- Tech Industry Statistics
- MFA Statistics
- Streaming Services Statistics
- Mobile Vs. Desktop Usage Statistics
- AI Statistics
- Live Streaming Statistics
- Zoom Meeting Statistics
- Cord Cutting Statistics
- Digital Transformation Statistics
- Virtual Reality Statistics
- How Fast Is Technology Advancing
- Mobile Commerce Statistics
- SaaS Statistics
- Machine Learning Statistics
- Diversity In High Tech
- Cyber Security Statistics
- Ecommerce Statistics
- Tech Industry
- Gaming Industry
- Renewable Energy Job Creation
- Smartphone Industry
- Cybercrime Statistics
- Amazon Statistics
- Personalization Statistics
Research Summary. Smartphone and cellphone use is at an all-time high in the United States. Across the nation, more and more people depend on their smartphones to communicate, stay connected, and be informed daily. After extensive research, our data analysis team concluded:
-
There are 307 million smartphone users in the United States as of 2022.
-
85% of American adults use smartphones.
-
Approximately 47% of web traffic in the U.S. originated from mobile devices.
-
Apple is the top smartphone in the U.S., with more than 116 million iPhone users.
For further analysis, we broke down the data in the following ways:
Demographics | Trends | Usage | Mobile Internet | Operating System
General U.S. Smartphone Industry Statistics
-
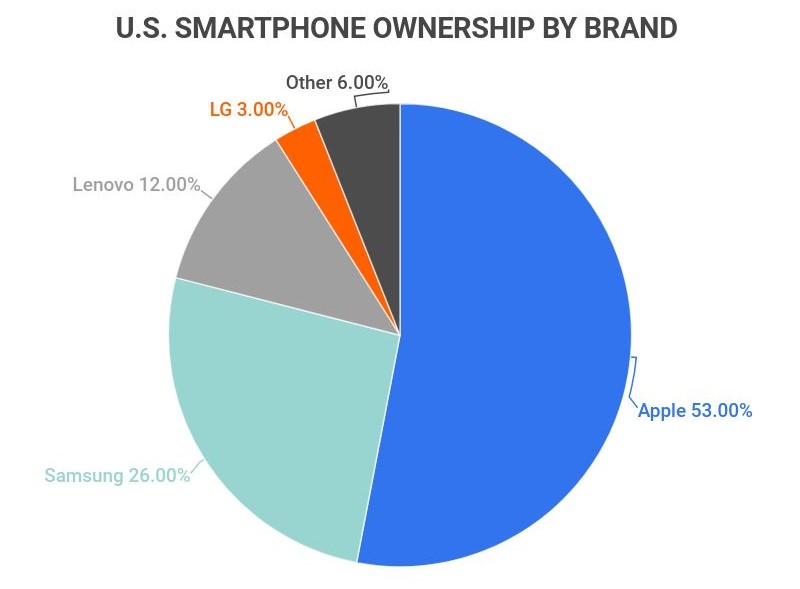
Apple is the top smartphone brand in the United States.
According to numbers from the most recent quarter, Apple represents the largest smartphone market share at 53%. Behind Apple, Samsung has 26% of the smartphone market, Lenovo has 12% of the smartphone market, and LG has 3% of the smartphone market.
-
12% of Americans own non-smart mobile phones.
About 12% of Americans have a non-smart mobile phone, while 85% of Americans have a smartphone. The number of Americans who own a smartphone has increased by 50% since 2011, when just 35% of Americans were smartphone owners.
-
The annual global revenue of the smartphone industry sits at approximately $409.1 billion.
China holds the largest section of the global smartphone market, generating more than $130 billion in sales each year. The United States is the second-largest segment of the global smartphone market, generating approximately $55.6 billion in annual revenue.
-
1.21 billion smartphones were sold around the world in 2022.
Between 1.2 and 1.5 billion smartphones are sold per year on average, with 2022 being a slower year. For instance, in 2019 over 1.5 billion smartphones were sold and distributed worldwide. That same year, more than 40% of people in the world had access to a smartphone.
-
The global smartphone industry is expanding at a compound annual growth rate of 16.4%.
The international smartphone industry is growing at a CAGR of 16.4%. In 2018 the market was valued at $520.3 billion. Now, current projections predict that the industry will reach $2,297.8 billion by 2025.
U.S. Smartphone Industry Statistics by Demographics
-
An estimated 96% of people aged 18 to 29 own a smartphone in the United States compared to 61% of people 65 years old and over.
-
85% of both White and Hispanic people and 83% of Black people own a smartphone in the United States.
-
In the United States, 85% of both men and women own a smartphone, and approximately 98% of women and 97% of men own a cellphone.
-
Individuals with higher annual incomes are more likely to own a smartphone. According to Pew Research, 76% of people who earn less than $30,000 a year own a smartphone compared to 96% of people who earn $75,000 or more each year.
-
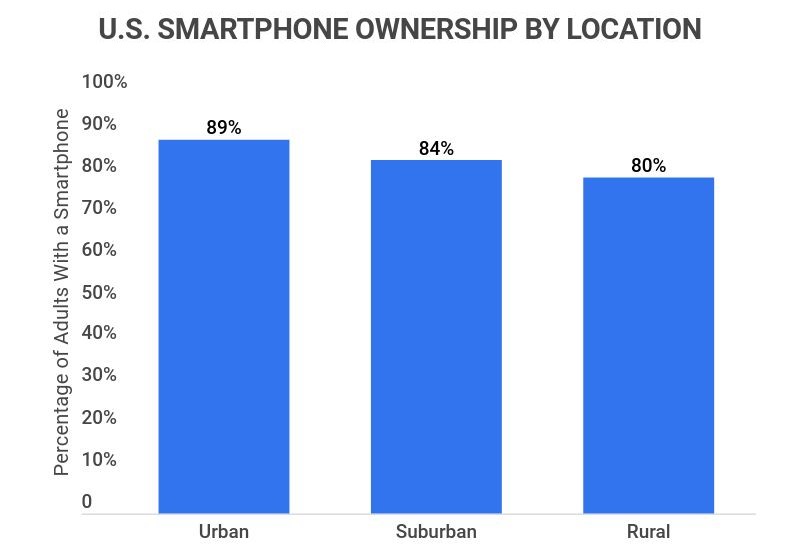
Across the nation, approximately 89% of individuals in urban areas, 84% of people in suburban areas, and 80% of people in rural areas own a smartphone.
U.S. Smartphone Industry Trends and Predictions
-
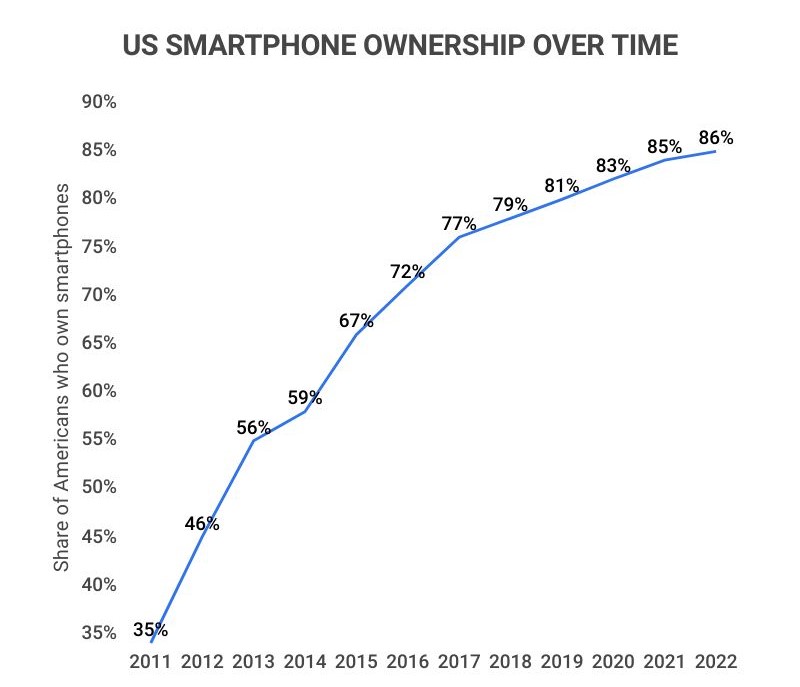
The number of Americans that own a smartphone has increased by 50% over the past decade.
85% of Americans owned a smartphone as of February 8, 2021 according to Pew Research. Meanwhile, in May 2011, research showed that just 35% of Americans owned a smartphone at that time. The number of Americans who own a cellphone of some kind has also increased over the past decade by approximately 17%.
-
Smartphone ownership is more prevalent in advanced economies compared to emerging economies around the world.
International smartphone ownership is fastest-growing in advanced economies — where, on average, 76% of people have smartphones — and slowest growing in emerging economies — where, on average, 45% of people have smartphones.
Smartphone ownership rates are lowest in India, where just 24% of people own a smartphone, and highest in South Korea, where 95% of people own a smartphone.
-
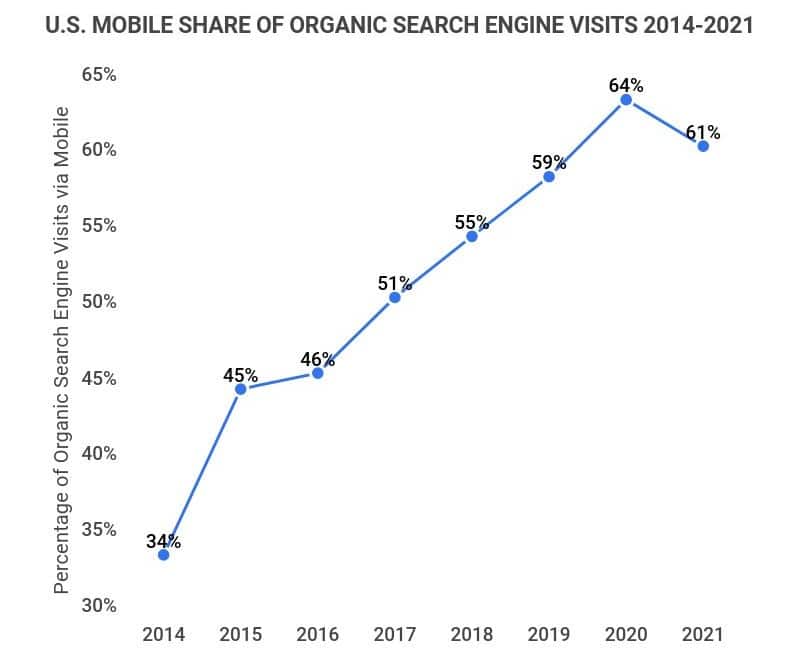
Mobile search accounts for 61% of all organic search engine visits in the United States.
More than half of organic search engine visits in the U.S. are performed using a mobile device. In 2020, an estimated 211 million people used mobile search across the country compared to just 177.8 million in 2016.
Furthermore, in 2018, approximately 63% of paid Google search clicks originated from smartphones, with mobile phones also accounting for 56% of total Google search clicks that year.
U.S. Smartphone Statistics by Usage
-
An average cell phone user interacts with their phone more than 2,000 times every day.
Cell phone users, on average, touch their phone 2,617 times every day. The top 10% of cell phone users, known as extreme cell phone users, interact with their mobile devices even more, touching their phones more than 5,400 times each day.
-
Americans spend about 2 hours and 25 minutes on their phone each day.
According to a study that tracked Android users’ smartphone usage, the average smartphone owner spends 145 minutes on their device every day, equivalent to approximately 76 phone sessions.
For comparison, a study by Apple found that iPhone users unlock their phones six to seven times an hour and engage in about 80 phone sessions a day.
-
85% of Americans own a smartphone, and even more own a cell phone.
According to Pew Research Center, 97% of Americans own a cellphone of some kind, and 85% of Americans own a smartphone.
-
Almost half of U.S. adults report that they can’t live without their smartphones.
47% of adults in the United States said they could not last 24 hours without their smartphones, according to a USA today study. A survey conducted by Bank of America also found that 91% of people value their smartphone just as much as they value their car and deodorant.
U.S. Smartphone Industry Statistics by Mobile Internet
-
Approximately 3 in 20 people in the United States only use the internet on their mobile devices.
15% of Americans are smartphone-only users, meaning they do not have a traditional home broadband service. The number of adults who owned a smartphone but did not use a traditional home broadband service was just 8% in 2013.
Younger Americans are most likely to be smartphone-only internet users. An estimated 28% of people aged 18 to 29 own a smartphone but do not use a traditional home broadband service.
-
In the United States, 47.07% of web traffic originates from mobile devices.
While more than half of all web traffic worldwide is mobile, about 47.07% of web traffic is mobile in the U.S., according to numbers from the first quarter of 2021. That number increased by 1.12% from the fourth quarter of 2020 and is up by 7.12% from the first quarter of 2018.
-
Most smartphone owners use mobile internet to shop.
82% of U.S. shoppers use a smartphone to help them shop, especially for food and entertainment. Most smartphone users who use mobile internet to shop report using the “near me” function to find local shops and businesses.
Meanwhile, 36% of international shoppers report using their smartphones to compare prices while shopping at a retail store.
U.S. Smartphone Statistics by Operating System
-
The majority of smartphone users in North America own Apple devices.
53.66% of smartphone users in the United States and North America use an Apple iPhone, while 45.99% of smartphone owners in that same area use an Android device. Only 0.35% of users ran a system other than Android or Apple iOS.
In 2019, the breakdown of Apple and Android users was more or less even, with approximately 49.9% of people using an Apple mobile device and 49.68% of people using an Android cell phone.
U.S. Smartphone Industry FAQ
-
How many people own smartphones in the United States?
Roughly 307 million people own smartphones in the United States, which is about 92% of the country. However, official estimates put the share of Americans with smartphones at around 86% in 2022.
Either way, this is a stark increase from 2011, when only 35% of all Americans owned smartphones.
-
What country has the most cell phones?
Macau, China has the most cell phones in the world, with 343.11 mobile phones per capita. This area is just west of Hong Kong, and one of the technological hubs of the world.
Ranking in the world’s top five countries with the most cell phones is Hong Kong, with 287.85 cell phones per capita, the Gaza Strip, with 215.58 cell phones per capita, the United Arab Emirates, with 197.65 cell phones per capita, and Seychelles, with 196.79 cell phones per capita.
The United States ranks much lower on the list of countries with the most cell phones, with 122.81 per capita.
-
How big is the smartphone industry?
The global smartphone industry market size is approximately $457.18 billion as of 2021. About 1.21 billion smartphone units were sold in 2022, and the market shows no signs of dying down any time soon.
-
Who is leading the smartphone market?
Samsung is leading the global smartphone market, while Apple has the advantage in the United States. Global numbers typically change to favor Apple in the fourth quarter of each year, while sales of Samsung phones tend to be more consistent throughout the year.
-
Which phone is most used in the world?
The iPhone 13 is the most-sold phone in the world throughout 2022. While there are no definitive numbers for the number of units sold globally, this phone was by far the most popular in the US, accounting for 17% of total smartphone sales.
-
Is the smartphone industry growing?
Yes, the smartphone industry is growing. According to a recent forecast, the global smartphone market is poised to grow by 9.5% annually through 2027, reaching a market cap of $759.3 billion.
Conclusion
In the age of modern technology, populations worldwide are becoming more and more reliant on smartphones. With the global smartphone industry generating an impressive $409.1 billion every year, it’s no surprise that approximately 85% of Americans use smartphones daily.
In the United States, 307 million smartphone users account for approximately 47% of web traffic. Meanwhile, 47% of U.S. adults report that they can not live without their smartphones. As the global smartphone industry continues to expand at a compound annual growth rate of 16.4%, the future of the smartphone market is indeed a profitable one.
References
-
Pew Research Center. “Mobile Fact Sheet.” Accessed on September 8, 2021.
-
Counter Point Research. “U.S. Smartphone Market Share: By Quarter.” Accessed on September 8, 2021.
-
Statista. “Share of U.S. Mobile Website Traffic 2015-2021.” Accessed on September 8, 2021.
-
Statista. “Smartphone Sales Revenue Worldwide 2013-2020.” Accessed on September 8, 2021.
-
Globe Newswire. “Smartphone Market To Garner USD 2,297.8 Billion At A 16.4% CAGR By 2025—Report By Market Research Future.” Accessed on September 9, 2021.
-
Pew Research Center. “Smartphone Ownership Is Growing Rapidly Around The World, But Not Always Equally.” Accessed on September 8, 2021.
-
Statista. “Mobile Search — Statistics Facts.” Accessed on September 9, 2021.
-
Business Insider. “Here’s How Many Times We Touch Our Phones Every Day.” Accessed on September 9, 2021.
-
USA Today. “47% Of Adults Couldn’t Last A Day Without Smartphone, Survey Says.” Accessed on September 9, 2021.
-
Statista. “Share Of Mobile Operating Systems In North America 2018-2021, By Month.” Accessed on September 9, 2021.
- Tech Industry Statistics
- MFA Statistics
- Streaming Services Statistics
- Mobile Vs. Desktop Usage Statistics
- AI Statistics
- Live Streaming Statistics
- Zoom Meeting Statistics
- Cord Cutting Statistics
- Digital Transformation Statistics
- Virtual Reality Statistics
- How Fast Is Technology Advancing
- Mobile Commerce Statistics
- SaaS Statistics
- Machine Learning Statistics
- Diversity In High Tech
- Cyber Security Statistics
- Ecommerce Statistics
- Tech Industry
- Gaming Industry
- Renewable Energy Job Creation
- Smartphone Industry
- Cybercrime Statistics
- Amazon Statistics
- Personalization Statistics
Author
Chris Kolmar is a co-founder of Zippia and the editor-in-chief of the Zippia career advice blog. He has hired over 50 people in his career, been hired five times, and wants to help you land your next job. His research has been featured on the New York Times, Thrillist, VOX, The Atlantic, and a host of local news. More recently, he's been quoted on USA Today, BusinessInsider, and CNBC.