
Housing Prices and Inflation
By Jared Bernstein, Ernie Tedeschi, and Sarah Robinson
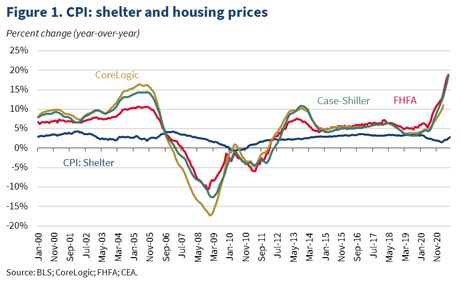
The pandemic has seen extraordinary growth in home values. Pandemic-related market disruptions, like increased demand and rising building costs as well as other long-term supply constraints in the housing market have contributed to record increases in prices. Over the last 12 months, the Case-Shiller U.S. National Home Price index has risen by 18.6 percent, the strongest year-long growth in the history of the series. Other third-party indices show similar rises (Figure 1).
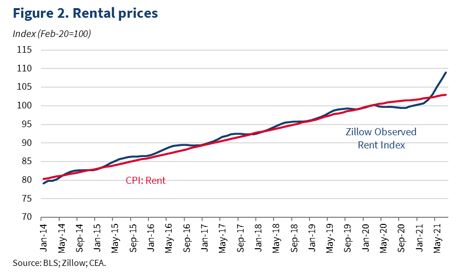
Meanwhile, asking rental prices, as measured by the Zillow Observed Rental Index (ZORI), initially fell during the pandemic but have since recovered and now exceed their pre-pandemic trend (Figure 2).
Because of the way shelter costs enter into the CPI, these increases in owned home and rental costs have not yet contributed much to overall inflation.
Our analysis, however, suggests that these higher shelter prices are likely to soon show up more clearly in the monthly CPI, potentially adding several more basis points (hundredths of a percentage point) to monthly inflation than they do now. As we show, some of this acceleration would simply represent a return to the normal pre-pandemic shelter contributions to inflation, and we note that these housing price dynamics are included in inflation forecasts, including our own, which show overall price growth decelerating in coming quarters.
The pandemic has seen higher-than-normal volatility and uncertainty in the economic data; so, while included in our analysis, we also recognize that historical relationships between housing prices and CPI may not hold in these unprecedented economic times.
What factors have contributed to rising home prices?
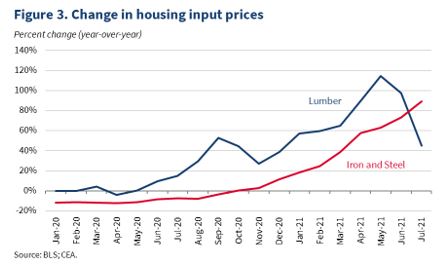
As with most economic variables, demand growth and supply constraints can act in tandem to boost home prices. In a recent blog post, CEA outlined some of the longer-run issues affecting U.S. housing supply that have been present for years, including local zoning restrictions and limited affordable or public housing (the post also details a robust set of near- and longer-term Biden Administration policies intended to boost supply). The pandemic has prompted more recent supply issues as well, driving the prices of key commodities to record highs and increasing the cost of home construction. For example, lumber prices increased 114 percent over the 12 months ending in May 2021—the highest 12-month growth for which there are data. Similarly, in June, prices of iron and steel had increased by 73 percent over the prior 12 months. However, between June and July, lumber prices declined by over 20 percent, indicating that some of the price pressures are easing (Figure 3)
In addition to supply factors, there are also potential pandemic-related demand factors stemming from increased at-home work and heightened mobility. At the start of the pandemic, there were elevated levels of migration away from city centers and into suburbs and other less population-dense areas. This created higher than usual churn in the housing market. Moreover, mortgage rates—which have declined to all-time lows over the past year—are making borrowing more affordable (for those with relatively good credit histories), thereby contributing to stronger demand for new homes.
Taken together, these dynamics mean the wedge between supply and demand has widened. According to Redfin, the seasonally-adjusted inventory of homes has declined by over 50 percent since February 2020. Other measures find similarly large declines. For example, the Census Bureau estimates that the inventory of for-sale homes has declined by 37 percent since 2019Q4.
What is the relationship between housing prices and CPI inflation?
Rising home prices have direct effects on household wealth and neighborhood affordability. They also play an important role in overall inflation. The Consumer Price Index (CPI), for example, measures the prices of a basket of household goods and services that households regularly consume, with weights assigned to each item in the basket based on their average shares of total expenditures. Among these is a shelter component that includes both rental costs and the consumption value of owner-occupied housing, in addition to other forms of lodging such as hotels. Shelter makes up nearly a third of the basket for CPI inflation, and 40 percent of the basket for core CPI that excludes the volatile food and energy components. [1] As a result, even small increases in rent and home prices can, in principle, have noticeable effects on overall inflation.
Understanding how housing affects inflation means understanding what our inflation data tries to measure. The CPI is a cost-of-living index: its purpose is to measure the price of different goods and services that households consume. It is not meant to measure the value of investment assets that families hold, such as stocks.
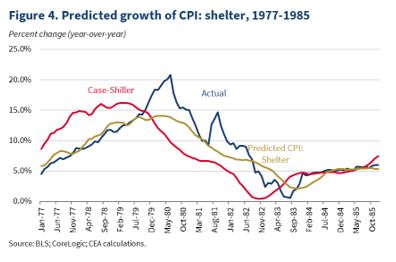
But this goal creates a unique challenge with owner-occupied housing, because the price of a house reflects both its value as an investment asset, which CPI in principle wants to ignore, and as a good that provides a “service”—shelter—to the families that live in it, whose cost CPI wants to incorporate. Prior to 1983, however, BLS calculated CPI: Shelter based on housing prices, mortgage rates, property taxes and insurance, and maintenance costs. This approach captured elements of both the service flow—the consumption of housing services—and asset investment aspects of housing expenditures. Not coincidentally, during this time house prices tracked closely with CPI: Shelter.[2] Between 1976 and 1985, Case-Shiller and CoreLogic were a strong predictor of growth in the shelter component of the CPI (Figure 4). A 1 percentage point increase in year-over-year growth in Case-Shiller or CoreLogic was associated with a 76 basis point increase in year-over-year growth of CPI: Shelter over the upcoming year (i.e. Case-Shiller 12-month growth from January 1980 to January 1981 was highly predictive of growth in CPI: Shelter from January 1981 to January 1982).[3]
But, BLS decided that the investment component was inconsistent with CPI’s role as a cost-of-living index. As a result, after many years of internal debate and testing, in 1983 BLS altered its methodology to the “rental equivalent” approach. Under this framework, owners’ equivalent rent (OER) of primary residence is meant to capture just the implicit value of services that homeowners “consume” from their own homes—not the asset value of the house as an investment. It is calculated using a subset of the same rental data as the CPI: Rent index, weighted by the price that homeowners think their home (unfurnished and without utilities) can be rented for monthly. The BLS rationale behind this change was that it would more accurately capture the price of the service homeowners receive from living in their home, distinct from the value of the home as an investment.
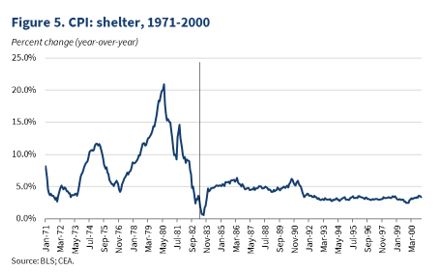
Due in large part to these methodology changes, in the mid- to late-1980s the relationship between CPI: Shelter and housing prices weakened. The change to the “rental equivalent” approach lowered growth in CPI: Shelter and made the series less volatile (Figure 5).
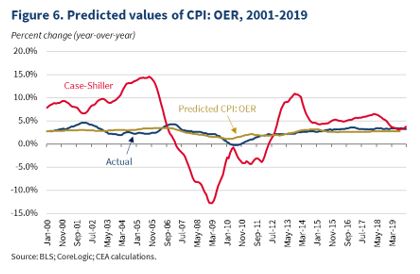
Ever since the early 1980s, the house price-CPI relationship has declined due to these changes in the methodology. Between 1985 and 1999, each 1 percentage point acceleration in year-on-year growth in Case-Shiller was associated with a 15 basis point rise in CPI: Shelter 22 months later. Since 2000, that effect has changed to 11 basis points, 16 months later. The story is similar when looking at CPI: OER, with an optimal predictive effect of 15 basis points after 23 months pre-2000 and of 9 basis points after 16 months post-2000 (Figure 6). Since the end of the Great Recession, the magnitude of the impact of housing prices on CPI: Shelter is roughly similar to the full post-2000 sample—around 11 basis points.
Recent behavior and expectations
The implication of this historical analysis is that there is indeed a relationship between housing prices and CPI, albeit one that often only shows up with a lag and, when it does, is not 1:1.
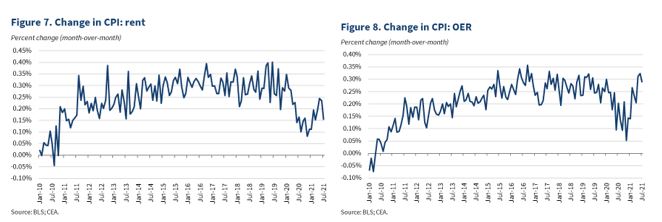
So far, growth of both CPI: Rent and CPI: OER have accelerated from their pandemic lows, as Figures 7 and 8 show. In the case of owners’ equivalent rent, its growth in recent months has returned to paces consistent with pre-pandemic years. CPI: Rent, on the other hand, remains below its pre-pandemic pace of growth. Because CPI: Rent captures rents for homes that are both on the market and already occupied, it tends to show less volatility than measures of on-the-market asking rents, like the Zillow index in Figure 2.
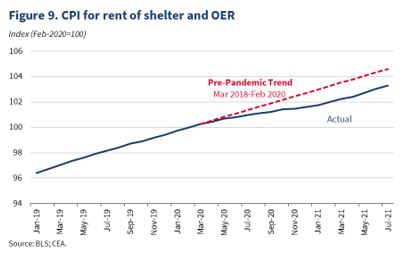
There is a risk of some further acceleration in the housing components of CPI in the months ahead, both because of recent home price appreciation and also, as Figure 9 shows, the fact that the level of rental and housing prices in CPI is below its pre-pandemic trend; a renormalization would require a temporary acceleration above the pre-pandemic pace of growth. If, illustratively, CPI: Rent and CPI: OER returned to trend by July 2022, that would imply roughly 13 basis points added to core CPI inflation every month, around 2 basis points more than they typically contributed before the pandemic and 1 basis point more than they contributed in June 2021. By comparison, in June, vehicle-related components of CPI—new and used cars, rentals, and parts—contributed more than 50 basis points to monthly core CPI inflation.
But as with so much data during the pandemic, past relationships are no guarantee of future dynamics, and the risks are two-sided. As input prices resettle to more normal levels and as the pandemic demand dynamics fade, we expect any pressure from housing inflation to eventually dissipate. But there is a possibility that some of the pandemic-era supply and demand factors could linger longer than anticipated, and even when they fade, many longer-term structural issues with housing supply that pre-date the pandemic will remain. By the same token, there is also a possibility that the spillover into inflation could be weaker than implied by prior years. CEA will continue to closely monitor the evolution of prices and its different drivers in the months ahead.
[1] Weights for PCE inflation are the nominal consumption shares as a percent of the total, which can be calculated from NIPA Table 2.4.5U. Despite the fact that the Personal Consumption Expenditure (PCE) price index (the measure most closely tracked by the Federal Reserve) incorporates the CPI: Rent and CPI: OER price indices, housing makes up a far smaller share of PCE inflation, partly because PCE is broader in scope overall and partly because PCE uses a different methodology than CPI for weighting housing. On average, housing is 16 percent of headline PCE and 18 percent of core PCE.
[2] To measure the relationship between housing prices and CPI: Shelter, we run a series of simple bivariate regressions of year-on-year CPI: Shelter or CPI: OER inflation on lagged Case-Shiller growth. We optimize the number of months of lags for each sample period by selecting the coefficient that results from the regression with the highest r-squared value, and control for serially correlated errors using a Prais-Winsten procedure.
[3] The effect is similar using three-month growth rates instead of twelve-month rates.