January 10, 2019
 By Suzanne Russo, CEO, Pecan Street
Pecan Street’s high-resolution data has led to numerous insights about how energy is used and generated by residential customers, such as how to optimize distributed solar for peak demand shaving. And it’s led to more than 120 papers from university researchers around the world via Dataport. For example, the Stanford Lab Accelerator (SLAC) uses Pecan Street’s data to help build more accurate grid system models through its Visualization and Analytics with High Penetration of Distributed Energy Resources (VADER) project.
This year, we are expanding into two communities in New York and California to improve the breadth and application of our dataset. As our expansion and upgrade occur, our researchers and those around the world will have an unprecedented dataset, which we make available for free to all university researchers, that will help drive revolutionary shifts in our energy system.
One topic we’ve been focusing on recently is voltage stabilization. It’s not sexy, but it’s important. In short, the goal is to keep voltage on the grid as constant as possible. A number of things upset that constancy, and operators have developed a number of responses, from load shifting to capacitor banks, reactors and more. Distributed solar seems to upset voltage stability, but to what degree that’s a problem for the grid is not yet clear. As more and more homes and businesses install rooftop solar, it’s becoming more important to know how significant increases in distributed solar will affect our grid. For example, how much of today’s voltage variability is due to rooftop solar and, therefore, how will the gigawatts of new solar we expect to see in the next decade impact the grid?
Pecan Street is doing our part to inform the answer, and our high-resolution data provides some interesting insight.
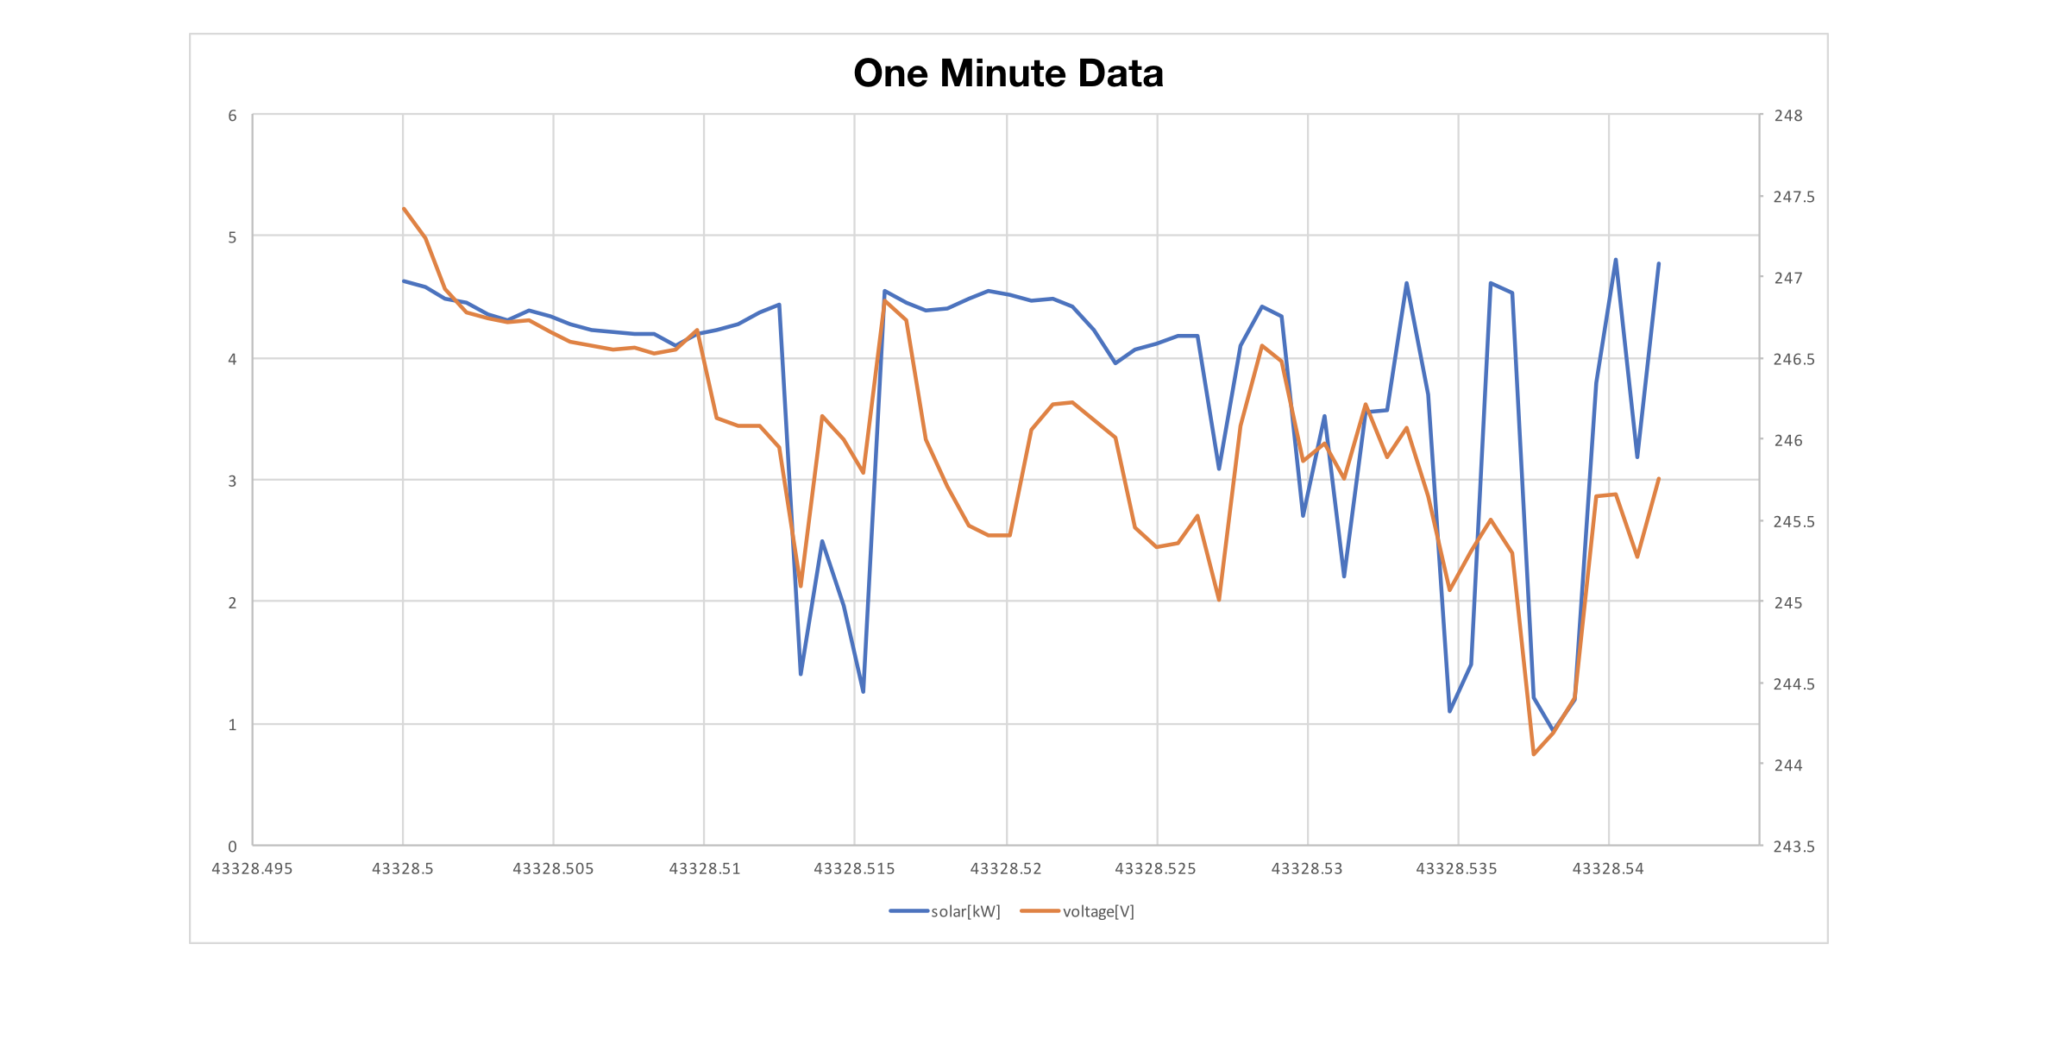
The following graphs show solar production (blue line) and voltage measured (orange line) for one house in our research network. When viewed at a one-minute interval you can see some alignment between PV generation and grid voltage.
When viewed at a one-second interval, however, correlations are more clear because there is a lot happening on the grid side and the PV side at intervals of a few seconds or less.
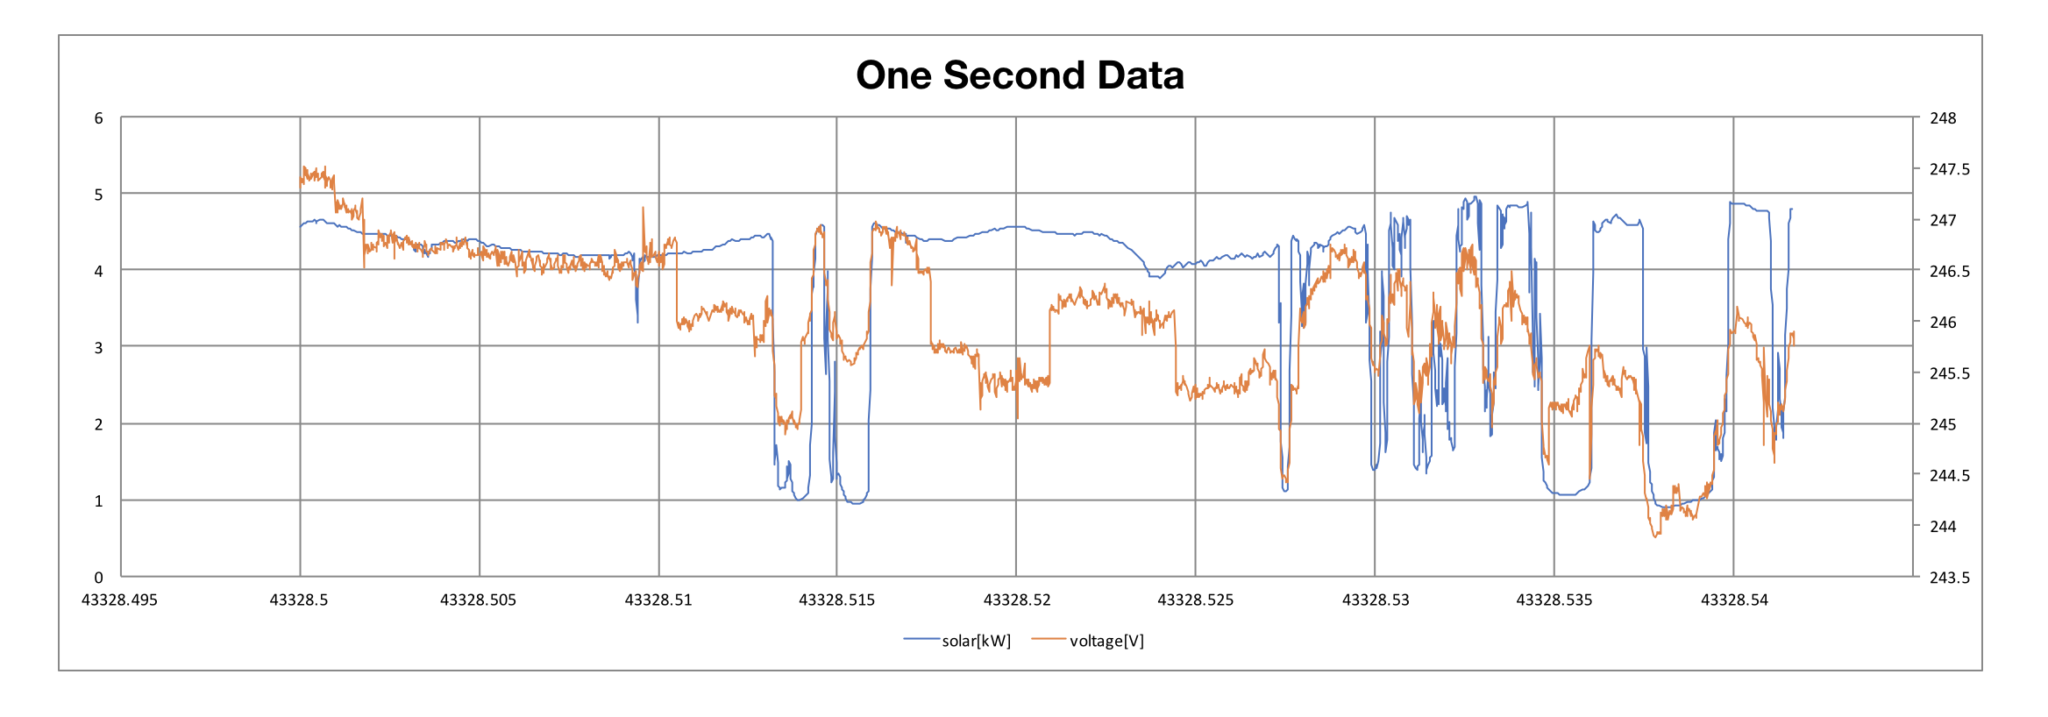
This also makes it easier to see when PV systems are not the main driver of grid voltage. We are now working on an algorithm that will make it possible to definitively separate out the impact of rooftop solar systems on grid voltage from other driving factors.
We are also upgrading our entire residential energy network to collect one-second interval data on voltage, current, total harmonic distortion and phase angle. This will enable even greater insight into how distributed solar can be optimized for more benefits to the grid and to households.