Article

Algae-Laden Fouling Control by Gravity-Driven Membrane Ultrafiltration with Aluminum Sulfate-Chitosan: The Property of Floc and Cake Layer

College of Architecture and Civil Engineering, Beijing University of Technology, Beijing 100124, China
*
Author to whom correspondence should be addressed.
Water 2020, 12(7), 1990; https://doi.org/10.3390/w12071990
Submission received: 20 June 2020 / Revised: 6 July 2020 / Accepted: 12 July 2020 / Published: 14 July 2020

Abstract

:
Gravity-driven membrane (GDM) ultrafiltration is a promising water treatment method due to its low energy consumption and low maintenance. However, the low stable permeability in algae-laden water treatment is currently limiting its wider application. With the ultimate goal of increasing permeability, the aim of this study was to evaluate the effect of a composite coagulant of aluminum sulfate-chitosan (AS-CS) on the GDM filtration performance. In parallel tests with a single AS coagulant and without pre-coagulation, the analysis of membrane fouling resistance and the membrane fouling mechanism were evaluated. The results indicated that the AS-CS/GDM system can alleviate 23.74% and 58.80% membrane fouling, respectively, compared with AS/GDM and the GDM system. The AS-CS/GDM system can effectively remove humic-like substances having a molecular weight (MW) of 3–100 kDa, resulting in removal of 98.32% of algae cells and removal of 66.25% of dissolved organic carbon; the AS-CS/GDM system thereby improved the concentration of attached biomass on the membrane surface with the stronger biodegradability of organic matters. The application of AS-CS pre-coagulation in the GDM process could enhance the proliferation of microorganisms and the removal of low molecular weight humic-like substances. Therefore, the AS-CS/GDM system is a potentially important approach for algae-laden water treatment.

Graphical Abstract

1. Introduction

The algae bloom occurring in lakes and reservoirs has become a major environmental concern due to its threat to human health and drinking water treatment [1,2]. Even worse is that algal cell breakage would release high concentration of natural organic matter (NOM), resulting in the reduced removal efficiency of traditional treatment plants, i.e., coagulation, sedimentation and sand filtration [3].
The ultrafiltration process (UF), which utilizes a thin membrane with approximately 30 nm pore size, could nearly completely retain algal cells, suspended substances and microorganisms with its physical size exclusion [4]. Therefore, UF is increasingly applied in algae-laden water treatment [5]. However, the membrane fouling caused by the pore blocking and cake layer, and the maintenance cost limit the application of the UF process in decentralized water treatment [6].
Recently, there has been increasing interest in the gravity-driven membrane (GDM) process, which is more favorable than the conventional UF process [7]. The GDM process operates in a dead-end mode at an ultra-low hydrostatic pressure (40–100 mbar), which has the advantages of not requiring backwashing, physical flushing, or chemical cleaning of the filters [8]. It was proven that the application of the GDM process was suitable for decentralized grey water treatment and reuse, although the flux was significantly lower than the conventional UF process [9]. The biofilms on the GDM membrane surfaces typically have a soft and heterogeneous structure, and these may be responsible for the stable flux even after a long-term operation [10,11]. Additionally, the biofilms can reject high molecular weight (MW) organic matter and protect the membrane from further fouling [12]. However, the low MW compounds could pass through the GDM membrane, resulting in a limited removal capacity for NOM. Furthermore, the higher concentration of NOM in the feed water resulted in a lower degree of flux stabilization [13]. Ding et al. [14] concluded that the application of the GDM process in rainwater treatment can effectively remove colloids and bacteria, but was ineffective in NOM removal due to the low rejection of low-MW humic-like species. Akhondi et al. [15] used the GDM process as the pre-treatment of seawater before reverse osmosis, and claimed that the low NOM removal of this process may because the presence of microbial species (e.g., algae) would convert CO2 into organic substances. Thus, pre-treatment could be applied to remove algae cells and low-MW humic-like species.
Among many pre-treatments, coagulation is widely applied as an effective strategy to improve permeate quality, and generate a porous cake layer with higher membrane permeate flux [16]. Ding et al. [17] added aluminum (Al) salt coagulant in a GDM process to treat synthetic wastewater, and demonstrated that Al-coagulant can improve the flux stabilization to avoid the formation of extracellular polymeric substances on the membrane surface, and enhance the removal of protein and fulvic-like substances. However, Al-coagulant was ineffective in removing low-MW organic matters. High doses of Al-coagulants were required when NOM was released from the algae, which resulted in secondary pollution of residual Al [18]. Ji et al. [19] found that the addition of polymeric organic coagulants, i.e., chitosan (CS) and polyacrylamide, could obtain higher membrane flux in a submerged membrane bioreactor, compared with Al-coagulant. A drawback is the high production cost of these organic coagulants, which limits their large-scale application as a single coagulant. To overcome the disadvantages of Al-coagulant and polymeric coagulants, Ma et al. [20] pre-mixed these two coagulants as a composite coagulant, and found that this coagulant can achieve much higher removal of algae cells and NOM than a single coagulant or dual coagulant. The use of AS-CS composite coagulant can improve floc properties, resulting in higher membrane flux in conventional UF filtration [21]. However, little study has focused on the application of Al-CS composite coagulant in membrane filtration performance and the fouling mechanism in the GDM process.
To enhance the removal of NOM and algae cells, and improve the flux stabilization, the composite coagulant of aluminum sulfate (AS) and CS applied in the GDM system (AS-CS/GDM) was investigated and compared with the AS/GDM system and the GDM control system. The objectives were to evaluate the influence of AS-CS on (i) the membrane filtration performance, including flux stabilization, fouling resistance and the fouling mechanism; (ii) the permeate quality in terms of concentration of dissolved organic carbon (DOC), excitation-emission matrix (EEM) spectra and biomass concentration; (iii) and the properties of floc and the cake layer. Thus, the results can contribute to improve the application of the GDM process in decentralized algae-laden water treatment.

2. Materials and Methods

2.1. Characteristics of Raw Water

The test water was collected from Rushan River (36°94′ N, 121°47′ E, Shandong, China). The main water quality of test water was as follows: turbidity = 2.67–5.46 NTU, algae density = (6.63–7.65) × 106 cell/L, DOC = 3.54–3.92 mg/L, UV254 = 0.092–0.117 cm−1, ammonia nitrogen (NH3-N) = 0.354–0.436 mg/L, and solution pH = 6.96–7.50. The temperature of the raw water was 20–30 °C and a digital thermostat was applied to keep the temperature of the feed water constant at 25 °C.

2.2. Preparation of Coagulant

Deionized (DI) water (Milli-Q, Darmstadt, Germany) was used throughout the experiment, and all of the reagents used to prepare each coagulant were of analytical grade. The aluminum sulfate (AS, Aladdin Chemical Corporation, Shanghai, China) stock solution was adjusted to 13.3 mg/L (0.2 M Al) by the addition of DI water. Chitosan (CS, MW 310–375 kDa, Sigma-Aldrich, Shanghai, China) stock solution was suspended at a concentration of 1 g/L in 1.0% acetic acid. Following the previous study [20], the composite coagulant of aluminum sulfate-chitosan (AS-CS) was prepared by pre-mixing 53.2 mg/L of AS stock solution with 0.05 mg/L of chitosan stock solution at a temperature of 20 °C, and stirred at 300 rpm overnight.

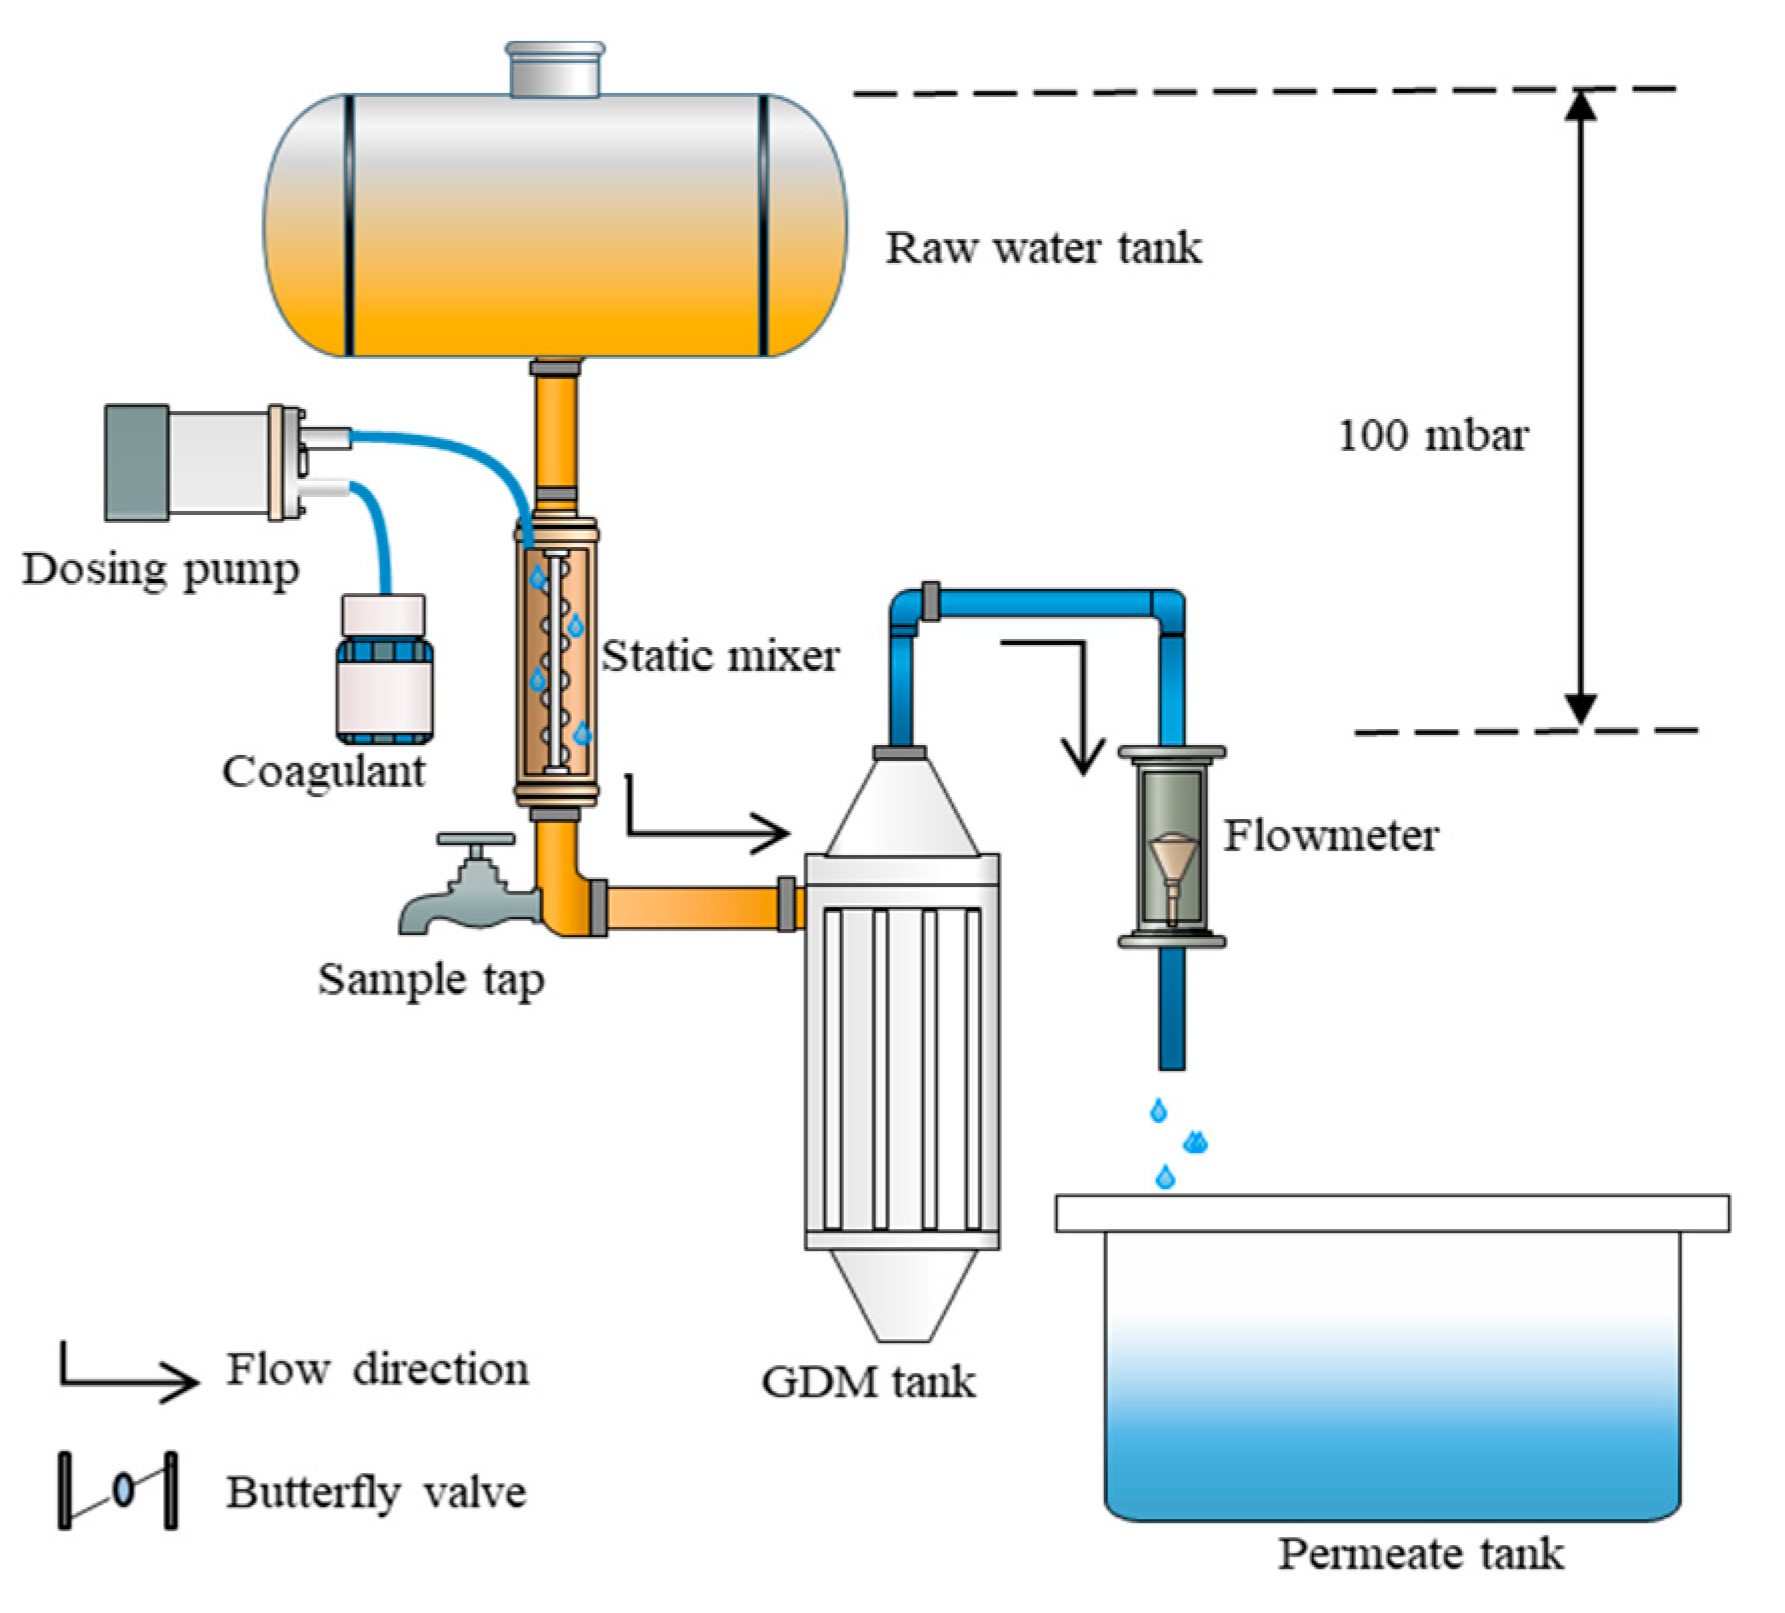
2.3. Experimental Set-up

2.3.1. Coagulation/GDM System

As shown in Figure 1, the coagulation/GDM system (including AS-CS/GDM and AS/GDM) consisted of a raw water tank, dosing pump, static mixer, UF membrane (GDM) tank, flowmeter and a permeate tank. The raw water tank was positioned at a height corresponding to the required driven pressure of 100 mbar. To add coagulant, a static mixer was connected following the raw water tank, with a dosing pump running at a flux of 1.4 mL/min. Before the filtration process, the flow mixed with coagulant passed through the static mixer, and the floc sample was acquired from the sample tap. The GDM tank, with a volume of 4.3 L, was connected to the static mixer by silicone tubes. To generate a constant driven pressure, the permeate of the UF membrane flowed into a permeate tank with a flowmeter for determining the permeate flux. Prior to operation, the raw water tank, GDM tank (including UF membrane), permeate tank and tubes were immersed in a sodium hypochlorite solution (5%) overnight, and then flushed with DI water three times. The GDM control system was operated under the identical conditions as the coagulation/GDM system in absence of the coagulation process.

2.3.2. UF Membrane Module

The UF membrane module was orientated vertically and operated in submerged filtration mode. An outside-in polyvinylidene fluoride (PVDF) hollow fiber UF membrane (Litree Ultrafiltration Membrane Technology Corporation, Hainan, China) with molecular weight cut-off of 100 kDa was employed. The external diameter and length of the membrane was 1.0 and 900 mm, respectively, and the total effective filtration area was 0.366 m2.

2.4. Ultrafiltration Process

2.4.1. Filtration Flux and Membrane Fouling Resistance

As shown in Equation (1), the permeate flux was calculated from the permeate volume, effective UF filtration area and filtration time, respectively [22].
J = V S · t ,
where J is the flux (L/(m2·h)); V is the water volume (L); S is the effective filtration area of the UF membrane (m2); and t is the effective filtration time (h).
The resistance-in-series model was applied to estimate membrane fouling resistance as described below [23,24].
J s t = P t μ R t ,
R t = R m + R c l + R i r e ,
R m = P t μ J i n i ,
R c l = P t μ J c l ,
R i r e = R c l R m ,
where Jst is the stable flux (m3/(m2·s)); Pt is the driven pressure (Pa); μ is the dynamic viscosity (Pa·s); Rt is the total resistance (m−1); Rm is the intrinsic membrane resistance (m−1); Rcl is the hydraulically reversible resistance (m−1); Rire is hydraulically irreversible resistance (m−1); Jini is the intrinsic flux (m3/(m2·s)); and Jcl is the flux after backwash (m3/(m2·s)).

2.4.2. Modeling for Membrane Fouling Process

The flux decline of the GDM system under driven pressure has been described by four classic filtration models [25,26]. These include cake filtration, intermediate blocking, standard blocking and complete blocking, schematically shown in Supplementary Figure S1. The general form of membrane fouling is as follows:
d 2 t d V 2 = k ( d t d V ) n ,
where t is the filtration time (d); and k and n are constants. Different values of n express different filtration models. n = 0 means a cake filtration, n = 1 means an intermediate blocking, n = 1.5 meaning a standard blocking, and n = 2 expresses a complete blocking. The equations for these different membrane blocking models are listed in Supplementary Table S1.

2.5. Floc Property

Prior to passing through the GDM tank, 300 mL of coagulated solution was immediately collected from the sample tap. After shaking the solution gently, floc samples from the homogeneous solution were acquired by a hollow plastic tube. The tube was open at both ends, and one end of the tube was inserted gently about 25 mm into the coagulated solution. The flocs in the tube were withdrawn carefully by covering the other end of the tube with a finger. After transferring the sample to a flat microscope slide, the images of the flocs were captured by an optical microscope (Olympus, BX51TF, Shinjuku-ku Japan) equipped with a video camera. The camera had a sensor matrix consisting of 1360 (horizontal) × 1024 (vertical) pixels. To interpret the image sizes correctly, a graduated micro-scale was photographed to determine the number of pixels corresponded to a given standard length. Images were obtained from an interrogation window of about 2952 × 1944 pixels with a resolution of 1340 pixels/mm. Thus 1 pixel corresponds to about 699 mm [27]. The two-dimensional fractal dimension Dpf was obtained from Equation (8):
A l D p f .
The projected area A and characteristic length l in this study were substituted by the number of pixels and the long dimension (in pixels) in the floc image, respectively, using ImageJ software [16]. Generally, a lower Dpf value indicates flocs with a highly branched and more porous structure, while flocs with a more compact structure result in higher Dpf values [28].
Equation (9) was used to calculate the average size d for flocs:
d = ( 4 A π ) 1 2
Following results by Yu et al. [16], the number of flocs was chosen between 800 and 1000 for these calculations, and their sizes were calculated as the result of floc size distribution.

2.6. Other Analytical Methods

DOC concentration was determined with a total carbon analyser Vario TOC® Cube (Elementar, Langenselbold, Germany), and UV254 was measured using a UV/Vis spectrophotometer (UV2600, Shanghai, China). Both DOC and UV254 were measured after filtration through a 0.45 µm membrane. Turbidity was measured with a 2100N turbidimeter (Hach, Loveland, CO, USA). The zeta potential of effluent after filtration was measured using a Zetasizer Nano-Z (Malvern, UK). The concentration of NH3-N was measured with a LH-3BA multi-parameter analyzer (Technology Co. Ltd., Hainan, China). The EEM spectra was tested with a F-7000 fluorescence spectrophotometer (Hitachi, Japan), and the details can be seen in Supplementary Information. The concentrations of free biomass and attached biomass were measured as in previous research [29]. The scanning electron microscopy (SEM) measurement was conducted using a Hitachi SU 8010 SEM.

3. Results

3.1. Membrane Filtration Performance

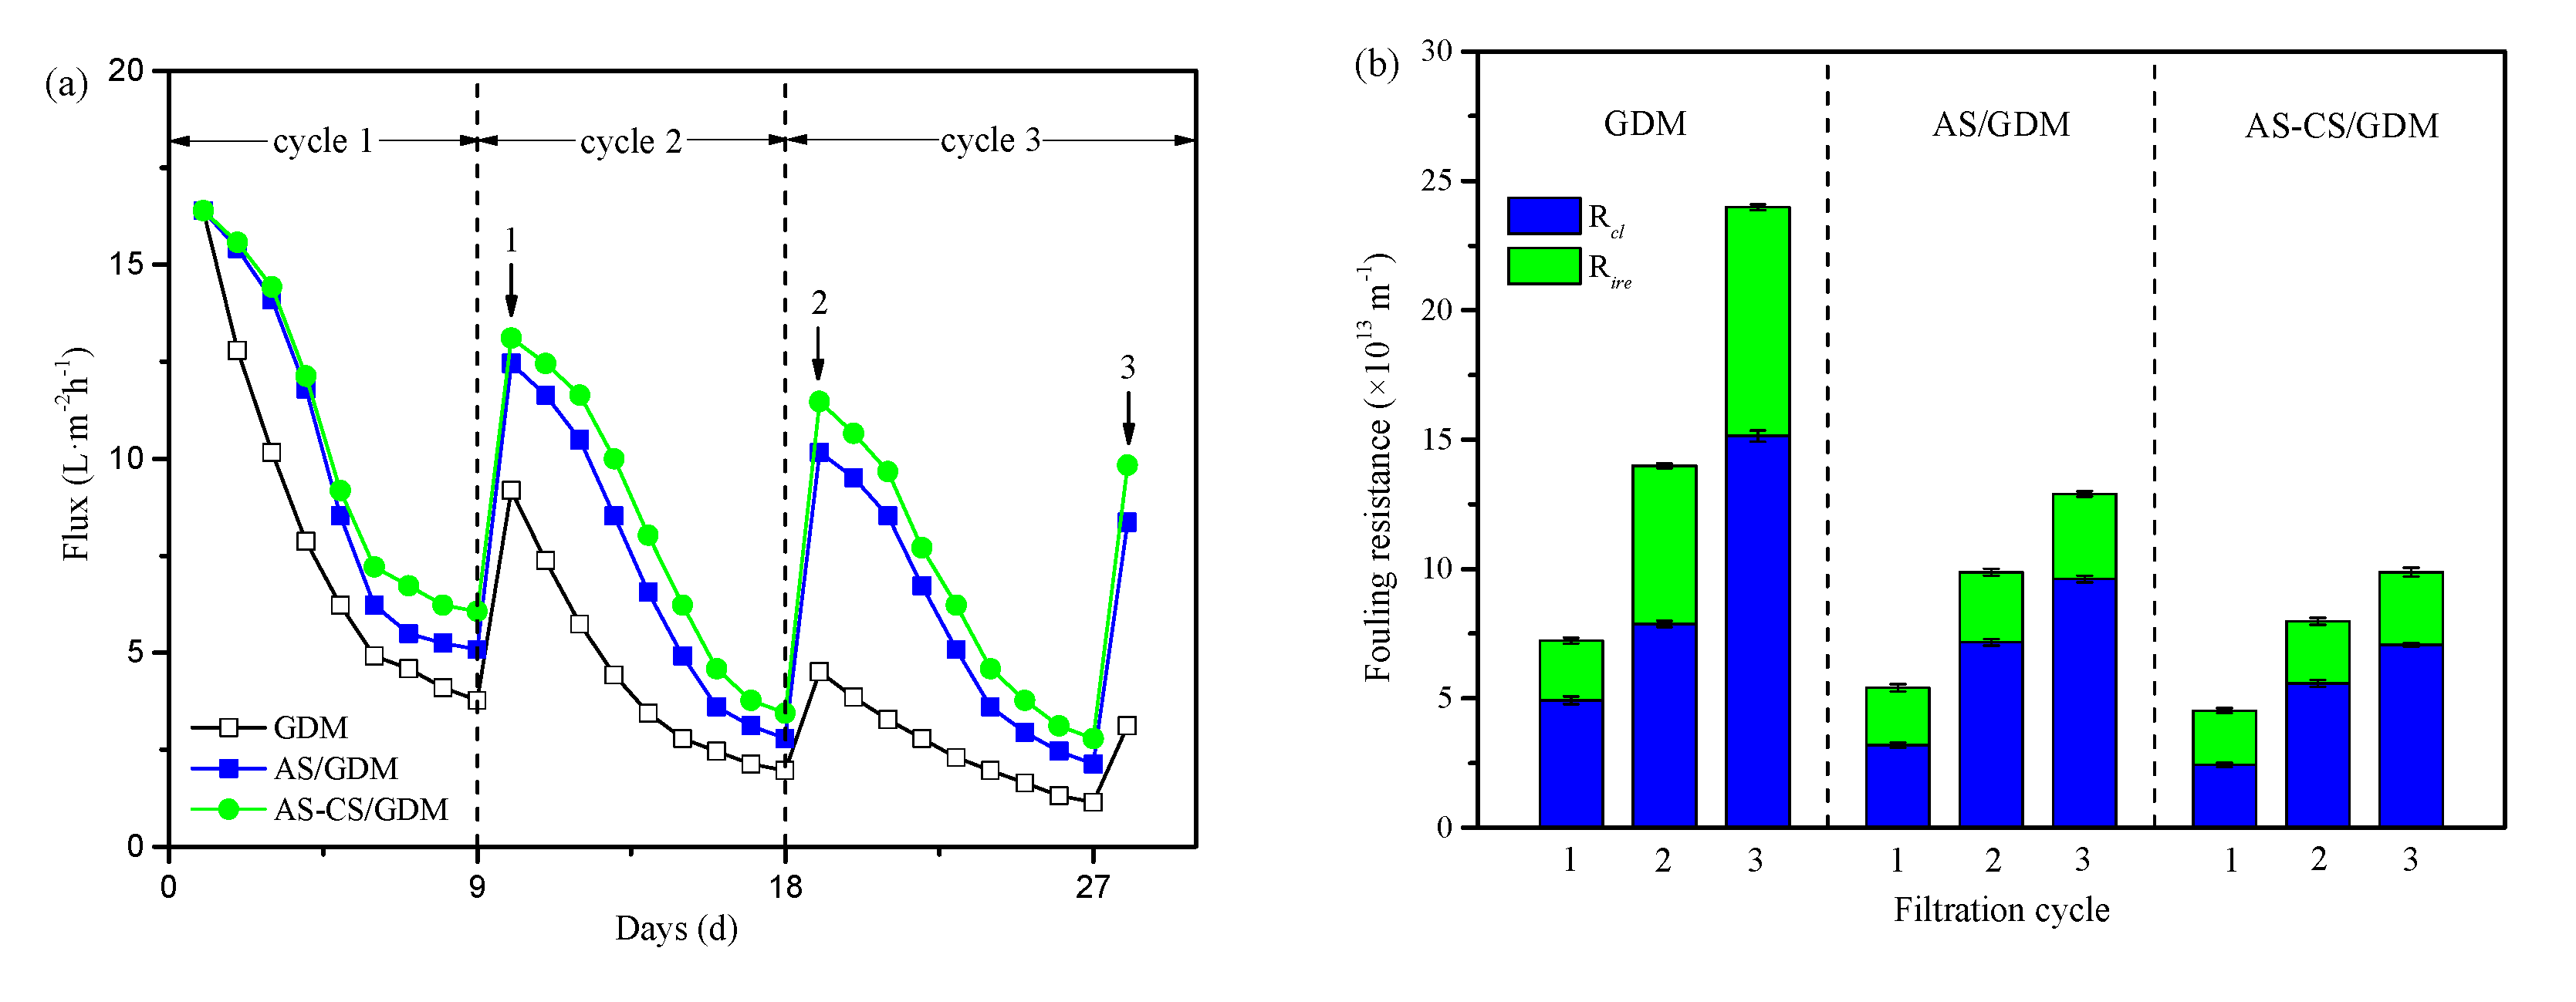
3.1.1. Membrane Permeate Flux and Fouling Resistance

Figure 2a shows the membrane permeate flux of various systems during consecutive filtration cycles. Permeate flux sharply declined with filtration time, especially for the GDM control system. The GDM control system obtained the severest membrane fouling with a reduction of 23%, 17% and 7% during the first, second and third filtration cycle, respectively. The flux significantly improved under the effect of pre-coagulation, of which the AS-CS/GDM system obtained the highest final flux (37%, 21% and 17%, respectively), followed by the AS/GDM system (31%, 17% and 13%, respectively). This result demonstrated that the AS-CS pre-coagulation was the most effective in mitigating fouling. The flux improved after a hydraulic backwashing, showing a valid recovery of membrane fouling.
Figure 2b compares the values of Rcl and Rire for three systems. As expected, the GDM control system obtained the highest Rcl and Rire, and both of them increased with the number of filtration cycles. This indicated that raw water without pre-treatment caused the severest reversible and irreversible fouling. Pre-coagulation, especially for the AS-CS/GDM system, could obviously alleviate Rt and Rcl, which was ascribed to the formation of a looser cake layer. Although pre-coagulation had a marginal effect on the value of Rire during the first filtration cycle, this process could obviously mitigate Rire during the second and third cycle. It suggested that the organic matter, wrapped in flocs after pre-coagulation and then accumulated on the membrane surface, would be more easily removed by hydraulic backwash than with the GDM control system. Among two pre-coagulation systems, the lighter Rcl and Rire in the AS-CS/GDM system was ascribed to the formation of a more porous cake layer and less residual organic matters [30].

3.1.2. Membrane Fouling Mechanism

To investigate the mechanisms of membrane fouling in three systems, equations describing four classic filtration models (Table S1) were used to fit the GDM experimental results. The regression results of the GDM, AS/GDM and AS-CS/GDM system data during three filtration cycles are presented in Figure S2, and the R2 values are listed in Table 1. For the first filtration cycle, the data for four models reached a similar R2 value, revealing that the fouling process was due to the participation of four fouling mechanisms. For the second and third filtration cycle, the R2 value for models of intermediate blocking and complete blocking increased, showing that these mechanisms dominated the fouling. Compared to these two mechanisms, the reduction of R2 value in the model of standard blocking and cake layer was correlated with the result by Cheng et al. [22], possibly because the decrease of organic matters with filtration time.

3.2. Filtration Permeate Quality

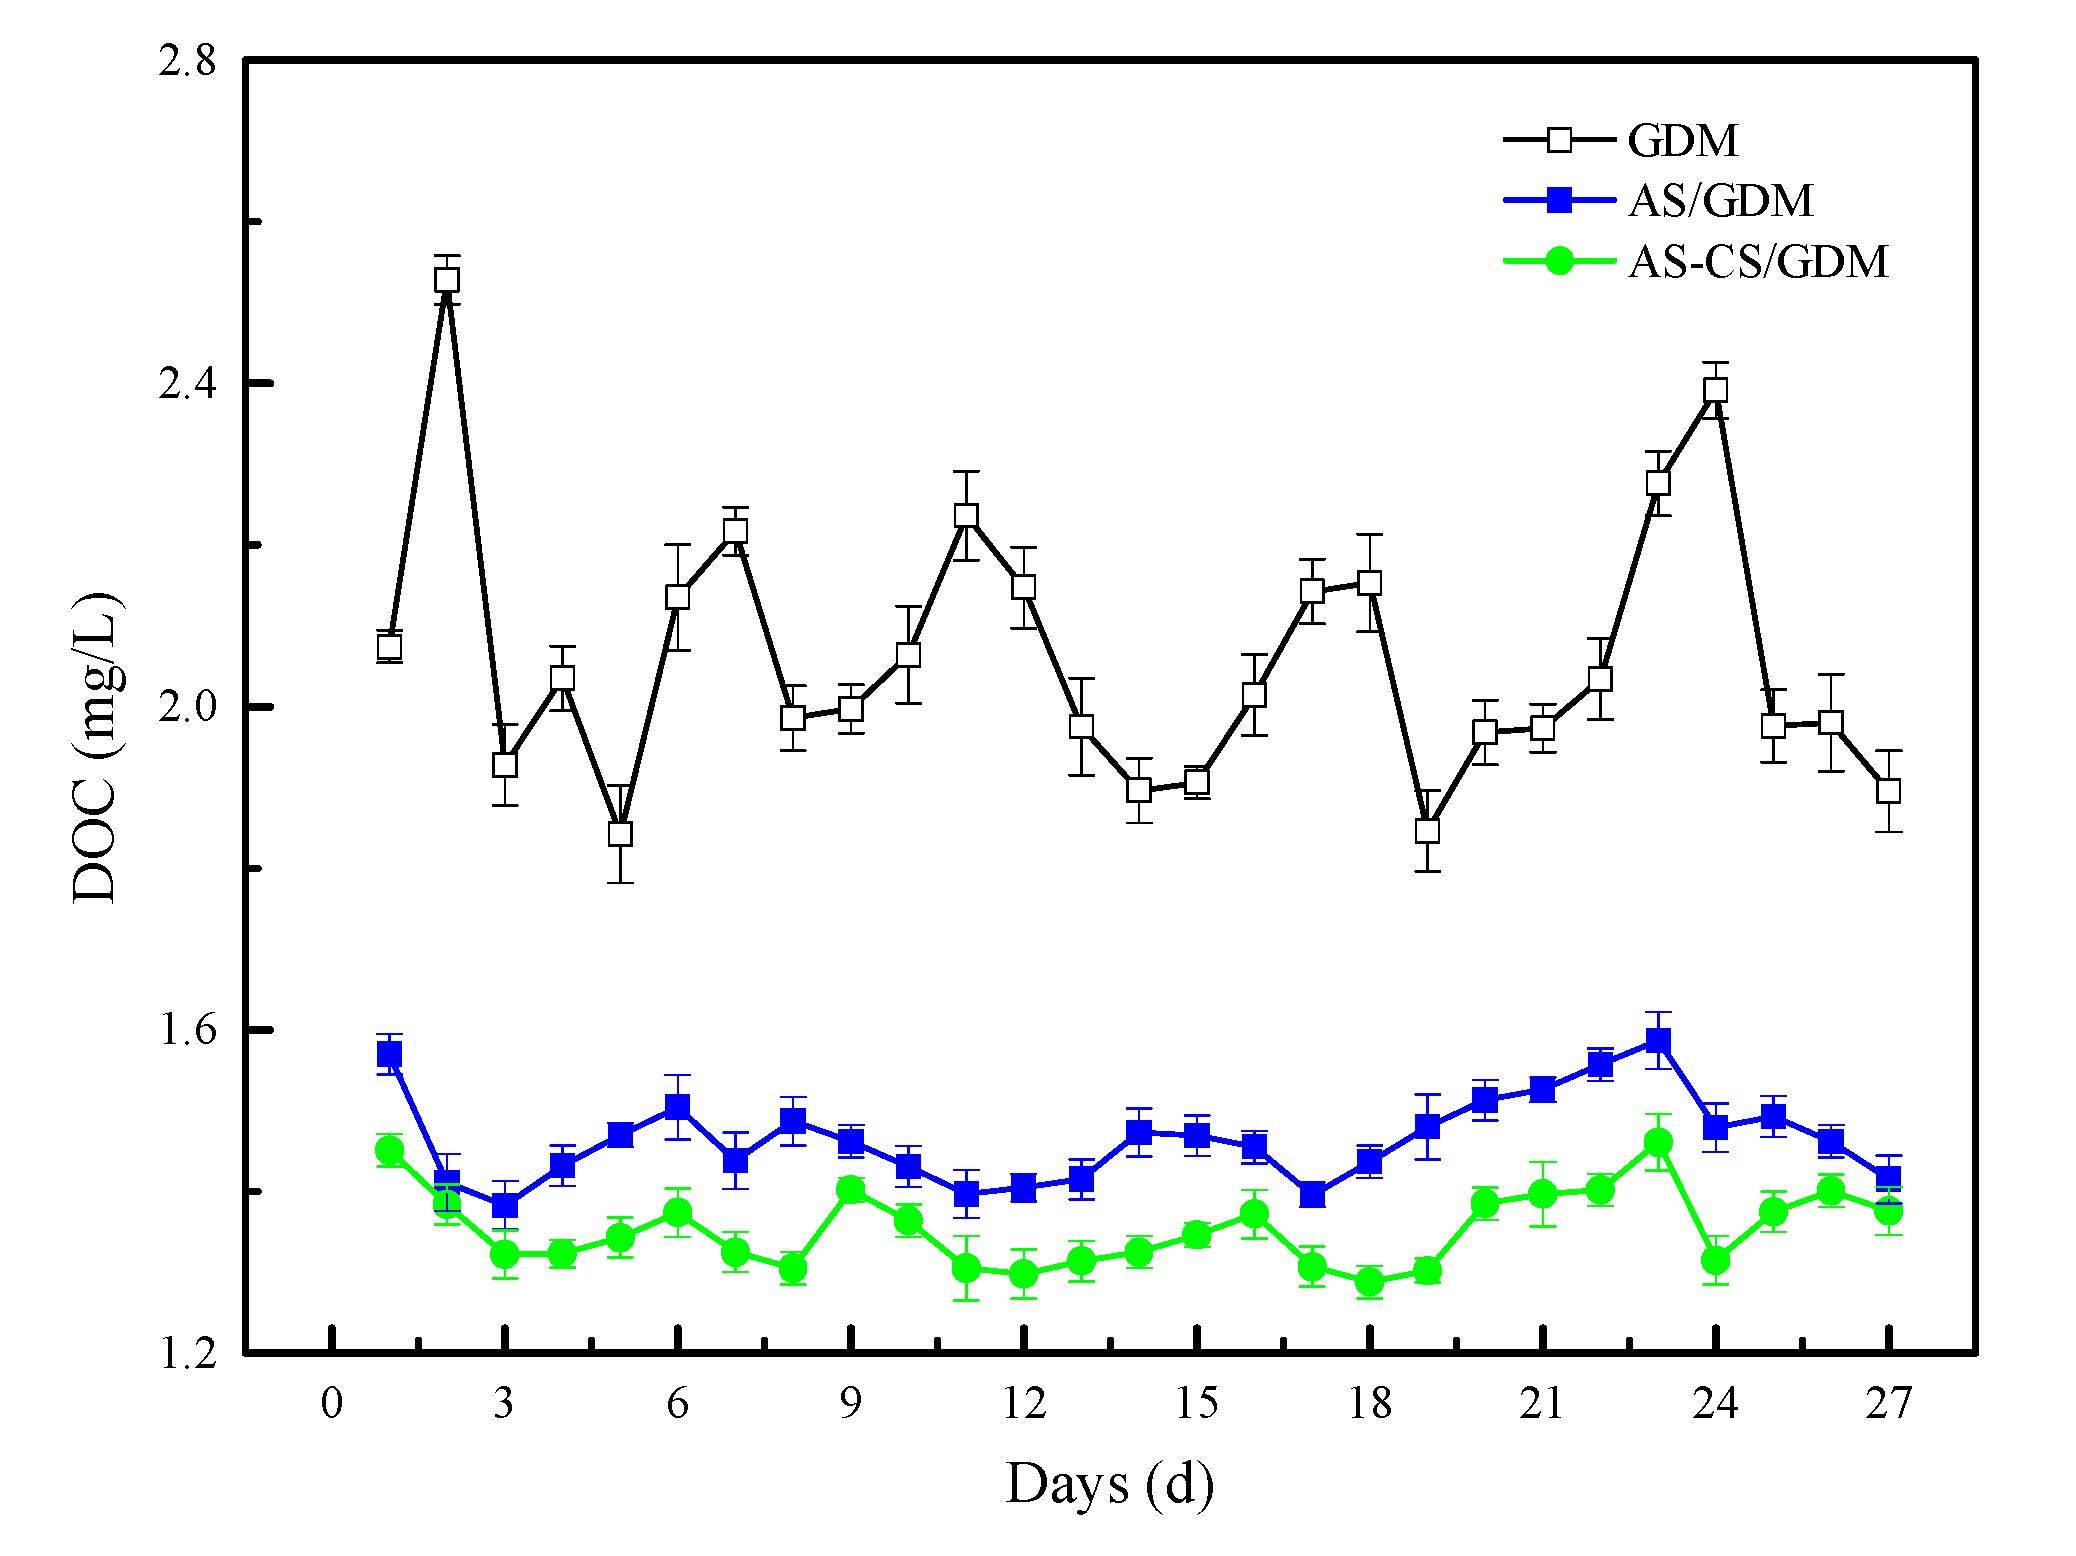
3.2.1. DOC Concentration

The DOC concentrations of each permeate were monitored during the whole operation time (Figure 3). For the GDM control system, DOC concentrations fluctuated by 2.06 mg/L, on average, which was 40.63% and 52.11% higher than for AS/GDM and AS-CS/GDM, respectively. As illustrated in Figure S3, the DOC concentration in raw water was on average 4.00 mg/L, and the concentration of AS and AS-CS decreased to 2.47 and 2.44 mg/L, respectively. It is worth noting that the DOC concentrations of AS and AS-CS pre-coagulation are similar (Figure S3), while the AS of permeate after the UF experiment is 7.53% higher than that of AS-CS (Figure 3). This result demonstrated that the UF membrane in the AS-CS/GDM system can prevent more organic matter from passing through, compared to the AS/GDM system.
The algae density and UV254 of each step at the end of the experiment were measured. Measurements show that the GDM control system can resist 95.56 ± 0.33% of algae cells. For the AS/GDM and AS-CS/GDM systems, the removal increased to 97.67 ± 0.20% and 98.32 ± 0.22%, respectively (Figure S4a). Similar to the result of DOC concentration, there was a minor difference for UV254 between AS and AS-CS pre-coagulation. After permeating through the UF membrane, the AS-CS/GDM system produced the highest UV254 removal, followed by the AS/GDM system (Figure S4b).

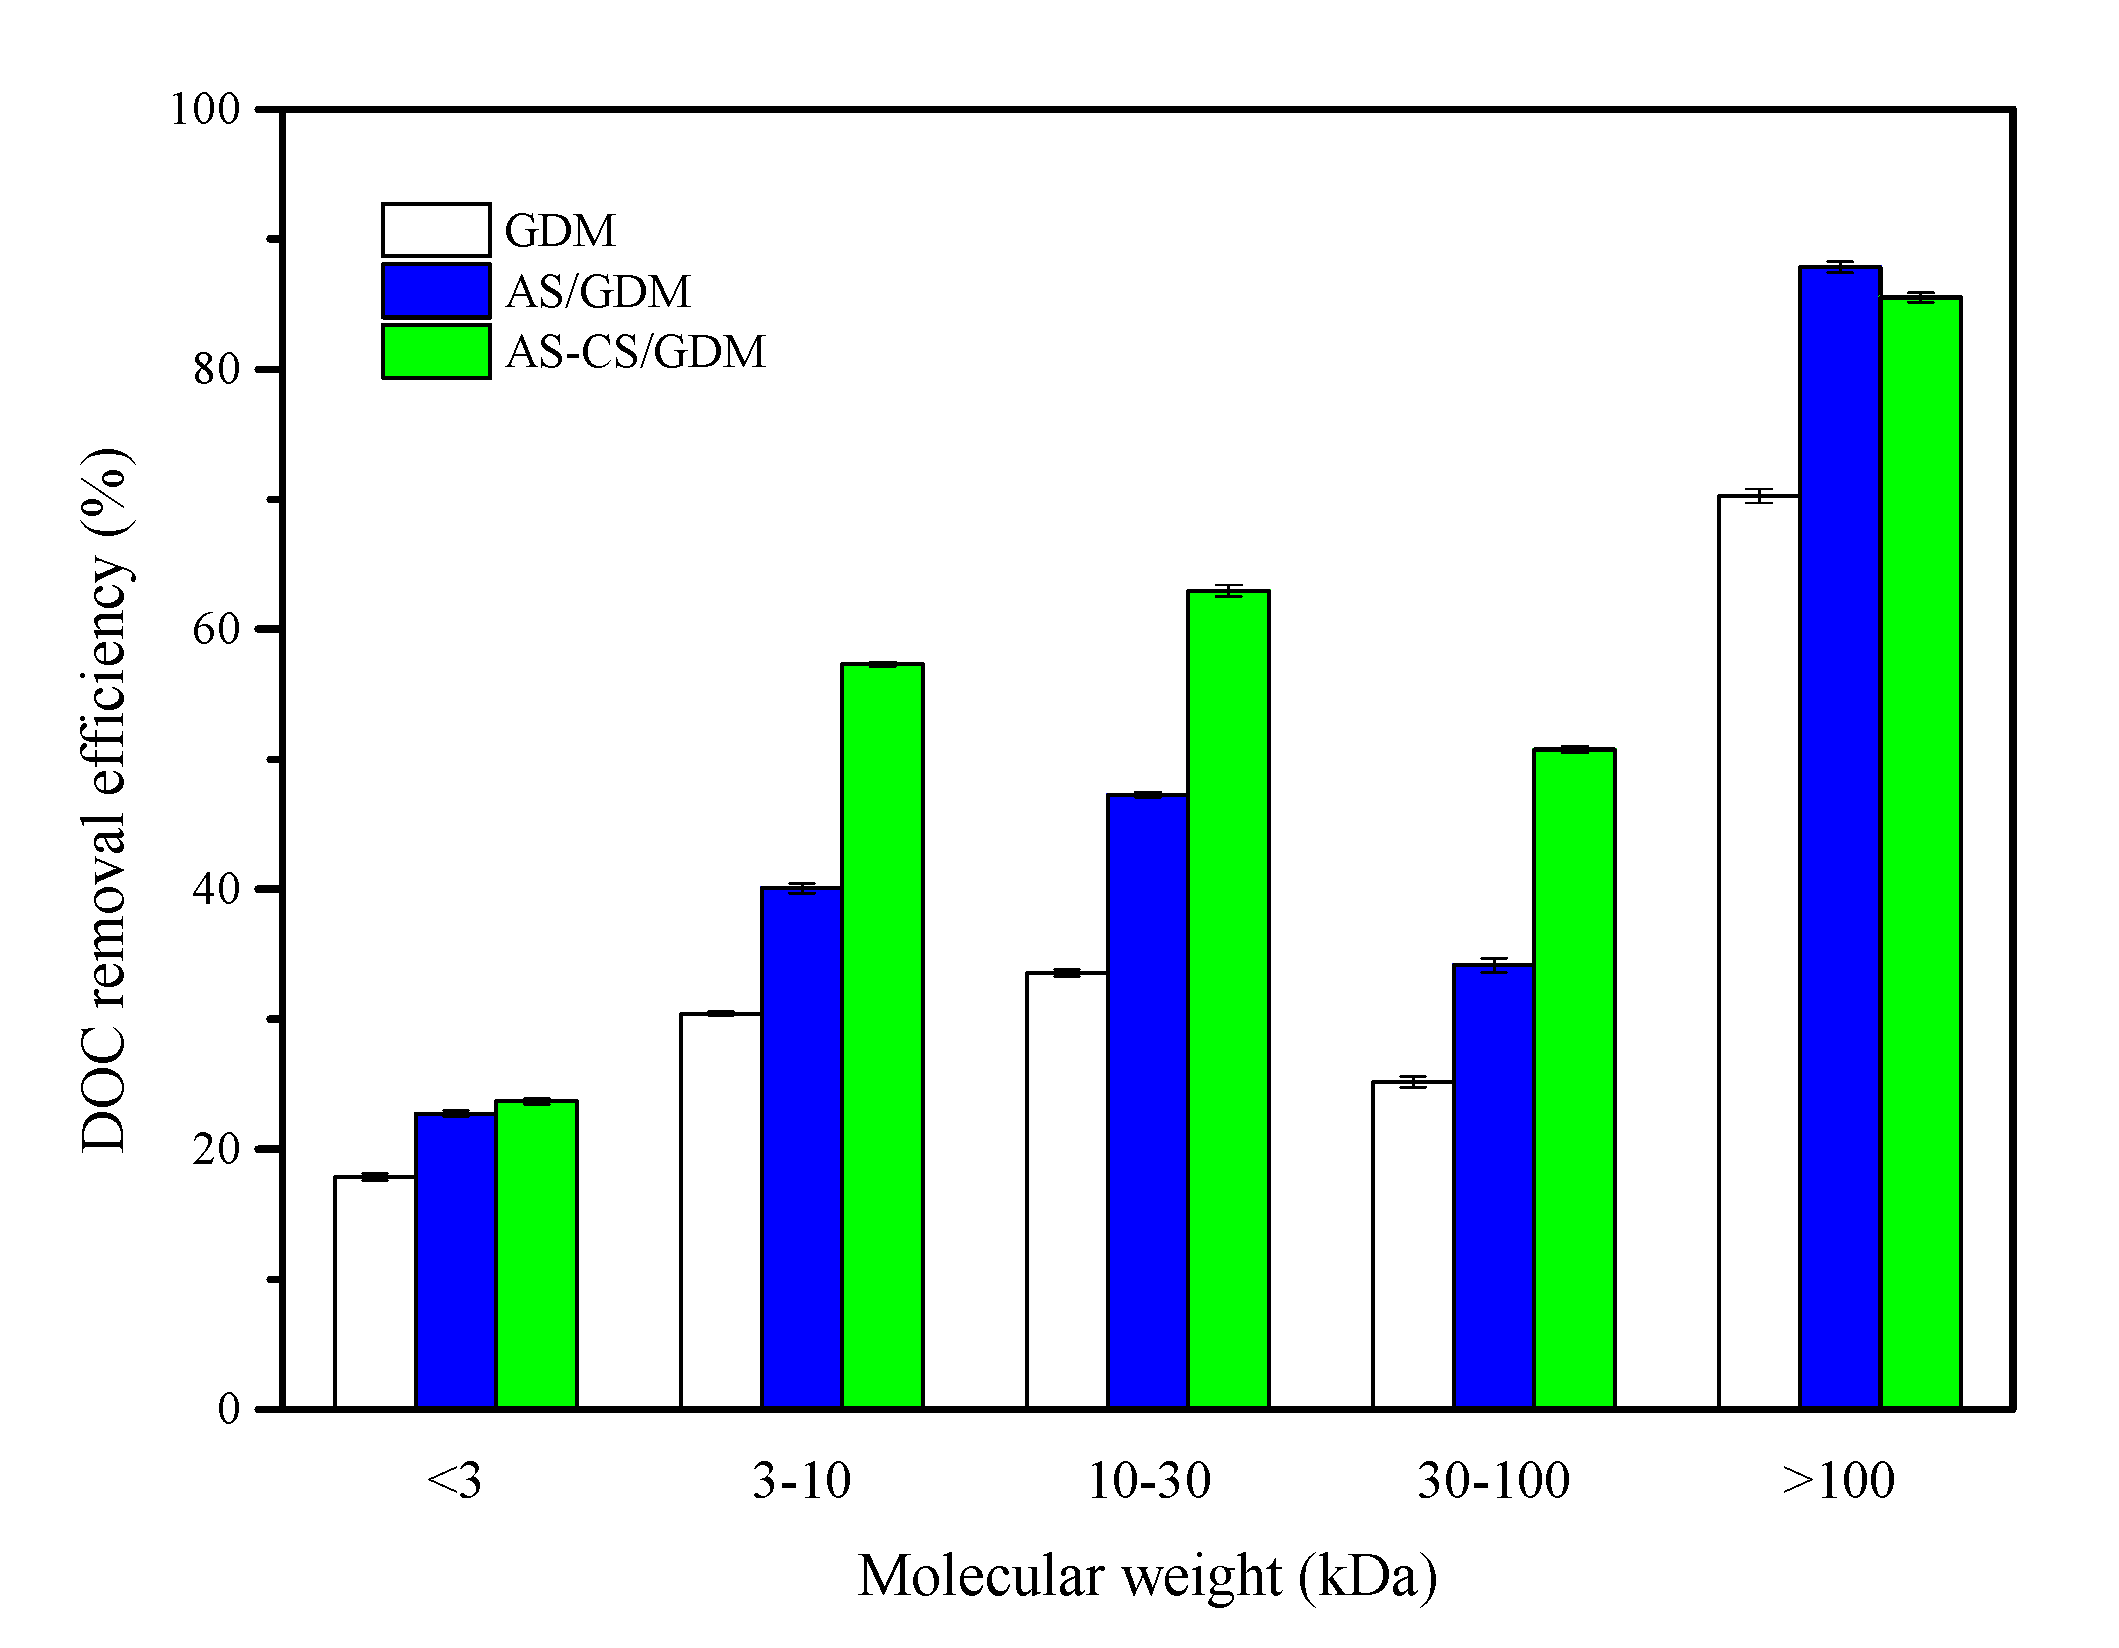
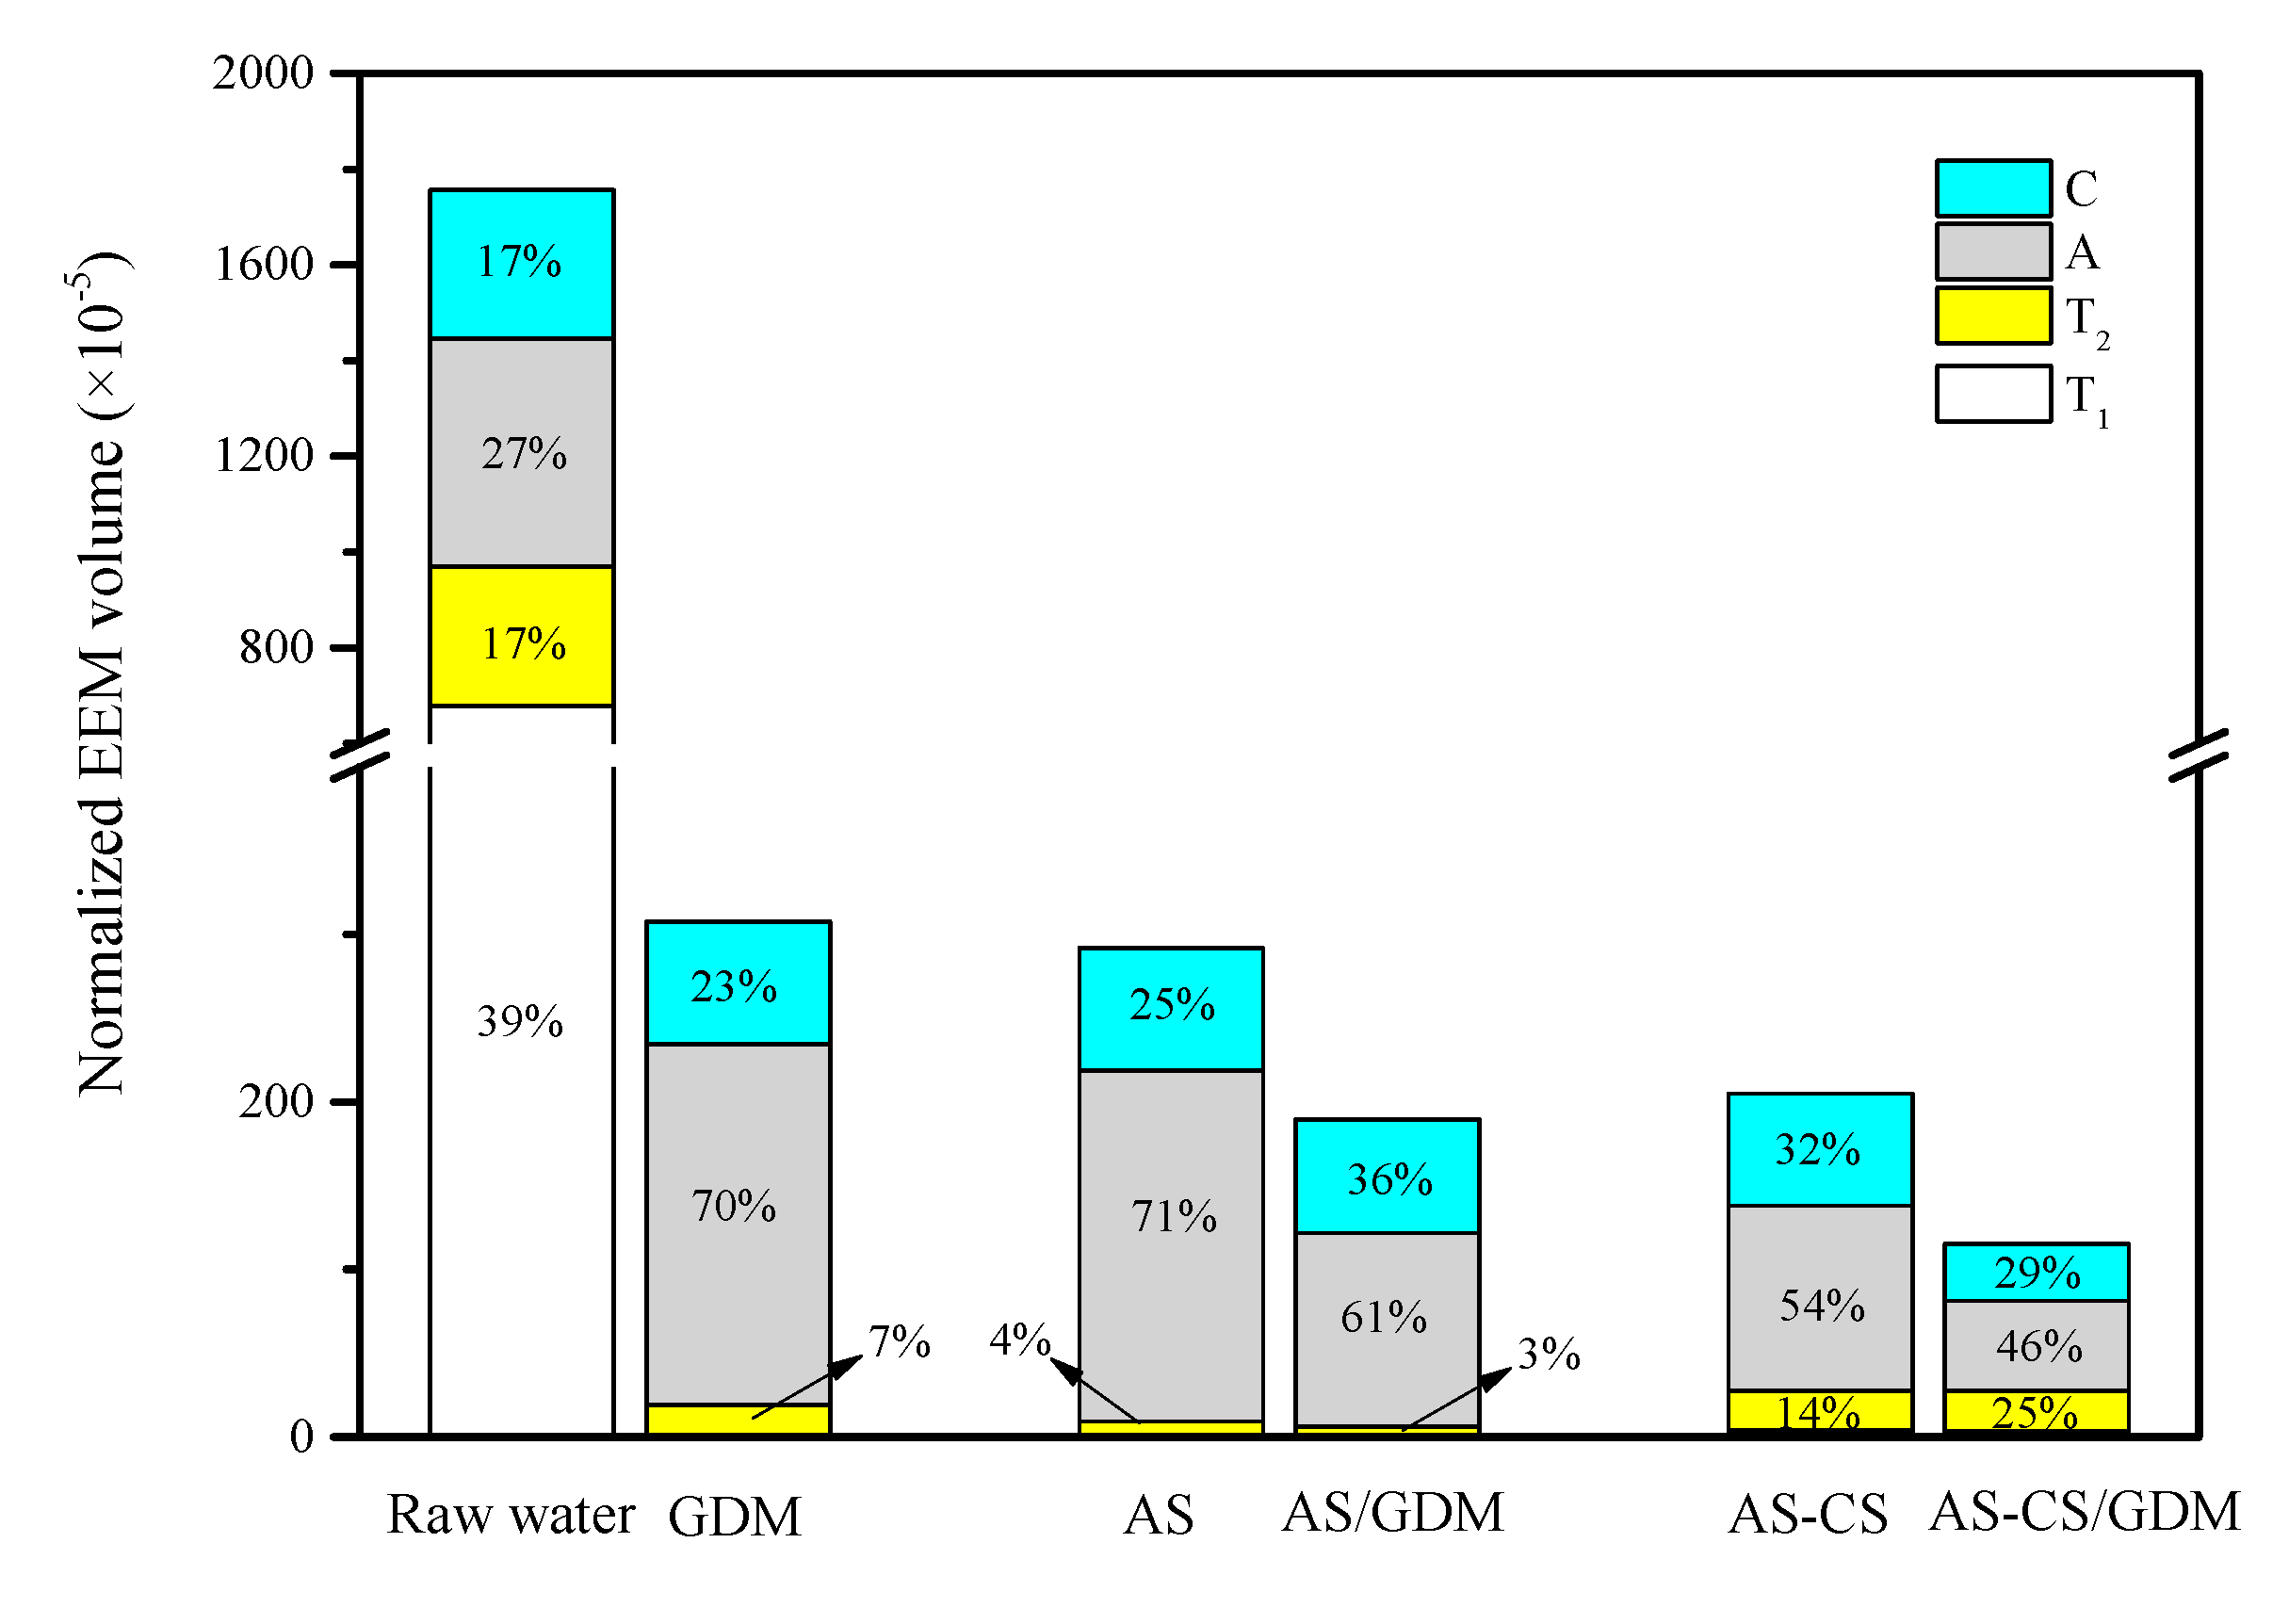
3.2.2. Characterization of Organic Matter

The DOC removal efficiency for different MWs in permeate at the final period of the experiment was measured (Figure 4). Irrespective of MW, the GDM control system obtained the lowest DOC removal efficiency. After the pre-coagulation process, the DOC removal efficiency for MWs more than 3 kDa strongly improved. This result revealed that the addition of coagulant can agglomerate this MW range of organic matter to generate flocs, resulting in the alleviation of pore blockage [31,32]. Compared to the AS/GDM system, the AS-CS/GDM system obtained 37.5% higher removal efficiency for a MW of 3–100 kDa. As illustrated in Figure S5, the DOC removal efficiency for AS-CS pre-coagulation was 9.10–16.67% higher than that of AS for MW < 100 kDa, because the presence of polymeric chains in CS can bridge relatively low MW organics. This result showed that AS-CS pre-coagulation was more effective in removing organic matters for MW < 100 kDa, while the UF membrane in AS-CS/GDM can further resist these organic matters.
To inspect the composition of organics, the EEM spectra of each step at the final period of the experiment is presented in Figure 5, with the distribution of the detected spectral regions shown in Figure 6. The protein-like substances (T1 = 6951.6, T2 = 7594.3) were the main composition of organics in raw water, accounting for 66% of fluorescence concentration. High concentration of a protein-like substance was due to the release of NOM by algae cells [33]. The humic-like substances (A = 2380.2, C = 1328.9) occupied a certain portion of organic matters in raw water (Figure 5a). The protein-like substances were the main foulants that caused severe irreversible membrane fouling with a high value of Rire in the GDM control system (Figure 2). Indeed, the protein-like substances obviously reduced after passing through the UF membrane (T1 = 213.7, T2 = 402.2), while the humic-like substances (A = 655.3, C = 458.2) became the main foulants in the permeate, accounting for 93% of fluorescence concentration. These humic-like substances, with MW < 30 kDa, passed through the GDM membrane and resulted in the enrichment in the permeate (Figure 5b).
Under the effect of pre-coagulation, the protein-like substances can be effectively removed. It is interesting that the normalized EEM volume of peak T2 in the pre-coagulation of AS-CS (23.76 × 10⁵) is higher than that of AS (8.181 × 10⁵) (Figure 6), while the peak A and C in AS-CS pre-coagulation is much lower (Figure 5c,e). When coagulated water passed through the UF membrane, the intensity of peak A and C in AS-CS/GDM obviously reduced, but the peak T2 slightly improved. This phenomenon illustrated that the AS-CS/GDM system can significantly remove humic-like substances having a MW of 3–100 kDa. However, the application of the AS-CS/GDM system slightly improved the concentration of protein-like substances, possibly because of the generation of more microorganisms [34].

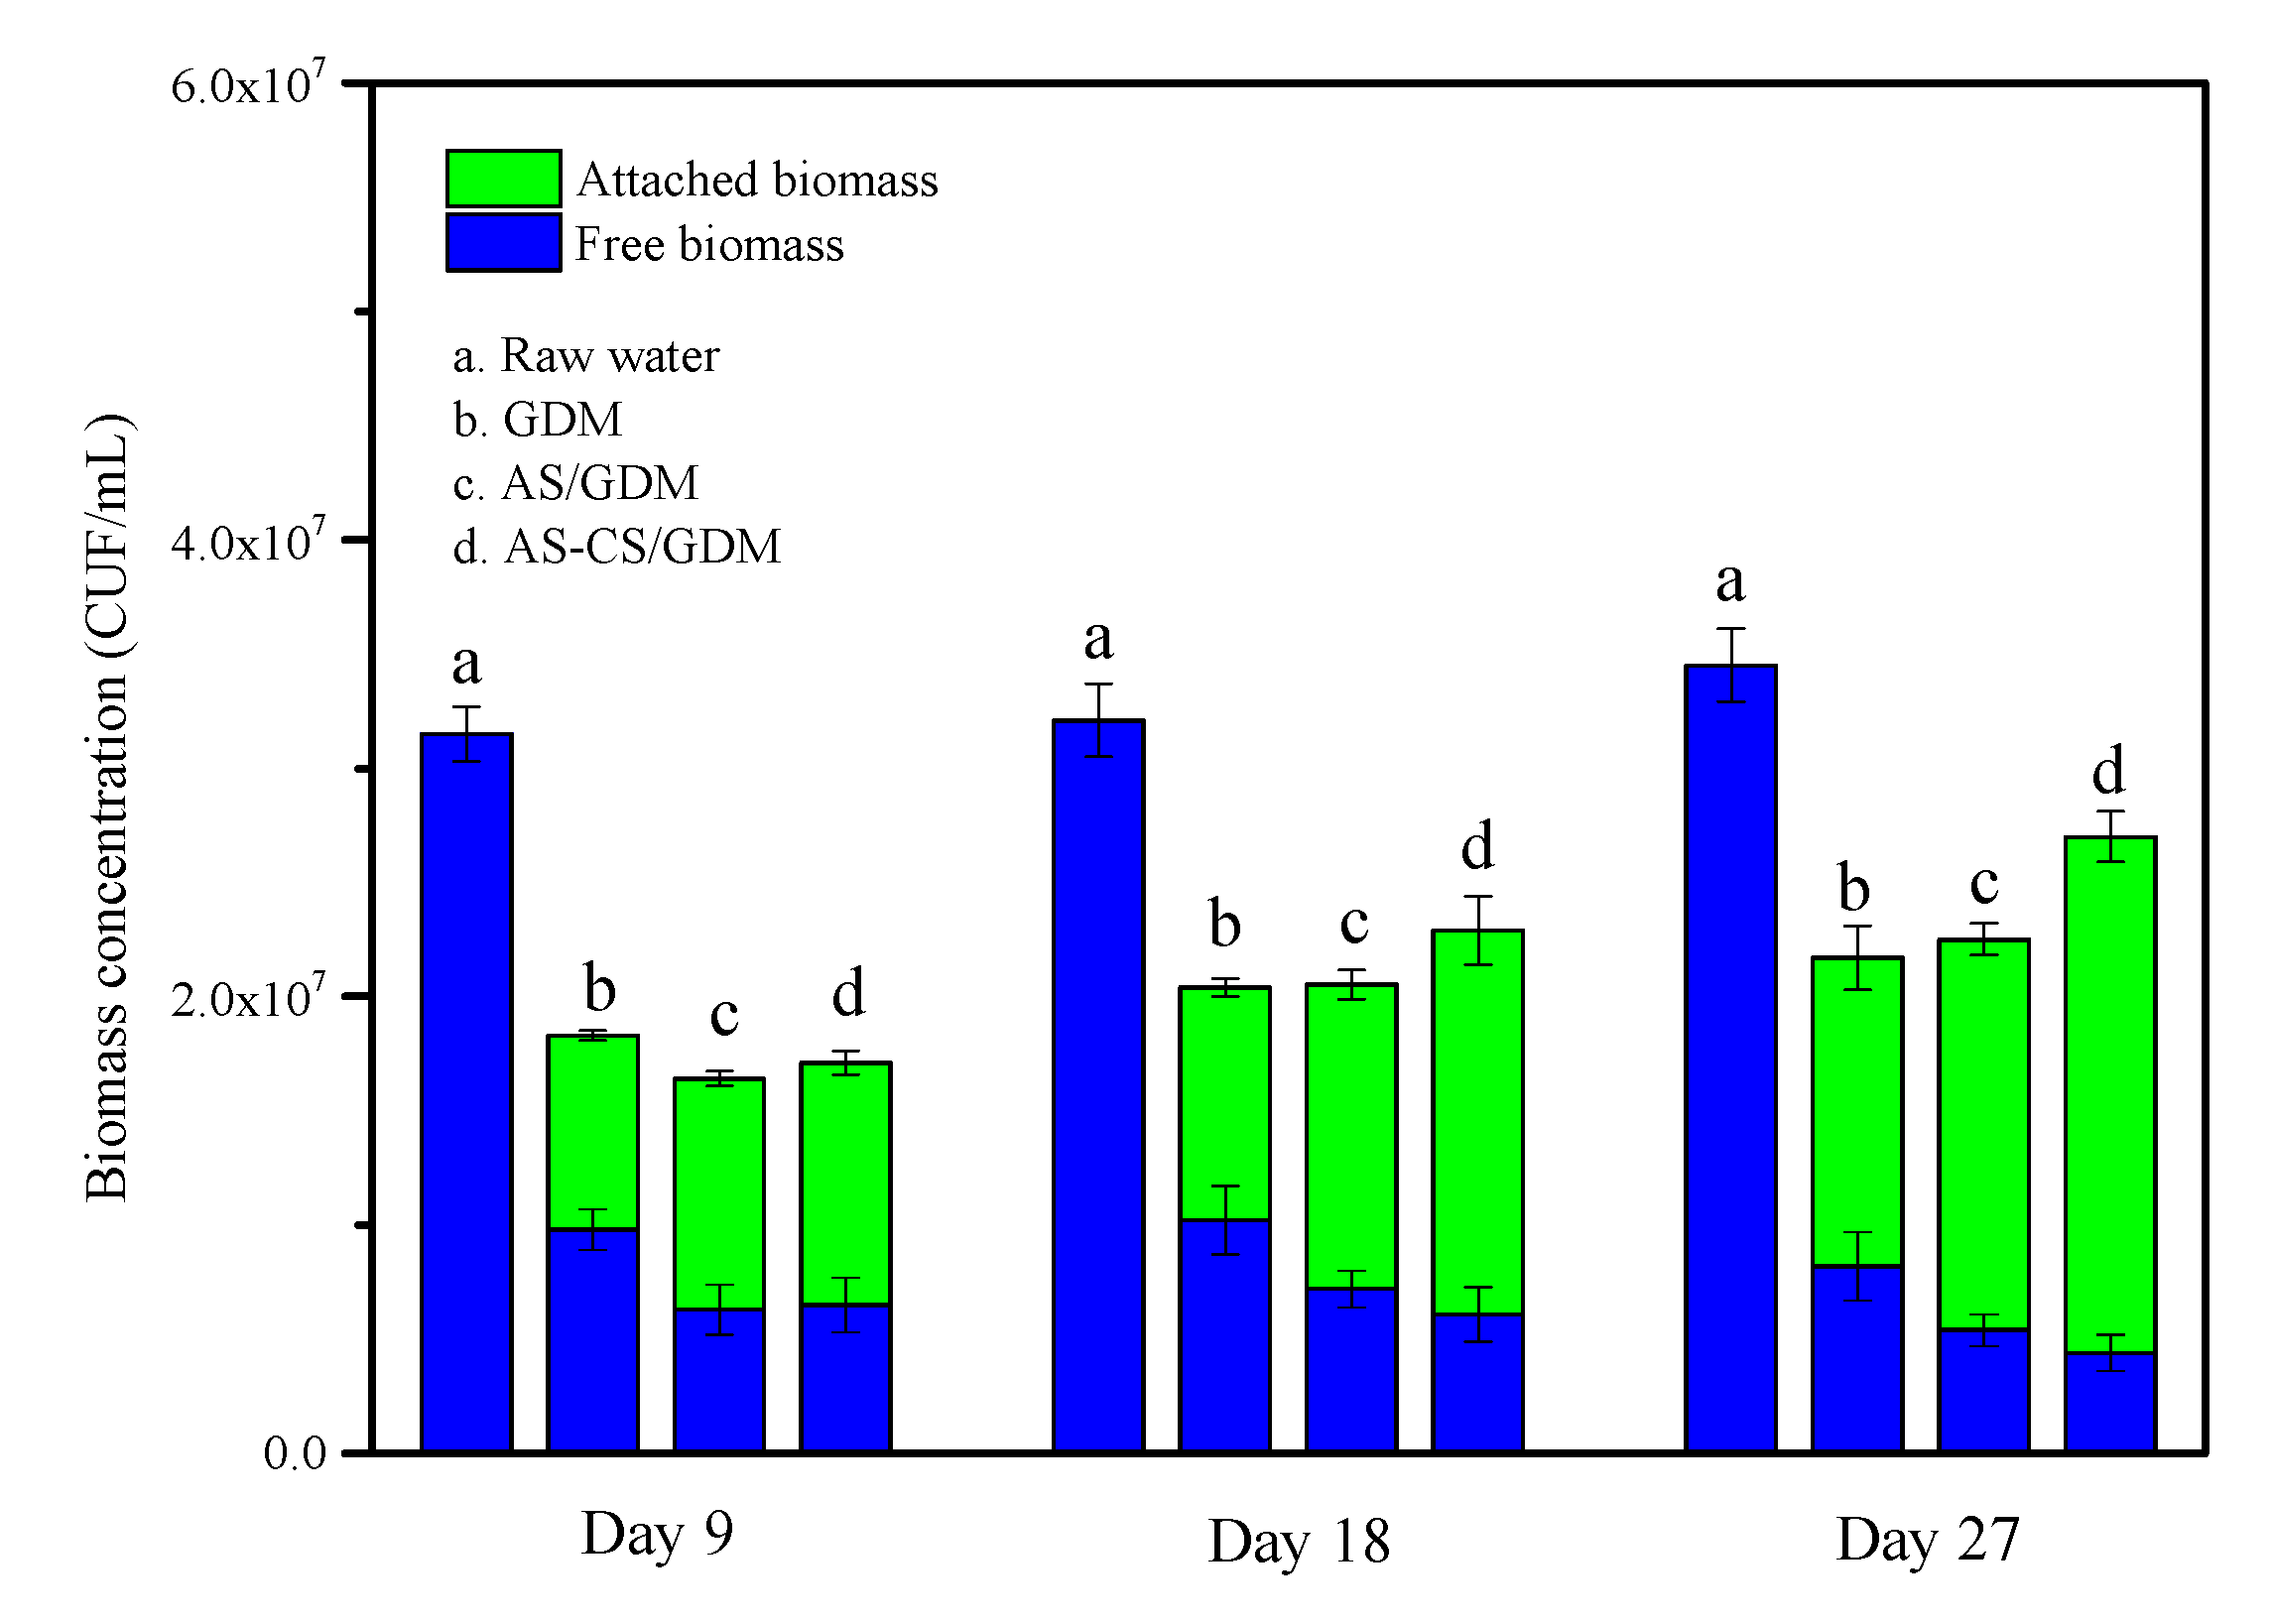
3.2.3. Biomass Concentration

To investigate the microbial characteristics of different conditions, the zeta potential, pH value and NH3-N concentration of each step at the final period of the experiment were measured. The zeta potential of raw water was −10.75 ± 0.45 mV, and the value increased to −8.45 ± 0.84 mV after GDM filtration, which was due to the rejection of negatively charged particles. After the addition of AS or AS-CS, the zeta potentials increased to −2.65 ± 0.07 mV. Different from the GDM control system, the zeta potentials of AS and AS-CS decreased after passing through the UF membrane, which can be explained by the enrichment of microorganisms with negative charges (Figure S6a) [35]. Figure S6b shows that the pH values in all steps are in the range of 6.7–7.2, which is suitable for the growth of microorganisms [36]. The reduction of the NH3-N concentration after GDM filtration can verify the formation of microorganisms on the membrane surface [37]. It can be observed that the NH3-N concentration in AS-CS/GDM system is the lowest, suggesting the exitance of maximum microorganisms in this case (Figure S6c).
The free biomass in the permeate and the attached biomass on the UF membrane were analyzed to explore the distribution of biomass. As shown in Figure 7, the concentration of attached biomass increases with the filtration time, while the free biomass shows a tendency to remain unchanged. For the AS-CS/GDM system, the concentration of attached biomass increases from 1.06 × 10⁷ to 2.26 × 10⁷ CUF/mL, which is the highest among the three systems, illustrating that the AS-CS cake layer is more suitable for the proliferation of microorganisms. The higher intensity of protein-like substances in the permeate of AS-CS/GDM was due to the stronger proliferation and metabolism of biomass, and we will discuss details in the following section.

4. Discussions

The properties of flocs play a key role in controlling the UF membrane fouling because both the cake layer and pore blockage were determined by the floc characteristics [38]. To understand the floc properties of AS and AS-CS pre-coagulation, the average size and structure of flocs prior to GDM filtration are clarified. Figure 8 illustrates the floc size distribution and fractal dimension (Dpf) after two pre-coagulations. For the AS pre-coagulation, 82.28% of the flocs were sized less than 80 μm, while 13.92% of the flocs were sized in the range of 100–140 μm. For the AS-CS pre-coagulation, 62.19% of the flocs were sized less than 80 μm, and 27.56% of the flocs were sized in the range of 100 to 140 μm. As reported in a previous study, the flocs formed with larger size could generate a cake layer with larger pore size and with higher porosity, resulting in the alleviation of reversible fouling [16]. Thus, compared with AS pre-coagulation, the lighter Rcl of AS-CS was because the presence of the Al-NH3 bond in AS-CS improved the floc size [39]. However, there was a minor difference for the value of Dpf between two pre-coagulations, revealing the formation of flocs with similar structure.
Figure 9 shows the SEM images of the cake layer formed by three different systems. It is evident that the cake layer formed without pre-coagulation is the densest blocked by algae cells, resulting in a decline of permeate flux with the improved cake layer resistance. Similar to the result of the floc property, more porous and looser cake layer can be observed under the effect of pre-coagulation, which reduces the value of Rcl. Furthermore, the cake layer formed by two pre-coagulations show similar compactness. To be specific, many small aggregations can be observed on the surface of AS-CS cake layer, but not on the AS cake layer. These small aggregations are related to the participation of CS in composite coagulant.
The mechanism of membrane fouling mitigation by the AS-CS/GDM system is illustrated in Figure 10. From the result in Figure 5, it can be concluded that the polymeric chain in CS can adsorb humic-like substances with a MW of 3–100 kDa, resulting in a lower concentration of DOC in permeate. Both CS and humic-like substances together formed the small aggregations on the cake layer surface, which not only avoided membrane pore blockage, but contributed to the proliferation of microorganisms [40,41]. The microorganisms attached to the aggregations exploit humic-like substances as the carbon sources and biodegrade them [42]. This result needs to be further investigated.

5. Conclusions

A composite coagulant of AS-CS was coupled with the GDM system to treat algae-laden water, and it was compared with the AS/GDM and GDM systems. The membrane filtration performance, characteristics of organic matters and biomass concentration were investigated, and the underlying mechanism was revealed. The main findings in this study are as follows:
  • Compared with AS/GDM and the GDM control system, the AS-CS/GDM system alleviated 26.40% and 53.24% of hydraulically reversible resistance, and 14.89% and 68.33% of hydraulically irreversible resistance, respectively. The application of AS-CS pre-coagulation can prolong the life of the GDM membrane.
  • Compared with the AS/GDM system, the AS-CS/GDM system effectively removed humic-like substances in the MW range of 3 to 100 kDa, while slightly improving the protein-like substance, resulting in a 7.53% lower concentration of DOC.
  • The presence of AS-CS pre-coagulation increased the concentration of attached biomass, which improved the biodegradability of microorganisms attached on the UF membrane surface.
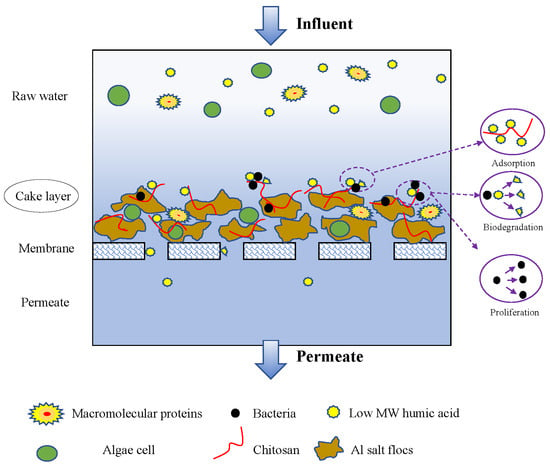
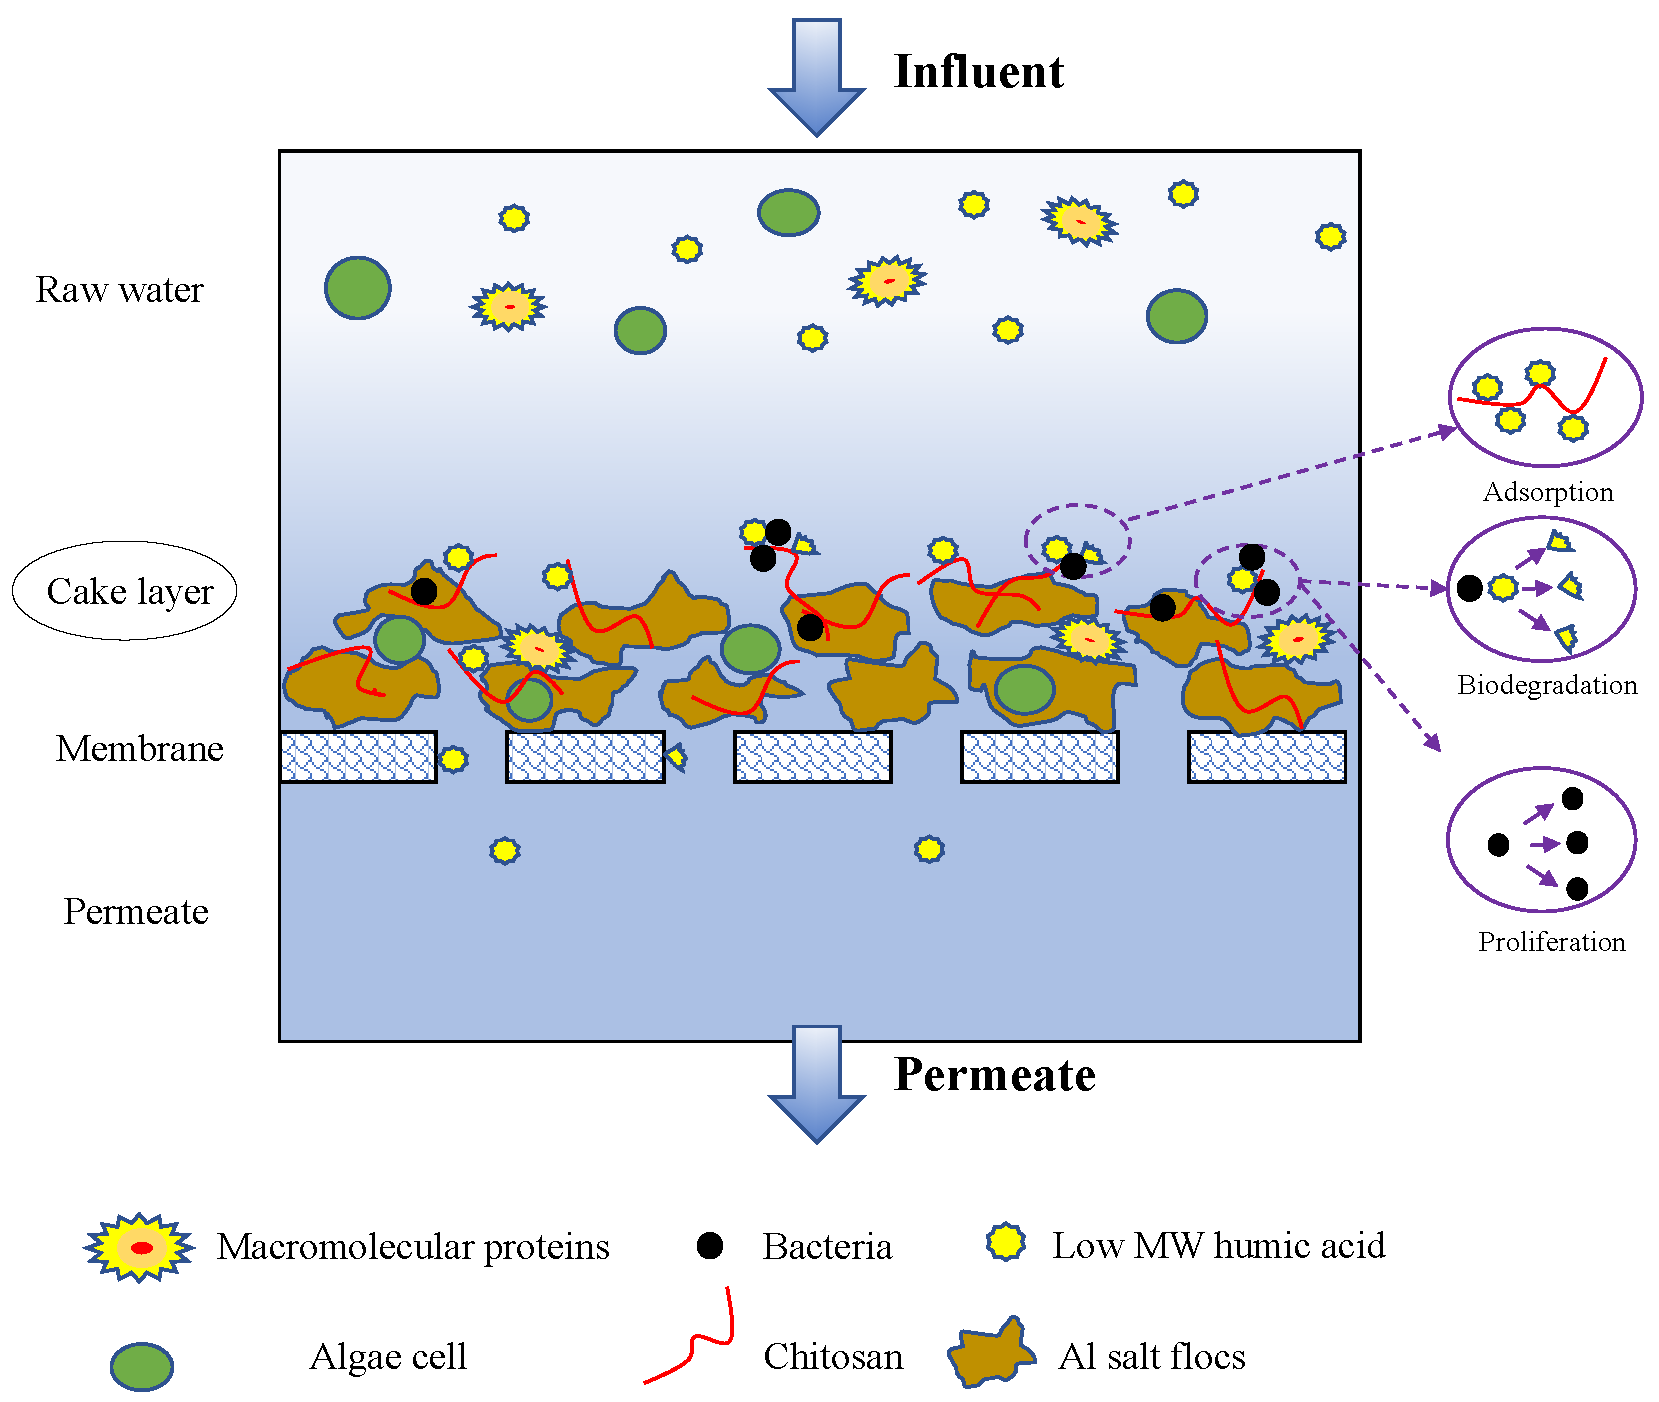
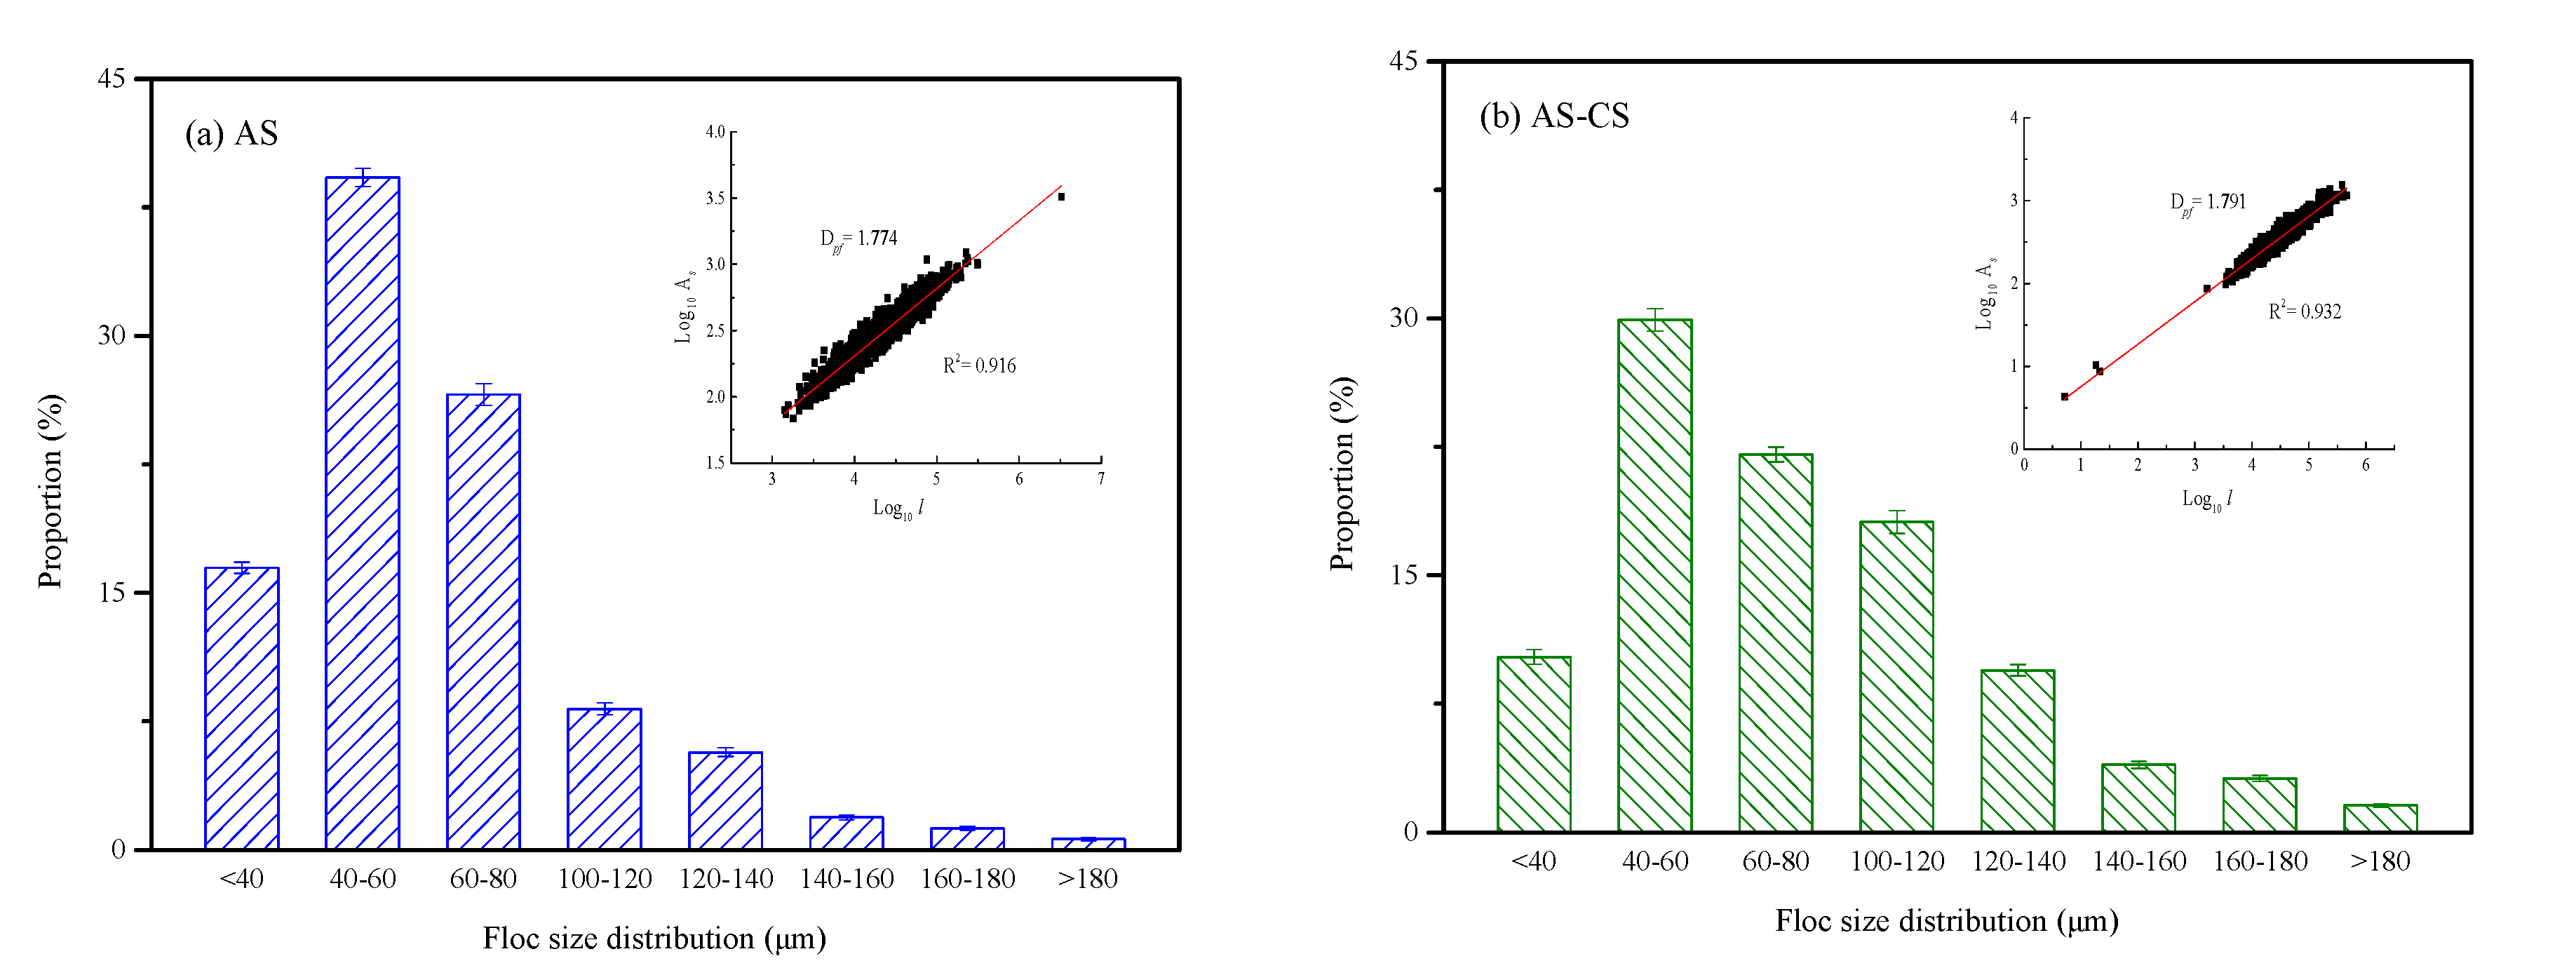
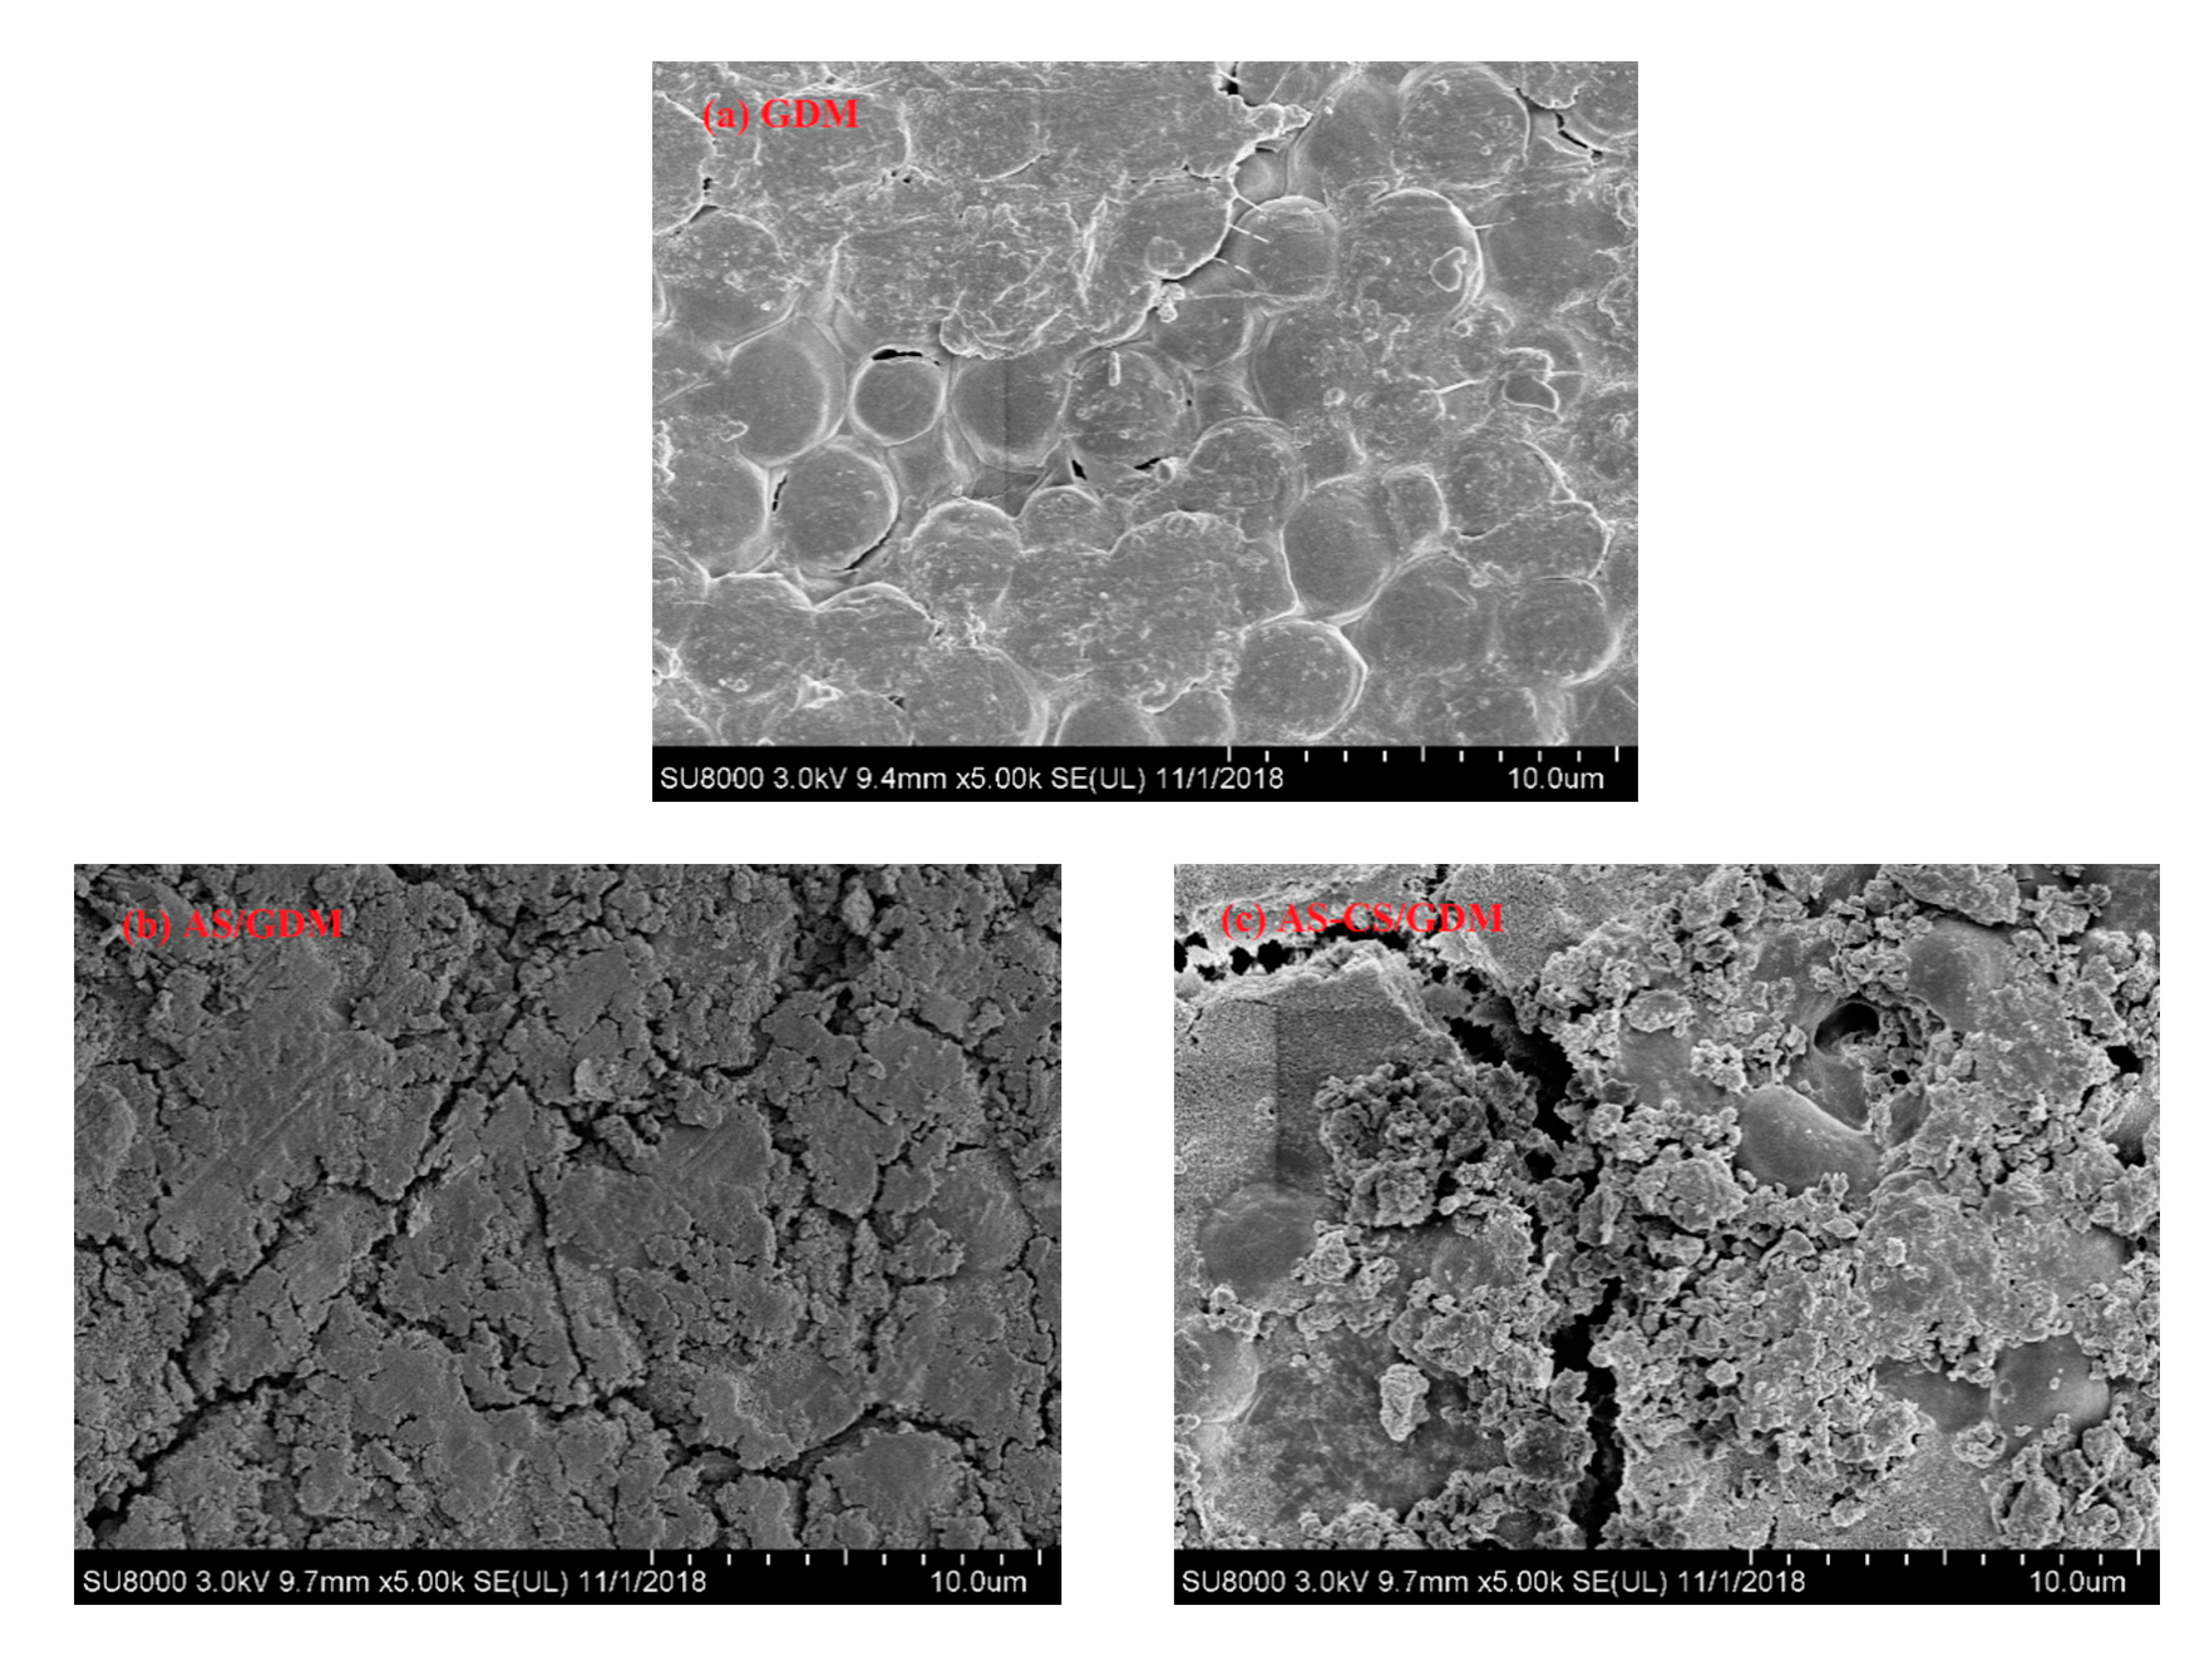
  • The generation of larger flocs in the AS-CS pre-coagulation step led to a porous cake layer with light Rcl. The presence of the CS polymeric chain in the AS-CS cake layer, together with humic-like substances, can form small aggregations, which were suitable for the proliferation of microorganisms with more attached biomass. The microorganisms effectively remove humic-like substances in the MW range of 3 to 100 kDa, resulting in the mitigation of pore blockage.

Supplementary Materials

The following are available online at https://www.mdpi.com/2073-4441/12/7/1990/s1, Figure S1. Schematic diagrams of four filtration models: (a) complete blocking, (b) standard blocking, (c) intermediate blocking and (d) cake filtration. Figure S2. Regression analyses of fouling in three systems during three cycles: (a) cake filtration, (b) intermediate blocking, (c) standard blocking and (d) complete blocking. Figure S3. Concentration of DOC of raw water without pretreatment and after AS or AS-CS coagulation treatment. Figure S4. (a) Algae density and (b) UV254 of different steps at three periods of the experiment. Figure S5. DOC removal efficiency of different MWs of suspensions in AS and AS-CS coagulation treatment at the 27th day of the experiment. Figure S6. (a) Zeta potential, (b) pH and (c) NH3-N of different steps at the 27th day of the experiment. Table S1. Equations of different fouling models for dead-end filtration.

Author Contributions

P.D. and J.F. were responsible for the experimental work, X.L. and Y.Y. supervised the laboratory work, Z.Z. and X.F. led the research. All authors have read and agreed to the published version of the manuscript.

Funding

This research was funded by the National Natural Science Foundation of China (51478010).

Acknowledgments

We would like to give our sincere thanks to the peer-reviewers for their suggestions.

Conflicts of Interest

The authors declare no conflict of interest.

References

  1. Liu, B.; Qu, F.S.; Liang, H.; Van der Bruggen, B.; Cheng, X.X.; Yu, H.R.; Xu, G.R.; Li, G.B. Microcystis aeruginosa-laden surface water treatment using ultrafiltration: Membrane fouling, cell integrity and extracellular organic matter rejection. Water Res. 2017, 112, 83–92. [Google Scholar] [CrossRef] [PubMed]
  2. Qu, F.S.; Du, X.; Liu, B.; He, J.G.; Ren, N.Q.; Li, G.B.; Liang, H. Control of ultrafiltration membrane fouling caused by Microcystis cells with permanganate preoxidation: Significance of in situ formed manganese dioxide. Chem. Eng. J. 2015, 279, 56–65. [Google Scholar] [CrossRef]
  3. Zhou, S.Q.; Shao, Y.S.; Gao, N.Y.; Deng, Y.; Li, L.; Deng, J.; Tan, C.Q. Characterization of algal organic matters of Microcystis aeruginosa: Biodegradability, DBP formation and membrane fouling potential. Water Res. 2014, 52, 199–207. [Google Scholar] [CrossRef] [PubMed]
  4. Zhang, Y.; Fu, Q. Algal fouling of microfiltration and ultrafiltration membranes and control strategies: A review. Sep. Purif. Technol. 2018, 203, 193–208. [Google Scholar] [CrossRef]
  5. Yu, C.H.; Gao, B.Y.; Wang, W.Y.; Xu, X.; Yue, Q.Y. Alleviating membrane fouling of modified polysulfone membrane via coagulation pretreatment/ultrafiltration hybrid process. Chemosphere 2019, 235, 58–69. [Google Scholar] [CrossRef] [PubMed]
  6. Chuang, Y.; Szczuka, A.; Shabani, F.; Munoz, J.; Aflaki, R.; Hammond, S.; Mitch, W. Pilot-scale comparison of microfiltration/reverse osmosis and ozone/biological activated carbon with UV/hydrogen proxide or UV/free chlorine AOP treatment for controlling disinfection byproducts during wastewater reuse. Water Res. 2019, 152, 215–225. [Google Scholar] [CrossRef]
  7. Chang, H.Q.; Liu, B.C.; Wang, H.Z.; Zhang, S.; Chen, S.; Tiraferri, A.; Tang, Y. Evaluating the performance of gravity-driven membrane filtration as desalination pretreatment of shale gas flowback and produced water. J. Membr. Sci. 2019, 587, 117187. [Google Scholar] [CrossRef]
  8. Tang, X.B.; Pronk, W.; Ding, A.; Cheng, X.X.; Wang, J.L.; Xie, B.H.; Li, G.B.; Liang, H. Coupling GAC to ultra-low-pressure filtration to modify the biofouling layer and bio-community: Flux enhancement and water quality improvement. Chem. Eng. J. 2018, 333, 289–299. [Google Scholar] [CrossRef]
  9. Ding, A.; Liang, H.; Li, G.B.; Derlon, N.; Szivak, I.; Morgenroth, E.; Pronk, W. Impact of aeration shear stress on permeate flux and fouling layer properties in a low pressure membrane bioreactor for the treatment of grey water. J. Membr. Sci. 2016, 510, 382–390. [Google Scholar] [CrossRef]
  10. Peter-Varbanets, M.; Margot, J.; Traber, J.; Pronk, W. Mechanism of membrane fouling during ultra-low pressure ultrafiltration. J. Membr. Sci. 2011, 377, 42–53. [Google Scholar] [CrossRef]
  11. Derlon, N.; Mimoso, J.; Klein, T.; Koetzsch, S.; Morgenroth, E. Presence of biofilms on ultrafiltration membrane surfaces increases the quality of permeate produced during ultra-low pressure gravity-driven membrane filtration. Water Res. 2014, 60, 164–173. [Google Scholar] [CrossRef] [PubMed]
  12. Chomiak, A.; Traber, J.; Morgenroth, E.; Derlon, N. Biofilm increases permeate quality by organic carbon degradation in low pressure ultrafiltration. Water Res. 2015, 85, 512–520. [Google Scholar] [CrossRef] [PubMed]
  13. Peter-Varbanets, M.; Gujer, W.; Pronk, W. Intermittent operation of ultra-low pressure ultrafiltration for decentralized drinking water treatment. Water Res. 2012, 46, 3272–3282. [Google Scholar] [CrossRef] [PubMed]
  14. Ding, A.; Wang, J.; Lin, D.; Tang, X.; Cheng, X.X.; Wang, H.; Bai, L.; Li, G.B.; Liang, H. A low pressure gravity-driven membrane filtration (GDM) system for rainwater recycling: Flux stabilization and removal performance. Chemosphere 2017, 172, 21–28. [Google Scholar] [CrossRef] [Green Version]
  15. Akhondi, E.; Wu, B.; Sun, S.; Marxer, B.; Lim, W.; Gu, J.; Liu, L.; Burkhardt, M.; McDougald, D.; Pronk, W.; et al. Gravity-driven membrane filtration as pre-treatment for seawater reverse osmosis: Linking biofouling layer morphology with flux stabilization. Water Res. 2015, 70, 158–173. [Google Scholar] [CrossRef]
  16. Yu, W.Z.; Liu, T.; Gregory, J.; Campos, L.; Li, G.B.; Qu, J.H. Influence of flocs breakage process on submerged ultrafiltration membrane fouling. J. Membr. Sci. 2011, 385–386, 194–199. [Google Scholar] [CrossRef]
  17. Ding, A.; Wang, J.L.; Lin, D.C.; Tang, X.B.; Cheng, X.X.; Li, G.B.; Ren, N.Q.; Liang, H. In situ coagulation versus pre-coagulation for gravity-driven membrane bioreactor during decentralized sewage treatment: Permeability stabilization, fouling layer formation and biological activity. Water Res. 2017, 126, 197–207. [Google Scholar] [CrossRef]
  18. Qi, J.; Lan, H.C.; Liu, R.P.; Liu, H.J.; Qu, J.H. Fe(II)-regulated moderate pre-oxidation of Microcystis aeruginosa and formation of size-controlled algae flocs for efficient flotation of algae cell and organic matter. Water Res. 2018, 137, 57–63. [Google Scholar] [CrossRef]
  19. Ji, J.; Qiu, J.; Wai, N.; Wong, F.S.; Li, Y. Influence of organic and inorganic flocculants on physical-chemical properties of biomass and membrane-fouling rate. Water Res. 2010, 44, 1627–1635. [Google Scholar] [CrossRef]
  20. Ma, C.X.; Hu, W.R.; Pei, H.Y.; Xu, H.Z.; Pei, R.T. Enhancing integrated removal of Microcystis aeruginosa and adsorption of Microcystins using chitosan-aluminum chloride combined coagulants: Effect of chemical dosing orders and coagulation mechanisms. Colloid Surf. A 2016, 490, 258–267. [Google Scholar] [CrossRef]
  21. Wang, W.Y.; Qu, F.S.; Li, R.H.; Bu, F.; Shen, X.; Gao, B.Y. Optimization of coagulation pre-treatment for alleviating ultrafiltration membrane fouling: The role of floc properties on Al species. Chemosphere 2018, 200, 86–92. [Google Scholar] [CrossRef]
  22. Cheng, X.X.; Liang, H.; Ding, A.; Zhu, X.W.; Tang, X.B.; Gan, Z.D.; Xing, J.J.; Wu, D.J.; Li, G.B. Application of Fe(II)/peroxymonosulfate for improving ultrafiltration membrane performance in surface water treatment: Comparison with coagulation and ozonation. Water Res. 2017, 124, 298–307. [Google Scholar] [CrossRef]
  23. Choo, K.H.; Lee, C.H. Membrane fouling mechanisms in the membrane-coupled anaerobic bioreactor. Water Res. 1996, 30, 1771–1780. [Google Scholar] [CrossRef]
  24. Yu, W.Z.; Zhang, D.J.; Graham, N. Membrane fouling by extracellular polymeric substances after ozone pre-treatment: Variation of nano-particles size. Water Res. 2017, 120, 146–155. [Google Scholar] [CrossRef] [PubMed]
  25. Hermia, J. Constant pressure blocking filtration laws-appllication to power-law non-Newtonian fluids. Trans. Inst. Chem. Eng. 1982, 60, 183–187. [Google Scholar]
  26. Bowen, W.R.; Calvo, J.I.; Hernadez, A. Steps of membrane blocking in flux decline during protein microfiltration. J. Member. Sci. 1995, 101, 153–165. [Google Scholar] [CrossRef]
  27. Zhou, Z.W.; Yang, Y.L.; Li, X.; Wang, W.Q.; Wu, Y.; Wang, C.Y.; Luo, J.L. Coagulation performance and flocs characteristics of recycling pre-sonicated condensate sludge for low-turbidity surface water treatment. Sep. Purif. Technol. 2014, 123, 1–8. [Google Scholar] [CrossRef]
  28. Wang, Z.B.; Nan, J.; Yao, M.; Yang, Y.M.; Zhang, P.Y. Insight into the combined coagulation-ultrafiltration process: The role of Al species of polyaluminum chlorides. Rsc Adv. 2017, 6, 48745–48752. [Google Scholar] [CrossRef]
  29. Servais, P.; Anzil, A.; Ventresque, C. Simple method for determination of biodegradable dissolved organic carbon in water. Appl. Environ. Microb. 1989, 55, 2732–2734. [Google Scholar] [CrossRef] [Green Version]
  30. Bu, F.; Gao, B.Y.; Li, R.H.; Sun, S.L.; Yue, Q.Y. Impacts of epichlorohydrin-dimethylamine on coagulation performance and membrane fouling in coagulation/ultrafiltration combined process with different Al-based coagulants. Chemosphere 2016, 159, 228–234. [Google Scholar] [CrossRef]
  31. Ma, B.W.; Wang, X.; Hu, C.Z.; Jefferson, W.A.; Liu, H.J.; Qu, J.H. Antifouling by pre-deposited Al hydrolytic flocs on ultrafiltration membrane in the presence of humic acid and bovine serum albumin. J. Member. Sci. 2017, 538, 34–40. [Google Scholar] [CrossRef]
  32. Sun, S.L.; Gao, B.Y.; Yue, Q.Y.; Li, R.H.; Song, W.; Bu, F.; Zhao, S.; Jia, R.B.; Song, W.C. Comparison of epichlorohydrin-dimethylamine with other cationic organic polymers as coagulation aids of polyferric chloride in coagulation-ultrafiltration process. J. Hazard. Mater. 2016, 307, 108–118. [Google Scholar] [CrossRef] [PubMed]
  33. Li, L.; Wang, Z.M.; Rietveld, L.C.; Gao, N.Y.; Hu, J.Y.; Yin, D.Q.; Yu, S.L. Comparison of the effects of extracellular and intracellular organic matter extracted from Microcystis aeruginosa on ultrafiltration membrane fouling: Dynamics and mechanisms. Environ. Sci. Technol. 2014, 48, 14549–14557. [Google Scholar] [CrossRef]
  34. Tian, J.Y.; Chen, Z.L.; Yang, Y.L.; Liang, H.; Nan, J.; Wang, Z.Z.; Li, G.B. Hybrid process of BAC and sMBR for treating polluted raw water. Bioresour. Technol. 2009, 100, 6243–6249. [Google Scholar] [CrossRef]
  35. Ayech, A.; Josende, M.E.; Ventura-Lima, J.; Ruas, C.; Gelesky, M.A.; Ale, A.; Cazenave, J.; Galdoporpora, J.M.; Desimone, M.F.; Duarte, M.; et al. Toxicity evaluation of nanocrystalline silver-impregnated coated dressing on the life cycle of worm Caenorhabditis elegans. Ecotox. Environ. Safe. 2020, 197, 110570. [Google Scholar] [CrossRef]
  36. Wang, H.S.; Feng, C.P.; Deng, Y. Effect of potassium on nitrate removal from groundwater in agricultural waste-based heterotrophic denitrification system. Sci. Total Environ. 2020, 703, 134830. [Google Scholar] [CrossRef] [PubMed]
  37. Wu, S.Q.; Gao, L.; Gu, J.Y.; Zhou, W.L.; Fan, C.Z.; He, S.B.; Huang, J.C.; Zhang, X.; Cheng, Y.F.; Wu, Z.W.; et al. Enhancement of nitrogen removal via addition of cattail litter in surface flow constructed wetland. J. Clean. Prod. 2018, 204, 205–211. [Google Scholar] [CrossRef]
  38. Shen, X.; Gao, B.Y.; Guo, K.Y.; Yue, Q.Y. Characterization and influence of floc under different coagulation system on ultrafiltration membrane fouling. Chemosphere 2020, 238, 124659. [Google Scholar] [CrossRef] [PubMed]
  39. Wang, W.Y.; Yue, Q.Y.; Li, R.H.; Song, W.; Gao, B.Y.; Shen, X. Investigating coagulation behavior of chitosan with different Al species dual-coagulants in dye wastewater treatment. J. Taiwan Inst. Chem. Eng. 2017, 78, 423–430. [Google Scholar] [CrossRef]
  40. Du, H.W.; Yang, Z.; Tian, Z.Q.; Huang, M.L.; Yang, W.B.; Zhang, L.M.; Li, A.M. Enhanced removal of trace antibiotics from turbid water in the coexistence of natural organic matters using phenylalanine-modified-chitosan flocculants: Effect of flocculants’ molecular architectures. Chem. Eng. J. 2018, 333, 310–319. [Google Scholar] [CrossRef]
  41. Ma, B.W.; Li, W.J.; Liu, R.P.; Liu, G.; Sun, J.Q.; Liu, H.J.; Qu, J.H.; van der Meer, W. Multiple dynamic Al-based floc layers on ultrafiltration membrane surfaces for humic acid and reservoir water fouling reduction. Water Res. 2018, 139, 291–300. [Google Scholar] [CrossRef] [PubMed]
  42. Wang, S.; Xu, J.P.; Chen, H.F.; Yin, X.H.; Wang, N. Structural Characteristics of Humic-like Acid from Microbial Transformation of Lignin Participated by Metal (hydro) Oxides. Chin. J. Anal. Chem. 2019, 47, 1809–1815. [Google Scholar]
Figure 1. Schematic flow diagram of the coagulation/GDM system. Note: GDM = gravity-driven membrane.
Water 12 01990 g001
Figure 2. (a) Flux decline and (b) fouling resistance distributions in three systems. Note: AS = aluminum sulfate; CS = chitosan.
Water 12 01990 g002
Figure 3. Concentration of DOC in three systems: the GDM, AS/GDM and AS-CS/GDM systems.
Water 12 01990 g003
Figure 4. Dissolved organic carbon (DOC) removal efficiency of different molecular weights (MWs) of different permeate waters at the 27th day of the experiment.
Water 12 01990 g004
Figure 5. Excitation-emission matrix (EEM) characterization of each step at the 27th day of the experiment: (a) raw water without pretreatment, (b) after GDM, (c) after AS coagulation treatment, (d) after AS/GDM, (e) after AS-CS coagulation treatment, and (f) after AS-CS/GDM.
Water 12 01990 g005
Figure 6. Fluorescence regional integration (FRI) parameters for operationally defined EEM regions in different steps. The condition was the same as that in Figure 5.
Water 12 01990 g006
Figure 7. Concentration of free and attached biomass in different systems at three periods of the experiment.
Water 12 01990 g007
Figure 8. Floc size distribution and fractal dimension after (a) AS and (b) AS-CS coagulation treatment.
Water 12 01990 g008
Figure 9. SEM images of the cake layer from the (a) GDM, (b) AS/GDM and (c) AS-CS/GDM systems.
Water 12 01990 g009
Figure 10. The mechanism of membrane fouling mitigation in the AS-CS/GDM system.
Water 12 01990 g010
Table 1. R2 values of regression analyses of membrane fouling during the different systems by four mechanisms.
Stage SystemsCake FiltrationIntermediate Blocking Standard BlockingComplete Blocking
1GDM0.9600.9720.9610.983
AS/GDM0.9120.9230.9380.938
AS-CS/GDM0.9340.9340.9440.947
2GDM0.8920.9530.9740.992
AS/GDM0.8430.9310.9720.954
AS-CS/GDM0.8200.9160.9590.934
3GDM0.8590.9520.9980.983
AS/GDM0.8550.9420.9760.963
AS-CS/GDM0.8450.9370.9790.964
Notes: GDM = gravity-driven membrane; AS = aluminum sulfate; CS = chitosan

