Evaluating the Performance of a Lab-Scale Water Treatment Plant Using Non-Thermal Plasma Technology

 ,
,  and
and 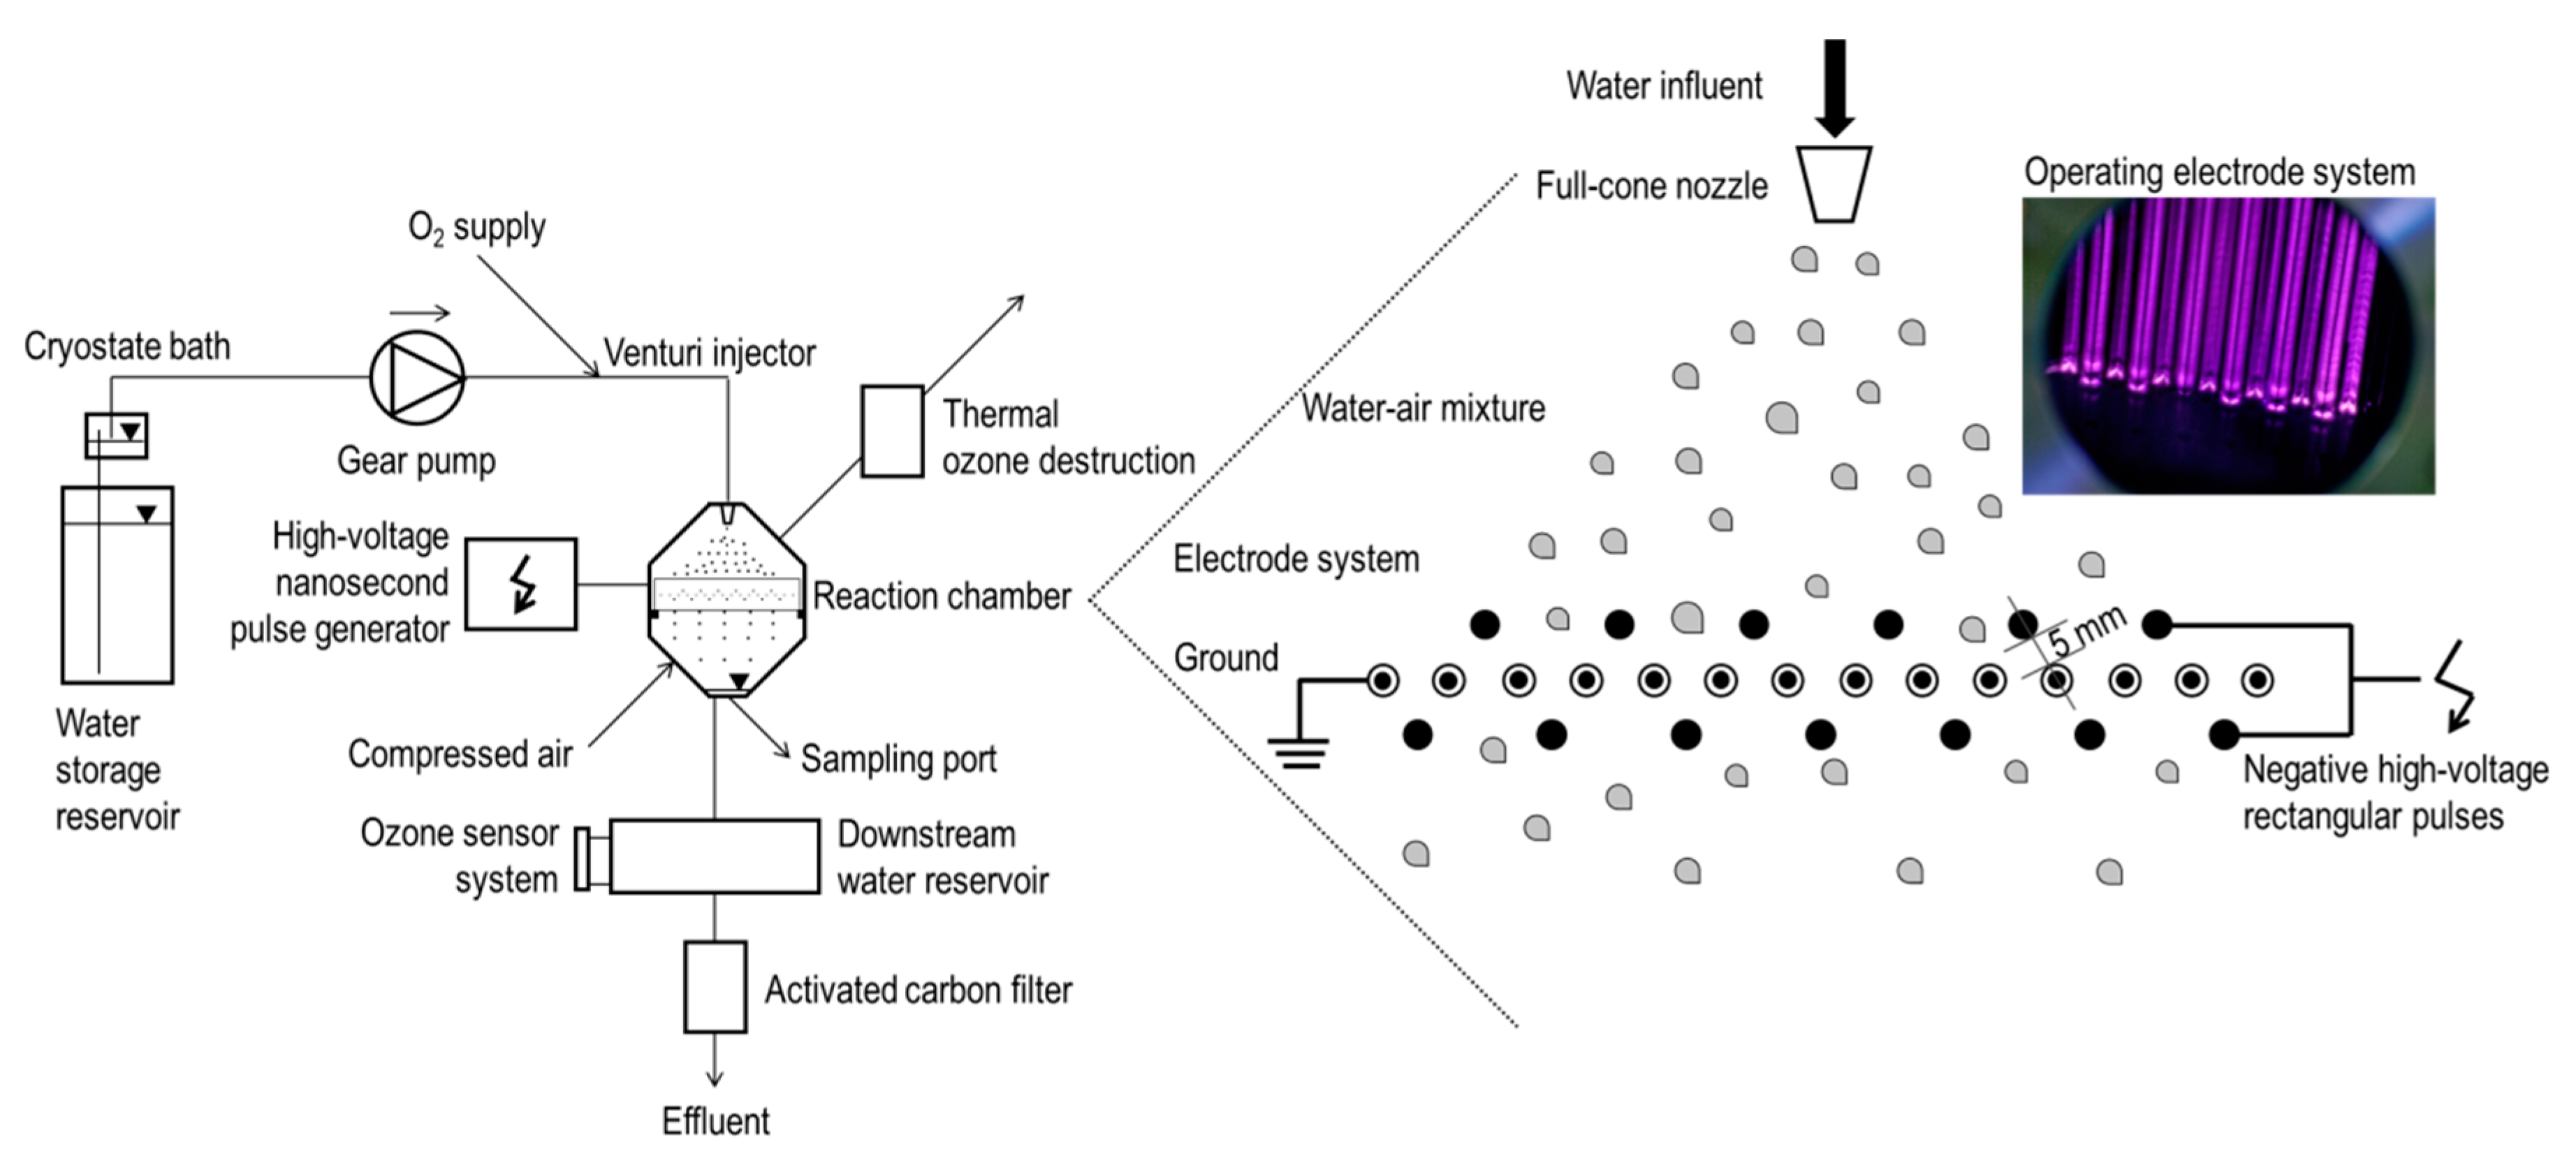
Abstract
:1. Introduction
2. Materials and Methods
2.1. Experimental Set-Up
2.2. Experimental Series
2.3. Sampling Procedure
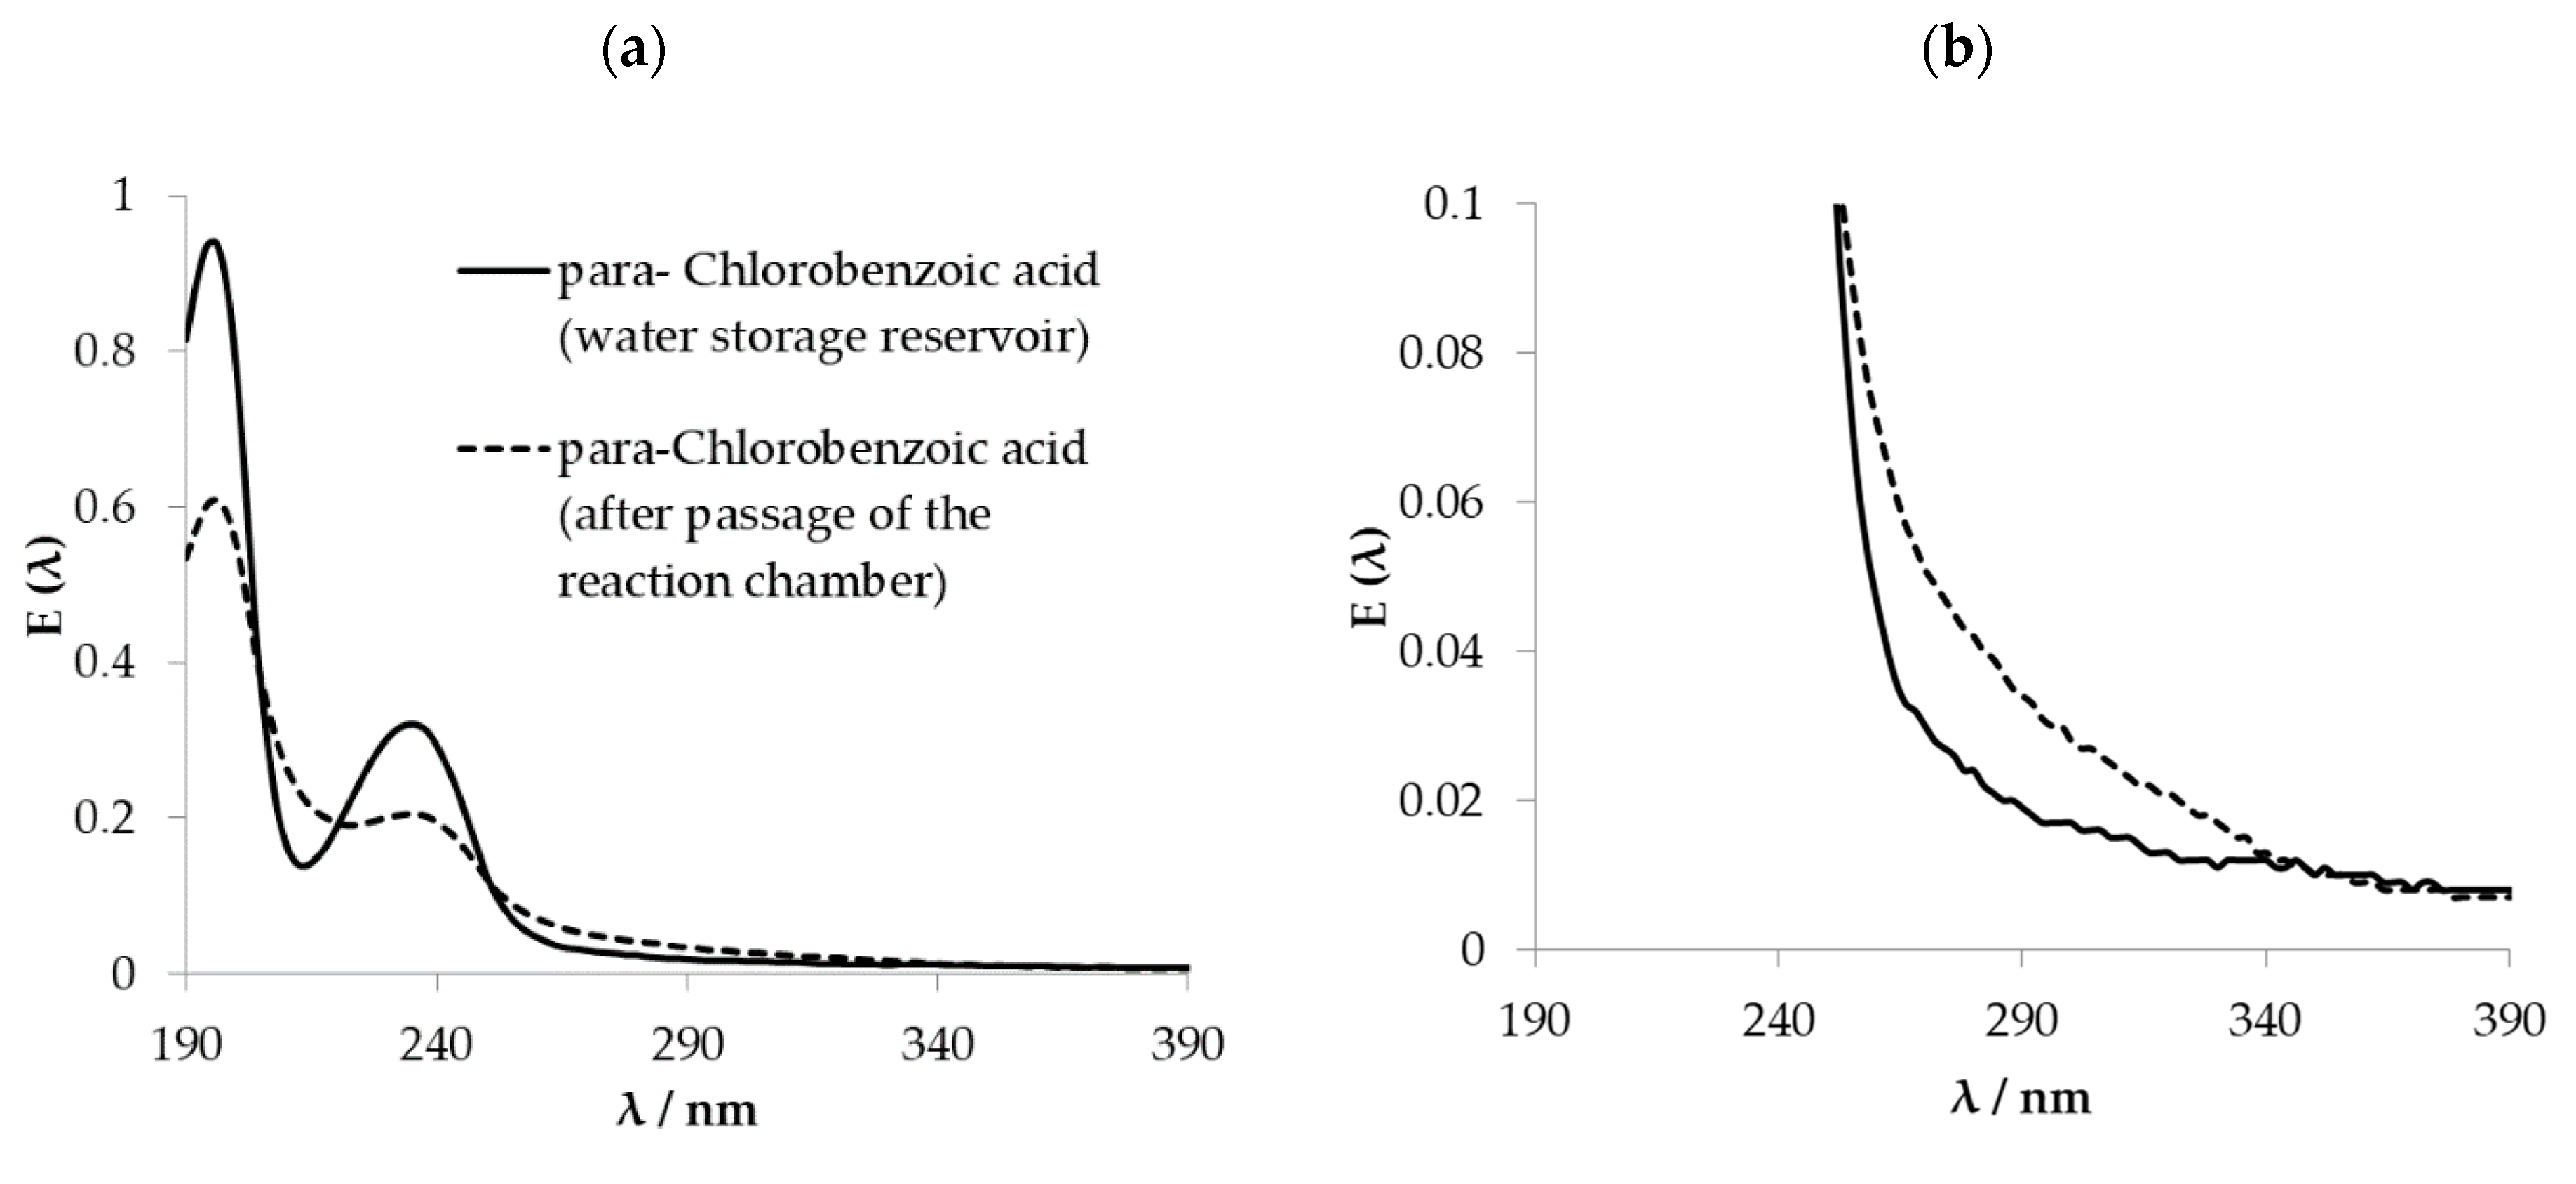
2.4. Determination of Chemical Parameters
3. Results and Discussion
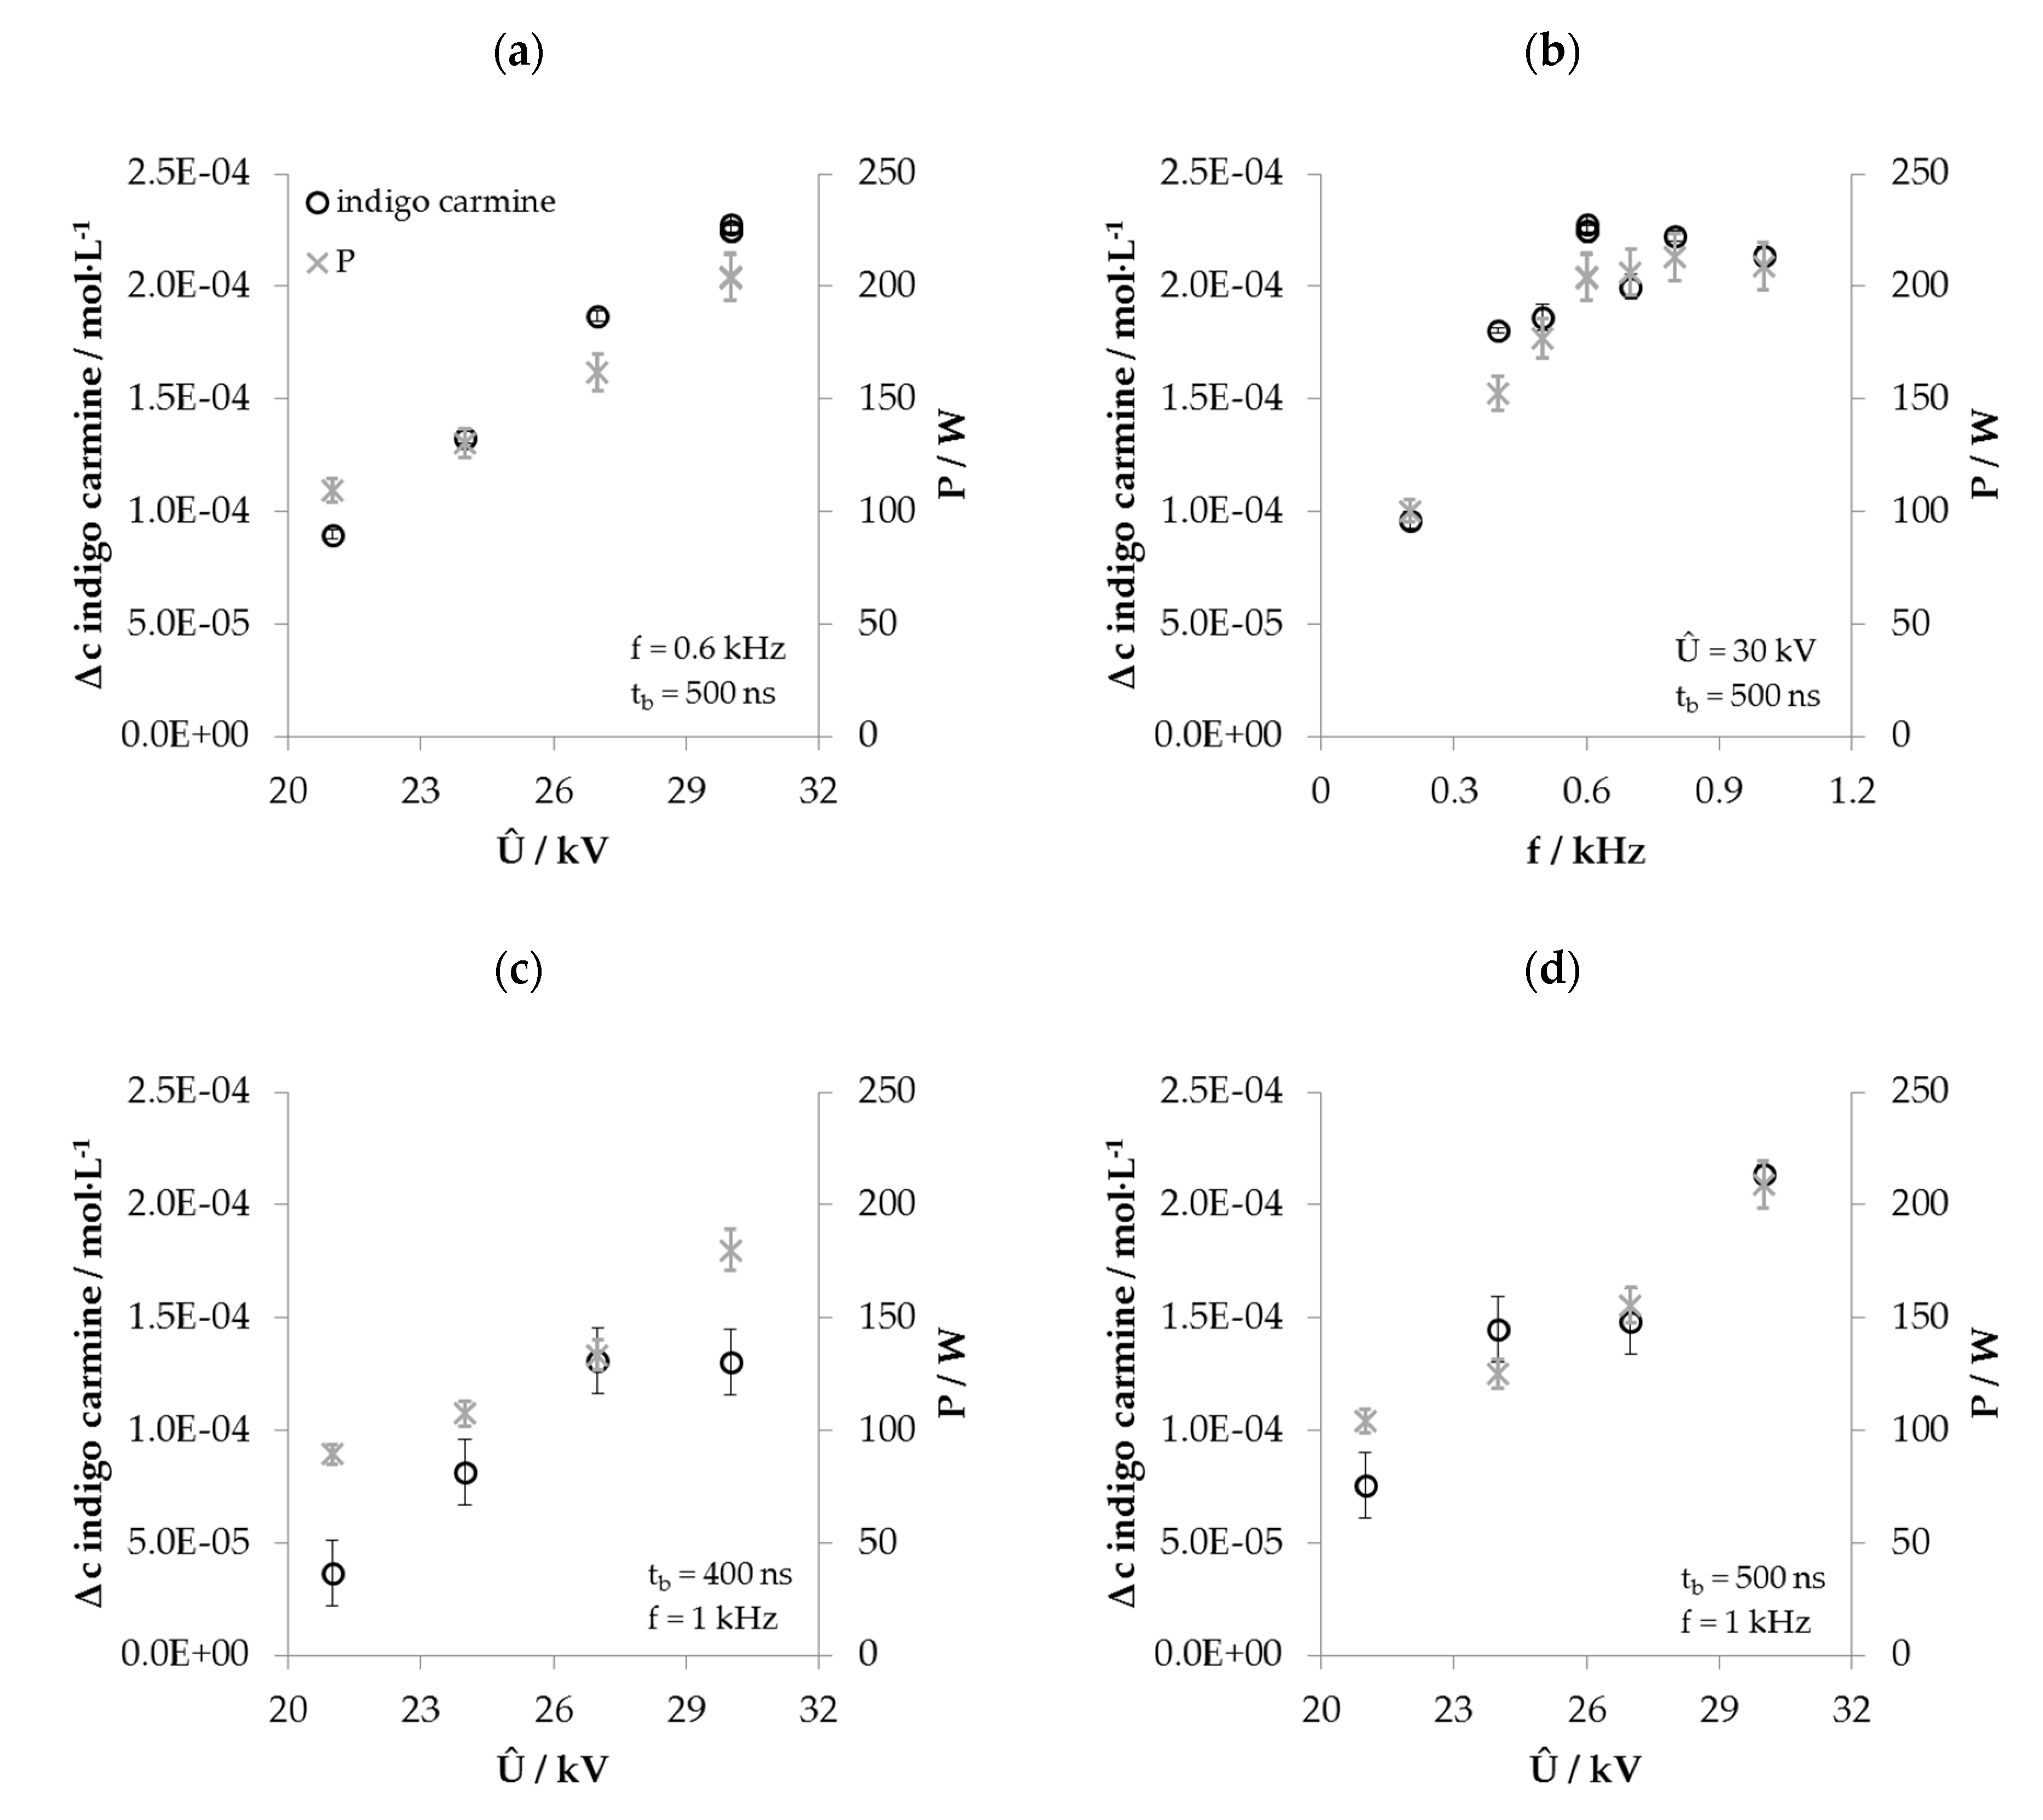
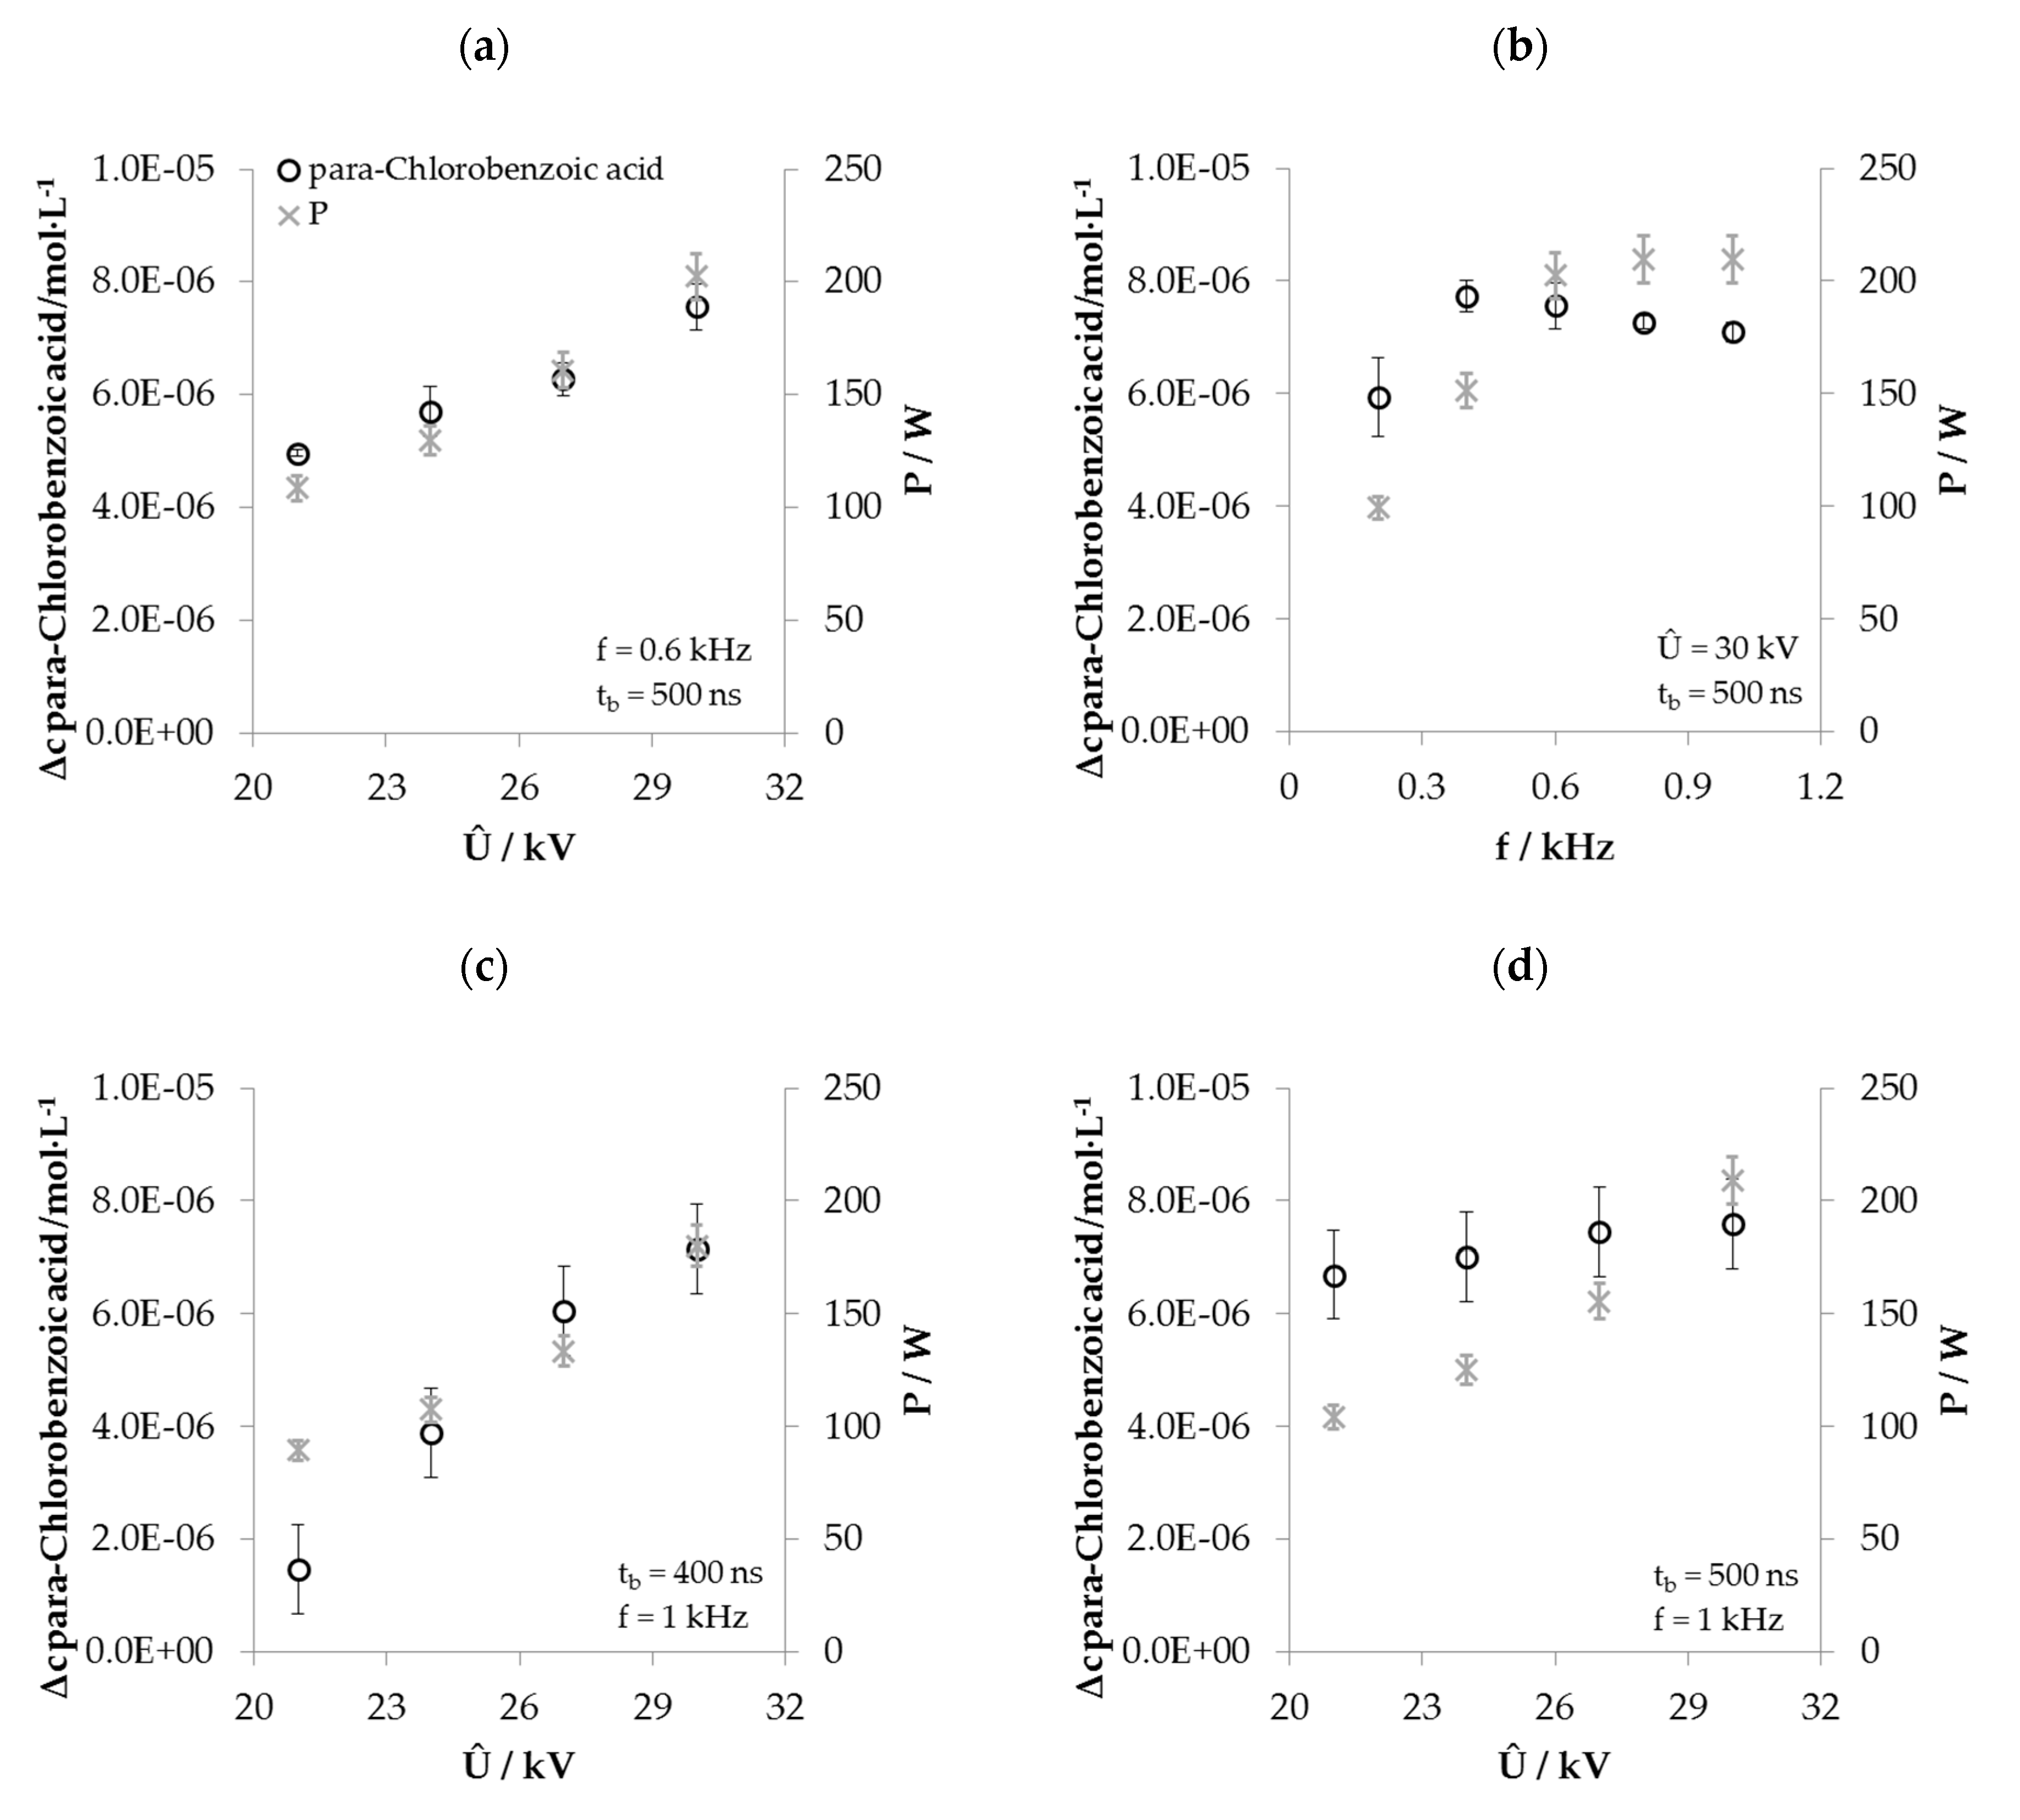
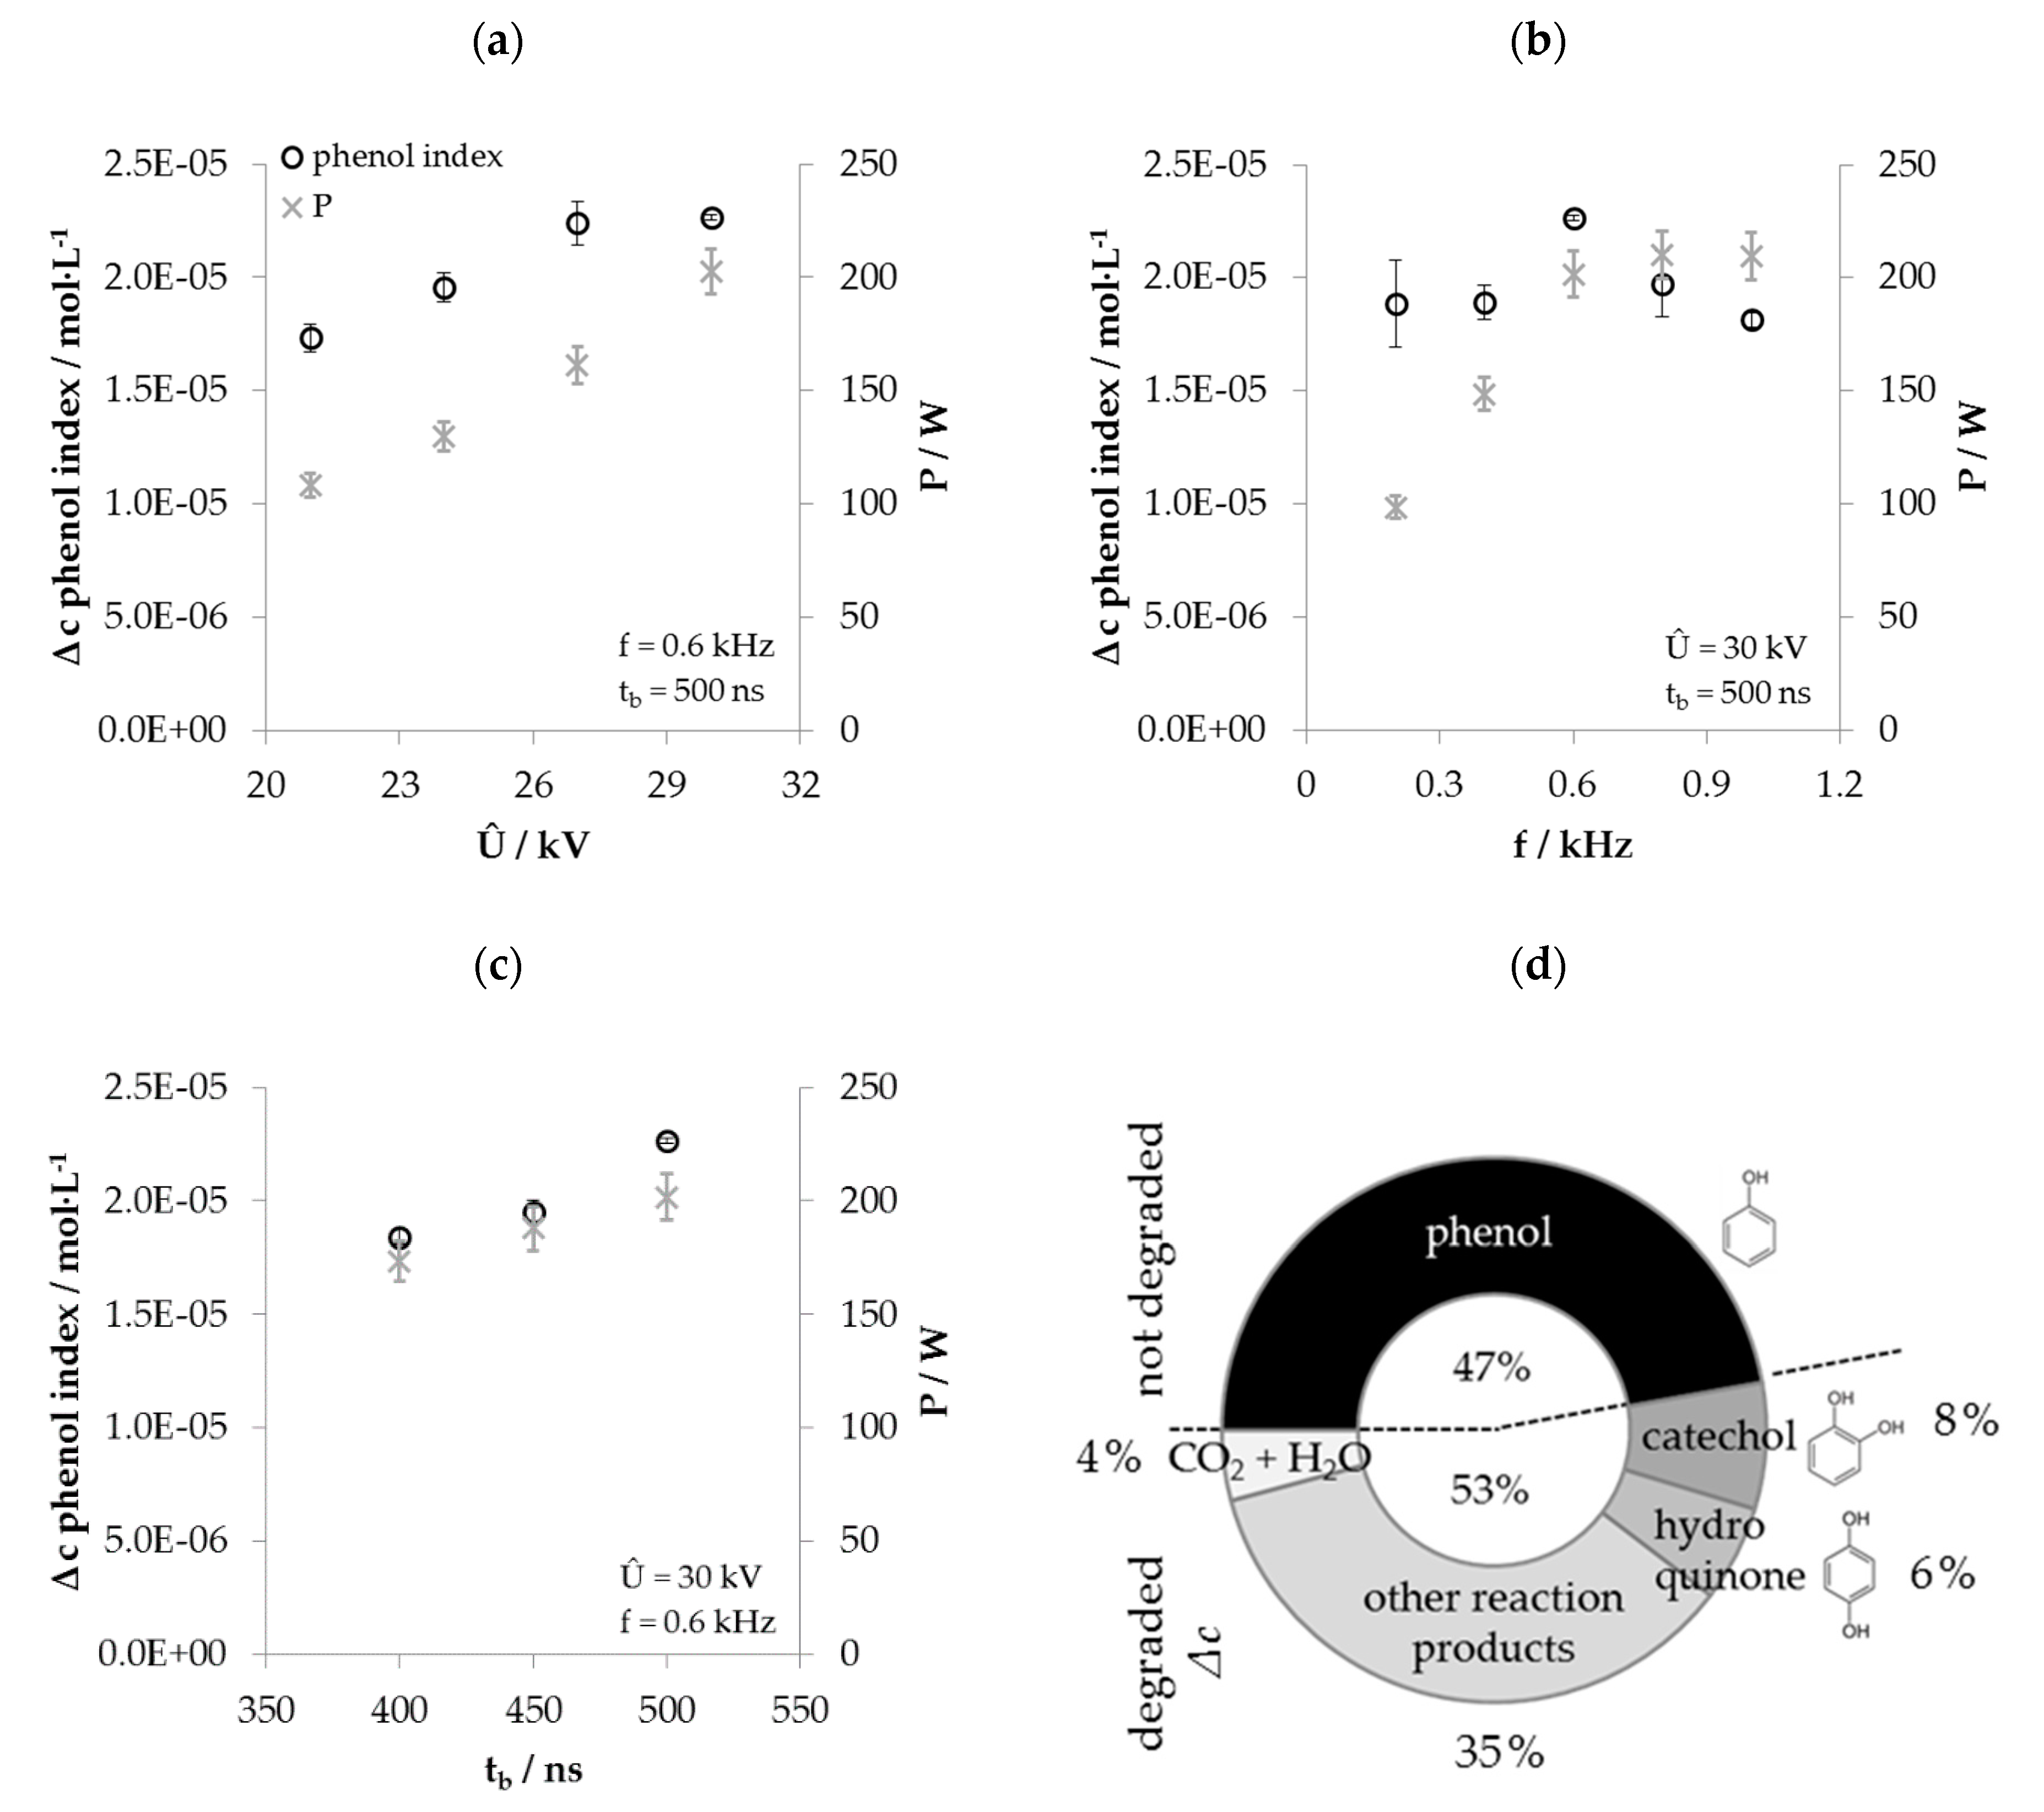
3.1. Influence of the HV Pulse Generator Settings on the Degradation of the Reference Substances and on the Power Consumption
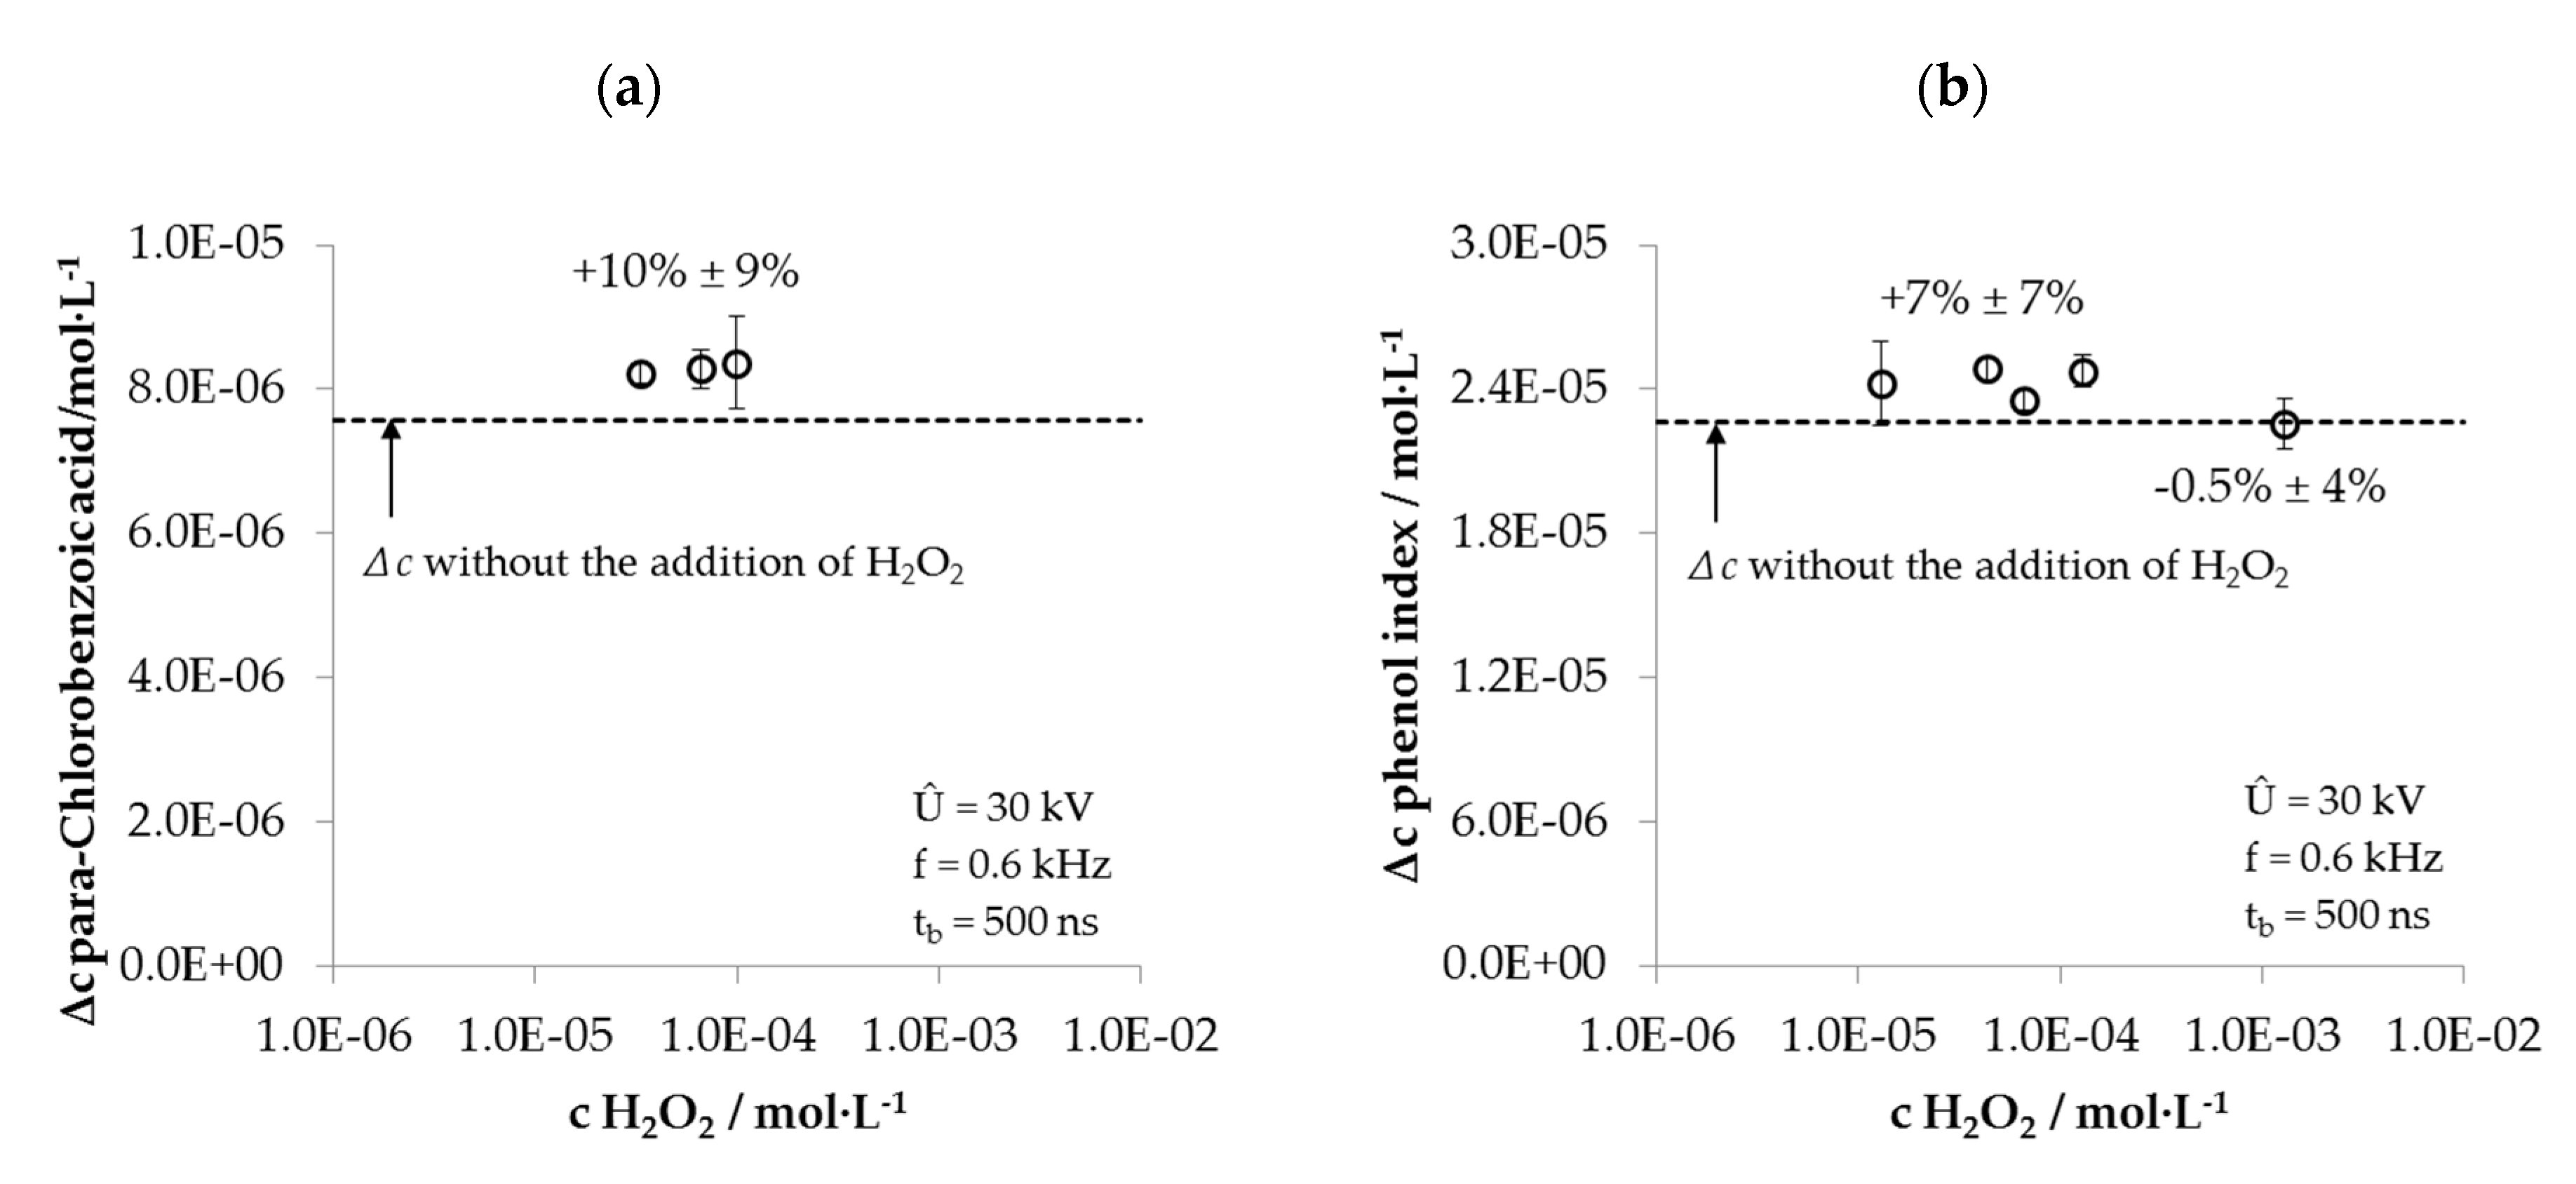
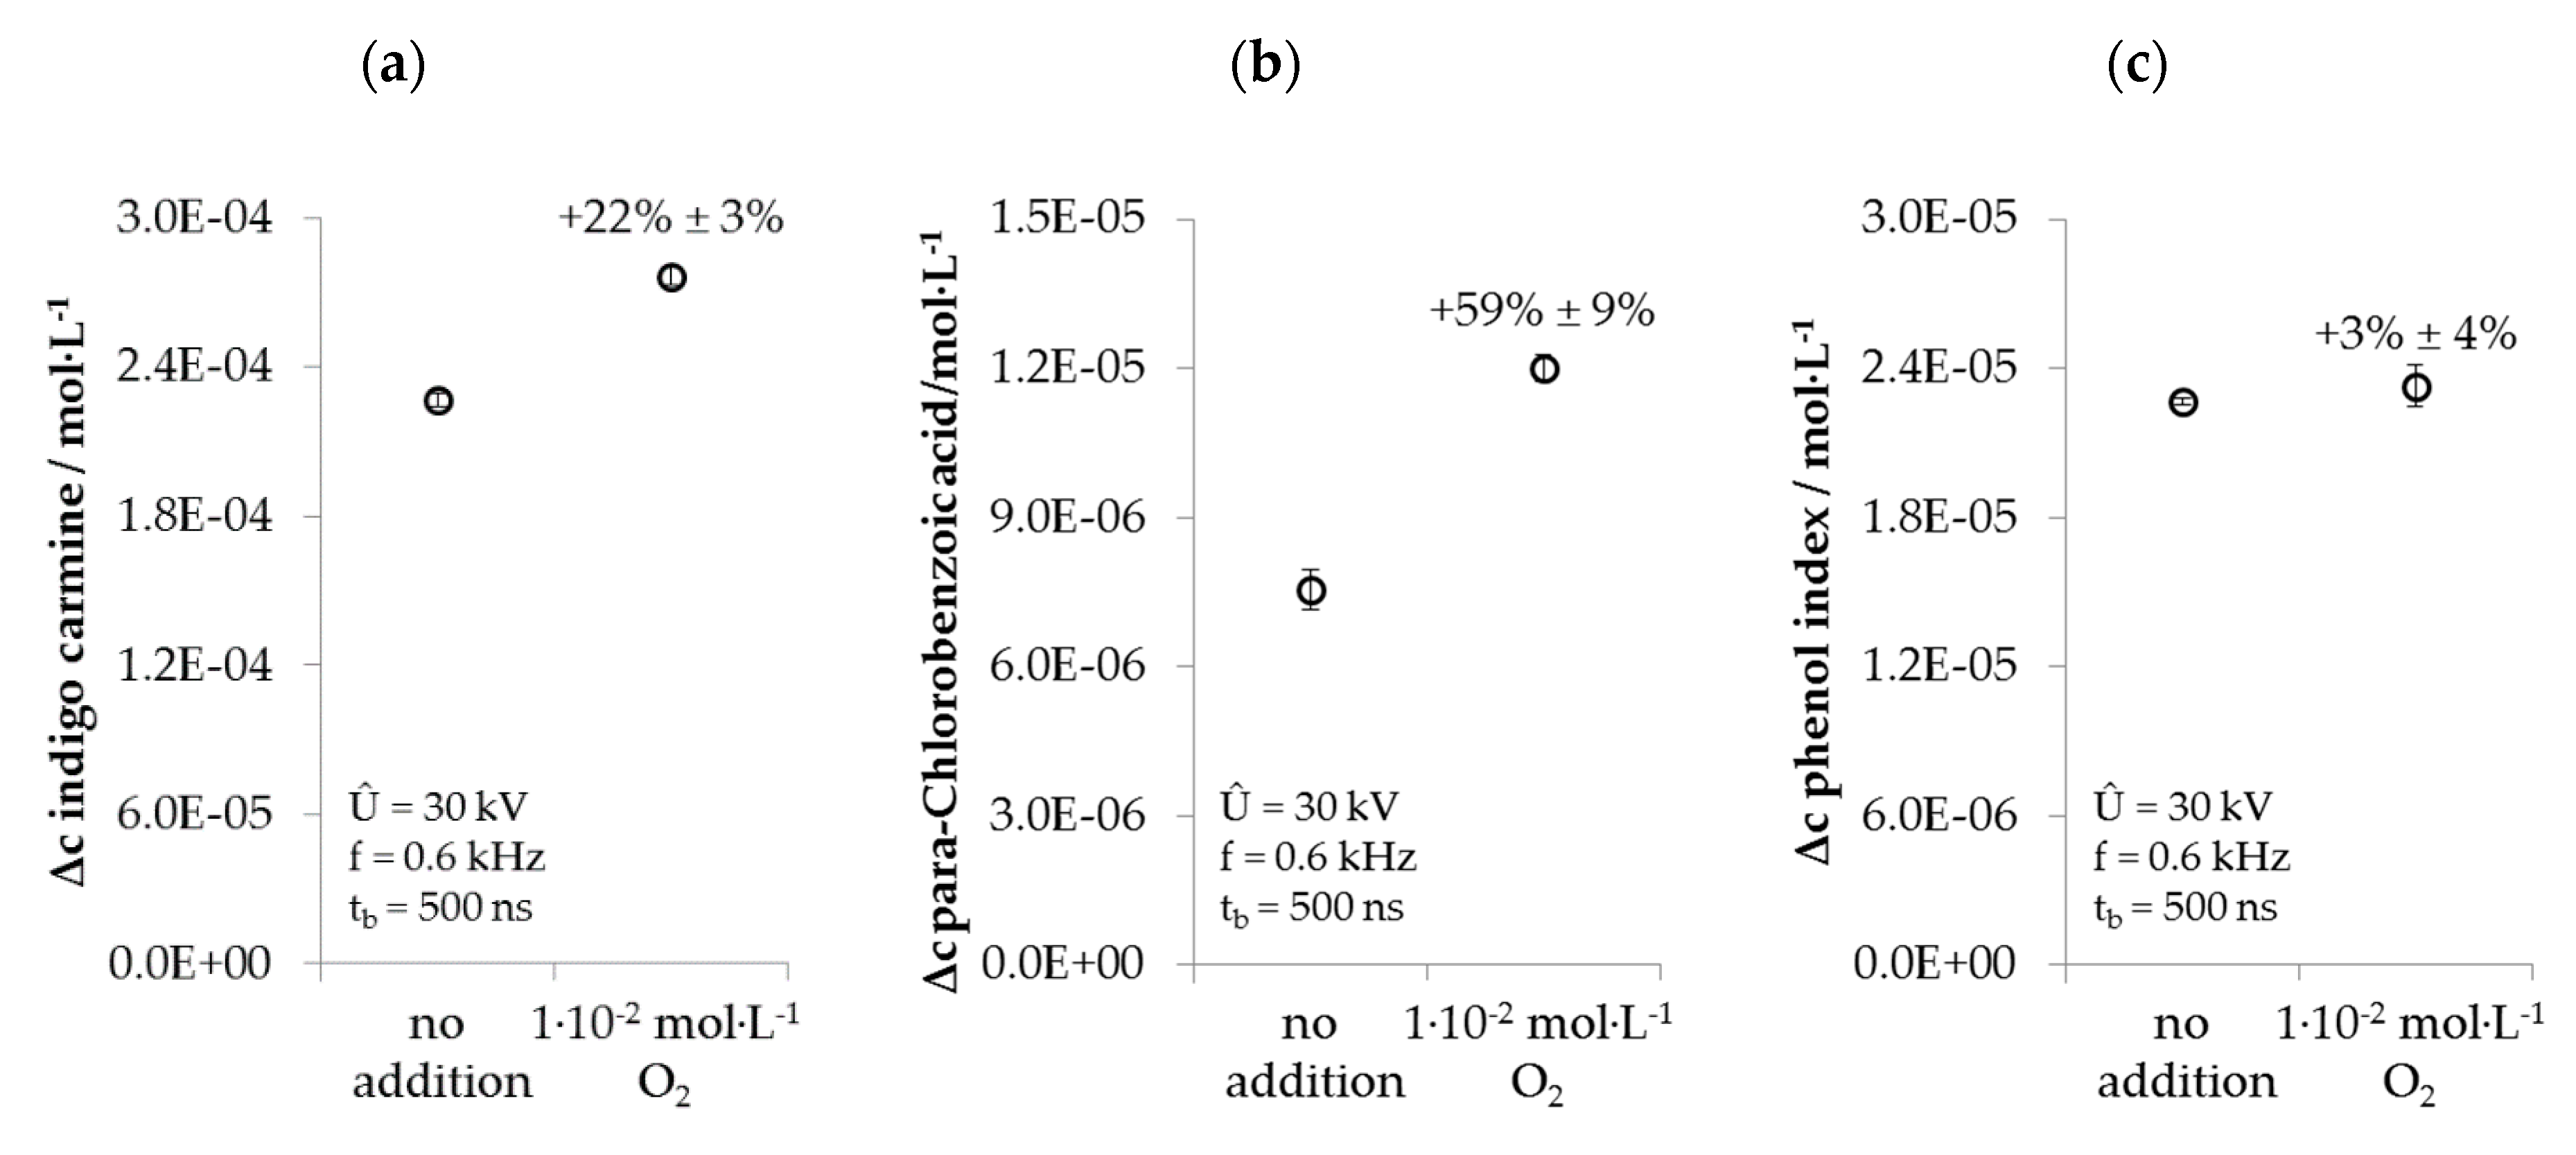
3.2. Influence of Different Oxygen-Based Additions on the Degradation of the Reference Substances
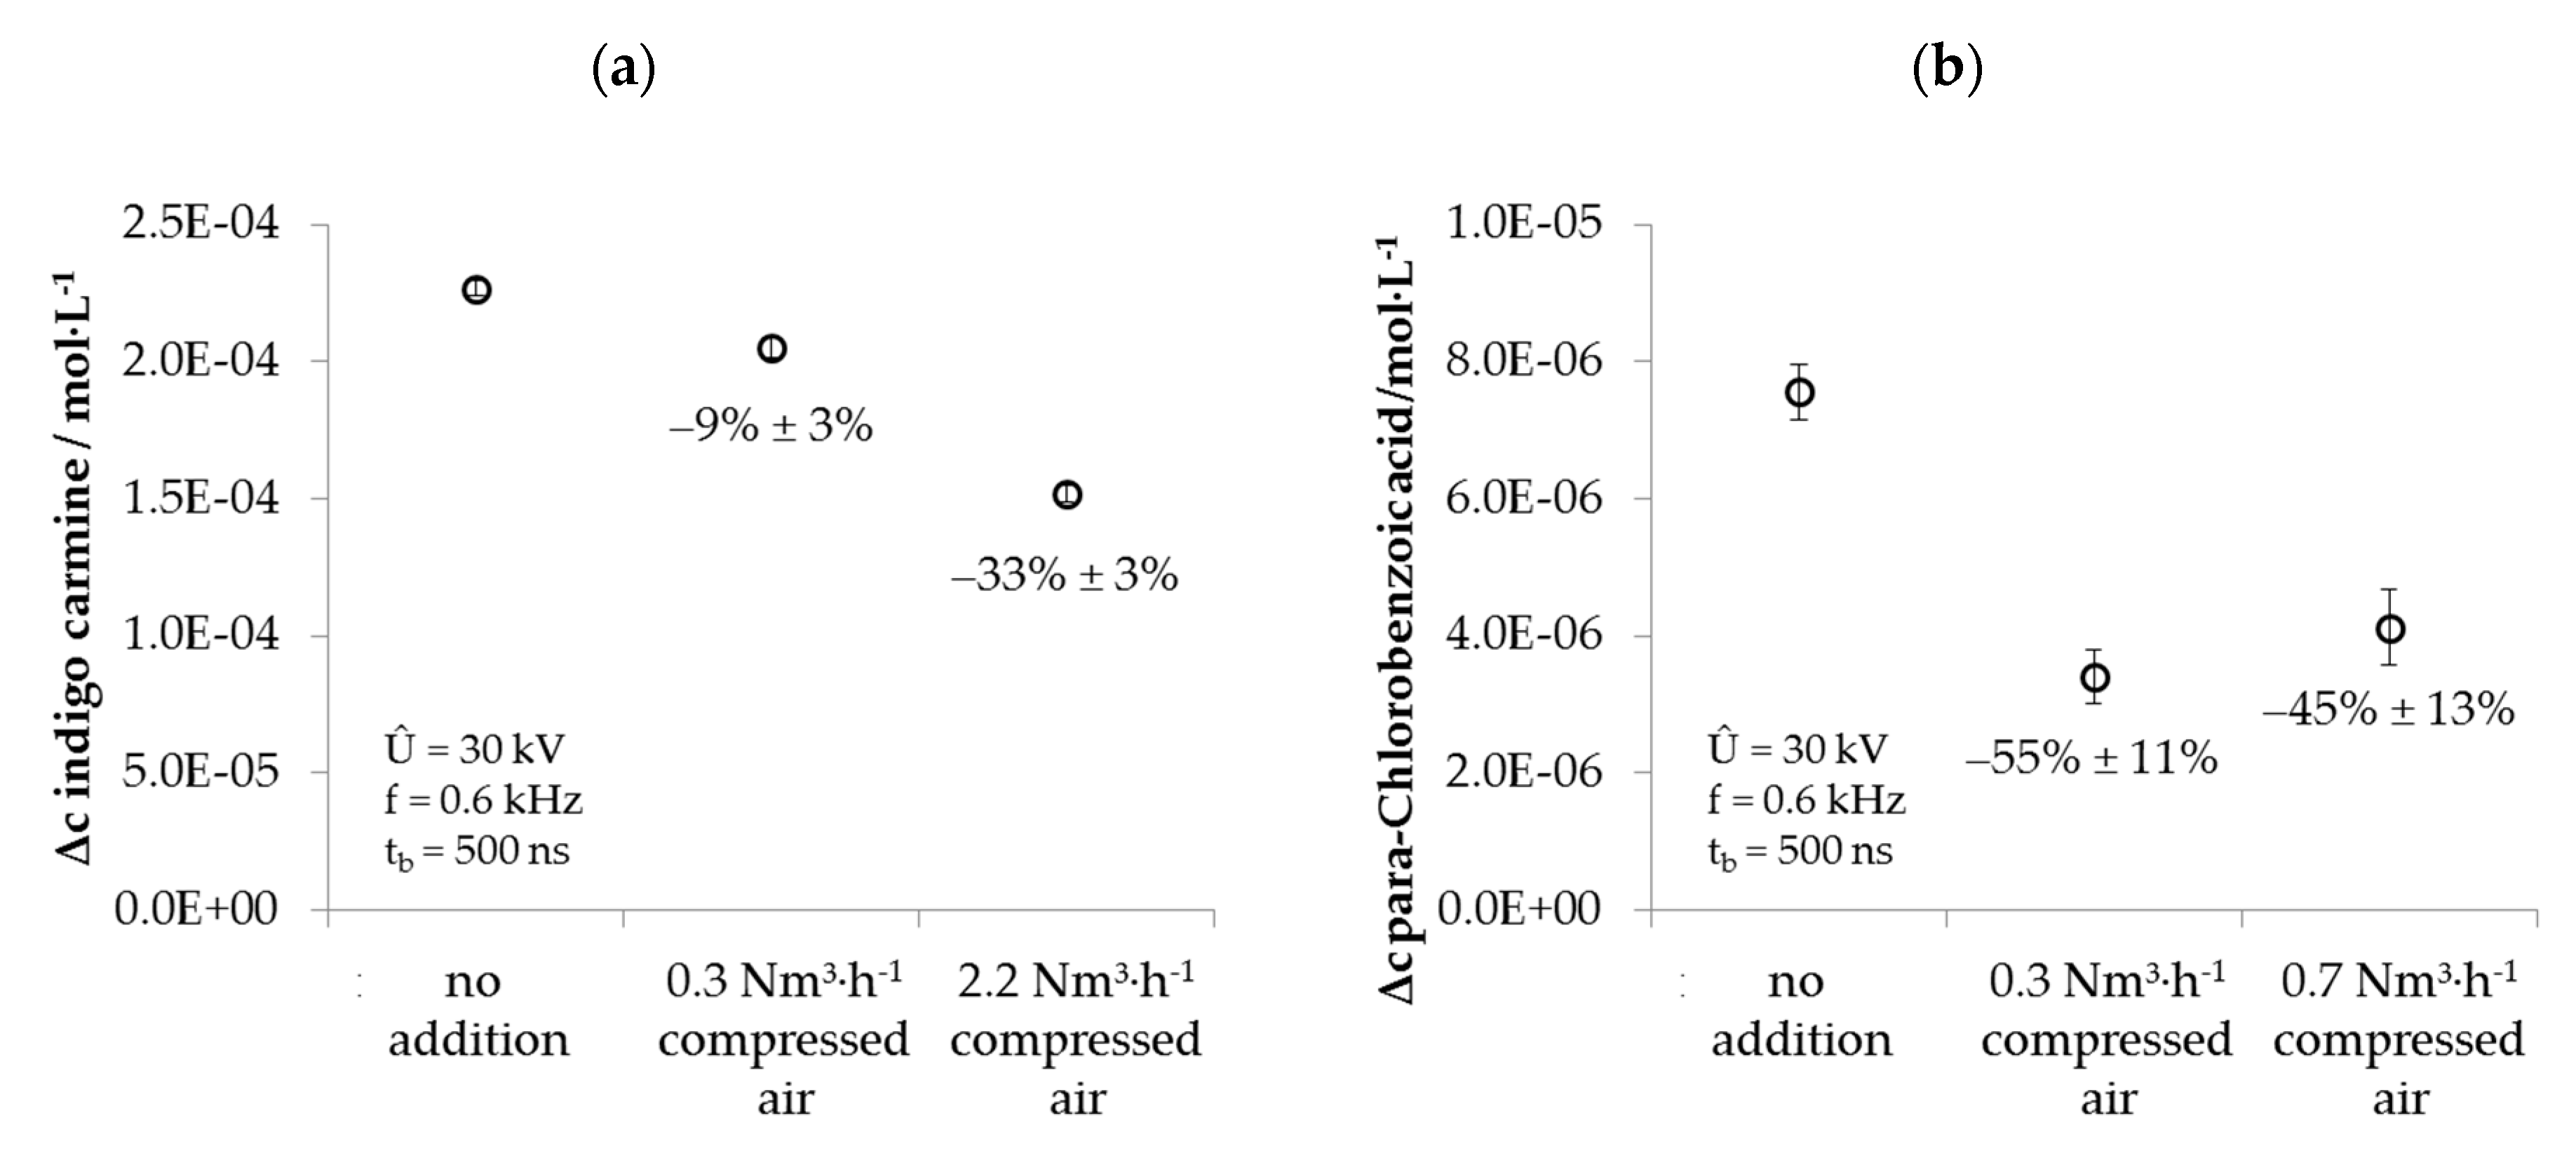
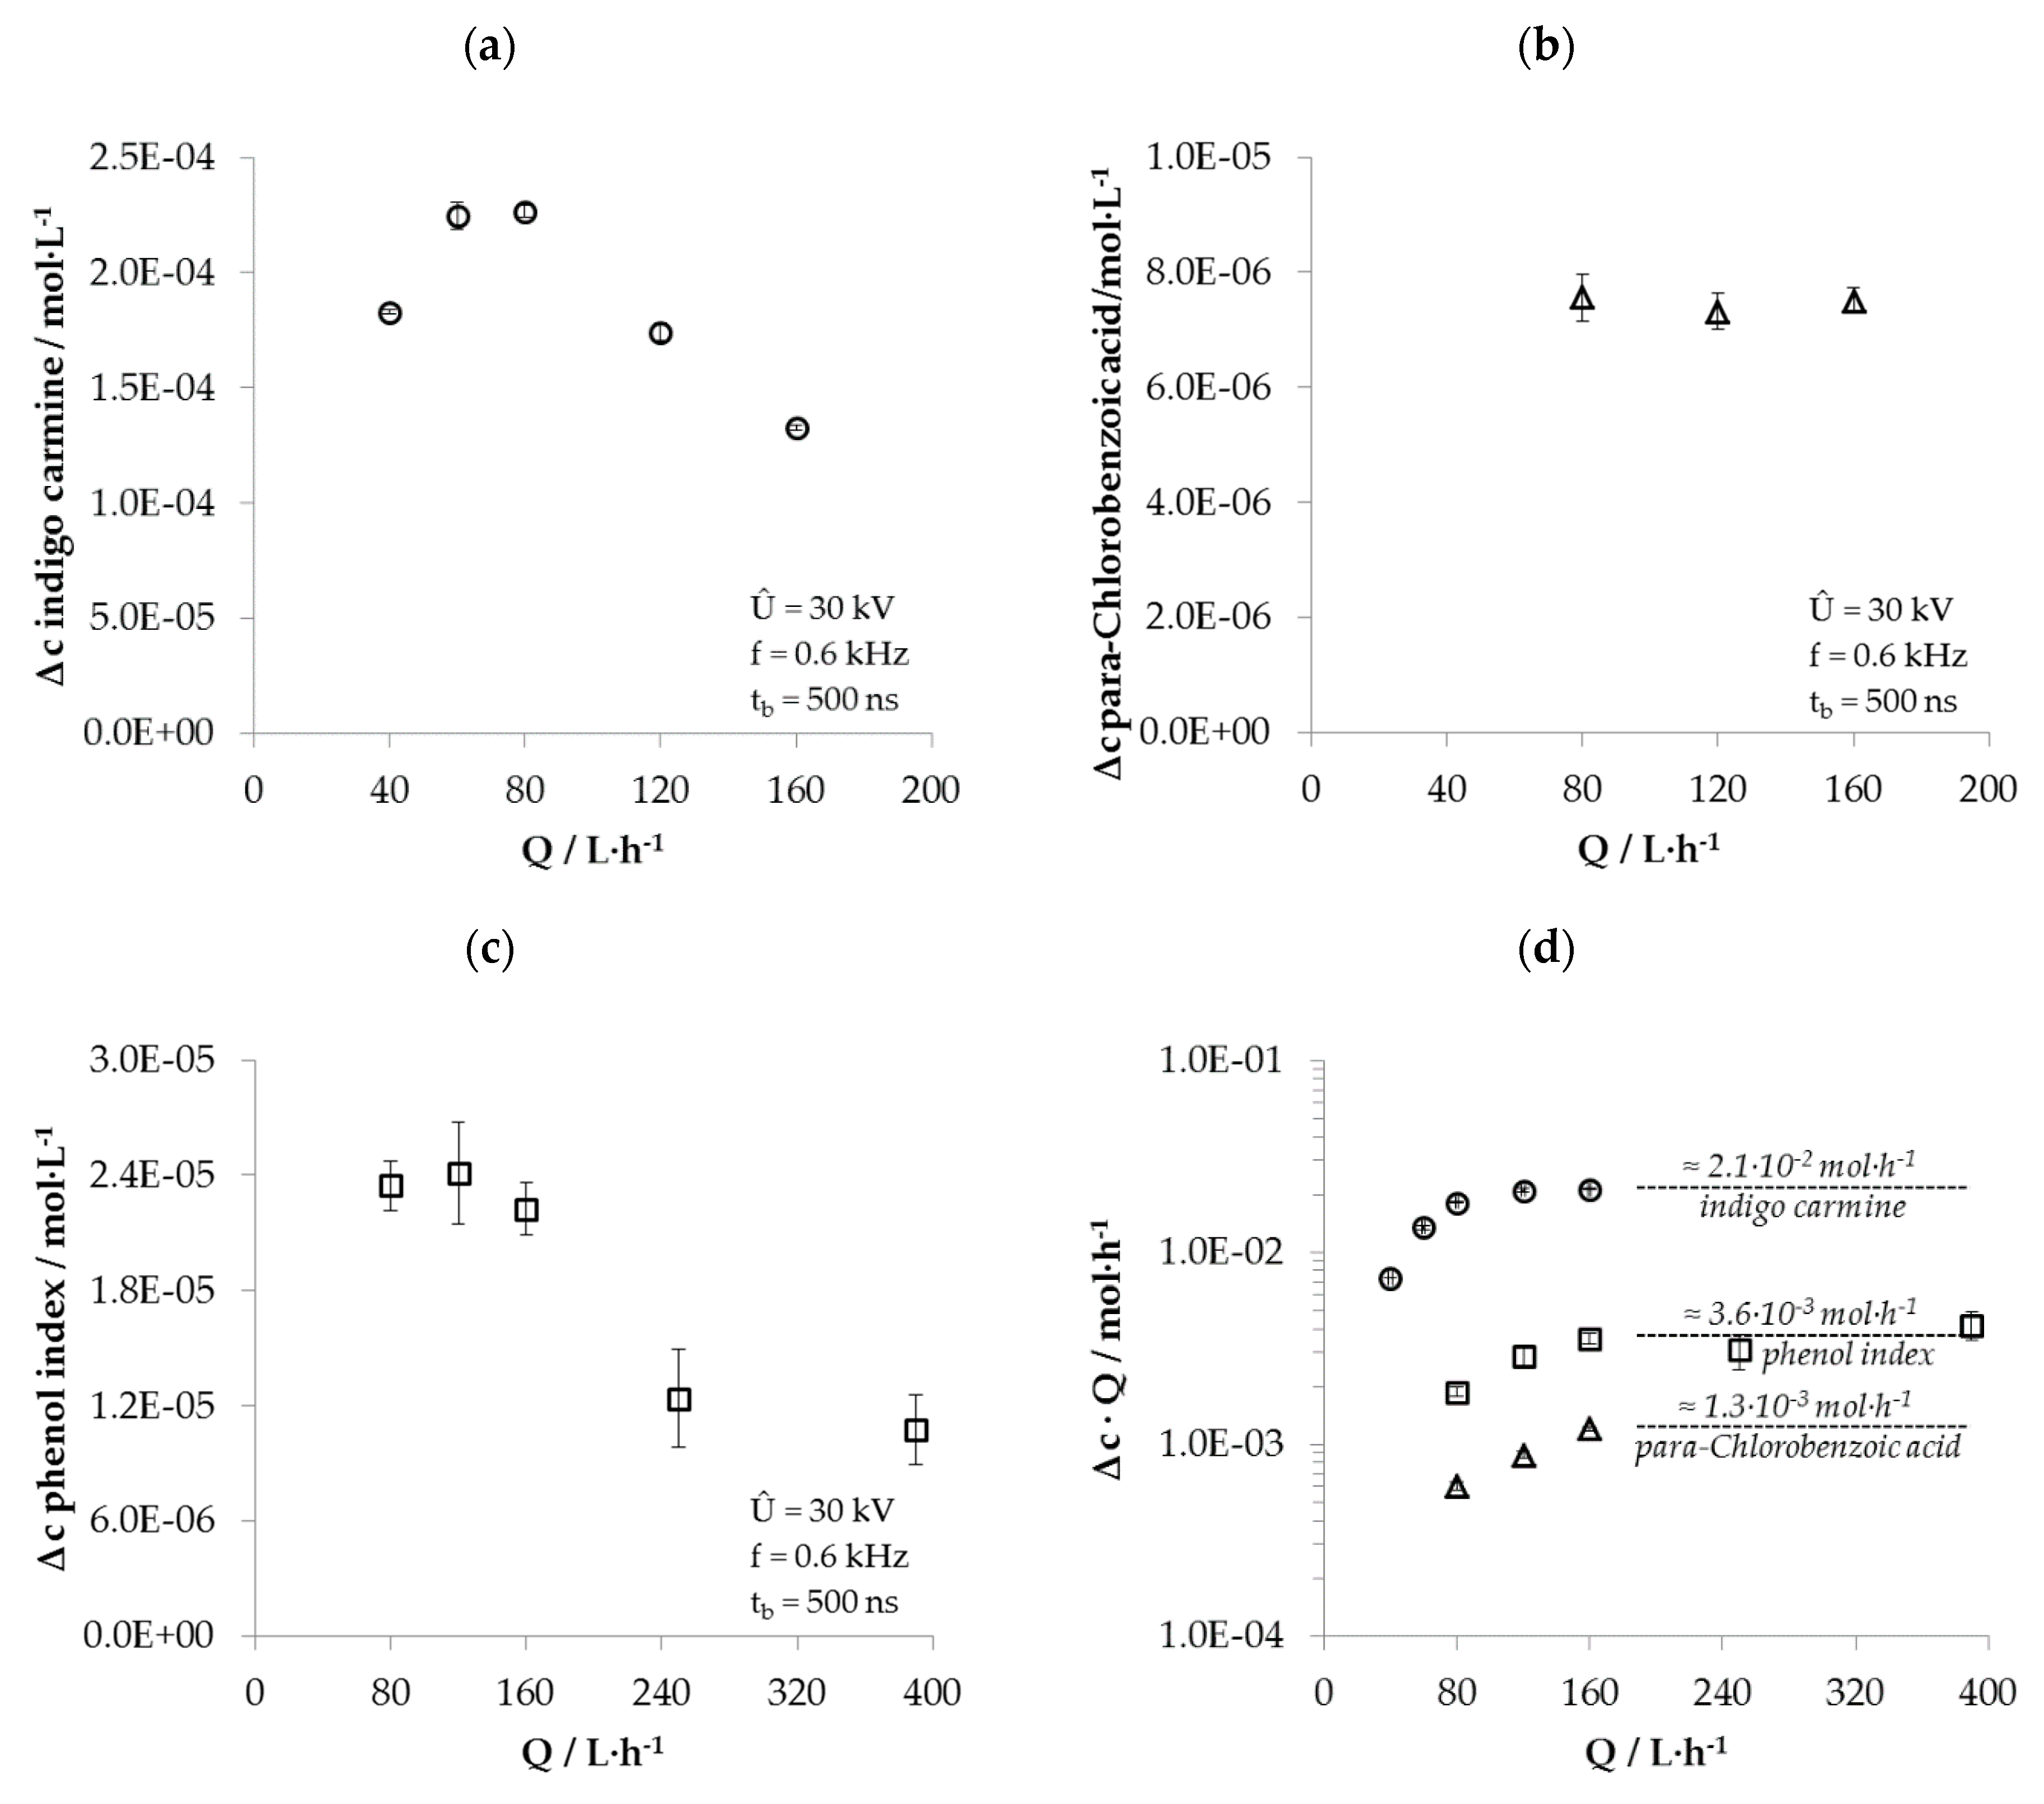
3.3. Degradation of Indigo Carmine, Para-Chlorobenzoic Acid, and Phenol Depending on Volume Flow Rate
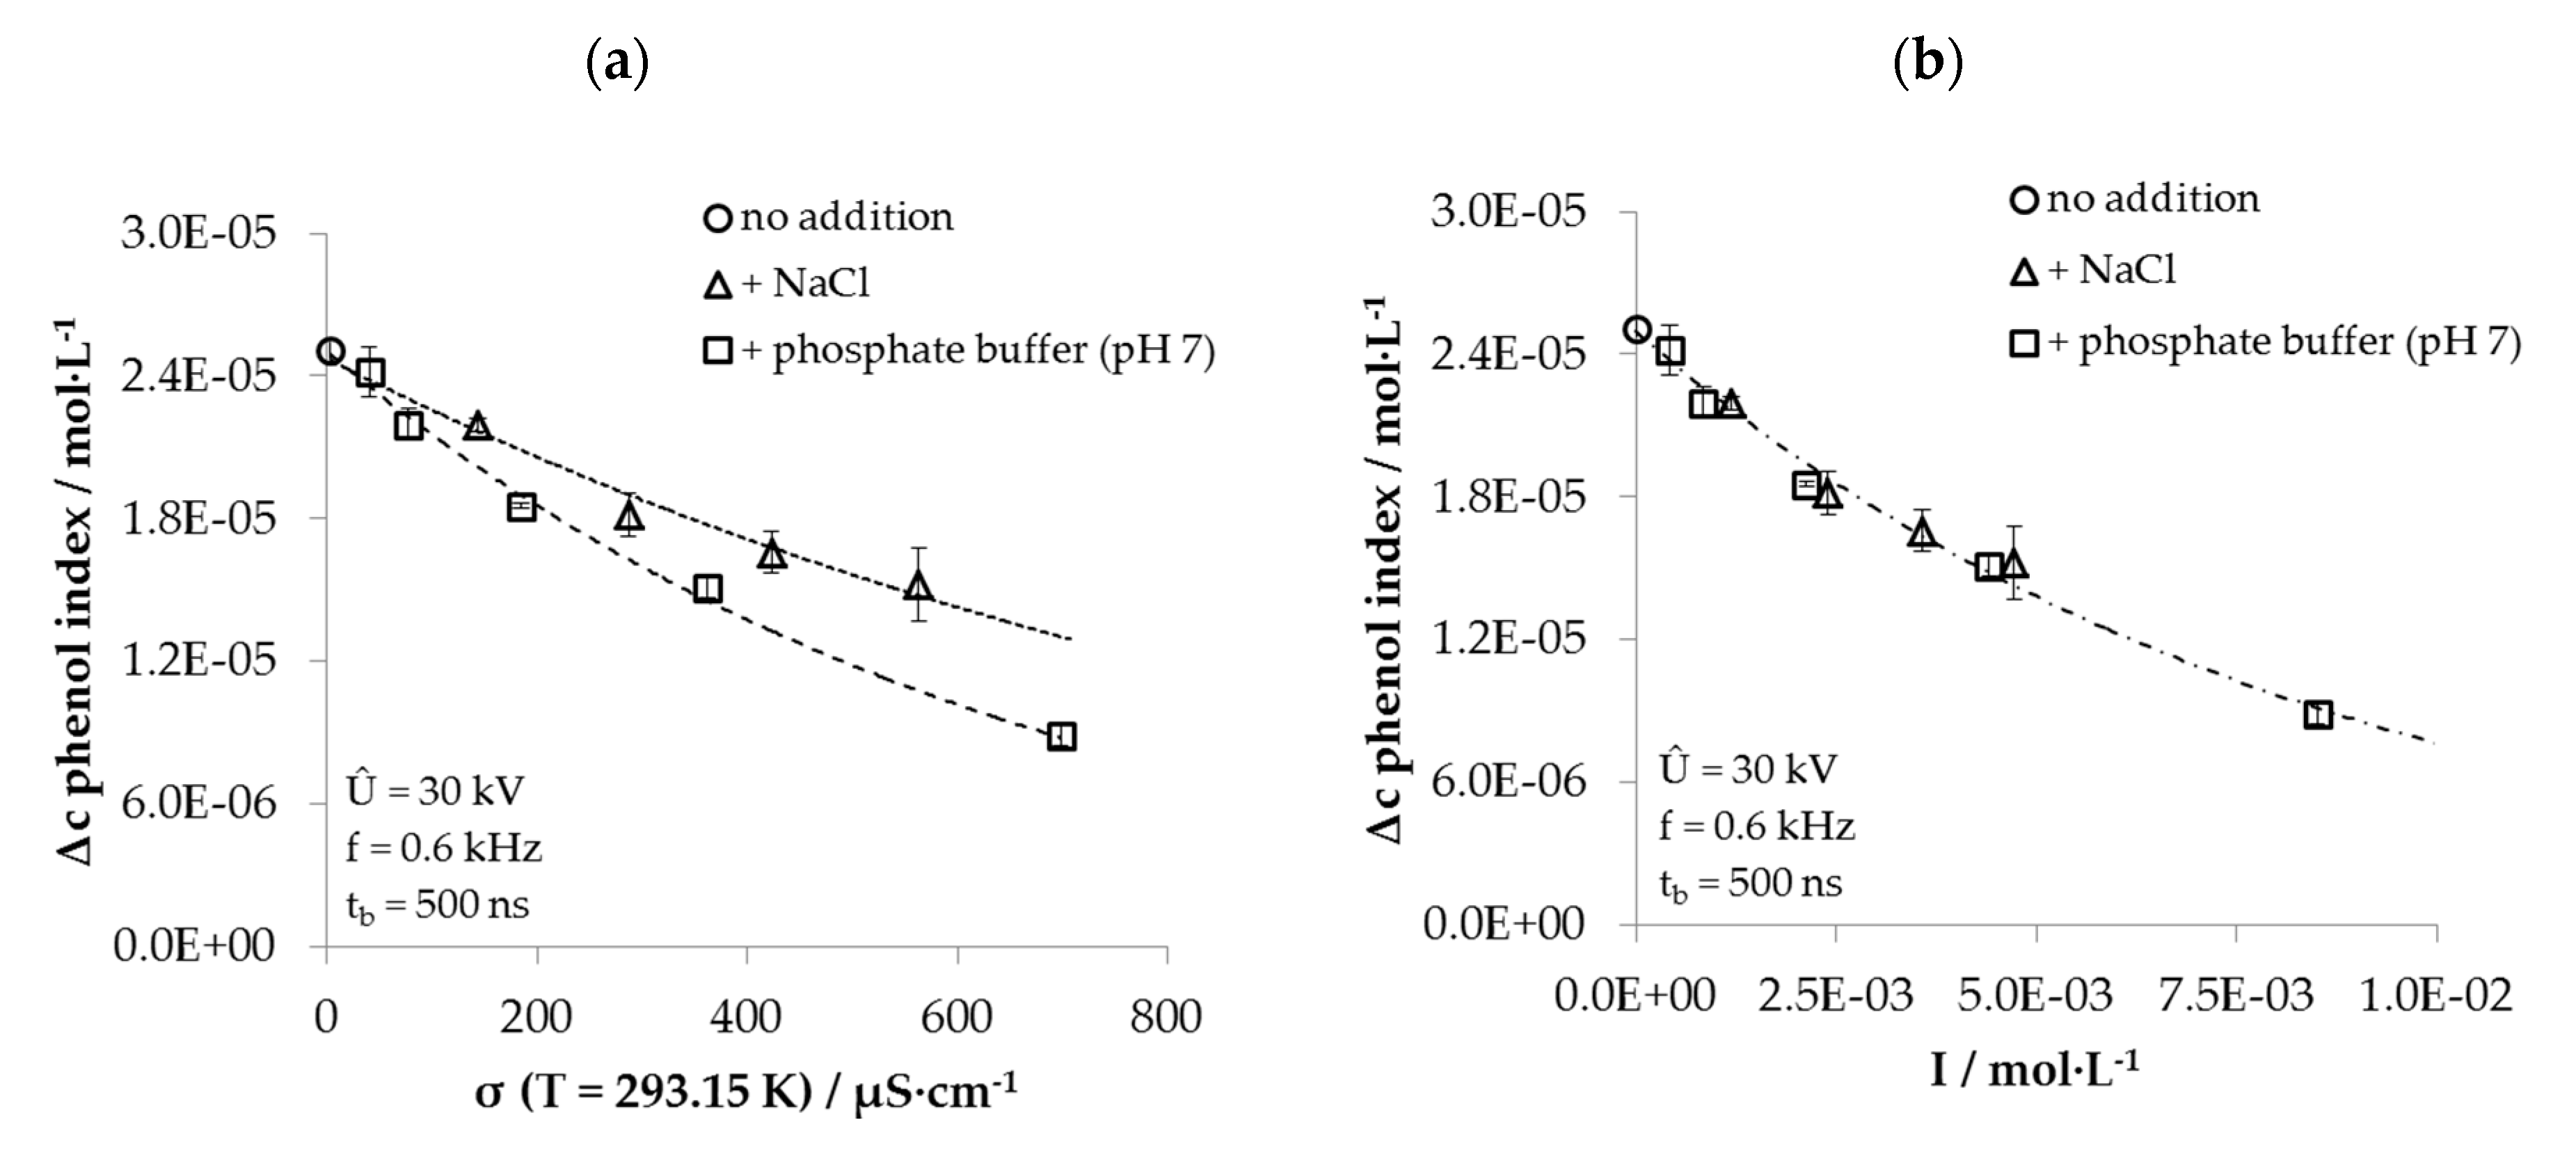
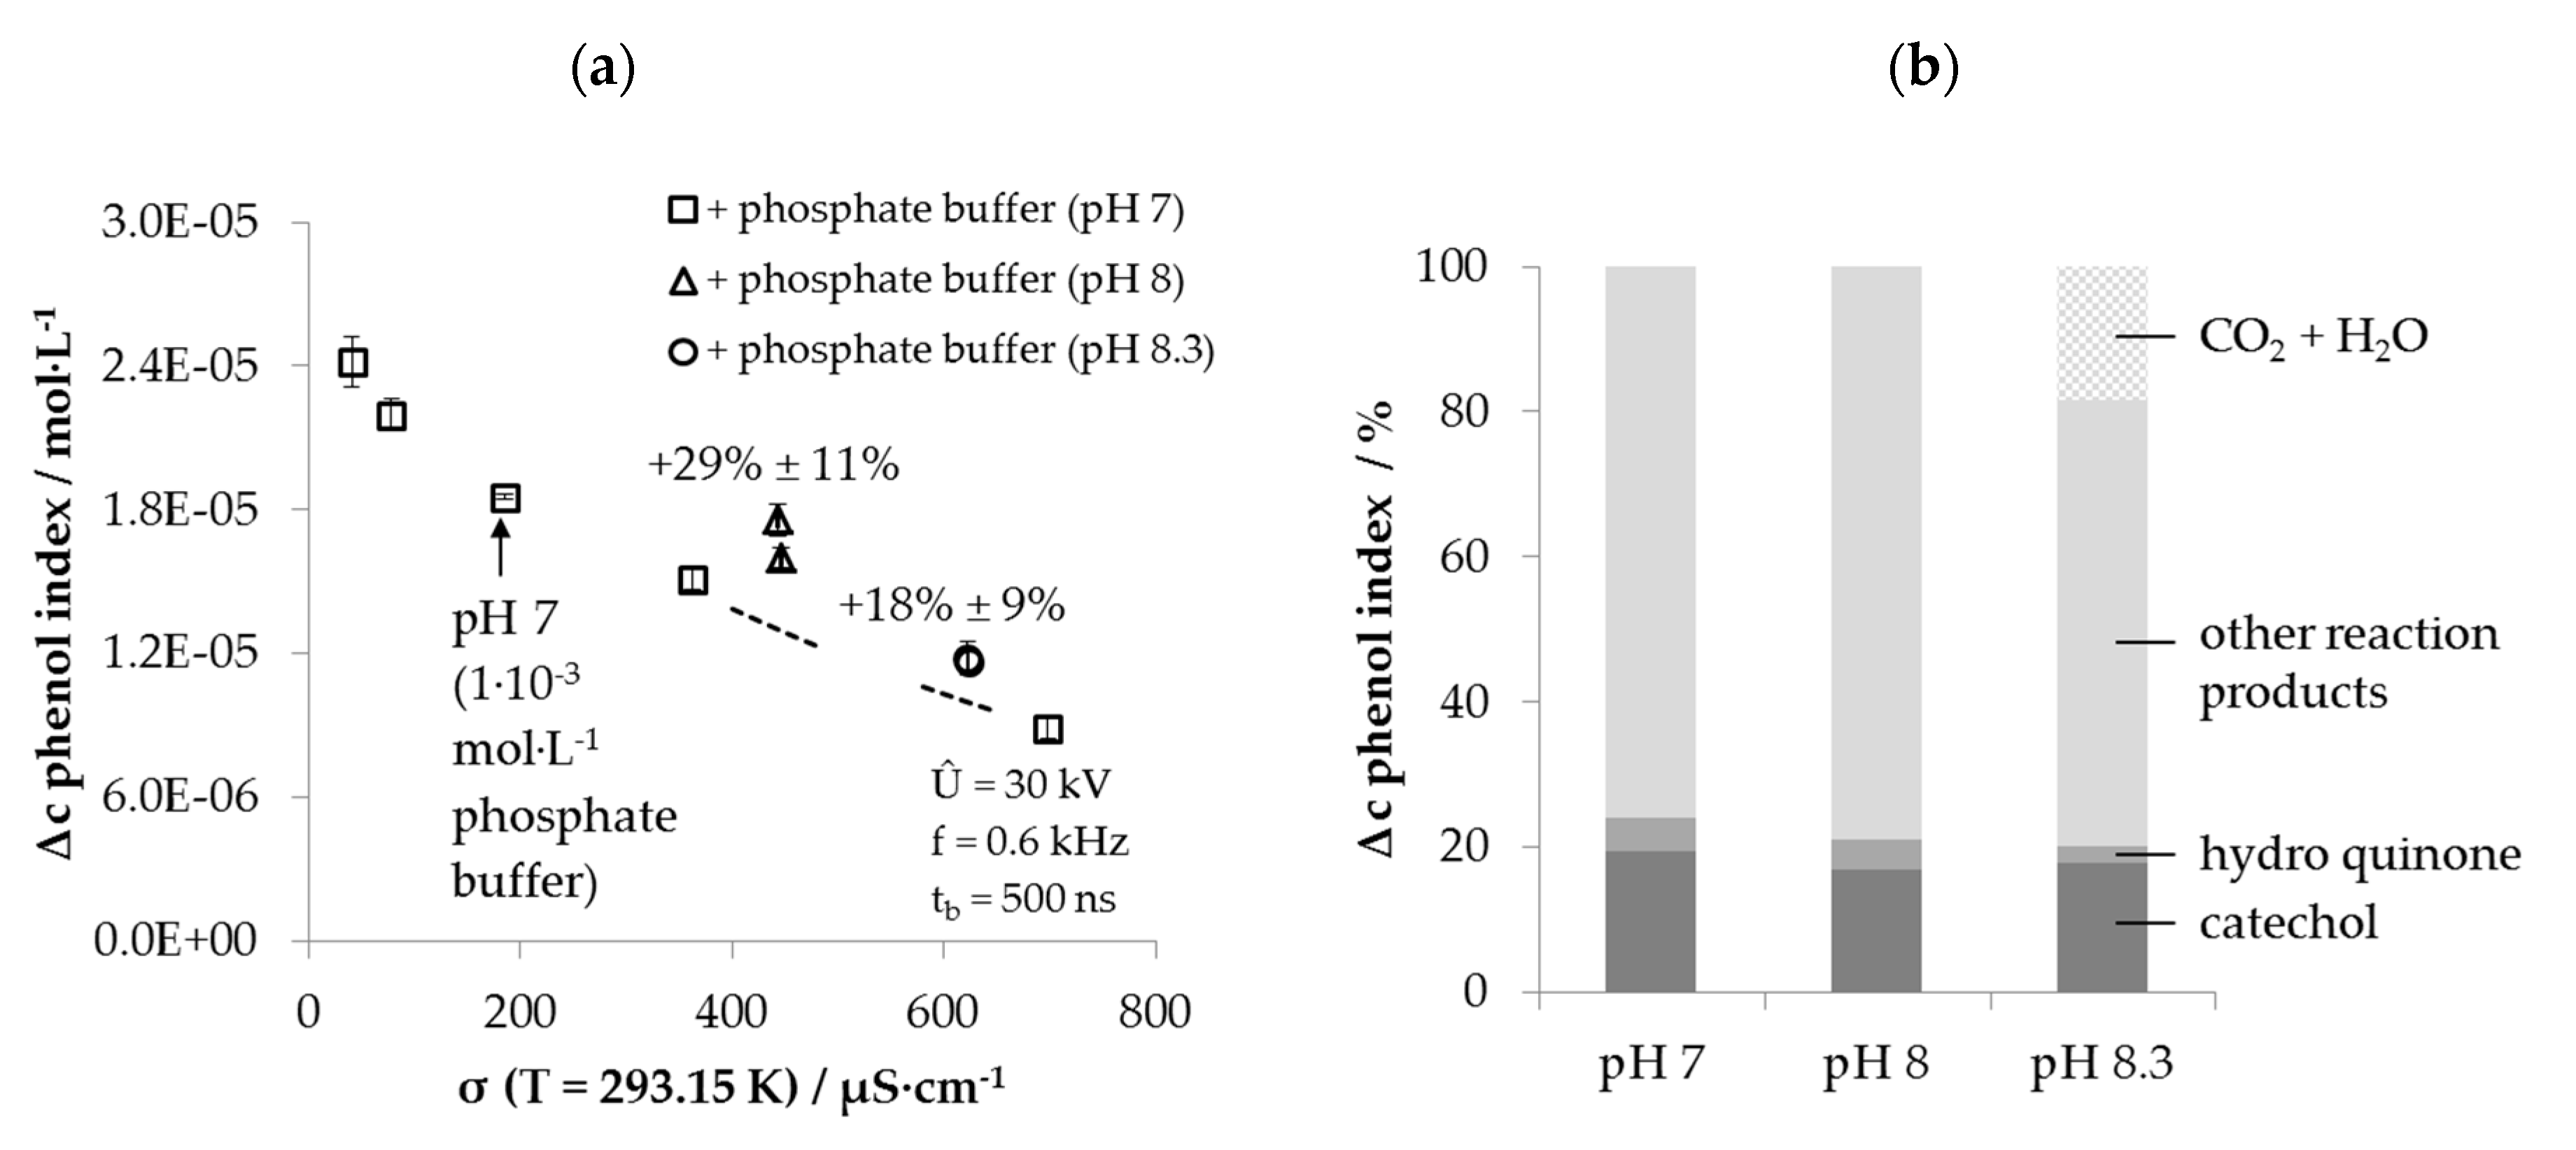
3.4. Degradation of the Refernce Substances Depending on Physical-Chemical Water Properties
4. Conclusions
5. Patents
Author Contributions
Funding
Acknowledgments
Conflicts of Interest
References
- Penetrante, B.M.; Hsiao, M.C.; Bardsley, J.N.; Merritt, B.T.; Vogtlin, G.E.; Kuthi, A.; Burkhart, C.P.; Bayless, J.R. Identification of mechanisms for decomposition of air pollutants by non-thermal plasma processing. Plasma Sources Sci. Technol. 1997, 6, 251–259. [Google Scholar] [CrossRef]
- Chandana, L.; Reddy, P.M.K.; Subrahmanyam, C. Atmospheric pressure non-thermal plasma jet for the degradation of methylene blue in aqueous medium. Chem. Eng. J. 2015, 282, 116–122. [Google Scholar] [CrossRef]
- Misra, N.N. The contribution of non-thermal and advanced oxidation technologies toward dissipation of pesticide residues. Trends Food Sci. Technol. 2015, 45, 229–244. [Google Scholar] [CrossRef] [Green Version]
- Acayanka, E.; Tarkwa, J.B.; Laminsi, S. Evaluation of energy balance in a batch and circulating non-thermal plasma reactors during organic pollutant oxidation in aqueous solution. Plasma Chem. Plasma Process. 2019, 39, 75–87. [Google Scholar] [CrossRef]
- Aziz, K.H.H.; Miessner, H.; Mueller, S.; Kalass, D.; Moeller, D.; Khorshid, I.; Rashid, M.A.M. Degradation of pharmaceutical diclofenac and ibuprofen in aqueous solution, a direct comparison of ozonation, photocatalysis, and non-thermal plasma. Chem. Eng. J. 2017, 313, 1033–1041. [Google Scholar] [CrossRef]
- Aziz, K.H.H.; Mahyar, A.; Miessner, H.; Mueller, S.; Kalass, D.; Moeller, D.; Khorshid, I.; Rashid, M.A.M. Application of a planar falling film reactor for decomposition and mineralization of methylene blue in the aqueous media via ozonation, Fenton, photocatalysis and non-thermal plasma: A comparative study. Process. Saf. Environ. Prot. 2018, 113, 319–329. [Google Scholar] [CrossRef]
- Baloul, Y.; Aubry, O.; Rabat, H.; Colas, C.; Maunit, B.; Hong, D.P. Paracetamol degradation in aqueous solution by non-thermal plasma. Eur. Phys. J. Appl. Phys. 2017, 79, 30802. [Google Scholar] [CrossRef]
- Bansode, A.S.; More, S.E.; Siddiqui, E.A.; Satpute, S.; Ahmad, A.; Bhoraskar, S.V.; Mathe, V.L. Effective degradation of organic water pollutants by atmospheric non-thermal plasma torch and analysis of degradation process. Chemosphere 2017, 167, 396–405. [Google Scholar] [CrossRef]
- Bosi, F.J.; Tampieri, F.; Marotta, E.; Bertani, R.; Pavarin, D.; Paradisi, C. Characterization and comparative evaluation of two atmospheric plasma sources for water treatment. Plasma Process. Polym. 2017, 15, e1700130. [Google Scholar] [CrossRef]
- Bradu, C.; Magureanu, M.; Parvulescu, V.I. Degradation of the chlorophenoxyacetic herbicide 2,4-D by plasma-ozonation system. J. Hazard. Mater. 2017, 336, 52–56. [Google Scholar] [CrossRef]
- Ceriani, E.; Marotta, E.; Shapoval, V.; Favaro, G.; Paradisi, C. Complete mineralization of organic pollutants in water by treatment with air non-thermal plasma. Chem. Eng. J. 2018, 337, 567–575. [Google Scholar] [CrossRef]
- Chen, J.Y.; Feng, J.W.; Lu, S.S.; Shen, Z.J.; Du, Y.L.; Peng, L.; Nian, P.; Yuan, S.J.; Zhang, A.Y. Non-thermal plasma and Fe2+ activated persulfate ignited degradation of aqueous crystal violet: Degradation mechanism and artificial neural network modeling. Sep. Purif. Technol. 2018, 191, 75–85. [Google Scholar] [CrossRef]
- Fahmy, A.; El-Zomrawy, A.; Saeed, A.M.; Sayed, A.Z.; El-Arab, M.A.E.; Shehata, H.A. Modeling and optimizing Acid Orange 142 degradation in aqueous solution by non-thermal plasma. Chemosphere 2018, 210, 102–109. [Google Scholar] [CrossRef]
- Ferhat, M.F.; Ghezzar, M.R.; Smail, B.; Guyon, C.; Ognier, S.; Addou, A. Conception of a novel spray tower plasma-reactor in a spatial post-discharge configuration: Pollutants remote treatment. J. Hazard. Mater. 2017, 321, 661–671. [Google Scholar] [CrossRef] [PubMed]
- Karimaei, M.; Nabizadeh, R.; Shokri, B.; Khani, M.R.; Yaghmaeian, K.; Mesdaghinia, A.; Mahvi, A.; Nazmara, S. Dielectric barrier discharge plasma as excellent method for Perchloroethylene removal from aqueous environments: Degradation kinetic and parameters modeling. J. Mol. Liq. 2017, 248, 177–183. [Google Scholar] [CrossRef]
- Kasih, T.P. Investigation of the non-thermal plasma-based advanced oxidation process for removal of organic contaminants in azo dyes solution. J. Ecol. Eng. 2017, 18, 1–6. [Google Scholar] [CrossRef]
- Krupež, J.; Kovačević, V.V.; Jović, M.; Roglić, G.M.; Natić, M.M.; Kuraica, M.M.; Obradović, B.M.; Dojčinović, B.P. Degradation of nicotine in water solutions using a water falling film DBD plasma reactor: Direct and indirect treatment. J. Phys. D Appl. Phys. 2018, 51, 1–14. [Google Scholar] [CrossRef]
- Liu, Y.A.; Zhang, H.; Sun, J.H.; Liu, J.X.; Shen, X.; Zhan, J.X.; Zhang, A.; Ognier, S.; Cavadias, S.; Li, P. Degradation of aniline in aqueous solution using non-thermal plasma generated in microbubbles. Chem. Eng. J. 2018, 345, 679–687. [Google Scholar] [CrossRef]
- Magureanu, M.; Mandache, N.B.; Bradu, C.; Parvulescu, V.I. High efficiency plasma treatment of water contaminated with organic compounds. Study of the degradation of ibuprofen. Plasma Process. Polym. 2018, 15, 9. [Google Scholar] [CrossRef]
- Mouele, E.S.M. Water Treatment Using Electrohydraulic Discharge System. Master’s Thesis, University of the Western Cape, Cape Town, South Africa, November 2014. [Google Scholar]
- Rong, S.P.; Sun, Y.B.; Zhao, Z.H.; Wang, H.Y. Dielectric barrier discharge induced degradation of diclofenac in aqueous solution. Water Sci. Technol. 2014, 69, 76–83. [Google Scholar] [CrossRef]
- Wardenier, N.; Vanraes, P.; Nikiforov, A.; van Hulle, S.W.H.; Leys, C. Removal of micropollutants from water in a continuous-flow electrical discharge reactor. J. Hazard. Mater. 2019, 362, 238–245. [Google Scholar] [CrossRef] [PubMed]
- Zhang, H.; Liu, Y.A.; Cheng, X.; Zhang, A.; Li, X.; Liu, J.X.; Cai, S.J.; Yang, C.; Ognier, S.; Li, P. Degradation of phenol in water using a novel gas-liquid two-phase dielectric barrier discharge plasma reactor. Water Air Soil Pollut. 2018, 229, 314. [Google Scholar] [CrossRef]
- Zhang, H.; Zhang, Q.; Miao, C.G.; Huang, Q. Degradation of 2, 4-dichlorophenol in aqueous solution by dielectric barrier discharge: Effects of plasma-working gases, degradation pathways and toxicity assessment. Chemosphere 2018, 204, 351–358. [Google Scholar] [CrossRef] [PubMed]
- Zhang, Q.; Zhang, H.; Zhang, Q.X.; Huang, Q. Degradation of norfloxacin in aqueous solution by atmospheric-pressure non-thermal plasma: Mechanism and degradation pathways. Chemosphere 2018, 210, 433–439. [Google Scholar] [CrossRef]
- Hoigné, J. Inter-calibration of OH radical sources and water quality parameters. Water Sci. Technol. 1997, 35, 1–8. [Google Scholar] [CrossRef]
- Elovitz, M.S.; von Gunten, U. Hydroxyl Radical/ Ozone Ratios During Ozonation Processes. I. The Rct Concept. Ozone-Sci. Eng. 1999, 21, 239–260. [Google Scholar] [CrossRef]
- Fernández-Castro, P.; Vallejo, M.; Román, M.F.S.; Ortiz, I. Insight on the fundamentals of advanced oxidation processes. Role and review of the determination methods of reactive oxygen species. J. Chem. Technol. Biotechnol. 2015, 90, 796–820. [Google Scholar] [CrossRef]
- Criegee, R. Mechanism of Ozonolysis. Angew. Chem. Int. Ed. 1975, 14, 745–752. [Google Scholar] [CrossRef]
- Geletneky, C.; Berger, S. The mechanism of Ozonolysis revisited by 17O-NMR Spectroscopy. Eur. J. Org. Chem. 1998, 8, 1625–1627. [Google Scholar] [CrossRef]
- Gottschalk, C.; Libra, J.A.; Saupe, A. Ozonation of Water and Wastewater: A Practical Guide to Understanding Ozone and Its Application; WILEY-VCH: Weinheim, Germany, 2000. [Google Scholar]
- Ribeiro, A.R.; Nunes, O.C.; Pereira, M.F.R.; Silva, A.M.T. An overview on the advanced oxidation processes applied for the treatment of water pollutants defined in the recently launched Directive 2013/39/EU. Environ. Int. 2015, 75, 33–51. [Google Scholar] [CrossRef] [Green Version]
- Staehelin, J.; Hoigné, J. Decomposition of Ozone in Water in the Presence of Organic Solutes Acting as Promoters and Inhibitors of Radical Chain Reactions. Environ. Sci. Technol. 1985, 19, 1206–1213. [Google Scholar] [CrossRef] [PubMed]
- Rubio-Clemente, A.; Torres-Palma, R.A.; Peñuela, G.A. Removal of polycyclic aromatic hydrocarbons in aqueous environment by chemical treatments: A review. Sci. Total Environ. 2014, 478, 201–225. [Google Scholar] [CrossRef] [PubMed]
- Cheng, M.; Zeng, G.; Huang, D.; Lai, C.; Xu, P.; Zhang, C.; Liu, Y. Hydroxyl radicals based advanced oxidation processes (AOPs) for remediation of soils contaminated with organic compounds: A review. Chem. Eng. J. 2016, 284, 582–598. [Google Scholar] [CrossRef]
- Bernal, M.; Romero, R.; Roa, G.; Barrera-Díaz, C.; Torres-Blancas, T.; Natividad, R. Ozonation of Indigo Carmine Catalyzed with Fe-Pillared Clay. Int. J. Photoenergy 2013, 1–7. [Google Scholar] [CrossRef]
- Wang, H.-J.; Chen, X.-Y. Kinetic analysis and energy efficiency of phenol degradation in a plasma-photocatalysis system. J. Hazard. Mater. 2011, 186, 1888–1892. [Google Scholar] [CrossRef]
- Bader, H.; Hoigné, J. Determination of ozone in water by the indigo method. Water Res. 1981, 15, 449–456. [Google Scholar] [CrossRef]
- DIN 38408-3:2011-04. German Standard Methods For. The Examination of Water, Waste Water and Sludge—Gaseous Components (Group G)—Part. 3: Determination of Ozone(G 3); Beuth Publishing DIN: Berlin, Germany, 2011. [Google Scholar]
- Galindo, C.; Jacques, P.; Kalt, A. Photochemical and photocatalytic degradation of an indigoid dye: A case study of acid blue 74 (AB74). J. Photochem. Photobiol. A Chem. 2001, 141, 47–56. [Google Scholar] [CrossRef]
- Anderson, C.E.; Cha, N.R.; Lindsay, A.D.; Clark, D.S.; Graves, D.B. The role of interfacial reactions in determining plasma–liquid chemistry. Plasma Chem. Plasma Process. 2016, 36, 1393–1415. [Google Scholar] [CrossRef]
- Sychev, A.Y.; Isak, V.G.; Pfannmueller, U. Determination of rate constants of hydroxyl radicals with organic and inorganic substances under conditions for the catalytic decomposition of hydrogen peroxide. Russ. J. Phys. Chem. 1979, 53, 2790–2793. [Google Scholar]
- Gandra, N.; Frank, A.T.; le Gendre, O.; Sawwan, N.; Aebisher, D.; Liebman, J.F.; Houk, K.N.; Greer, A.; Gao, R. Possible singlet oxygen generation from the photolysis of indigo dyes in methanol, DMSO, water, and ionic liquid, 1-Butyl-3-methylimidazolium tetrafluoroborate. Tetrahedron 2006, 62, 10771–10776. [Google Scholar] [CrossRef]
- Kettle, A.J.; Clark, B.M.; Winterbourn, C.C. Superoxide converts indigo carmine to isatin sulfonic acid. J. Biol. Chem. 2004, 279, 18521–18525. [Google Scholar] [CrossRef] [PubMed] [Green Version]
- Handa, T.; Minamitani, Y. The effect of a water-droplet spray and gas discharge in water treatment by pulsed power. IEEE Trans. Plasma Sci. 2009, 37, 179–183. [Google Scholar] [CrossRef]
- Nose, T.; Yokoyama, Y.; Nakamura, A.; Minamitani, Y. Effect of oxygen gas on the decomposition of dye by pulsed discharge in water droplet spray. Electr. Eng. Jpn. 2013, 183, 10–23. [Google Scholar] [CrossRef]
- Liao, H.; Stenman, D.; Jonsson, M. Study of indigo carmine as radical probe in photocatalysis. J. Photochem. Photobiol. A Chem. 2009, 202, 86–91. [Google Scholar] [CrossRef]
- Yao, C.C.D.; Haag, W.R. Rate constants for direct reactions of ozone with several drinking water contaminants. Water Res. 1991, 27, 761–773. [Google Scholar] [CrossRef]
- Neta, P.; Dorfman, L.M. Pulse radiolysis studies. XIII: Rate constants for the reaction of hydroxyl radicals with aromatic compounds in aqueous solutions. Adv. Chem. Ser. 1968, 81, 222–230. [Google Scholar] [CrossRef]
- Zona, R.; Solar, S.; Getoff, N.; Sehested, K.; Holcman, J. Reactivity of H atoms and hydrated electrons with chlorobenzoic acids. Radiat. Phys. Chem. 2008, 77, 162–168. [Google Scholar] [CrossRef]
- Pi, Y.; Schumacher, J.; Jekel, M. The use of para-Chlorobenzoic acid (pCBA) as an Ozone/Hydroxyl radical probe compound. Ozone-Sci. Eng. 2005, 27, 431–436. [Google Scholar] [CrossRef]
- Li, J.; Sato, M.; Ohshima, T. Degradation of phenol in water using a gas-liquid phase pulsed discharge plasma reactor. Thin Solid Films 2007, 515, 4283–4288. [Google Scholar] [CrossRef]
- Sato, M.; Tokutake, T.; Ohshima, T.; Sugiarto, A.T. Aqueous phenol decomposition by pulsed discharges on the water surface. IEEE Trans. Ind. Appl. 2008, 44, 1397–1402. [Google Scholar] [CrossRef]
- Wu, J.; Rudy, K.; Spark, J. Oxidation of aqueous phenol by ozone and peroxidase. Adv. Environ. Res. 2000, 4, 339–346. [Google Scholar] [CrossRef]
- Duan, L.; Shang, K.; Lu, N.; Li, J.; Wu, Y. Study on the factors influencing phenol degradation in water by dielectric barrier discharge (DBD). J. Phys. Conf. Ser. 2012, 418, 012129. [Google Scholar] [CrossRef] [Green Version]
- Tang, S.; Yuan, D.; He, J. Adsorbability enhancement of macroporous resin by dielectric barrier discharge plasma treatment to phenol in water. J. Chem. 2016, 1–8. [Google Scholar] [CrossRef] [Green Version]
- Mizrahi; A.; Litaor, I.M. The kinetics of the removal of organic pollutants from drinking water by a novel plasma-based advanced oxidation technology. Desalin. Water Treat. 2014, 52, 5264–5275. [Google Scholar] [CrossRef]
- Dors, M.; Metel, E.; Mizeraczyk, J. Phenol degradation in water by pulsed streamer corona discharge and fenton reaction. Int. J. Plasma Environ. Sci. Technol. 2007, 1, 76–81. [Google Scholar]
- Poznyak, T.; Vivero, J. Degradation of aqueous phenol and chlorinated phenols by ozone. Ozone Sci. Eng. 2005, 27, 447–458. [Google Scholar] [CrossRef]
- Kaminski, G.A. Accurate prediction of absolute acidity constants in water with polarizable force field: Substituted phenols, methanol, and imidazole. J. Phys. Chem. B 2005, 109, 5884–5890. [Google Scholar] [CrossRef]
- Hoigné, J.; Bader, H. Rate constants of reactions of ozone with organic and inorganic compounds in water-II. Dissociating organic compounds. Water Res. 1983, 17, 185–194. [Google Scholar] [CrossRef]
- Lukeš, P. Water Treatment by Pulsed Streamer Corona Discharge. Ph.D. Thesis, Institute of Plasma Physics AS CR, Prague, Czechia, 2001. [Google Scholar]
- De, A.K.; Chaudhuri, B.; Bhattacharjee, S.; Dutta, B.K. Estimation of ∙OH radical reaction rate constants for phenol and chlorinated phenols using UV/H2O2 photo-oxidation. J. Hazard. Mater. B 1999, 64, 91–104. [Google Scholar] [CrossRef]
- Shih, K.-Y.; Locke, B.R. Optical and electrical diagnostics of the effects of conductivity on liquid phase electrical discharge. IEEE Trans. Plasma Sci. 2011, 39, 883–892. [Google Scholar] [CrossRef]
- Sehested, K.; Corfitzen, H.; Holcman, J.; Fischer, C.F.; Hart, E.J. The primary reaction in the decomposition of ozone in acidic aqueous solutions. Environ. Sci. Technol. 1991, 25, 1589–1596. [Google Scholar] [CrossRef]
- Staehelin, J.; Hoigné, J. Decomposition of ozone in water: Rate of initiation by hydroxide ions and hydrogen peroxide. Environ. Sci. Technol. 1982, 16, 676–681. [Google Scholar] [CrossRef]
- DIN 38409-16:1984-06. German Standard Methods for the Examination of Water, Wastewater and Sludge; General Measures of Effects and Substances (Group H); Determination of the Phenol Index (H 16); Beuth Publishing DIN: Berlin, Germany, 2011. [Google Scholar]
- DIN EN 1484:2019-04. Water Analysis-Guidelines for the Determination of Total Organic Carbon (Toc) and Dissolved Organic Carbon (DOC); Beuth Publishing DIN: Berlin, Germany, 2011. [Google Scholar]
- Elovitz, M.S.; von Gunten, U.; Kaiser, H.-P. Hydroxyl radical/ozone ratios during ozonation processes. II. the effect of temperature, pH, alkalinity; DOM properties. Ozone Sci. Eng. 2000, 22, 123–150. [Google Scholar] [CrossRef]
- Liu, Z.M.; Lin, J.Y.; Zheng, H.L.; Pang, Y. Effect of viscosities on the spray characteristics of pressure swirl nozzle. J. Appl. Fluid Mech. 2020, 13, 861–870. [Google Scholar] [CrossRef]
- Venard, J.K.; Street, R.L. Elementary Fluid Mechanics, 5th ed.; Wiley: New York, NY, USA, 1975. [Google Scholar]
- Malik, M.A. Water purification by plasmas: Which reactors are most energy efficient? Plasma Chem. Plasma Process. 2010, 30, 21–31. [Google Scholar] [CrossRef]
- Guerra, R. Ecotoxicological and chemical evaluation of phenolic compounds in industrial effluents. Chemosphere 2001, 44, 1737–1747. [Google Scholar] [CrossRef]
- Fischbacher, A.; von Sonntag, J.; von Sonntag, C.; Schmidt, T.C. The OH Radical Yield in the H2O2 + O3 (Peroxone) Reaction. Environ. Sci. Technol. 2013, 47, 9959–9964. [Google Scholar] [CrossRef]
- De Witte, B.; Dewulf, J.; Demeestere, K.; van Langenhove, H. Ozonation and advanced oxidation by the peroxone process of ciprofloxacin in water. J. Hazard. Mater. 2009, 161, 701–708. [Google Scholar] [CrossRef]
- Chirokov, A.; Gutsol, A.; Fridman, A. Atmospheric pressure plasma of diselectric barrier discharges. Pure Appl. Chem. 2005, 77, 487–495. [Google Scholar] [CrossRef]
- Tabrizi, M.T.F.; Glasser, D.; Hildebrandt, D. Wastewater treatment of reactive dyestuffs by ozonation in a semi-batch reactor. Chem. Eng. J. 2011, 166, 662–668. [Google Scholar] [CrossRef]
- Bezbarua, B.K.; Reckhow, D.A. Modification of the standard neutral ozone decomposition model. Ozone Sci. Eng. 2010, 26, 345–357. [Google Scholar] [CrossRef]
- Gultekin, I.; Ince, N.I. Degradation of reactive Azo dyes by UV/H2O2: Impact of radical scavengers. J. Environ. Sci. Health A 2004, 39, 1069–1081. [Google Scholar] [CrossRef] [PubMed]
- Gurol, M.D.; Singer, P.C. Kinetics of ozone decomposition: A dynamic approach. Environ. Sci. Technol. 1982, 16, 377–383. [Google Scholar] [CrossRef] [PubMed]
- Beltrán, F.J. Theoretical aspects of the kinetics of competitive ozone reactions in water. Ozone Sci. Eng. 1995, 17, 163–181. [Google Scholar] [CrossRef]
- Hayashi, M. Temperature-electrical conductivity relation of water for environmental monitoring and geophysical data inversion. Environ. Monit. Assess. 2004, 96, 119–128. [Google Scholar] [CrossRef]


© 2020 by the authors. Licensee MDPI, Basel, Switzerland. This article is an open access article distributed under the terms and conditions of the Creative Commons Attribution (CC BY) license (http://creativecommons.org/licenses/by/4.0/).
Share and Cite
Schönekerl, S.; Weigert, A.; Uhlig, S.; Wellner, K.; Pörschke, R.; Pfefferkorn, C.; Backhaus, K.; Lerch, A. Evaluating the Performance of a Lab-Scale Water Treatment Plant Using Non-Thermal Plasma Technology. Water 2020, 12, 1956. https://doi.org/10.3390/w12071956
Schönekerl S, Weigert A, Uhlig S, Wellner K, Pörschke R, Pfefferkorn C, Backhaus K, Lerch A. Evaluating the Performance of a Lab-Scale Water Treatment Plant Using Non-Thermal Plasma Technology. Water. 2020; 12(7):1956. https://doi.org/10.3390/w12071956
Chicago/Turabian StyleSchönekerl, Stefan, Astrid Weigert, Stephan Uhlig, Katharina Wellner, Richard Pörschke, Christel Pfefferkorn, Karsten Backhaus, and André Lerch. 2020. "Evaluating the Performance of a Lab-Scale Water Treatment Plant Using Non-Thermal Plasma Technology" Water 12, no. 7: 1956. https://doi.org/10.3390/w12071956