Sedimentation and Transport of Different Soil Colloids: Effects of Goethite and Humic Acid


1
Key Laboratory for Environmental Factors Control of Agro-Product Quality Safety, Ministry of Agriculture and Rural Affairs, Tianjin 300191, China
2
Agro-Environmental Protection Institute, Ministry of Agriculture and Rural Affairs, Tianjin 300191, China
3
Department of Soil Quality, Wageningen University, P.O. Box 47, 6700 AA Wageningen, The Netherlands
4
College of Natural Resources and Environment, South China Agricultural University, Guangzhou 510642, China
*
Authors to whom correspondence should be addressed.
Water 2020, 12(4), 980; https://doi.org/10.3390/w12040980
Submission received: 23 February 2020
/
Revised: 20 March 2020
/
Accepted: 23 March 2020
/
Published: 30 March 2020
(This article belongs to the Special Issue Colloid and Pathogen Transport in Groundwater)
Abstract
:Soil colloids significantly facilitate the transport of contaminants; however, little is known about the effects of highly reactive iron oxide and the most representative organic matter on the transport of soil colloids with different physicochemical properties. This study investigated the effects of goethite (GT) and humic acid (HA) on the sedimentation and transport of soil colloids using settling and column experiments. The stability of soil colloids was found to be related to their properties and decreased in the following order: black soil colloids (BSc) > yellow soil colloids (YSc) > fluvo-aquic soil colloids (FSc). Organic matter increased the stability of BSc, and ionic strength (Ca2+) promoted the deposition of FSc. Colloids in individual and GT colloids (GTc) coexistence systems tended to stabilize at high pH and showed a pH-dependence whereby the stability decreased with decreasing pH. The interaction of GTc and kaolinite led to a dramatic sedimentation of YSc at pH 4.0. HA enhanced the stability of soil colloids, especially at pH 4.0, and obscured the pH-dependent sedimentation of soil colloids. The transport ability of soil colloids was the same as their stability. The addition of GT retarded the transport of soil colloids, which was quite obvious at pH 7.0. This retardation effect was attributed to the transformation of the surface charge of sand from negative to positive, which increased the electrical double-layer attraction. Although sand coated with GT–HA provided more favorable conditions for the transport of soil colloids in comparison to pure sand, the corresponding transport was relatively slow. This suggests that the filtration effect, heterogeneity, and increased surface roughness may still influence the transport of soil colloids.
1. Introduction
Highly heterogeneous natural environmental systems are characterized by an abundance of natural colloids and nanoparticles. Colloidal particles are usually smaller than ~ 1 μm in at least one dimension and have high specific surface areas (10–800 m2 g−1) [1]. These factors determine the fate and transport of pollutants to a great extent and thus also contribute to environmental pollution in adjacent surface waterbodies and groundwater. [2,3,4]. A prerequisite for colloid-facilitated transport is that colloids present in the subsurface [5,6] form stable colloid suspensions [7].
Soil type determines the physicochemical properties of soil colloids; differences in the chemical and mineralogical properties of soil colloids influence their stability [8], pollutant load [9], and mobility [10], which further affects their ability to transport pollutants. The presence of organic matter and metallic oxides on colloid surfaces determine their surface chemical properties and stability or mobility [11,12,13,14]. Soil colloids with a high content of Fe and Al (hydro-)oxides may cause their aggregation and coagulation, while an increased organic carbon content promotes a high colloid stability [15]. The presence of other natural colloids and nanoparticles may also interfere with the stability, transport, and fate of soil colloids.
Goethite (α-FeOOH, GT) is a highly reactive Fe oxide and may influence the stability and transport of soil colloids. Goethite can act as cementing agents to bind colloids together [16]. In the presence of Fe (hydro-)oxides with a positive charge at a pH below the point of zero charge (PZC), the aggregation and coagulation of soil colloids are accelerated through the attraction between the Fe (hydro-)oxides and the negatively charged colloid particles [17]. Meanwhile, GT has a positive effect on the heteroaggregation of selenium nanoparticles [18] and inhibits the transport of graphene oxides [19,20]. In contrast, some studies have found that mineral colloids can enhance the dispersion of nanoparticles, for example, CeO2 nanoparticle-hematite colloids [21]. Goethite has varying effects on colloids and nanoparticles with different properties, which indicates that the stability and migration of soil colloids are affected differently by GT.
Humic acid (HA) is the most representative organic matter in the natural environment and has varying effects on the stability and transport of soil colloids. Some studies have demonstrated that when HA was adsorbed to colloids, the colloid assemblage remained well-dispersed due to electrostatic repulsive interaction [4,22]. Moreover, the particle morphology of HA exhibited different enhancements in the transport of ferrihydrite nanoparticles, and chain-shaped HA enhanced the transport more prominently than pristine granular HA [4]. However, the presence of organic matter also led to the aggregation of suspended colloids and was dependent on its concentration or composition [23]. Another investigation suggested that the addition of HA to reference clay minerals increased their critical coagulation [17]. Moreover, our previous research found the occurrence of heteroagglomeration between GT colloids (GTc) and HA at pH 7.0 and 9.0 [3]. The effects of HA are varying at different pH and HA concentrations.
Previous studies have also indicated that environmental pH may regulate colloid stability; colloids tended to disperse at pH values both below and above their PZC, whereas they aggregated or coagulated when the pH was at their PZC [23,24,25]. The significant discrepancy of the PZC between HA (<3) [26] and GT (9.2) [27] led to differences in the regulation of colloidal mobility or stability [28]. Thus, the variability of environmental pH and the existence of HA and GT complicate the stability and/or mobility of soil colloids.
Consequently, the indigenous physicochemical properties of soil colloids, environmental pH, GT content, and HA content all play essential roles in regulating the stability and mobility of soil colloids, which can in turn significantly influence the fate and transport of colloid-associated contaminants. Therefore, it is necessary to develop a comprehensive understanding of how soil colloid stability and transport in soils are affected by pH, GT, and HA. The present study accordingly investigates the sedimentation and transport of soil colloids by sedimentation kinetics and column experiments and uses the Derjaguin–Landau–Verwey–Overbeek (DLVO) theory (i.e., the sum of the Van der Waals attractive energy (EVDW) and electrical double layer energy (EEDL)) to further reveal the associated mechanisms of colloid–colloid and colloid–plane interactions.
2. Materials and Methods
2.1. Preparation of Soil Colloid, Humic Acid, and Goethite Suspensions
Black soils or chernozem (BS, located at 124°23′20.8″ E, 51°40′44.2″ N), fluvo-aquic soils (FS, located at 115°2′8.9″ E, 36°51′37.4″ N), and yellow soils or yellow podzolic soil (YS, located at 113°22′39.4″ E, 23°9′26.6″ N), were collected from Heilongjiang Province, Hebei Province, and Guangdong Province in China, respectively. The soils were air-dried for two weeks before crushing massive aggregates. Undesirable materials such as stones, grass, and dry roots were manually removed, and the soil was then ground and sieved to <2 mm for analysis of soil properties. Soil samples were digested using HNO3-H2O2 in 50 mL conical flasks. The total elemental concentrations, including Al, Ca, and Fe, were determined by inductively coupled plasma optical emission spectrometry (ICP-OES, Optima 5300DV, Perkin-Elmer, Waltham, MA, US). The pH of soil sample was obtained using a pH meter (S400 SevenExcellence, METTLER TOLEDO, Shanghai, China) in a suspension of the soil at a solid-to-water ratio of 1:5. The total organic carbon (TOC) concentration was measured by a TOC analyzer (Aurora 1030C, OI Analytical, College Station, TX US), and the cation exchange capacity (CEC) was measured by a CEC analyzer (SKD-300, PeiOU, Shanghai, China). The particle size distribution of each soil sample was measured using a laser diffraction particle size analyzer (Mastersizer 2000, Malvern, UK).
For soil colloid preparation, 0.1 g of each soil with 50 mL of Milli-Q water was mixed in a 100 mL conical flask and then sonicated for 60 min. After shaking for 20 h, each solution was sonicated for another 60 min and left to settle for 30 min in order to precipitate the large particles. The upper 20 mL of each suspension was then transferred to a centrifuge tube for the settling experiments and subsequent chemical analysis. The concentration of each soil colloid suspension was determined by measuring the extinction at the optimal absorption wavelength (420 nm) with a spectrophotometer (UV2700, Shimadzu, Kyoto, Japan), as based on the linear calibration curves between absorbencies and standards. [29,30,31]. The standard concentration of soil colloids was obtained by weighing after drying the suspension. The total elemental concentrations, including Al, Ca, Fe, K, Mg, and Na, in each soil colloid suspension were determined by ICP-OES after digestion. The same solution was used to measure the dissolved organic carbon (DOC) content using the TOC analyzer. The conductivity of each soil colloidal suspension was obtained using a pH meter with a conductivity probe.
Humic acid was extracted following the classic alkali/acid fractionation procedure [32], and GT was precipitated by titrating dissolved Fe(NO3)3·9H2O (Sinopharm Chemical Reagent Co. Ltd., Shanghai, China, >98%) with NaOH to pH 12 [33]. The Brunauer–Emmett–Teller specific surface area (87.65 m2·g−1) and PZC (9.3) of GT were not analyzed in this study but are detailed in our previous study [3]. The molecular weight and Fourier-transform infrared spectroscopy analysis results for HA can also be found in our previous study [4]. The HA suspension was prepared by adding a trace amount of NaOH to accelerate the dissolution of HA to obtain a stock solution of 1 g L−1. The GT suspension was prepared by adding 0.1 g GT to 50 mL Milli-Q water, which was then sonicated for 60 min, shaken for 20 h, sonicated for another 60 min, and then left to settle for 30 min. The final HA and GT suspensions were diluted with Milli-Q water. The pH values of the suspensions were carefully adjusted using 0.1 M HCl and NaOH.
2.2. Settling Experiments and Model
Three groups of settling experiments were performed to investigate the independent settling of soil colloids, cosettling of soil colloids–GTc mixtures, and cosettling of soil colloids–HA mixtures for the three soil types (BS, FS, and YS) (Table 1). Each experiment was performed at pH 4.0, 7.0, and 9.0. The hydrodynamic size distribution and zeta potential of colloids were measured by a dynamic light scattering analyzer (Zetasizer Nano ZS, Malvern Instruments, Malvern UK) before the settling experiments (Table 1). Each suspension was immediately transferred into cuvettes for the measurement of absorbance at 420 nm [34] over a period of 20 h. All settling experiments were conducted in duplicate. The individual- and cosettling curves were then plotted, whereby the ordinate was the ratio of the absorbance values at a given point in time (At) to the initial absorbance (A0) and the abscissa was time. All settling curves were fitted using the exponential model [35,36,37,38] defined by Equation (1):
where t refers to the settling time (min), CPlateau and C1 represent the ratio of At/A0 and the diminished At/A0 when the settling curve plateaus (1 − At/A0), respectively, and R0 is the precipitation rate.
2.3. Transport Experiments and Model
Column experiments were performed in 10-cm glass chromatographic columns (inner diameter of 1.5 cm). Quartz sand (average particle size of 337.5 μm) was cleaned using 6 M HCl before being rinsed repeatedly with Milli-Q water. The columns were wet packed with either the cleaned quartz sand, sand coated with 0.5% GT, or sand simultaneously coated with 0.5% GT and 0.2% HA. The effective porosity and bulk density of the packed sand were 0.45 ± 0.02 cm3·cm−3 and 1.43 ± 0.05 g·cm−3, respectively [39]. After packing, the columns were preconditioned with approximately 15 pore volumes (PVs) of Milli-Q water (pH 7.0) using a peristaltic pump (BT-100 1F, Longer, Baoding China) in the upflow mode. All column experiments were performed at pH 7.0. Ten PVs of a soil colloid were injected into the columns, followed by elution with five PVs at the same pH and at a constant Darcy velocity of 0.568 cm·min−1. Concentrations of soil colloids in the effluents and the zeta potential of the ground sand/coated sands were measured as detailed in Section 2.1 and Table 1.
A conservative tracer can check the hydraulic characteristics, including the longitudinal dispersity, of the columns before the colloid transport experiments. Because the conditions of transport experiments are the same as our previous study, parameters of hydraulic characteristics were cited [39]. The transport data were simulated with the colloid transport model, which included two-site kinetic retention to describe the nanoparticle transport and retention in the column experiments [40,41]. For the first kinetic Site-1, the time-dependent retention is taken into account, assuming reversible retention using first-order attachment (k1a) and detachment (k1d) coefficients. For the second kinetic Site-2, depth-dependent retention is considered, assuming irreversible retention using a first-order retention coefficient (k2a) and a depth-dependent blocking function with a Langmuirian approach accounting for maximum nanoparticle content attached on Site-2 (Smax2). Detailed equations and parameters are exhibited in Supplementary Material S1.
2.4. Calculation of DLVO Energy
The formalized description of colloid stability and transport is given by the DLVO theory, which describes colloid–colloid and colloid–plane interactions as the sum of the EVDW and EEDL, as expressed by Equation (2) [42]:
The EVDW C-C between colloids in water was evaluated according to Equation (3):
where A is the Hamaker constant estimated to be 7.5 × 10⁻²⁰ J for the soil colloid [43], respectively, r1 and r2 are the hydrodynamic radius of nanoparticles, h is the separation distance between nanoparticles, and λ is the characteristic wavelength of interaction (100 nm) [44];
The EVDW C-P between colloid and sand was evaluated according to Equation (4):
where dp is the diameter of colloid; AC-P is the Hamaker constant for particle-water-sand, which can be expressed by Equation (5):
where AQ is the Hamaker constant for quartz sand (8.86 × 10⁻²⁰ J); AW is the Hamaker constant for water (3.7 × 10⁻²⁰ J).
The EEDL for colloid–colloid (EEDL c-c) and colloid–plane (EEDL c-p) interactions are function of the separation distance between colloids and between colloids and sand immersed in water, defined by Equations (6) and (7):
where ε0 is the dielectric permittivity of vacuum (8.854 × 10⁻¹² F·m−1); εr is the relative dielectric permittivity of water (78.5); ψC and ψP are the zeta potentials of colloids and sand (mV), used to approximate surface potential, n∞ is the number density of ions (m−3), k is the Boltzmann constant (1.38×10⁻²³ J K−1), T is the absolute temperature (298 K), and κ is the Debye-Huckel parameter (m−1). The Debye-Huckel parameter also provides an estimation of the effective thickness of the electrical double layer, and is expressed by Equation (8):
where I is ionic strength.
3. Results and Discussion
3.1. Characterization of Soil Samples and Soil Colloids
The physicochemical properties of the soil samples and soil colloids are presented in Table 2. The BS (5.73) and YS (5.91) had similar acidic pH values, whereas the FS was alkaline (7.68). The BS had the highest TOC content (38.8 g kg−1) and CEC (44.0 cmol kg−1), which were much higher than those of the other two soils. As the alkaline soil, the Ca content of the FS was 29.3 g kg−1, which was much higher than that of the BS (8.4 g kg−1) and YS (1.7 g kg−1). In general, all of the soils used in this experiment were silty loam, with the silt fraction (79.0–88.9%) dominating the particle size distribution, which was followed by sand (10.8–16.4%) and then clay (0.17–0.38%).
For the soil colloids, the colloidal concentration of the BS colloids (BSc), FS colloids (FSc), and YS colloids (YSc) were 0.88, 0.63, and 0.34 g L−1, respectively. The BS colloidal suspension had the highest DOC (10.6 mg L−1). Meanwhile, the FS colloidal suspension exhibited the highest conductivity (85.2 μS cm−1), and the Ca, K, Mg, and Na concentrations of the FSc were all higher than those of the other two soil colloidal suspension, (Table 2), thus corresponding to a relatively high ionic strength. All soil colloids were negatively charged (−14.2~−39.9 mV) and became more negative with increasing pH (Table 1). The hydrodynamic sizes varied little among the different treatments (380.1~579.1 nm). In addition, the compositions of the BSc and FSc were dominated by SiO2, while the YSc were abundant in kaolinite (Al2Si2O4) (Figure S1).
3.2. Effect of Goethite and HA on the Sedimentation of Different Soil Colloids
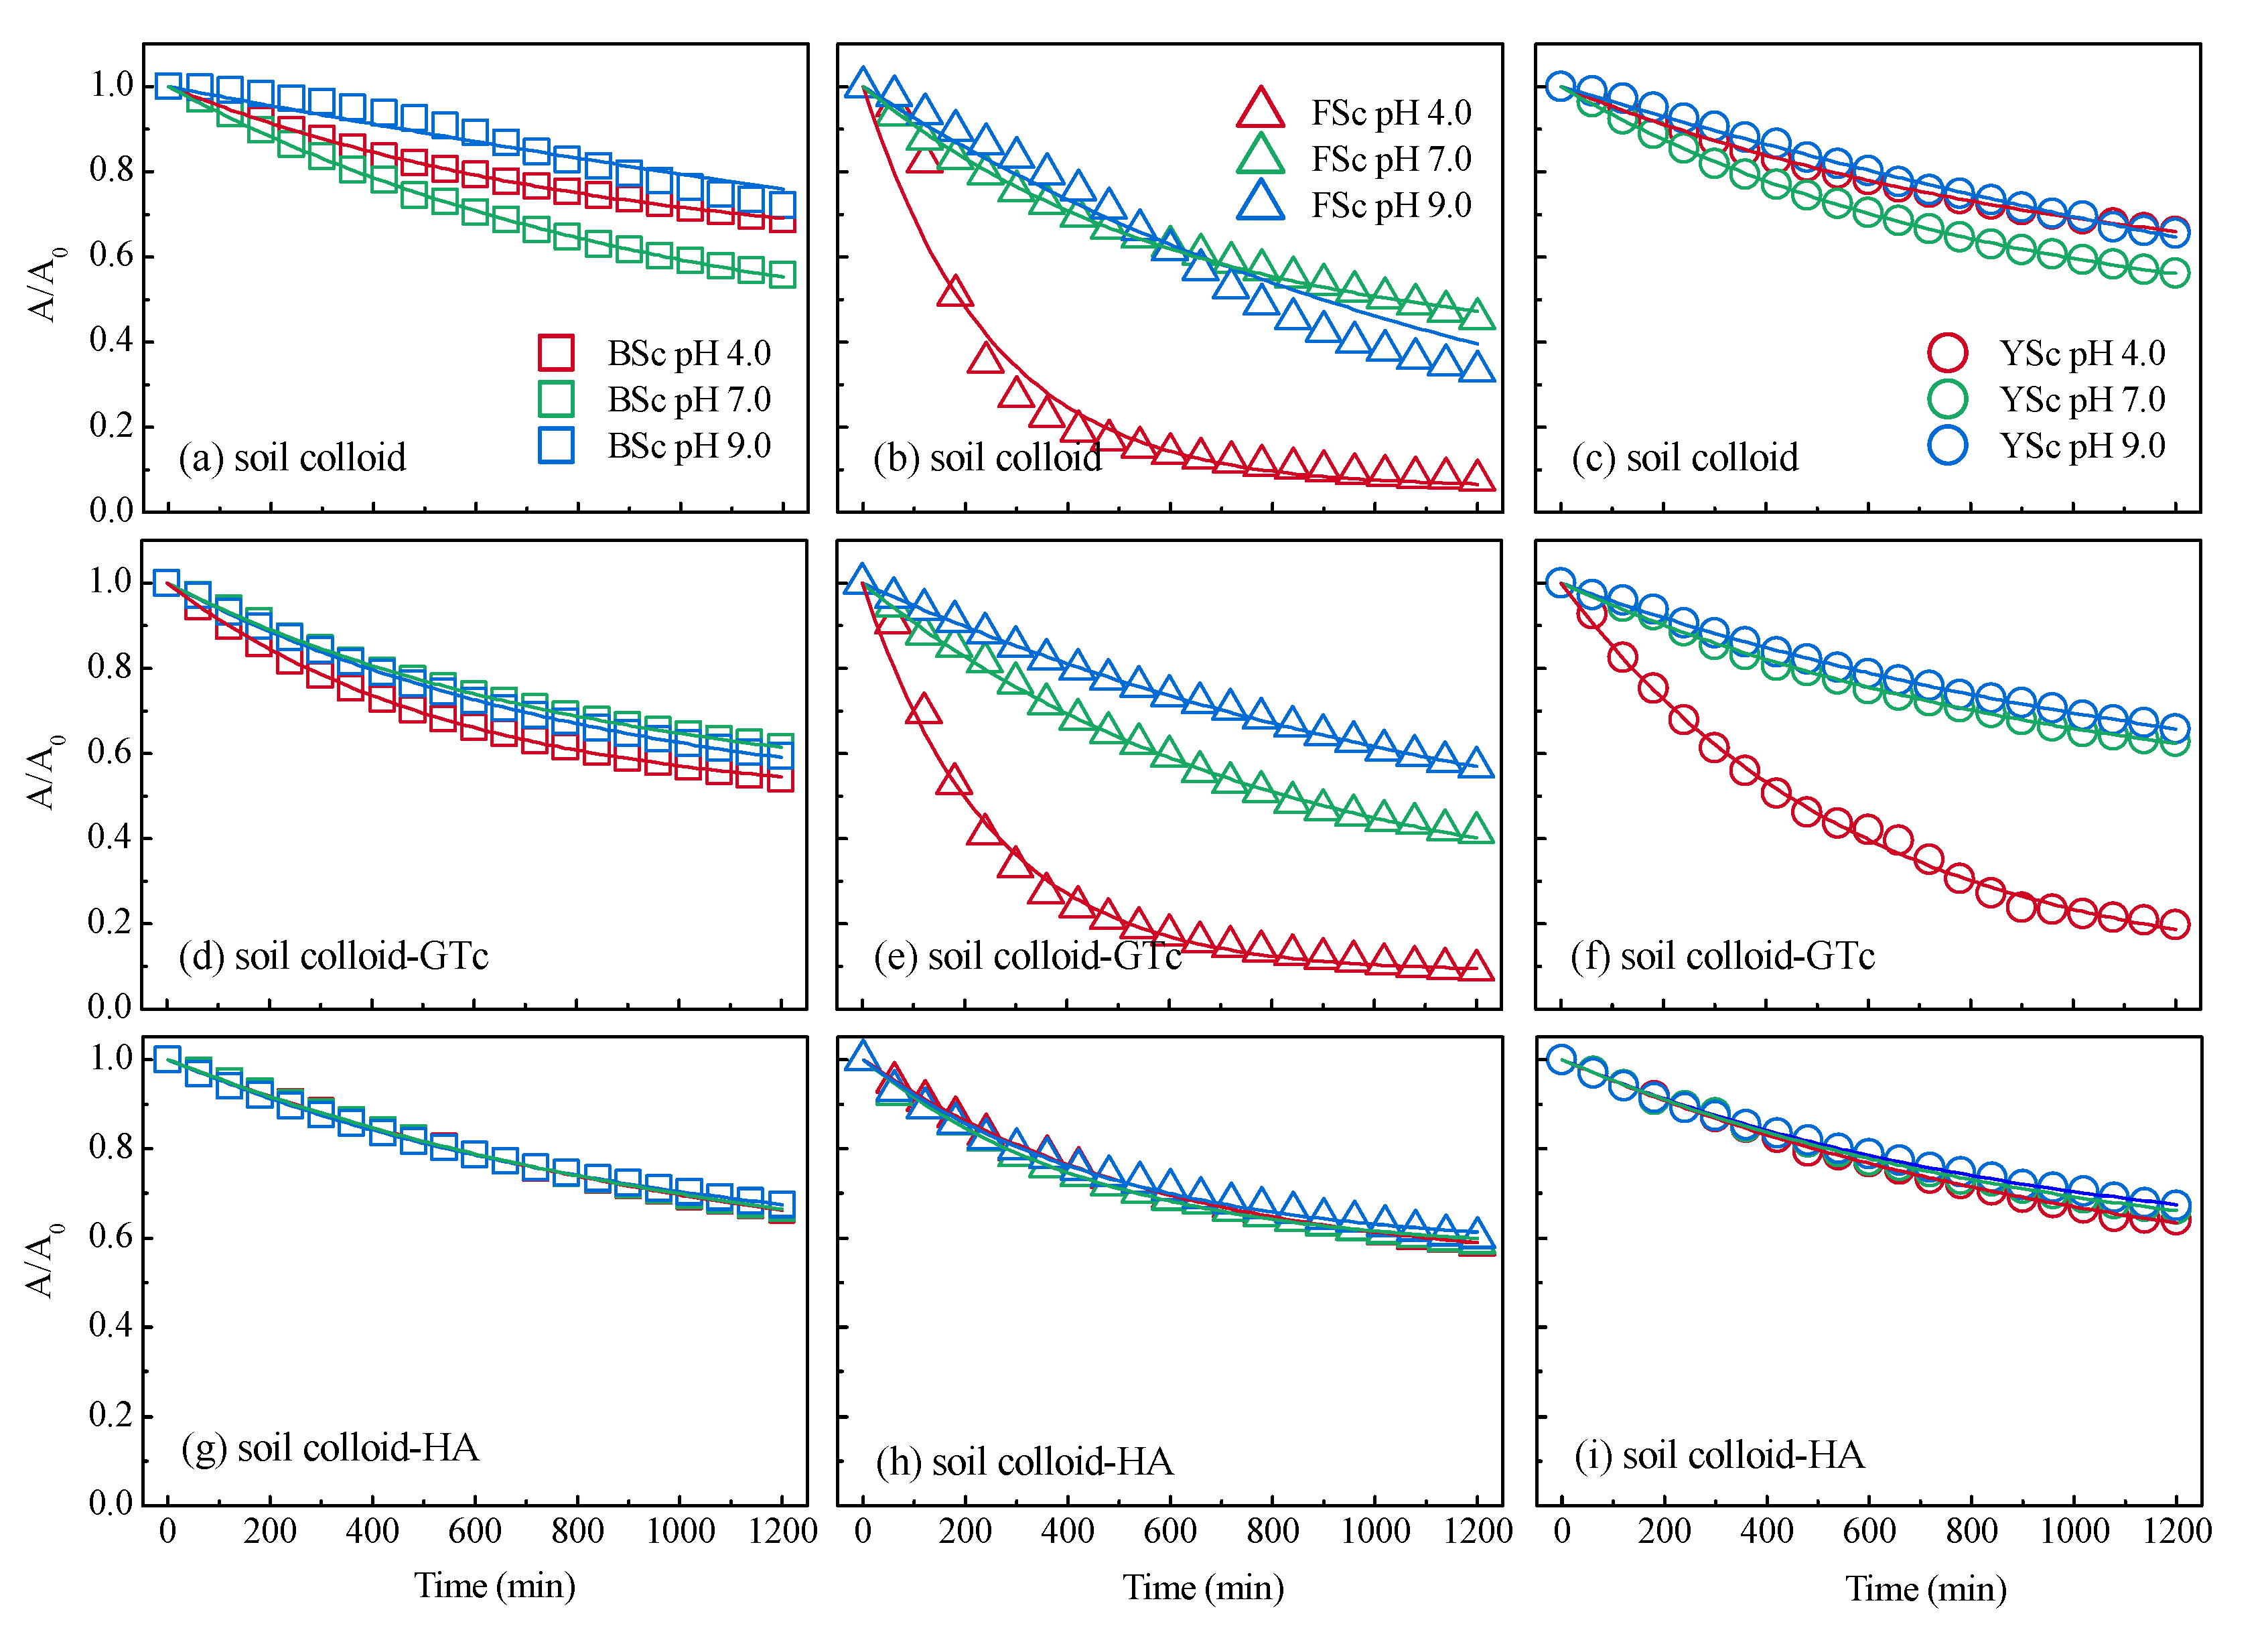
The sedimentation characteristics of individual soil colloids, soil colloids–GTc, and soil colloid–HA at different pH are shown in Figure 1 and their sedimentation parameters are presented in Table S1. In general, the settling of the FSc (60–95%) was much stronger than that of the BSc and YSc, showing a high homoaggregation. The stability of these soil colloids was dependent on the environmental pH, especially in the case of the FSc (Figure 1b). At pH 4.0, the FSc readily coagulated and exhibited the highest sedimentation rate (Vs = 4.02 × 10⁻³ m h−1) and lowest relative nonsettling concentration overall (C’res = 0.059) (Table S1), which was consistent with its high instability, as reflected by the relatively higher zeta potential (−14.2 mV) and larger hydrodynamic size of the FSc (802.9 nm) (Table 1). The larger hydrodynamic size indicated the significant homoaggregation of colloids, which could have caused the stronger settling of colloid aggregates [38]. The low concentration of FSc showed that homoaggregation of soil colloids was independent of concentration in this study. With increasing pH to 7.0 and 9.0, a much higher stability of FSc was observed along with a the relatively low hydrodynamic size (473.3~535.7 nm), zeta potentials (−17.6~−17.7 mV) (Table 1), and Vs value (0.772 × 10⁻³~1.61 × 10⁻³ m h−1) (Table S1). In contrast, the settling abilities of the BSc and YSc were the most unstable at pH 7.0 due to their larger hydrodynamic sizes (453.9~579.1 nm) (Figure 1a,c and Table 1), whereby they became most stable at pH 9.0, which corresponded to the lowest Vs values (0.23 × 10⁻³~0.264 × 10⁻³ m h−1), zeta potentials (−35.1~−39.9 mV), and hydrodynamic sizes (424.4~380.1 nm) (Table 1 and Table S1).
The stability of the individual GTc was strongly pH-dependent and gradually decreased with increasing pH (Figure S2, Table S3). In the pH range of 4.0–9.0, GTc were positively charged due to their pHPZC of 9.3 in our study. Thus, the increased protonation led to a stronger electrostatic repulsion, thus resulting in an increased stability [3]. At pH 4, in the presence of GTc, a decreased stability of the mixed soil colloid–GTc systems was observed to varying degrees in comparison to the individual soil colloids (Figure 1a–f). In both the FSc–GT and BSc–GT systems, the stability just maintained or decreased slightly. However, GTc caused a remarkable settling phenomenon in the YSc-GTc system, which was indicated by the increased Vs values (1.75 × 10⁻³ m h−1), C’res (0.074), and hydrodynamic sizes (1890.7 nm) in comparison to the individual YSc (Figure S2, Table S2). The FSc concentration was the lowest in this study, indicating that the colloidal concentration had little contribution for heteroaggregation bewteen soil colloids and GTc. Under neutral pH conditions, all of the soil colloid–GTc systems showed a slightly increased stability in the presence of GTc (Figure 1, Table 1 and Table S1). The mixed soil colloid–GTc systems displayed slightly decreased hydrodynamic sizes compared with the individual soil colloids, thus indicating that aggregation did not occur in the presence of GTc. At pH 7.0, the GTc exhibited similar sedimentation curves as those for the soil colloids (Figure S2, Figure 1a–c) with similar Vs values (1.05 × 10⁻³~1.61 × 10⁻³ m h−1) (Tables S1 and S2). However, the hydrodynamic size of the GTc (382.8 nm) was much smaller than that of the soil colloids (453.9~579.1 nm) (Table 1 and Table S2). Therefore, the addition of GTc with relatively small sizes slightly increased the stability of the soil colloid–GTc systems.
The mixed soil colloid–GTc systems exhibited different settling behaviors at pH 9.0 in comparison to the individual soil colloids. The mixed BSc and YSc systems showed slightly lower settling curves, whereas the mixed FSc systems presented the opposite trend (Figure 1d–f). Thus, a slightly increased settling was observed for the mixed BSc and YSc systems. The previously low stability of the FSc became more stable in the presence of the GTc.
The presence of HA enhanced the stability of all of the soil colloid-HA systems, and there was little variation in settling with pH (Figure 1g–i). This was consistent with the understanding that organic matter can increase the negative charge on the surface of colloids, whereby the electrostatic repulsive force has a greater effect on colloid stability [11,45,46].
Thus, the stability of soil colloids was closely related to their properties, which was consistent with the results in a previous study [47]. Meanwhile, the environmental pH and ionic strength also played a significant role in soil colloid stability. In general, soil colloids exhibited a relatively higher stability at high pH (i.e., 9.0), which should have mainly resulted from the stronger electrostatic repulsions due to the increased deprotonation on the negatively charged soil colloid surface. On the contrary, the FSc with a high ionic strength (indicated by Ca2+) showed the lowest stability compared to other soil colloids at same pH. When the ionic strength increased, the colloidal surface double electric layer would have compressed and the electrostatic repulsion between the colloidal particles would have decreased, thus leading to an increased colloidal attraction and decreased stability. Humic acid significantly enhanced the stability of all soil colloids at pH 4.0, which led to highly consistent settling curves for the soil colloids at different pH. GT colloids displayed a relatively complicated impact with the stability of the YSc, which significantly decreased at pH 4.0.
3.3. Transport of Different Soil Colloids in the Simulated Saturated Medium
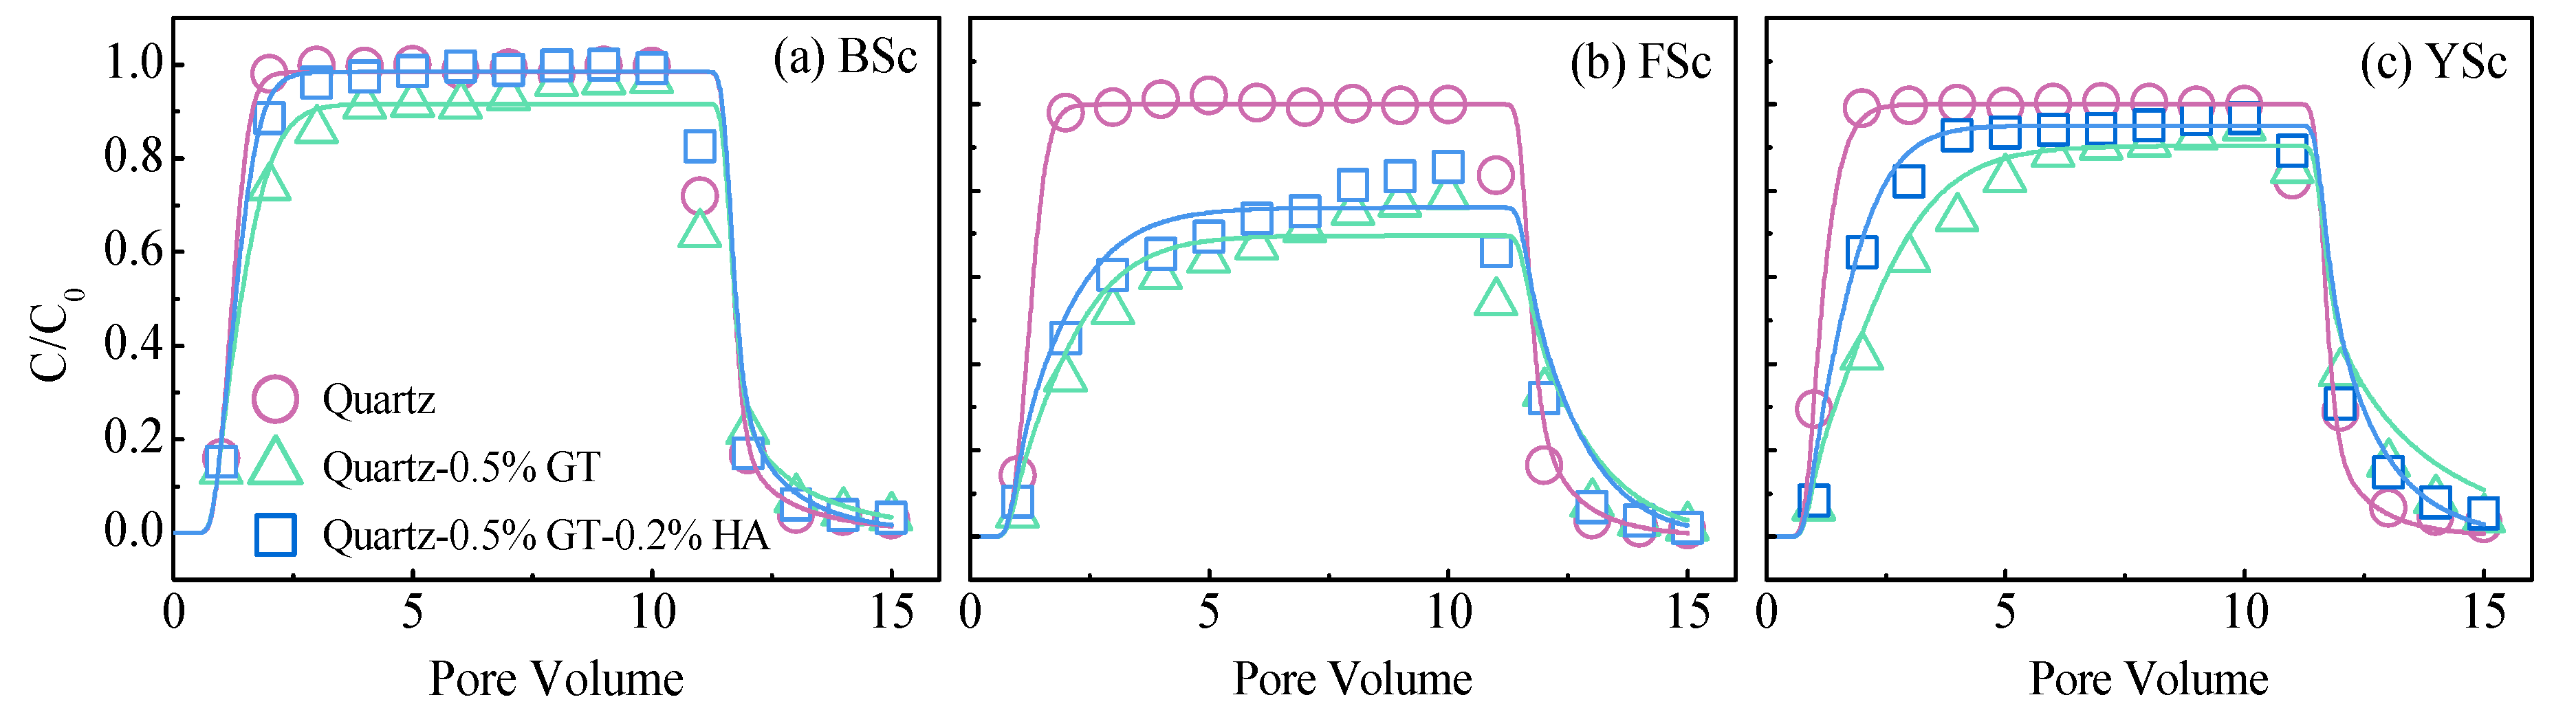
The mobility of soil colloids at pH 7.0 was evaluated using transport experiments in the pure quartz sand, GT coated sand, and GT–HA coated sand columns. The observed and simulated breakthrough curves (BTCs) for the transport of soil colloids are shown in Figure 2. The fitted parameters of the colloid transport model are presented in Table S3. Although all soil colloids exhibited significant settling (Figure 1a–c), their transport in the quartz sand column was very rapid, with high liquid recoveries that ranged from 100.1% to 105.4% (Figure 2 and Table S3). This indicated that quartz sand with a large particle size (average of 337.5 μm) had little effect on retarding the transport of the soil colloids, regardless of soil type (Table 2). Our previous study suggested that soil colloids moderately transported in natural sand with an average particle size of 70 mm at pH 7.2 [34]. Although the small collector caused a straining effect and thus decreased colloid transport, mineral substances on the sand were responsible for the retardation of transport.
Despite the fact that all of the soil colloid–GTc systems maintained their stability in the presence of GT when compared with the individual soil colloids under neutral conditions (Figure 1a–f), the transport of soil colloids was retarded in the GT coated sand columns (Figure 2). Although colloidal retention can be well simulated by the model, it is difficult to compare the observed values and fitting values due to inseparable soil colloids and GT in the columns. However, the recoveries of 93.0%, 87.8%, and 68.8% could still be used as evidence to show that the transport gradually decreased with an order of BSc > YSc > FSc (Figure 2 and Table S3). This order was consistent with that of the C’res (Table S2). In the FSc transport experiment, the relatively high ionic strength of the solution enhanced the attachment of soil colloids [48]. In addition to attachment, a straining effect may occur; however, this influence should have been very small due to the small diameter ratio of the colloid to the collector [4]. In the presence of the GT–HA coated sand, the transport of soil colloids was enhanced compared with that in the GT coated sand column, but the transport capacity was not up to the level of that in the pure sand columns (Figure 2). A similar increase in the breakthrough (C/C0) was observed in a study of HA enhanced transport of biochar colloids [49], which indicated that HA has the ability to accelerate the transport of negatively charged colloids. Humic acid and dissolved organic matter (DOM) released from HA decreased the zeta potential of the GT coated sand and soil colloids, respectively (Table 1). Our previous study reported a similar phenomenon, whereby an enhanced transport of ferrihydrite nanoparticles in columns of sand coated with agricultural organic inputs was observed [39]. In the present study, although the favorable conditions caused by the HA were beneficial to the transport of soil colloids compared with that of the pure sand column, the transport was still slower than that in the absence of GT and HA. The mechanisms are discussed in detail in Section 3.4.
3.4. Mechanism of Sedimentation and Transport of Different Soil Colloids
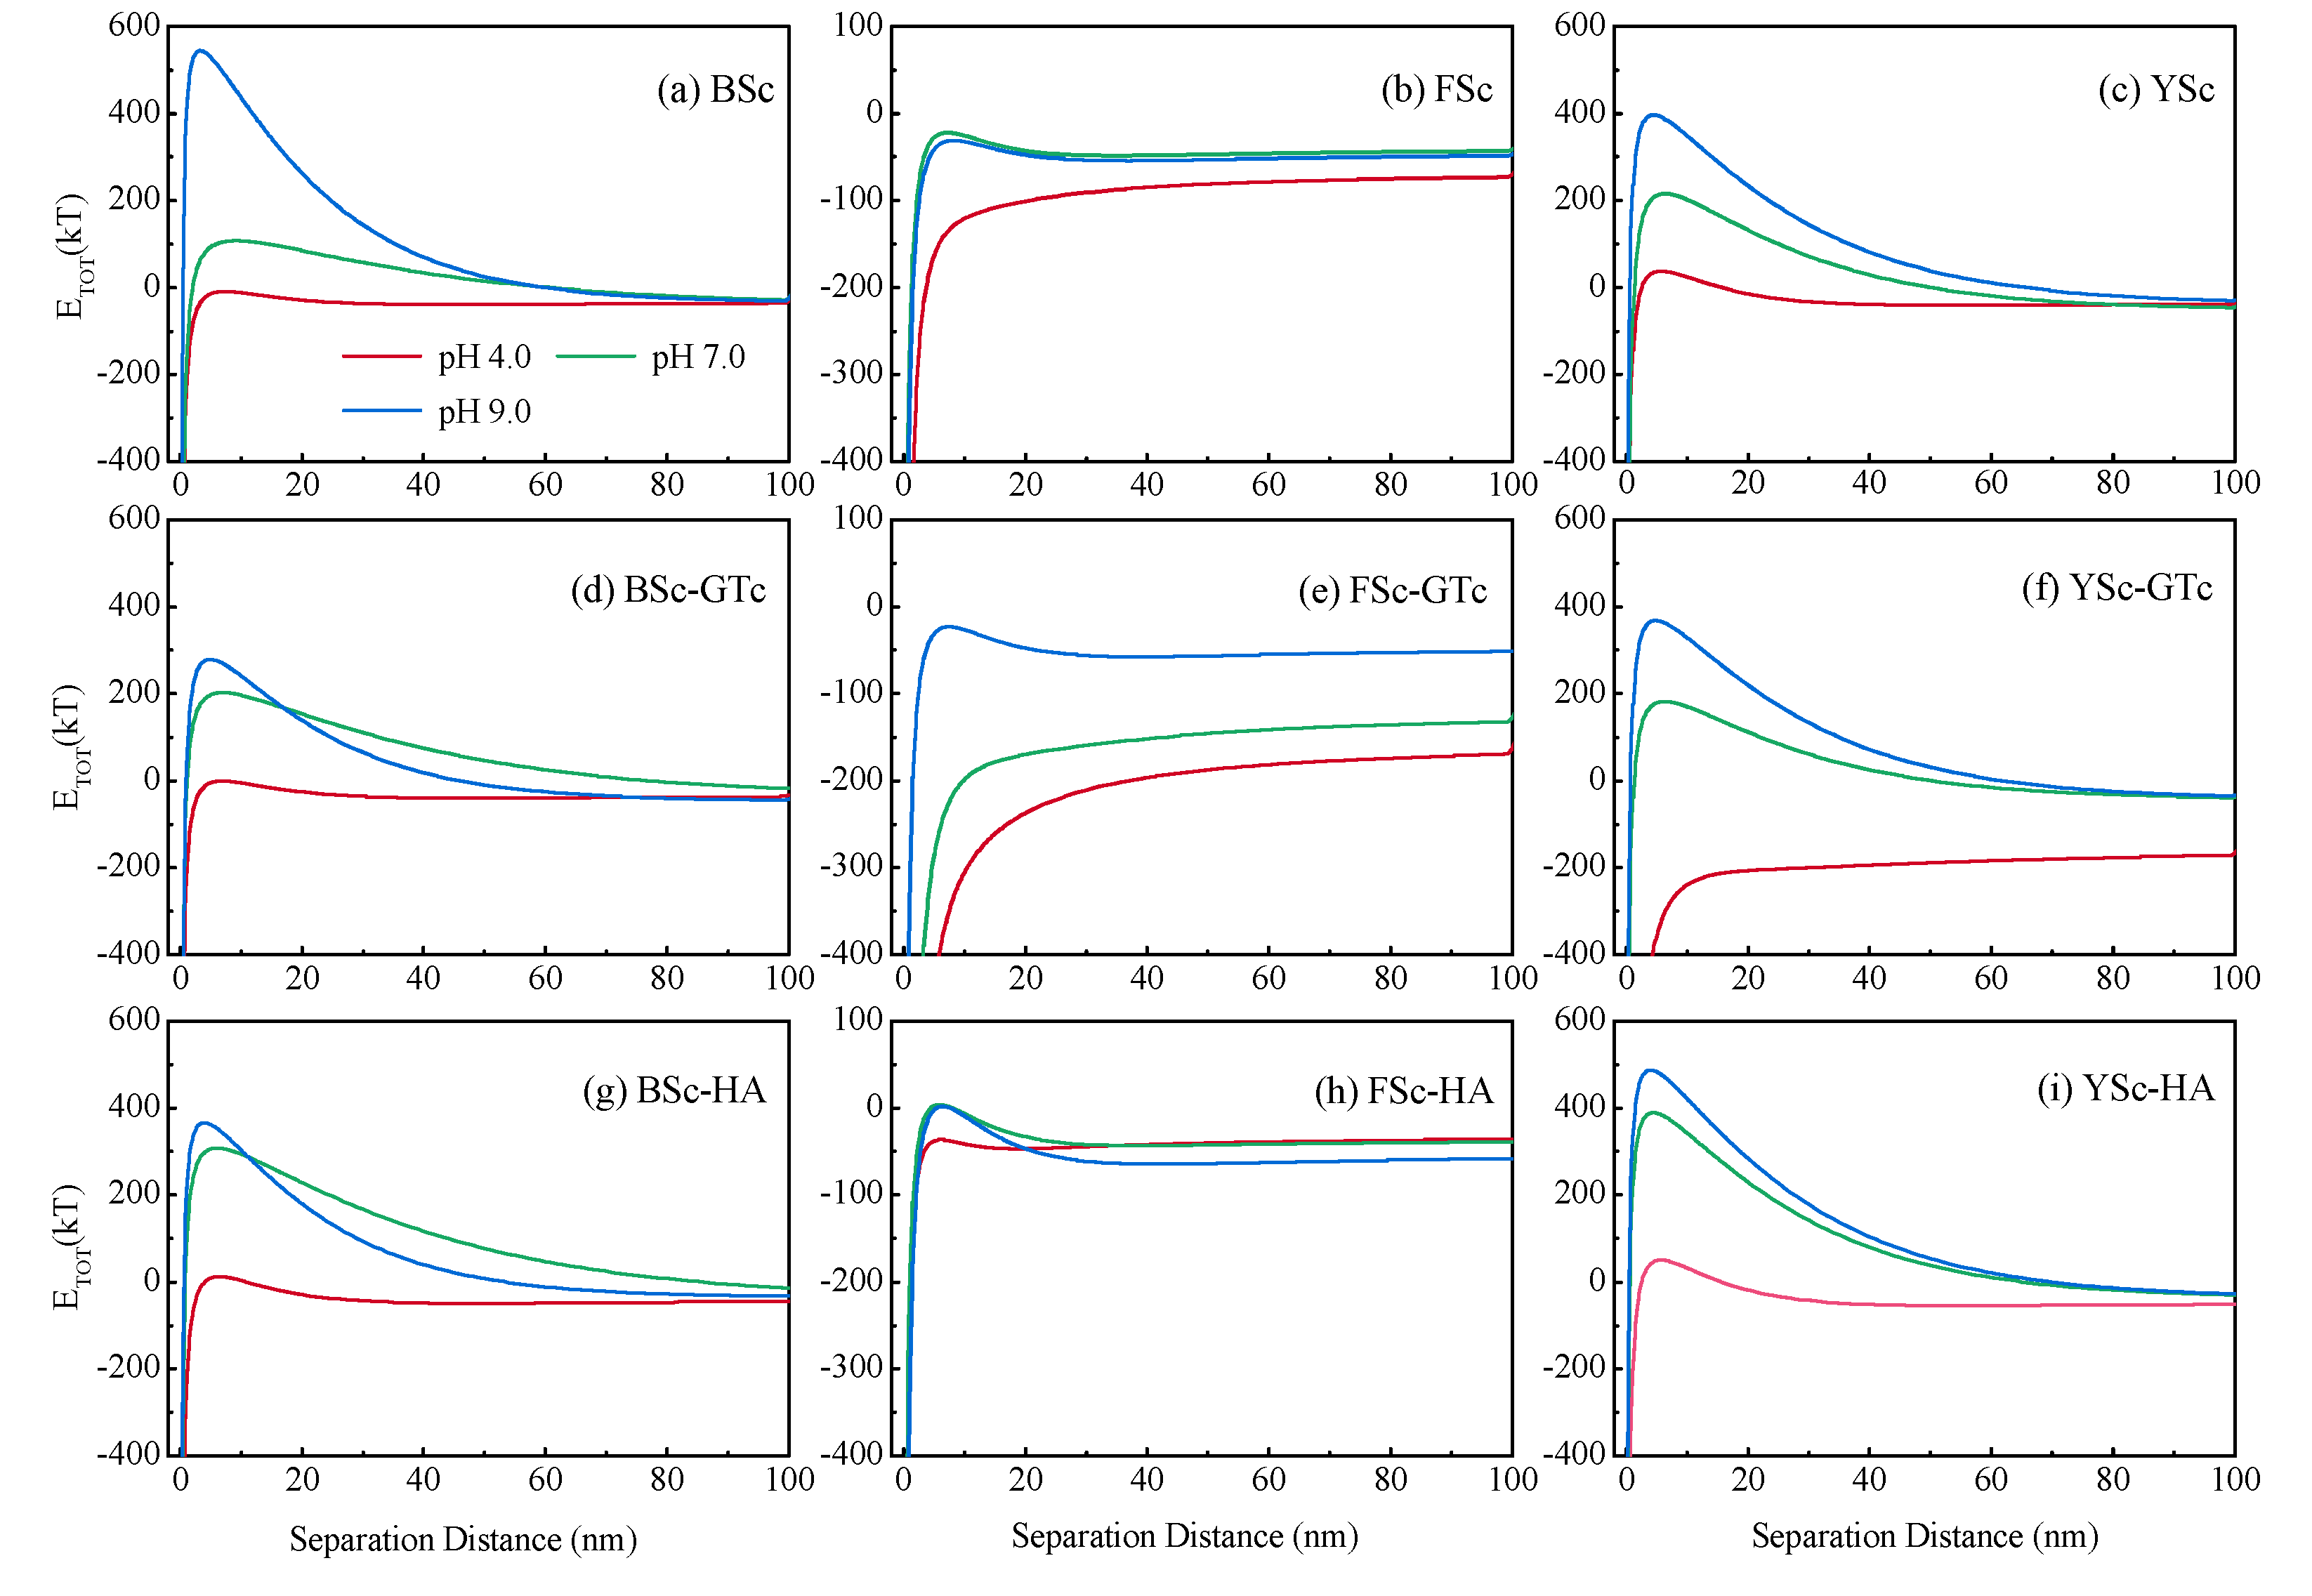
The DLVO theory was used to calculate the interaction energy in the different settlement systems. The parameters used in the DLVO calculation are listed in Table 1. The results and energy barriers are shown in Figure 3 and Table S4, respectively and explain the settling trends of the various soil colloids. In general, the DLVO results for the soil colloids were consistent with the transport characteristics in the absence of HA (Figure 1a–f and Figure 3a–f). In most cases, the highest primary energy barriers (279.2~544.2 kT) were observed at pH 9.0, and the primary energy barriers were either absence or very low (11.8~50.2 kT) at pH 4.0 (Table S4). The primary energy barriers exhibited a pH-dependence whereby they decreased with decreasing pH.
For the individual soil colloids system, the average primary energy barrier of the BSc (217.3 kT) was similar to that of the YSc (216.7 kT) and thus both showed good stabilities (Figure 3 and Table S4). There was no primary energy barrier for the FSc, which therefore had a relatively poor stability (Figure 3). This was attributable to the ionic strength, especially Ca2+, which hampered the colloidal stability [50]. Although the primary energy barrier of the YSc (215.6 kT) was higher than that of the BSc (107.7 kT) at pH 7.0 (Figure 3a,c and Table S4), a relatively high DOC concentration (10.6 mg L−1) in BSc suspension enhanced the colloidal stability. Although relatively high concentrations of BSc and YSc (Table 2) had high probability of collisions [51], low sedimentation indicated that the colloidal concentration was not the main controlling factor for deposition.
For the coexistence system of soil colloids and GTc, a decrease in the primary energy barriers occurred for the BS at pH 7.0 and 9.0. (Figure 3a,d and Table S4). However, the colloidal stability changed little and there were only small discrepancies in the Vs values and C’res (Figure 1a,d and Table S1). Although the presence of positively charged GTc enhanced the sedimentation of negatively charged soil colloids, the protonation of the carboxylic and phenolic groups in organic-rich colloids increased the repulsion of positively charged colloids, thereby resulting in a limited heteroagglomeration.
The primary energy barriers of the FSc in the GTc coexistence system remained below 0 (Table S4), and the electrical double-layer attraction further increased. Therefore, the stability of the FSc was either maintained or decreased further at pH 4.0 and 7.0. The increase in pH caused the deprotonation of surface hydroxyl groups and the development of a negative surface charge for the GTc [50]. Therefore, under alkaline conditions, the deprotonation of the surface of the GTc decreased the attraction between the GTc and negatively charged soil colloids.
The settling of the YSc was stable in the GTc coexistence system at pH 7.0 and 9.0 in comparison to that of the individual system due to little change in the primary energy barriers (Table S4). However, the primary energy barriers decreased from 38.2 kT to less than 0 kT at pH 4.0, thus causing an accelerated settling (Table S4). In the YSc, kaolinite (Figure S1), which is negatively charged in the natural environment [52], remained flocculated at pH < 7.5 due to the strong attraction of oppositely charged crystal faces [53]. Moreover, a previous study indicated that the abundance of kaolinite in soil colloids contributed to their accelerated decreased stability with decreasing pH [54]. Under a low pH, although the individual YSc did not show an obvious settling trend (Figure 1c), the protonation of kaolinite might have led to the heteroagglomeration between kaolinite and GT as well as the homoaggregation of kaolinite. In the individual and coexistence GTc systems, the DLVO model essentially analyzed the stability of soil colloid.
In the presence of a high HA concentration, the primary energy barriers generally increased (with the exception of the BSc at pH 9.0 (Figure 3 and Table S4) due to a decrease in the negative zeta potential from −39.9 mV to −34.3 mV) (Table 1). However, the DLVO results (Figure 3g–i) were clearly inconsistent with the characteristics of settlement (Figure 3g–i). Although the primary energy barriers of the different soil colloids varied with pH, the stability barely changed at different pH values, even between the various soil colloids (Figure 1g–i). Humic acid loaded onto soil colloids significantly changed the properties of the colloidal surface and thus caused electrical double layer, osmotic repulsion, and elastic-steric repulsion [4,22,28]. However, osmotic repulsion and elastic-steric repulsion were not calculated in the DLVO. This effect was similar for the different soil colloids after the saturated adsorption of HA at different pH values. In addition, the adsorption of HA masked the positive charge adsorption points, such as those of Fe minerals and adsorbed cations, and thus caused a uniformization of heterogeneity on soil colloids. Therefore, the DLVO model unsuccessfully analyzed the stability of soil colloids in the presence of HA.
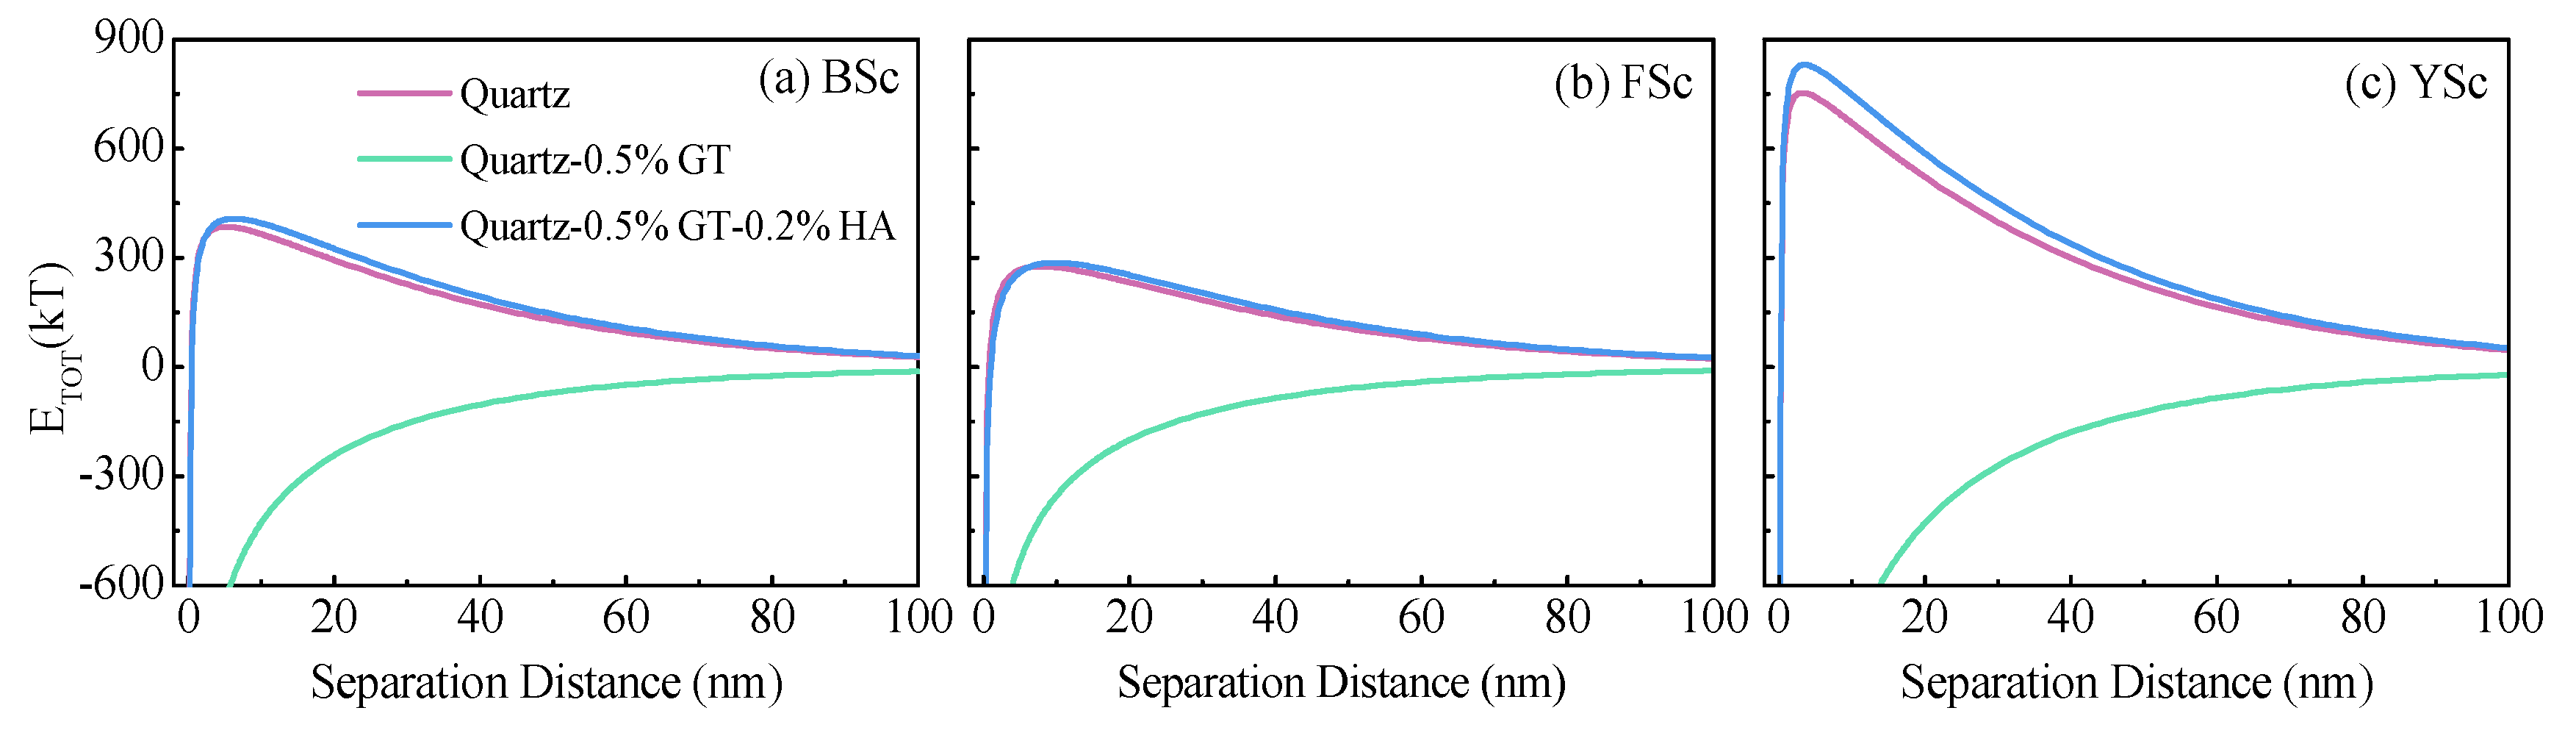
The DLVO theory was also used to calculate the interaction energy between soil colloids and collectors. The results and energy barriers are shown in Figure 4 and Table S5, respectively, which explain the trends in the transport of the soil colloids. In the pure quartz sand columns, the primary energy barriers were relatively high due to the negative charge of the soil colloids and sand; hence, soil colloids rapidly transported in the quartz porous media (Figure 4). In the presence of GT, the zeta potential of the collector transformed from negative (−34.5 mV) to positive (15.2 mV) (Table 1), which caused the disappearance of the primary energy barriers (Figure 4 and Table S5). Therefore, soil colloids readily fell into the primary energy minimum and thus deposited on the GT coated sand. In comparison, the transport of the FSc was the slowest. The YSc with the relatively larger hydrodynamic size caused the filtration effect to retard the transport of soil colloids. In addition, an increase in the surface roughness due to GT may have also hampered their transport [39,55]. Although HA provided more favorable conditions for the transport of soil colloids in comparison to the pure sand column and thus caused higher primary energy barriers (Figure 4 and Table S5), the transport of the three different soil colloids in the GT–HA coated columns were all still slower. This indicates that the retardation effect of GT on colloidal transport was significant in the presence of HA. Moreover, the HA coatings on the sand caused the retention of oxide-rich soil colloids due to the high affinity between HA and oxide minerals [56]. This effect was the greatest for the FSc and least for the BSc (Figure 2). The properties of soil colloids also played an essential role. Similar to sedimentation, the DOC enhanced the transport of BSc, ionic strength retarded the transport of FSc, and the colloidal concentration had little influence on the transport of soil colloids. In addition, the filtration effect and an increased surface roughness still occurred in the presence of GT and HA.
4. Conclusions
Iron oxides and HA are ubiquitous in natural environmental systems, especially in soil, and they play essential roles in geochemical heterogeneity. In this study, the effects of GT and HA on the sedimentation and transport of soil colloids were investigated using settling and column experiments. Our results showed that the sedimentation of soil colloids was pH-dependent. Colloids in individual and GTc coexistence systems tended to stabilize at high pH, and the stability decreased with decreasing pH. Overall, the stability and transport of soil colloids were related to the properties of the soil colloids and decreased in the order of BSc > YSc > FSc. Goethite colloid only obviously accelerated the sedimentation of YSc at pH 4.0 due to the interaction of GTc and kaolinite with YSc. However, the retardation effect of GTc on soil colloid transport was relatively obvious at pH 7.0. The addition of GT transformed the surface charge of sand from negative to positive and thus increased the electrical double-layer attraction, which was beneficial for the deposition of soil colloids. Organic matter in the BSc and DOC in the colloidal suspension enhanced the colloidal dispersion and transport due to an increased negative charge. The addition of HA had a stabilizing effect on the sedimentation of soil colloids, especially at pH 4.0, and it obscured the pH-dependent sedimentation of soil colloids. Although GT–HA coated sand provided the most favorable conditions for the transport of soil colloids, transport through this column was still slower than that in pure sand columns, thereby suggesting that the filtration effect, heterogeneity, and increased surface roughness may still influence the transport of soil colloids. As an important reaction interface and transport carrier in soil, the fate of soil colloids greatly affects the distribution of nutrients and pollutants. Our findings suggest that soil type and important aspects of soil composition (GT and HA) both affect the dispersion and transport of soil colloids and further regulate the soil microenvironment.
Supplementary Materials
The following are available online at https://www.mdpi.com/2073-4441/12/4/980/s1, S1: Colloid transport models, S2: XRD analysis of soil colloids (Figure S1: XRD analysis of soil colloids at pH 7.0), S3: Exponential-model-fitted parameters of settling experiments (Table S1: Exponential-model-fitted parameters of soil colloids and mixed soil colloid-HA/GT at pH 4.0, 7.0, and 9.0.), S4: Sedimentation kinetics of goethite colloid at different pH (Figure S2: Sedimentation kinetics of goethite (GT) colloid at pH 4.0, 7.0, and 9.0. Symbols show observed data and lines show simulation fitting. Table S2: Particle size and zeta potential of the goethite (GT) colloid and exponential-model-fitted parameters of goethite (GT) colloid at pH 4.0, 7.0, and 9.0.), S5: Fitting parameters of transport experiments (Table S3: Fitted and experimental parameters of transport of soil colloids in the sand, 0.5% GT mixed sand, and 0.5% GT-0.2% HA sand columns at pH 7.0.), S6: The DLVO energy barriers for settling and transport systems (Table S4: The DLVO energy barriers for settling systems. Table S5: The primary energy barriers for transport systems.).
Author Contributions
Data curation, X.W.; Funding acquisition, Y.C. and J.M.; Methodology, J.M.; Resources, L.W.; Supervision, L.W. and Y.L.; Writing—original draft, Y.C. and J.M.; Writing—review & editing, Y.C. and J.M. All authors have read and agreed to the published version of the manuscript.
Funding
This research was funded by the National Natural Science Foundation of China (Nos. 41701355 and 41701262), the National Key Research and Development Program of China (2017YFD0801003), Natural Science Foundation of Tianjin City (19JCQNJC08500 and 17JCQNJC08100), Central Public-interest Scientific Institution Basal Research Fund (Y2020PT03 and 2020-jbkyywf-mj).
Acknowledgments
Thanks are given to the anonymous reviewers and editors for their constructive comments.
Conflicts of Interest
The authors declare no conflict of interest.
References
- Kretzschmar, R.; Schäfer, T. Metal retention and transport on colloidal particles in the environment. Elements 2005, 1, 205–210. [Google Scholar]
- Yin, X.; Gao, B.; Ma, L.Q.; Saha, U.K.; Sun, H.; Wang, G. Colloid-facilitated Pb transport in two shooting-range soils in Florida. J. Hazard. Mater. 2010, 177, 620–625. [Google Scholar]
- Chen, Y.; Ma, J.; Li, Y.; Weng, L. Enhanced cadmium immobilization in saturated media by gradual stabilization of goethite in the presence of humic acid with increasing pH. Sci. Total Environ. 2019, 648, 358–366. [Google Scholar]
- Ma, J.; Guo, H.; Lei, M.; Li, Y.; Weng, L.; Chen, Y.; Ma, Y.; Deng, Y.; Feng, X.; Xiu, W. Enhanced transport of ferrihydrite colloid by chain-shaped humic acid colloid in saturated porous media. Sci. Total Environ. 2018, 621, 1581. [Google Scholar]
- Fritzsche, A.; Rennert, T.; Totsche, K.U. Arsenic strongly associates with ferrihydrite colloids formed in a soil effluent. Environ. Pollut. 2011, 159, 1398–1405. [Google Scholar]
- Ma, J.; Guo, H.; Weng, L.; Li, Y.; Lei, M.; Chen, Y. Distinct effect of humic acid on ferrihydrite colloid-facilitated transport of arsenic in saturated media at different pH. Chemosphere 2018, 212, 794–801. [Google Scholar]
- Szabolcs, C.; Markus, F.; Harsh, J.B. Colloid stability in vadose zone Hanford sediments. Environ. Sci. Technol. 2005, 39, 1506–1512. [Google Scholar]
- Igwe, C.A.; Akamigbo, F.O.R.; Mbagwu, J.S.C. Chemical and mineralogical properties of soils in southeastern Nigeria in relation to aggregate stability. Geoderma 1999, 92, 111–123. [Google Scholar]
- Ma, J.; Lei, M.; Weng, L.; Li, Y.; Chen, Y.; Islam, M.S.; Zhao, J.; Chen, T. Fractions and colloidal distribution of arsenic associated with iron oxide minerals in lead-zinc mine-contaminated soils: Comparison of tailings and smelter pollution. Chemosphere 2019, 227, 614–623. [Google Scholar]
- Zhou, D.; Wang, D.; Cang, L.; Hao, X.; Chu, L. Transport and re-entrainment of soil colloids in saturated packed column: Effects of pH and ionic strength. J. Soils Sediments 2011, 11, 491–503. [Google Scholar]
- Zhu, X.; Chen, H.; Li, W.; He, Y.; Brookes, P.C.; White, R.; Xu, J.M. Evaluation of the stability of soil nanoparticles: The effect of natural organic matter in electrolyte solutions. Eur. J. Soil Sci. 2017, 68, 105–114. [Google Scholar]
- Yan, J.; Lazouskaya, V.; Jin, Y. Soil colloid release affected by dissolved organic matter and redox conditions. Vadose Zone J. 2016, 15, 1–10. [Google Scholar]
- Igwe, C.A.; Zarei, M.; Stahr, K. Colloidal stability in some tropical soils of southeastern Nigeria as affected by iron and aluminium oxides. Catena 2009, 77, 232–237. [Google Scholar]
- Hou, T.; Xu, R.; Tiwari, D.; Zhao, A. Interaction between electrical double layers of soil colloids and Fe/Al oxides in suspensions. J. Colloid Interface Sci. 2007, 310, 670–674. [Google Scholar]
- Barton, C.D.; Karathanasis, A.D. Influence of soil colloids on the migration of atrazine and zinc through large soil monoliths. Water Air Soil Pollut. 2003, 143, 3–21. [Google Scholar]
- Ryan, J.N.; Gschwend, P.M. Colloid mobilization in two Atlantic coastal plain aquifers: Field studies. Water Resour. Res. 1990, 26, 307–322. [Google Scholar]
- Frenkel, H.; Levy, G.J.; Fey, M.V. Organic and inorganic anion effects on reference and soil clay critical flocculation concentration. Soil Sci. Soc. Am. J. 1992, 56, 1762–1766. [Google Scholar]
- Wang, X.; Zhang, D.; Qian, H.; Liang, Y.; Pan, X.; Gadd, G.M. Interactions between biogenic selenium nanoparticles and goethite colloids and consequence for remediation of elemental mercury contaminated groundwater. Sci. Total Environ. 2018, 613–614, 672–678. [Google Scholar]
- Ji, Y.; Luo, W.; Lu, G.; Fan, C.; Tao, X.; Ye, H.; Xie, Y.; Shi, Z.; Yi, X.; Dang, Z. Effect of phosphate on amorphous iron mineral generation and arsenic behavior in paddy soils. Sci. Total Environ. 2019, 657, 644–656. [Google Scholar]
- Wang, D.; Shen, C.; Jin, Y.; Su, C.; Chu, L.; Zhou, D. Role of solution chemistry in the retention and release of graphene oxide nanomaterials in uncoated and iron oxide-coated sand. Sci. Total Environ. 2017, 579, 776–785. [Google Scholar]
- Oriekhova, O.; Stoll, S. Heteroaggregation of CeO2 nanoparticles in presence of alginate and iron (III) oxide. Sci. Total Environ. 2019, 648, 1171–1178. [Google Scholar]
- Wang, D.; Jin, Y.; Jaisi, D.P. Effect of size-selective retention on the cotransport of hydroxyapatite and goethite nanoparticles in saturated porous media. Environ. Sci. Technol. 2015, 49, 8461–8470. [Google Scholar]
- Hunter, R.J.; White, L.R. Foundations of Colloid Science; Clarendon Press: Oxford, UK, 1987. [Google Scholar]
- Kretzschmar, R.; Holthoff, H.; Sticher, H. Influence of pH and humic acid on coagulation kinetics of kaolinite: A dynamic light scattering study. J. Colloid Interface Sci. 1998, 202, 95–103. [Google Scholar]
- Suarez, D.L.; Rhoades, J.D.; Lavado, R.; Grieve, C.M. Effect of pH on saturated hydraulic conductivity and soil dispersion. Soil Sci. Soc. Am. J. 1984, 48, 50–55. [Google Scholar]
- Kosmulski, M. IEP as a parameter characterizing the pH-dependent surface charging of materials other than metal oxides. Adv. Colloid Interface Sci. 2012, 171–172, 77–86. [Google Scholar]
- Deng, Y.; Li, Y.; Li, X.; Sun, Y.; Ma, J.; Lei, M.; Weng, L. Influence of calcium and phosphate on pH dependency of arsenite and arsenate adsorption to goethite. Chemosphere 2018, 199, 617–624. [Google Scholar]
- Wang, D.; Zhang, W.; Zhou, D. Antagonistic effects of humic acid and iron oxyhydroxide grain-coating on biochar nanoparticle transport in saturated sand. Environ. Sci. Technol. 2013, 47, 5154–5161. [Google Scholar]
- Roy, S.B.; Dzombak, D.A. Chemical factors influencing colloid-facilitated transport of contaminants in porous media. Environ. Sci. Technol. 1997, 31, 656–664. [Google Scholar]
- Saiers, J.E.; Hornberger, G.M. The role of colloidal kaolinite in the transport of cesium through laboratory sand columns. Water Resour. Res. 1996, 32, 33–41. [Google Scholar]
- Shani, C.; Weisbrod, N.; Yakirevich, A. Colloid transport through saturated sand columns: Influence of physical and chemical surface properties on deposition. Colloids Surf. A 2008, 316, 142–150. [Google Scholar]
- Valdrighi, M.M.; Pera, A.; Agnolucci, M.; Frassinetti, S.; Lunardi, D.; Vallini, G. Effects of compost-derived humic acids on vegetable biomass production and microbial growth within a plant (Cichorium intybus)-soil system: A comparative study. Agric. Ecosyst. Environ. 1996, 58, 133–144. [Google Scholar]
- Venema, P.; Hiemstra, T.; Weidler, P.G.; Riemsdijk, W.H.V. Intrinsic proton affinity of reactive surface groups of metal (hydr)oxides: Application to iron (hydr)oxides. J. Colloid Interface Sci. 1998, 198, 282–295. [Google Scholar]
- Ma, J.; Guo, H.; Lei, M.; Wan, X.; Zhang, H.; Feng, X.; Wei, R.; Tian, L.; Han, X. Blocking effect of colloids on arsenate adsorption during co-transport through saturated sand columns. Environ. Pollut. 2016, 213, 638–647. [Google Scholar]
- Chappell, M.A.; George, A.J.; Dontsova, K.M.; Porter, B.E.; Price, C.L.; Zhou, P.; Morikawa, E.; Kennedy, A.J.; Steevens, J.A. Surfactive stabilization of multi-walled carbon nanotube dispersions with dissolved humic substances. Environ. Pollut. 2009, 157, 1081–1087. [Google Scholar]
- Lin, D.; Ji, J.; Long, Z.; Yang, K.; Wu, F. The influence of dissolved and surface-bound humic acid on the toxicity of TiO2 nanoparticles to Chlorella sp. Water Res. 2012, 46, 4477–4487. [Google Scholar]
- Long, Z.; Ji, J.; Yang, K.; Lin, D.; Wu, F. Systematic and quantitative investigation of the mechanism of carbon nanotubes toxicity toward algae. Environ. Sci. Technol. 2012, 46, 8458–8466. [Google Scholar]
- Ma, S.; Zhou, K.; Yang, K.; Lin, D. Heteroagglomeration of oxide nanoparticles with algal cells: Effects of particle type, ionic strength and pH. Environ. Sci. Technol. 2015, 49, 932–939. [Google Scholar]
- Qian, X.; Ma, J.; Weng, L.; Chen, Y.; Ren, Z.; Li, Y. Influence of agricultural organic inputs and their aging on the transport of ferrihydrite nanoparticles: From enhancement to inhibition. Sci. Total Environ. 2020, 719, 137440. [Google Scholar]
- Bradford, S.A.; Simunek, J.; Bettahar, M.; van Genuchten, M.T.; Yates, S.R. Modeling colloid attachment, straining, and exclusion in saturated porous media. Environ. Sci. Technol. 2003, 37, 2242–2250. [Google Scholar]
- Yu, B.; Jia, S.Y.; Liu, Y.; Wu, S.H.; Han, X. Mobilization and re-adsorption of arsenate on ferrihydrite and hematite in the presence of oxalate. J. Hazard. Mater. 2013, 262, 701–708. [Google Scholar]
- Zhao, W.; Walker, S.L.; Huang, Q.; Cai, P. Adhesion of bacterial pathogens to soil colloidal particles: Influences of cell type, natural organic matter, and solution chemistry. Water Res. 2014, 53, 35–46. [Google Scholar]
- Yu, Z.; Zhang, J.; Zhang, C.; Xin, X.; Li, H. The coupling effects of soil organic matter and particle interaction forces on soil aggregate stability. Soil Tillage Res. 2017, 174, 251–260. [Google Scholar]
- Gregory, J. Approximate expression for retarded van der Waals interaction. J. Colloid Interface Sci. 1981, 83, 138–145. [Google Scholar]
- Jekel, M. The stabilization of dispersed mineral particles by adsorption of humic substances. Water Res. 1986, 20, 1543–1554. [Google Scholar]
- Kretzschmar, R.; Robarge, W.P.; Amoozegar, A. Influence of natural organic matter on colloid transport through saprolite. Water Resour. Res. 1995, 31, 435–445. [Google Scholar]
- Shang, S.; Wang, F.; Li, C. Study on stability and mobility of soil colloids based on physicochemical property (in Chinese). Soils 2010, 42, 1015–1019. [Google Scholar]
- Esfandyari Bayat, A.; Junin, R.; Derahman, M.N.; Samad, A.A. TiO(2) nanoparticle transport and retention through saturated limestone porous media under various ionic strength conditions. Chemosphere 2015, 134, 7–15. [Google Scholar]
- Yang, W.; Wang, Y.; Shang, J.; Liu, K.; Sharma, P.; Liu, J.; Li, B. Antagonistic effect of humic acid and naphthalene on biochar colloid transport in saturated porous media. Chemosphere 2017, 189, 556–564. [Google Scholar]
- Walsch, J.; Dultz, S. Effects of pH, Ca- and SO4-concentration on surface charge and colloidal stability of goethite and hematite—Consequences for the adsorption of anionic organic substances. Clay Miner. 2018, 45, 1–13. [Google Scholar]
- Fang, J.; Shijirbaatar, A.; Lin, D.H.; Wang, D.J.; Shen, B.; Sun, P.D.; Zhou, Z.Q. Stability of co-existing ZnO and TiO2 nanomaterials in natural water: Aggregation and sedimentation mechanisms. Chemosphere 2017, 184, 1125–1133. [Google Scholar]
- Yan, C.; Cheng, T.; Shang, J. Effect of bovine serum albumin on stability and transport of kaolinite colloid. Water Res. 2019, 155, 204–213. [Google Scholar]
- Tama, K.; El-Swaify, S.A. Charge, colloidal and structural stability interrelationships for oxidic soils. In Modification of Soil Structure; John Wiley & Sons: New York, NY, USA, 1978; pp. 41–49. [Google Scholar]
- Seta, A.K.; Karathanasis, A.D. Stability and transportability of water-dispersible soil colloids. Soil Sci. Soc. Am. J. 1997, 61, 604–611. [Google Scholar]
- Shen, C.; Li, B.; Wang, C.; Huang, Y.; Jin, Y. Surface roughness effect on deposition of nano- and micro-sized colloids in saturated columns at different solution ionic strengths. Vadose Zone J. 2011, 10, 1071–1081. [Google Scholar]
- Tombácz, E.; Libor, Z.; Illés, E.; Majzik, A.; Klumpp, E. The role of reactive surface sites and complexation by humic acids in the interaction of clay mineral and iron oxide particles. Org. Geochem. 2004, 35, 257–267. [Google Scholar]
Figure 1.
Sedimentation kinetics at pH 4.0 (red symbols), 7.0 (green symbols), and 9.0 (blue symbols) for (a–c) soil colloids, (d–f) soil colloids–goethite colloids (GTc), and (g–i) soil colloids–humic acid (HA). Treatments with (a,d,g) black soil colloids (BSc) (squares), (b,e,h) fluvo-aquic soil colloid (FSc) (triangles), and (c,f,i) yellow soil colloids (YSc) (circles). The concentrations of GTc and HA were both 25 mg L−1. Symbols show the observed data and the lines indicate the simulation fitting.

Figure 2.
Breakthrough curves of (a) black soil colloids (BSc), (b) fluvo-aquic soil colloids (FSc), and (c) yellow soil colloids (YSc) in the quartz sand column (purple circles), 0.5% GT mixed sand column (green triangles), and 0.5% GT and 0.2% HA sand column (blue squares) at pH 7.0.
Figure 2.
Breakthrough curves of (a) black soil colloids (BSc), (b) fluvo-aquic soil colloids (FSc), and (c) yellow soil colloids (YSc) in the quartz sand column (purple circles), 0.5% GT mixed sand column (green triangles), and 0.5% GT and 0.2% HA sand column (blue squares) at pH 7.0.

Figure 3.
DLVO interaction energy (ETOT) of soil colloids versus (a) black soil (BS) colloids, (b) fluvo-aquic soil (FS) colloids, (c) yellow soil (YS) colloids, (d) BS–goethite (GT), (e) FS–GT, (f) YD–GT, (g) BS–humic acid (HA), (h) FS–HA, and (i) YS–HA at pH 4.0 (red lines), 7.0 (green lines), and 9.0 (blue lines). The ETOT is expressed in kT, where k is the Boltzmann constant and T is the absolute temperature in Kelvin.

Figure 4.
DLVO interaction energy (ETOT) between soil colloids and sand (purple lines), sand coated with 0.5% goethite (GT) (green lines), and sand coated with 0.5% GT plus 0.2% humic acid (HA) (blue lines) for (a) black soil (BS), (b) fluvo-aquic soil (FS), and (c) yellow soil (YS). The ETOT is expressed in kT, where k is the Boltzmann constant and T is the absolute temperature in Kelvin.


Table 1.
Hydrodynamic sizes and zeta potential of the soil colloids, mixed colloids, and collector.
| Colloid/Collector | pH | Hydrodynamic Size (nm) | Zeta Potential (mV) |
|---|---|---|---|
| BSc | 4 | 398.0 | −16.5 |
| 7 | 453.9 | −22.1 | |
| 9 | 380.1 | −39.9 | |
| FSc | 4 | 806.9 | −14.2 |
| 7 | 473.3 | −17.7 | |
| 9 | 535.7 | −17.6 | |
| YSc | 4 | 425.7 | −21.0 |
| 7 | 579.1 | −29.7 | |
| 9 | 424.4 | −35.1 | |
| BSc-GTc | 4 | 398.9 | −17.4 |
| 7 | 398.8 | −26.4 | |
| 9 | 509.6 | −32.3 | |
| FSc-GT | 4 | 1863.8 | −13.9 |
| 7 | 453.3 | −17.3 | |
| 9 | 567.4 | −19.2 | |
| YSc-GTc | 4 | 1890.7 | −20.0 |
| 7 | 479.3 | −27.2 | |
| 9 | 483.7 | −34.7 | |
| BSc-HA | 4 | 498.0 | −20.5 |
| 7 | 432.0 | −31.1 | |
| 9 | 392.8 | −34.3 | |
| FSc-HA | 4 | 396.8 | −16.9 |
| 7 | 426.0 | −19.3 | |
| 9 | 644.7 | −22.9 | |
| YSc-HA | 4 | 561.3 | −24.1 |
| 7 | 419.9 | −34.8 | |
| 9 | 409.4 | −37.9 | |
| Quartz sand | 7 | - | −34.5 |
| GT coad sand | 7 | - | 15.2 |
| GT-HA coad sand | 7 | - | −39.2 |
Table 2.
Physicochemical properties of the soil samples and soil colloids.
| Item | Black Soil | Fluvo-Aquic Soil | Yellow Soil | |
|---|---|---|---|---|
| Soil | pH | 5.73 | 7.68 | 5.91 |
| TOC (g kg−1) | 38.8 | 13.7 | 14.6 | |
| CEC (cmol kg−1) | 44.0 | 10.8 | 8.1 | |
| Al (g kg−1) | 68.3 | 72.5 | 100.8 | |
| Ca (g kg−1) | 8.4 | 29.3 | 1.7 | |
| Fe (g kg−1) | 35.1 | 23.4 | 20.5 | |
| Sand (63~2000 μm) % | 10.8 | 20.9 | 16.4 | |
| Silt (4~63 μm) % | 88.9 | 79.0 | 83.2 | |
| Clay (<4 μm) % | 0.36 | 0.17 | 0.38 | |
| Soil colloidal suspension(pH = 7) | Colloid concentration (g L−1) | 0.88 | 0.34 | 0.63 |
| DOC (mg L−1) | 10.6 | 2.1 | 2.5 | |
| Conductivity (μS cm−1) | 7.4 | 85.2 | 10.8 | |
| Soil colloid (pH = 7) | Al (g kg−1) | 82.6 | 90.4 | 143.9 |
| Ca (g kg−1) | 10.3 | 51.1 | 4.5 | |
| Fe (g kg−1) | 49.9 | 58.1 | 59.5 | |
| K (g kg−1) | 11.1 | 27.2 | 13.7 | |
| Mg (g kg−1) | 12.9 | 23.2 | 3.7 | |
| Na (g kg−1) | 2.2 | 5.1 | 4.9 | |
© 2020 by the authors. Licensee MDPI, Basel, Switzerland. This article is an open access article distributed under the terms and conditions of the Creative Commons Attribution (CC BY) license (http://creativecommons.org/licenses/by/4.0/).
Share and Cite
MDPI and ACS Style
Chen, Y.; Ma, J.; Wu, X.; Weng, L.; Li, Y. Sedimentation and Transport of Different Soil Colloids: Effects of Goethite and Humic Acid. Water 2020, 12, 980. https://doi.org/10.3390/w12040980
AMA Style
Chen Y, Ma J, Wu X, Weng L, Li Y. Sedimentation and Transport of Different Soil Colloids: Effects of Goethite and Humic Acid. Water. 2020; 12(4):980. https://doi.org/10.3390/w12040980
Chicago/Turabian StyleChen, Yali, Jie Ma, Xiaojuan Wu, Liping Weng, and Yongtao Li. 2020. "Sedimentation and Transport of Different Soil Colloids: Effects of Goethite and Humic Acid" Water 12, no. 4: 980. https://doi.org/10.3390/w12040980
Note that from the first issue of 2016, this journal uses article numbers instead of page numbers. See further details here.