Indexing of Heatwaves in Ukraine


Department of Meteorology and Climatology, Taras Shevchenko National University of Kyiv, 64/13, Volodymyrska Street, 01601 Kyiv, Ukraine
*
Author to whom correspondence should be addressed.
Water 2020, 12(4), 962; https://doi.org/10.3390/w12040962
Submission received: 6 February 2020
/
Revised: 23 March 2020
/
Accepted: 25 March 2020
/
Published: 28 March 2020
(This article belongs to the Special Issue Understanding, Modelling and Mitigating Flood, Drought and other Extreme Weather Events)
Abstract
:During the last decades, the number of heatwaves (HWs) has increased worldwide, as well as in Ukraine. It is very important to determine the duration, intensity, and other HW parameters, in particular under climate change condition. For this purpose, various heatwave indices and characteristics are used. The aims of this study were (1) to investigate heatwave indices and their characteristics over the territory of Ukraine for the reference period 1981–2010, as well as to examine the extreme heatwave event of 2010 and (2) to make a comparison and establish a statistical relationship between the HW indices and their characteristics and to assess their suitability and sensitivity to changes in the modern climate of Ukraine. On the basis of 49 selected stations, daily values of maximum air temperature (Tmax) in the summer months June to August of 1981–2010 were used to determine two heatwave indices (HWMI (heatwave magnitude index) and HWMId (heatwave magnitude index daily)) and five heatwave characteristics (HWM (heatwave mean), HWA (heatwave amplitude), HWN (heatwave number), HWD (heatwave duration), HWF (heatwave day frequency)). The calculated indices of heatwaves appeared to be sufficiently sensitive to minor changes in the daily maximum air temperature. HWMId was found to be more sensitive to temperature changes than HWMI. The heatwave characteristics of the HWN, HWF, HWM, and the HWMId climate index proved to be the most informative in the study of heatwaves in Ukraine.
1. Introduction
Climate extremes are of the major concern in the global context, since they can result in significant financial losses and human casualties [1,2,3]. Summertime heat waves (HWs) top the list of extreme climate and weather events [4]. During the last decades, the number of HWs has increased worldwide. Extreme HWs were observed in Central Europe in June and August 2003 [5], in June and July 2006 [6,7], in summer 2015 [8]. A particularly extreme heatwave occurred in July and August 2010 in Eastern Europe as well as Western Russia [9,10]. The Central European heatwave in summer 1994 was most extreme in some Central European stations [3,8,11].
The HWs are most commonly linked with climate change, which brings with it an increase in the frequency of heatwaves [12,13]. Global climate change has been observed on our planet today [14], as well as in Ukraine [15]. Studies on the climate of Ukraine indicate that in recent decades the values of some meteorological parameters differ from the long-term average. The most evident of these changes include changes in air temperature and the phenomena associated with it (for example, the frequency of occurrence of hot days, tropical nights and heatwave cases, displacement of climatic seasons duration, etc.) [16]. According to Shevchenko et al. [10], the number of heatwave episodes was the highest in the decade 2001–2010 and the fewest for the two decades between 1961 and 1980. For many stations, the longest and strongest heatwave occurred from the end of July till the middle of August 2010, i.e., in the period of the extremely severe heatwave in Western Russia.
In principle, the heatwave is a meteorological phenomenon that consists of abnormally hot weather and belongs to the atmosphere’s synoptic-scale circulation. To date, there is no one universally acceptable HW definition [4,17,18,19].
Daily Tmax represents the meteorological variable, which is used in numerous HW investigations. One approach to identify an HW is based on the exceedance of a fixed absolute threshold for daily Tmax. An HW definition based on the exceedance of an absolute Tmax threshold, e.g., a period of at least five days, each of which has a Tmax ≥ 25 °C, was used by National Weather Service’s [4] or in similar investigations [20,21,22]. However, this type of HW definition cannot be applied to larger territories because they are often characterized by different climatic conditions. In cooler regions, the absolute thresholds may never be reached, and they may have to be higher in hotter regions to ensure only those events perceived as stressful are identified as HWs.
In order to reduce the degree of arbitrariness involved in the selection of a threshold for HWs and to provide an HW definition, which may also be easily transferable to other regions, fixed percentiles turn out to be more suitable [23,24,25].
HW definitions could be based not only on maximum air temperature values but on different meteorological parameters values. Cowan et al. [26], Cloutier-Bisbee et al. [27], Gershunov, et al. [4], Fischer, and Schär [2] use maximum and minimum air temperature data, as well as some other parameters for heatwave investigations. How to define an HW in detail often depends on the aim of a study and the meteorological data, which are available for the method of definition [4,28,29]. For instance, it is necessary to use a few meteorological parameters to assess negative impacts of heatwaves on human health, as the most of the impacts of temperature extremes on human health relate not only to extreme heat but are strongly affected by average daily temperature, minimum air temperatures, and air humidity, wind speed, solar radiation, and other factors. Applying a time series of a few variables often related to the problem of too many and too long gaps, cannot be filled to the required extent. Therefore, it is better to avoid using complex HW definitions, which require a lot of data, if it does not correspond to the aim of the research.
With no regards, which type of heatwaves definition is used, it helps only to identify HW events but does not characterize duration, intensity, and other their parameters. For this purpose, various heatwave indices are used. They based on different methods for calculation. First is the temperature anomaly over a calendar-based threshold. The second method is based on a temperature exceedance over a constant annual threshold that takes into account the seasonal cycle and therefore increases the magnitude of waves occurring at the season’s peak. Quite successful was the idea by Russo et al. [30,31] who proposed a single metric for heat/cold waves assessment based on several indices such as the HWMI (Heatwave Magnitude Index)/CWMI (Cold Wave Magnitude Index) and HWMId (Heatwave Magnitude Index daily). These are relatively easy to calculate from climatological data and provide integral information taking into account different aspects of the heat/cold waves. So far, it has been difficult to compare heat/cold waves across the climatic zones because temperatures considered as normal in a certain region can be categorized as hot/cold in other areas if they are outside the area’s normal temperature range [32]. This problem was resolved by the introduction of HWMI [30]. It sums up the excess temperatures beyond a certain normalized threshold and merges duration and temperature anomaly of intense heat events into a single number. This enables a comparison of heatwaves with different duration and peak magnitudes that have occurred in different regions and in different years [33]. However, the authors were a bit critical about the proposed HWMI, since it has some limitation on measuring the magnitude of sub-heatwaves composed by high-temperature values, as a probabilistic event. In other words, the one-to-one correspondence between the sum of temperature of three consecutive hot days (sub-heatwave) and probability saturates when a sub-heatwave is composed of days with temperature values exceeding the highest temperature recorded during the reference period 1981–2010. The problem of saturation results in a certain distortion (underestimation) of heatwave magnitude, especially given the increasing temperatures in a globally warming climate. According to Russo et al. [31], to overcome this problem, the HWMI can be replaced by the heatwave magnitude index daily (HWMId) using a different formula in assigning magnitude to a single day composing a heatwave.
Additionally, to assess the various aspects of heatwaves, five “heatwave aspects” (characteristics) can be used based on Fischer and Schär [2] and Perkins and Alexander [34] as below: magnitude (HWM, average daily magnitude across all heatwave events within a year), amplitude (HWA, the hottest day of hottest yearly event), the number of heatwave events (HWN), duration (HWD, length in days), frequency (HWF, the sum of participating heatwave days).
Despite some uncertainties in the proposed methods, they have great potential to be useful for many different weather- and climate-dependent sectors affected by heatwaves, as well as being applicable to a broad range of climates. The present study attempts to achieve this, using Ukraine as a region, which shows different climatic conditions.
This paper, therefore, has the following aims:
- to investigate heatwave indices and characteristics over the territory of Ukraine for the reference period 1981–2010, as well as examine the extreme heatwave event of 2010;
- to make a comparison and establish a statistical relationship between the HW indices and characteristics and to assess their suitability and sensitivity to changes in the modern climate of Ukraine.
2. Materials and Methods
2.1. Data
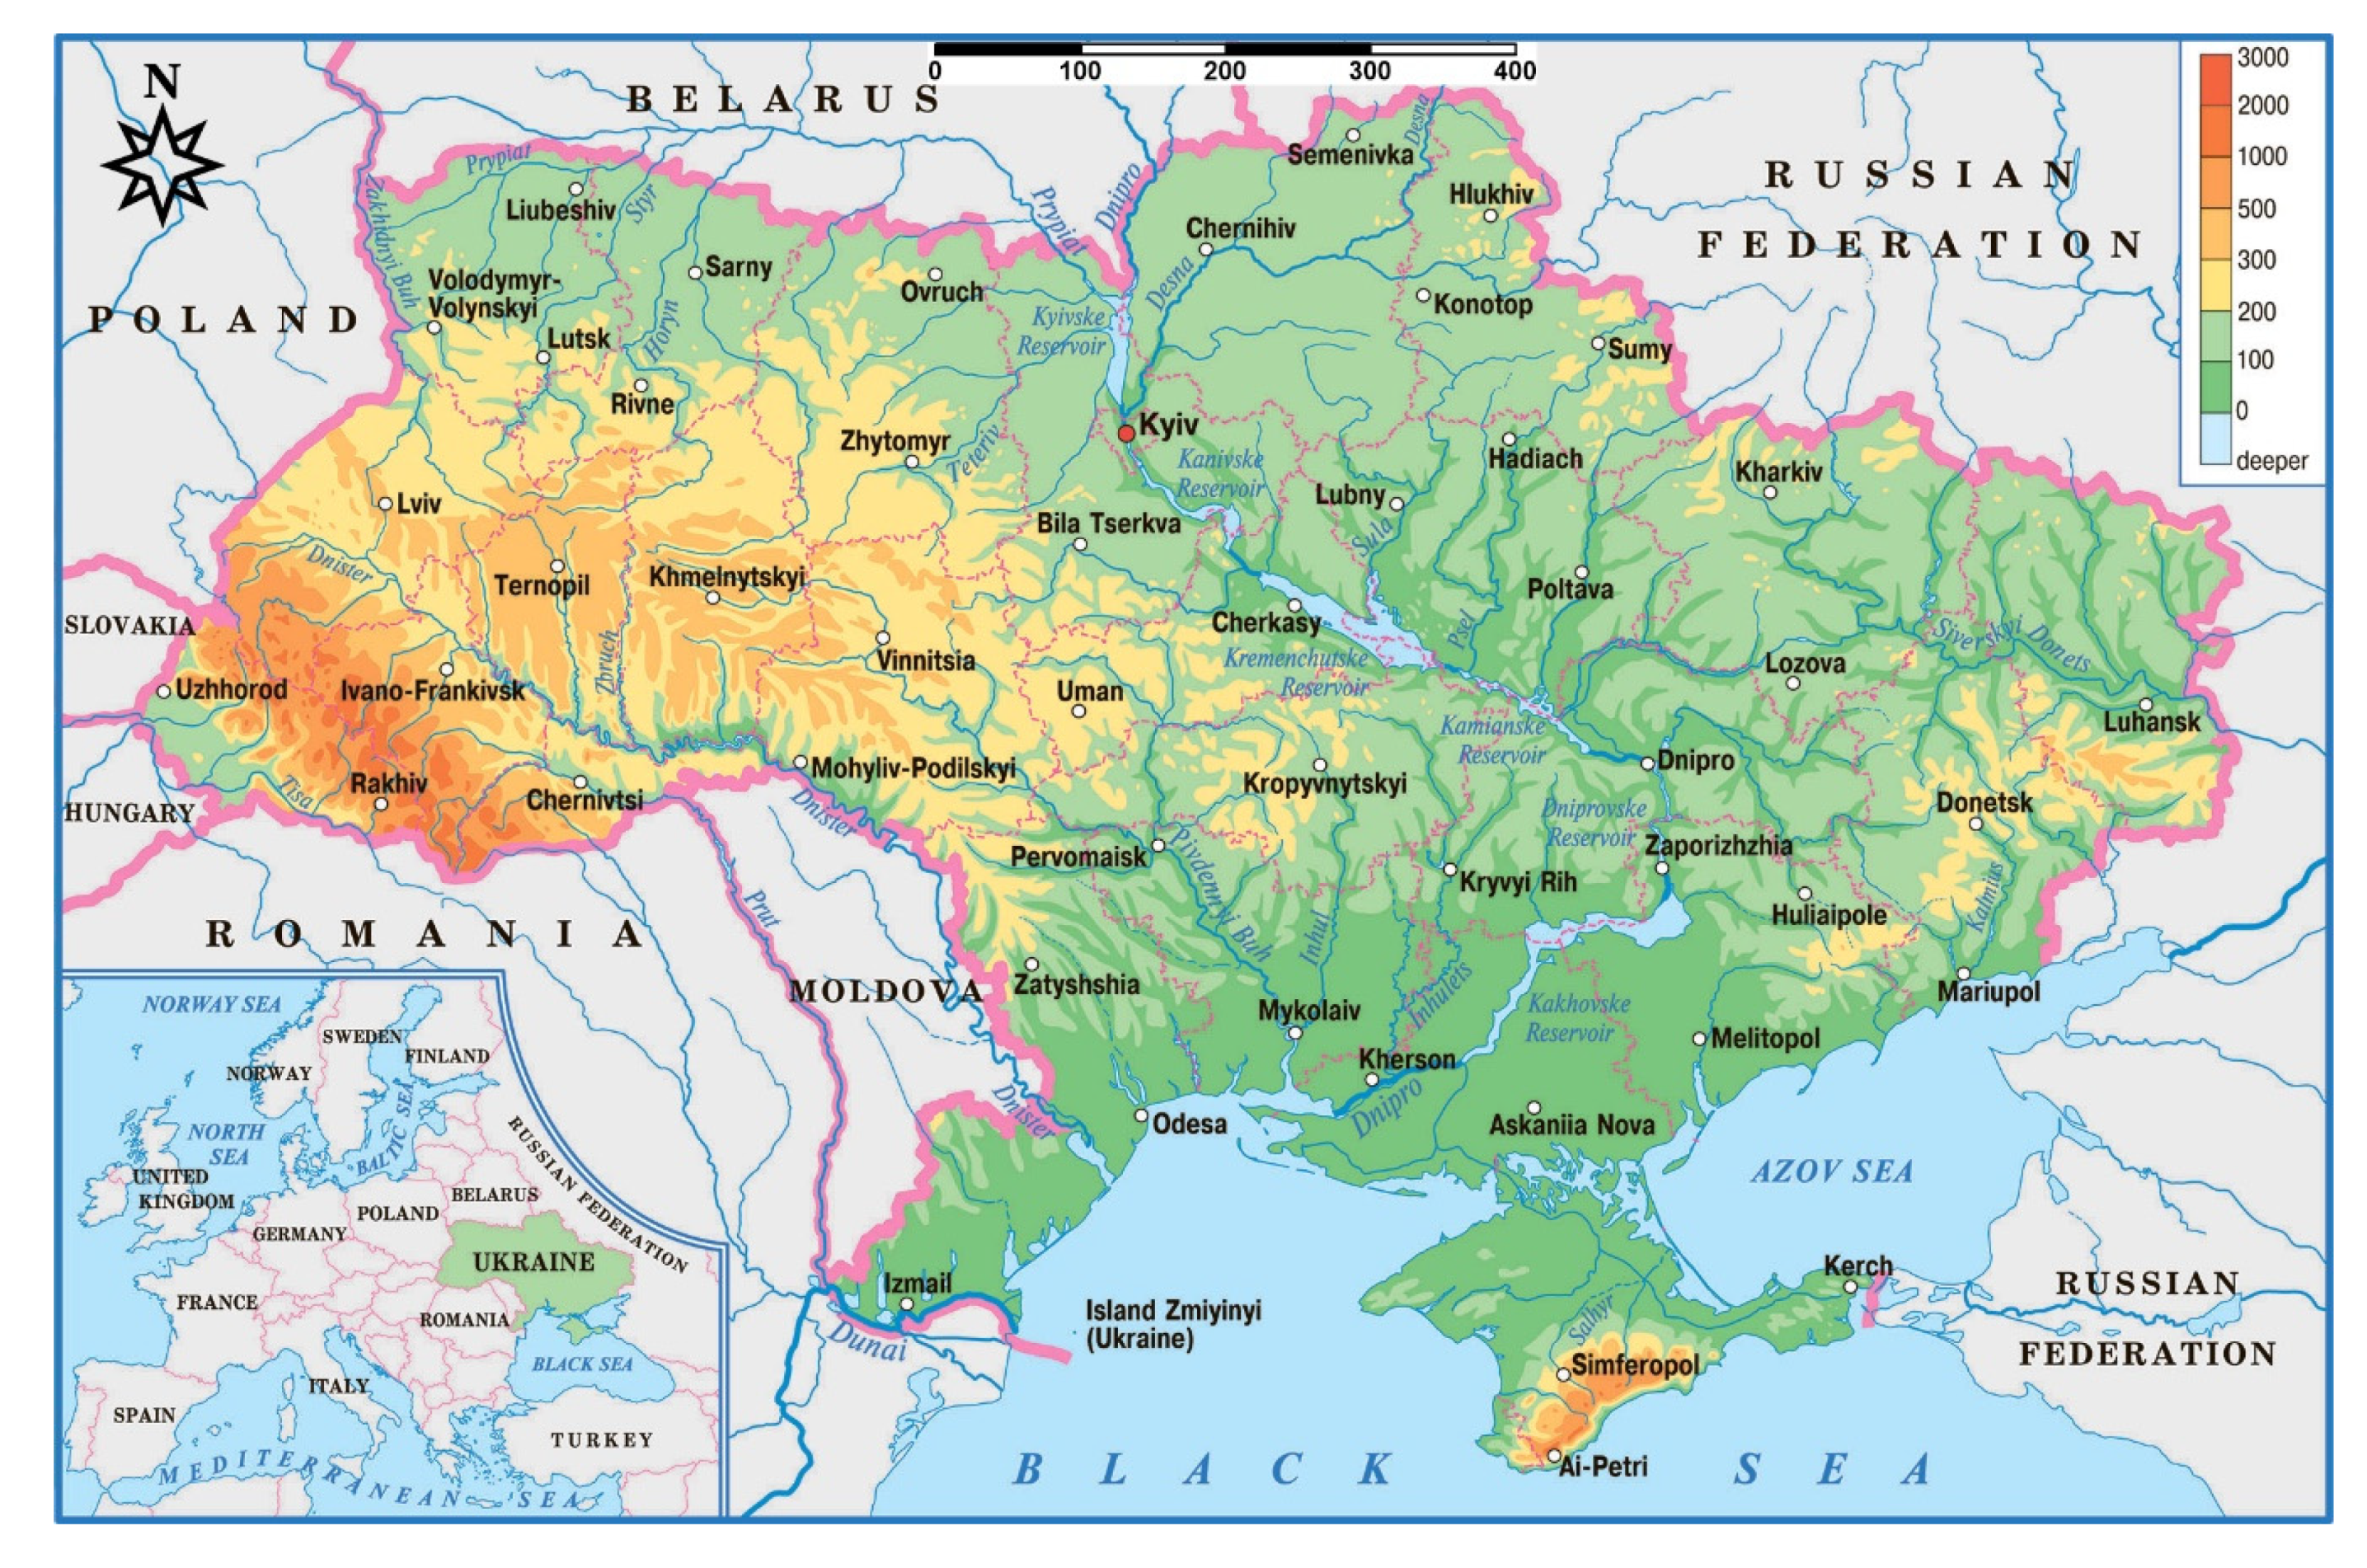
For the purpose of this study, data of daily observations of maximum air temperature (Tmax) from 49 meteorological stations in Ukraine (Figure 1, Table S1) for June–August months of 1981–2010 were used.
The study period was chosen according to the current World Meteorological Organization Technical Regulations. The WMO (World Meteorological Organization) recommends defining climatological standard normal as averages of climatological data computed for successive 30-year periods, updated every ten years, with the first year of the period ending in 1, and the last year, with 0. That is, consecutive 30-year normal include: 1981–2010, 1991–2020, and so forth. Therefore, the modern climatological standard normal is 1981–2010 and this period was used in our research as a reference period. Summer 2010 was chosen for the research because it was a period of abnormally hot weather in Eastern Europe (including Ukraine) [10] and it is important to study in detail different characteristics of the strong heatwave occurred from the end of July till the middle of August over the territory of Ukraine.
Using data from meteorological stations located in different regions of Ukraine in this study allowed the provision of spatially relatively uniform coverage of the entire territory and investigation of the temperature differences with uncertainty in the resolution. Most of the territory of Ukraine lies within the East European Plain and consists of regular plains with elevations of no more than 0–600 m a.s.l. among, which there are recognized lowlands and uplands. Plains are surrounded by two mountain regions which are Carpathians (on the west) and Crimean Mountains (on the south) (Figure 1). Although there is evidence that the rate of warming is amplified with elevation in the mountains, according to the Pepin et al. [35], more rapid changes in temperature observed in high-mountain environments. Carpathians and Crimean Mountains with heights of 1000–2000 m do not belong to such categories of mountain systems. Therefore, we did not consider the influence of complex orography on heatwave characteristics and dynamics, as well as it was in many other studies of HW events in countries with complex orography [8,36,37,38].
2.2. Heatwave aspects
The selected methodology for the heatwaves research at this stage is based on the aspects proposed by Perkins and Alexander [34]:
HWM—average magnitude of all summertime heatwaves;
HWA—hottest day of hottest summertime event;
HWN—frequency of heatwave events during summertime;
HWD—length of the longest summertime event;
HWF—sum of participating heatwave days in the summertime season, which meet the HW definition criteria over a 30-day interval.
The difference is that heatwaves study was carried out only during the summertime season, and more than five days duration heatwaves were analyzed.
HWM is the average magnitude (average maximum temperature) of all yearly heatwaves, scaled over the 30-year reference period (1981–2010), and measured in °C. Regarding the summer of 2010, it was defined as an anomaly against the reference period.
2.3. Heatwaves Climate Indices
One of the climate indexes that takes into account both heatwave duration and intensity is the HWMI [30]. This index can be used for HW comparison across the various spatial and time scales, and also for comparison of the heatwaves in the projected future climate with those of today. The calculation of HWMI for the specific year consists of several stages. The identification of heatwaves according to the proposed methodology is based on the filtration of time series of daily maxima temperatures against the threshold value, which is calculated as the 90th percentile of daily maxima based on a moving 31-day window in a 30-year reference period 1981–2010. Heatwave is considered as an ensemble of sub-heatwaves, where the sub-heatwave represents three consecutive days with a maximum above the daily threshold. The sub-heatwave unscaled magnitude, which is a sum of the three daily maximum temperatures of a sub-heatwave, is transformed into a probability value on a scale from 0 to 1, which is defined as the magnitude of a sub-heatwave. In turn, the magnitude of a heatwave is defined as the sum of the magnitudes of the n sub-heatwaves, and the HWMI—as the maximum of all heatwave magnitudes for a given year. The final estimation of the heatwave magnitude was determined according to the scale proposed by Russo et al. [30] for the HWMI values based on the following categories: ≤1 Normal < 2 ≤ Moderate < 3 ≤ Severe < 4 ≤ Extreme < 8 ≤ Very Extreme < 16 ≤ Super Extreme < 32 ≤ Ultra Extreme.
Since the hypothetic maximum of the magnitude of the sub-heatwave tends to 1, then based on the proposed scale the “Normal” heatwave can be obviously composed of at least two sub-heatwaves, the “Moderate”—of at least three, the “Severe”—of at least four, etc. Therefore, the hypothetic maximum of the HWMI is defined by the duration of the event, and then finely tuned by the temperature within the range from 1 to the category’s hypothetic maximum.
The HWMId is an index developed based on the HWMI [31]. This index is definied as the maximum magnitude of the heatwaves in a year, where heatwave is a period of more than six consecutive days with maximum temperature (Tmax) above the daily threshold for the reference period 1981–2010. HWMId magnitude is a sum of the magnitude of the consecutive days composing a heatwave, with daily magnitude calculated as follow:
where Td—the maximum daily temperature on day d of the heatwave exceeding the temperature threshold of that day calculated as the 90th percentile of the maximum daily temperature based on a 30-day sliding window for the 1981–2010 reference period; T30y25p and T30y75p are the values for the 25th and 75th percentiles of time series of the maximum daily temperature for the 1981–2010 reference period. Quartiles are a useful dispersion measurement tool because they are much less dependent on extreme values or asymmetry of the data set than the mean or standard deviation. Therefore, quartile data are usually provided when working with data arrays containing significant extremes. Quartiles are often represented by the annual interquartile range (IQR). IQR is defined as the difference between the third (Q3) and the first (Q1) quartiles of the data set. The measurement of the heat/cold wave is based on 30-year reference periods, while it should be noted that the point estimation (for example, multi-year average, maximum, etc.) for such samples are quite rough. As already noted, IQR is more qualitative for statistics of small samples. Therefore, Russo et al. [31] proposed an algorithm for determining the daily heatwave magnitude as the ratio of two statistical intervals that can be deemed feasible.
3. Results
3.1. Spatial Variability of the Heatwave Aspects for 2010 Heatwave and 1981–2010 Reference Period
3.1.1. HWN
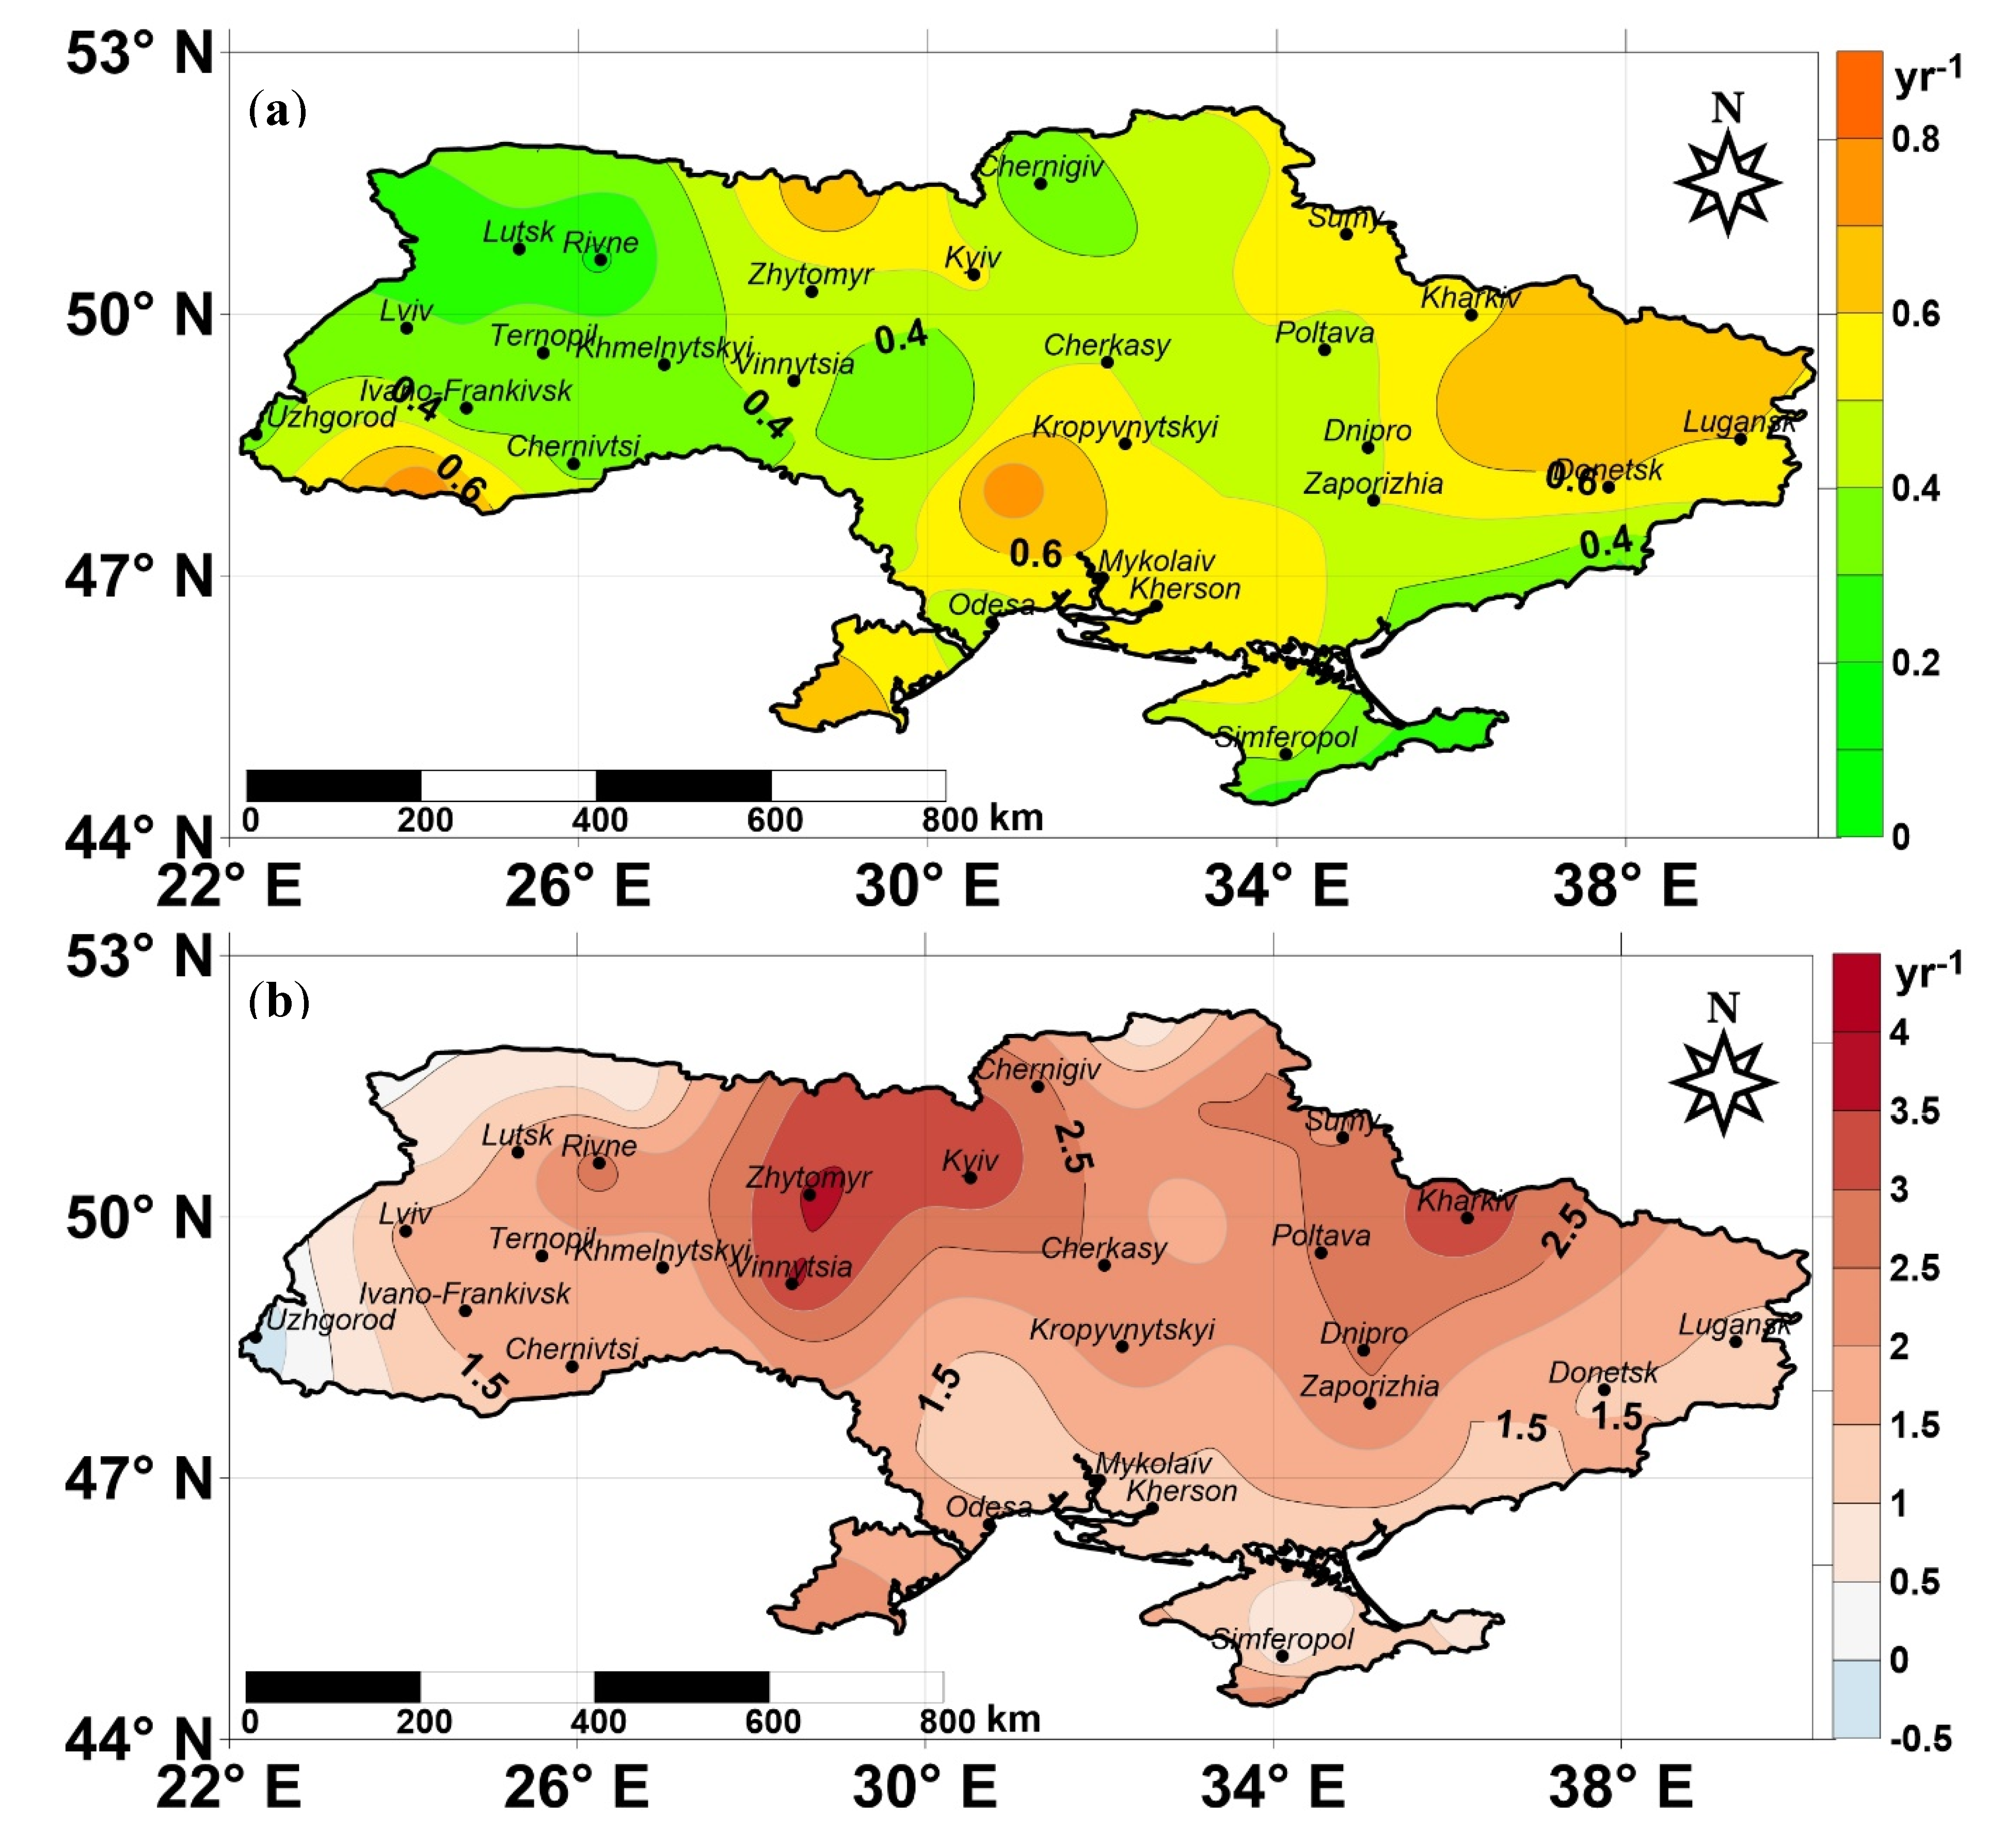
HWN is a heatwave aspect that reflects the yearly number of heatwaves scaled over a selected reference period (in our study, 30-year period: 1981–2010) and is measured in yr−1. For 2010, the anomaly of the HWN index was measured against the reference period, i.e., the number of heatwaves in summer 2010 compared with 1981–2010.
Figure 2a shows the number of heatwaves identified according to the maxima air temperature threshold, which was determined as the 90th percentile of daily highs based on a 31-day moving window in the reference period 1981–2010. For the whole territory of Ukraine, the average number of events is less than 1 per year, with a range of 0.2–0.8. An average HWN value for all studied areas of Ukraine is about 0.5. The lowest HWN values were found in the northwest of the territory of Ukraine (which could be explained by the transfer of cool north-western air in the summertime). Also, a few zones with higher HWN values were found in different parts of the territory (on the southwest, on the east, as well as on the territory between Kropyvnytskyi, Mykolaiv, and Odesa). As expected, the HWN anomaly in 2010 is apparent for almost the entire territory of Ukraine. The average anomaly was about 2.0; that is 2–3 heatwaves were observed in summer 2010 on the whole studied territory. It should be noted that only one meteorological station in the Transcarpathia region (city of Uzhgorod) did not register any heatwaves in 2010 according to this methodology.
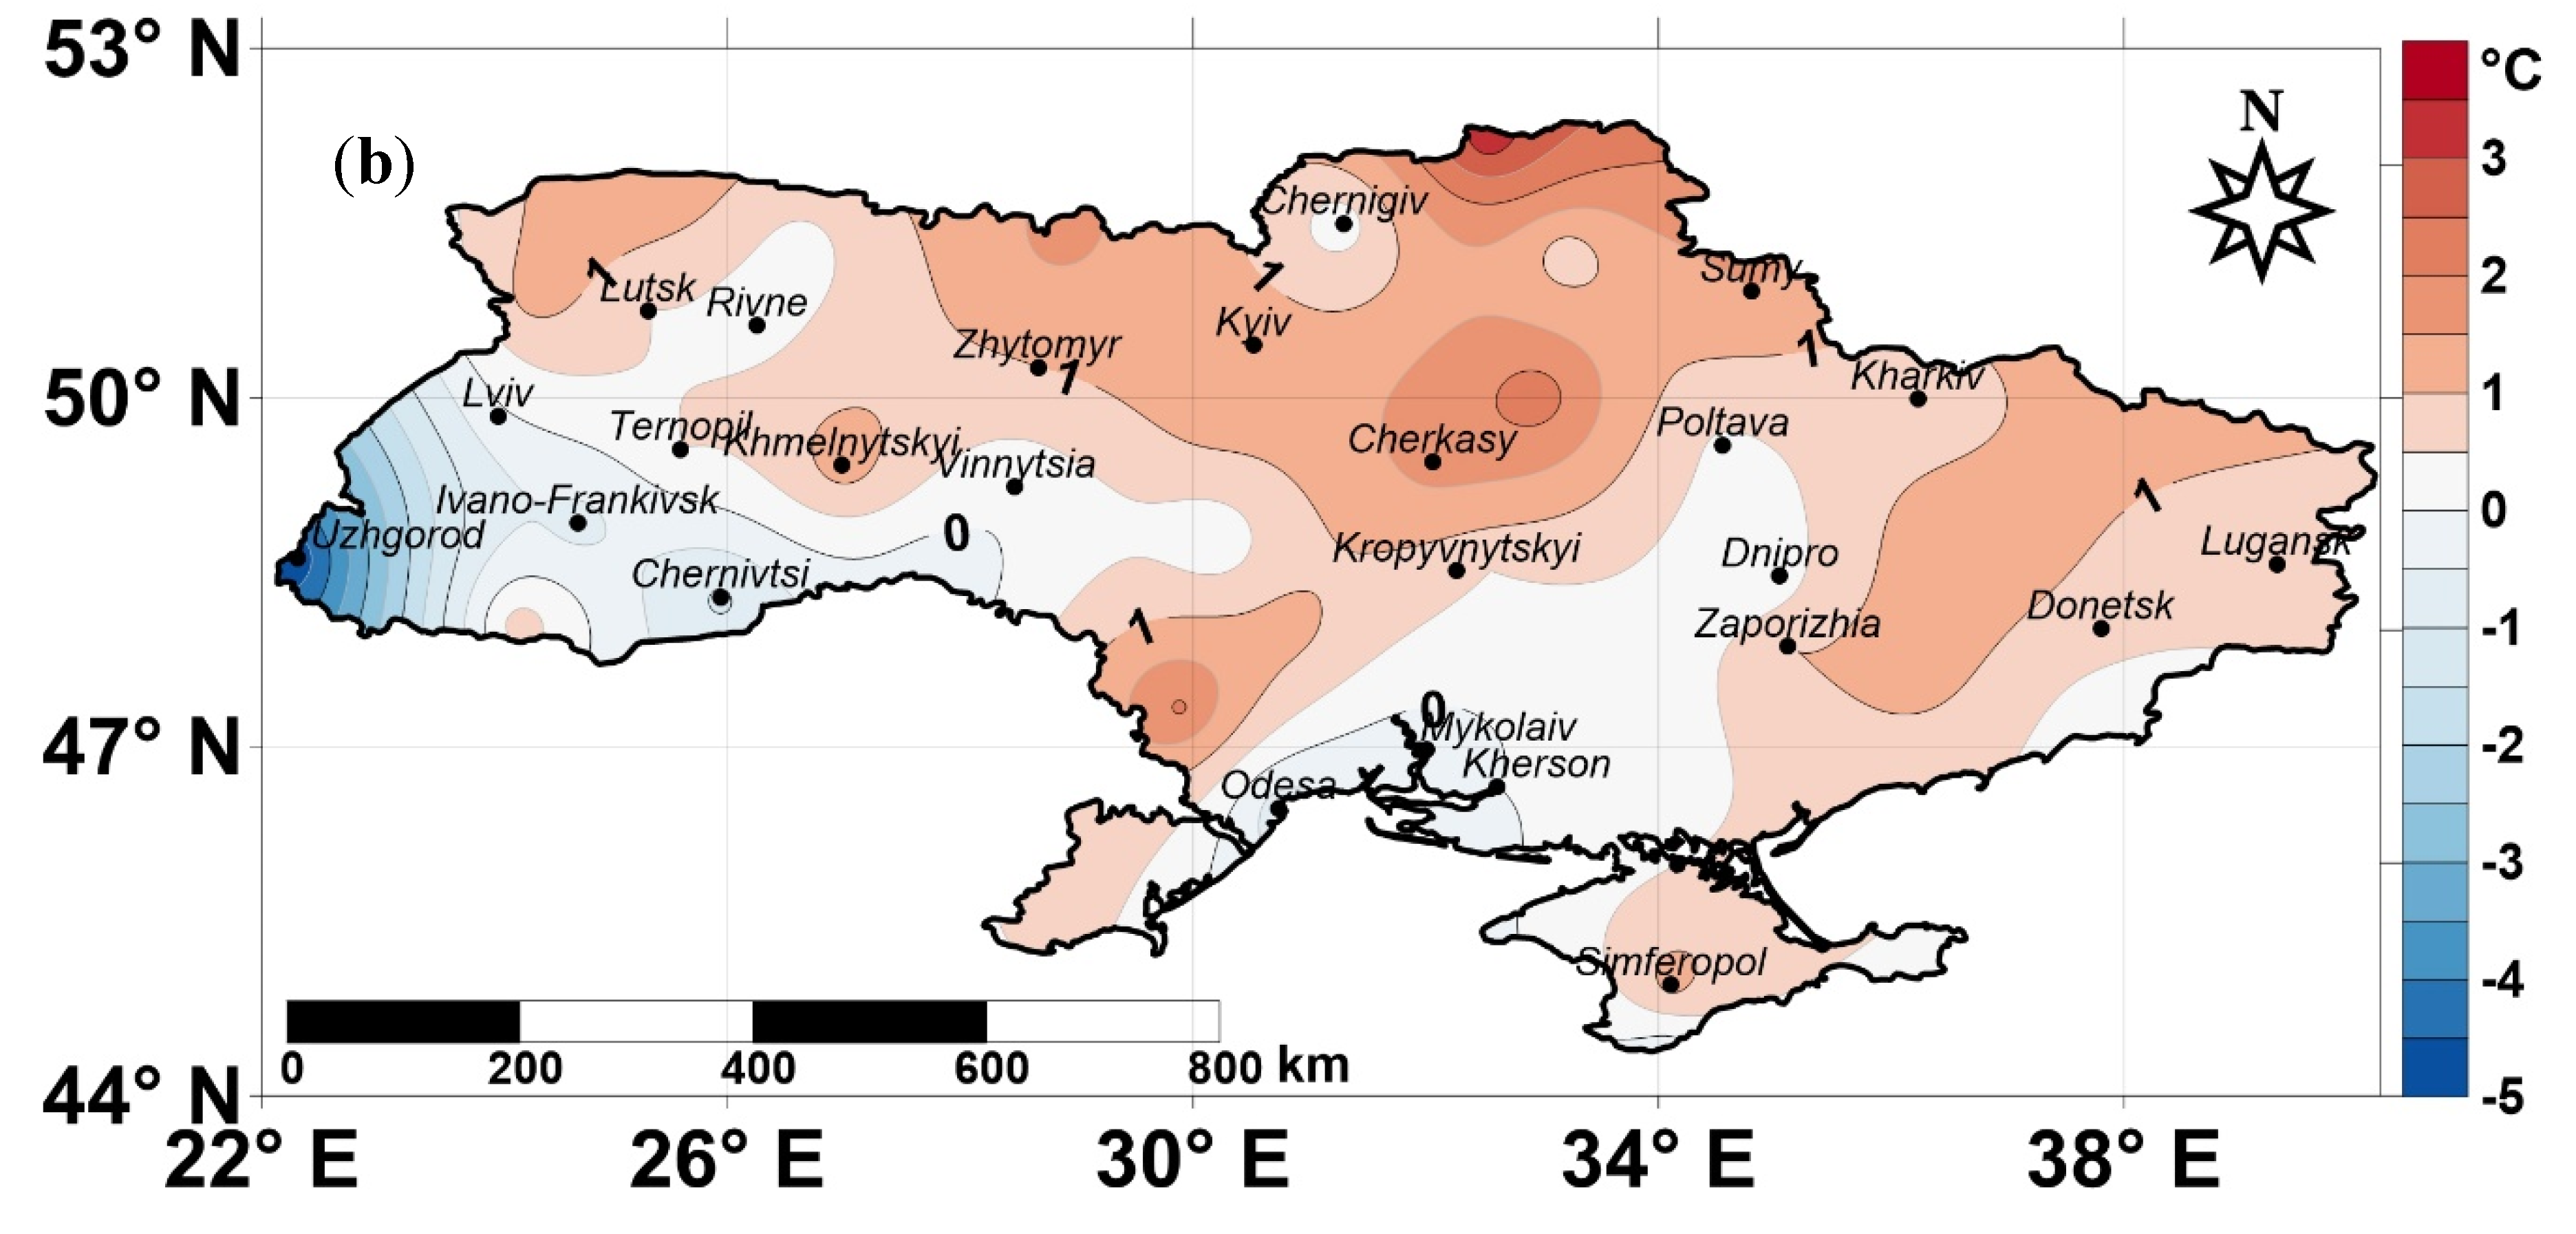
The anomaly of HWN in the reference period (Figure 2b) under review also has a pronounced zonal bipolarity. However, centers of temperature anomalies have somewhat shifted and are now located at about 500 km distance from each other at a latitude of 50 °N. A few factors could be the reason for such spatial distribution of HWN values. First of all, potential interactions between urban heat island (UHI) and heatwaves could influence on HWs characteristics [39,40,41]. The intensity, duration, and number of heatwaves can increase due to UHIs. Kyiv and Kharkiv are the biggest cities in Ukraine; therefore, the high anomalies of the HWN found around these cities could be due to UHIs existence. Excessive humidity over the territory of the Dnipro Lowlands due to cascade of water reservoirs and numerous tributaries of the Dnipro River could also influence on the HW characteristics in summer 2010.
The HWN anomaly (Figure 2b) considered for summer 2010 has a pronounced zonal bipolarity. The centers of temperature anomalies are approximately 500 km distance from each other at a latitude of 50 °N. The pooling of anomalous zones most likely prevented high humidity over the Dnieper lowland through a cascade of reservoirs and numerous tributaries of the Dnieper River, which contributed to the maintenance of a long-lasting heatwave (July–August).
3.1.2. HWD
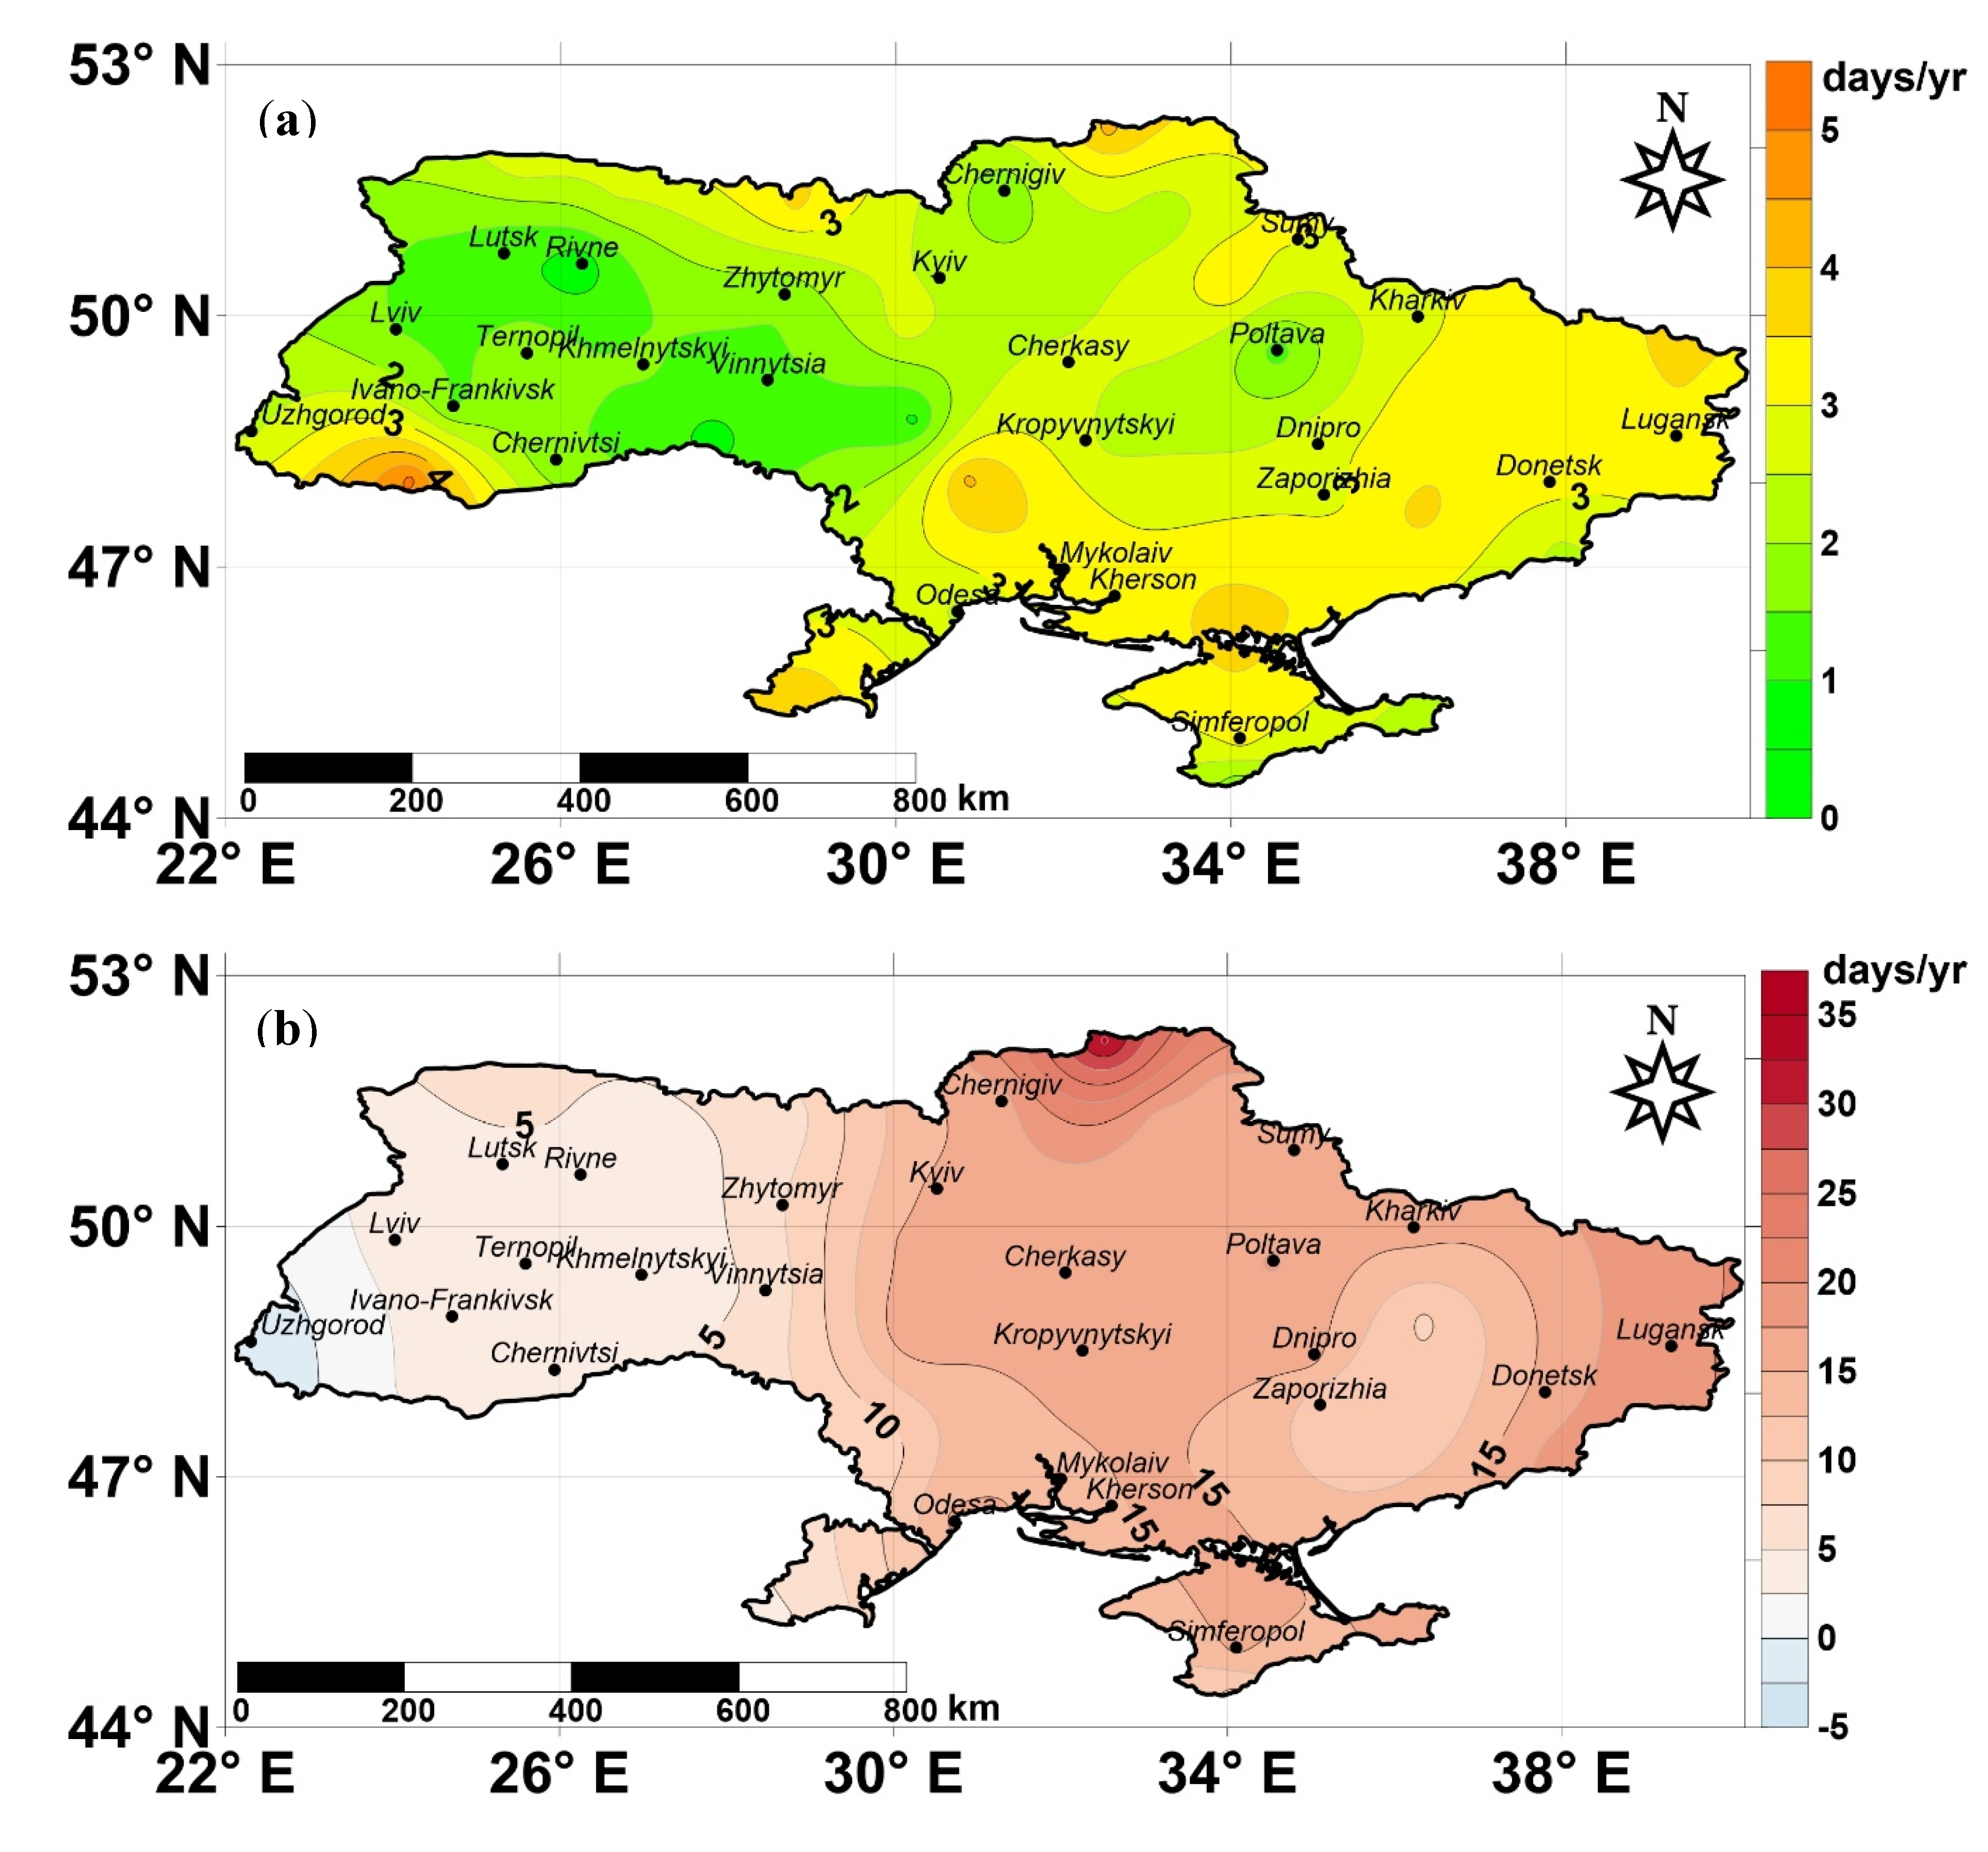
HWD is a heatwave aspect that reflects the length of the longest summertime event. Similar to the previous index, it is scaled over the same 30-year reference period and measured in days per year. Regarding the summer of 2010, it was defined as an anomaly against the reference period.
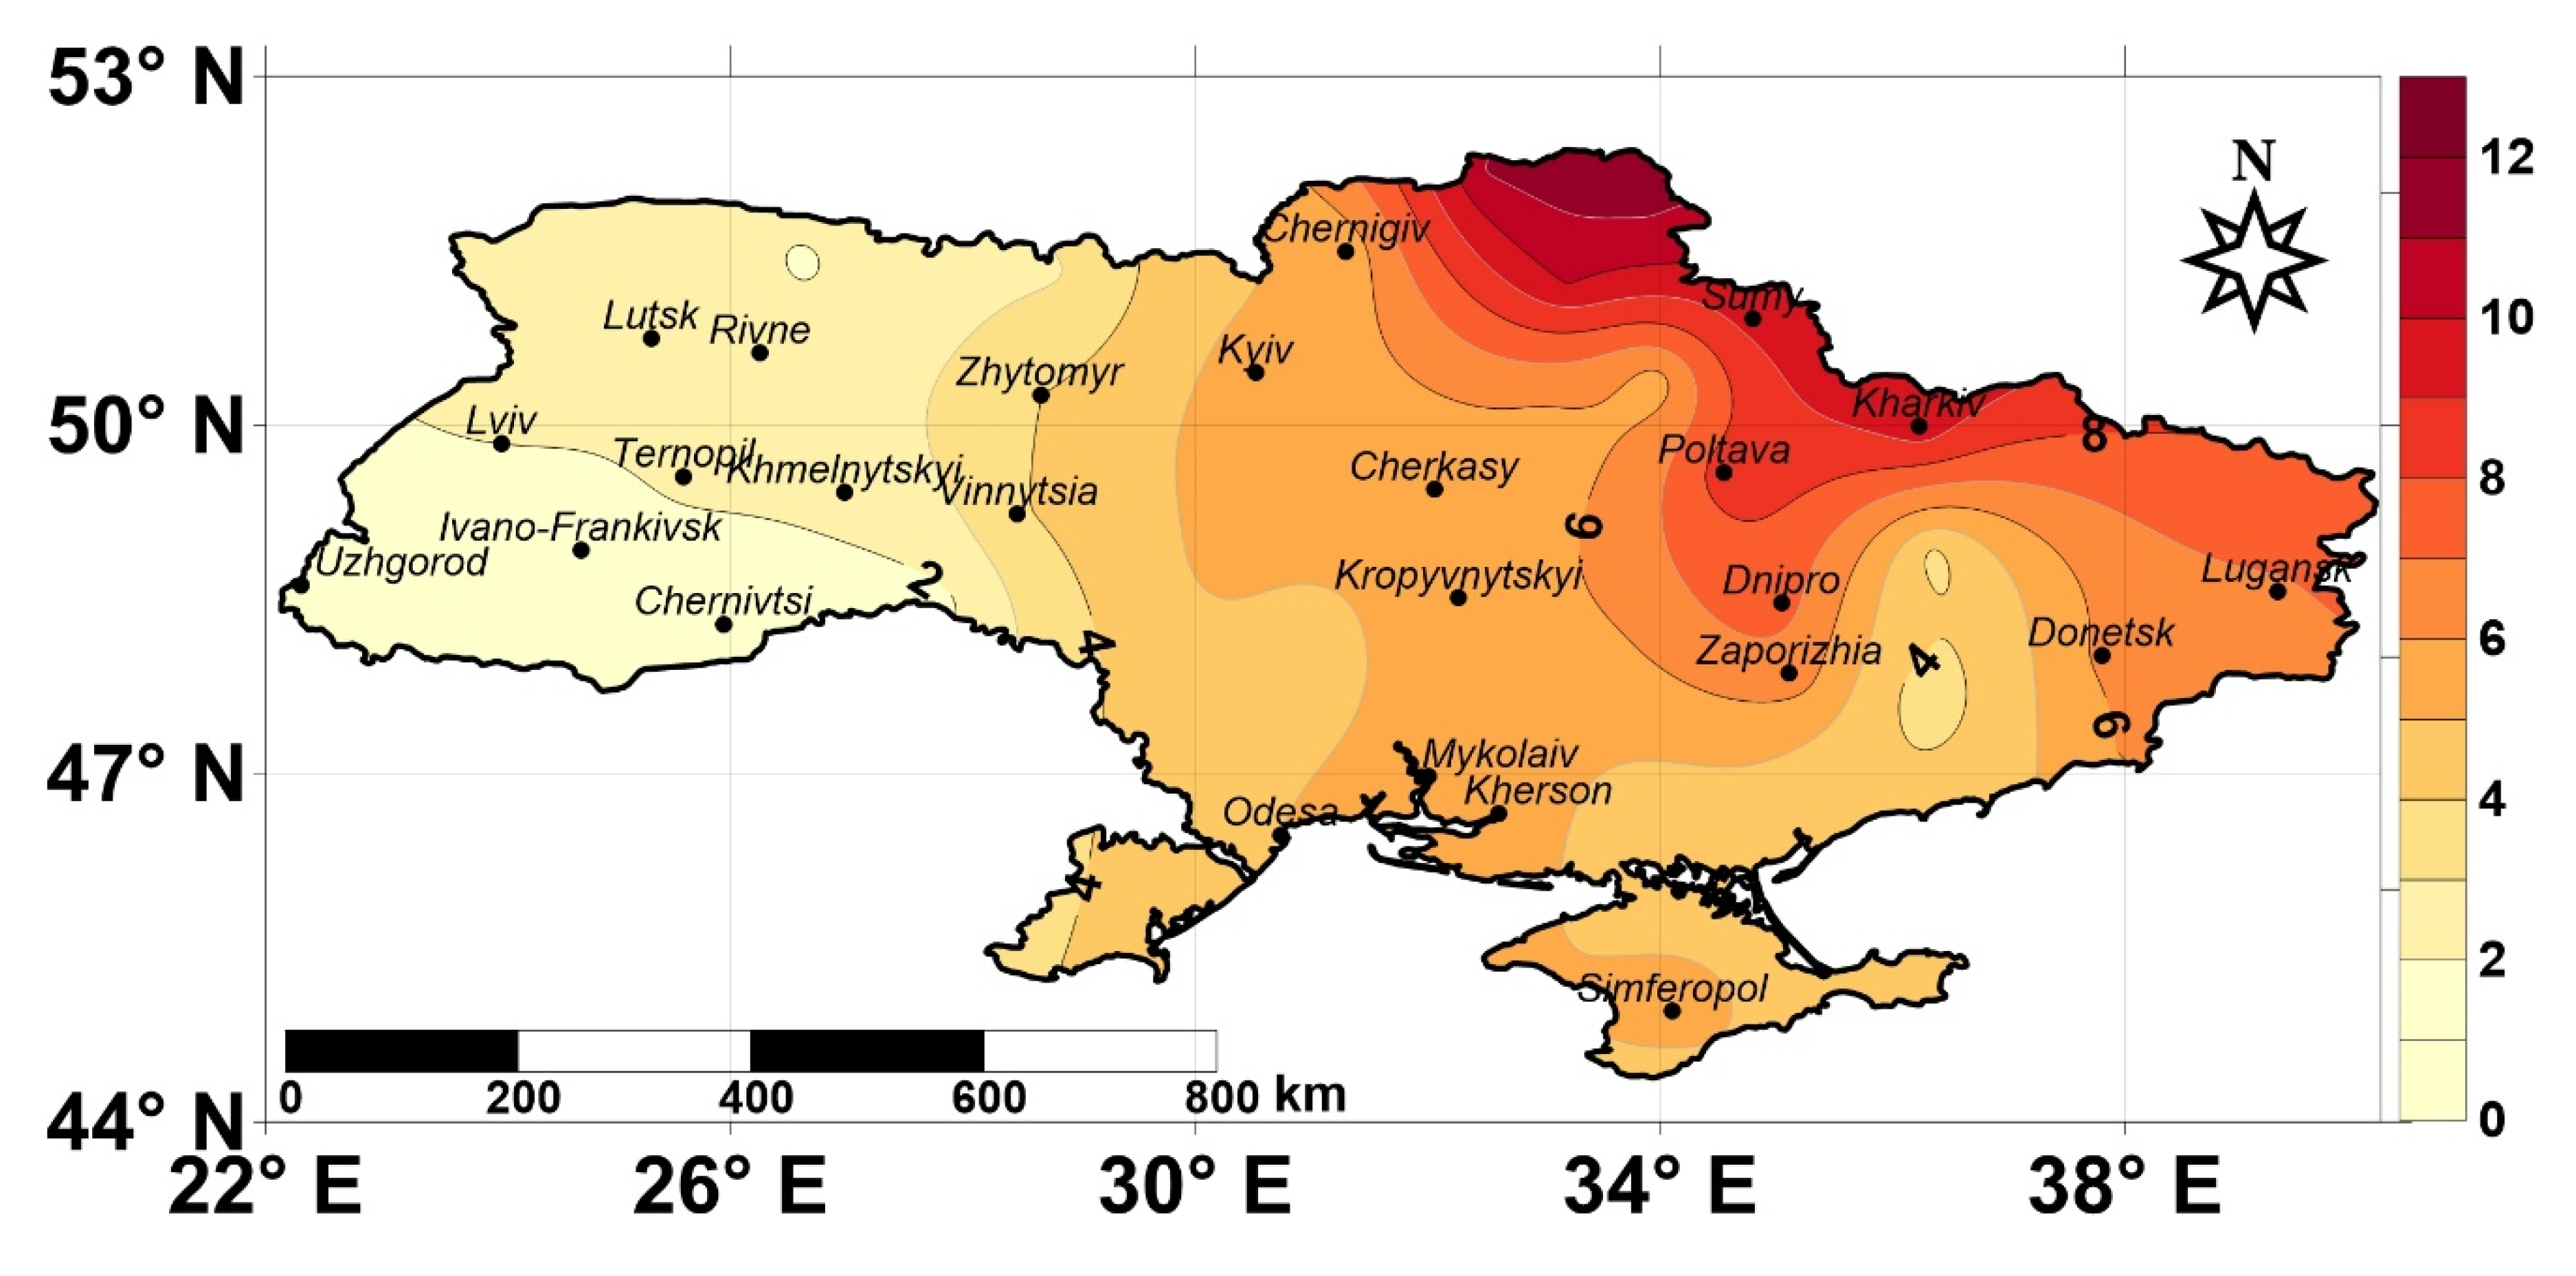
Figure 3 shows the spatial distribution of HWD (day y−1).
Interestingly enough that while common zones for HWD and HWN are similar, they are not always overlapping. The unipolar HWD anomaly, that also have inherent zones, is consistent with the HWN anomaly; namely, it’s pole HWDmax = 20 days yr−1 is located exactly in the vicinity of the local HWN minimum (across its poles). In the western part of Ukrainian territory (<25° E), the heatwave of the end of July–August 2010 was practically not visible (HWN <1). Anomalous temperature conditions in summer 2010 on this territory has been mentioned in previous studies. For example, Shevchenko et al. [42] pointed out that the heatwave of the end of July–August 2010 was characterized by considerable duration and magnitude. Moreover, it led to the significant exceedance of the average temperature in August over the 1961–1990 values at the major part of the territory of Ukraine. The formation of a powerful heatwave was caused by the influence of blocking anticyclone in the European part of Russia. If the heatwaves shorter than five days are neglected, then the condition HWD < 5 is met over a slightly larger area (<28° E).
3.1.3. HWF
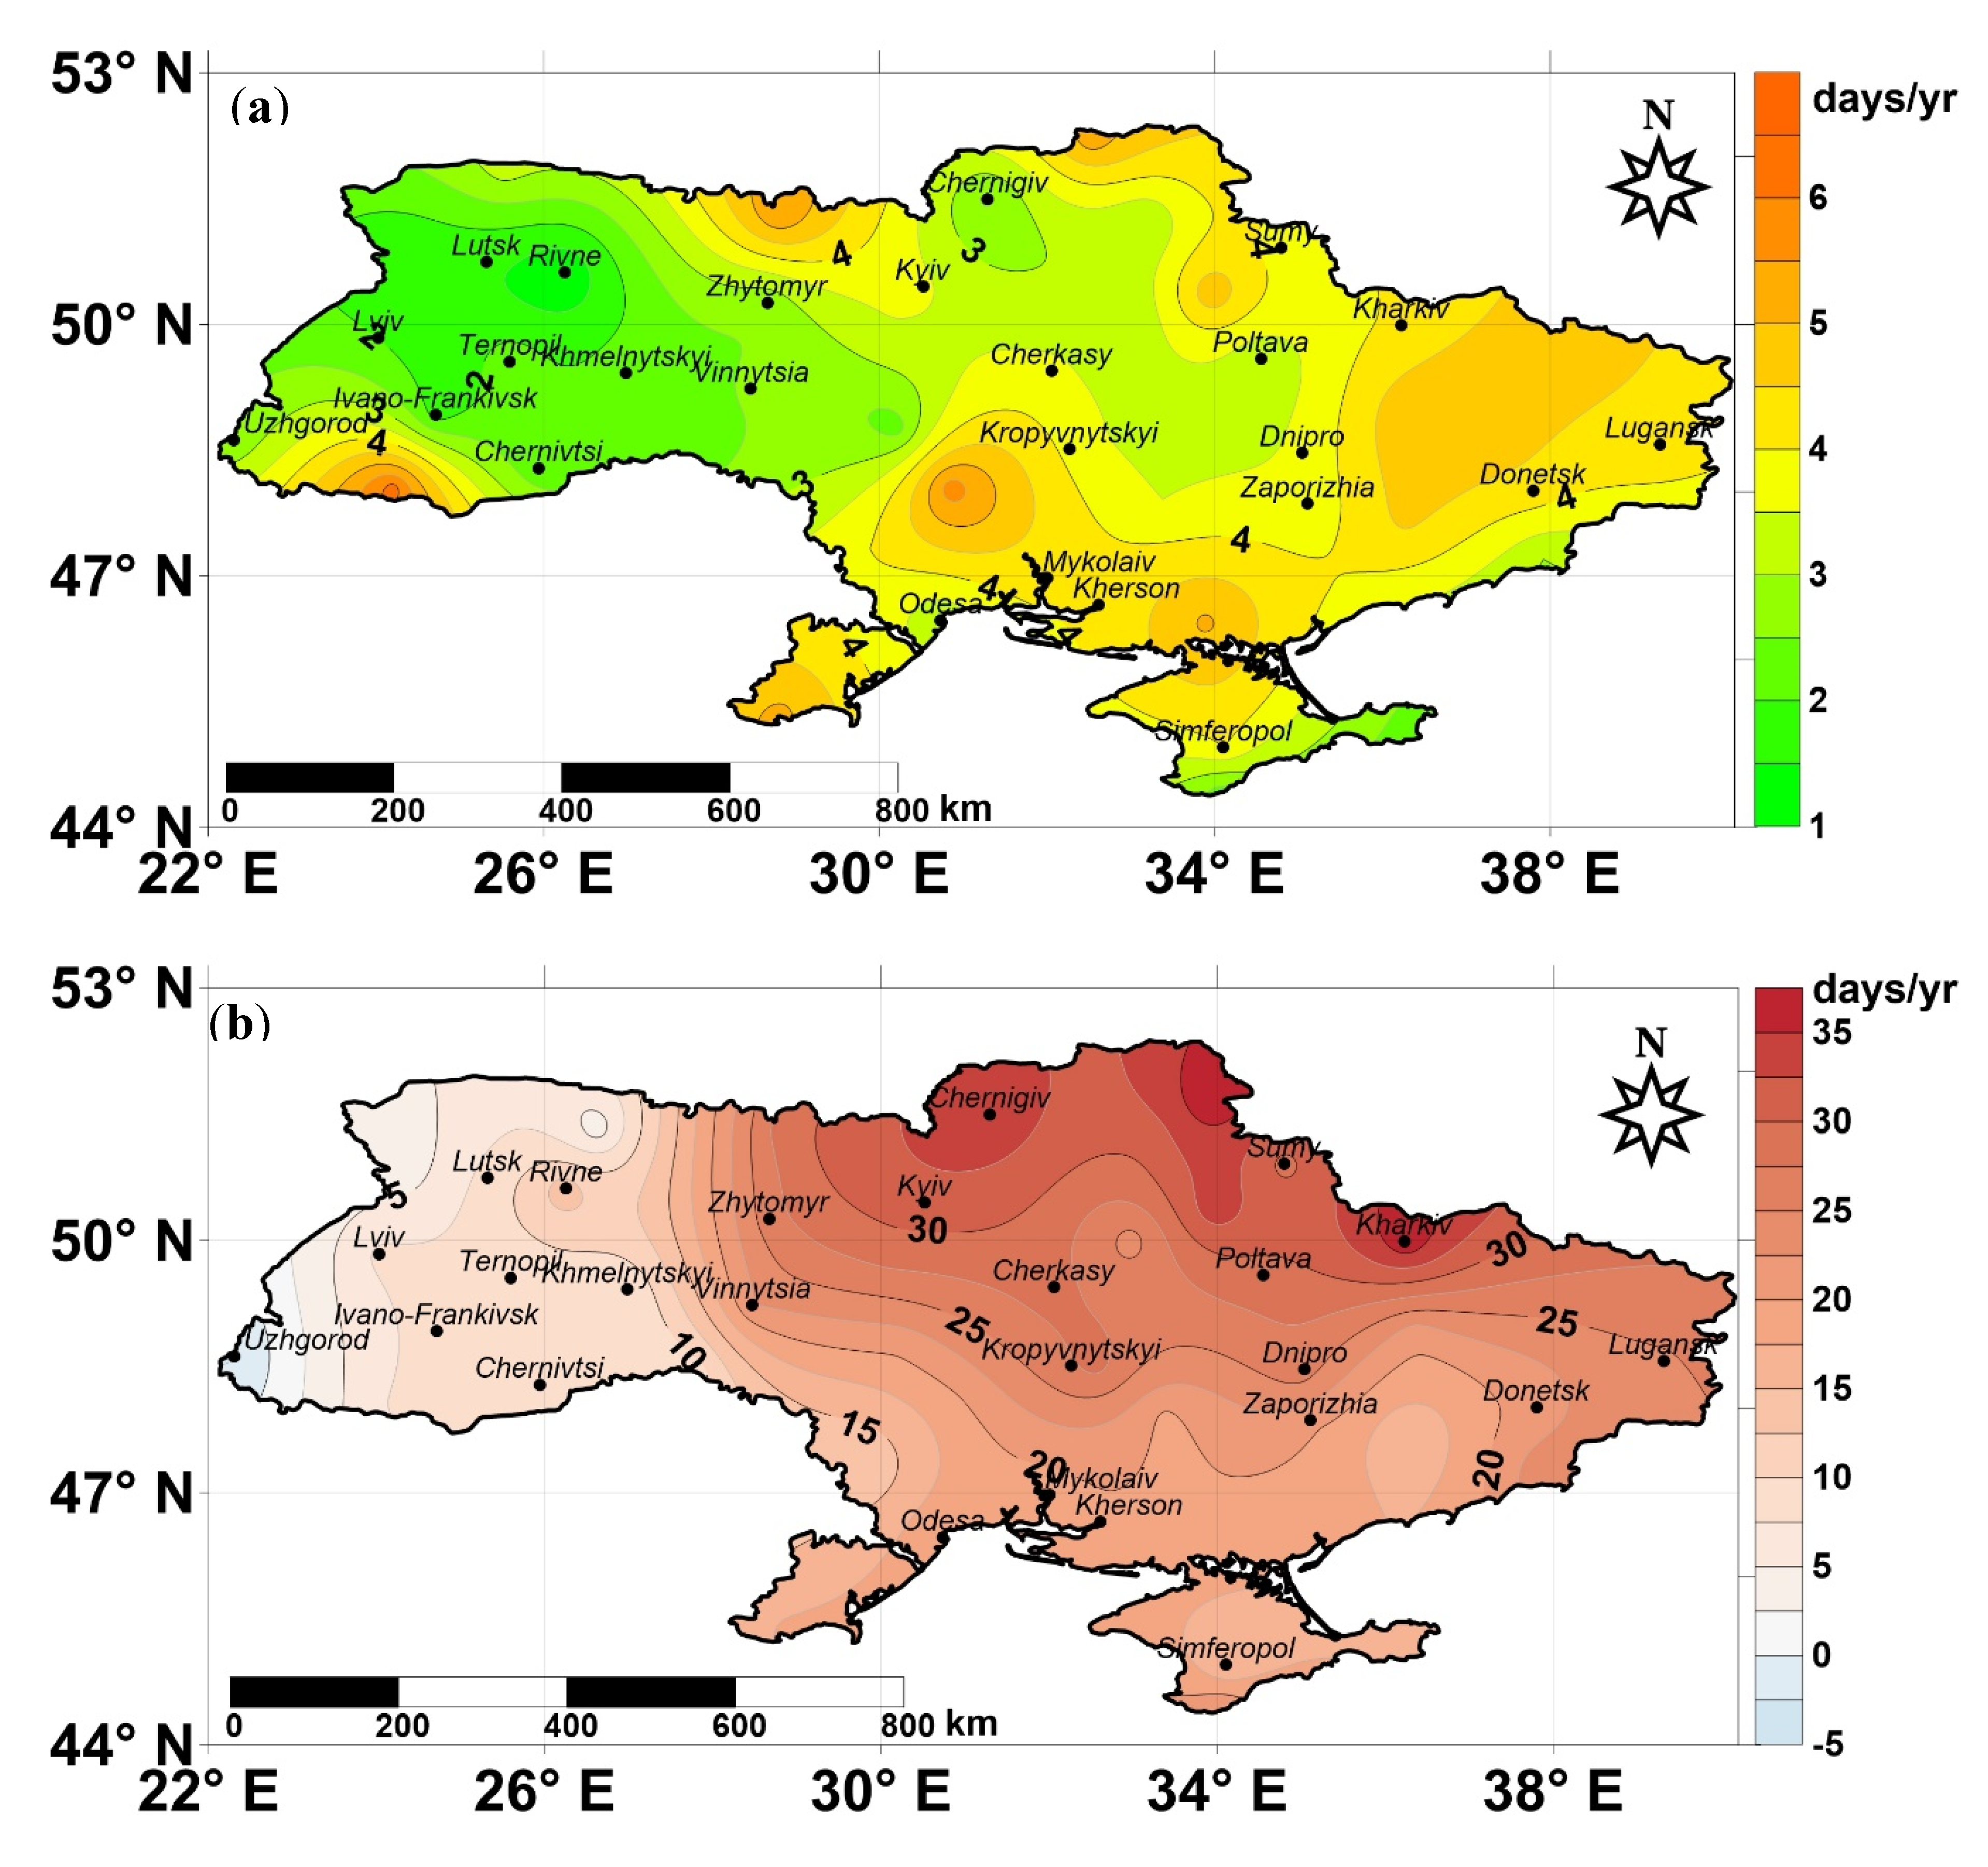
HWF is the heatwave aspect, which is determined by the annual sum of contributing heatwave days during the summer season scaled over the same 30-year reference period and is also measured in days per year. HWF for 2010 is defined as an anomaly in the reference period.
Figure 4a shows the spatial distribution of this index. There are some climatological patterns between the HWF, HWN, and HWD aspects. Indeed, for the entire study area, the crucial similarity exists between the sum of contributing heatwave days with the duration of the longest wave. Furthermore, the change in the total number of hot days determines the total number of heatwaves.
The spatial distribution of the HWF values in 2010 indicates that the strong positive anomaly of HWF was observed in a large area, especially in the northwest of Ukraine, where the heatwave lasted for more than a month. There are clearly visible trends of a significant reduction of the anomaly in the west of the country, which correlate with the aforementioned anomalies. The specific difference of this anomaly is an absence of local extreme.
3.1.4. HWA
HWA is a heatwave aspect that reflects the temperature of the hottest day of the hottest yearly event, scaled over the same 30-year reference period, and is measured in °C. The hottest heatwave determined according to the average heatwave air temperature.
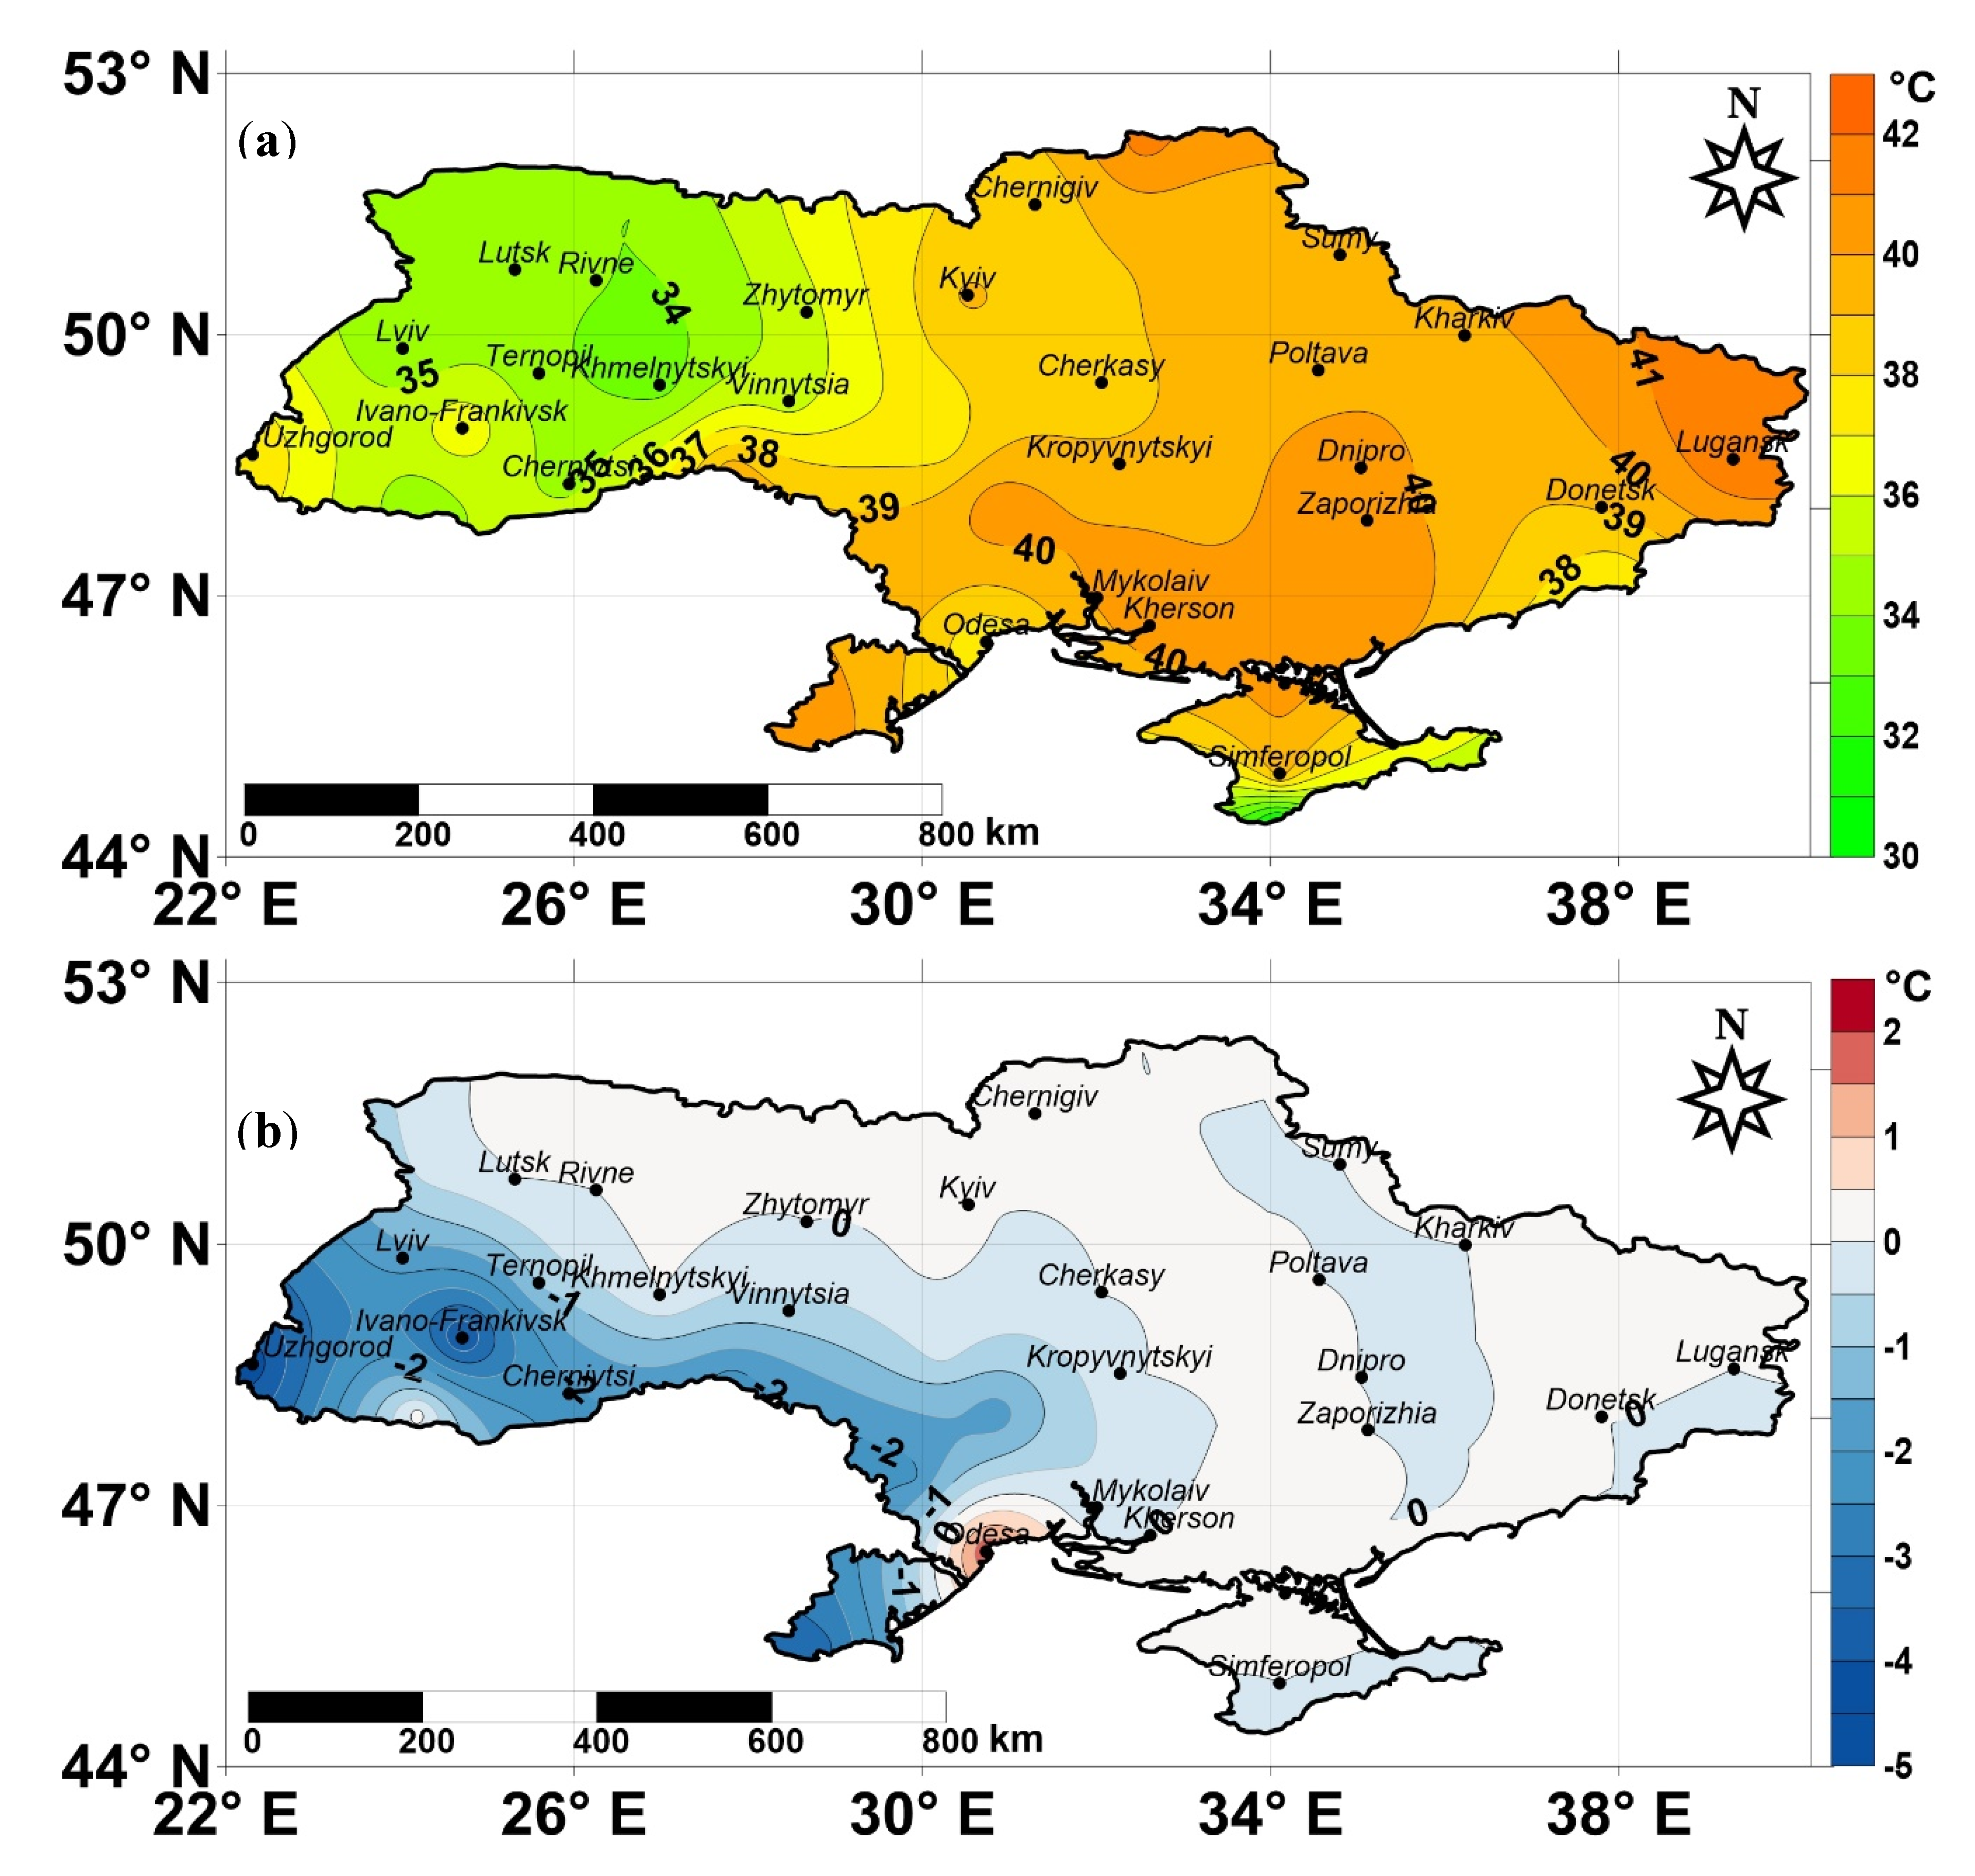
Over the larger part of Ukraine (Figure 5a), the hottest events for the reference period were the heatwaves with a maximum daily temperature of about +40 °C, except for the north-western areas where the maximum temperature was 5 °C lower on average. The absolute maximum of +42 °C (city of Lugansk) was registered on August 12, 2010. It should be noted that the spatial distribution of the HWA differs significantly from the previous indices pattern; it has a weak downward trend in the western direction (0.25 °C/1° latitude). Accordingly, HWA for 2010 is presented as an anomaly in the reference period (Figure 5b). The anomaly is not observed over a considerable area. This means that during the studied period, the most intense heatwave with the maximum air temperature was identified in summer 2010.
For the western and south-western regions, a negative anomaly is observed; that is, the most intense heatwave in these regions was not observed in 2010, with the highest temperature of these heatwaves being higher than in 2010. A positive anomaly represents a single point HWA (city of Odesa) = 2.0. This is because the hottest event of the reference period in Odesa observed in 1998 and the highest air temperature of this HW reached 37 °C, while the maximum temperature of the hottest day of 2010 heatwave was a bit higher and reached 39 °C, but this HW was not the hottest event for the reference period. A positive anomaly most likely is caused by the specific aspects of the coastal climatology in this region. If we describe a whole picture, then the HWA anomaly represents a pseudovector aimed northeast towards its growth, and its module estimated for the whole territory of Ukraine does not exceed 2 °C.
3.1.5. HWM
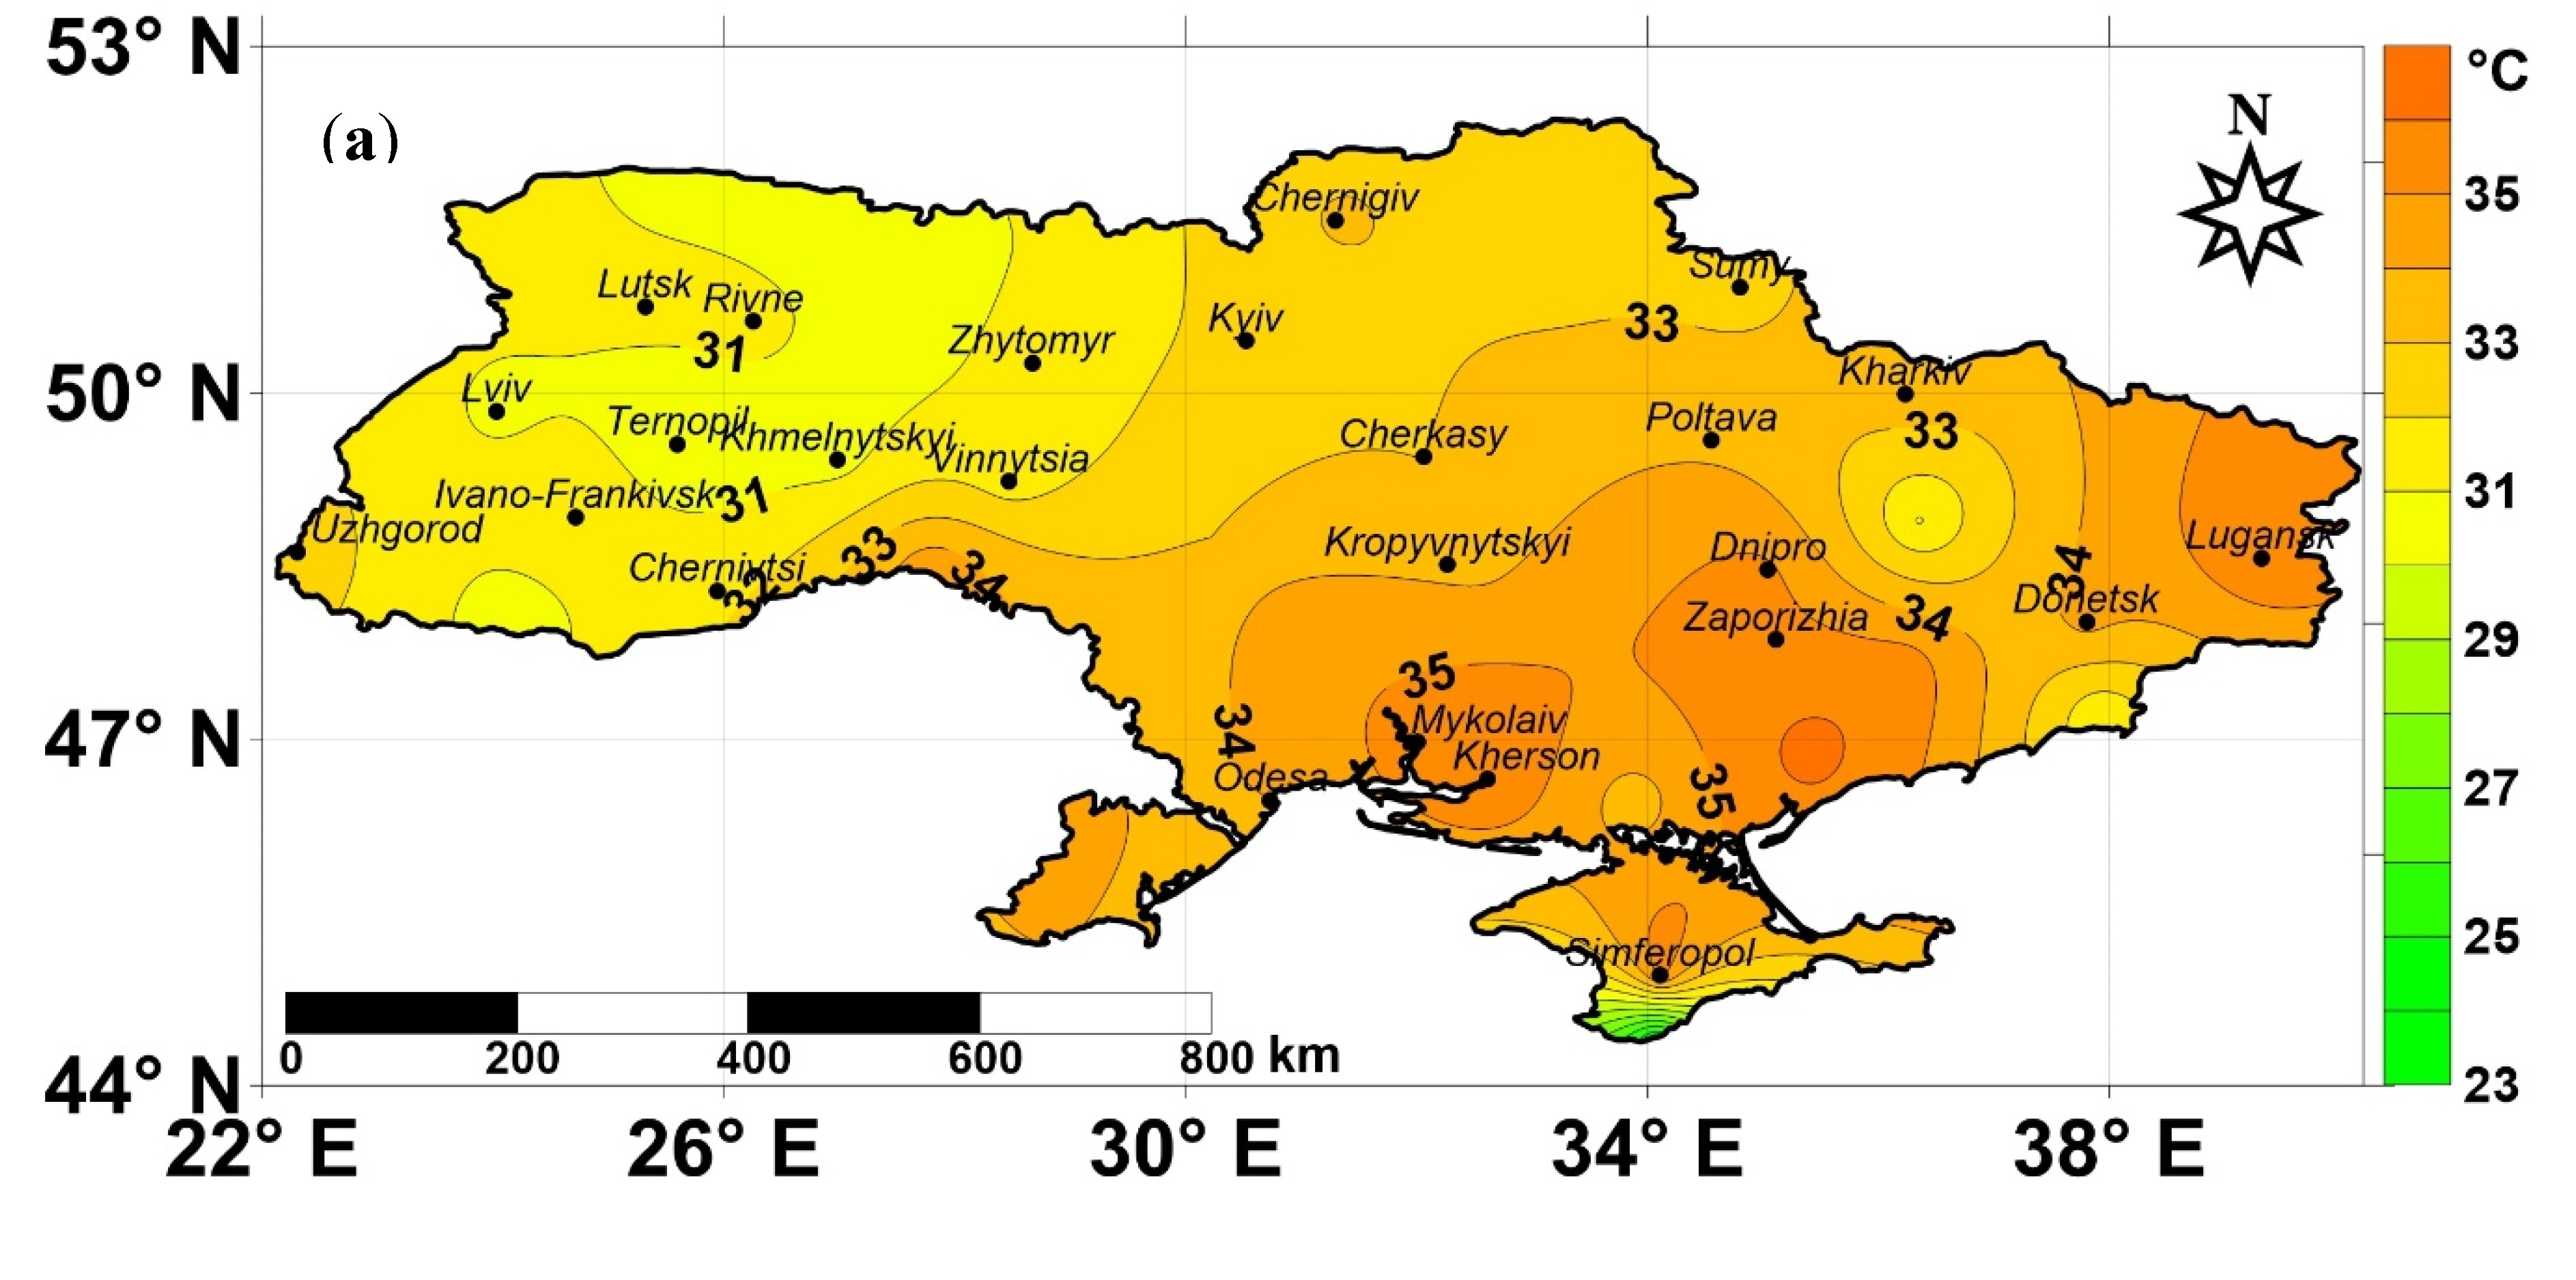
The HWM climatology over the reference period indicates a weak territorial fluctuation of this index (Figure 6a), both in zonal and meridional terms. The spatial distribution of this index in 2010 is presented in Figure 6b. The results of the comparison of the spatial distribution of different indices across the territory of Ukraine (Figure 2, Figure 3, Figure 4 and Figure 5) demonstrate a certain similarity between HWM and HWA. In addition, HWM showed anomalies of both signs. For a considerable part of the country, the 2010 anomaly was positive-average intensity of the heatwave was on average 1 °C higher than in the reference period, with the maximum exceedance of 3.3 °C (city of Semenivka). On a fairly large area from the northwest to the southeast, no anomalies were observed—the corresponding intensities of the heatwaves are in a full agreement. Finally, in western and south-western regions, a small negative anomaly (HWM < 0) about one degree was observed. Summarizing, we can state that the HWM values increase from west and southwest to the northeast of the territory of Ukraine.
3.2. Climate Indices for 2010 Heatwave and 1981–2010 Reference Period
3.2.1. HWMI
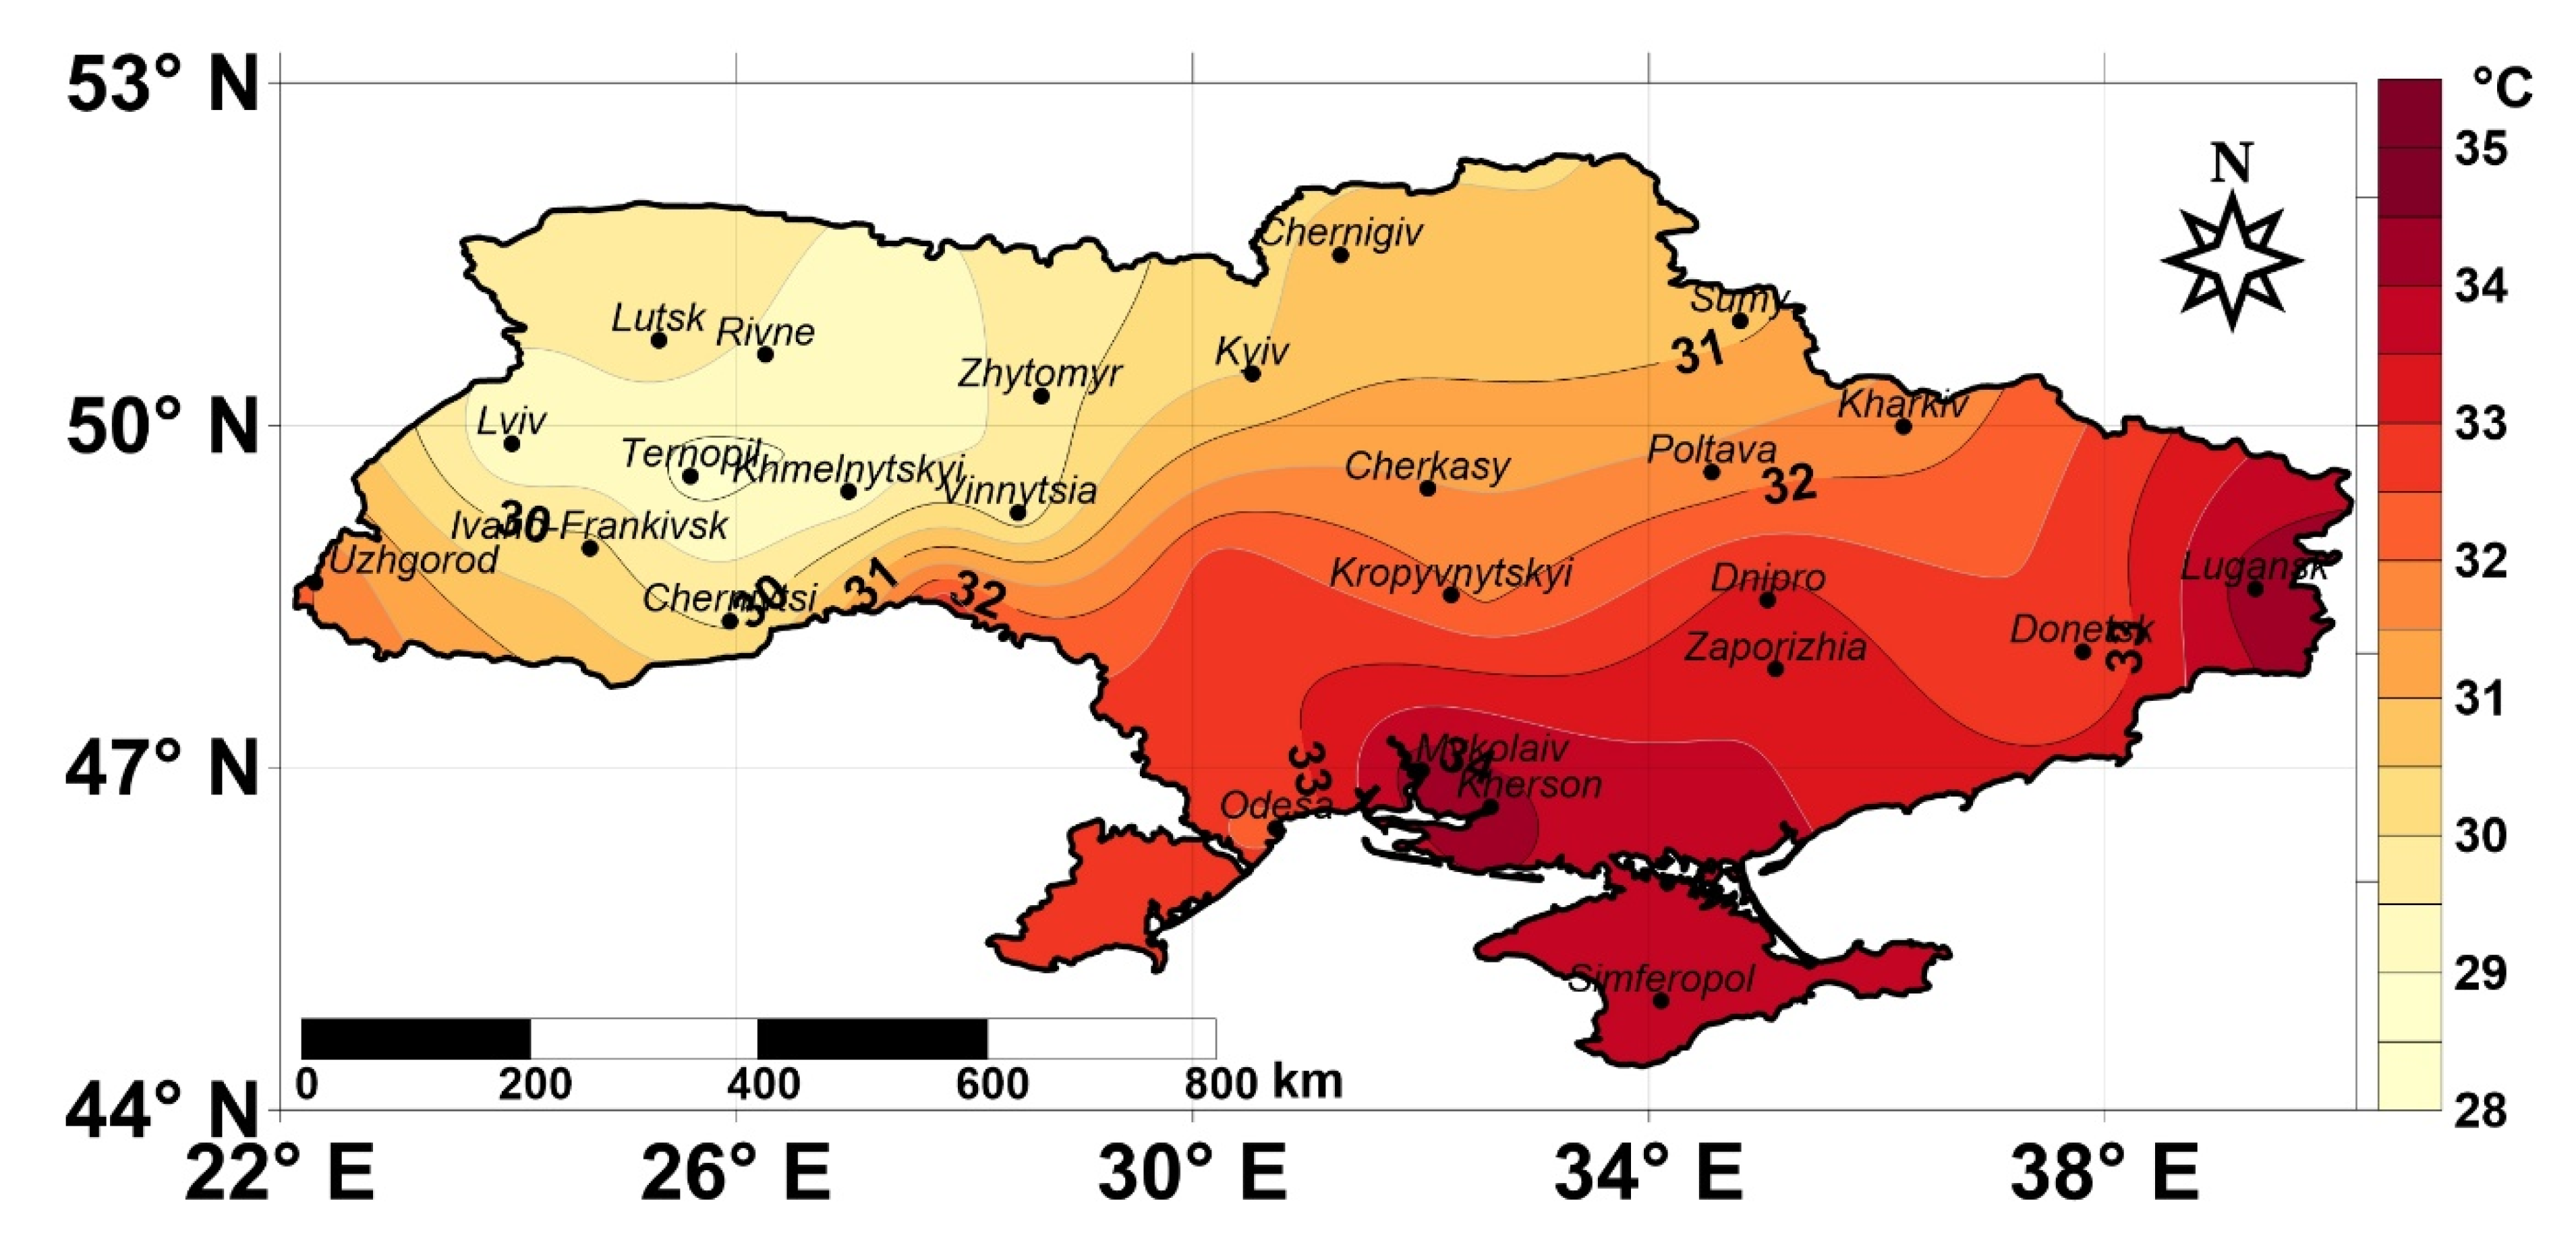
HWMI was measured as a sum of scaled magnitudes of all sub-heatwaves (HWMI) [30]. Since the heatwave is always a multiple of a whole number of sub-heatwaves, according to the methodology presented herein, if an event was not a multiple of sub-heatwave, then the sub-heatwave which is usually a three-day event has been extended by another one or two days, for which the maximum temperature did not exceed the predefined temperature threshold. It should be noted that the above procedure did not produce any significant distortion of the results since the magnitude of such sub-heatwaves was insignificant—at the level of inaccuracy and round-offs. As shown by the results of the calculation for the entire territory of Ukraine, the HWMI index was quite sensitive. HWMI index ranges till 0 to 11 for the territory of Ukraine (RHWMI = 11) (Figure 7). When comparing the field of threshold temperatures (Figure 8), defined for July, with the HWMI index (Figure 7), a certain spatial discrepancy was found. The highest temperature thresholds are typical for the southeast of Ukraine, with the epicenter of the mega-heatwave 2010 located in the northeast of the country. The blocking anticyclone over the European part of Russia was the reason for this mega-heatwave over the central and eastern part of Ukraine and western Russia [10,43,44]; therefore the highest air temperatures observed on the northeast of Ukraine close to the epicenter this HW over the European part of Russia.
3.2.2. HWMId
As already noted above, Russo et al. [31] proposed an alternative index HWMId, which is free from saturation in the high-temperature area. Its obvious advantage is that it is calculated for a specific day of the heat event. This is especially important in cases where the heatwave is a long event containing one- or two-day temperature discontinuities. HWMI smoothes such discontinuities in sub-heatwaves, while HWMId allows to simply ignore them when the value is < 1, that is, when the maximum daily temperature Td < T30y75p. Therefore, the informative value of the HWMId index is higher because it more accurately reflects the heat event by dealing only with the participating days, as opposed to the HWMI index.
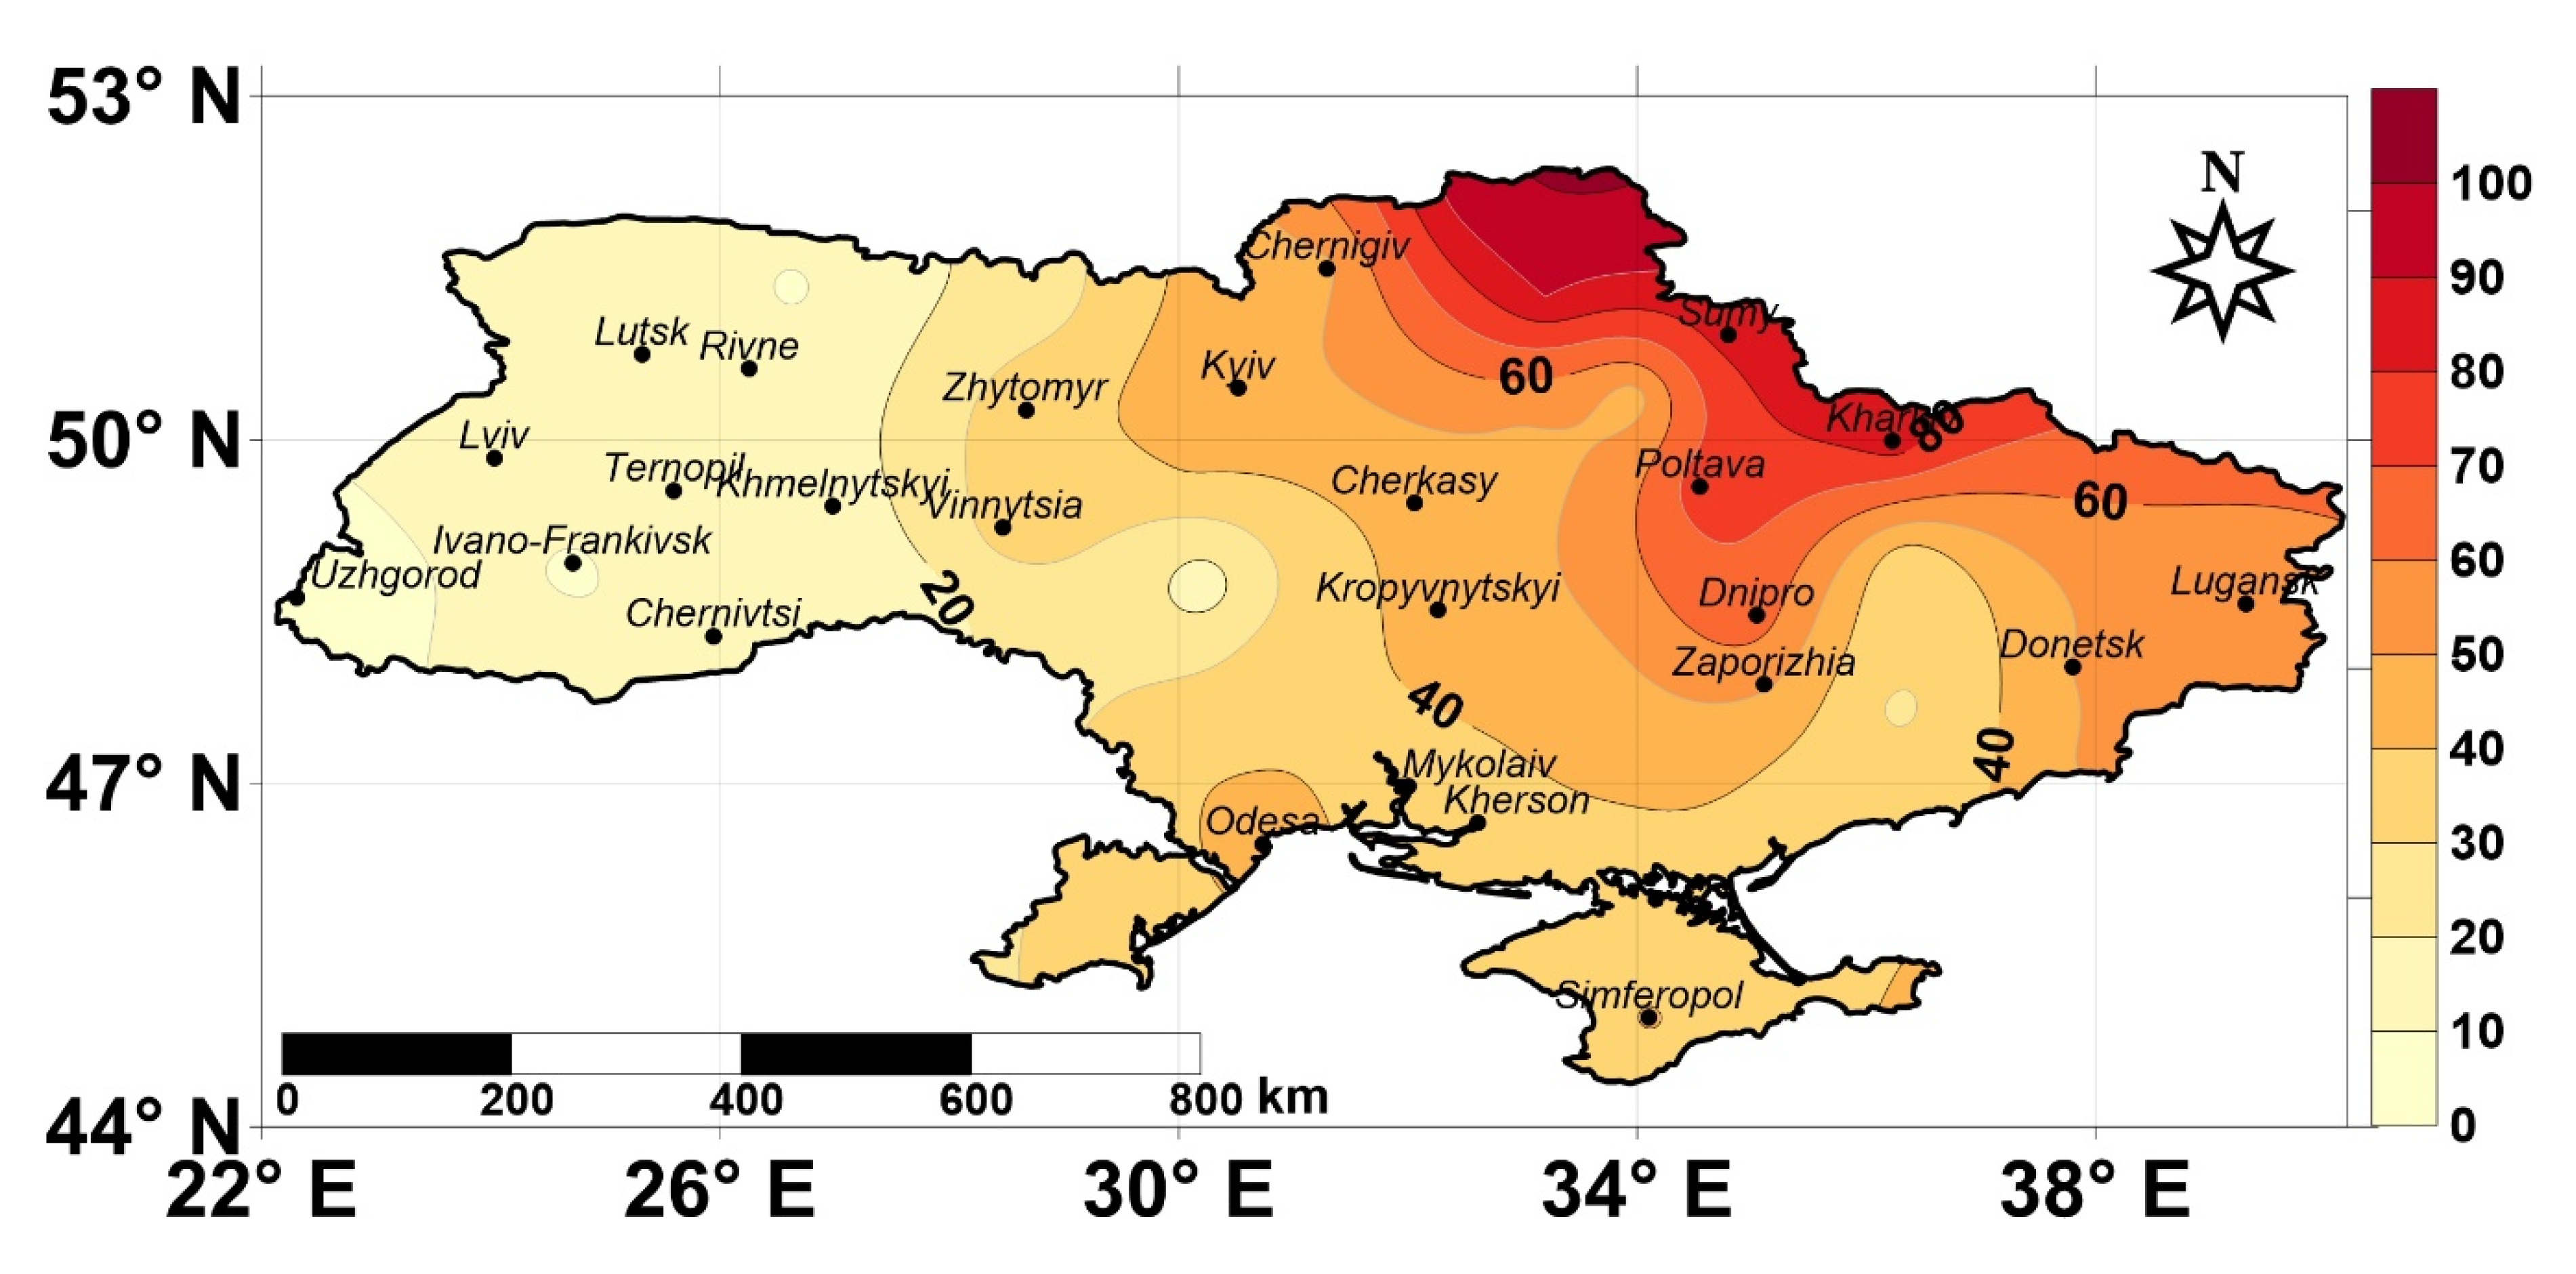
Calculation of the aforementioned index for a certain heat event allows a better understanding of their differences and advantages. An anomalous event that took place in summer 2010 in Eurasia was also measured for Ukraine with the aid of the HWMId index (Figure 9). The overall picture for both indices was similar—epicenters of the event, high and low-value areas have shown a complete overlapping. However, the variability of this index is found in a much wider range of values. The HWMId index ranges till 0 to 111 for the territory of Ukraine during the 2010 heatwave (RHWMId = 111).
3.3. The Statistical Estimation of Heatwave Aspects
The correlation analysis was carried out to establish the collinearity degree between the proposed heatwave aspects, or to estimate how strong/weak are statistical relationships. Correlation coefficients (significant at p < 0.05) shown in Table 1 and Table 2 were calculated using the program “Statistica”. Table 1 presents the square symmetric correlation matrix, constructed for the whole domain. The variables are the mean values of the heatwave aspects determined for the 1981–2010 observation period for all weather stations. Thus, the list consists of 49 values for every aspect. As seen in Table 1, all heatwave aspects which are scaled to the reference period, are in a positive, moderate, and strong statistical relationship with each other. The behavior of HWN and HWD with regard to other factors demonstrate certain analogy. HWA and HWM behave in a similar way. Despite the fact that HWF represents an exception, to some extent, its statistical relationships with the HWN and HWD are in the strong correlation, and with the HWA and HWM – in the moderate correlation.
Anomalies of the heatwave aspects in 2010 are of particular interest. The correlation matrix presented in Table 2 prepared on the same principle as Table 1. The difference is that the variables are presented by the anomalies of some aspects, namely the difference between the aspect value for 2010 and the value for the reference period 1981–2010. The lists for each aspect have a regular spatial row. Thus, the obtained correlation values are consistent for the entire domain. As can be seen from Table 2 below, HWM and HWF correlate with all the aforementioned aspects, while HWM with respect to HWN, HWD, and HWF is in a moderate negative statistical relationship. The exception is HWA, with which HWM is nearly in a positive functional relationship (paired correlation coefficient is 0.997), i.e., the spatial distribution of these indices for 2010 are almost the same (in terms of extreme temperatures of the hottest heatwaves and average temperatures of heatwaves). The statistical relationship between these indices and others also demonstrates very close agreement (see Table 1). The correlation of HWF with other aspects is fundamentally different: correlation with both HWA and HWM is moderate negative, and with HWN and HWD—positive and visibly strong. HWD demonstrated a statistically significant relationship only with HWF—the correlation is strongly positive, and with HWM—the correlation is moderately negative. A strong statistical relationship was not found between HWN and any of the aspects, thus showing its independence. As for HWN, it has an absolutely similar relationship (moderate negative correlation) with HWA and HWM.
4. Discussion
4.1. Comparison of Heatwave Aspects
The results of this study do not necessarily apply to other global regions. Therefore, it is important to consider several aspects of the heatwave to understand the full spectrum of heatwave characteristics for each region of interest. For every aspect, the variability of its values is quite similar in both sign and spatial extent (in particular, for HWN, HWD, and HWF), especially in the reference period 1981–2010. Regions, where variability of all aspects are poorly pronounced, are among the definitions.
The spatial variability of HWF (Figure 4a) was quite noticeable compared to HWN, HWD (Figure 2a and Figure 3a). Since there is a tendency to increase the number of waves and days involved in this event, the likelihood of an increase in the duration of the heatwave increases. It is difficult to predict HWN variability (Figure 2b) if based only on HWF data (Figure 4b) for a particular year. However, for the reference period, this statistical relationship is obvious (Figure 2a and Figure 4a). There are some spatial similarities between HWA (Figure 5a) and HWM (Figure 6a); however, the change in average temperature experienced during the 2010 heatwave (HWM) is greater than the change on the hottest day of the hottest annual event (HWA). This may be explained by the prolongation of heatwaves, the increase in days that consistently exceed the threshold. HWA is based on a single day; therefore, it is not affected by the increase in event duration. However, this is an important result, since it indicates that over the Ukraine the rise of the heatwave is most likely due to the prolongation of this event. The spatial variability of HWA and HWM (Figure 5a or Figure 6a) is quite similar, especially for the 1981–2010 reference period.
Thus, in all five aspects of heatwaves and in both time periods, there is an area with the highest upward trends, the northeast of the country. However, caution is advised when interpreting trends in the regions, as a result is significantly affected by the spatial distribution of the observation stations.
4.2. Comparison of Heatwave Climate Indices
There are many metrics (or index) that seek to provide quantitative information about the periods of extreme temperatures or excessive. The Heatwave Magnitude Index (HWMI) [30], which takes into account not only the duration of the heatwave but also the intensity estimated by weighing the temperature values of the heatwave with respect to the probability distribution of the annual maximum of the reference period, allows determining the magnitude of the heatwave in different time periods and in different regions. The HWMI is defined as the maximum magnitude of the heatwaves in a year, where heatwave is the period ≥ 5 consecutive days with maximum temperature above the daily threshold for the reference period 1981—2010. The minimum number of consecutive hot days required to be considered as heatwave may vary across regions: for example, Perkins and Alexander [34], focusing on Australia, have defined a heatwave as an event of at least three consecutive days above the threshold. Who used a particular temperature threshold CTX90pct —the threshold is the calendar day 90th percentile of Tmax, based on a 15-day window, whereas Fischer and Schär [2] defined a European heatwave as an event of at least six days duration. The threshold is defined as the 90th percentile of daily maxima, centered on a 31-day window. As shown in the previous studies [45], smaller windows do not filter noise and synoptic-scale fluctuations. Using HWMI, we have shown that an extraordinary heatwave in 2010 is still considered a rare event for Ukraine. In terms of the heatwave categories proposed by Russo et al. [30], it turns out that about 10% of the territory was affected by «Very Extreme» and more than 40%— by «Extreme» heatwaves. The new HWMId index [31], which also takes into account the severity of extreme temperatures and the duration of the heatwave, differs from the previous HWMI version [31] for two main improvements:
- the division in sub-heatwaves is not necessary;
- the daily magnitude is assigned by the function with values in (0, +∞) and not in a bounded interval (0, 1) as for the empirical cumulative distribution function used in the HWMI.
The statistical dependence between the two heatwave indices of 2010 in the territory of Ukraine turned out to be quite high (0.99), practically functional. Thus, methodologically different indices formally carry the same information on climate threats. When calculating the HWMI for Ukraine, we had no problems with the probability of saturation of the sub-heatwave magnitude, but we completely agree with the authors [31] on the feasibility of using only the HWMId index in future studies.
5. Conclusions
Heatwaves that arose during the period 1981–2010 was investigated using a multidimensional framework, proposed by Perkins and Alexander [34]. Each heatwave analyzed with respect to five aspects—they early number heatwaves (HWN), length of the longest yearly event (HWD), the yearly sum of participating heatwave days (HWF), the hottest day of the hottest yearly event (HWA), and the average magnitude of all yearly heatwaves (HWM), all calculated yearly. It was found that for most regions of Ukraine, anomalies of all aspects of the 2010 heatwave were clearly visible, although sometimes poorly differentiated. The statistical comparison showed that there is certain multicollinearity between aspects of the heatwave. The use of all five aspects in heatwave research may be inappropriate. In our opinion, only HWN, HWF, and HWM are sufficient for the research of heatwaves on the territory of Ukraine.
The heatwave climate indices [30,31] have proved to be sufficiently sensitive because they respond to minor changes in the daily maximum air temperature. If within one heatwave, the total temperature changes by 3–4 °C, in other words, if the maximum daily air temperature changes on average by 1 °C, then the HWMI value will change by 0.1. The accuracy of the calculation of this indicator should be limited to one-tenth. Since the HWMId index is determined by the sum of the daily magnitudes, so its sensitivity depends on the sensitivity of the daily magnitude, which in turn depends on the variability of quartile measurement (IQR). According to the specific estimates on this point, the change in the maximum daily air temperature by 10 °C results in a change of daily magnitude by 0.3. Therefore, the calculation of HWMId should also be made accurate to a tenth. Since the range of the indices value is quite different (RHWMI = 11; RHWMId = 111), this yields the proposition that the HWMId is substantially more sensitive. In addition, it is worth mentioning that the HWMId magnitude should be continuously calculated over the month, season, and year, and then used for the index calculation in cases when its value >1. At the same time, the HWMId can be a source of characteristic information in terms of excess heat on a monthly, seasonally, and yearly basis. Future studies will focus on the integration of 2D spatial data on indices into GIS environment and overlaying with layers of administrative regions of Ukraine, population density, and agricultural lands for evaluation of potential impact and risks of heatwaves on environment, population, and economy.
Supplementary Materials
The following are available online at https://www.mdpi.com/2073-4441/12/4/962/s1, Table S1: Information about the meteorological stations in Ukraine used in this investigation.
Author Contributions
Conceptualization, O.S., R.O. and S.S.; resources and data curation, I.K. and H.S.; Formal analysis, O.S., R.O., S.S., I.K. and H.S.; Methodology, O.S., R.O. and S.S.; Project administration, S.S.; Validation, O.S., R.O., H.S. and I.K.; Visualization, I.K.; Writing—original draft, O.S., R.O., S.S. and I.K.; Writing—review & editing, O.S., S.S., I.K. All authors have read and agreed to the published version of the manuscript.
Funding
This research received no external funding.
Acknowledgments
We would like to thank Alexander Mahura (University of Helsinki (UHEL), Institute for Atmospheric and Earth System Research (INAR)) for useful discussions, constructive comments, and advice.
Conflicts of Interest
The authors declare no conflict of interest.
References
- Coumou, D.; Rahmstorf, S. A decade of weather extremes. Nat. Clim. Chang. 2012, 2, 491–496. [Google Scholar] [CrossRef]
- Fischer, E.M.; Schär, S. Consistent geographical patterns of changes in high-impact European heatwaves. Nat. Geosci. 2010, 3, 398–403. [Google Scholar] [CrossRef]
- Tomczyk, A.M.; Bednorz, E. Heatwaves in Central Europe and their circulation conditions. Int. J. Climatol. 2016, 36, 770–782. [Google Scholar] [CrossRef]
- Gershunov, A.; Cayan, D.R.; Iacobellis, S.F. The great 2006 heatwave over California and Nevada: Signal of an increasing trend. J. Clim. 2009, 22, 6181–6203. [Google Scholar] [CrossRef] [Green Version]
- Fink, A.; Brücher, T.; Krüger, A.; Leckebusch, G.; Pinto, J.; Ulbrich, U. The 2003 European summer heatwaves and drought—Synoptic diagnosis and impacts. Weather 2004, 59, 209–216. [Google Scholar] [CrossRef] [Green Version]
- Fouillet, A.; Rey, G.; Wagner, V.; Laaidi, K.; Empereur-Bissonnet, P.; Le Tertre, A.; Frayssinet, P.; Bessemoulin, P.; Laurent, F.; De Crouy-Chanel, P.; et al. Has the impact of heatwaves on mortality changed in France since the European heatwave of summer 2003? A study of the 2006 heatwave. Int. J. Epidemiol. 2008, 37, 309–317. [Google Scholar] [CrossRef]
- Rebetez, M.; Dupont, O.; Giroud, M. An analysis of the July 2006 heatwave extent in Europe compared to the record year of 2003. Theor. Appl. Climatol. 2009, 95, 1–7. [Google Scholar] [CrossRef] [Green Version]
- Hoy, A.; Hänsel, S.; Skalak, P.; Ustrnul, Z.; Bochníček, O. The extreme European summer of 2015 in a long-term perspective. Int. J. Clim. 2016, 37, 943–962. [Google Scholar] [CrossRef]
- Grumm, R.H. The Central European and Russian heat event of July–August 2010. Bull. Am. Meteorol. Soc. 2011, 92, 1285–1296. [Google Scholar] [CrossRef] [Green Version]
- Shevchenko, O.; Lee, H.; Snizhko, S.; Mayer, H. Long-term analysis of heatwaves in Ukraine. Int. J. Climatol. 2014, 34, 1642–1650. [Google Scholar] [CrossRef]
- Lhotka, O.; Kyselý, J. Hot Central-European summer of 2013 in a long-term context. Int. J. Climatol. 2015, 35. [Google Scholar] [CrossRef]
- Delworth, T.L.; Mahlman, J.; Knutson, T.R. Changes in heat index associated with CO2-induced global warming. Clim. Chang. 1999, 43, 369–386. [Google Scholar] [CrossRef]
- McCarthy, J.; Canziani, O.; Leary, N.; Dokken, D.; White, K. (Eds.) Climate Change 2001: Impacts, Adaptation, and Vulnerability; Cambridge University Press: Cambridge, UK, 2001; p. 1032. [Google Scholar]
- IPCC. Climate Change 2014: Synthesis Report. Contribution of Working Groups I, II and III to the Fifth Assessment Report of the Intergovernmental Panel on Climate Change; Pachauri, R.K., Meyer, L.A., Eds.; IPCC: Geneva, Switzerland, 2014; p. 151. [Google Scholar]
- Balabukh, V.; Lukianets, O. Climate change and its consequences in Rakhiv district of Transcarpathian region. HydrolohiiaHydrokhimiia I Hidroekolohiia 2015, 37, 132–148. [Google Scholar]
- Shevchenko, O.; Snizhko, S.; Matzarakis, A. Recent trends on human thermal bioclimate conditions in Kyiv, Ukraine. Geogr. Pol. 2020, 93, 89–106. [Google Scholar] [CrossRef] [Green Version]
- Meehl, G.A.; Tebaldi, C. More intense, more frequent, and longer lasting heatwaves in the 21st century. Science 2004, 305, 994–997. [Google Scholar] [CrossRef] [Green Version]
- Tan, J.; Zheng, Y.; Song, G.; Kalkstein, L.S.; Kalkstein, A.J.; Tang, X. Heatwave impacts on mortality in Shanghai, 1998 and 2003. Int. J. Biometeorol. 2007, 51, 193–200. [Google Scholar] [CrossRef]
- Monteiro, A.; Carvalho, V.; Oliveira, T.; Sousa, C. Excess mortality and morbidity during the July 2006 heatwave in Porto, Portugal. Int. J. Biometeorol. 2013, 57, 155–167. [Google Scholar] [CrossRef] [Green Version]
- Kyselý, J. Temporal fluctuations in heatwaves at Prague-Klementinum, the Czech Republic, from 1901–97, and their relationships to atmospheric circulation. Int. J. Climatol. 2002, 22, 33–50. [Google Scholar] [CrossRef]
- Gong, D.Y.; Pan, Y.Z.; Wang, J.A. Changes in extreme daily mean temperatures in summer in eastern China during 1955–2000. Theor. Appl. Climatol. 2004, 77, 25–37. [Google Scholar]
- Zhang, S.Y.; Wang, S.R.; Zhang, Y.S.; Zhang, D.K.; Song, Y.L. The climate character of high temperature and the prediction in the large cities of east of China. J. Trop. Meteorol. 2004, 20, 750–760. [Google Scholar]
- Beniston, M. The 2003 heatwave in Europe: A shape of things to come? An analysis based on Swiss climatological data and model simulations. Geophys. Res. Lett. 2004, 31, L02202. [Google Scholar] [CrossRef] [Green Version]
- Gosling, S.N.; McGregor, G.R.; Pàldy, A. Climate change and heat-related mortality in six cities. P 1: Model constructionand validation. Int. J. Biometeorolgy 2007, 51, 525–540. [Google Scholar] [CrossRef] [PubMed]
- Kyselý, J.; Kríz, B. Decreased impacts of the 2003 heatwaves on mortality in the Czech Republic: An improved response? Int. J. Biometeorol. 2008, 52, 733–745. [Google Scholar] [CrossRef] [PubMed]
- Cowan, T.; Purich, A.; Perkins, S.; Pezza, A.; Boschat, G.; Sadler, K. More Frequent, Longer, and Hotter Heatwaves for Australia in the Twenty-First Century. J. Clim. 2014, 27, 5851–5871. [Google Scholar] [CrossRef]
- Cloutier-Bisbee, S.R.; Raghavendra, A.; Milrad, S.M. Heatwaves in Florida: Climatology, Trends, and Related Precipitation Events. J. Appl. Meteorol. Climatol. 2019, 58, 447–466. [Google Scholar] [CrossRef]
- Antics, A.; Pascal, M.; Laaidi, K.; Wagner, V.; Corso, M.; Declercq, C.; Beaudeau, P. A simple indicator to rapidly assess the short-term impact of heatwaves on mortality within the French heat warning system. Int. J. Biometeorol. 2013, 57, 75–81. [Google Scholar] [CrossRef]
- Pascal, M.; Wagner, V.; Le Tertre, A.; Laaidi, K.; Honor´e, C.; B´enichou, F.; Beaudeau, P. Definition of temperature thresholds: The example of the French heatwave warning system. Int. J. Biometeorol. 2013, 57, 21–29. [Google Scholar] [CrossRef]
- Russo, S.; Dosio, A.; Graversen, R.G.; Sillmann, J.; Carrao, H.; Dunbar, M.B.; Vogt, J.V. Magnitude of extreme heatwaves in present climate and their projection in a warming world. J. Geophys. Res. Atmos. 2014, 119, 12–500. [Google Scholar] [CrossRef] [Green Version]
- Russo, S.; Sillmann, J.; Fischer, E.M. Top ten European heatwaves since1950 and their occurrence in the coming decades. Environ. Res. Lett. 2015, 10, 124003. [Google Scholar] [CrossRef]
- Lass, W.; Haas, A.; Hinkel, J.; Jaeger, C. Avoiding the avoidable: Towards a European heatwaves risk governance. Int. J. Disaster Risk Sci. 2011, 2, 1–4. [Google Scholar] [CrossRef] [Green Version]
- Hoag, H. Russian summer tops ‘universal ’heatwave index. Nature 2014, 16. [Google Scholar] [CrossRef]
- Perkins, S.E.; Alexander, L.A.; Nairn, J.R. Increasing frequency, intensity and duration of observed global heatwaves and warm spells. Geophys. Res. Lett. 2012, 39, L20714. [Google Scholar] [CrossRef]
- Pepin, N.; Bradley, R.S.; Diaz, H.F.; Baraër, M.; Caceres, E.B.; Forsythe, N.; Fowler, H.; Greenwood, G.; Hashmi, M.Z.; Liu, X.D.; et al. Elevation-dependent warming in mountain regions of the world. Nat. Clim. Chang. 2015, 5, 424–430. [Google Scholar] [CrossRef] [Green Version]
- Perkins, S.E.; Alexander, L.V. On the measurement of Heatwaves. J. Clim. 2012, 25, 4500–4517. [Google Scholar] [CrossRef]
- Yu, S.; Yan, Z.; Freychet, N.; Li, Z. Trends in summer heatwaves in central Asia from 1917 to 2016: Association with large-scale atmospheric circulation patterns. Int. J. Clim. 2020, 40, 115–127. [Google Scholar] [CrossRef] [Green Version]
- Ceccherini, G.; Russo, S.; Ameztoy, I.; Francesco Marchese, A.; Carmona-Moreno, C. Heatwaves in Africa 1981–2015, observations and reanalysis. Nat. Hazards Earth Syst. Sci 2017, 17, 115–125. [Google Scholar] [CrossRef] [Green Version]
- Souch, C.; Grimmond, S. Applied climatology: Urban climate. Prog. Phys. Geogr. 2006, 30, 270–279. [Google Scholar] [CrossRef]
- Li, D.; Bou-Zeid, E. Synergistic Interactions between Urban Heat Islands and Heatwaves: The Impact in Cities Is Larger than the Sum of Its Parts. J. Appl. Meteorol. Climatol. 2013, 52, 2051–2064. [Google Scholar] [CrossRef] [Green Version]
- Lemonsu, A.; Viguié, V.; Daniel, M.; Masson, V. Vulnerability to heatwaves: Impact of urban expansion scenarios on urban heat island and heat stress in Paris (France). Urban Clim. 2015, 14, 586–605. [Google Scholar] [CrossRef]
- Shevchenko, O.G.; Samchuk, E.V.; Snizhko, S.I. Characteristics of synoptic processes during heatwave in July-August 2010 in Ukraine. Proc. Russ. State Hydrometeorol. Univ. 2013, 29, 85–94. [Google Scholar]
- Dole, R. Was there a basis for anticipating the 2010 Russian heatwave? Geophys. Res. Lett. 2011, 38, L06702. [Google Scholar]
- Konstantinov, P.I.; Varentsov, M.I.; Malinina, E.P. Modeling of thermal comfort conditions inside the urban boundary layer during Moscow’s 2010 summer heatwave (case-study). Urban Clim. 2014, 10, 563–572. [Google Scholar] [CrossRef]
- Shevchenko, O.; Snizhko, S.; Oliynyk, R.; Kostyrko, I. Indicators of temperature anomalies of regional climate. Visnyk Kyivskogo Nac. Universytetu Im. Tarasa ShevchenkaGeogr. [Bull. Taras Shevchenko Natl. Univ. KyivGeogr.] 2019, 1, 15–19. [Google Scholar]
Figure 1.
Location of the meteorological stations in Ukraine used in this investigation.

Figure 2.
Spatial distribution of (a) the climatology of HWN (frequency of heatwave events during summertime) averaged over 1981–2010 and (b) the anomalies of HWN for 2010 over different geographical regions of Ukraine.
Figure 2.
Spatial distribution of (a) the climatology of HWN (frequency of heatwave events during summertime) averaged over 1981–2010 and (b) the anomalies of HWN for 2010 over different geographical regions of Ukraine.

Figure 3.
Spatial distribution of (a) the climatology of HWD (length of the longest summertime event) averaged over 1981–2010 and (b) the anomalies of HWD for 2010 over different geographical regions of Ukraine.
Figure 3.
Spatial distribution of (a) the climatology of HWD (length of the longest summertime event) averaged over 1981–2010 and (b) the anomalies of HWD for 2010 over different geographical regions of Ukraine.

Figure 4.
Spatial distribution of (a) the climatology of HWF (sum of participating heatwave days in the summertime season, which meet the HW definition criteria over a 30-day interval) averaged over 1981–2010 and (b) the anomalies of HWF for 2010 over different geographical regions of Ukraine.
Figure 4.
Spatial distribution of (a) the climatology of HWF (sum of participating heatwave days in the summertime season, which meet the HW definition criteria over a 30-day interval) averaged over 1981–2010 and (b) the anomalies of HWF for 2010 over different geographical regions of Ukraine.

Figure 5.
Spatial distribution of (a) the climatology of HWA (hottest day of hottest summertime event) averaged over 1981-2010 and (b) the anomalies of HWA for 2010 over different geographical regions of Ukraine.
Figure 5.
Spatial distribution of (a) the climatology of HWA (hottest day of hottest summertime event) averaged over 1981-2010 and (b) the anomalies of HWA for 2010 over different geographical regions of Ukraine.

Figure 6.
Spatial distribution of (a) the climatology of HWM (average magnitude of all summertime heatwaves) averaged over 1981–2010 and (b) the anomalies of HWM for 2010 over different geographical regions of Ukraine.
Figure 6.
Spatial distribution of (a) the climatology of HWM (average magnitude of all summertime heatwaves) averaged over 1981–2010 and (b) the anomalies of HWM for 2010 over different geographical regions of Ukraine.


Figure 7.
Spatial distribution of the HWMI index for 2010 heatwave over different geographical regions of Ukraine.
Figure 7.
Spatial distribution of the HWMI index for 2010 heatwave over different geographical regions of Ukraine.

Figure 8.
Spatial distribution of July temperature thresholds as the 90th percentile of reference period 1981–2010 over different geographical regions of Ukraine
Figure 8.
Spatial distribution of July temperature thresholds as the 90th percentile of reference period 1981–2010 over different geographical regions of Ukraine

Figure 9.
Spatial distribution of the HWMId for 2010 heatwave over different geographical regions of Ukraine.
Figure 9.
Spatial distribution of the HWMId for 2010 heatwave over different geographical regions of Ukraine.


Table 1.
Correlation of heatwave aspects for 1981—2010 reference period.
| Aspects | Means | Std.Dev | HWN | HWD | HWA | HWF | HWN |
|---|---|---|---|---|---|---|---|
| HWN | 0.457 | 0.147 | 1.000 | 0.793 | 0.836 | 0.558 | 0.359 |
| HWD | 2.565 | 0.952 | 1.000 | 0.859 | 0.514 | 0.331 | |
| HWF | 3.038 | 0.892 | 1.000 | 0.654 | 0.515 | ||
| HWA | 37.867 | 2.679 | 1.000 | 0.832 | |||
| HWM | 32.816 | 2.166 | 1.000 |
Table 2.
Correlation of anomalies of the heatwave aspects for 2010.
| ∆Aspects | Means | Std.Dev. | ∆HWN | ∆HWD | ∆HWA | ∆HWF | ∆HWM |
|---|---|---|---|---|---|---|---|
| ∆HWN | 1.89 | 0.89 | 1.000 | 0.102 | −0.403 | 0.658 | −0.408 |
| ∆HWD | 11.25 | 6.51 | 1.000 | −0.278 | 0.765 | −0.286 | |
| ∆HWA | 1.71 | 14.51 | 1.000 | −0.307 | 0.997 | ||
| ∆HWF | 19.51 | 9.78 | 1.000 | −0.312 | |||
| ∆HWM | 2.78 | 14.49 | 1.000 |
© 2020 by the authors. Licensee MDPI, Basel, Switzerland. This article is an open access article distributed under the terms and conditions of the Creative Commons Attribution (CC BY) license (http://creativecommons.org/licenses/by/4.0/).
Share and Cite
MDPI and ACS Style
Shevchenko, O.; Oliinyk, R.; Snizhko, S.; Svintsitska, H.; Kostyrko, I. Indexing of Heatwaves in Ukraine. Water 2020, 12, 962. https://doi.org/10.3390/w12040962
AMA Style
Shevchenko O, Oliinyk R, Snizhko S, Svintsitska H, Kostyrko I. Indexing of Heatwaves in Ukraine. Water. 2020; 12(4):962. https://doi.org/10.3390/w12040962
Chicago/Turabian StyleShevchenko, Olga, Rostyslav Oliinyk, Sergiy Snizhko, Hanna Svintsitska, and Ivan Kostyrko. 2020. "Indexing of Heatwaves in Ukraine" Water 12, no. 4: 962. https://doi.org/10.3390/w12040962
Note that from the first issue of 2016, this journal uses article numbers instead of page numbers. See further details here.