Article

Hydropower Generation Through Pump as Turbine: Experimental Study and Potential Application to Small-Scale WDN

by
Matteo Postacchini
1,*,
Giovanna Darvini
1,
Fiorenza Finizio
1,
Leonardo Pelagalli
2,
Luciano Soldini
1 and
Elisa Di Giuseppe
1
1
Department of Civil and Building Engineering, and Architecture (DICEA), Università Politecnica delle Marche, 60131 Ancona, Italy
2
Department of Industrial Engineering and Mathematical Sciences (DIISM), Università Politecnica delle Marche, 60131 Ancona, Italy
*
Author to whom correspondence should be addressed.
Water 2020, 12(4), 958; https://doi.org/10.3390/w12040958
Submission received: 7 February 2020 / Revised: 11 March 2020 / Accepted: 23 March 2020 / Published: 28 March 2020

Abstract

:
Pump-As-Turbine (PAT) technology is a smart solution to produce energy in a sustainable way at small scale, e.g., through its exploitation in classical Water Distribution Networks (WDNs). PAT application may actually represent a suitable solution to obtain both pressure regulation and electrical energy production. This technology enables one to significantly reduce both design and maintenance costs if compared to traditional turbine applications. In this work, the potential hydropower generation was evaluated through laboratory tests focused on the characterization of a pump working in reverse mode, i.e., as a PAT. Both hydrodynamic (pressure and discharge) and mechanical (rotational speed and torque) conditions were varied during the tests, with the aim to identify the most efficient PAT configurations and provide useful hints for possible real-world applications. The experimental findings confirm the good performances of the PAT system, especially when rotational speed and water demand are, respectively, larger than 850 rpm and 8 L/s, thus leading to efficiencies greater than 50%. Such findings were applied to a small municipality, where daily distribution of pressure and discharge were recorded upstream of the local WDN, where a Pressure Reducing Valve (PRV) is installed. Under the hypothesis of PRV replacement with the tested PAT, three different scenarios were studied, based on the mean recorded water demand and each characterized by specific values of PAT rotational speed. The best performances were observed for the largest tested speeds (1050 and 1250 rpm), which lead to pressure drops smaller than those actually due to the PRV, thus guaranteeing the minimum pressure for users, but also to mechanical powers smaller than 100 W. When a larger mean water demand is assumed, much better performances are reached, especially for large speeds (1250 rpm) that lead to mechanical powers larger than 1 kW combined to head drops a bit larger than those observed using the PRV. A suitable design is thus fundamental for the real-world PAT application.

1. Introduction

Nowadays, the need to produce energy in a sustainable way is an important issue to tackle to both improve environment quality and human life. To this effort, new energy systems, exploiting different available natural sources such as water, have been developed over time to reduce carbon emissions and produce energy in a renewable way (e.g., [1,2,3,4,5,6,7]). One of the main and first sources used to obtain clean energy is water, since the huge availability of hydraulic resources, which can be exploited in several ways through use of turbines, spanning from large facilities (order of hundreds of M W or G W ) to pico-hydro stations (order of kW or less). However, the high plant costs associated with the use of traditional turbines have discouraged the exploitation of small water resources in the past. Since international agreements and incentive policies by governments suggest that water use and reuse in our society are of primary importance, a significant contribution may come from small hydropower plants based on the exploitation of centrifugal pumps operating in reverse mode, called Pumps As Turbines (PATs) [2,4].
In recent years, many managers working in the water supply systems have started up a pressure control policy, installing Pressure Reducing Valves (PRVs) in the networks to limit leakages and pipe bursts, hence to reduce water resource losses. A further challenge is represented by the energy saving. However, despite the increasing number of the installed PRVs, attempts to convert the excess water pressure into energy, i.e., moving from energy dissipation to energy production, remain scarce [8]. Hydropower generation through application of PATs and PRVs has been proven to be a sustainable way to manage traditional water systems, which permits achieving both pressure control and leakage reduction [9]. The use of PAT is a smart solution, which also enables significantly reducing design and maintenance costs in comparison with classical turbines [10]. In fact, the mass-produced centrifugal pumps cover a wide range of both water heads and flow rates and are easy to install. Hence, their prime cost is lower than that of a turbine and their maintenance is easier and cheaper, due to the availability of spare parts on the market [11]. Centrifugal pumps also cover a wide power range, from less than 1 kW to more than 1000 kW.
However, while the performance curves of the pump are normally provided by the manufacturer, the analogous curves for the same machine used in reverse mode are generally not available. Further, each PAT is characterized by a different Best Efficiency Point (BEP) due to the different fluid-dynamics within the pump. In the last decade, such issue has been investigated under several points of view, i.e., through experimental tests [9,12] or using theoretical/empirical models for the prediction of PAT performance curves [1,13], though a general methodology has not been reached so far. In details, many laboratory tests were carried out running pumps in both direct and reverse modes, to investigate the links existing between such working conditions. The main goal was that of getting suitable predictive models to analytically obtain the performance curves of the PAT directly from the pump characteristics provided by the manufacturer [5]. Specifically, such predictive models mainly fall into two distinct groups. Models falling in the first group are based on the efficiency at BEP when the pump works in direct mode [14], while models falling in the second group are based on the pump specific speed number [5].
Recent research and projects are also trying to integrate this technology either within the urban environments, e.g. PATs to be installed in typical Water Distribution Networks (WDN) [15,16] or in particular applications, such as an oil refinery [17]. Some studies focused on the role of the flow-rate variability existing in pipelines where the PAT is supposed to be installed. Analyzing the influence of the rotational PAT speed, it was observed that a varying discharge requires a continuous change in the rotational speed to guarantee the best PAT efficiency [6]. Laboratory tests and real-world applications exist based on the use of PAT combined to electrical devices, e.g., an inverter drive, able at imposing the rotational speed which leads to the best PAT efficiency [18], although some researchers believe that no substantial benefits exist for practical applications [19].
The PAT integration into an existing WDN is strictly linked to the design strategy. Specifically, the design may deal with either some parts of the turbine, such as the diffuser [20], or the addition of specific devices, such as the above-mentioned inverter, able to improve the PAT efficiency under variable flow-rate and pressure conditions [21,22,23]. In the latter case, two main approaches exist: hydraulic regulation (HR) and electrical regulation (ER). In the HR approach, two regulating valves are combined to the PAT system: one upstream, in series with the PAT, and the other integrated into a bypass, in parallel with the PAT. Such combination allows the PAT to work in optimal conditions, in terms of both head drop and flow rate. In the ER approach, an inverter is required to change the rotational speed of the PAT, leading to the speed that optimizes the PAT working conditions.
The Variable Operating Strategy (VOS) is a suitable methodology which allows one to select the PAT for a specific WDN when either the HR or the ER approach is used [2,22]. The VOS mainly consists in the analysis of the required backpressure and available head, in addition to the estimate of the overall plant efficiency during a considered operational time range, such efficiency also depending on the rotational speed in the ER case [22]. A series of available PATs with known characteristics must be analyzed, with that providing the largest efficiency being the best solution. The hydraulic and electric regulation (HER) is a further method coming from the combination of the previous approaches, and consisting in the optimal regulation of the PAT using the valves of the HR approach and the inverter of the ER approach. For a complete overview, some authors expressly address the issue of the economic feasibility of the systems, considering the additional investment and maintenance costs, compared to provided energy benefits [24,25].
The motivation of the present study is mainly due to the fact that only some literature works investigate the possible use of a PAT in place of or in parallel to a PRV which regulates the pressure of an existing WDN [26,27]. Few works deal with the possibility to improve the PAT operation by adjusting the PAT rotational speed [6,28]. To the authors’ knowledge, there is a lack in the literature about a possible PAT application to the WDN of a small municipality (fewer than 5000 people), as well as about the investigation of the PAT performances when different values of mean water demand and rotational speed are used.
The present work is part of a collaborative project, named Water In Sustainable and Efficient Buildings (“WISE Buildings”), which aims at finding an appropriate and efficient solution to produce energy from the water source in different urban contexts and at different scales (e.g., building or neighborhood), also considering related life-cycle environmental impacts and costs. This could be obtained by exploiting PAT technologies in water supply systems, which could be particularly suitable for areas where a large part of unexploited energy is often present, due to the excess water pressure to dissipate [25]. Specifically, such approach may be extended and, more efficiently, applied to the case of remote villages or decentralized districts where an important amount of excess water pressure is likely to occur. Such areas may benefit of a PAT-based system, i.e., a micro- or pico-hydropower plant, able to provide both pressure dissipation and energy production. Hence, one of the goals of the present project is that of studying the functioning of a pump working as a turbine installed within a portion of a typical WDN.
As the first step of the above project, an experimental investigation was conducted at the Università Politecnica delle Marche (Ancona, Italy), testing a centrifugal pump installed in a laboratory facility. Different regimes were tested: the hydrodynamic conditions, i.e., pressure and discharge, were varied to reproduce the classical performance curve; in addition, a test bench enabled us to regulate the mechanical conditions, i.e., both rounds and torque of the PAT shaft. Such tests allowed us to mimic typical conditions experienced in real applications and to estimate the actual energy production.
Within the framework of the “WISE Buildings” project, the main findings of laboratory tests will be related to PAT-application scenarios in real urban contexts where water demand profiles are set, with the final goal to assess their life-cycle costs and environmental performance based on the energy produced. On the other hand, the main objectives of the present study were: (i) characterization of the PAT functioning; (ii) simulation of possible PAT application to the WDN of a small municipality; and (iii) analysis of different real-world scenarios using available field data and laboratory findings.
The manuscript is divided as follows. Section 2 describes both experimental tests and application to a real-world context. Section 3 describes and discusses the main results of the work. Some conclusions close the paper (Section 4).

2. Materials and Methods

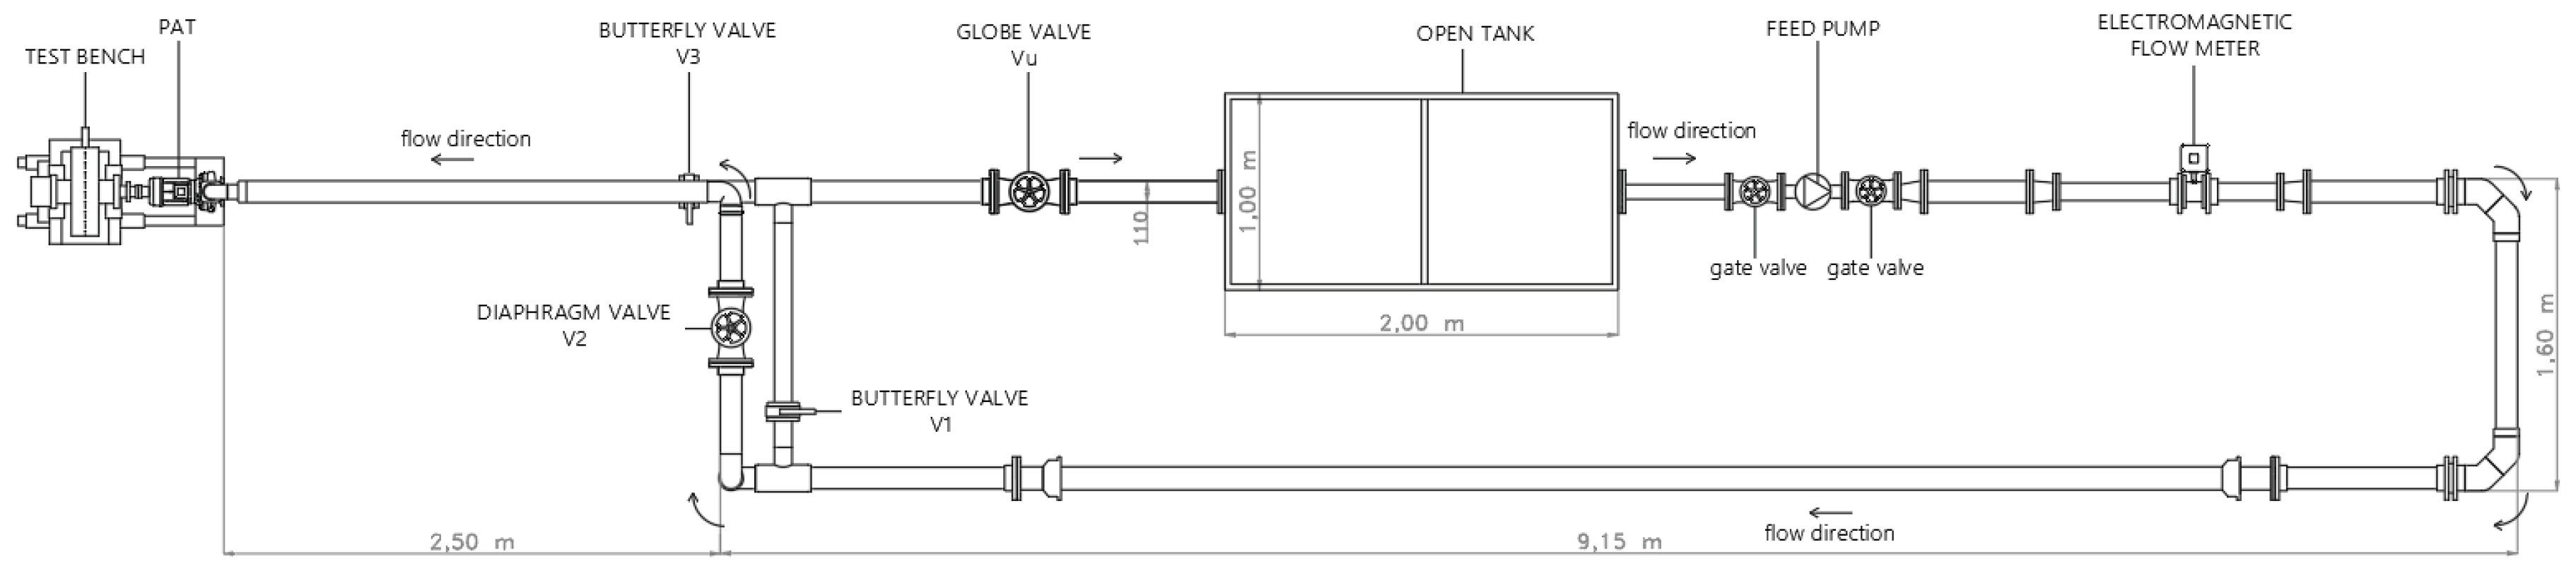
2.1. Experimental Tests

Energy generation from domestic and urban water supply systems was tackled by exploiting an experimental facility available in the Laboratory of Hydraulics and Maritime Constructions of the Università Politecnica delle Marche (Ancona, Italy). The facility has been equipped with a centrifugal pump (Rotos pump, Aturia group), which was used in the past in the classical mode for a different laboratory purpose. This was recovered for the present work and used as a PAT, i.e., in reverse mode. When working in classical mode, the pump is characterized by a nominal power of 1.23 kW, while the maximum head and flow rate are 12 m and 11.12 L/s, respectively. The main characteristics are listed in Table 1, while a top view of the system is illustrated in Figure 1.
To regulate the hydrodynamic field, a feed pump, two flowmeters, and three pressure gauges were mounted on the supply system. This was characterized by PVC pipes with diameters DN110, DN75 and DN50, in agreement with both typical WDN pipes and PAT inlet/outlet (Figure 2a). Specifically, an auxiliary 5.5 kW pump (Caprari multistage vertical electric pump) was used to supply water from the tank to the PAT at desired head and flow rate. An inverter was also used to select the operation frequency of the feed pump within the range 35–50 Hz. The discharge traveling through the PAT was measured using two sensors: an electromagnetic device located just downstream of the feed pump (Endress+Hauser, Promag 10) and an instant measuring flowmeter located more downstream in the supply system (Riels Instruments, FPL Series). To measure the pressure drop between upstream and downstream of the PAT, a manometer and two pressure sensors (Endress+Hauser, Cerabar PMP21) were used. In addition, a set of pressure taps was also installed to investigate the pressure values at 6 different locations around the PAT: 1 upstream of the PAT, 4 around the pipe circumference just downstream of the PAT, and 1 about 1.7 m downstream of the PAT exit (Figure 2a,b). The equipment used in the present experiment is summarized in Table 2.
In addition to what is presented above, a bypass pipe was also included in the model, together with four regulating valves, named V1, V2, V3, and Vu (Figure 2a). Opening of all valves allows the water to flow within the whole system, closure of V1 inhibits the flow to pass through the bypass, while closure of V2 and V3 excludes the PAT-system portion. Hence, such approach allows the user to simulate the PAT application in typical WDNs, as well as to properly adjust both water head and flow rate affecting the PAT. A transparent PVC pipe was installed downstream of the PAT to visualize the vorticity generation at the PAT exit, due to turbulence and cavitation occurring at specific regimes (Figure 2b). The pressure measurements around the pipe circumference just downstream of the PAT exit were used to investigate the pressure variations induced by such vorticity.
To properly characterize the PAT behavior, a test bench was exploited with the aim to regulate the PAT motion by exerting a braking force on its shaft. This enables one to measure the output power, the torque and the speed (rounds per minute) induced by the water flowing within the PAT when subjected to different heads. The test bench (Borghi&Saveri) was coupled to the PAT and integrated into the supply system (Figure 2a). Hence, adjustments of both test-bench brake and regulating valves allowed the analysis of various working configurations, with multiple combinations of hydrodynamic and mechanical actions characterizing the PAT.
The main goals were those of determining the performance characteristic curve, the efficiency, and the produced power of the PAT under the above working conditions. As for the classical turbines, the hydraulic power of the flow traveling through the PAT blades P H is converted into mechanical shaft power P M . The hydraulic power is defined as
P H = γ Q Δ H ,
with γ the water specific weight, Q the discharge, and Δ H the head drop calculated between upstream and downstream of the PAT. The mechanical power is
P M = M N
with M the torque and N the rotational speed of the PAT shaft. The PAT efficiency is the ratio between mechanical and hydraulic power
η = P M / P H .
Finally, the mechanical power could be further converted into electricity by means of a generator [29].
During the experimental tests, the feed pump, located in the upstream part of the plant, enabled us to vary the flow discharge in the range Q = 5–9 L/s, while the available pressure head was H = 4.8–33.9 m. Two different series were conducted.
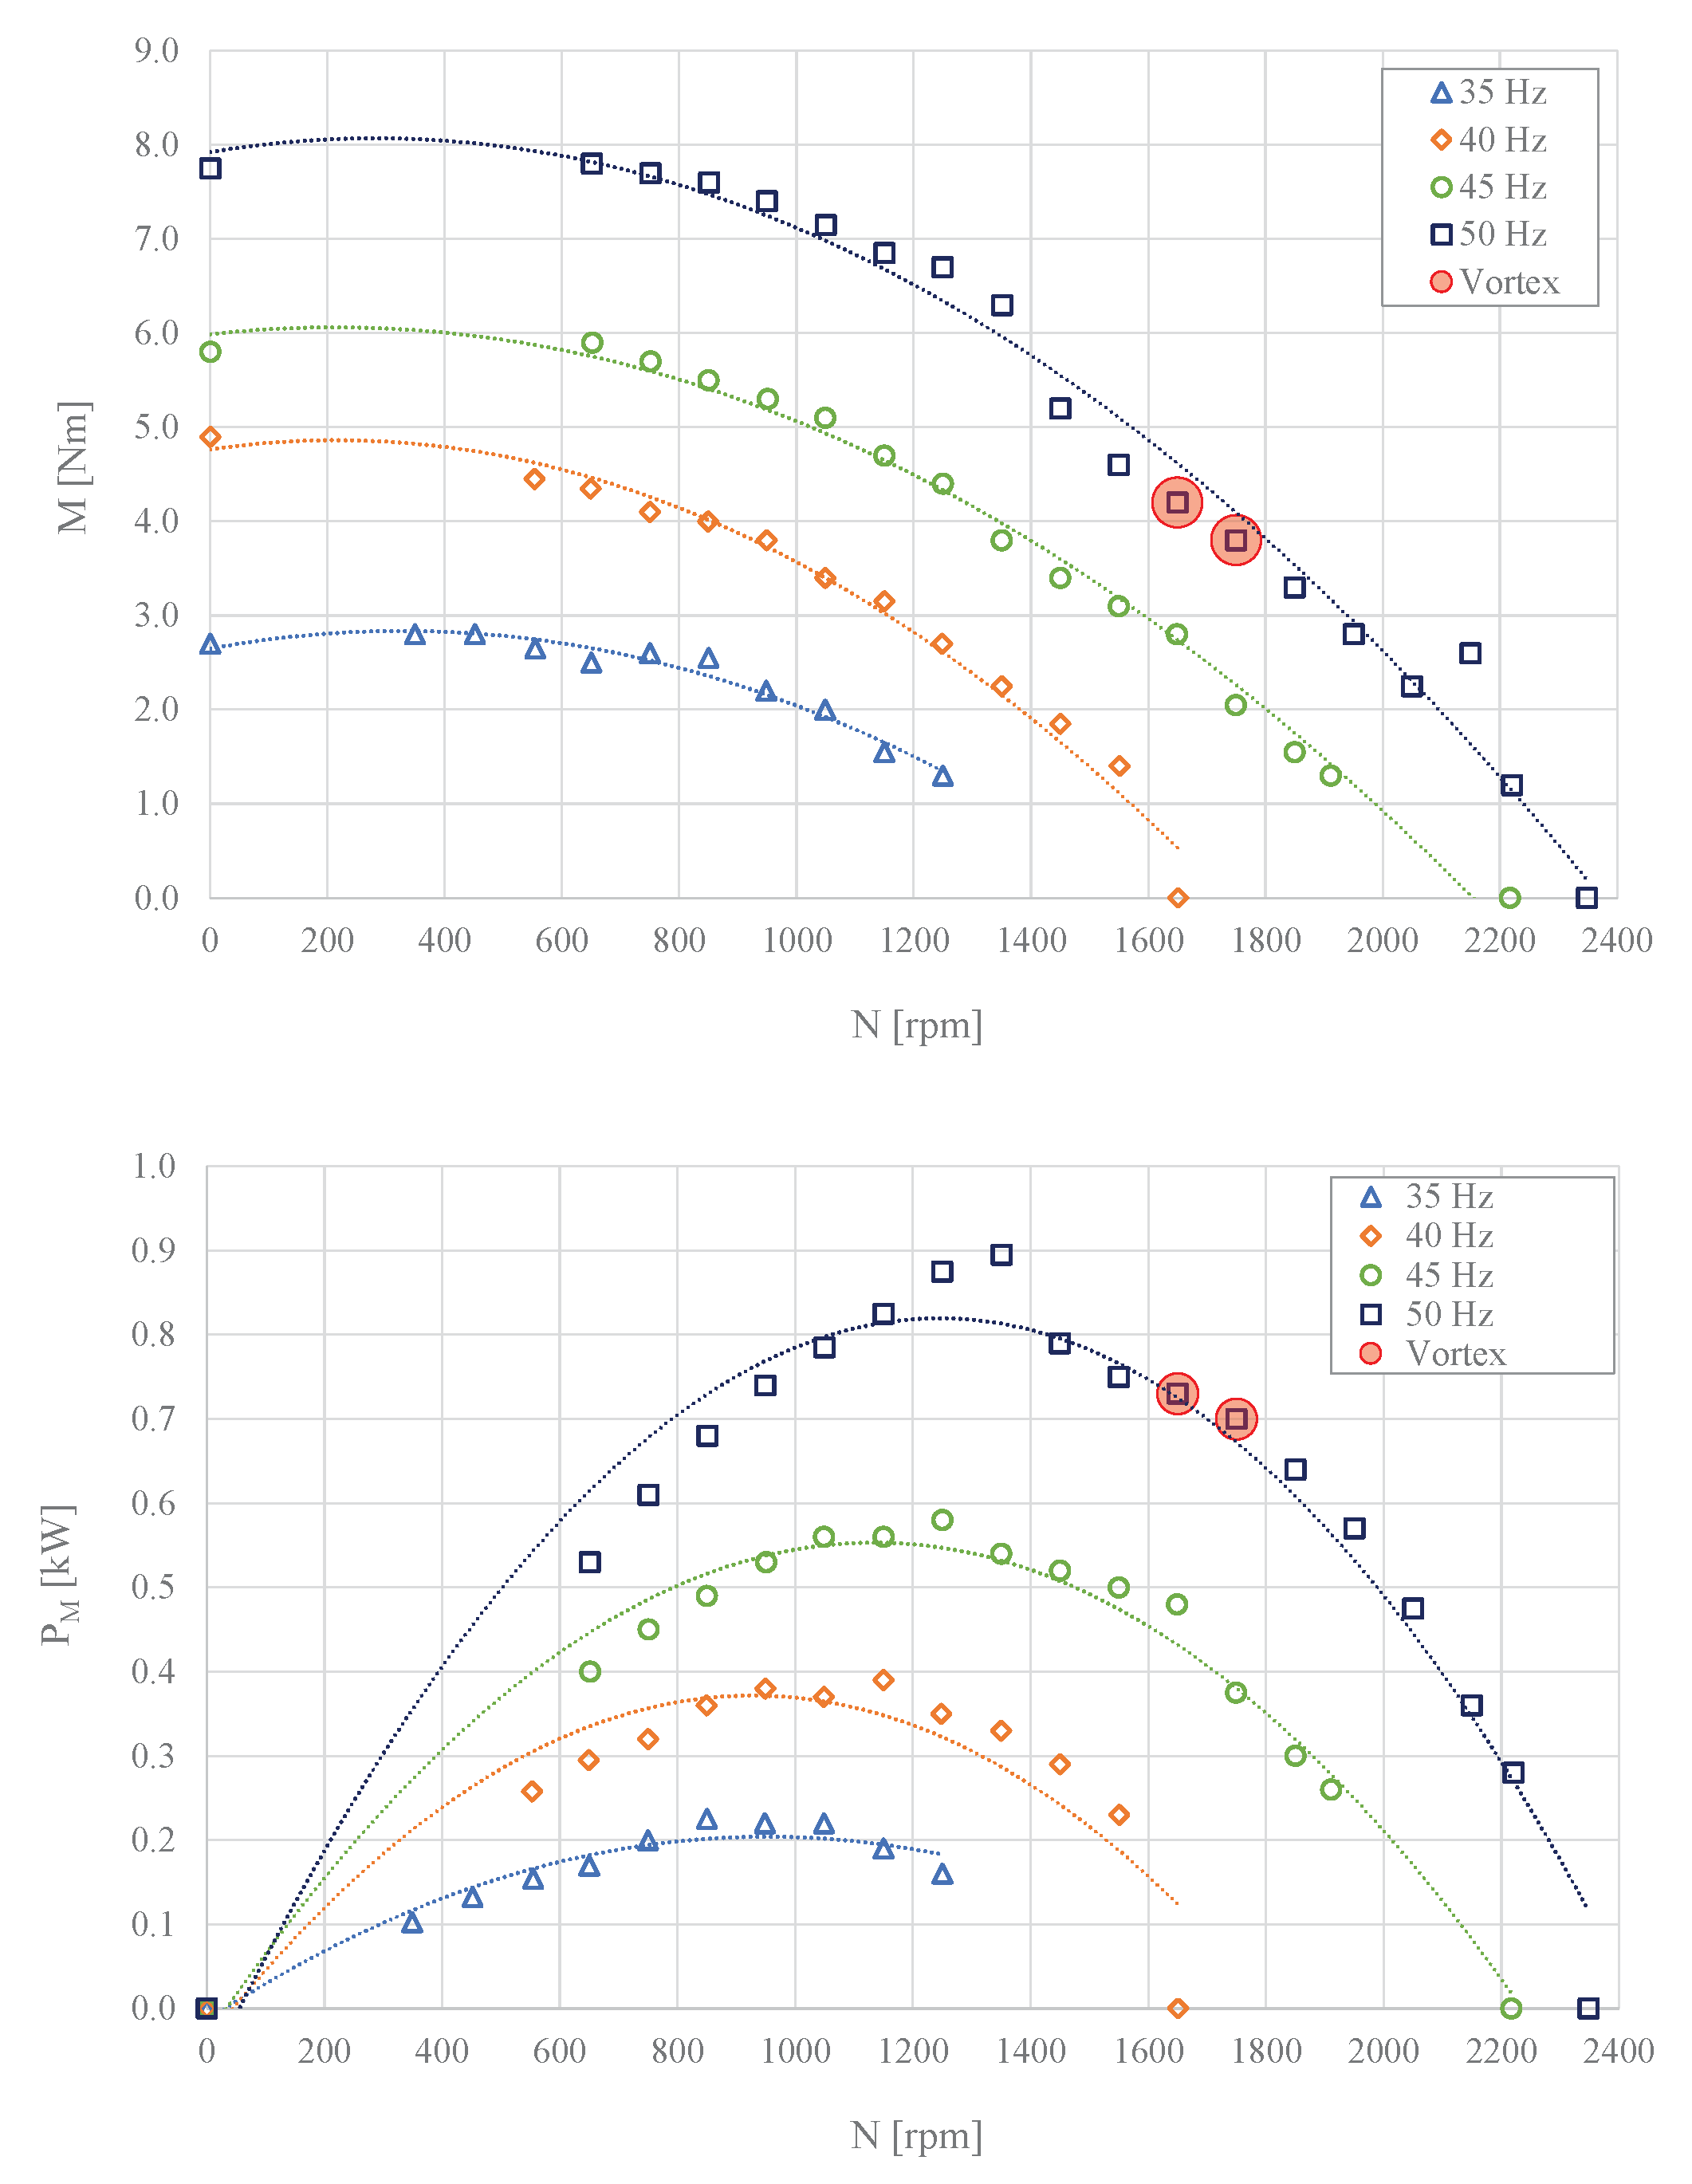
  • Test Series 1: Both rotational PAT speed N and inverter frequency were kept constant during each test, the former imposed at the test bench, the latter at the feed pump. From test to test, the speed varied in the range N = 650–2350 rpm, while the frequency ranging 35–50 Hz, with step of 5 Hz.
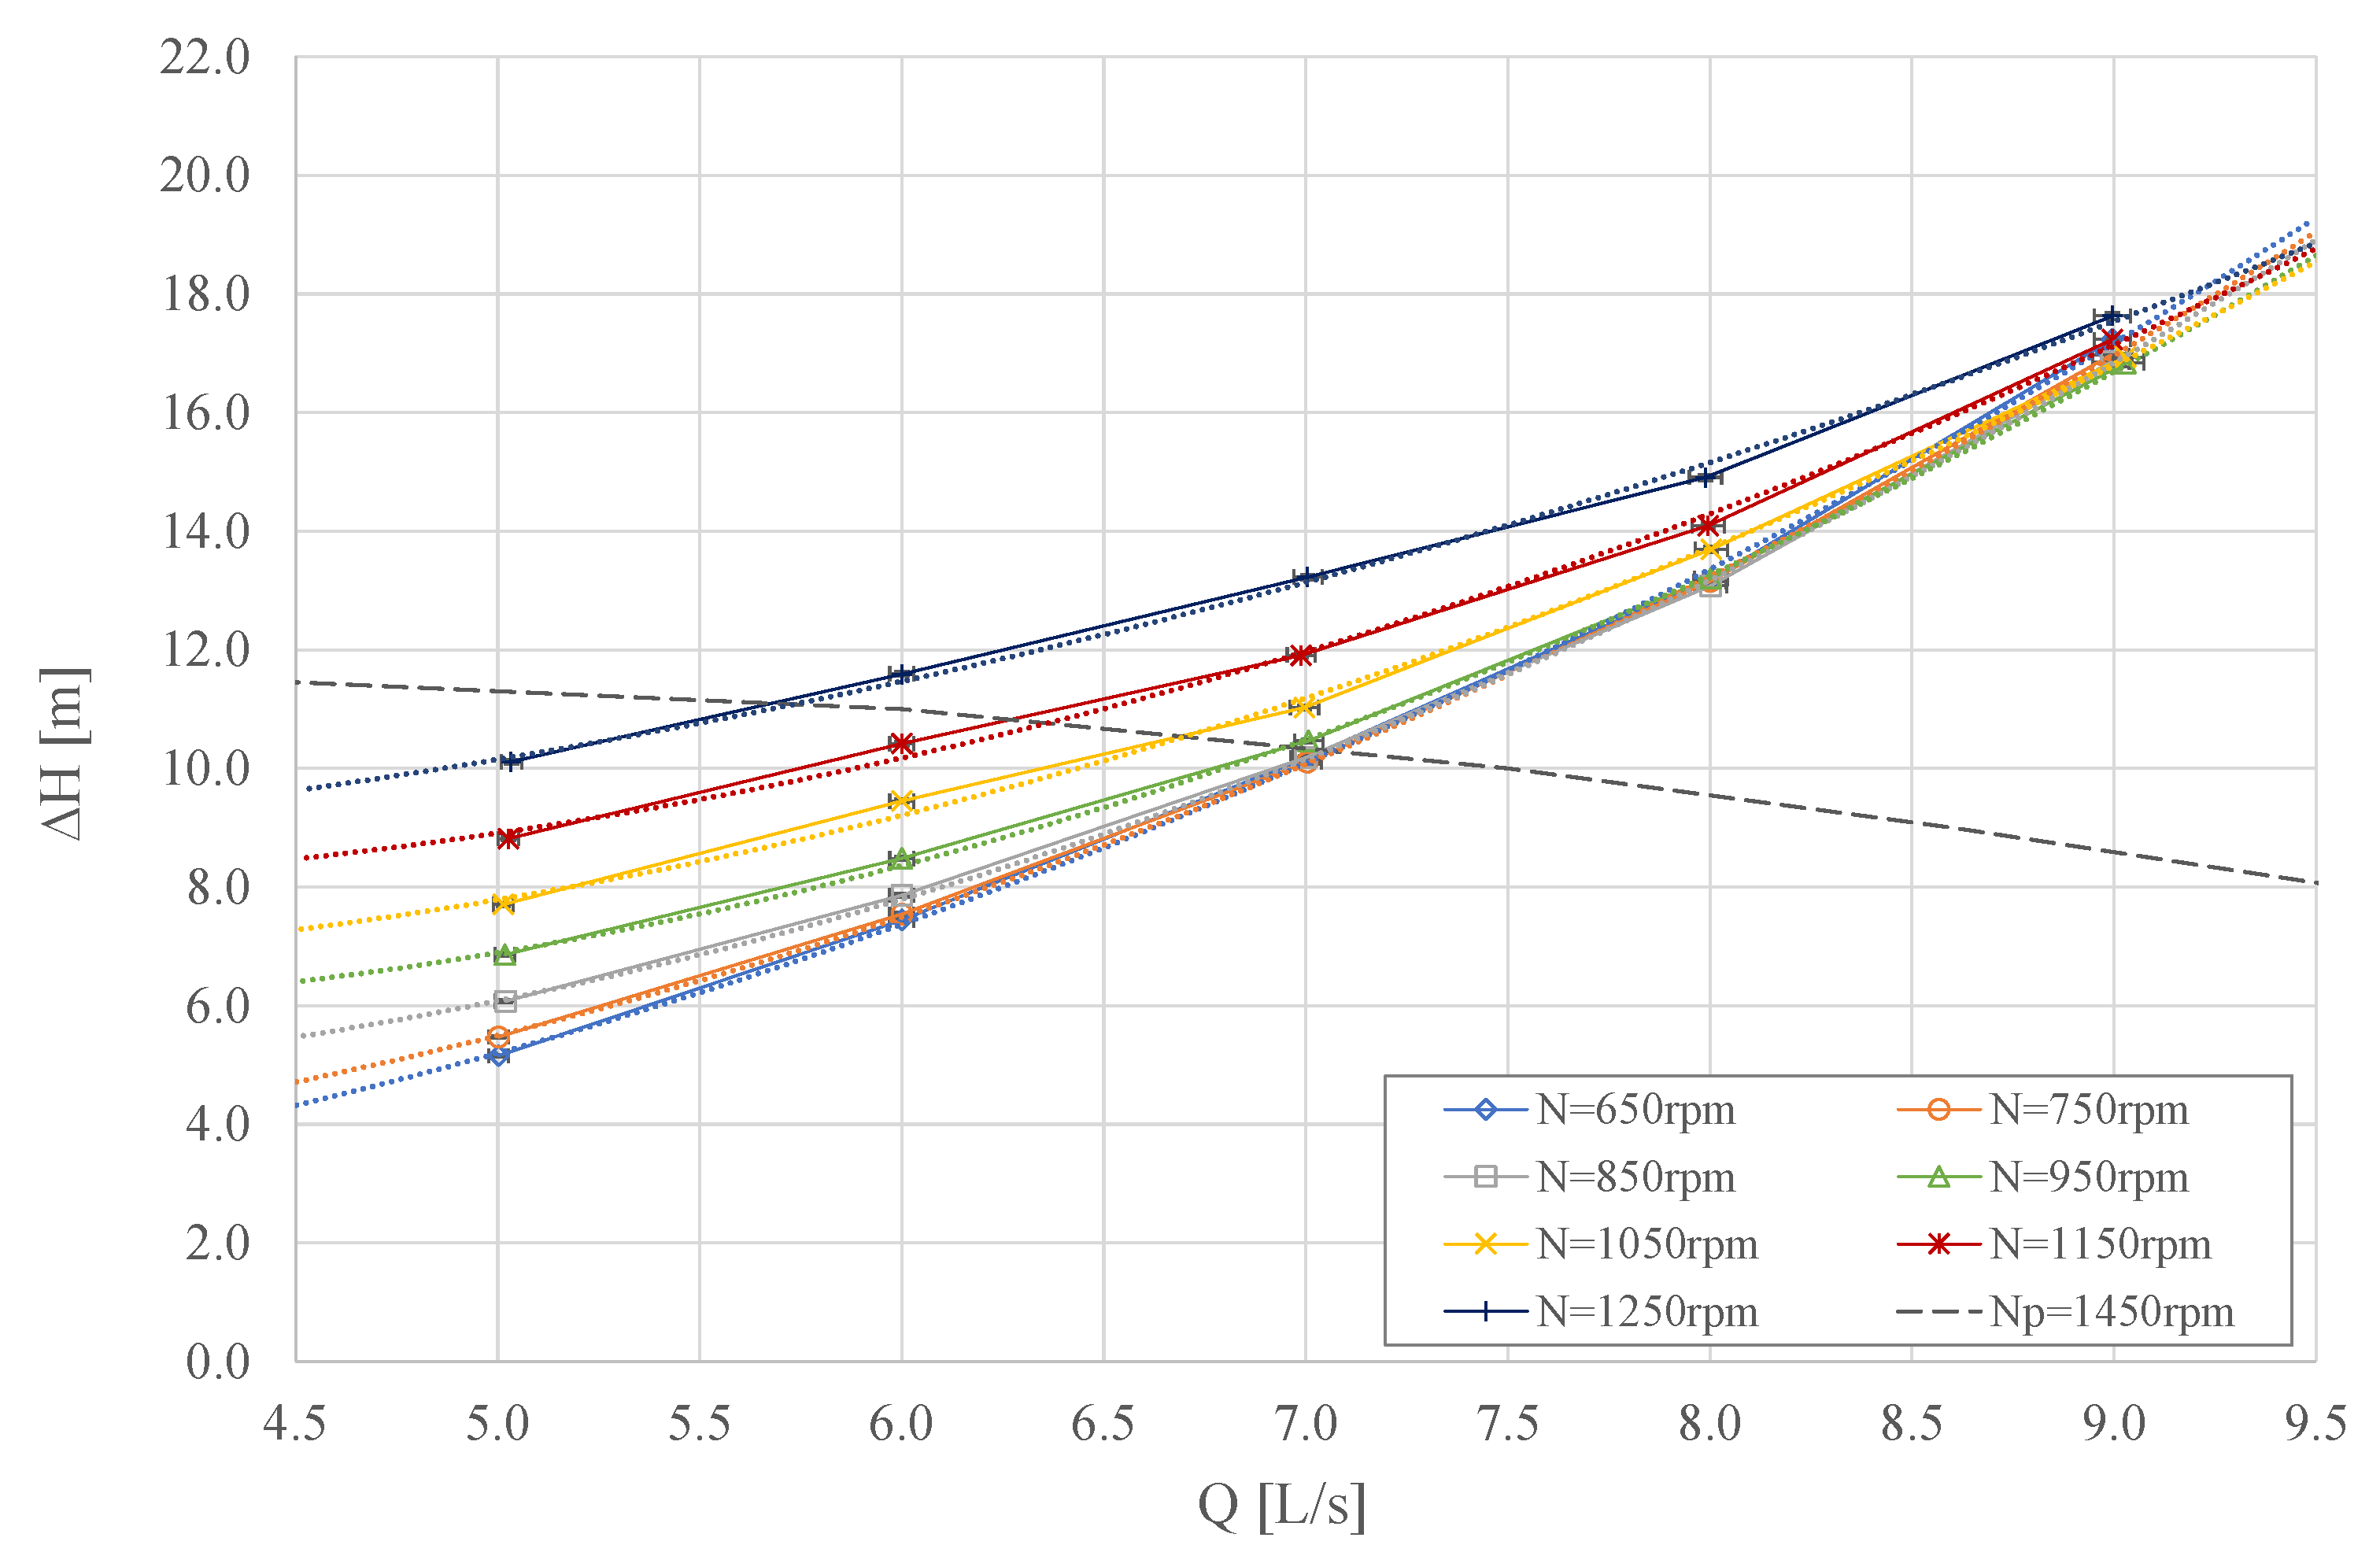
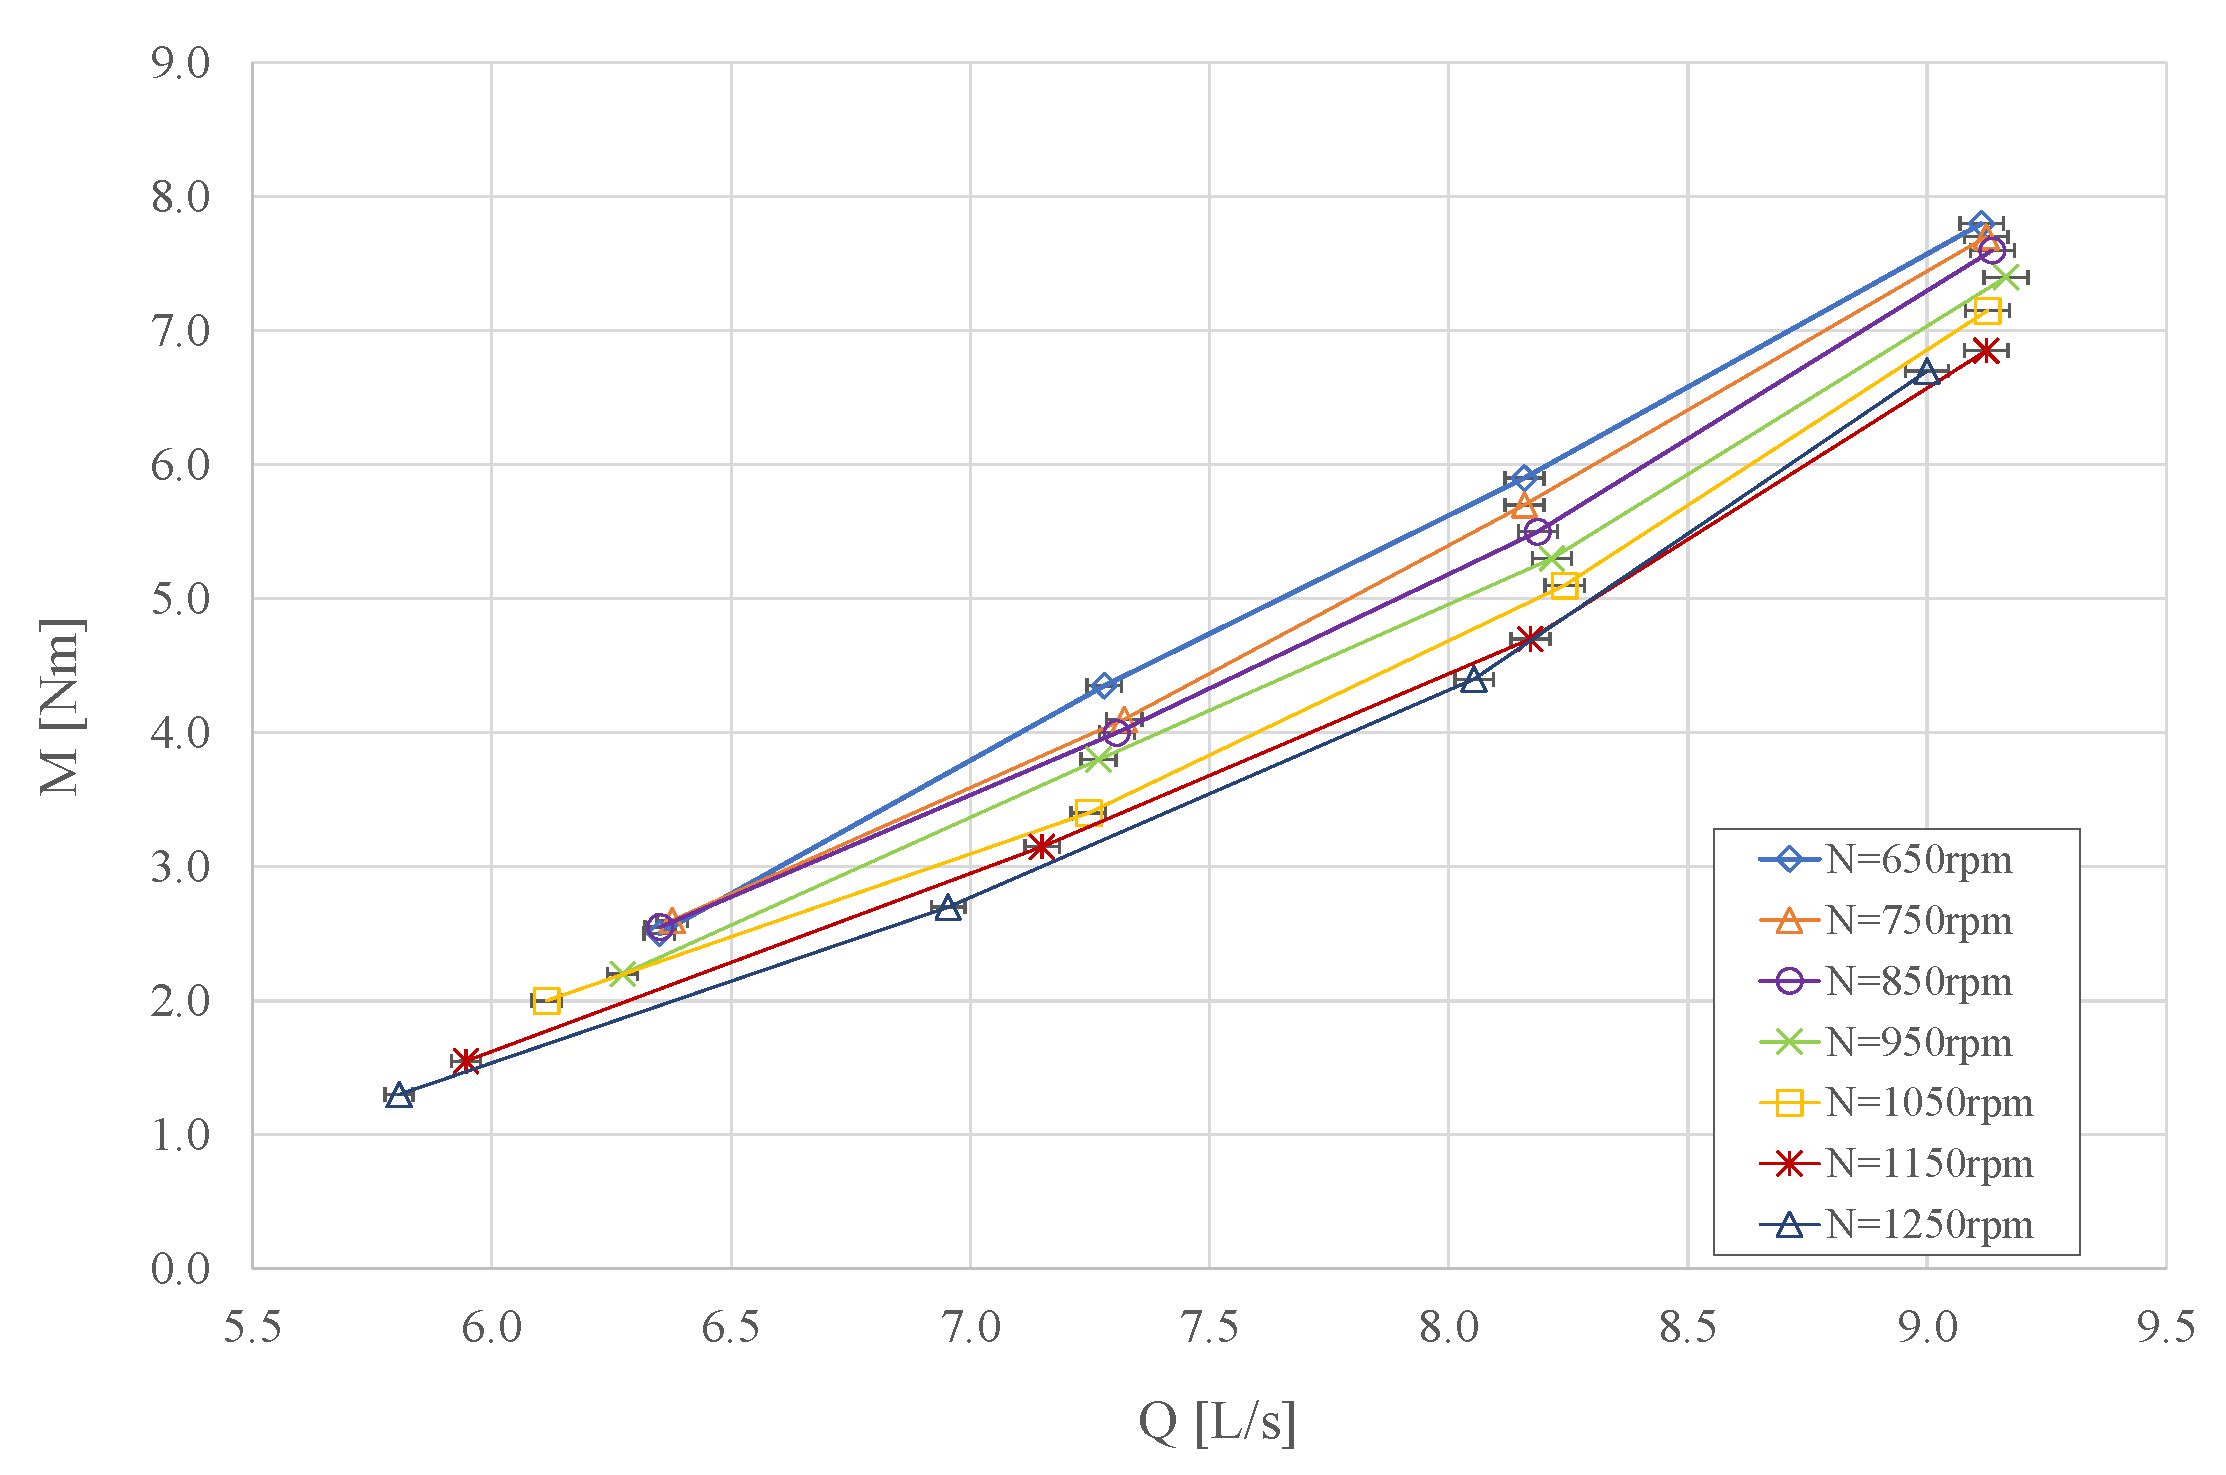
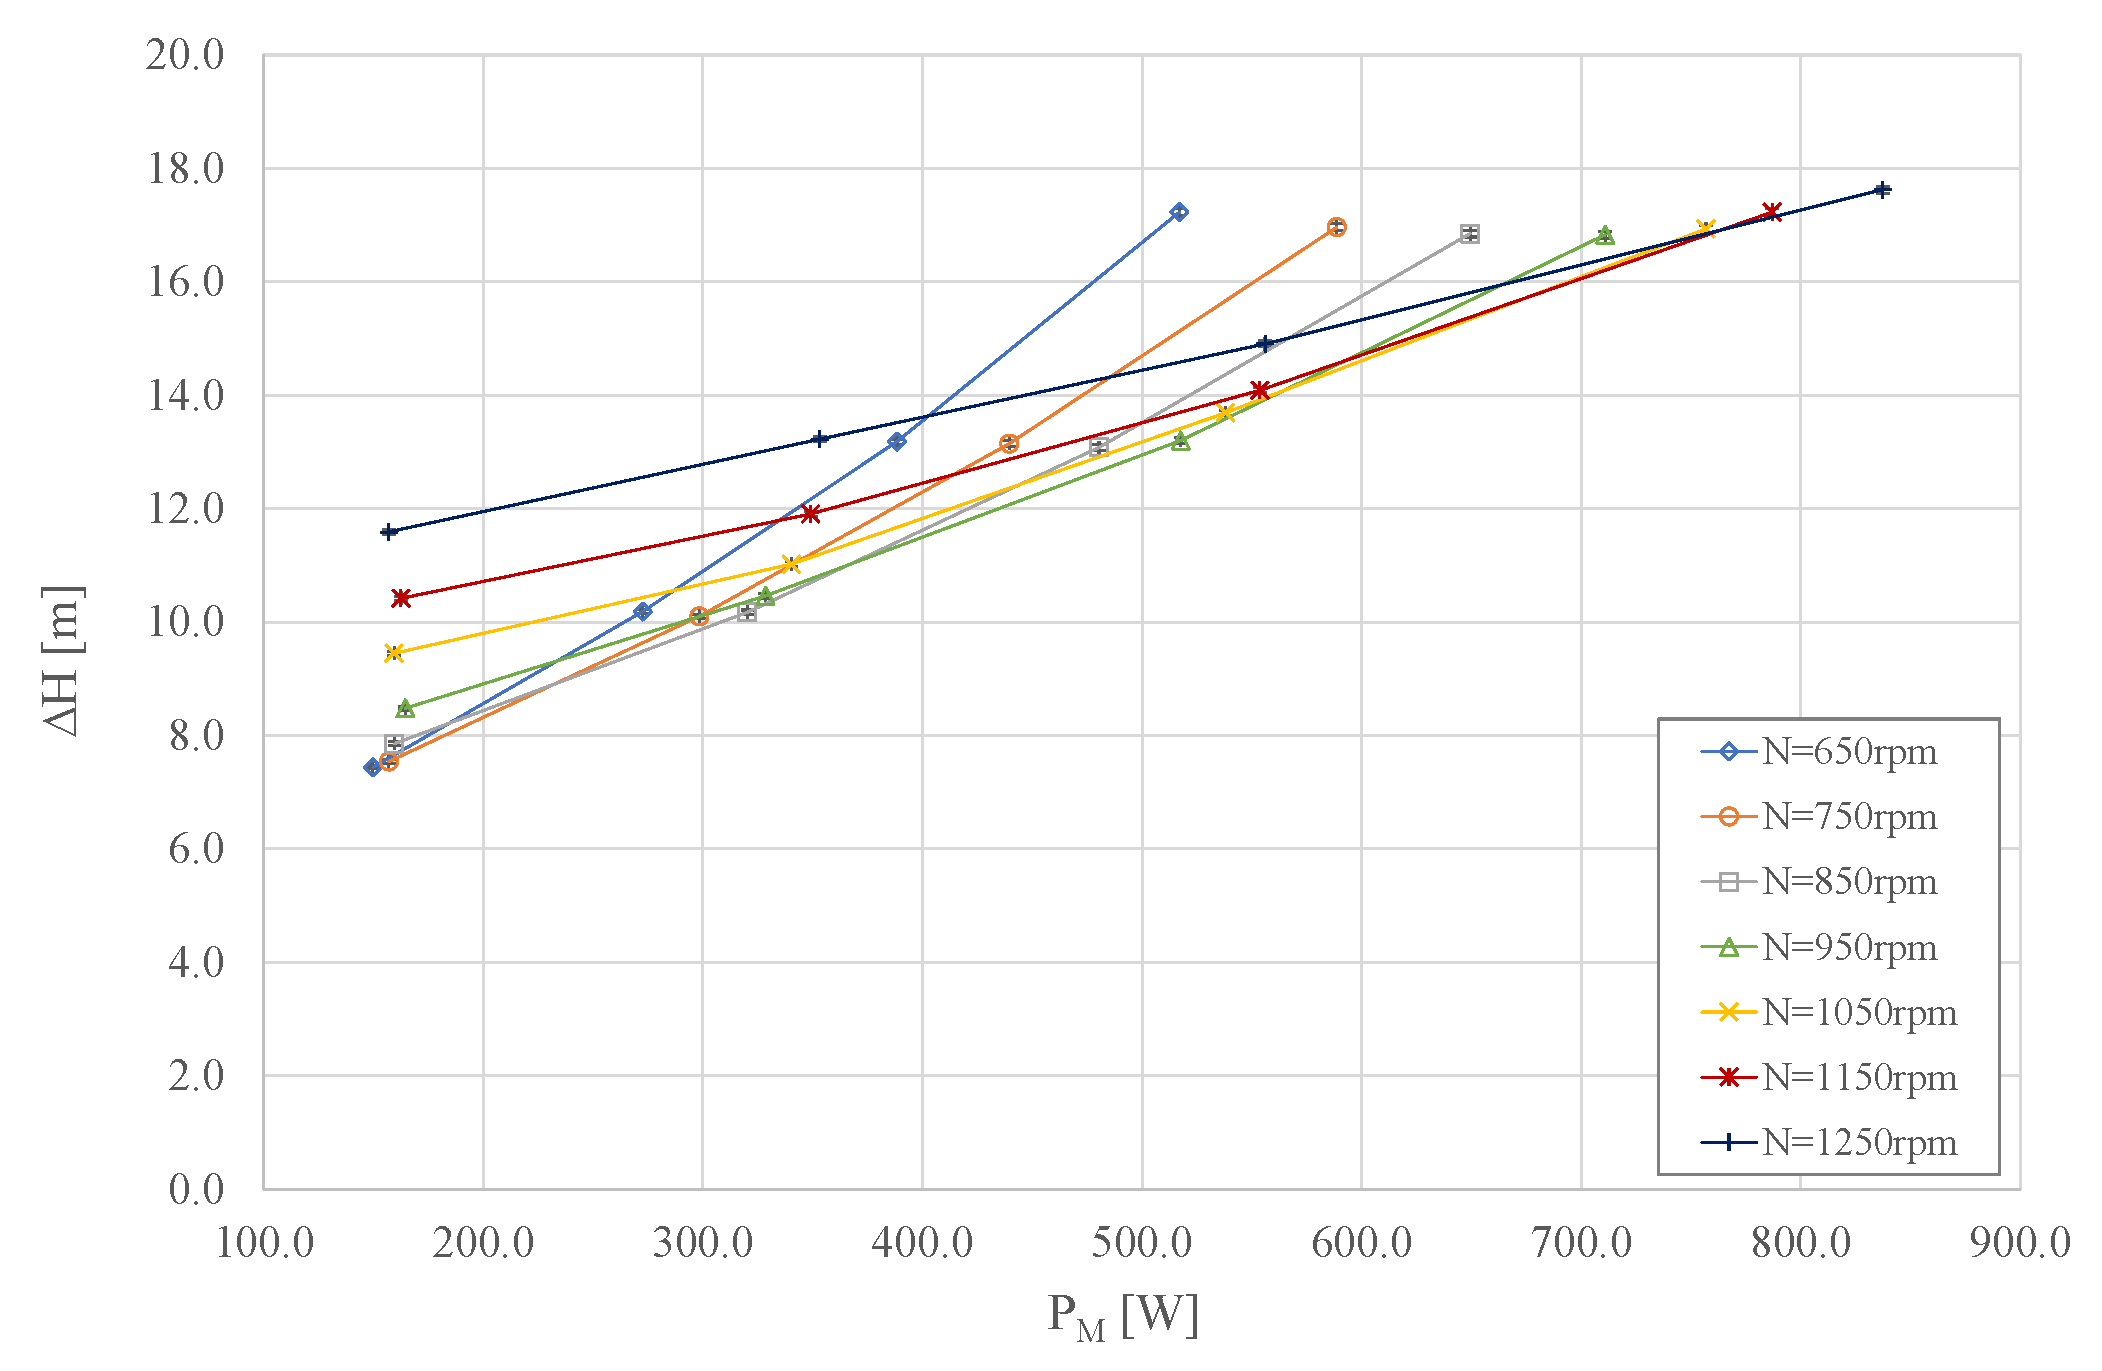
  • Test Series 2: N, inverter frequency, and discharge Q were kept constant during each test. Such test series was conducted (i) imposing the rotational speed at the test bench; (ii) fixing the feed-pump frequency; and (iii) regulating the valves. This enabled us to have the same flow-rate values, ranging within Q = 5–9 L/s, for each tested speed, this ranging N = 650–1250 rpm.
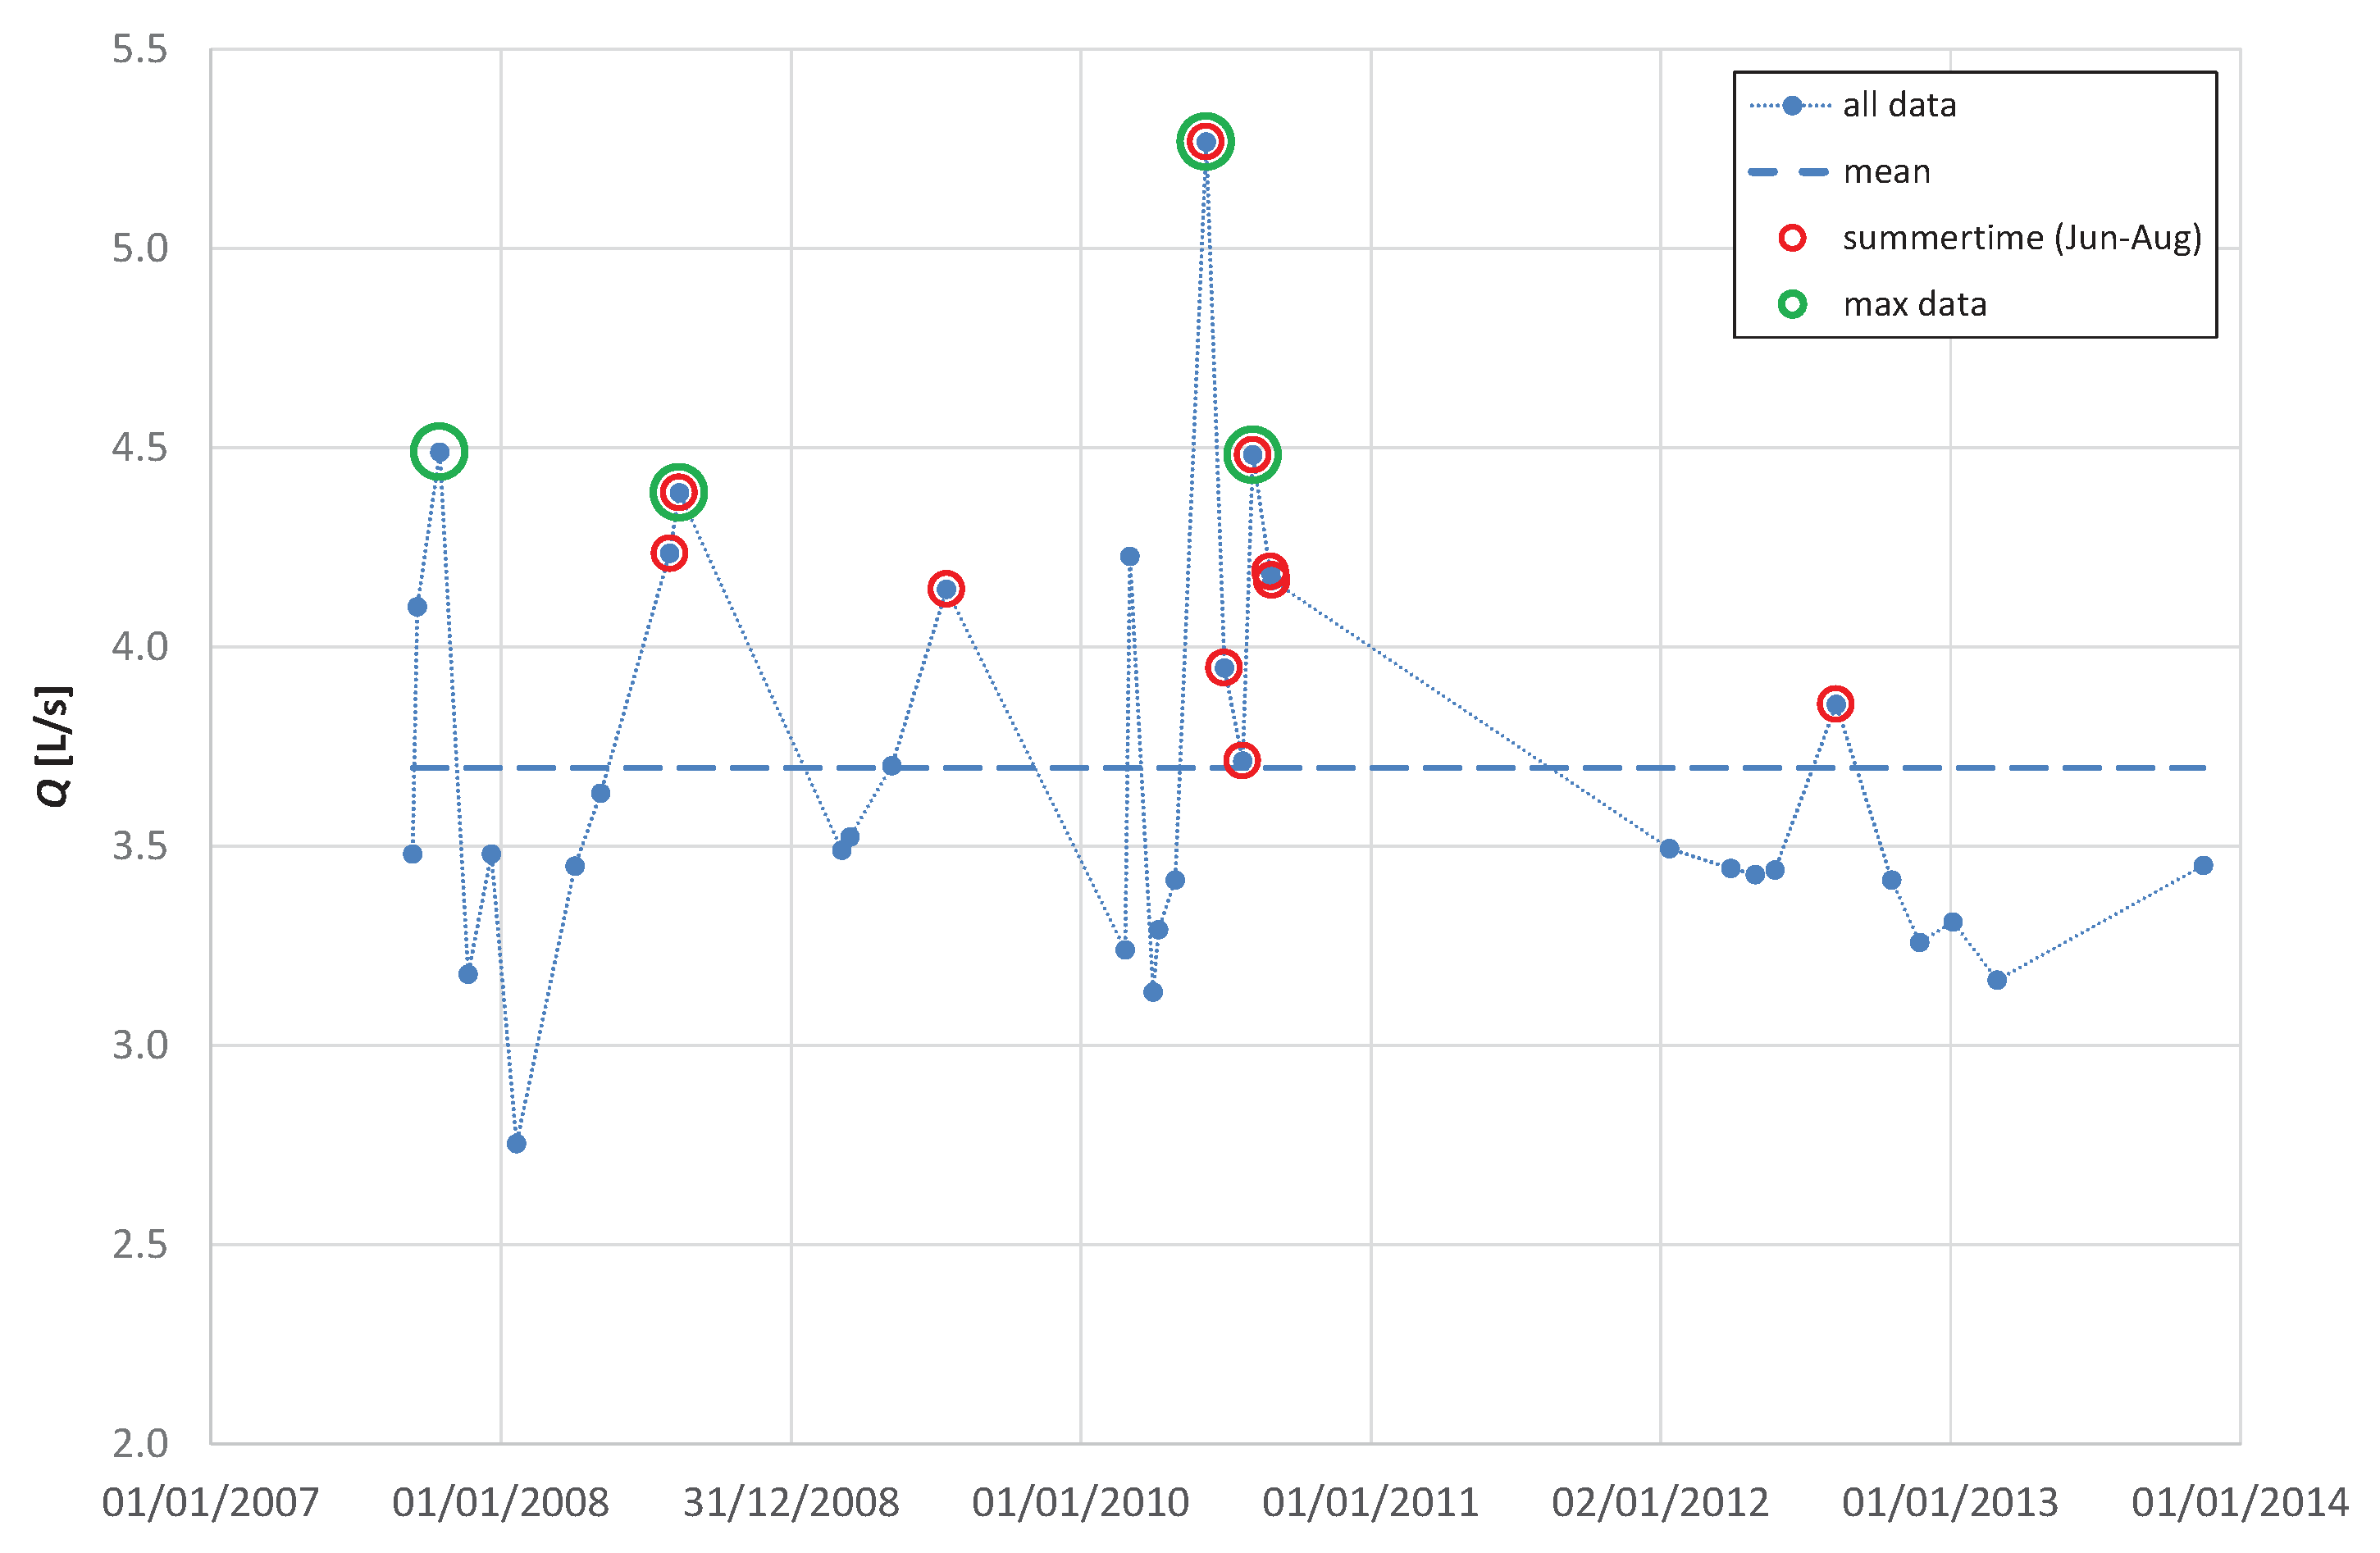
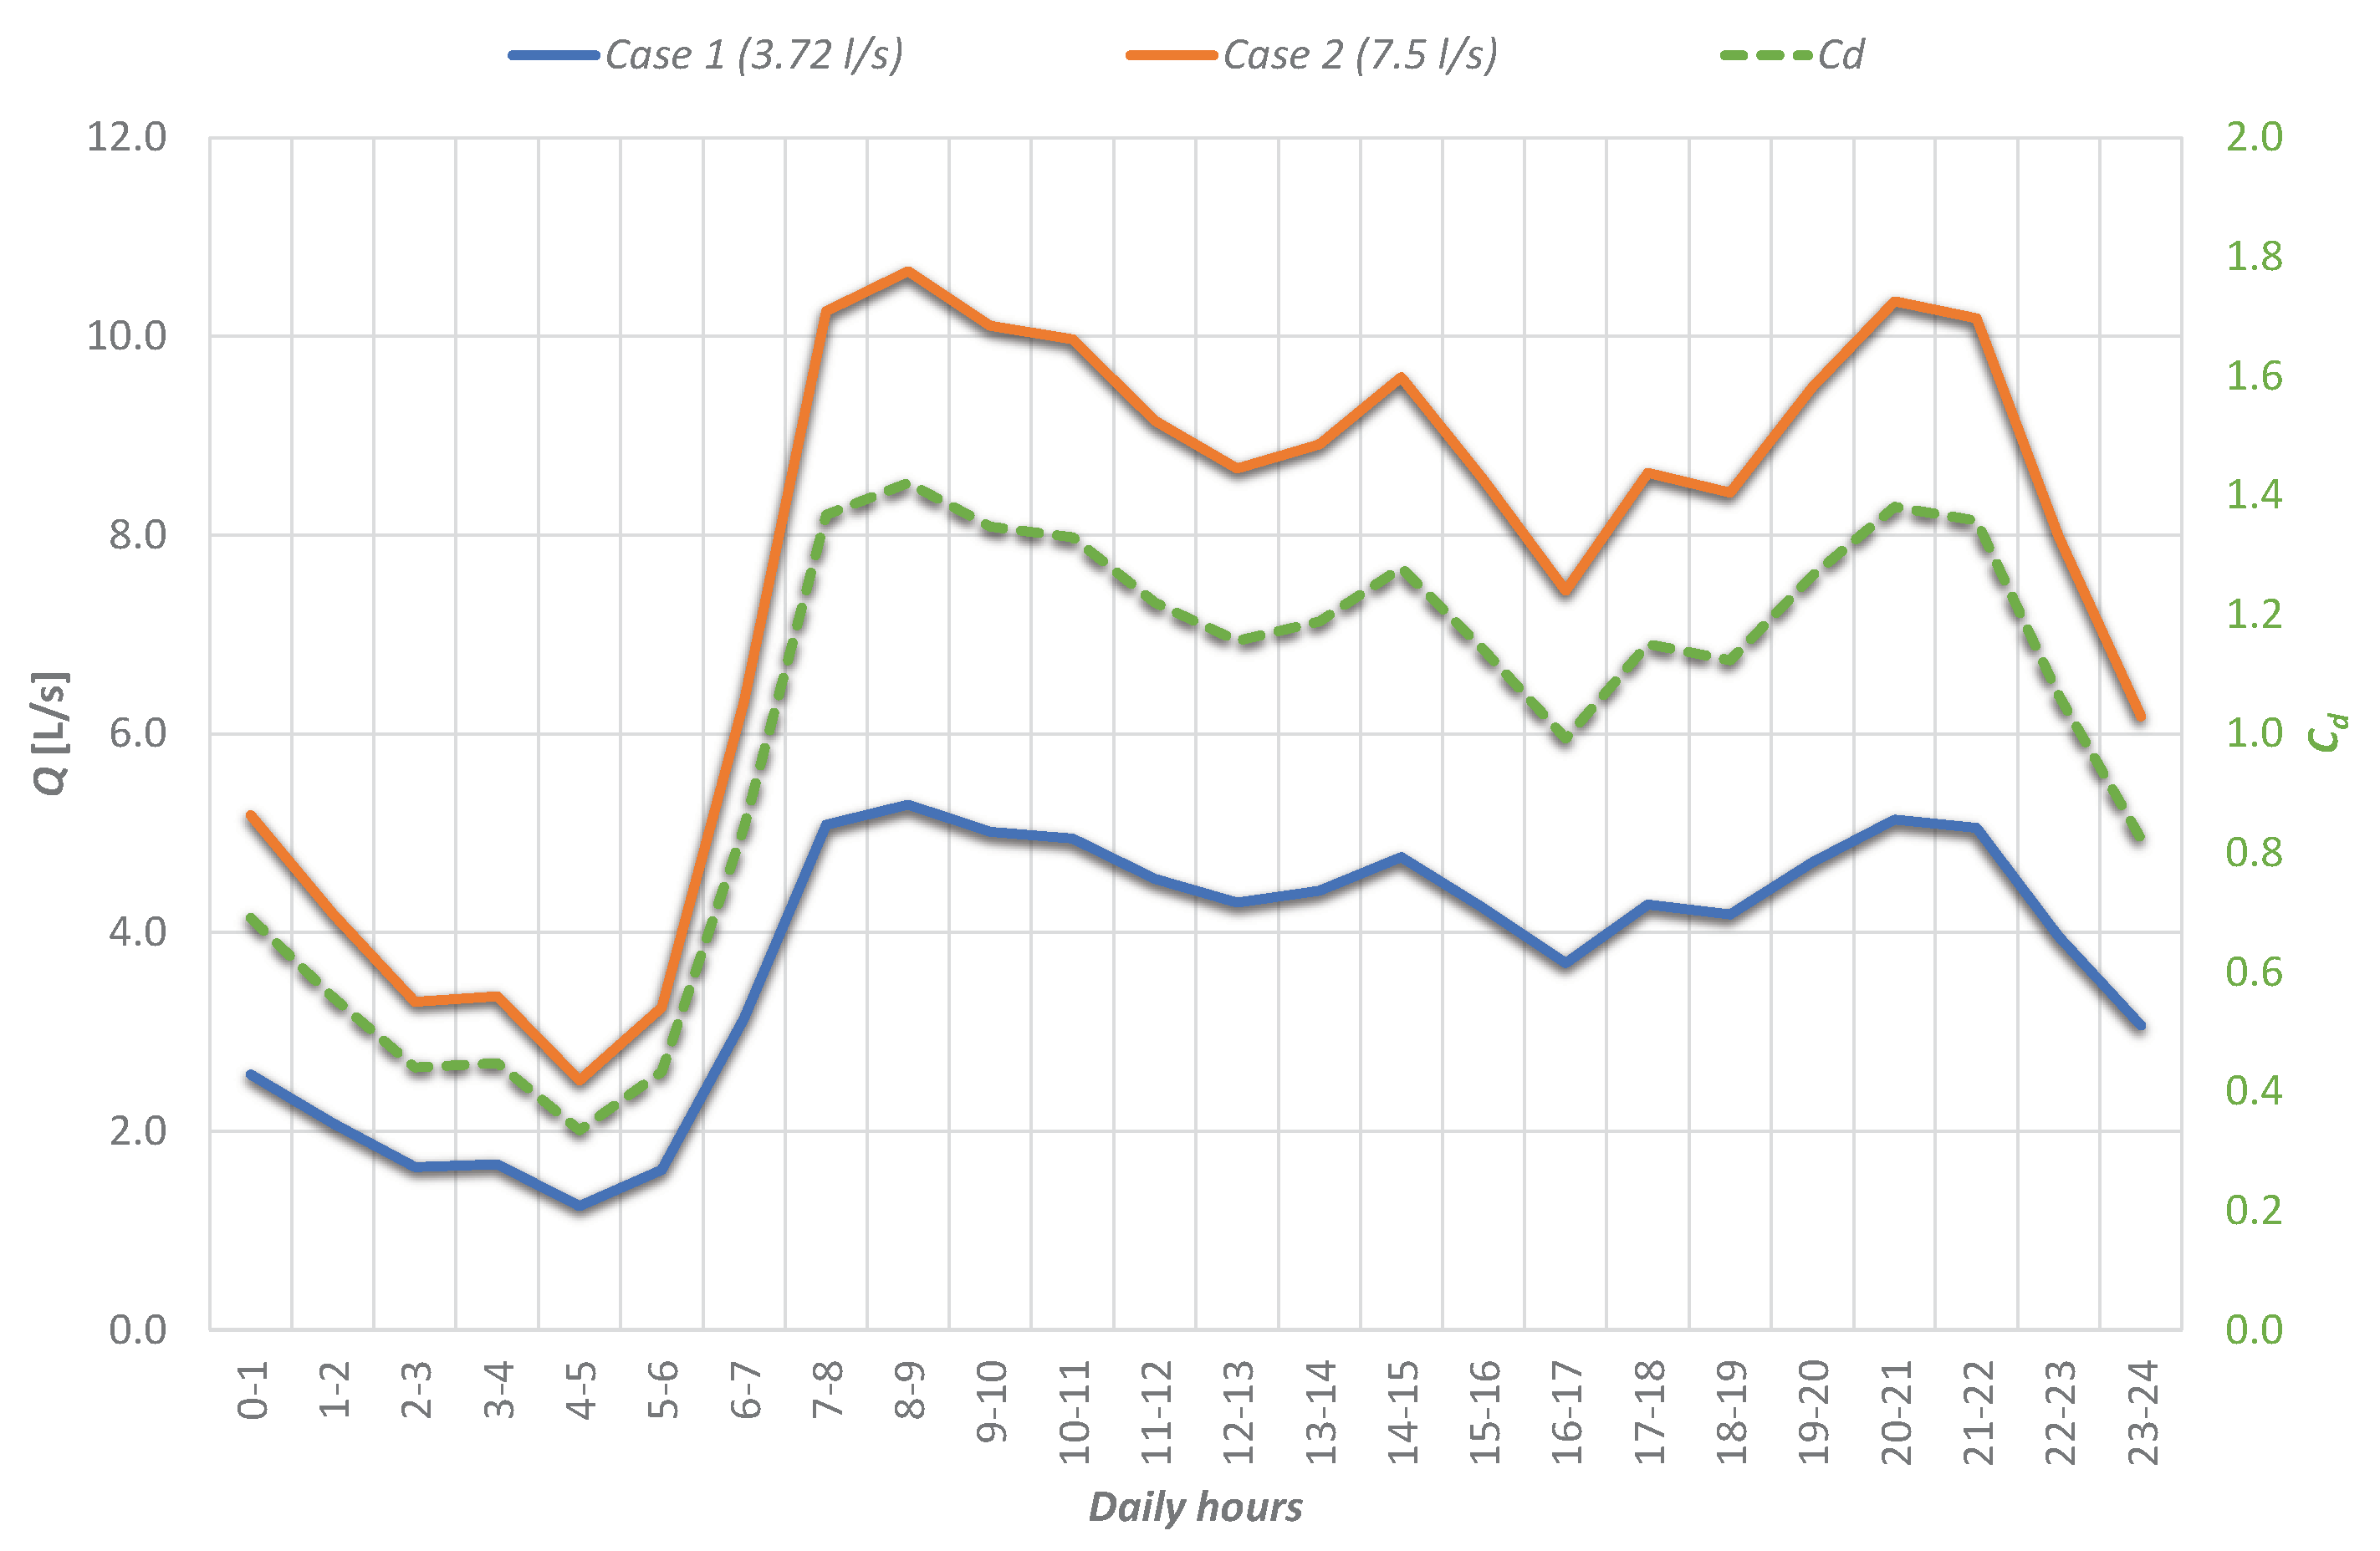
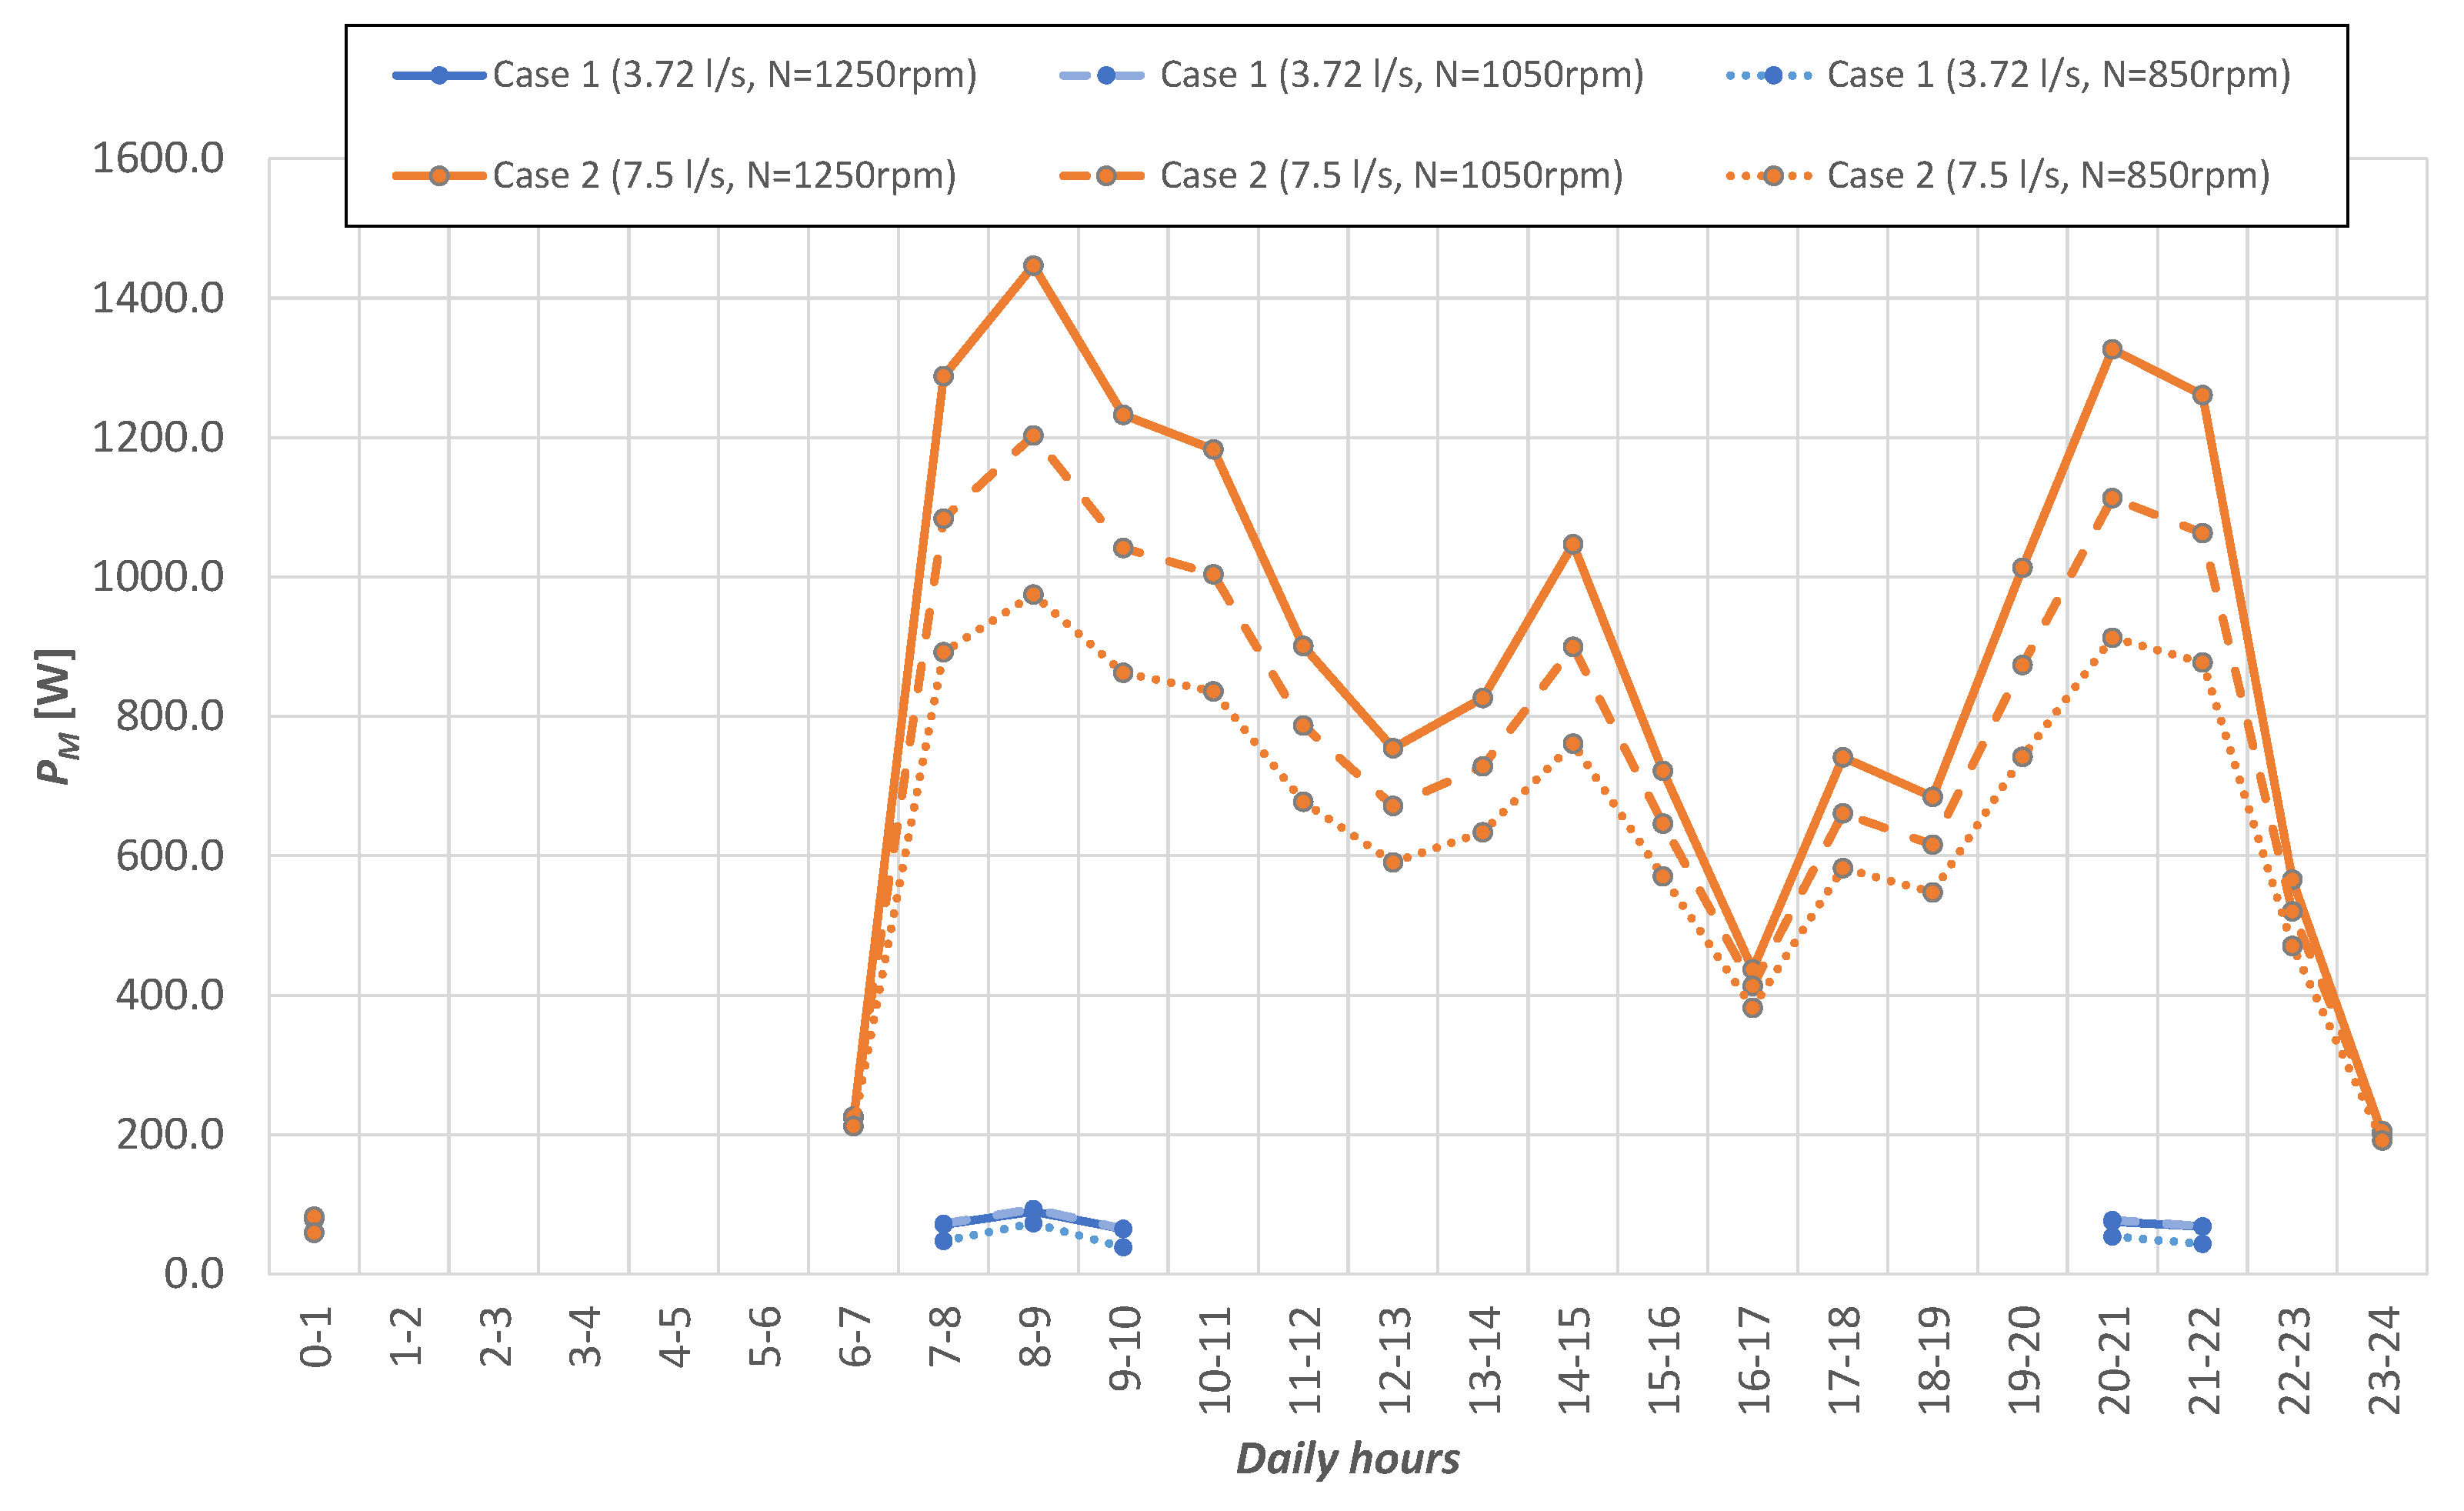
2.2. Application

With the aim to investigate a possible application of the PAT system studied in the present work, some data collected in the municipality of Servigliano (Fermo, Italy) were used. Here, pressure dissipation was provided through a PRV located upstream of the WDN. Two diverse datasets are available. The first concerns water-volume data collected by the local water authority between 2007 and 2013, and provides the daily mean water consumption in Servigliano, as illustrated in Figure 3 (blue dots). Specifically, the water demand ranges between 2.75 and 5.27 L/s in the analyzed time period. The summertime data are highlighted in red, while the maximum data available in the time series, corresponding to ~10% of the data in the whole investigated period, are shown in green.
The second dataset refers to a specific day, i.e., 17 July 2008. In this case, data were collected continuously by a gauge located just downstream of the reservoir which feeds the whole municipality. Figure 4 illustrates the hourly distribution of the flow rate (blue solid line), which is characterized by a double peak corresponding to the times of larger demand, i.e., around 8–9 and 20–21. The demand ranges between a minimum discharge Q m i n = 1.24 L/s during the nighttime and a maximum discharge Q m a x = 5.28 L/s in the morning. The mean water demand of such day is thus μ q = 3.72 L/s, which is in agreement with the average value estimated from the data collected between 2007 and 2013, i.e., μ q = 3.70 L/s (dashed line in Figure 3).
The ratio between the hourly demand and the mean demand provides the hourly coefficient:
C d = Q / μ q ,
whose distribution for the considered municipality is illustrated in Figure 4 (blue dashed line). Such trend is typical of relatively small urban areas. Specifically, while areas with larger population (over 10 , 000 people) are identified by C d distributions characterized by a smoothed trend and only one peak [30,31,32], smaller areas are identified by two ore more peaks (e.g., [33]).
The classical law used to estimate the daily mean water demand is
μ q = α · n · d ,
where α is the ratio between the daily mean water demand and the annual mean consumption, n is the population, and d is the per capita water demand. For the specific case of Servigliano, the population in 2008 was n = 2377 (available online: https://www.tuttitalia.it/marche/81-servigliano/statistiche/popolazione-andamento-demografico/, accessed on 8 May 2012) and it can be assumed d = 130 lpd (suitable for urban areas with n < 5000 [30]). Since the mean water demand is known, the coefficient is calculated from Equation (5) and is found to be α = 1.04 . This is smaller than the daily peak factor ( α p = 1.3 for small urban areas), which represents the day of maximum consumption during the year.
In addition to the above-described scenario, another scenario was built on the basis of the flow-rate range investigated in the laboratory. With this purpose, a daily mean water demand μ q = 7.50 L/s was tested, this value being far larger than the daily water demand referring to the summertime period ( μ q s u m m e r = 4.24 L/s, red circles in Figure 3) or the 10% largest values ( μ q m a x = 4.66 L/s, green circles in Figure 3). Under the hypothesis that the same water demand d and α coefficient of Servigliano are used, such scenario can be seen as referring to a population slightly smaller than 5000. In this condition, the use of the C d distribution illustrated in Figure 4 can still be retained as valid. To summarize the scenarios introduced here and analyzed in the next sections, Table 3 reports the main features.
The combined use of the selected μ q with the C d distribution enables one to calculate the water-demand evolution. This is represented in Figure 4 for Case 1 (blue solid line) and Case 2 (orange line). It is worth noting that the water demand of Case 1 is generally smaller than the flow rate leading to the best PAT performances, while that of Case 2 is in good agreement with the experimental range.

3. Results

The following sections describe the main findings from the experimental tests carried out at the Università Politecnica delle Marche (Section 3.1 and Section 3.2) and their application to the real-world contexts (Section 3.3). To better understand the error propagation due to the instrument accuracy (see Table 2), error bars are also illustrated in the next figures (for details, see also [6,34]).

3.1. Hydraulic Properties

The characteristic curve of the pump working in direct mode was available for the rotational speed N = 1450 rpm and is represented in Figure 5 (dashed black line). Conversely, the characteristic curves for the pump working in reverse mode were not available. Hence, the first aim of the experimental tests was that of finding such curves, which represent the evolution of the head drop Δ H with the discharge Q at specific rotational speeds, imposed through the test bench.
The PAT curves resulting from Test Series 2 are shown in Figure 5 (dashed colored lines). Each curve refers to a specific speed N: the flow rate increases with Δ H when the pump works in reverse mode (solid lines). With Q fixed, larger rotational speeds provide larger head drops. Such behavior is more pronounced at smaller Q values and reduces at higher Q. Hence, the smaller is N, the larger is the curve steepness, which means that an increase of Q provides larger increases of Δ H at smaller N values. With the aim to understand the error related to the hydraulic properties, both horizontal and vertical error bars are illustrated in Figure 5, showing a significantly small error of both Q (order of 10 2 L/s) and Δ H (order of 10 2 m).
Each experimental dataset related to a specific speed was interpolated using a second-degree polynomial function, with the aim to correlate Q, Δ H and N (dotted colored lines).

3.2. Mechanical Properties
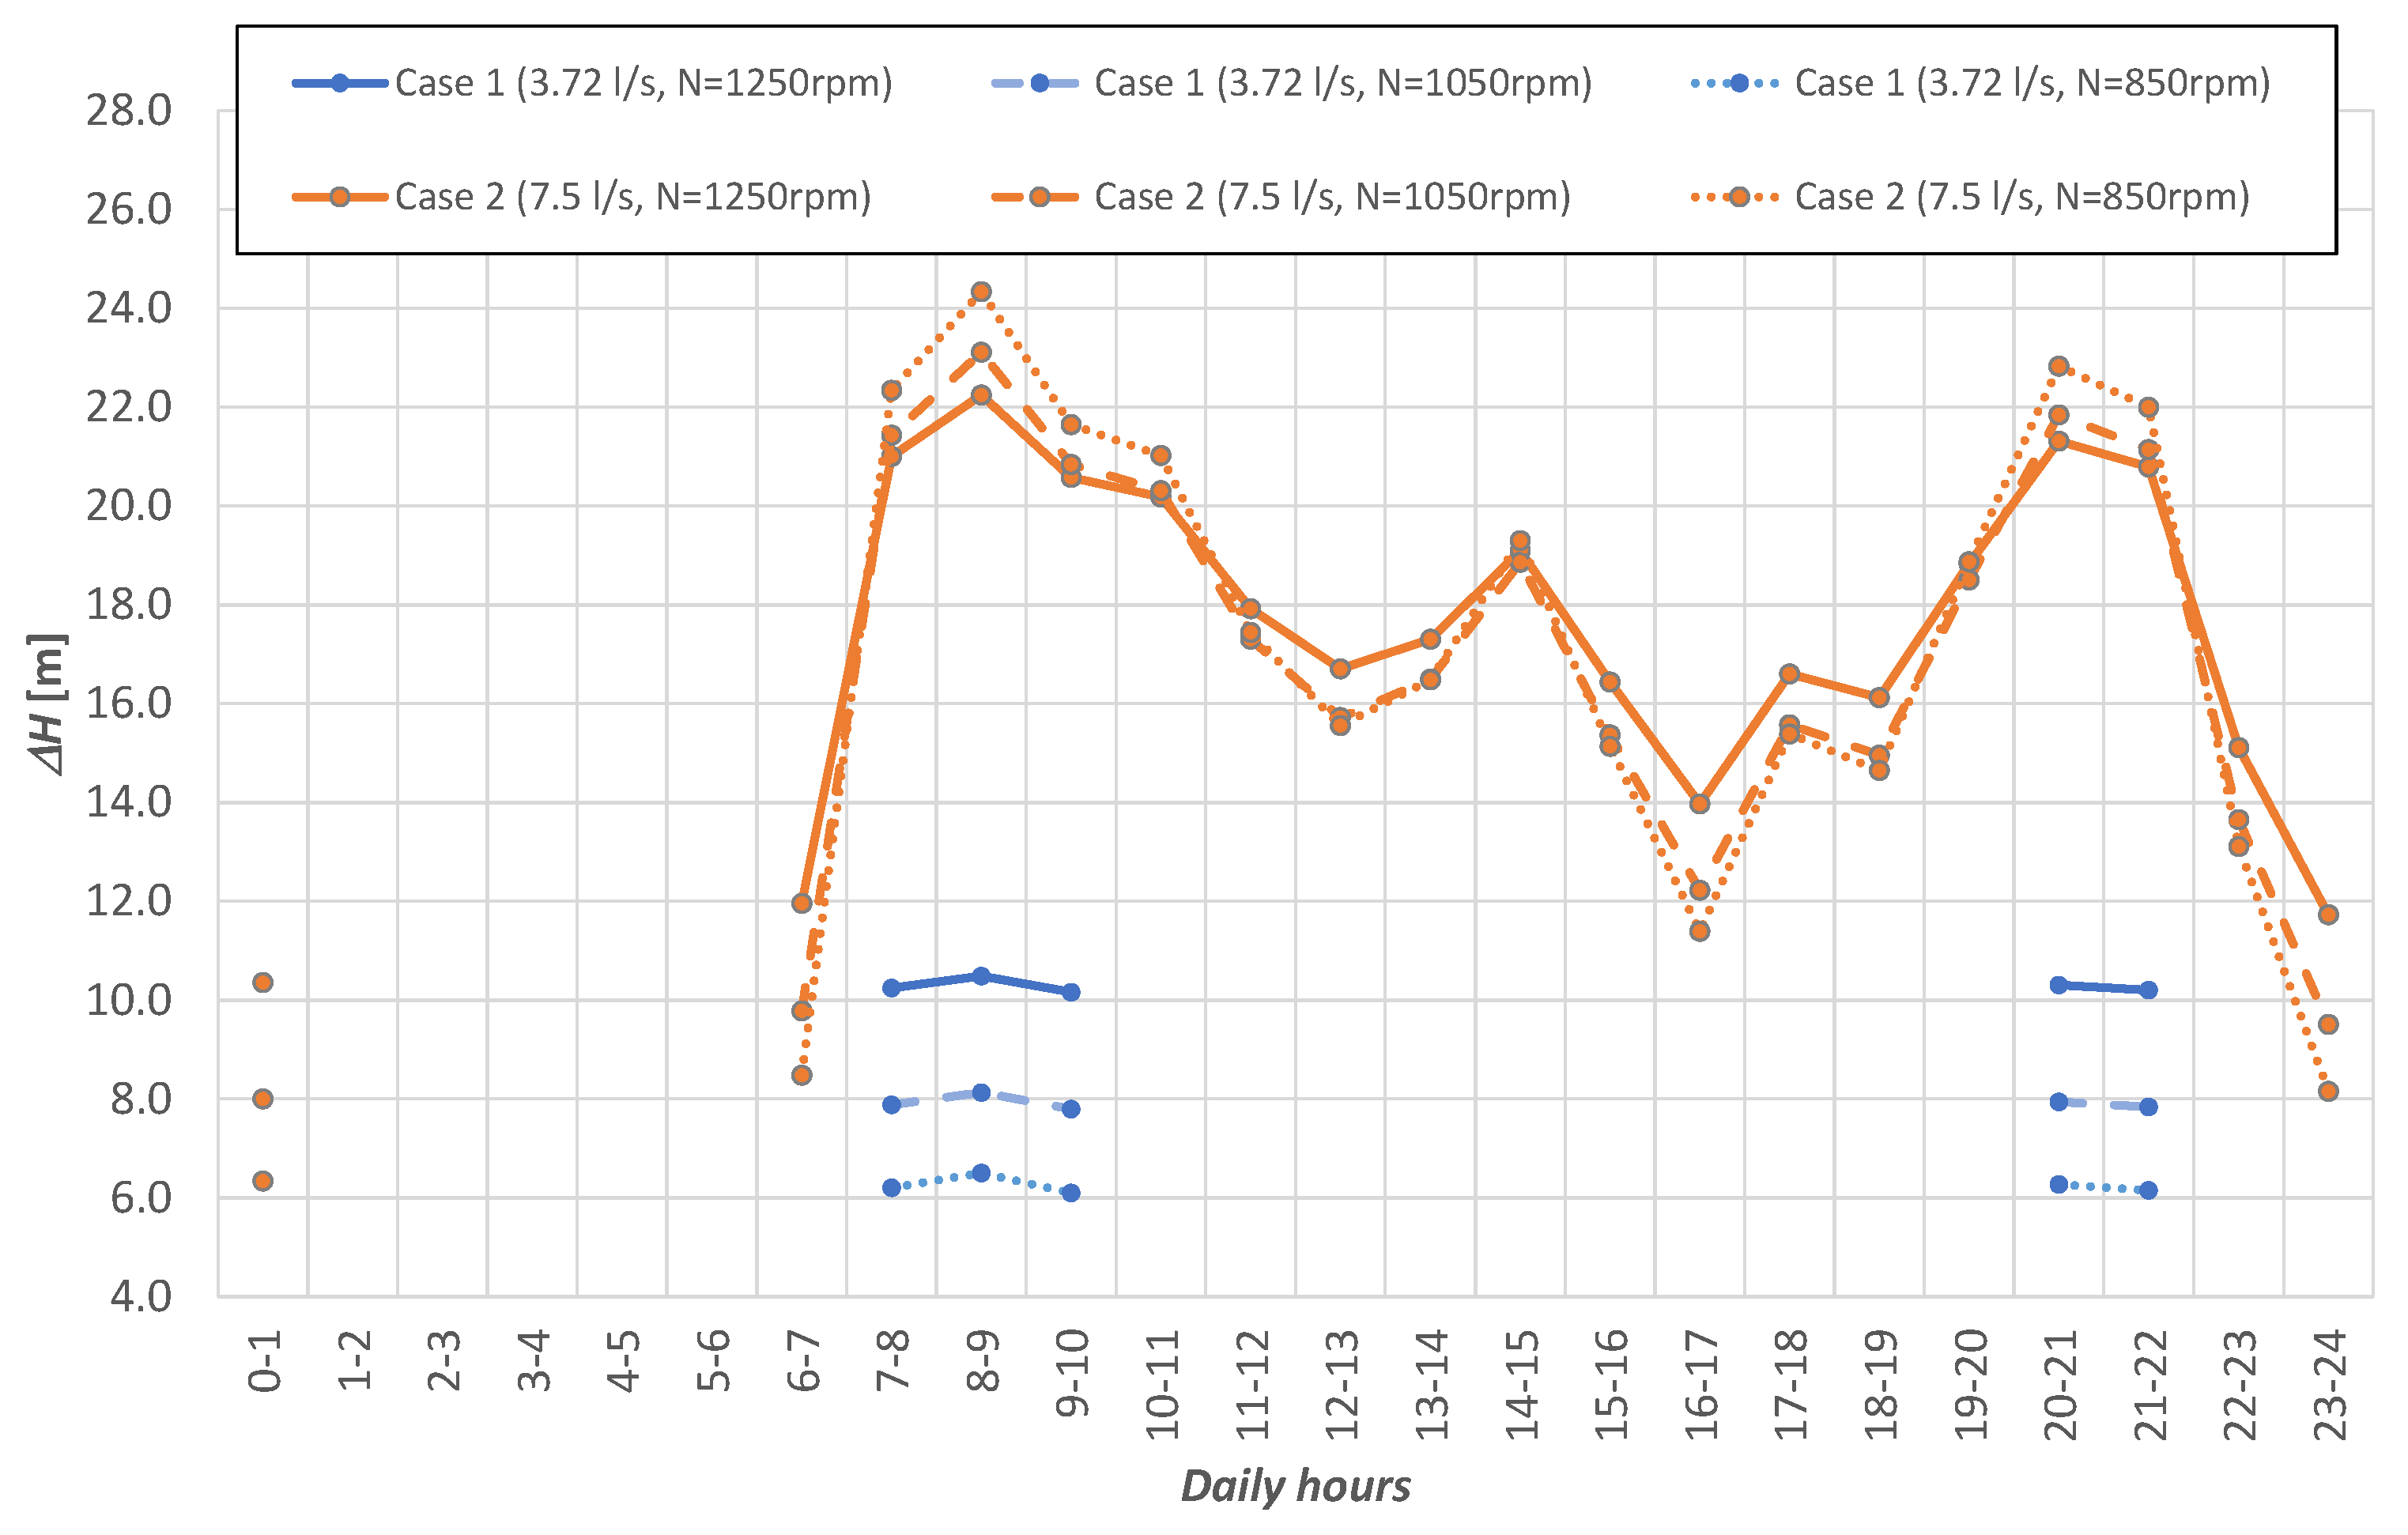
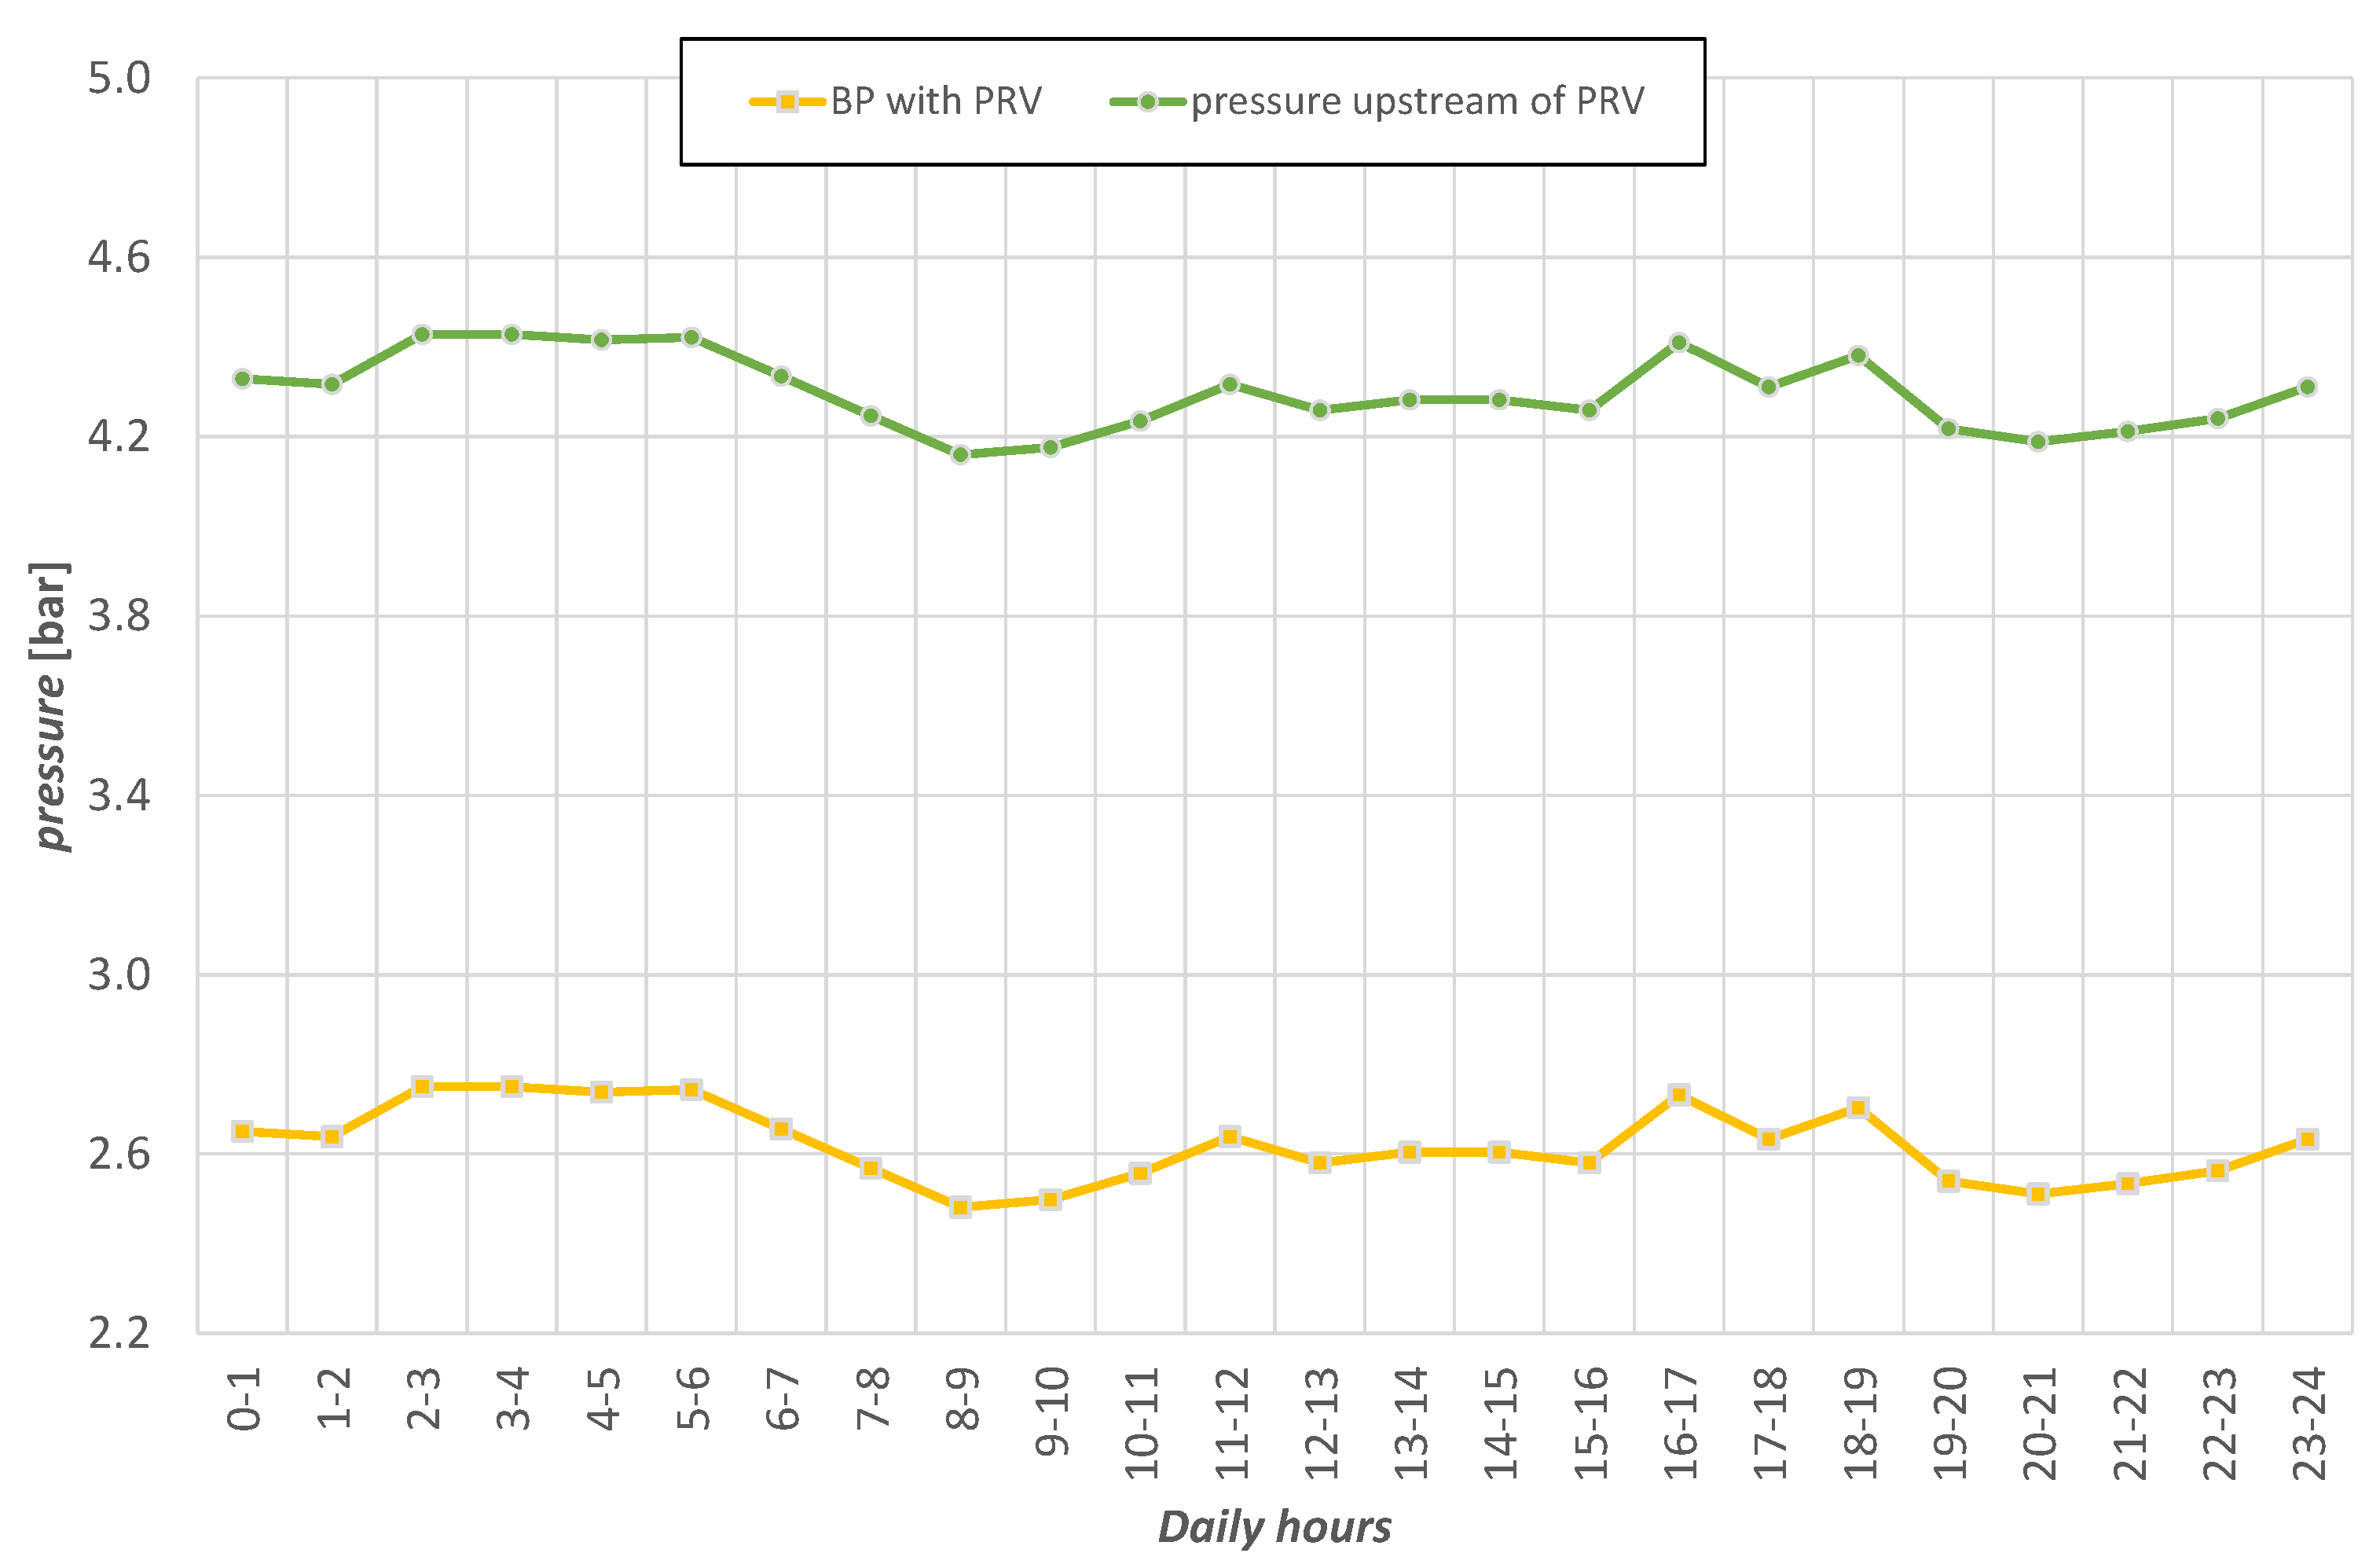
Flow rates passing through the PAT increase with the increase of the feed-pump frequency, although such quantities are not proportional. Specifically, a fixed feed-pump frequency leads to larger/smaller Q values (hence to larger/smaller Δ H ) for smaller/larger values of the PAT rotational speed N (e.g., a 45 Hz frequency provides Q ranging from 7.2 to 5.8 L/s when the speed N changes from 650 to 2200 rpm). With the purpose to investigate the mechanical PAT behavior, results of Test Series 1 are here reported. The mechanical features of the PAT subjected to the braking force, i.e., torque M and mechanical power P M , were thus measured by the test bench. Figure 6 illustrates the evolution of M (top) and P M (bottom) as a function of the PAT speed N. Each dataset and the related interpolating curve refer to a specific frequency of the feed pump, which ranged between 35 and 50 Hz.
The torque M decreases with both the increase of the PAT rotational speed N and the decrease of the feed-pump frequency. Differently, the mechanical power P M initially increases with the rotational speed up to a peak value, then decreases for higher values of N. Such trend is more evident in case of higher feed-pump frequencies (e.g., 50 Hz), where two points of the upper series, corresponding to N = 1250 rpm and 1350 rpm, are located farther from the interpolating curve. Observing the interpolating curves, the peak of each P M curve tends to move towards larger values of N, with the maximum power being reached for N 1000 rpm when the feed-pump frequency is relatively small (35 Hz) and for N 1250 rpm when the feed-pump frequency is relatively large (50 Hz). This suggests that the peak mechanical power that can be obtained from the PAT system increases with both N and frequency. In other words, the larger is the flow rate, the larger is the rotational speed required to get the maximum power. In both panels, the red-highlighted points in the upper curve indicate the tests (i.e., 50 Hz frequency, N = 1650 rpm, and N = 1750 rpm) during which a clearly visible vortex lingered during the whole test. In such cases, the vortex length was of the order of O(1 m), with the N = 1650 rpm case providing a longer vortex, comparable to the transparent pipe length (∼1.7 m, see Figure 2b).
With the aim to directly inspect the effect of the flow rate Q on the mechanical features, Figure 7 and Figure 8 illustrate the evolution of both torque M and power P M , respectively, with respect to the discharge Q flowing through the PAT. The N lines illustrated range between 650 and 1250 rpm, since fewer data were collected for speeds smaller than 650 rpm and larger than 1250 rpm. Hence, data referring to such N values are not here represented.
In Figure 7, the torque increases with the flow rate and, usually, decreases with the rotational speed (e.g., the curve referring to N = 650 rpm is significantly higher than that referring to N = 1250 rpm). However, at specific conditions, i.e., specific values of N and Q, the largest torque value might not refer to the smallest rotational speed. For instance, the N = 1250 rpm line intersects and overcomes the N = 1150 rpm line when Q > 8 L/s. This suggests that larger mechanical powers may be reached at sufficiently large flow rates and speeds, being P M proportional to both M and N (see Equation (2)).
The evolution of P M with the flow rate is illustrated using data points and interpolating curves (Figure 8). To better draw the interpolating lines, data from both Test Series 1 and 2 were here used. The power increases with both flow rate and rotational speed, a behavior similar to that characterizing the head drop. However, in this case, the larger is N, the more rapid is the increase of P M . In other words, while large flow rates lead to small differences in Δ H among the N iso-lines (see Figure 5), large differences are observed in the mechanical power.
To properly understand the performances of the PAT system, the efficiency was evaluated for N = 650–1250 rpm, as reported in Figure 9, where the dependence on both flow rate (top) and mechanical power (bottom) is illustrated. The efficiency η increases with the flow rate in the beginning, then decreases. Such trend changes with N, i.e., the larger is the rotational speed, the larger is the discharge at which the maximum efficiency occurs (in agreement with what observed in Figure 6, bottom). Further, the maximum efficiency is significantly larger at higher N values, e.g., while the maximum efficiency is η ≈ 43% for N = 650 rpm, it rises up to η > 60% when N = 1250 rpm. Conversely, relatively small discharges ( Q 6 L/s) lead to a larger efficiency at small speeds (e.g., η = 37% for N = 650 rpm) if compared to what happens at large speeds ( η = 25% for N = 1250 rpm). If the efficiency is represented as a function of the mechanical power P M (Figure 9, bottom), the produced power significantly varies when passing from Q = 6.0 L/s to Q = 9.0 L/s, i.e., a 50% increase of the flow rate leads to an increase of the mechanical power of more than 500% (see also Figure 8).
The relationship between head drop and mechanical power is also worth investigating, especially in view of the application described in Section 3.3. Hence, Figure 10 illustrates the evolution of Δ H with respect to P M for each investigated N value. While lower N values are related to large head-drop variations (e.g., Δ H ranging between 7.44 and 17.23 m when N = 650 rpm), larger N values are related to large mechanical power variations (e.g., P M ranging between 157 and 837 W when N = 1250 rpm).

3.3. Application

Enhancement of supply systems for energy production purposes is particularly suitable for relatively small urban agglomerates. Since the present work aims at finding efficient and integrated solutions for energy production and consumption in real-world contexts, the results of the application to the municipality of Servigliano is here illustrated (see also Section 2.2).
First, the design of a WDN is usually undertaken with reference to the water required by customers during the day of maximum demand. Then, some considerations should be made, especially for what concerns the water demand variability occurring during the day [32,33,35]. Hence, following the analysis of Section 2.2, different scenarios are here investigated starting from the data collected between 2007 and 2013. The yearly variability of the water consumption is described by two representative values of the mean water demand, i.e., μ q = 3.72 L/s (Case 1) and μ q = 7.50 L/s (Case 2), while the hourly distribution of the flow rate is illustrated in Figure 4.
Due to the largely variable daily flow pattern in small urban areas, the use of the tested PAT should be properly calibrated. Exploitation of the experimental results enables one to calculate the mechanical power as a function of the flow rate, based on the interpolating lines shown in Figure 8. Similarly, the produced head drop can also be estimated through the interpolations illustrated in Figure 5. All interpolating curves are second-degree polynomial functions, all with best-fit coefficients R 2 > 0.995 .
Application of such interpolating lines enables one to investigate the hourly variation of both mechanical power (Figure 11) and head drop (Figure 12). Each case was investigated under three different hypotheses, each related to a specific rotational PAT speed: N = 1250 (solid lines), 1050 (dashed lines), and 850 rpm (dotted lines). This choice was motivated by the dual need to avoid rotational speeds providing significantly small mechanical powers, i.e., N = 650 and 750 rpm (see Figure 8), and have a relatively wide spectrum of PAT working conditions, i.e., N ranging between 850 and 1250 rpm.
Due to the low efficiency at small flow rates (see Figure 9), it was supposed to operate the PAT only when Q 5 L/s. As shown in Figure 11 and Figure 12, the time ranges during which the PAT system would work are different and depend on the analyzed cases. For Case 1, the PAT would work for 5 h, i.e., during 7–10 and 20–22. For Case 2, the working time would be of 19 h, i.e., during 0–1 and 6–24. Hence, a continuous operation of the PAT system would not occur for Case 1, mainly due to the small flow rate during the nighttime, as expected, but also to the double peaked distribution of the flow rate and the relatively small flow rate between the peaks. Conversely, Case 2 shows a large and continuous exploitation of the PAT during the whole daytime and part of the nighttime, i.e., with the only gap between 1 and 6.
Further aspects can be observed from the analysis of the P M evolution. In detail, the comparison illustrated in Figure 11 highlights the effect of N on the hourly variation of P M . However, due to the relatively small flow rate during Case 1, the rotational speed slightly affects P M and the efficiency is η < 40%, 30% and 25% when N = 850 , 1050, and 1250 rpm, respectively. Specifically, the use of an intermediate speed, i.e., N = 1050 (dashed lines), leads to relatively better performances than use of larger ( N = 1250 rpm, solid lines) and smaller ( N = 850 rpm, dotted lines) speeds. Case 2 shows a non-negligible increase of P M with N, this being due to the larger distance among the N curves at large Q values (Figure 8). In this case, the efficiency is η < 55% for the N = 850 rpm scenario, while it is η > 55% for most of the working time, when N = 1050 rpm or 1250 rpm. The largest efficiency is reached at large flow rates ( Q > 8.5 L/s) for N = 1250 rpm.
An important issue is the effect of the water demand. In particular, relatively small values of μ q (e.g., Case 1, blue lines) lead to significantly small values of P M . As an example, the highest demand peak, occurring in the morning between 8 and 9, is associated to a maximum value P M = 94 and 1447 W when the mean demand is, respectively, μ q = 3.72 and 7.50 L/s. Hence, the doubling of the water demand leads to a mechanical power 15 times larger. In addition, a larger mean water demand provides a more continuous power production, i.e., Case 2 (orange lines) is better suited for the application of the PAT system as it would be operative for 19 h continuously. From the analysis of Case 2, P M increases of about 30% when passing from N = 850 rpm to N = 1250 rpm during relatively low-flow conditions (e.g., between 12 and 13) and about 50% during relatively high-flow conditions (e.g., between 8 and 9). This is due to the larger efficiency and mechanical power obtained with larger N values when the flow rate is large, i.e., Q > 7 L/s (see Figure 9).
On the other hand, the head drop should also be accounted for when choosing the most suitable PAT configuration (Figure 12), as large μ q values lead to large head drops. Further, Δ H is more sensitive to the change in the rotational speed when the mean water demand is relatively small. For instance, when N changes from 850 to 1250 rpm, a variation larger than 60% occurs during the highest peak for Case 1, while smaller variations occur for Case 2 (<10%).
On 17 July 2008, upstream of the Servigliano WDN, a PRV provided a head drop Δ H P R V 17 m, which guaranteed a backpressure (BP) downstream of the PRV in the range 25–28 m throughout the day. Figure 13 illustrates the measured pressure upstream (green line) and downstream (yellow line) of the PRV. At a first sight, comparing with Figure 12, the head drop produced by the PRV is larger than the maximum value estimated for the PAT application related to Case 1 ( Δ H 1 < Δ H P R V ), while Case 2 often leads to larger drops ( Δ H 2 > Δ H P R V ).
However, in light of the above results and in view of a possible PAT installation, a suitable strategy should be selected, in terms of both: (i) PAT-PRV configuration; and (ii) PAT regulation. First, for the case at hand, a complete replacement of the existing PRV with the analyzed PAT seems to be difficult. This is due to the working conditions tested during the laboratory experiments, since the maximum pressure recorded upstream of the PAT was 3.5 b a r , i.e., smaller than that recorded upstream of the PRV. For the real-world application, a PRV–PAT integration is thus suggested, to allow the PRV to reduce the pressure coming from the reservoir, located upstream, and make the PAT work in almost optimal conditions.
Second, a further reasoning is required in terms of PAT system design and regulation [2]. Application of an HR approach would be suitable. A regulating valve, such as a PRV, in parallel with the PAT would provide a large dissipation during the nighttime, when the PAT is not working. During the daytime, when the power generation is important, a regulation valve in series with the PAT would dissipate part of the excess pressure to allow the PAT to properly operate. On the other hand, an ER approach would allow the user to exploit different PAT rotational speeds, with the aim to reach the best efficiency and make the PAT work around its BEP. Finally, a thorough analysis of the operating PAT conditions in the WDN and the combined use of PAT, regulating valves and inverter (HER-type approach) might lead to the optimal use of the PAT system [23].

4. Conclusions

According to the modern trend for a sustainable management of natural resources, the potential energy deriving from the excess of pressure available in several parts of the water supply networks should be recovered and exploited. However, the low values of available power and the large variations of flow rate and pressure drop, with the consequent need for an expensive power plant control system, hinder the diffusion of such practice for small residential areas. In this paper, a centrifugal pump available in a laboratory facility was tested in reverse conditions, with the aim to reproduce real-case conditions. Different hydrodynamic and mechanical forcing actions were tested, accordingly to users’ water demand. Relatively large flow rates ( Q > 8 L/s) were seen to provide relatively large energy dissipation ( Δ H > 13 m) and mechanical power ( P M > 400 W). Further, an increase of the rotational speed provides an increase of both Δ H and P M , with the former mainly changing at small flow rates ( Q < 6 L/s) and the latter mainly changing at large flow rates ( Q > 8 L/s).
Results show that this type of application is a suitable solution to harvest energy from conventional water distribution networks at small scale (e.g., neighborhoods). With the aim to reproduce typical real-world conditions, the experimental results obtained from the characterization of an available pump, here used as a PAT, were applied, although we are aware of the need to properly design the PAT application through investigation of further possibilities (e.g., see [8]). Some scenarios were tested by parameterizing the rotational PAT speed and the value of the mean water demand. The choice of such demand was based on the available data collected in the municipality of Servigliano (Fermo, Italy) in recent years. The investigated conditions demonstrate that a suitable choice of the PAT-system use (e.g., rotational speed and operational time) is needed to guarantee a sufficient mechanical power and a head drop compatible with the minimum service level, considering that a larger mean water demand means larger flow rate, hence larger power and head drop. For the case at hand, it was observed that the power (ranging between ∼50 and ∼1450 W) is largely sensitive to the used mean water demand and less sensitive to the PAT operational speed, while the head drop (ranging between ∼6 and ∼24 m) is less affected by such parameters. It can also be stated that the obtained head drops are smaller than those provided by the existing PRV when the mean water demand recorded in Servigliano is used. If the mean demand is twice this value, the head drop presents large oscillations, sometimes being larger and sometimes smaller than the drop provided by the existing PRV. In such conditions, an optimal PAT design should be undertaken, considering the possibility to opt for a hydraulic and/or electrical regulation.
Finally, the design of a pico-hydropower plant sized for each real-case leads to the possibility to produce and sell energy and, consequently, to save management costs in a relatively simple way. Exploiting the results here found and taking into account the reduced cost of a PAT application (e.g., compared to a customized turbine), future studies within the “WISE Buildings” project will investigate the costs and impacts related to PAT applications at neighborhood scale, compared to provided energy benefits, considering all relevant life-cycle stages and taking into account the possible uncertainties related to the future macro-economic scenario, to PAT installation and maintenance costs and to the water supply demand [36,37].

Author Contributions

Conceptualization, M.P., F.F., and G.D.; methodology, M.P., F.F., L.P., and G.D.; investigation, F.F., M.P., and L.P.; resources, M.P., L.P., E.D.G., L.S., and G.D.; writing—original draft preparation, F.F. and M.P.; and writing—review and editing, M.P., G.D., F.F., L.P., L.S., and E.D.G. All authors have read and agreed to the published version of the manuscript.

Funding

This work was fully supported by the scientific project “WISE Buildings” funded by Università Politecnica delle Marche (Italy), internal program 2018/2019.

Acknowledgments

Special thanks go to G. Di Giovine, G. Giuliani, and L. Luccarini, for designing and realizing the experimental apparatus, as well as for their help during the data analysis. Acknowledgments are also given to CIIP s.p.a., the local water authority of Servigliano, for providing the authors with the consumption database. We also thank the anonymous Reviewers for their useful comments.

Conflicts of Interest

The authors declare no conflict of interest.

References

  1. Derakhshan, S.; Nourbakhsh, A. Experimental study of characteristic curves of centrifugal pumps working as turbines in different specific speeds. Exp. Therm. Fluid Sci. 2008, 32, 800–807. [Google Scholar] [CrossRef]
  2. Carravetta, A.; Del Giudice, G.; Fecarotta, O.; Ramos, H.M. Energy production in water distribution networks: A PAT design strategy. Water Resour. Manag. 2012, 26, 3947–3959. [Google Scholar] [CrossRef]
  3. Fontana, N.; Giugni, M.; Portolano, D. Losses reduction and energy production in water-distribution networks. J. Water Resour. Plan. Manag. 2012, 138, 237–244. [Google Scholar] [CrossRef]
  4. Sammartano, V.; Aricò, C.; Carravetta, A.; Fecarotta, O.; Tucciarelli, T. Banki-Michell optimal design by computational fluid dynamics testing and hydrodynamic analysis. Energies 2013, 6, 2362–2385. [Google Scholar] [CrossRef]
  5. Stefanizzi, M.; Torresi, M.; Fortunato, B.; Camporeale, S. Experimental investigation and performance prediction modeling of a single stage centrifugal pump operating as turbine. Energy Procedia 2017, 126, 589–596. [Google Scholar] [CrossRef]
  6. Delgado, J.; Ferreira, J.; Covas, D.; Avellan, F. Variable speed operation of centrifugal pumps running as turbines. Experimental investigation. Renew. Energy 2019, 142, 437–450. [Google Scholar] [CrossRef]
  7. Morani, M.C.; Carravetta, A.; Fecarotta, O.; McNabola, A. Energy Transfer from the Freshwater to the Wastewater Network Using a PAT-Equipped Turbopump. Water 2020, 12, 38. [Google Scholar] [CrossRef] [Green Version]
  8. Darvini, G.; Soldini, L. Pressure control for WDS management. A case study. Procedia Eng. 2015, 119, 984–993. [Google Scholar] [CrossRef] [Green Version]
  9. Pugliese, F.; De Paola, F.; Fontana, N.; Giugni, M.; Marini, G. Experimental characterization of two pumps as turbines for hydropower generation. Renew. Energy 2016, 99, 180–187. [Google Scholar] [CrossRef]
  10. Jain, S.V.; Patel, R.N. Investigations on pump running in turbine mode: A review of the state-of-the-art. Renew. Sustain. Energy Rev. 2014, 30, 841–868. [Google Scholar] [CrossRef]
  11. Novara, D.; Carravetta, A.; McNabola, A.; Ramos, H. Cost model for pumps as turbines in run-of-river and in-pipe microhydropower applications. J. Water Resour. Plan. Manag. 2019, 145, 04019012. [Google Scholar] [CrossRef]
  12. Barbarelli, S.; Amelio, M.; Florio, G. Experimental activity at test rig validating correlations to select pumps running as turbines in microhydro plants. Energy Convers. Manag. 2017, 149, 781–797. [Google Scholar] [CrossRef]
  13. Venturini, M.; Alvisi, S.; Simani, S.; Manservigi, L. Comparison of Different Approaches to Predict the Performance of Pumps as Turbines (PATs). Energies 2018, 11, 1016. [Google Scholar] [CrossRef] [Green Version]
  14. Yang, S.S.; Derakhshan, S.; Kong, F.Y. Theoretical, numerical and experimental prediction of pump as turbine performance. Renew. Energy 2012, 48, 507–513. [Google Scholar] [CrossRef]
  15. Rossi, M.; Righetti, M.; Renzi, M. Pump-as-Turbine for energy recovery applications: The case study of an aqueduct. Energy Procedia 2016, 101, 1207–1214. [Google Scholar] [CrossRef]
  16. De Marchis, M.; Milici, B.; Volpe, R.; Messineo, A. Energy saving in water distribution network through pump as turbine generators: Economic and environmental analysis. Energies 2016, 9, 877. [Google Scholar] [CrossRef] [Green Version]
  17. Renzi, M.; Rudolf, P.; Štefan, D.; Nigro, A.; Rossi, M. Installation of an axial Pump-as-Turbine (PaT) in a wastewater sewer of an oil refinery: A case study. Appl. Energy 2019, 250, 665–676. [Google Scholar] [CrossRef]
  18. Morabito, A.; Hendrick, P. Pump as turbine applied to micro energy storage and smart water grids: A case study. Appl. Energy 2019, 241, 567–579. [Google Scholar] [CrossRef]
  19. Kramer, M.; Terheiden, K.; Wieprecht, S. Pumps as turbines for efficient energy recovery in water supply networks. Renew. Energy 2018, 122, 17–25. [Google Scholar] [CrossRef] [Green Version]
  20. Sammartano, V.; Sinagra, M.; Filianoti, P.; Tucciarelli, T. A Banki–Michell turbine for in-line water supply systems. J. Hydraul. Res. 2017, 55, 686–694. [Google Scholar] [CrossRef]
  21. Sammartano, V.; Filianoti, P.; Sinagra, M.; Tucciarelli, T.; Scelba, G.; Morreale, G. Coupled hydraulic and electronic regulation of cross-flow turbines in hydraulic plants. J. Hydraul. Eng. 2017, 143, 04016071. [Google Scholar] [CrossRef]
  22. Carravetta, A.; Del Giudice, G.; Fecarotta, O.; Ramos, H.M. PAT design strategy for energy recovery in water distribution networks by electrical regulation. Energies 2013, 6, 411–424. [Google Scholar] [CrossRef] [Green Version]
  23. Carravetta, A.; Derakhshan Houreh, S.; Ramos, H.M. Pumps as turbines. In Springer Tracts in Mechanical Engineering; Springer: Cham, Switzerland, 2018; p. 236. [Google Scholar]
  24. Tricarico, C.; Morley, M.S.; Gargano, R.; Kapelan, Z.; De Marinis, G.; Savic, D.; Granata, F. Integrated optimal cost and pressure management for water distribution systems. Procedia Eng. 2014, 70, 1659–1668. [Google Scholar] [CrossRef] [Green Version]
  25. Carravetta, A.; Fecarotta, O.; Ramos, H. A new low-cost installation scheme of PATs for pico-hydropower to recover energy in residential areas. Renew. Energy 2018, 125, 1003–1014. [Google Scholar] [CrossRef]
  26. Lydon, T.; Coughlan, P.; McNabola, A. Pressure management and energy recovery in water distribution networks: Development of design and selection methodologies using three pump-as-turbine case studies. Renew. Energy 2017, 114, 1038–1050. [Google Scholar] [CrossRef]
  27. Muhammetoğlu, A.; Muhammetoğlu, H. Excess Pressure in Municipal Water Supply Systems as a Renewable Energy Source: Antalya Case Study. In Recycling and Reuse Approaches for Better Sustainability; Springer: Berlin, Germany, 2019; pp. 113–126. [Google Scholar]
  28. Alberizzi, J.C.; Renzi, M.; Nigro, A.; Rossi, M. Study of a Pump-as-Turbine (PaT) speed control for a Water Distribution Network (WDN) in South-Tyrol subjected to high variable water flow rates. Energy Procedia 2018, 148, 226–233. [Google Scholar] [CrossRef]
  29. Du, J.; Yang, H.; Shen, Z.; Chen, J. Micro hydro power generation from water supply system in high rise buildings using pump as turbines. Energy 2017, 137, 431–440. [Google Scholar] [CrossRef]
  30. Milano, V. ACQUEDOTTI; Hoepli: Milan, Italy, 2012. (In Italian) [Google Scholar]
  31. Creaco, E.; Franchini, M.; Todini, E. Generalized resilience and failure indices for use with pressure-driven modeling and leakage. J. Water Resour. Plan. Manag. 2016, 142, 04016019. [Google Scholar] [CrossRef]
  32. Darvini, G.; Ruzza, V.; Salandin, P. Performance Assessment of Water Distribution Systems Subject to Leakage and Temporal Variability of Water Demand. J. Water Resour. Plan. Manag. 2020, 146, 04019069. [Google Scholar] [CrossRef]
  33. Tricarico, C.; De Marinis, G.; Gargano, R.; Leopardi, A. Peak residential water demand. In Proceedings of the Institution of Civil Engineers-Water Management; Thomas Telford Ltd.: London, UK, 2007; Volume 160, pp. 115–121. [Google Scholar]
  34. IEC. Hydraulic Turbines, Storage Pumps and Pump-Turbines—Model Acceptance Tests; International Electrotechnical Commission: Geneva, Switzerland, 1999; European Standard EN 60193:1999. [Google Scholar]
  35. Balacco, G.; Carbonara, A.; Gioia, A.; Iacobellis, V.; Piccinni, A. Evaluation of peak water demand factors in Puglia (Southern Italy). Water 2017, 9, 96. [Google Scholar] [CrossRef] [Green Version]
  36. Favi, C.; Di Giuseppe, E.; D’Orazio, M.; Rossi, M.; Germani, M. Building retrofit measures and design: A probabilistic approach for LCA. Sustainability 2018, 10, 3655. [Google Scholar] [CrossRef] [Green Version]
  37. Baldoni, E.; Coderoni, S.; D’Orazio, M.; Di Giuseppe, E.; Esposti, R. The role of economic and policy variables in energy-efficient retrofitting assessment. A stochastic Life Cycle Costing methodology. Energy Policy 2019, 129, 1207–1219. [Google Scholar] [CrossRef]
Figure 1. Top view of the experimental setup.
Water 12 00958 g001
Figure 2. Experimental setup: (a) indication of the main elements of the supply system; and (b) vortex generation at the PAT outlet.
Water 12 00958 g002
Figure 3. Daily mean water demand in Servigliano between 2007 and 2013 (blue dots). The mean value (blue line), summertime measures (red circles), and maximum collected data (green circles) are shown.
Water 12 00958 g003
Figure 4. Water demand in Servigliano measured on 17 July 2008 ( μ q = 3.72 L/s, blue solid line) and related hourly coefficient C d (green dashed line). The scenario referring to the optimal PAT application ( μ q = 7.50 L/s, orange line) is also illustrated.
Water 12 00958 g004
Figure 5. PAT characteristic curves (solid lines and symbols) referring to a specific rotational speed N. Interpolations are also shown (dotted colored lines). The curve referring to the pump working in classical mode at N = 1450 rpm is also shown (dashed line).
Water 12 00958 g005
Figure 6. Curves of torque (top) and mechanical power (bottom) vs. rotational speed of the PAT, each referring to a specific frequency of the feed pump.
Water 12 00958 g006
Figure 7. Curves of torque vs. flow rate through the PAT, each referring to a specific rotational speed of the PAT.
Water 12 00958 g007
Figure 8. Data from Test Series 1 and 2 and interpolating lines of mechanical power vs. flow rate through the PAT, each referring to a specific rotational speed of the PAT.
Water 12 00958 g008
Figure 9. PAT efficiency vs. discharge (top) and vs. mechanical power (bottom). Each curve refers to a specific rotational speed N.
Water 12 00958 g009
Figure 10. Curves of head drop vs. mechanical power, each referring to a specific rotational PAT speed N.
Water 12 00958 g010
Figure 11. Daily distribution of mechanical power for the investigated cases (blue for μ q = 3.72 L/s and orange for μ q = 7.50 L/s) and PAT speed (solid for N = 1250 rpm, dashed for N = 1050 rpm, and dotted for N = 850 rpm).
Water 12 00958 g011
Figure 12. Daily distribution of head drop for the investigated scenarios (blue for μ q = 3.72 L/s and orange for μ q = 7.50 L/s) and PAT speed (solid for N = 1250 rpm, dashed for N = 1050 rpm, and dotted for N = 850 rpm).
Water 12 00958 g012
Figure 13. Daily distribution of pressure measured upstream (green line) and downstream (yellow line) of the existing PRV.
Water 12 00958 g013
Table 1. Main characteristics of the Rotos pump when working in classical mode.
Flow rate value at BEP Q B 7 L/s
Head at BEP H B 10 m
Best efficiency value η B 0.75
Fixed rotating speed N1450 rpm
Specific speed N s p 12.63
Impeller diameter65 mm
Liquid processedH2O ( ρ = 1000 kg/m3)
Table 2. Components of the experimental setup (instrument accuracy is also reported).
#ComponentSpecifications
1Open tank2.0 m × 1.0 m × 2.5 m
1Feed pumpCaprari multistage vertical electric pump
( P = 5.5 kW, H m a x = 56 m, Q m a x = 10.2 L/s)
2Flowmeters1 instant-measuring (Riels)
1 electromagnetic Endress+Hauser [acc.: ±0.5%]
4Flow-regulation valves2 butterfly valves (V1, V3)
1 diaphragm valve (V2)
1 globe valve (Vu)
3Pressure meters1 barometer
2 electronic Endress+Hauser [acc.: ±0.3%]
1PATRotos axial pump
(1.23 kW, max head 12 m, max flow 11.2 L/s)
1Test benchBorghi&Saveri
Table 3. Characteristics of the analyzed cases.
CaseDescriptionnd [lpd]α μ q [L/s]
1Servigliano23771301.043.72
2PAT optimized47921301.047.50

