Overview of the Chemical and Isotopic Investigations of the Mareza Springs and the Zeta River in Montenegro


1
“Water Supply and Sewerage” LLC, Zetskih vladara bb, 81000 Podgorica, Montenegro
2
Faculty of Civil Engineering, University of Montenegro, Dzordza Vasingtona bb, 81000 Podgorica, Montenegro
3
Department of Environmental Sciences, Jožef Stefan Institute, Jamova cesta 39, 1000 Ljubljana, Slovenia
4
Faculty of Environmental Protection, University of Educons, Vojvode Putnika 87, 21208 Sremska Kamenica, Serbia
*
Author to whom correspondence should be addressed.
Water 2020, 12(4), 957; https://doi.org/10.3390/w12040957
Submission received: 18 February 2020
/
Revised: 23 March 2020
/
Accepted: 23 March 2020
/
Published: 28 March 2020
(This article belongs to the Section Water Resources Management, Policy and Governance)
Abstract
:The Mareza karst aquifer is the most important drinking water resource for the water supply system of the City of Podgorica, the capital of Montenegro. This study presents the first assessment for the determination of the Mareza catchment area. Water chemistry and stable isotopic composition (δ18O and δ2H) of monthly precipitation samples (as inputs) are presented, in order to determine the Local Meteoric Water Line (LMWL) for the study area, and to analyze the behavior of the karst spring Mareza (as output) and the Zeta River water. The possible impact of the river on the Mareza springs was also investigated. Stable isotope compositions were used to analyze the origin of the four springs of the Mareza aquifer. Seasonal variations of δ18O and δ2H values and deuterium excess (d excess) changes in precipitation are explained by the mixing of air masses, such that a Mediterranean source prevails in the winter period, while in the summer period, the area is rather under the influence of air mass originating from the Atlantic Ocean. All spring water samples have lower δ values than the local precipitation and they plot above the LMWL, which may indicate recharge at a higher altitude in the distant mountainous area. The d excess values of all water samples (higher than 10‰) indicate the prevalence of the Mediterranean as a moisture source. Based on the analysis of the seasonal variations of δ18O and δ2H in precipitation and the Mareza spring, it has been estimated that the groundwater mean transit time (MTT) is 92–129 days, and that the young water fraction (Fyw) amounts to 40.9%–53.3%. These values are typical for the strong karstic springs of highly karstified terrains.
Keywords:
karst aquifers; surface water; precipitation; water chemistry; stable isotopes; Montenegro1. Introduction
Karst aquifers are of utmost importance for the drinking water supply in Montenegro, where more than two-thirds of the territory are covered by carbonate formations (limestone, dolostone, and dolomite) belonging to south-eastern Dinaric Alps, and more than 90% of the population depends upon drinking water supplied by groundwater. Rapid development of tourism in the last two decades has increased the need for drinking water, in particular in the coastal areas, during the summer, where the population during the peak season has more than tripled [1].
Compared to other groundwater systems, karstic aquifers are intrinsically vulnerable, since karstified carbonate terrains exhibit strong fissuring and spatially highly variable multiphase porosity, which enables diffuse and concentrated infiltration of water from the surface. Karstic groundwater flow is therefore different from that in other types of aquifers [2,3], namely a combination of slow fracture and quick conduit flows, where the water residence time in the matrix can be several orders of magnitude longer than that in the conduits [4]. Infiltration rates and underground water flow are controlled by heterogeneous permeability and hydrological conditions. The abundance and quality of karstic water resources is thus highly susceptible to climate [5] and land use change [6].
Protection and sustainable management of karstic groundwater require sound evaluation of recharge based on adequate delineation of recharge areas, which is regularly supported by the use of a variety of natural or artificial geochemical and isotopic tracers [7,8,9]. The Mareza aquifer, which provides drinking water for more than 60% of the municipal area of Podgorica (120,000 inhabitants), has been the subject of many scientific investigations [10,11,12,13,14,15], but until now, isotopic tracers have not been used. The origin of the Mareza spring and the nearby Zeta River water was interpreted on the basis of hydrogeological characteristics and structure of the terrain. The results of a previous study of the Mareza were inconclusive, since it could not be identified whether it is a uniform or seasonally fragmented karst aquifer or a group of aquifers which do not communicate with each other [14]. A general direction of the water flow from north to south was identified, but the recharge area has not yet been determined.
Stable O and H isotopes are excellent natural tracers of sources of water because of the spatial and temporal variability of the O and H isotope ratios in precipitation [16]. They have greatly contributed to the understanding of hydrological processes [17,18], particularly that of groundwater recharge [19,20,21], groundwater mixing [22,23,24,25], and the interactions between groundwater and surface water [26,27,28,29]. On the other hand, groundwater chemistry is controlled greatly by interaction of water with the aquifer through which it flows. In any area, groundwater exhibits an isotopic and chemical fingerprint, obtained during processes such as soil/rock-water interaction during recharge and groundwater flow, prolonged storage in the aquifer, dissolution and precipitation of minerals, element speciation, and so forth [30]. The chemistry of karstic ground and spring water and the temporal and spatial variations of major ion concentrations are important in understanding chemical and physical processes that are influenced by geological setting, climate, and anthropogenic activities [31]. These processes can also be studied by determining the spatial and temporal variability of the isotopic composition of hydrogen, oxygen, and carbon in water [32]. Stable isotopes of hydrogen and oxygen are useful tools to indicate the potential water inputs to the system and to determine the mixing of waters with different origins within the system [33,34].
In the present paper, we report the first results of water isotope analyses of precipitation and the Zeta River and Mareza spring water. Based on the results, the origin and mean transit time of spring and river water were determined, providing essential information for groundwater management in the area.
2. Materials and Methods
2.1. Study Area
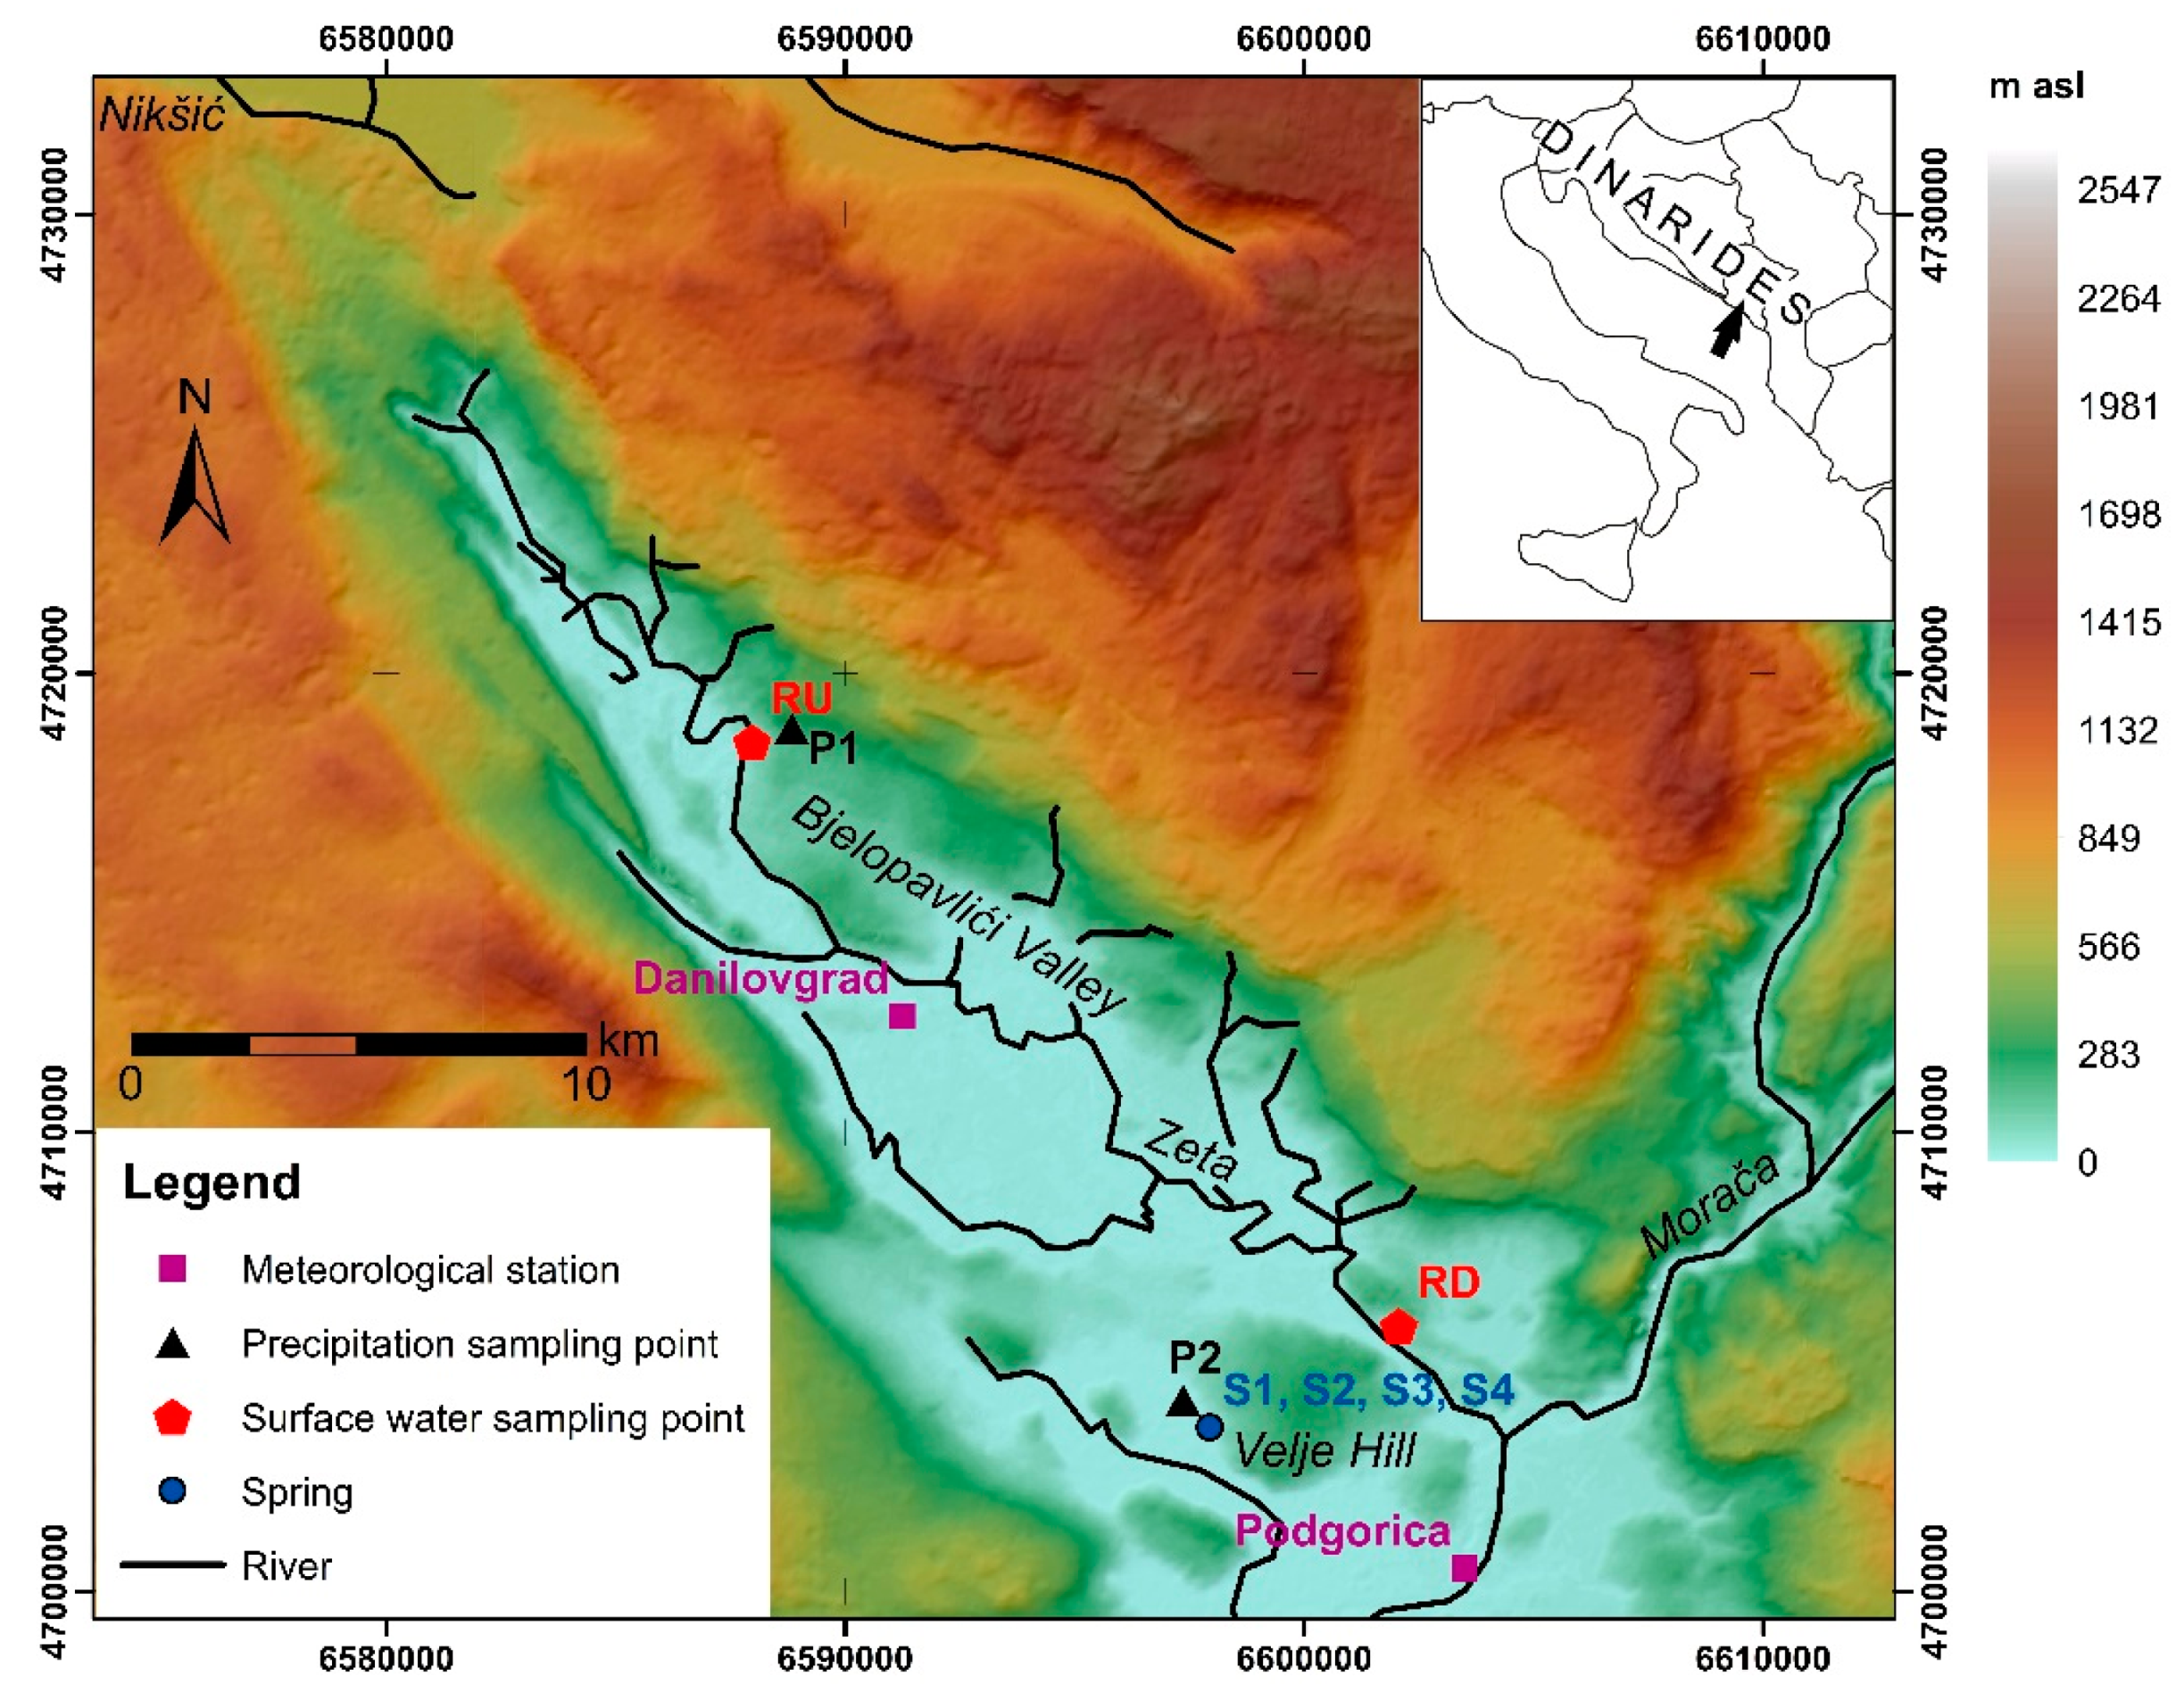
The Mareza karst aquifer is located in the central part of Montenegro (Figure 1). It belongs to the Adriatic hydrological basin—more precisely, the Skadar Lake basin—and lays about 50 km away from the Adriatic Sea and 20 km away from the lake Skadar. The Mareza springs are located at elevations from 26 to 32.7 m asl (above sea level). The Zeta River, with a total length of 85 km, flows a few kilometers northeast of the Mareza springs.
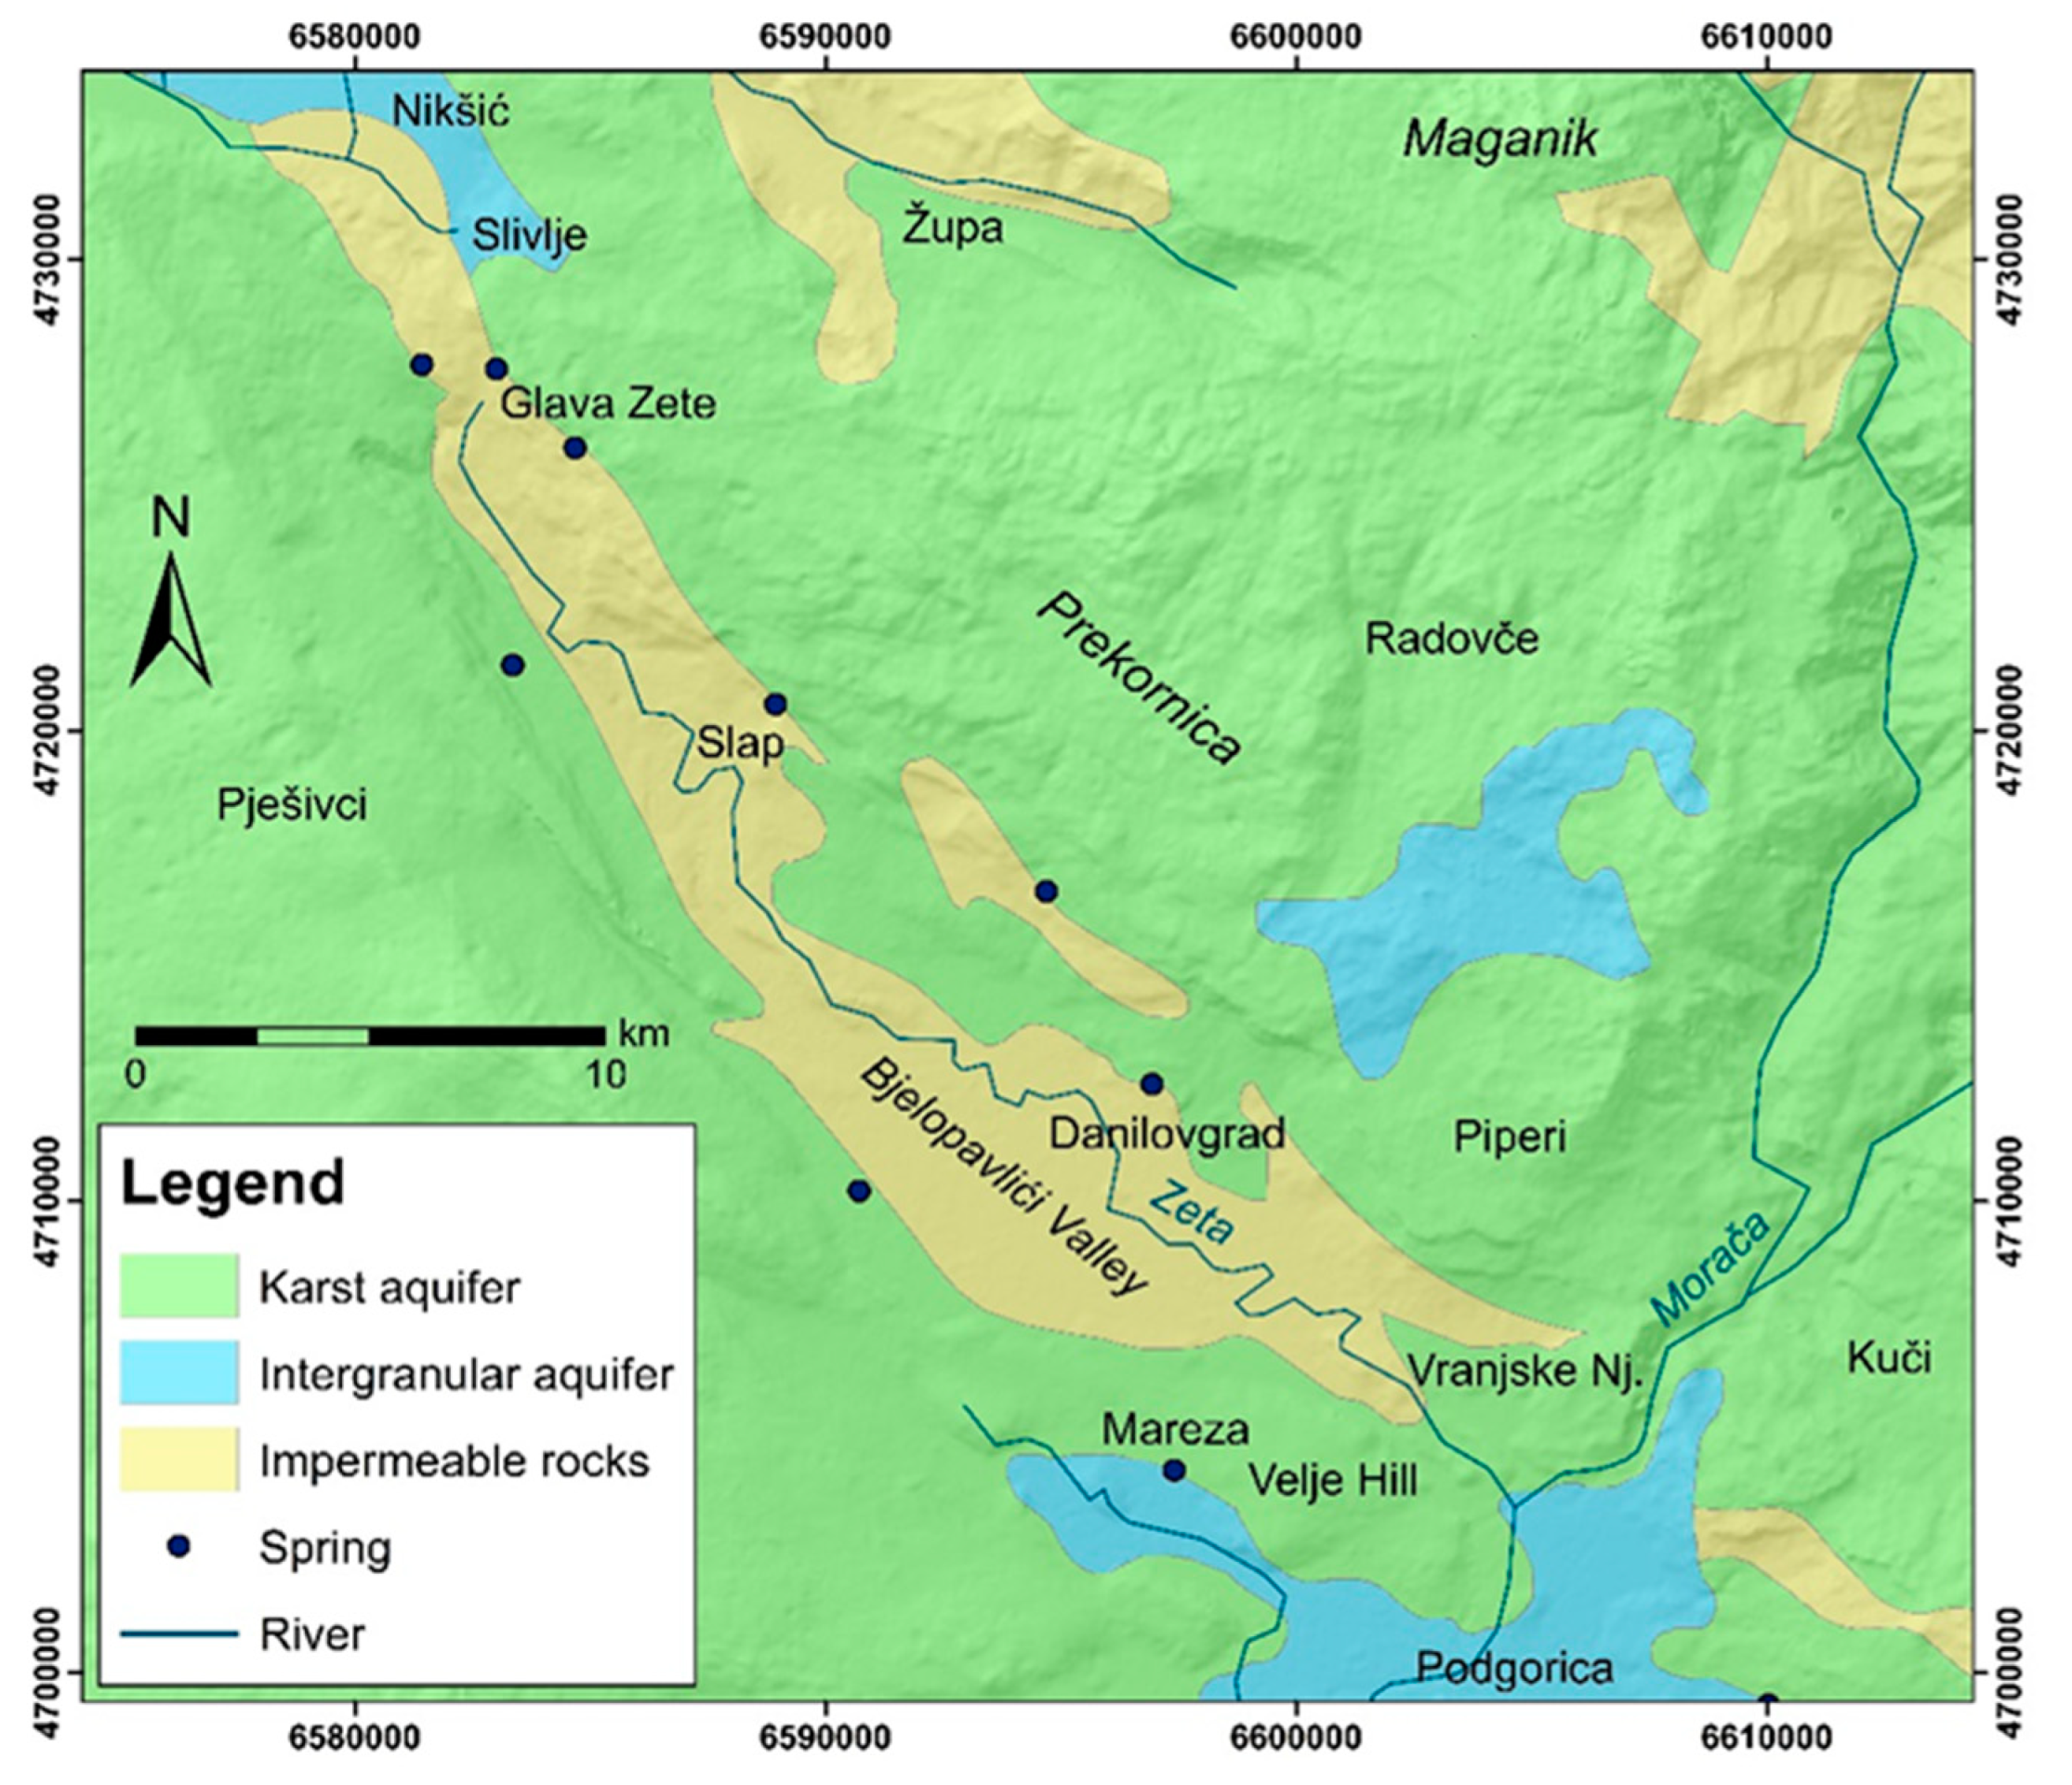
The study area includes the lower course of the Zeta River (the valley is known as the Zeta River Valley or the Bjelopavlici Valley), its permanent or ephemeral tributaries, and springs. The valley is the only traffic corridor between the two biggest Montenegrin towns of Nikšić and Podgorica. The Mareza aquifer and the Zeta River are separated by the Velje hill, which is built of permeable limestone (Figure 1 and Figure 2). The area around the Mareza springs consists of highly permeable karstified Upper Cretaceous limestone, which lays on clayey sediments and clays [35]. Generally, the recharge area of the Skadar Lake karst aquifer is spread over a wide area in the karst plateaus, while the discharge area extends along the karst depressions and deep canyons [36].
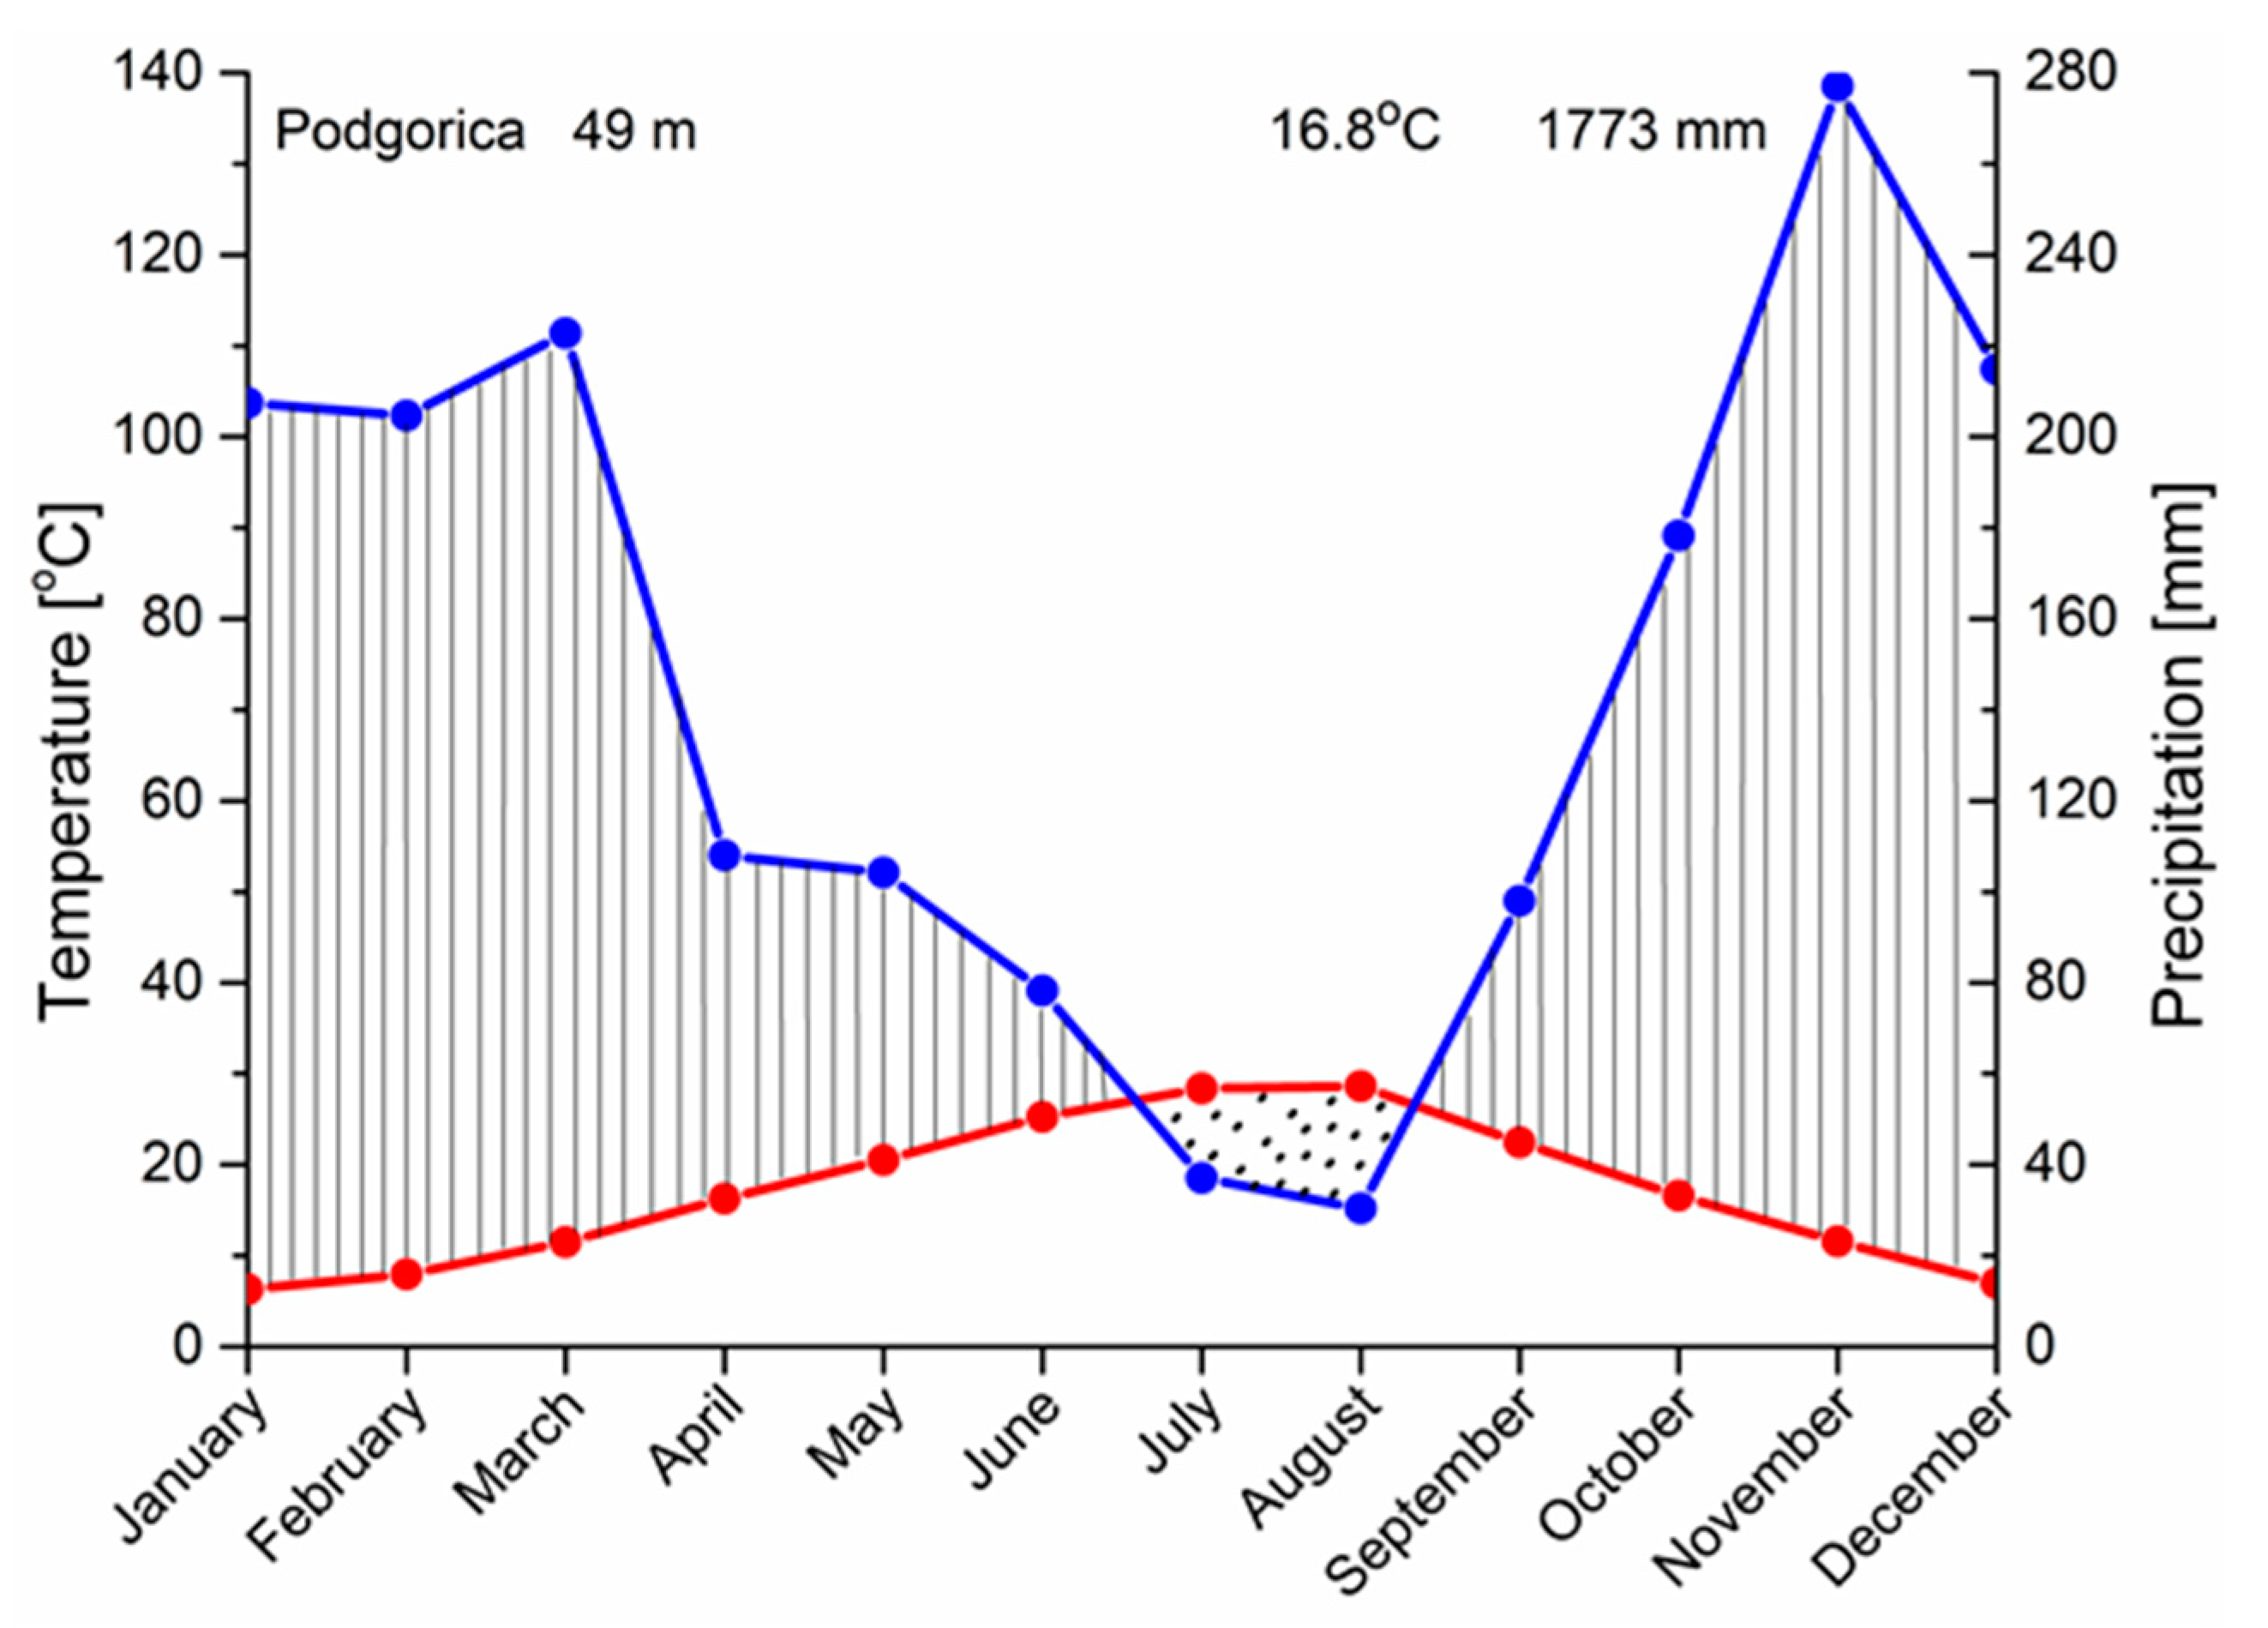
According to the Institute of Hydrometeorology and Seismology of Montenegro’s (IHMS) meteorological data, the mean monthly air temperature during the sampling period (from February 2017 to March 2018) in Podgorica was between 7.3 °C in December and 30 °C in July and August (Figure 3). No data for the town of Danilovgrad were available. The lowest daily air temperature was recorded in December (−3.3 °C) and the highest in July and August (up to 43 °C). The annual average temperature (16.1 °C) was slightly lower than the long-term (2007–2018) average annual temperature (16.8 °C).
During the sampling period, the highest total monthly precipitation in Podgorica occurred in the winter, reaching up to 460 mm (Figure 3). Extreme rainfall events occurred in November 2017 (13 November, 114.5 mm; 30 November, 75.3 mm) and on 3 February 2018 (88 mm), which caused increased turbidity of the water in both the springs and the river. The situation was similar in the town of Danilovgrad. The lowest amount of precipitation occurred in summer (June, July, and August; Figure 3). The total annual precipitation during the sampling period in the study area was 2153 mm for Danilovgrad and 1905 mm for Podgorica.
For comparison, recorded data of mean annual precipitation across a long-term period (2007–2017) in the study area (1773 mm) and data in the study period (1905 mm) showed no significant changes (Supplementary Materials, Figure S1).
2.2. Sampling Locations
Precipitation was collected in rain gauge HDPE (high-density polyethylene) collectors as cumulative monthly samples, positioned at two locations: P1 (near the Zeta River) and P2 (between the capped Mareza springs). Both sites are very close to the hydrometeorological monitoring stations of Danilovgrad (P1) and Podgorica (P2) managed by the IHMS (Table 1 and Figure 1).
Water samples for chemical and isotope analyses were taken at two locations from the Zeta River (upstream, RU; downstream, RD; Figure 1) and from four springs of the Mareza aquifer, of which three are capped (S1, S2, and S3) and one is an open spring (S4). Sampling point RD is located approximately 20 km downstream from RU.
2.3. Sampling
During the one-year sampling period, 74 spring water samples, 37 river water samples, and 21 samples of precipitation were collected and analyzed.
Precipitation was collected in 5-L HDPE collectors. To prevent evaporation, even under very hot summer conditions, a layer of paraffin oil was added [37]. Before sample bottles were filled, the paraffin oil was removed completely using a glass separation funnel. Untreated precipitation samples, for determination of a stable isotope composition of hydrogen and oxygen, were stored in 50-mL HDPE bottles with double caps.
For chemical analysis, water samples were collected in dark glass bottles, triple rinsed with sample water prior to filling. For trace metal analysis, samples were stored in 50-mL HDPE bottles and acidified with suprapure HNO3 to pH < 2.
2.4. Methods
2.4.1. Analyses
pH, electrical conductivity (EC), and water and air temperature were measured in situ in all spring and surface water samples. All chemical analyses were conducted in an accredited testing laboratory (under ISO 17025, International standard for testing and calibration laboratories) in the Company “Water supply and sewerage” in Podgorica. The coefficient of variation of hardness (CV), expressed in percent (%), is typically used to classify flow regimes in karst terrain [38]. Three flow types occur in a karst system: conduit, fissure, and diffuse flow (an equivalent to base flow) [39]. The coefficient of variation of hardness (CV) can be calculated by the following equation [40]:
where Ca2+ and Mg2+ concentrations are in milligrams per liter (mg/L), the quantity in parentheses is the total hardness expressed as milligrams per liter CaCO3, is the mean, and σ is the standard deviation of hardness.
The hardness of water is the concentration of ions in the water that will react with a sodium soap to precipitate an insoluble residue [41].
Stable isotope analyses of water were determined at the Department of Environmental Sciences of the Jožef Stefan Institute in Ljubljana (Slovenia) using the Finnigan MAT Delta plus isotope ratio mass spectrometer. Results are reported in the conventional delta (δ) notation (δ2H and δ18O), i.e., the relative deviation of the heavy-to-light isotope ratio of the sample from that of the standard (VSMOW) expressed in per mil (‰). In-house working standards calibrated vs. VSMOW2 and SLAP2 international reference materials were used to calibrate the measurements. The accuracy was checked using the USGS45- and USGS47-certified reference materials as controls, randomly distributed in each batch. The measurement uncertainty (determined as long-term deviation of control materials from their respective certified δ values) was 0.05‰ for δ18O and 0.7‰ for δ2H.
2.4.2. Calculation of Mean Transit Time (MTT) and Young Water Fraction (Fyw)
The assessment of the groundwater mean transit time (MTT) in the aquifer was based on the sinusoidal fluctuation of monthly stable isotope compositions (δ18O, δ2H) of precipitation and spring water. From the relationship between the amplitudes of the modeled sine wave, the MTT and young water fraction (Fyw) were calculated. The sine wave model has previously been used to fit seasonal variations of δ18O and δ2H in precipitation and spring water [42,43], defined as
where δ is the modeled δ18O or δ2H, δmean is the mean annual measured δ18O or δ2H, A is the modeled annual amplitude of δ18O or δ2H, c is the radial frequency of annual fluctuations (0.017214 rad/day; [42]), t is the time in days after the start of the sampling period, and θ is the phase lag or time of the annual peak of δ18O or δ2H in radians [42,43].
δ = δmean + A(cos(c × t − θ)),
For the purposes of estimating the MTT, the exponential model was applied [42,43], according to which
where As and Ap are the modeled annual amplitudes of δ18O or δ2H of the spring water and of precipitation, respectively [43].
The young water fraction (Fyw) was estimated from the amplitude ratio, as suggested by Kirchner [44]:
3. Results and Discussion
3.1. Physicochemical Parameters
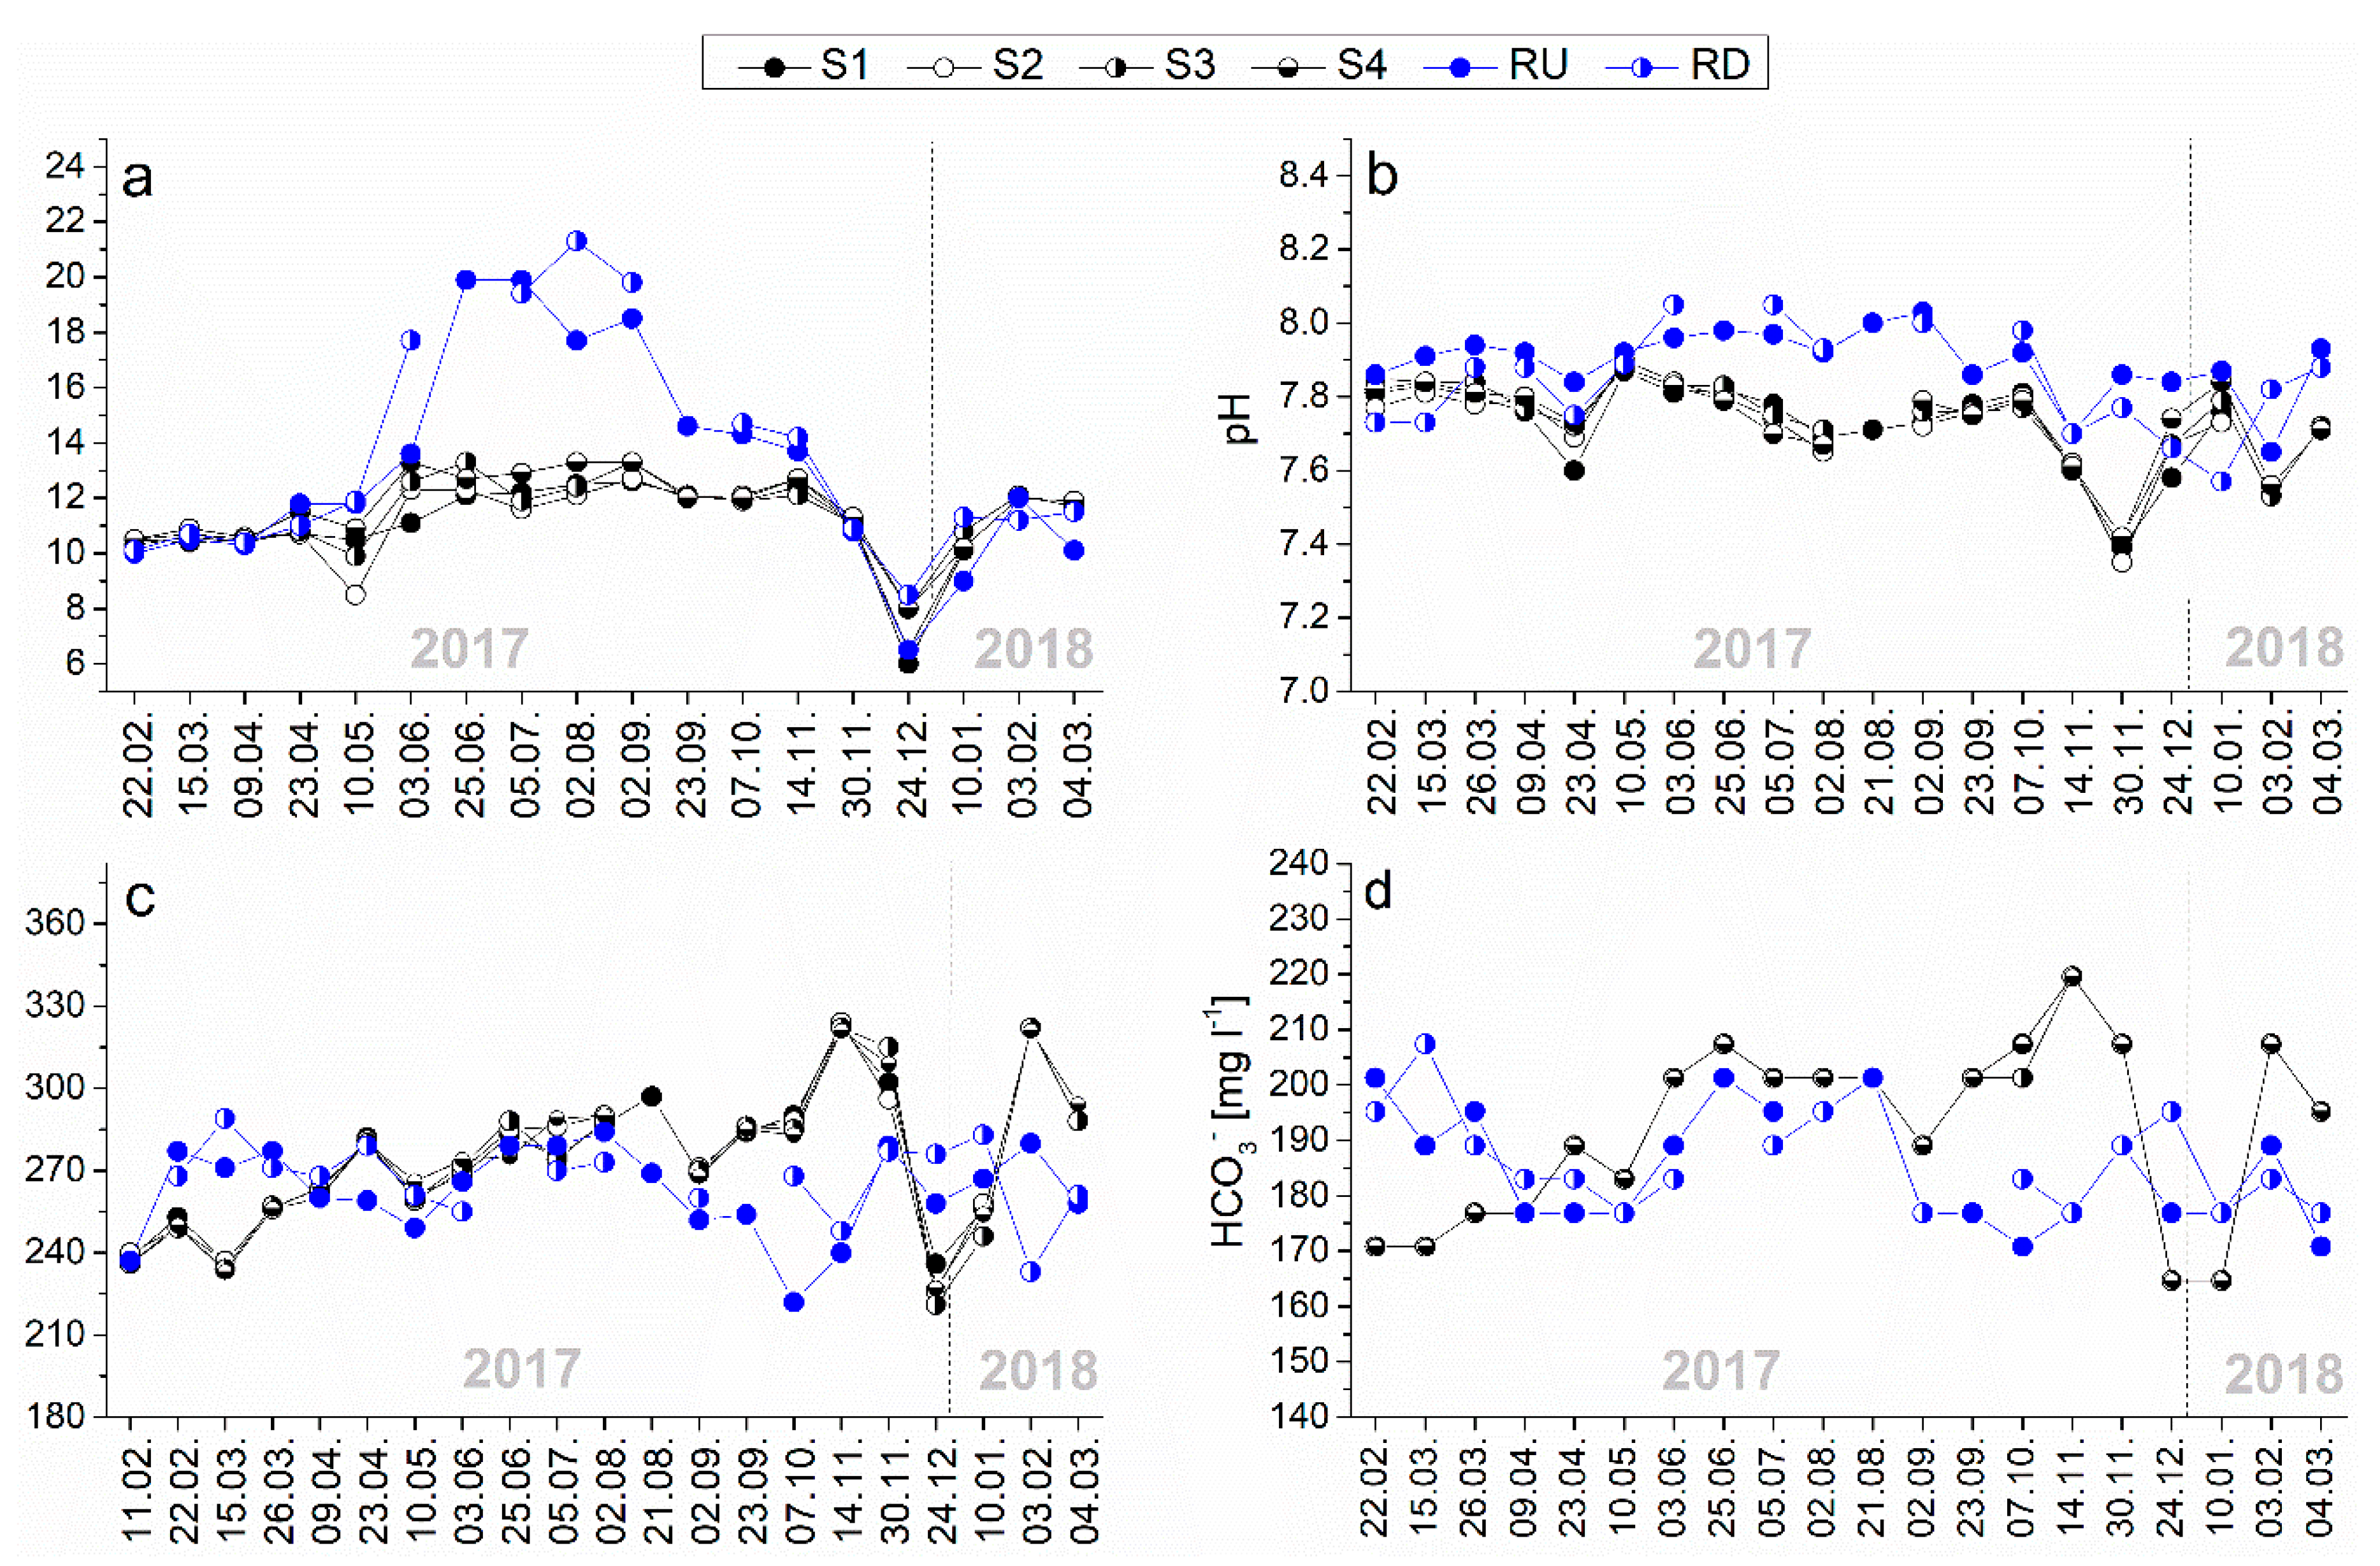
All results of the major physicochemical properties of the spring water (S1, S2, S3, and S4) and the Zeta River (RU and RD), during the research period, are summarized in Table S1 (Supplementary Materials), while the average, minimum, maximum, and median values are presented in Table S2 (Supplementary Materials). In general, all four sampled springs showed very similar temporal profiles of temperature, pH, EC, and HCO3− contents; also, the river water showed no significant difference regarding the measured parameters between the upstream and the downstream sampling sites (Figure 4).
The water temperature at all four springs was relatively uniform, with a mean value of 11.3 °C and annual variation between 6 and 13.3 °C, which is much lower than the local mean annual air temperature (around 16 °C). These results indicate a distant water infiltration area with lower mean annual air temperature and higher altitude [45]. The temperature of the river and the springs was very similar in the colder part of the year (November–May), with an average value of 10.8 °C. In the warmer period (June–October), the temperature of the Zeta River reached up to 21.3 °C (mean temperature of 17.8 °C), which is much higher than in the springs (mean temperature of 12.4 °C) (Figure 4a).
The pH value of the springs and the river showed little seasonal variation, ranging from 7.35 to 7.96 for the springs and 7.57 to 8.05 for the river. A significant difference in pH between the spring and river water (ranging from 0.2 to 0.4 units) was observed in the summer months when the river water temperature increased (June–September; Figure 4b). The increased pH value of the Zeta River in the warm period of the year may be due to a low water level, CO2 degassing (see the discussion on pCO2 below), and higher photosynthetic activity [46].
The temporal EC profiles (Figure 4c) of the spring and river water showed more variability than the other parameters. The variations of EC can help in estimating the relative residence time of the circulating water [47], and therefore, the response of the springs to rainstorms. During the dry season, similar trends of the EC in the river and the springs existed, while in the autumn and winter period, larger differences were recorded. In the periods of heavy rainfall, which caused turbidity of the spring water, the EC increased by approximately 20% (November 2017 and February 2018). This can be explained by the increased discharge of carbonate-rich groundwater masses from the aquifer. At the same time, the heavy rainfalls that caused turbidity of the Zeta River decreased its EC because of dilution with precipitation and surface runoff. In the rest of the winter period, the EC of the spring water was lower than that of the surface water (February, March, and December 2017, Figure 4c). The EC of the surface and spring water was evidently different during almost the entire research period, which indicates that the Mareza springs receive very little or no surface water from the Zeta River.
The coefficient of variation of hardness (CV) values for the Mareza spring water was 10% (calculated by using Equation (1)). According to the authors of [48], CV conduit flow-type springs varied by 10%–25%, while diffusive flow springs had a relative constant hardness and CV values below 5% (<5%). A conduit flow system is characterized by quick recharge and sensitive reaction after intense precipitation events, while a diffuse flow karst system is characterized by small variation of physiochemical parameters. The CV value of the Mareza spring (10%) is at the low end for a conduit flow system, indicating that the conduit system is influenced strongly by fractures that feed it or by diffuse recharge [40].
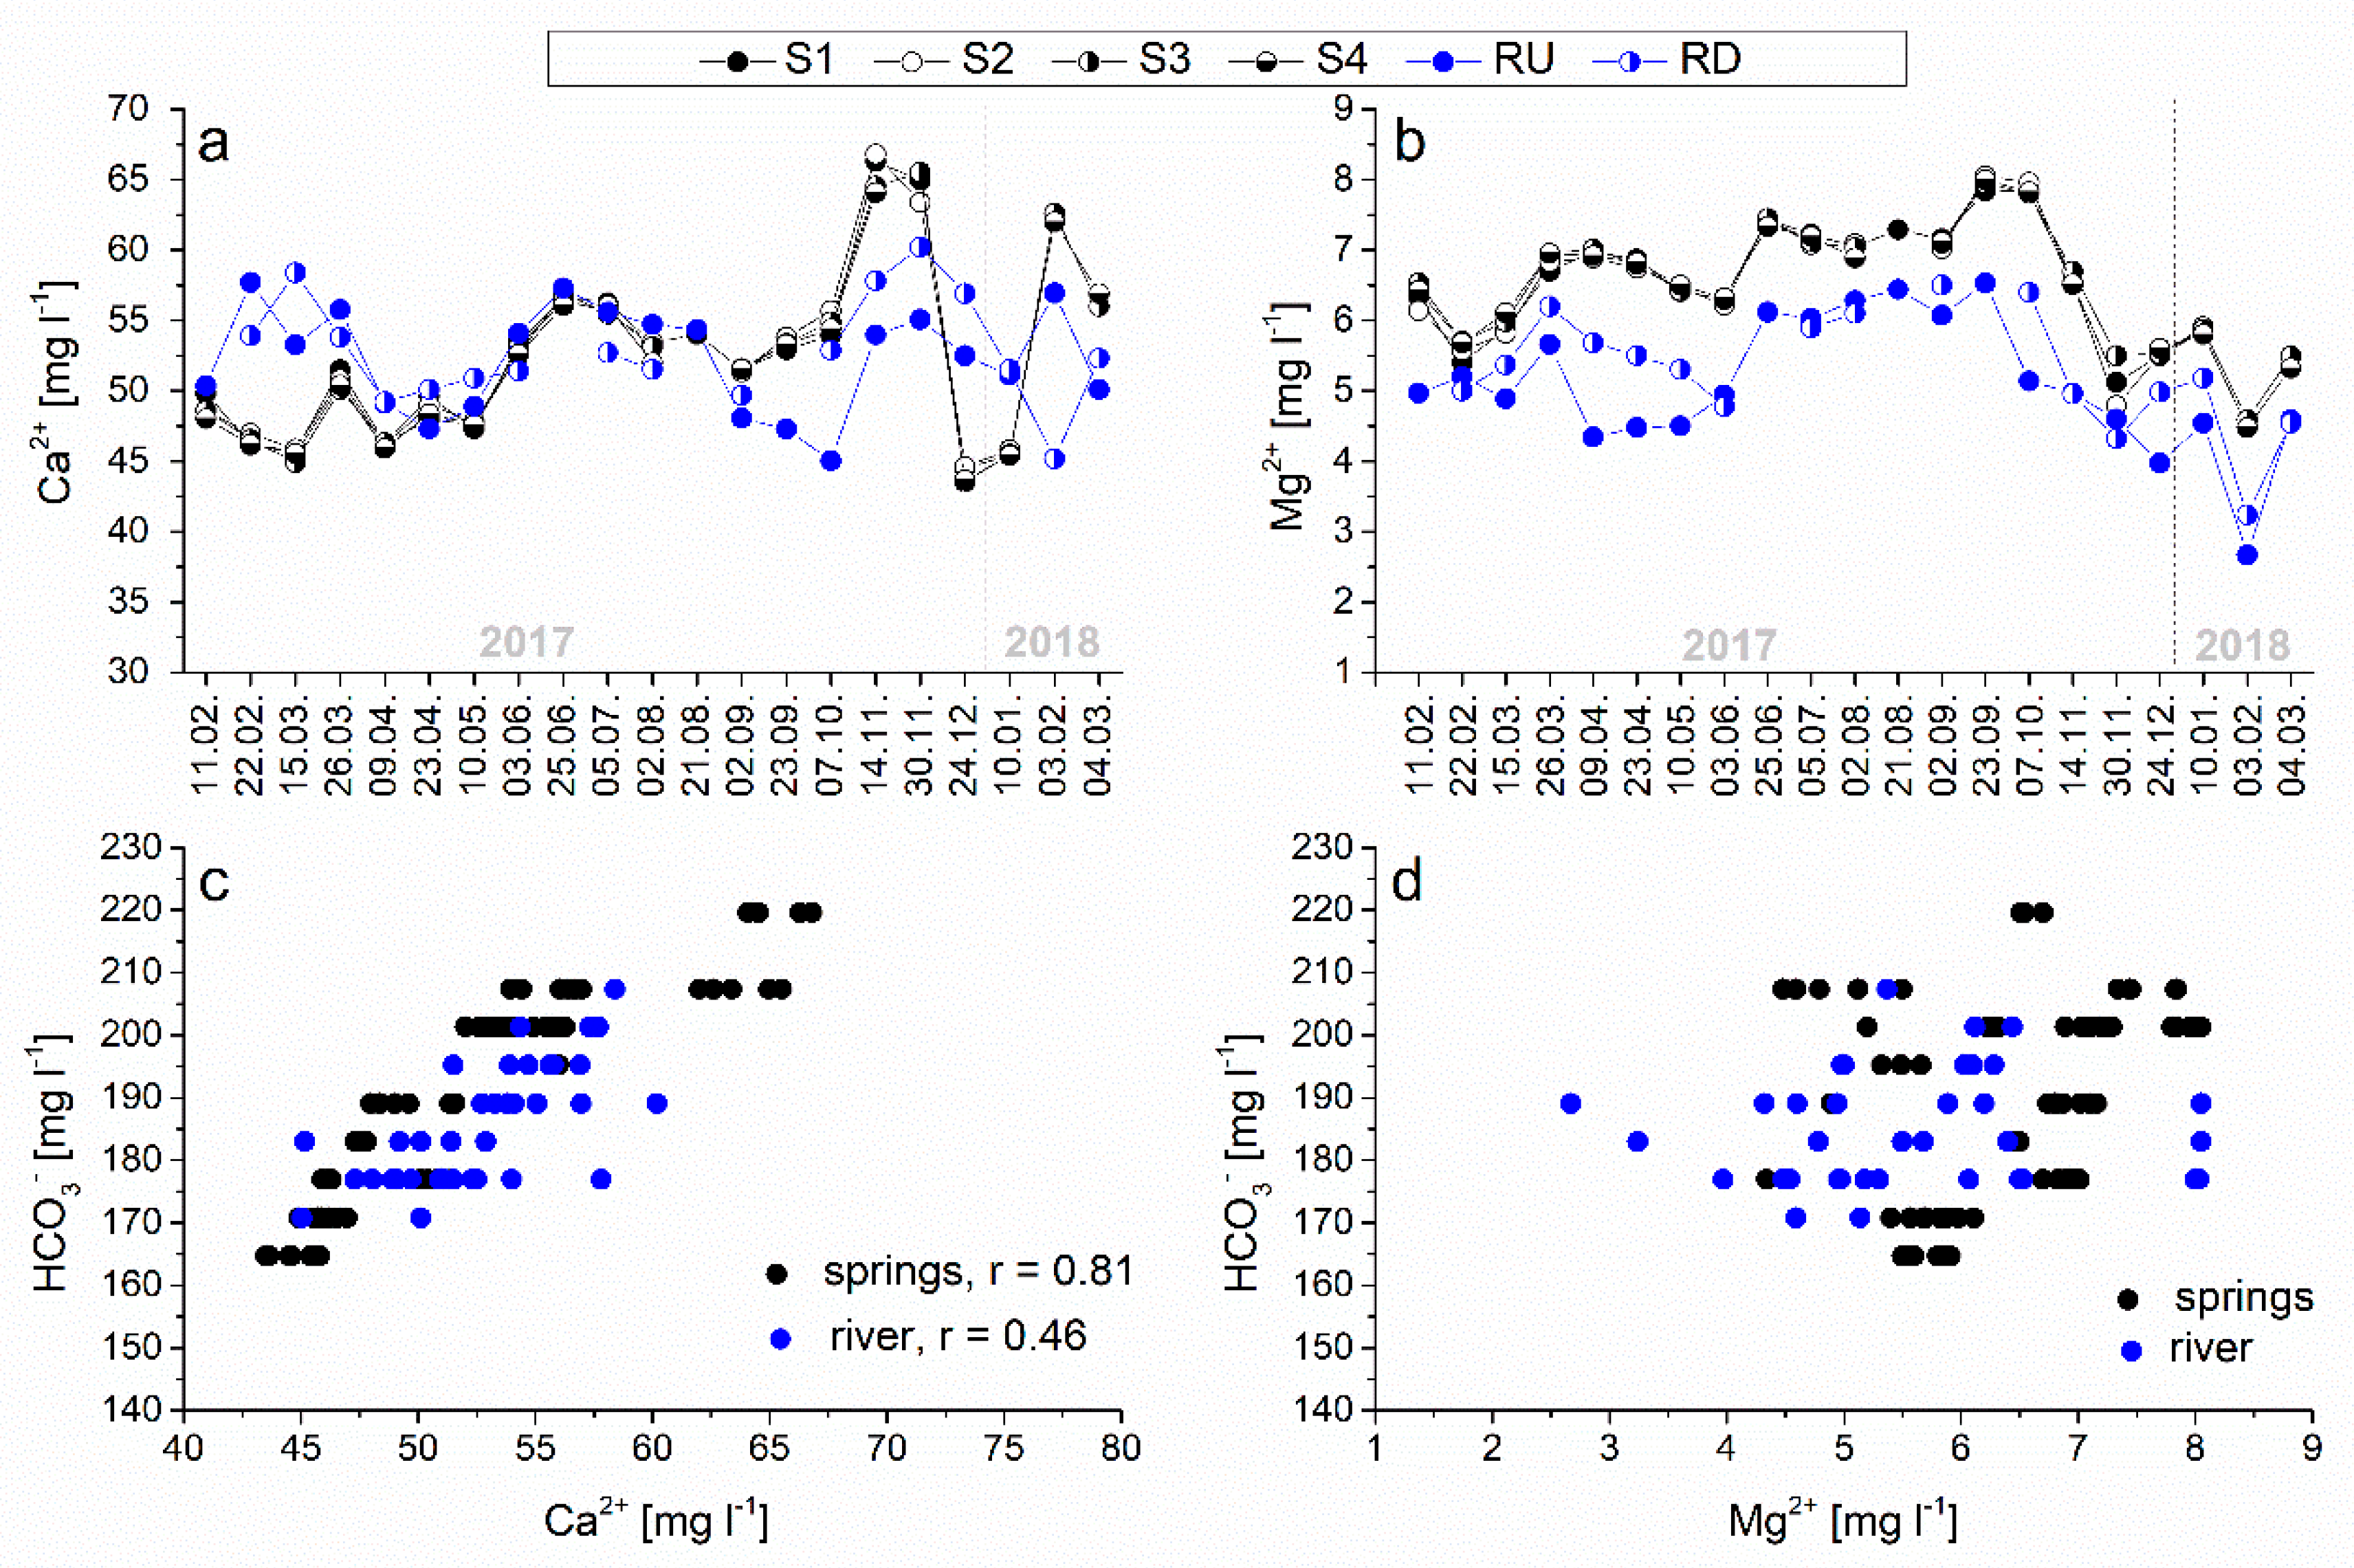
The content of the dominant anion (HCO3−) in all samples of the Zeta River varied within a narrow range of 188–207 milligrams per liter, and in the spring water from 165 to 219 milligrams per liter (Table S2 and Figure 4d). A good positive correlation was found between bicarbonate and calcium ions of the spring water and the Zeta River water (r = 0.81) (Figure 5c), while no correlation was found between Mg2+ and bicarbonate. This indicates that the varying Ca2+ mainly originates from the dissolution of calcite.
In the study period, the Ca2+ between the sampling points along the Zeta River (RU and RD) differed by 0.1–11.79 milligrams per liter, with the maximum difference recorded in February 2018 (Figure 5a). The concentrations of Ca2+ and HCO3− fluctuated seasonally—in particular, in the period of heavy rainfall. Also, Ca2+ fluctuations were much greater than Mg2+ fluctuations. The concentration of potassium (K), in the greatest number of samples, was below the limit of detection (LoD; <0.5 milligrams per liter).
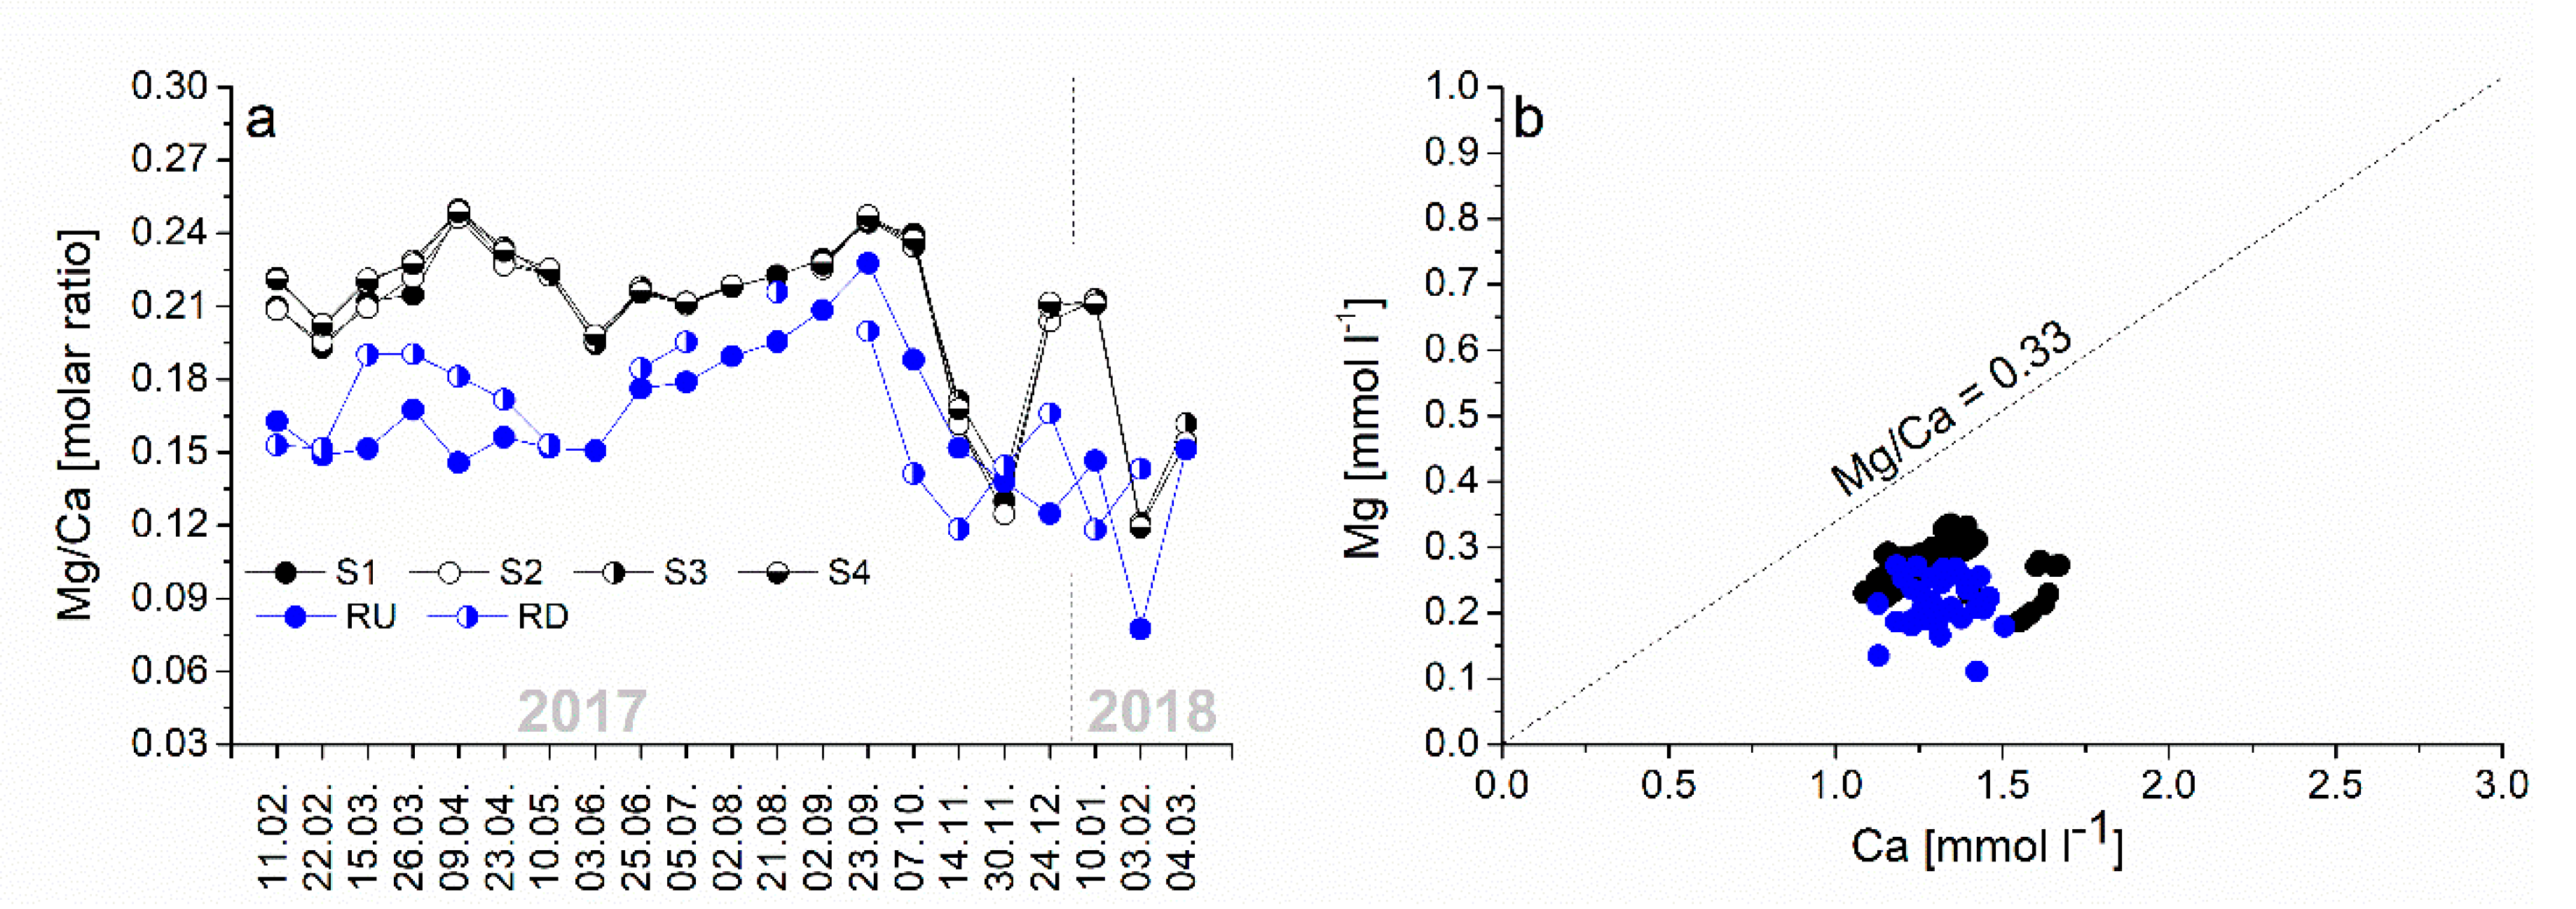
A useful parameter for better understanding the nature of the carbonate aquifer is the water–rock interaction through which the water circulated is a molar ratio of Mg/Ca (Figure 6), which depends on the proportion of calcite and dolomite present in the aquifer rock [39]. According to some authors, this parameter can be used as a qualitative indicator of the residence time of the water in the aquifer [49,50,51,52].
According to [39], the Mg/Ca molar ratio is 1 in water that dissolves pure dolomite, and 0 for water that dissolves pure calcite. The dissolution of calcite and dolomite in a 1:1 ratio results in an Mg/Ca ratio of water of 0.33. Here, all of the collected springs and surface water samples were below the line of 0.33 (Figure 6b), which suggests that limestone dissolution prevails over dolomite dissolution.
In spring samples collected in the period of heavy precipitation (14.11., 30.11., and 3.02.), we recorded a decrease of the Mg/Ca ratio (Figure 6a). At the same time, the spring water showed turbidity as a response of the karst spring to precipitation after an antecedent dry period. That turbidity events can explain the gradual increase in water level in the deep subterranean channels when, after the first heavy rain events, the hydraulic head within the karst system was high enough to mobilize the deep and long residence time water toward the surface as spring water. Considering the geological composition, the water turbidity was caused by the outwash of clay which occurs in cracks or pockets in karstified carbonate rocks [35].
The Mg/Ca time series of the Zeta River water was parallel to that of the Mareza springs, but consistently slightly lower (Figure 6a). The differences in the Mg/Ca ratios of the river water between the two sampling sites could be attributed to the discharge of small tributaries and the diffuse recharge downstream of the RU site. Most of the tributaries only flow seasonally, in the autumn and winter period, which is what caused the higher variability of the Mg/Ca ratio at the downstream site (RD) in the wetter period of the year. The fact that the Zeta River discharge at RD is almost double compared with that of the RU site supports this interpretation.
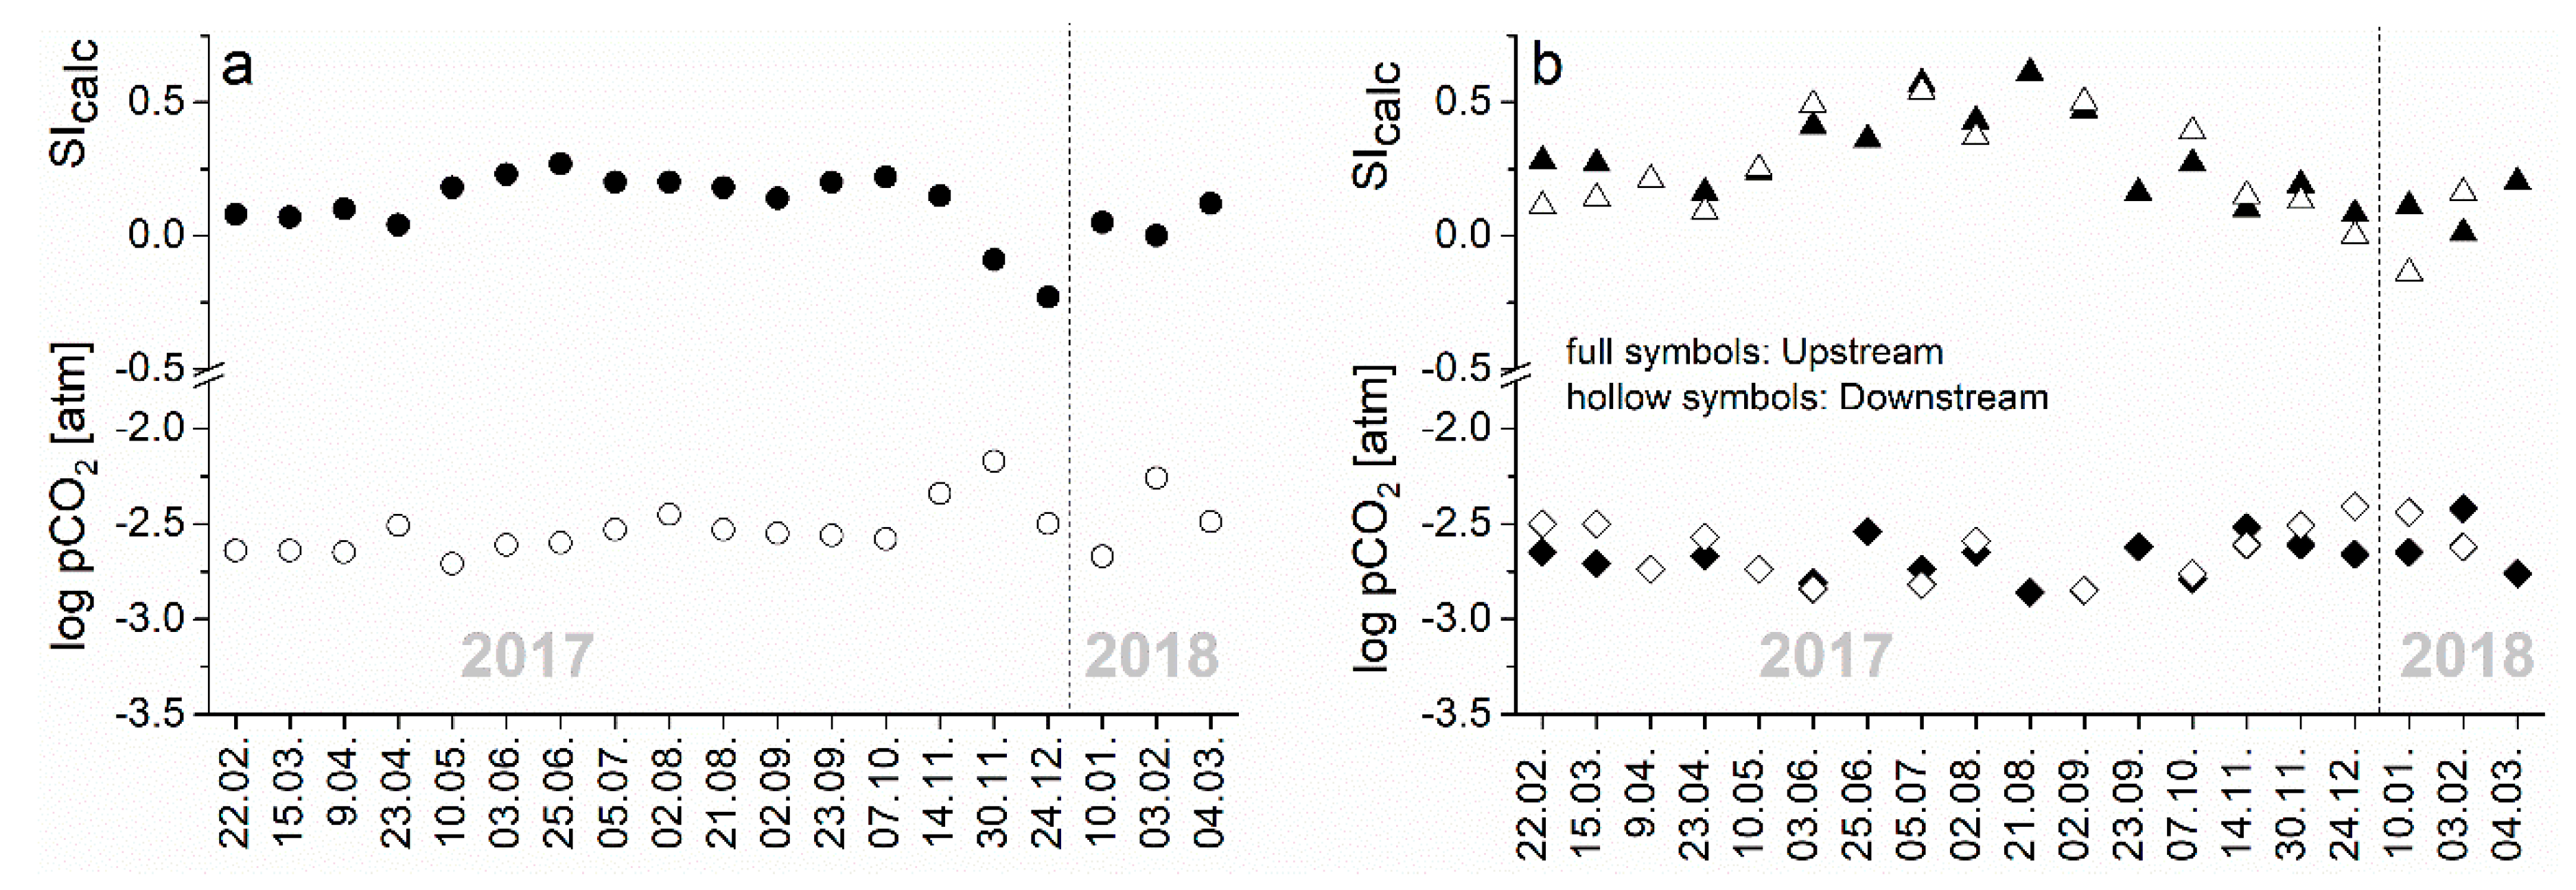
The calcite saturation index (SIc) and pCO2 were determined using the computer program PHREEQC (version 3), developed by the United States Geological Survey (USGS) [53] which is part of the United States Government. The saturation index (SI) is defined as the log of the ratio between the ion activity product (IAP) of calcite in the water sample and that at equilibrium [54], and indicates the ability of water to precipitate (for supersaturated water with SIc > 0) or dissolve (for undersaturated water with SIc < 0) calcite [55].
During the research period, the SIc of the spring water shows variation from −0.23 to 0.27. In the period of a high amount of precipitation (November and December 2017, and February 2018) and a higher discharge of the springs, the water was undersaturated with respect to calcite (Sic < 0). The exception was the sample collected during the first heavy rain event (14 November 2017), which was supersaturated (SIc = 0.15). Then, probably, infiltrated rainwater mobilized the deeper groundwaters to discharge at springs. This water was warmer and its EC was higher (Figure 4). Small positive values of SIc (0.04–0.07), which indicate near-equilibrium conditions [56], were recorded in February, March, and April 2017 and January 2018. In the rest of the research period, the water was oversaturated with respect to calcite (SI = 0.12–0.27), with the highest SI value in June 2017.
The partial pressure of carbon dioxide in spring water fluctuated from 10−2.67 to 10−2.17 atm (atmosphere), (average, 10−2.5; Figure 7a), while in the Zeta River water, it ranged from 10−2.8 to 10−2.4 atm (average, 10−2.6; Figure 7b). All of these values are higher than the atmospheric partial pressure of CO2 (10−3.4 at 400 ppmv CO2) and indicate degassing of CO2 from both spring and river water throughout the year [54]. The estimated values for the Mareza springs were similar to or slightly below those considered normal in the groundwater of carbonate aquifers: 10−2.5 atm [57]. The exceptions were the samples collected in November (30.11.), with the highest (maximum) value (10−2.17 atm).
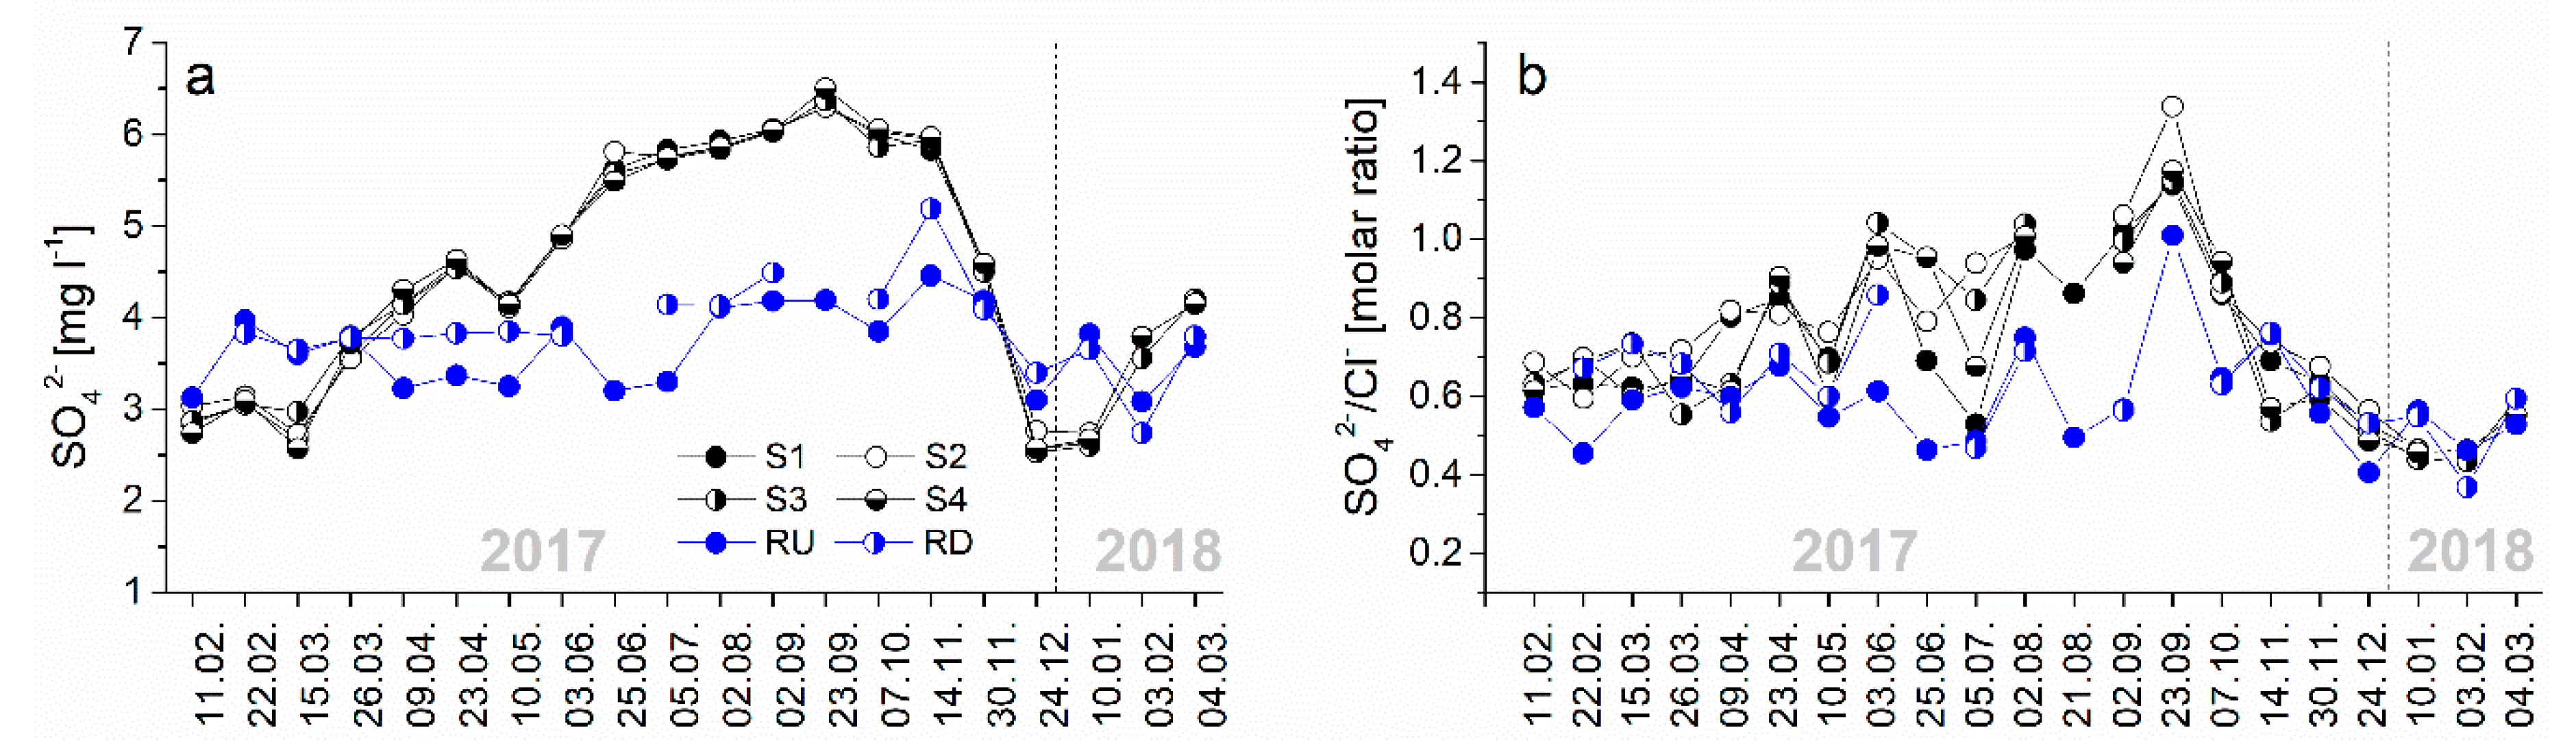
The sulphate concentration in the river water was low and showed little seasonal variation (2.74–5.19 mg/L), in contrast to the spring water, where sulphate content increased during the warmer and drier part of the year (Table S2 and Figure 8a). The molar ratio of SO4/Cl vs. time (Figure 8b) showed a trend similar to sulphate concentration—the values were higher in spring water in the period with low precipitation and higher temperature, which supports the assumption of a geogenic rather than a meteoric source of sulphate.
In conclusion, the chemical composition of spring and surface water does not change much during the year, but nevertheless, some parameters show conspicuous patterns (e.g., electrical conductivity, calcite saturation indices). The most significant differences were noticed in the period of heavy rainfall, reflected in all major chemical parameters. Furthermore, all water samples showed the same water facies (calcium–hydrogen carbonate), low alkaline water, classified as low mineralization waters with low and insignificantly changing concentrations of chloride, sodium, and potassium during the research period. The biggest temporal variation was observed in the EC values closely related to the concentration of major ions (Ca2+ and HCO3−), recorded in periods of heavy rainfall. During the research period, all of the springs (S1, S2, S3, and S4) showed the same chemical characteristics, while the surface water samples (RU, RD) showed increasing major ion contents downstream. According to chemical parameters, the main recharge area of the Mareza springs is located at a higher altitude (considering the constantly low temperature of the springs), with only a minor or negligible contribution from the surface water (Zeta River).
3.2. Isotope Composition of Oxygen and Hydrogen
For better understanding of the functioning of karst aquifers, the stable isotopes of water, oxygen, and hydrogen are most commonly used as tracers of water source, flow, and mixing, while the hydrochemical parameters provide information on the interactions of water with bedrock (e.g., dissolution and precipitation of minerals during infiltration and groundwater flow, and dilution with surface discharge). This combination of the stable isotopes of hydrogen and oxygen is also useful tools for determining residence time [42,58].
3.2.1. Isotopic Composition of Precipitation
At stations P1 and P2, 11 and te10n monthly precipitation samples were collected, respectively. Because of the dry weather, no samples were obtained at any of the sampling sites in October 2017, while in June 2017, enough samples could be retrieved only at station P2. No snowfall was recorded in the sampling area during the observation period, so all samples represented rainwater. The results of the δ2H and δ18O analyses are shown in Table S3.
Because of the very strong correlation between δ18O and δ2H values (r2 = 0.93), further discussion on time series of stable isotopes will be based only on δ18O values.
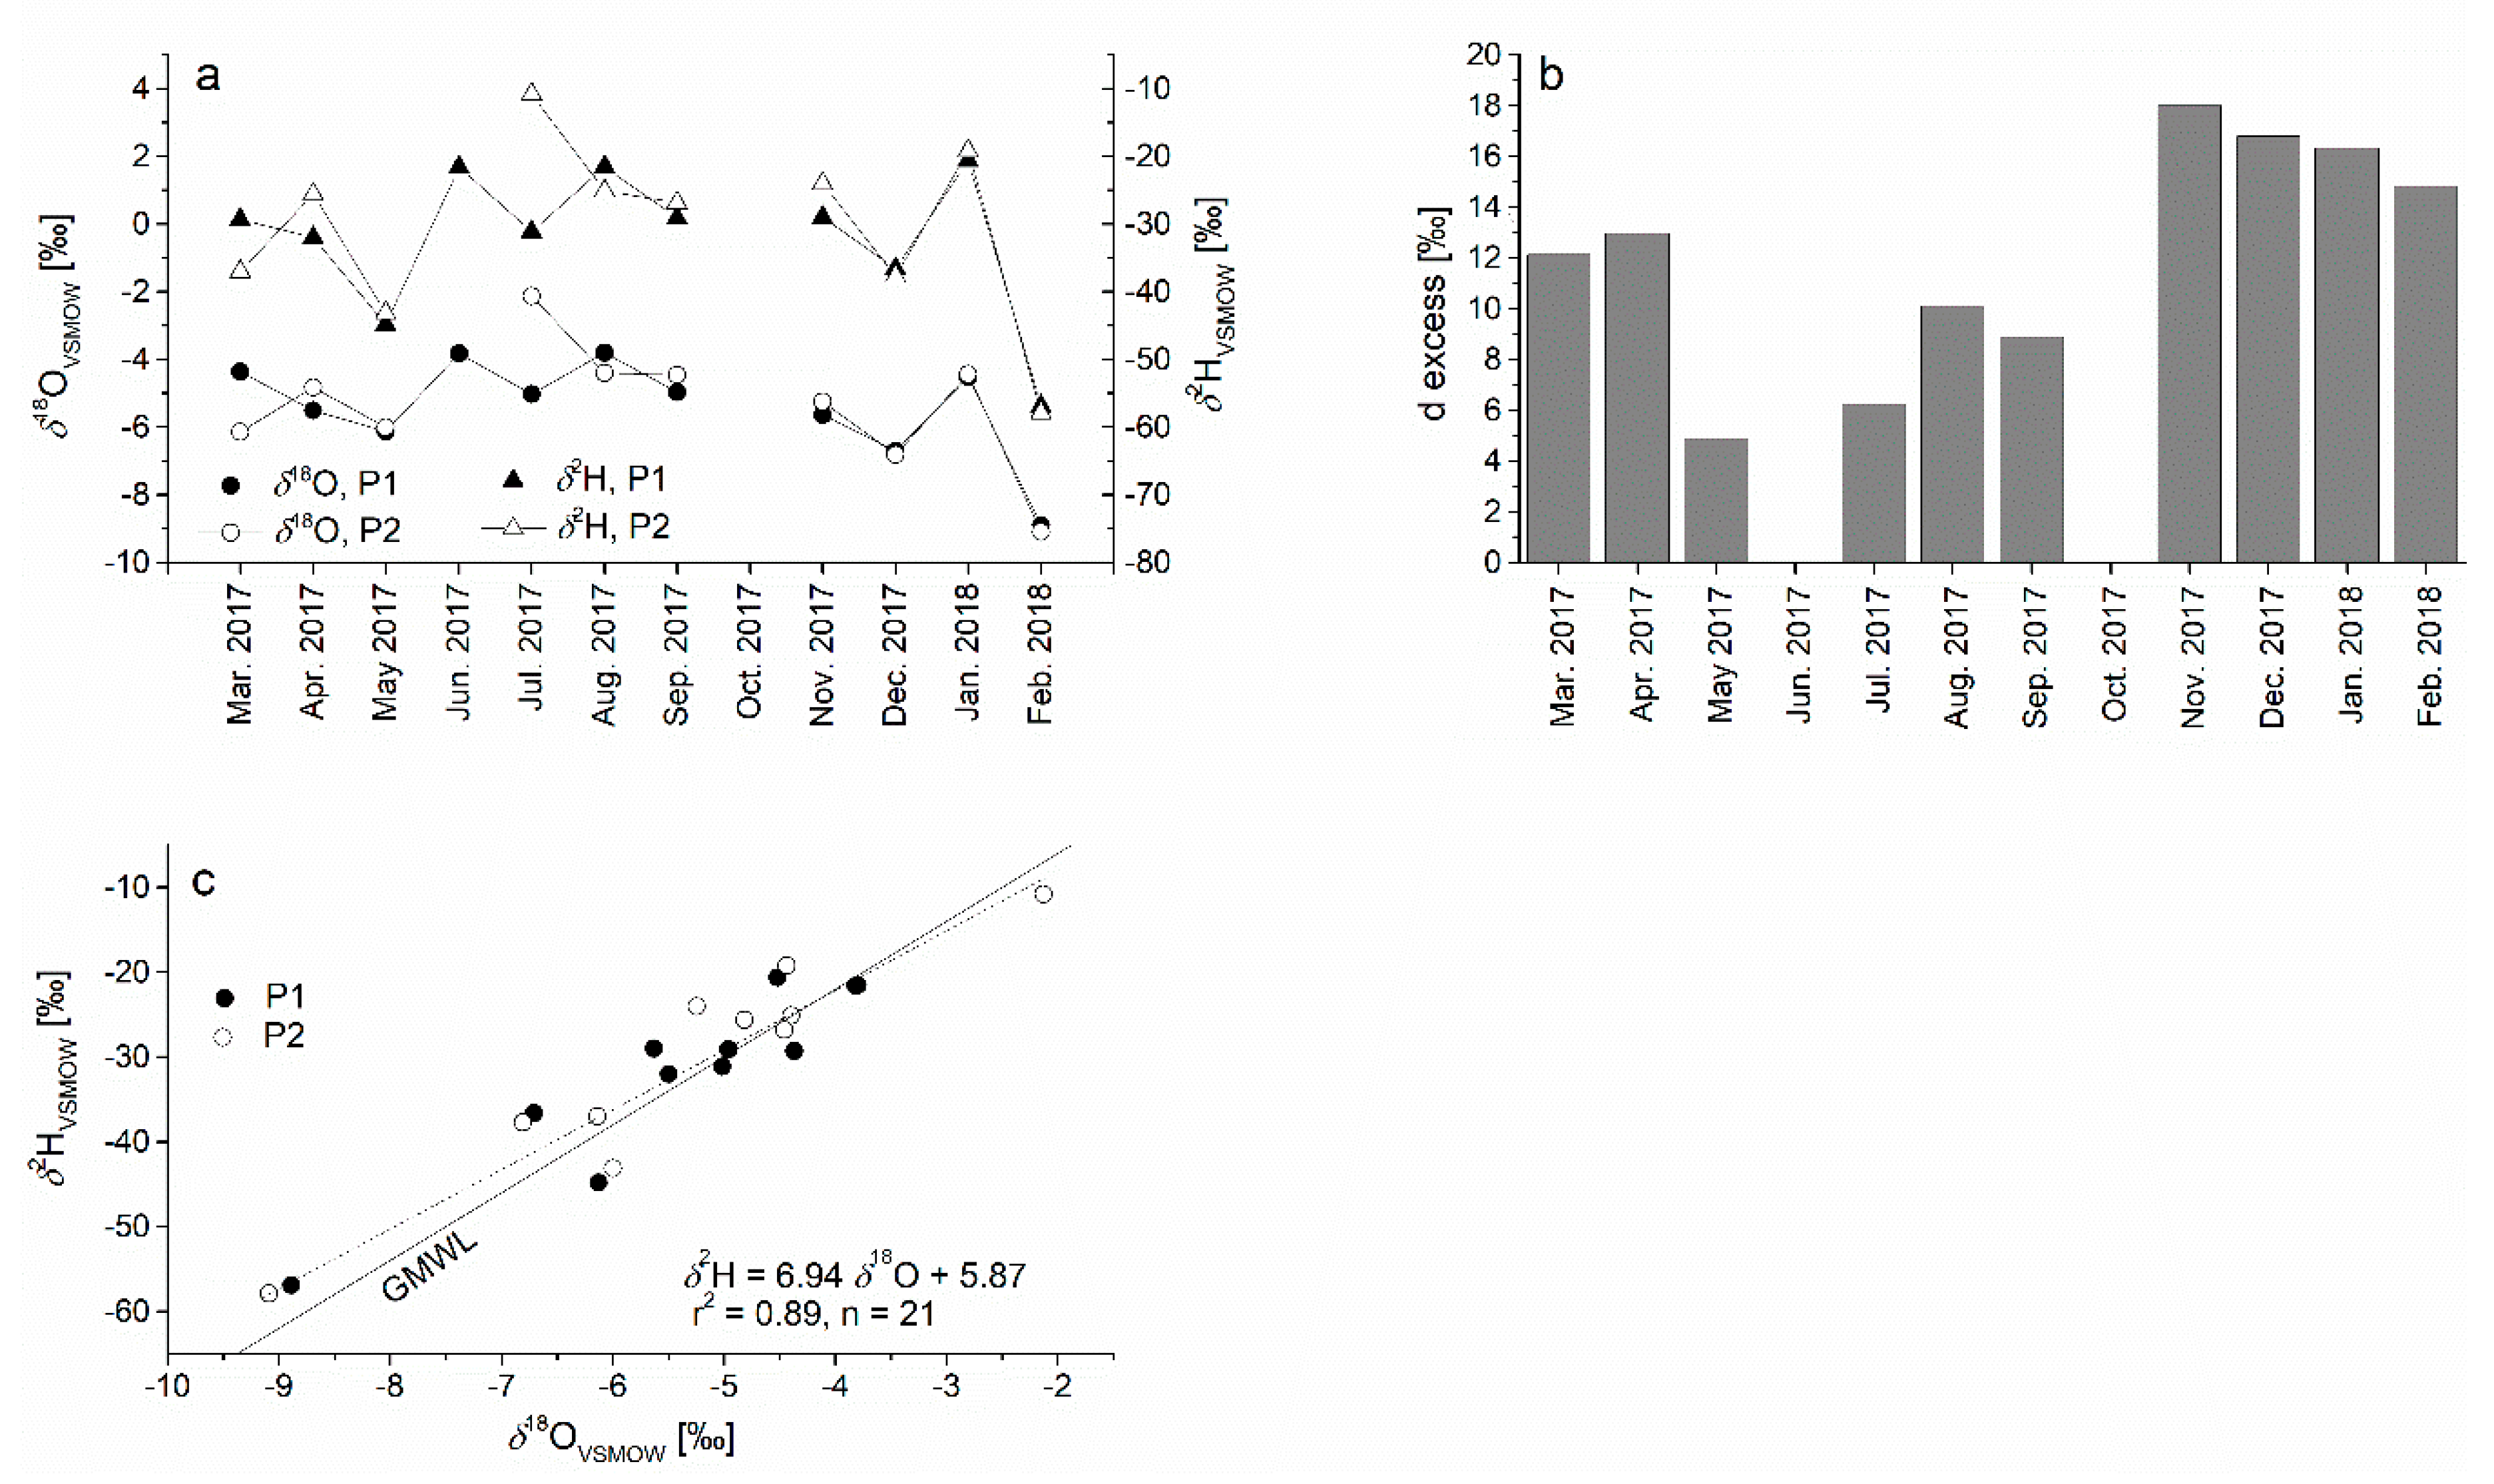
The correlation between δ2H and δ18O in atmospheric precipitation, commonly called Global Meteoric Water Line (GMWL), is defined as: δ2H = 8δ18O + 10‰ [59], and the deuterium excess (d excess) parameter is defined as: d = δ2H − 8δ18O [33,60,61]. A deuterium excess value of 10‰ in the GMWL is based on global atmospheric water vapor that forms at a relative humidity of approximately 85%, producing a precipitation line that shifts from the seawater line by 10‰ [62]. Depending on the region, differences in the amount of precipitation, temperature variations, distinct air mass sources, evaporation, and fractionation processes occurring below the cloud base are characteristic at a local scale, which causes the relationship between the stable isotopes of water δ2H and δ18O to deviate from that of the GMWL [18]. The Local Meteoric Water Lines (LMWL) for particular regions can deviate from the GMWL, both regarding the slope and the d excess, depending upon the isotopic characteristics of precipitation at the local scale [61,62,63].
The calculated annual weighted average δ18O value of precipitation for the investigated period at station P2 was −5.9‰. The δ18O and δ2H values of precipitation show seasonal variations typical for continental stations in the Northern hemisphere, with more negative values in winter and considerably fewer negative values in summer [64] (−9.09‰ in February 2018 and −2.13‰ in July 2017; Figure 9). The isotopic compositions of O and H in precipitation in the study area are presented in Table S3 (Supplementary Materials). The most negative values at the station P2 were measured when the temperature was the lowest (average value of 7.4 °C) and the amount of precipitation was very high (total month amount 284 L/m2). Since these were the first analyses of the isotopic composition of precipitation in Montenegro, comparison with previous years was not possible.
Seasonal changes in temperature and amount of precipitation affect the isotopic composition of precipitation, which is reflected in the time series of δ18O in the precipitation collected at station P2 (Figure 9).
An observation period of one year is too short to estimate the Local Meteoric Water Line with reasonable uncertainty. For the purpose of this study, we could only estimate the short-term local meteoric trend line (δ2H = 6.94 δ18O + 5.87; Figure 9c), which may not be representative of long-term precipitation.
The slope and intercept of the trend line were lower than those of the GMWL, which suggests evaporation of the falling rain [65] as a result of the high temperature and the low humidity in the research area, in particular in the summer months.
The deuterium excess is commonly used as an indicator of water vapor source region [66,67], since it is sensitive to the meteorological conditions at the point where the vapor is originally evaporated from the surface, including sea surface temperature and relative humidity [68,69,70,71]. Monthly variations of d in the analyzed period are shown in Table S3 and Figure 9b.
Higher d excess in the autumn–winter period compared to spring–summer is typical of the Northern hemisphere [64]. In the Mediterranean area, precipitation has higher d excess than Atlantic air masses, generally increasing in W–E direction from 14‰ to 22‰ [72]. In the period from May to November 2017, at both measuring stations, the d values were lower than or close to the 10‰ that is typical for Atlantic air masses [73,74], and may be indicative of secondary evaporation processes (e.g., evaporation of falling raindrops) in a warm and dry atmosphere. Đorđević et al. [75] calculated the 96-hour backward trajectories ending at Herceg Novi, a coastal town 60 km West of Podgorica, and estimated that at more than 36% of days with 0.5 mm or more precipitation, the air masses derive from the western direction, originating in the northern Atlantic. This is in line with the findings of Schicker et al. [76], who estimated that in the Eastern Adriatic area, only a minor fraction of precipitation derives from the evaporation of local (Mediterranean) moisture. Therefore, the d excess values of precipitation in the study area typical for Atlantic air masses are not unexpected. In the winter period (November–May), these values range from 12‰ to 18‰, which are attributed to the precipitation originating from the Mediterranean Sea [72,74], with the exception of the results of March and July 2017, with a drastic deviation between two sampling locations (Table S3). This means that the recorded seasonal changes can be explained by the fact that the research area was under the influence of Mediterranean air masses during the winter period, while in the summer period, the research area was under the influence of air masses originating from the Atlantic Ocean.
The nearest station contributing data for long-term International Atomic Energy Agency (IAEA) Global Network of Isotopes in Precipitation (GNIP) is the Dubrovnik station, located 98 km WNW (West-Northwest) flight distance from the study area. The LMWL equation of Dubrovnik (δ2H (‰) = 6.46δ18O + 3.95) [77,78] for the period of September 2000–December 2003 is similar to the observed trend line for the study area (δ2H (‰) = 6.94δ18O + 5.9). However, because of the short observation period, the long-term d excess of precipitation in the investigated area may also considerably differ from the estimated value.
3.2.2. Isotope Composition of the Spring and River Water
All isotopic data of river and spring water samples are shown in Table S4, while the average, minimum, maximum, and median values are reported in Table S5 (Supplementary Materials).
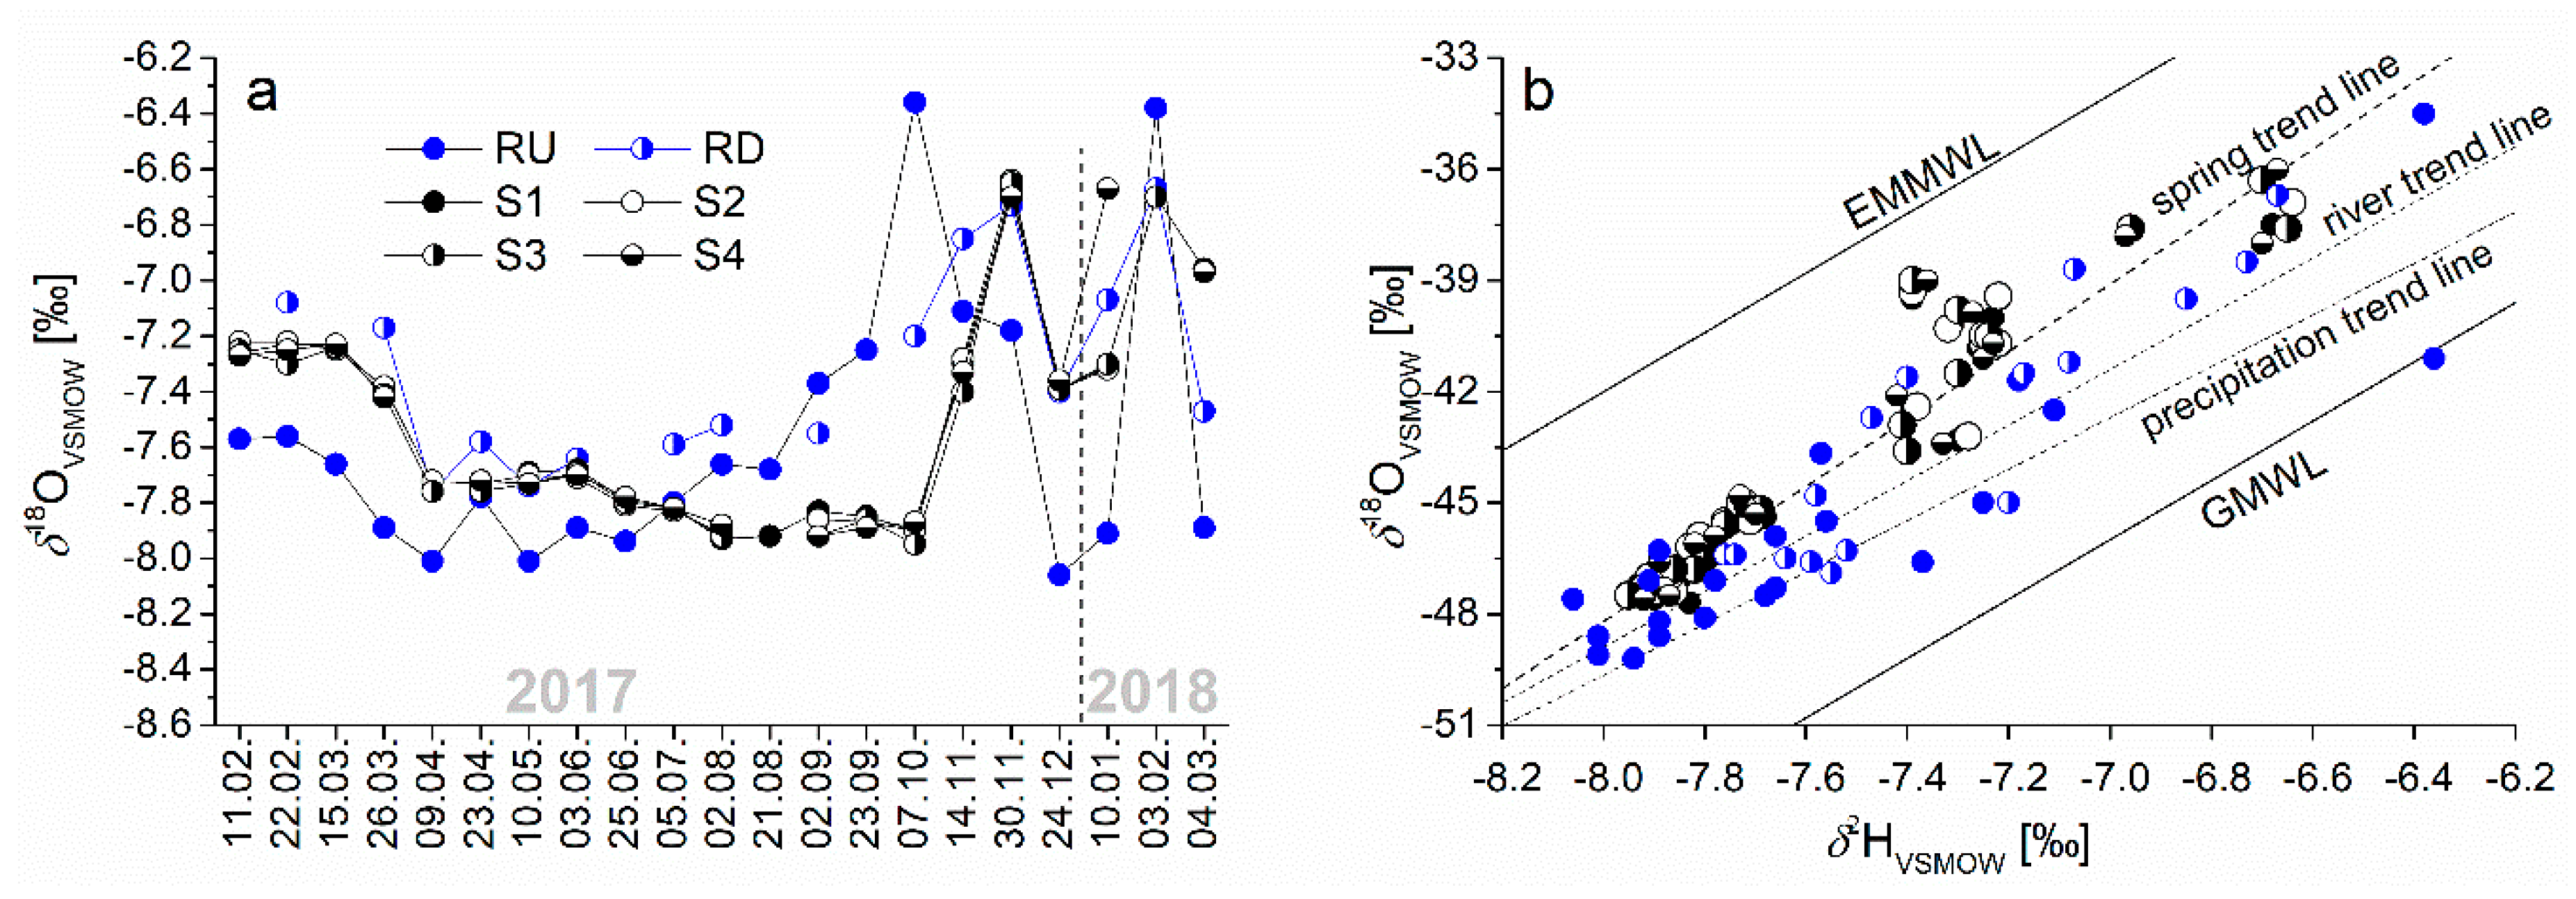
During the study period, the δ18O values of the spring water ranged from −7.95‰ to −6.64‰ (Table S4 and Figure 10), and the δ2H values from −47.7‰ to −36‰ (Table S5); the ranges of values are much smaller than those in precipitation (see Table S3), suggesting good mixing of infiltrated water (precipitation) in the aquifer. All δ18O and δ2H values of the spring water samples plot between the GMWL and the Eastern Mediterranean MWL (EMMWL; [79]). Significantly lower δ values of the spring water compared to the local precipitation (Figure 9) point toward recharging with precipitation with a lower δ value than in the sampled area from a higher altitude. Assuming the altitude effect for the Southern Adriatic being about −0.26‰ per 100 m [77,80], the average altitude of the recharge area should be about 620 m asl. However, for a more reliable determination of the mean catchment altitude, it would be necessary to follow the long-term data of stable isotopes in precipitation and springs, including sampling stations at higher altitudes.
The most negative δ18O values of the spring water (down to −7.93‰) were recorded in the period between August and October 2017 (Figure 10), while the highest δ18O values (up to −6.7‰) were registered during the period with more precipitation (November–March). Meanwhile, the precipitation showed the most negative values in February 2018, while in the rest of the observation period, the δ values were much higher and showed no regular pattern. This indicates that the groundwater is homogenized in the aquifer, but no systematic shift between the isotope signal of spring water and precipitation in the study period could be detected. All spring water samples plot between the local precipitation trend line for the study period and the EEMWL, which leads to the conclusion that the origin of the spring water must be searched between the local precipitation and an area with precipitation closer to the EMMWL.
Figure 10 also shows the variation of the δ18O values of the river water between RU and RD (Table S4). The δ18O values measured at the downstream station (RD) are consistently higher than at the upstream station (RU), which is consistent with evaporation. This assumption is also supported by differences in the slope and intercept at both sampling points (δ2H vs. δ18O trend lines for RU: δ2H = 6.51δ18O + 3.48 and for RD: δ2H = 8.91δ18O + 22.1). The influence of several small ephemeral tributaries discharging to the Zeta River in the wetter part of the year between the RU and RD sites on the δ18O values of the river water cannot be ruled out; however, no isotope data for these streams are available.
3.2.3. Estimated Mean Transit Time (MTT) and Young Water Fraction (Fyw)
The data sets of the monthly δ18O and δ2H values in the precipitation and the spring water were used for the estimation of the MTT and Fyw of the Mareza aquifer.
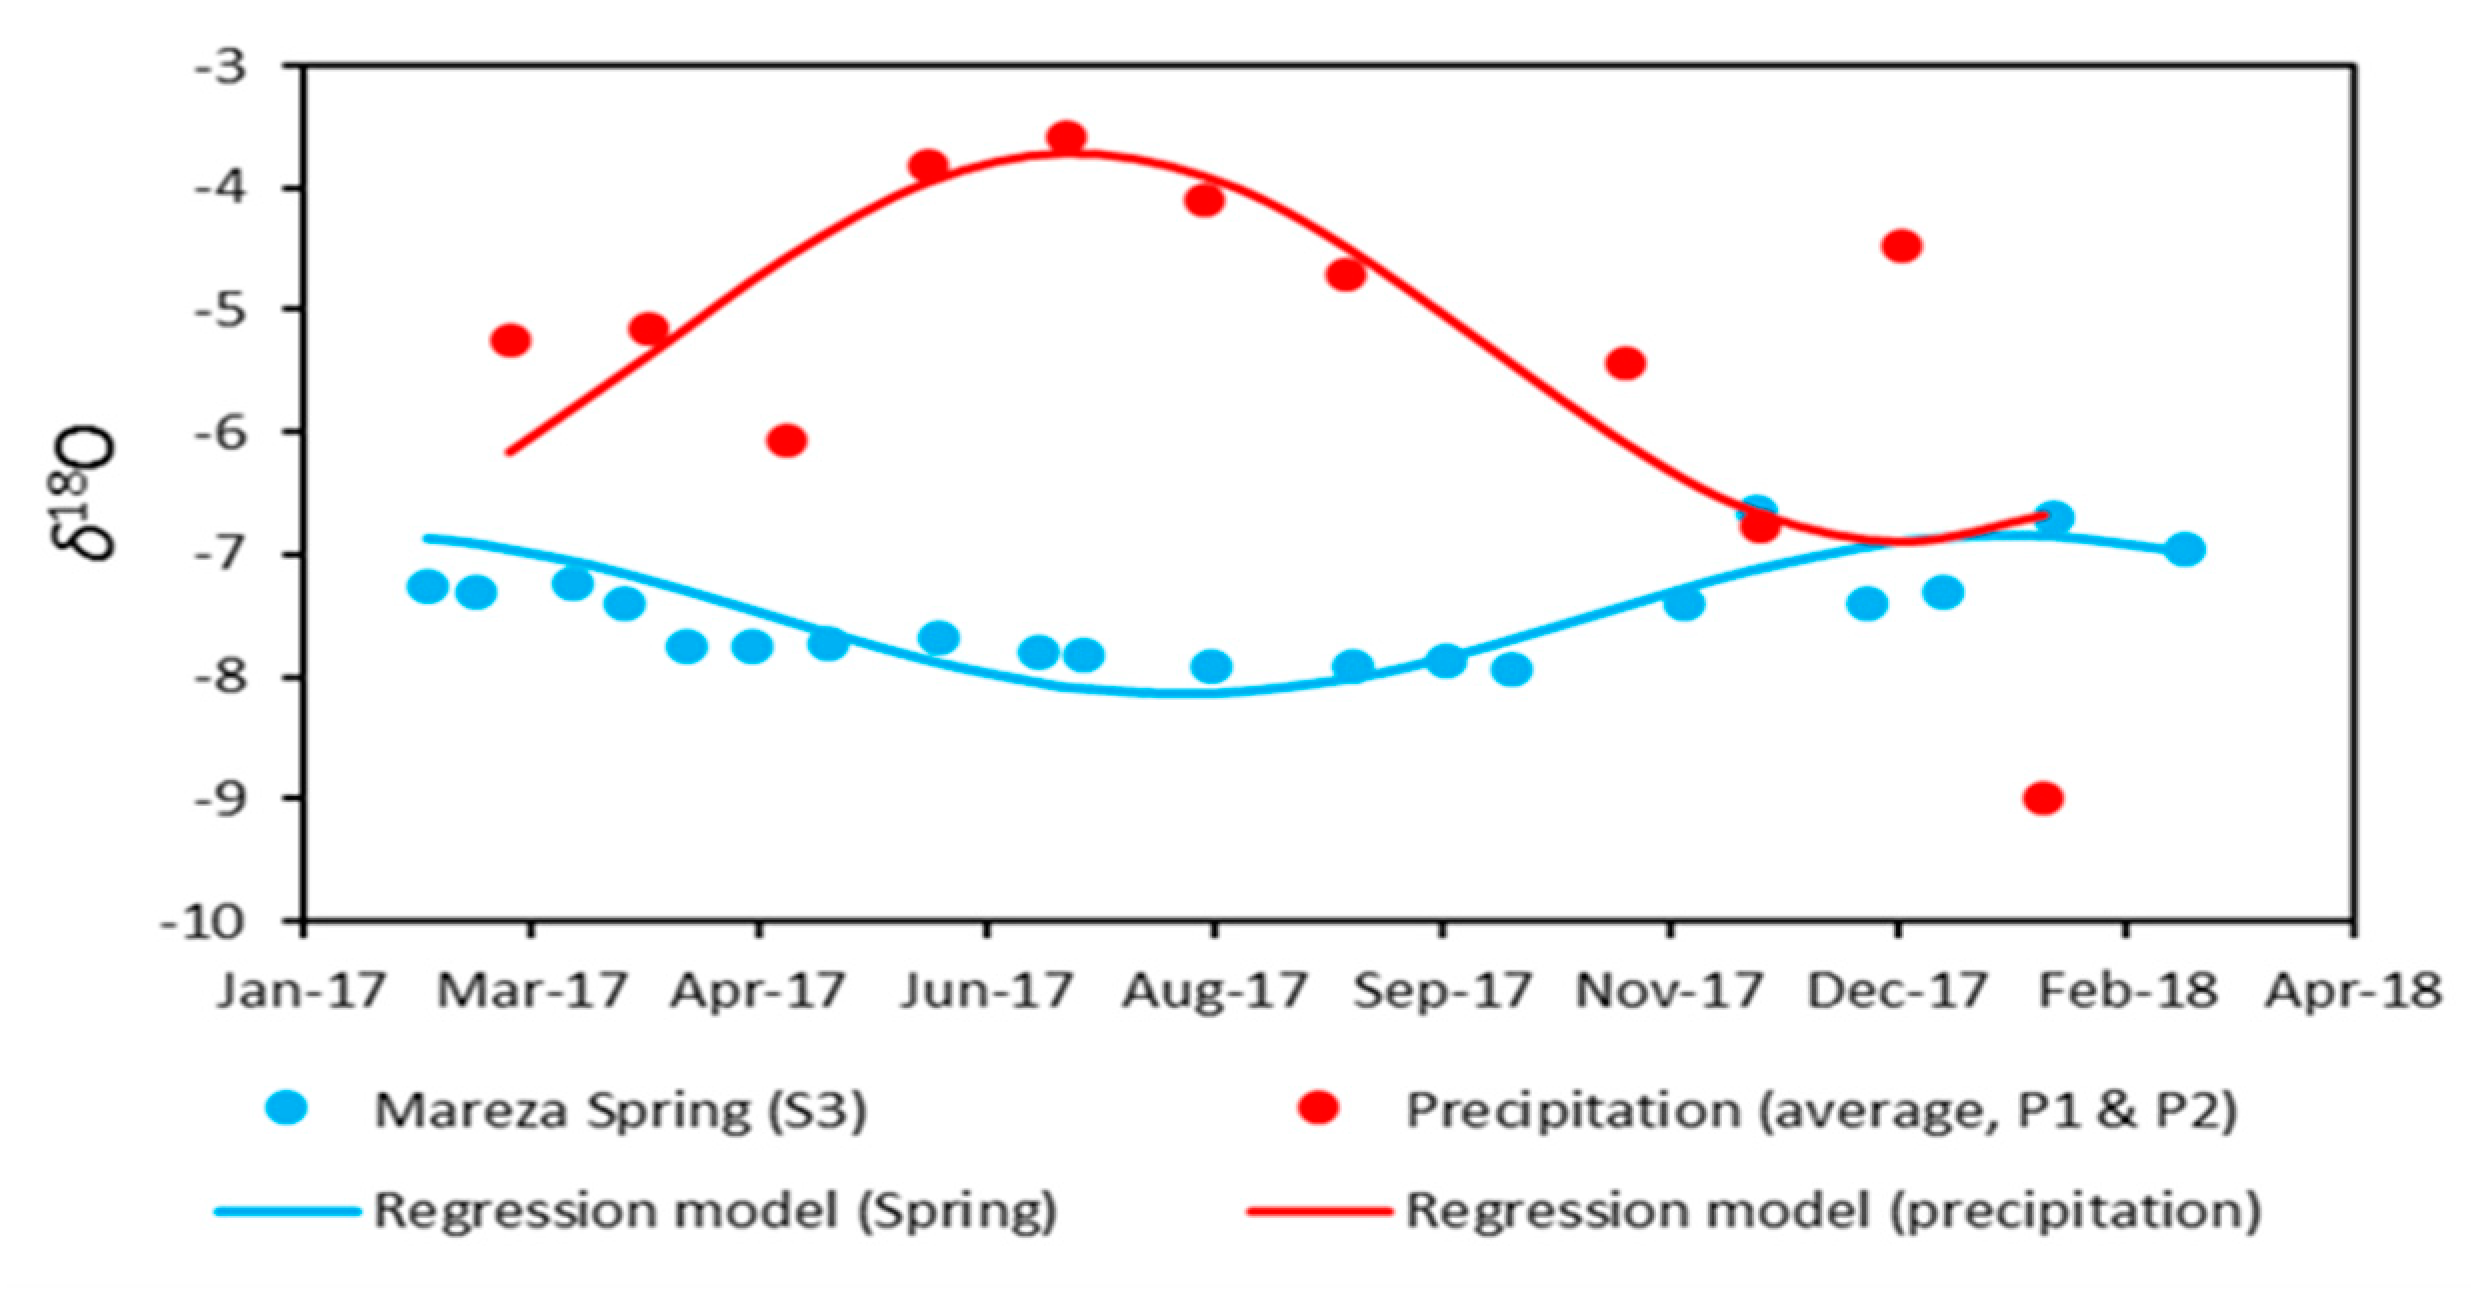
The MTT was calculated using Equation (3), and the Fyw using Equation (4). The sine wave curves were previously modeled to fit the seasonal variations of stable isotope composition in precipitation and spring water (Figure 11 and Figure 12). Two separate analyses were performed, one with the δ18O data set and the other with the δ2H data set. The precipitation curves (Figure 11 and Figure 12) are based on the average values between the two precipitation sampling points (P1 and P2). Mareza spring S3 was selected as the most representative because it has the longest series (there are no significant differences in the isotopic composition between the four springs in Mareza). The radial frequency of annual fluctuations (c) is 0.017214 rad/day [43].
According to the estimation based on the δ18O data set, the MTT amounts 129 days, and the fraction of young water Fyw is 40.9%. The estimation based on δ2H values gave the following results: MTT = 92 days; Fyw = 53.3%. Thus, with two separate data sets, similar results were obtained. Since this is a first assessment from a rather short observation period, the results should be interpreted with caution.
4. Conclusions
The hydrochemical composition of the spring and river water showed seasonal variations, mostly depending on the amount of precipitation. Variable discharge influences the basic hydrochemical parameters, such as electroconductivity and the concentration of major ions (Ca2+ and HCO3−). The springs generally showed little difference in hydrochemical composition, while in the river, the concentrations of the major solutes analyzed increased downstream between the two sampling sites. The recharge of the Mareza springs by the river water is possible, although the magnitude of such a recharge would be small. The isotopic composition of the spring and river water indicates that the main recharge area is in a mountainous area with conspicuously higher altitude than the investigated area.
The significant changes in hydrochemistry of spring water (EC, HCO3−, Ca2+, and the saturation indices of calcite and pCO2) recorded during the heavy rainfall lagged behind the change in discharge, suggesting that recharge water must first flush the system of stored water before arriving at the spring itself.
The isotopic composition of precipitation during the investigated period (2017–2018) in Podgorica and Danilovgrad was similar to that in Dubrovnik (Croatia)—GNIP station (at a distance of 98 km WNW).
The trend line for the δ2H vs. δ18O for precipitation in the investigated area was determined, although—due to a short observation period—it may have large attached uncertainties and therefore may differ from the long-term Local Meteoric Water Line. The seasonal variability of the δ18O values of precipitation and the d excess values can be attributed to the prevailing influence of Mediterranean air masses during the winter, while in the summer period, the investigated area was under the influence of air masses originating from the Atlantic Ocean.
The time series δ18O and δ2H values for the spring water (S1, S2, S3, and S4) showed the same behavior and the same origin of water. For precise determination of the mean altitude of the recharge area based on stable isotopes, a longer observation, and additional datasets on precipitation at high altitude meteorological stations would be necessary. The origin of the spring water must be searched between the local precipitation and an area with precipitation closer to the Eastern Mediterranean. The Zeta River, too, is recharged from water originating from both Mediterranean and Atlantic air masses, as indicated by the seasonal variability of the meteorological parameters. In the summer months, the evaporation of river water also influences the isotopic composition of the surface water.
According to the analysis of the δ18O and δ2H seasonal variations in the precipitation and the spring water, the groundwater mean transit time (MTT) of the Mareza aquifer is in the range of 92–129 days. Also, the young water fraction (Fyw) was estimated to be between 40.9% to 53.3%. The obtained values are typical of springs in highly karstified terrains [31]. Although these results are significant indicators of the degree of karstification and permeability of the Mareza aquifer, for now, they represent only the first assessment.
The results provide a good basis for future investigations and water management in the area, as well as in similar hydrogeological systems.
Supplementary Materials
The following are available online at https://www.mdpi.com/2073-4441/12/4/957/s1, Table S1: Results of the major physicochemical properties of the spring and surface water during the research period; Table S2: Average, minimum, maximum, and median values for the in situ field parameters and major ion concentrations of the six sampling locations; Table S3: Isotopic contents of δ18O and δ2H and the d excess values in the monthly precipitation collected at P1 and P2, during the period of March 2017–February 2018; Table S4: Isotopic data of all water samples (spring and surface water) through 21 series of sampling; Table S5: Average, minimum, maximum, and median values for the isotope composition of the spring and surface water samples collected in the study period; Figure S1: Mean annual air temperature and annual precipitation in the study area for the long-term period (2007–2017).
Author Contributions
Conceptualization, K.Ž. and S.L; writing—original draft manuscript, K.Ž.; review and editing of corrections and improvements to the manuscript, S.L., M.R., and M.P. All authors have read and agreed to the published version of the manuscript.
Funding
This research was financially supported by “Water supply and drainage” LLC Podgorica, Montenegro.
Acknowledgments
The authors are thankful to the Institute of Hydrometeorology and Seismology of Montenegro, which on request, obtained meteorological data (free of charge).
Conflicts of Interest
The authors declare no conflicts of interest.
References
- ten Brink, P.; Avramovski, L.; Vermoote, S.; Bassi, S.; Callebaut, K.; Lust, A.; Hunt, A. Benefits for fYRoM and Other Countries of SEE of Compliance with the Environmental Acquis (Task 2); Final Report—Part II: Country Specific Report Montenegro; Report prepared for the European Commission—DG Environment, Arcadis ECOLAS N.V.; Berchem and Institute of European Environmental Policy: Brussels, Belgium, 2007. [Google Scholar]
- Bakalowicz, M. Karst groundwater: A challenge for new resources. Hydrogeol. J. 2005, 13, 148–160. [Google Scholar] [CrossRef]
- Ford, D.; Williams, P. Karst Geomorphology and Hydrology; Unwin Hyman: London, UK, 2007; p. 601. [Google Scholar]
- Chen, X.; Zhang, Z.; Soulsby, C.; Cheng, Q.; Binley, A.; Jiang, R.; Tao, M. Characterizing the heterogeneity of karst critical zone and its hydrological function: An integrated approach. Hydrol. Process. 2018, 32, 1–15. [Google Scholar] [CrossRef] [Green Version]
- White, W.B. Karst hydrology: Recent developments and open questions. Eng. Geol. 2002, 65, 85–105. [Google Scholar] [CrossRef]
- Zhao, M.; Hu, Y.; Zeng, C.; Liu, Z.; Yang, R.; Chen, B. Effects of land cover on variations in stable hydrogen and oxygen isotopes in karst groundwater: A comparative study of three karst catchments in Guizou Province, Southwest China. J. Hydrol. 2018, 565, 374–385. [Google Scholar] [CrossRef]
- Coplen, T.B.; Herczeg, A.L.; Barnes, C. Isotope engineering—Using stable isotopes of the water molecule to solve practical problems. In Environmental Tracers in Subsurface Hydrology; Cook, P., Herczeg, A.L., Eds.; Kluwer Academic Publishers: South Holland, The Nerthelands, 2000; pp. 79–110. [Google Scholar]
- Leibundgut, C.; Maloszewski, P.; Kulls, C. Tracer in Hydrology, 1st ed.; Wiley-Blackwell: Chichester, UK, 2009; p. 432. [Google Scholar]
- Moeck, C.; Radny, D.; Popp, A.; Brennwald, M.; Stoll, S.; Auckenthaler, A.; Berg, M.; Schirmer, M. Characterization of a managed aquifer recharge system using multiple tracers. Sci. Total Environ. 2017, 609, 701–714. [Google Scholar] [CrossRef]
- Dević, N.; Filipović, S. Repercussion of the pressure from the surface area to the geochemical properties of water of karst spring. In Proceedings of the Book of Apstracts 6th Symposium Chemistry and Environmental Protection EnviroChem, Vršac, Serbia, 21–24 May 2013; pp. 220–222. [Google Scholar]
- Krivokapić, S.; Dević, N.; Filipović, S. Research on the natural features of karst water, on the example of some water inatkes. Abstr. Appl. Stud. Agribus. Commer. 2013. [Google Scholar] [CrossRef]
- Dević, N.; Radojević, D.; Filipović, S.; Blečić, V. Prilog poznavanju veze između voda sliva gornje Morače i vodozahvata Mareza. In Proceedings of the XIV Srpski Simpozijum o Hidrogeologiji sa Međunarodnim Učešćem, RGF, Zlatibor, Serbia, 17–20 May 2012; pp. 70–74. [Google Scholar]
- Vujošević, M. Izrada Monitoringa Vode za Piće, na Primjeru Kaptiranih Izvora ”Mareza”. Master’s Thesis, University of Montenegro—Faculty of Natural Sciences and Mathematics, Podgorica, Montenegro, 2013. [Google Scholar]
- Živkovic, K. Istraživanje Kvaliteta Vode Izvorišta “Ljeskovac”—Podgorica za Proizvodnju Flaširane vode za Piće. Master’s Thesis, University of Montenegro—Faculty of Metallurgy and Technology, Podgorica, Montenegro, 2007. [Google Scholar]
- Živković, K.; Zejnilović, R.M.; Jaćimović, Ž.K. Investigation of water and sediments in water from well “Ljeskovac”–Podgorica and possibility of its use in production of bottled water. In Proceedings of the 5th International Conference of the Chemical Societies of the South-Eastern European Countries, Ohrid, FYR Macedonia, 10 September 2006. [Google Scholar]
- McGuire, K.; McDonnell, J.J. Stable isotope tracers in watershed hydrology. In Stable Isotopes in Ecology and Environmental Science, 2nd ed.; Michener, R., Lajtha, K., Eds.; Wiley/Blackwell: Malden, MA, USA, 2007; pp. 334–540. [Google Scholar]
- Gat, J.R.; Gonfiantini, R. Stable Isotope Hydrology: Deuterium and Oxygen-18 in the Water Cycle; IAEA Technical Reports Series; International Atomic Energy Agency: Vienna, Austria, 1981; Volume 63, pp. 861–862. [Google Scholar]
- Gat, J.R. Oxygen and hydrogen isotopes in the hydrologic cycle. Annu. Rev. Earth Planet. Sci. 1996, 24, 225–262. [Google Scholar] [CrossRef] [Green Version]
- Greene, E.A. Tracing recharge from sinking streams over spatial dimensions of kilometers in a karst aquifer. Ground Water 1997, 35, 898–904. [Google Scholar] [CrossRef]
- Kohfahl, C.; Sprenger, C.; Benavente Herrera, J.; Meyer, H.; Fernandez Chacon, P.; Pekdeger, A. Recharge sources and hydrogeochemical evolution of groundwater in semiarid and karstic environments. A field study in the Granada Basin (Southern Spain). Appl. Geochem. 2008, 23, 846–862. [Google Scholar] [CrossRef] [Green Version]
- Vandenschrick, G.; van Wesemael, B.; Frot, E.; Pulido-Bosch, A.; Molina, L.; Stiévenard, M.; Souchez, R. Using Stable Isotope Analysis (δD and δ18O) to Characterize the Regional Hydrology of the Sierra de Gador, South East Spain. J. Hydrol. 2002, 265, 43–55. [Google Scholar] [CrossRef]
- Long, A.J.; Putnam, L.D. Linear model describing three components of flow in karst aquifers using 18O data. J. Hydrol. 2004, 296, 254–270. [Google Scholar] [CrossRef]
- Maloszewski, P.; Stichler, W.; Zuber, A.; Rank, D. Identifying the flow systems in a karstic-fissured-porous aquifer, the Schneealpe, Austria, by modelling of environmental 18O and 3H isotopes. J. Hydrol. 2002, 256, 48–59. [Google Scholar] [CrossRef]
- Perrin, J.; Jeannin, P.Y.; Zwahlen, F. Epikarst storage in a karst aquifer: A conceptual model based on isotopic data, Milandre test site, Switzerland. J. Hydrol. 2003, 279, 106–124. [Google Scholar] [CrossRef]
- Schwarz, K.; Barth, J.A.C.; Postigo-Rebollo, C.; Grathwohl, P. Mixing and transport of water in a karst catchment: A case study from precipitation via seepage to the spring. Hydrol. Earth Syst. Sci. 2009, 13, 285–292. [Google Scholar] [CrossRef] [Green Version]
- Katz, B.G.; Coplen, T.B.; Bullen, T.D.; Davis, J.H. Use of chemical and isotopic tracers to characterize the interactions between ground water and surface water in mantled karst. Ground Water 1997, 35, 1014–1028. [Google Scholar] [CrossRef]
- Barbieri, M.; Boschetti, T.; Petitta, M.; Tallini, M. Stable isotope (H-2, O-18 and Sr-87/Sr-86) and hydrochemistry monitoring for groundwater hydrodynamics analysis in a karst aquifer (Gran Sasso, Central Italy). Appl. Geochem. 2005, 20, 2063–2081. [Google Scholar]
- Andreo, B.; Liñán, C.; Carrasco, F.; Jimenez de Cisneros, C.; Caballero, E.; Mudry, J. Influence of rainfall quantity on the isotopic composition (18O and 2H) of water in mountainous areas. Application for groundwater research in the Yunquera-Nieves karst aquifers (S Spain). Appl. Geochem. 2004, 19, 561–574. [Google Scholar] [CrossRef]
- Einsiedl, F.; Maloszewski, P.; Stichler, W. Multiple isotope approach to the determination of the natural attenuation potential of a high-alpine karst system. J. Hydrol. 2009, 365, 113–121. [Google Scholar] [CrossRef]
- Hem, J.D. Study and Interpretation of the Chemical Characteristics of Natural Water, 2nd ed.; US Government Printing Office: Washington, DC, USA, 1975.
- Gibbs, R.J. Mechanism controlling world water chemistry. Science 1970, 17, 1088–1090. [Google Scholar] [CrossRef]
- Kendall, C.; Doctor, D.H. Stable Isotope Applications in Hydrologic Studies. In Treatise on Geochemistry, 1st ed.; Drever, J.I., Ed.; Elsevier: Amsterdam, The Netherlands, 2003; Volume 5, pp. 319–364. [Google Scholar]
- Clark, I.D.; Fritz, P. Environmental Isotopes in Hydrogeology; CRC Press/Lewis Publishers: Palm Beach County, FL, USA, 1997; p. 342. [Google Scholar]
- Glynn, P.D.; Plummer, L.N. Geochemistry and the understanding of ground-water systems. Hydrogeol. J. 2005, 13, 263–287. [Google Scholar] [CrossRef]
- Radulović, V.; Perović, V. Concession Study for Use a Part of Waters for Bottling of Aquifer Mareza PE; Water Supply and Sewage: Podgorica, Montenegro, 2003. [Google Scholar]
- Radulovic, M.; Radulovic, M.; Stevanovic, Z.; Sekulic, G.; Radulovic, V.; Buric, M.; Radojevic, D. Hydrogeology of the Skadar Lake basin (Southeast Dinarides) with an assessment of considerable subterranean inflow. Environ. Earth Sci. 2015, 74, 71–82. [Google Scholar] [CrossRef]
- IAEA/GNIP. Available online: http://www.naweb.iaea.org/napc/ih/documents/other/gnip_manual_v2.02_en_hq.pdf (accessed on 9 June 2017).
- Ternan, J.L. Comments on the use of calcium hardness variability index in the study of carbonate aquifers; with reference to the Central Pennines, England. J. Hydrol. 1972, 16, 317–321. [Google Scholar] [CrossRef]
- White, W.B. Geomorphology and Hydrology of Karst Terrain; Oxford University Press: New York, NY, USA, 1988; p. 480. [Google Scholar]
- Toran, G.L.; Roman, E. CO2 outgassing in a combined fracture and conduit karst aquifer near Lititz Spring, Pennsylvania. Spec. Pap. Geol. Soc. Am. 2006, 404, 275–282. [Google Scholar]
- Drever, J.I. The Geochemistry of Natural Waters-Surface and Groundwater Environments, 3rd ed.; Prentice Hall: Upper Saddle River, NJ, USA, 1997; p. 436. [Google Scholar]
- Rodgers, P.; Soulsby, C.; Waldon, S.; Tetzlaff, D. Using stable isotope tracers to identify hydrological flow paths, residence times and landscape controls in a mesoscale catchment. Hydrol. Earth Syst. Sci. 2005, 9, 139–155. [Google Scholar] [CrossRef] [Green Version]
- Rusjan, S.; Sapač, K.; Petrič, M.; Lojenc, S.; Bezaka, N. Identifying the hydrological behavior of a complex karst system using stable isotopes. J. Hydrol. 2019, 577. [Google Scholar] [CrossRef]
- Kirchner, J.W. Aggregation in environmental systems—Part 1: Seasonal tracer cycles quantify young water fractions, but not mean transit times in spatially heterogeneous catchments. Hydrol. Earth Syst. Sci. 2016, 20, 279–297. [Google Scholar] [CrossRef] [Green Version]
- Manning, A.H.; Solomon, D.K. Using noble gases to investigate mountain-front recharge. J. Hydrol. 2003, 275, 194–207. [Google Scholar] [CrossRef]
- Barešić, J. Application of Isotopic and Geochemical Methods in Monitoring of Global and Local Changes in Ecological System of Plitvice Lakes. Ph.D. Thesis, University of Zagreb, Zagreb, Croatia, 2009. [Google Scholar]
- Jacobson, R.L.; Langmuir, D. The chemical history of some spring waters in carbonate rocks. Groundwater 1970, 8, 5–9. [Google Scholar] [CrossRef]
- Hess, J.W.; White, W.B. Storm response of the karstic carbonate aquifer of south-central Kentucky. J. Hydrol. 1988, 99, 235–252. [Google Scholar] [CrossRef]
- Edmunds, W.M.; Cook, J.M.; Darling, W.G.; Kinniburgh, D.G.; Miles, D.L.; Bath, A.H.; Morgan-Jones, M.; Andrews, J.N. Baseline geochemical conditions in the Chalk aquifer, Berkshire, UK: A basis for groundwater quality management. Appl. Geochem. 1987, 2, 251–274. [Google Scholar] [CrossRef]
- Cardenal, J.; Benavente, J.; Cruzsanjulian, J.J. Chemical Evolution of Groundwater in Triassic Gypsum-Bearing Carbonate Aquifers (Las-Alpujarras, Southern Spain). J. Hydrol. 1994, 161, 3–30. [Google Scholar] [CrossRef]
- Musgrove, M.; Banner, J.L. Controls on the spatial and temporal variability of vadose dripwater geochemistry: Edwards Aquifer, central Texas. Geochim. Cosmochim. Acta 2004, 68, 1007–1020. [Google Scholar] [CrossRef]
- McMahon, P.B.; Böhlke, J.K.; Christenson, S.C. Geochemistry, radiocarbon ages, and paleorecharge conditions along a transect in the central High Plains aquifer, southwestern Kansas, USA. Appl. Geochem. 2004, 19, 1655–1686. [Google Scholar] [CrossRef]
- Parkhurst, D.L.; Appelo, C.A.J. Description of Input and Examples for PHREEQC Version 3—A Computer Program for Speciation, Batch Reaction, One Dimensional Transport and Inverse Geochemical Calculations; U.S. Geological Survey Techniques and Methods: Reston, VA, USA, 2013; Volume 43.
- Appello, C.A.J.; Postma, D. Geochemistry, Groundwater and Pollution, 2nd ed.; A.A. Balkema Publishers: Leiden, The Netherlands, 2005; p. 649. [Google Scholar]
- Langelier, W.F. The analytical control of anti-corrosion water treatment. J. Am. Waterworks Assoc. 1936, 28, 1500–1521. [Google Scholar] [CrossRef]
- Langmuir, D. The geochemistry of some carbonate ground waters in central Pennsylvania. Geochim. Cosmochim. Acta 1971, 35, 1023–1045. [Google Scholar] [CrossRef]
- Langmuir, D. Aqueous Environmental Chemistry; Prentice Hall: Upper Saddle River, NJ, USA, 1997. [Google Scholar]
- Vitvar, T.; Balderer, W. Estimation of mean water residence times and runoff generation by 180 measurements in a Pre-Alpine catchment (Rietholzbach, Eastern Switzerland). Appl. Geochem. 1997, 12, 787–796. [Google Scholar] [CrossRef]
- Craig, H. Isotopic Variations in Meteoric Waters. Science 1961, 133, 1702–1703. [Google Scholar] [CrossRef]
- Bowen, R. Groundwater, 2nd ed.; Elsevier Applied Science Publishers: London, UK, 1986. [Google Scholar]
- Aggarwal, P.K.; Gat, J.R.; Froehlich, K.F.O. Isotopes in the Water Cycle: Past, Present and Future of a Developing Science; Springer: Berlin, Germany, 2005. [Google Scholar]
- Dansgaard, W. Stable isotopes in precipitation. Tellus 1964, 16, 436–468. [Google Scholar] [CrossRef]
- Kendall, C.; McDonnell, J.J. Isotope Tracers in Catchment Hydrology; Elsevier: Amsterdam, The Netherlands, 1998; p. 840. [Google Scholar]
- Araguás-Araguás, L.; Froehlich, K.; Rozanski, K. Deuterium and oxygen-18 isotope composition of precipitation and atmospheric moisture. Hydrol. Process. 2000, 14, 1341–1355. [Google Scholar] [CrossRef]
- Mook, W.G.; De Vries, J.J. Environmental Isotopes in the Hydrological Cycle. In Principles and Applications; IHP–V, UNESCO, No. 39; IAEA Publish: Vienna, Austria, 2000. [Google Scholar]
- Masson-Delmotte, V.; Jouzel, J.; Landais, A.; Stievenard, M.; Johnsen, S.J.; White, J.W.C.; Werner, M.; Sveinbjornsdottir, A.; Fuhrer, K. GRIP Deuterium excess reveals rapid and orbital-scale changes in Greenland moisture origin. Science 2005, 309, 118–121. [Google Scholar] [CrossRef] [Green Version]
- Aemisegger, F.; Pfahl, S.; Sodemann, H.; Lehner, I.; Seneviratne, S.I.; Wernli, H. Deuterium excess as a proxy for continental moisture recycling and plant transpiration. Atmos. Chem. Phys. 2014, 14, 29721–29784. [Google Scholar] [CrossRef] [Green Version]
- Lewis, S.C.; LeGrande, A.N.; Kelley, M.; Schmidt, G.A. Modeling insights into deuterium excess as an indicator of water vapor source conditions. J. Geophys. Res. Atmos. 2013, 118, 243–262. [Google Scholar] [CrossRef]
- Benetti, M.; Reverdin, G.; Pierre, C.; Merlivat, L.; Risi, C.; SteenLarsen, H.C.; Vimeux, F. Deuterium excess in marine water vapor: Dependency on relative humidity and surface wind speed during evaporation. J. Geophys. Res.-Atmos. 2014, 119, 584–593. [Google Scholar] [CrossRef]
- Pfahl, S.; Sodemann, H. What controls deuterium excess in global precipitation? Clim. Past 2014, 10, 771–781. [Google Scholar] [CrossRef] [Green Version]
- Steen-Larsen, H.C.; Sveinbjornsdottir, A.E.; Peters, A.J.; Masson-Delmotte, V.; Guishard, M.P.; Hsiao, G.; Jouzel, J.; Noone, D.; Warren, J.K.; White, J.W.C. Climatic controls on water vapor deuterium excess in the marine boundary layer of the North Atlantic based on 500 days of in situ, continuous measurements. Atmos. Chem. Phys. 2014, 14, 7741–7756. [Google Scholar] [CrossRef] [Green Version]
- IAEA. Isotopic Composition of Precipitation in the Mediterranean Basin in Relation to Air Circulation Patterns and Climate; IAEA-TECDOC-1453; IAEA: Vienna, Austria, 2005; p. 223. [Google Scholar]
- Froehlich, K.; Gibson, J.J.; Aggarwal, P.K. Deuterium Excess in Precipitation and Its Climatological Significance; IAEA-CSP--13/P; International Atomic Energy Agency (IAEA): Vienna, Austria, 2002. [Google Scholar]
- Cruz-san, J.; Araguas, L.; Rozanski, K.; Benavente, J.; Cardenal, J.; Hidalgo, M.C.; Garcia-Lopez, S.; Martinez-Garrido, J.C.; Moral, F.; Olias, M. Sources of precipitation over South-Eastern Spain and groundwater recharge. An isotopic study. Tellus B 1992, 44, 226–236. [Google Scholar] [CrossRef] [Green Version]
- Đorđević, D.S.; Tošić, I.; Unkašević, M.; Đurašković, P. Water-soluble mainions in precipitation over the southeastern Adriatic region: Chemical composition and long-rang transport. Environ. Sci. Pollut. Res. 2010, 17, 1591–1598. [Google Scholar] [CrossRef]
- Schicker, I.; Radanovics, S.; Seibert, P. Origin and transport of Mediterranean moisture and air. Atmos. Chem. Phys. 2010, 10, 5089–5105. [Google Scholar] [CrossRef] [Green Version]
- Vreča, P.; Krajcar Bronić, I.; Horvatinčić, N.; Barešić, J. Isotopic characteristics of precipitation in Slovenia and Croatia: Comparisom of continental and maritime stations. J. Hydrol. 2006, 330, 457–469. [Google Scholar] [CrossRef]
- IAEA/GNIP. Available online: https://nucleus.iaea.org/wiser/index.aspx (accessed on 8 February 2019).
- Gat, J.R.; Carmi, H. Evolution of the isotopic composition of atmospheric waters in the Mediterranean Sea area. J. Geophys. Res. 1970, 75, 3039–3040. [Google Scholar] [CrossRef]
- Horvatinčić, N.; Krajcar Bronić, I.; Barešić, J.; Obelić, B.; Vidić, S. Tritium and stable isotope distribution in the atmosphere eat the coastal region of Croatia. In Isotopic Composition of Precipitation in the Mediterranean Basin in Relation to Air Circulation Patterns and Climate; TECDOC Series No. 1453; IAEA: Vienna, Austria, 2005; pp. 37–50. [Google Scholar]
Figure 1.
Elevation map of the study area with sampling locations for collecting precipitation (P1 and P2), Mareza spring water (S1, S2, S3, and S4), and surface water of the Zeta River (upstream, RU; downstream, RD).
Figure 1.
Elevation map of the study area with sampling locations for collecting precipitation (P1 and P2), Mareza spring water (S1, S2, S3, and S4), and surface water of the Zeta River (upstream, RU; downstream, RD).

Figure 2.
Hydrogeological map of the study area.

Figure 3.
Ombrothermic diagram for Podgorica precipitation station during the study period.

Figure 4.
Time series of (a) temperature, (b) pH, (c) electroconductivity, and (d) concentration of HCO3− in the spring and river water.
Figure 4.
Time series of (a) temperature, (b) pH, (c) electroconductivity, and (d) concentration of HCO3− in the spring and river water.

Figure 5.
Concentrations of dissolved Ca2+ (a) and Mg2+ (b) in the spring and river water, and their respective correlations with HCO3− (c,d).
Figure 5.
Concentrations of dissolved Ca2+ (a) and Mg2+ (b) in the spring and river water, and their respective correlations with HCO3− (c,d).

Figure 6.
Time series of dissolved Mg/Ca molar ratio in the spring and river water (a), and dissolved Mg vs. Ca plot (b).
Figure 6.
Time series of dissolved Mg/Ca molar ratio in the spring and river water (a), and dissolved Mg vs. Ca plot (b).

Figure 7.
Time series of saturation indices of calcite and log pCO2, calculated using the PHREEQC program, in the spring (a) and river water (b).
Figure 7.
Time series of saturation indices of calcite and log pCO2, calculated using the PHREEQC program, in the spring (a) and river water (b).

Figure 8.
Time series of concentration of dissolved sulphate (a) and SO42−/Cl− ratio (b) in the spring and river water.
Figure 8.
Time series of concentration of dissolved sulphate (a) and SO42−/Cl− ratio (b) in the spring and river water.

Figure 9.
Isotopic composition of precipitation at stations P1 and P2 (a), d excess at station P1 (b), and regression line of local precipitation during the study period in comparison with the Global Meteoric Water Line (c).
Figure 9.
Isotopic composition of precipitation at stations P1 and P2 (a), d excess at station P1 (b), and regression line of local precipitation during the study period in comparison with the Global Meteoric Water Line (c).

Figure 10.
Time series of the δ18O values of the spring and river water (a) and δ2H vs. δ18O plot with trend lines for the spring and river water, the Global Meteoric Water Line (GWML), and the Eastern Mediterranean Meteoric Water Line (EMMWL) (b).
Figure 10.
Time series of the δ18O values of the spring and river water (a) and δ2H vs. δ18O plot with trend lines for the spring and river water, the Global Meteoric Water Line (GWML), and the Eastern Mediterranean Meteoric Water Line (EMMWL) (b).

Figure 11.
Seasonal variations of δ18O in precipitation and the Mareza spring (measured values and regression model curves).
Figure 11.
Seasonal variations of δ18O in precipitation and the Mareza spring (measured values and regression model curves).

Figure 12.
Seasonal variations of δ2H in precipitation and the Mareza spring (measured values and regression model curves).
Figure 12.
Seasonal variations of δ2H in precipitation and the Mareza spring (measured values and regression model curves).


Table 1.
Geographical latitude, longitude, and altitude of the precipitation (P1 and P2) sampling points and the meteorological stations.
Table 1.
Geographical latitude, longitude, and altitude of the precipitation (P1 and P2) sampling points and the meteorological stations.
| Location | Latitude (°) | Longitude (°) | Altitude (m asl) |
|---|---|---|---|
| P1 | 42.36 | 19.04 | 38 |
| P2 | 42.45 | 19.20 | 32 |
| Danilovgrad meteorological station | 42.55 | 19.1 | 53 |
| Podgorica meteorological station | 42.43 | 19.28 | 49 |
© 2020 by the authors. Licensee MDPI, Basel, Switzerland. This article is an open access article distributed under the terms and conditions of the Creative Commons Attribution (CC BY) license (http://creativecommons.org/licenses/by/4.0/).
Share and Cite
MDPI and ACS Style
Živković, K.; Radulović, M.; Lojen, S.; Pucarević, M. Overview of the Chemical and Isotopic Investigations of the Mareza Springs and the Zeta River in Montenegro. Water 2020, 12, 957. https://doi.org/10.3390/w12040957
AMA Style
Živković K, Radulović M, Lojen S, Pucarević M. Overview of the Chemical and Isotopic Investigations of the Mareza Springs and the Zeta River in Montenegro. Water. 2020; 12(4):957. https://doi.org/10.3390/w12040957
Chicago/Turabian StyleŽivković, Katarina, Milan Radulović, Sonja Lojen, and Mira Pucarević. 2020. "Overview of the Chemical and Isotopic Investigations of the Mareza Springs and the Zeta River in Montenegro" Water 12, no. 4: 957. https://doi.org/10.3390/w12040957
Note that from the first issue of 2016, this journal uses article numbers instead of page numbers. See further details here.