Modelling Groundwater Returns to Streams From Irrigation Areas with Perched Water Tables
by
Dougal Currie
1,*, 
Tariq Laattoe
2,
Glen Walker
3,*,
Juliette Woods
2,
Tony Smith
1 and
Kittiya Bushaway
2 1
CDM Smith, Level 2, 238 Angas St., Adelaide, SA 5000, Australia
2
South Australian Department for Environment and Water, 81–95 Waymouth Street, Adelaide, SA 5000, Australia
3
Grounded in Water, 2/490 Portrush Rd., St. Georges, Adelaide, SA 5064, Australia
*
Authors to whom correspondence should be addressed.
Water 2020, 12(4), 956; https://doi.org/10.3390/w12040956
Submission received: 2 March 2020
/
Revised: 25 March 2020
/
Accepted: 25 March 2020
/
Published: 27 March 2020
(This article belongs to the Special Issue Rainfall Infiltration Modeling)
Abstract
:Quantifying the magnitude and timing of groundwater returns to streams from irrigation is important for the management of natural resources in irrigation districts where the quantity or quality of surface water can be affected. Deep vadose zones and perched water tables can complicate the modelling of these fluxes, and model outputs may be biased if these factors are misrepresented or ignored. This study was undertaken in the Murray Basin in southern Australia to develop and test an integrated modelling method that links irrigation activity to surface water impacts by accounting for all key hydrological processes, including perching and vadose zone transmission. The method incorporates an agronomic water balance to simulate root zone processes, semi-analytical transfer functions to simulate the deeper vadose zone, and an existing numerical groundwater model to simulate irrigation returns to the Murray River and inform the management of river salinity. The integrated modelling can be calibrated by various means, depending on context, and has been shown to be beneficial for management purposes without introducing an unnecessary level of complexity to traditional modelling workflows. Its applicability to other irrigation settings is discussed.
1. Introduction
Irrigation often results in return flows to streams, either by drainage systems established to remove excess irrigation water in the root zone (drainage returns) or by excess irrigation water moving past the root zone, recharging groundwater and then discharging to streams (groundwater returns) [1]. Return flows can be significant in terms of quantity and/or quality and can potentially impact downstream users or aquatic and riparian ecology [2]. Quantifying the magnitude, timing, and quality of return flows to streams is required to inform the management of these risks [3,4]. Drainage returns can be measured directly, but modelling is required to quantify groundwater returns [1].
Several processes need to be represented in the modelling in order to estimate the timing and magnitude of groundwater returns [5,6]. Surface and rootzone processes control the amount of water that moves past the rootzone (rootzone drainage) [7]. This water must pass through the remainder of the vadose zone before it recharges the groundwater system (irrigation recharge). Saturated zone processes, including groundwater–surface water dynamics, control the transmission of this flux to streams.
The surface and rootzone processes are comparatively well understood, being an area of focus for agronomic specialists in the interests of devising improved irrigation practices. The saturated zone also receives attention, being an area of focus for hydrologists and hydrogeologists in the interests of water resource management. The deeper vadose zone, being harder to measure and falling between scientific disciplines, is not as well understood.
Where the vadose zone is thin and relatively uniform with depth, there is minimal delay between rootzone drainage and irrigation recharge such that it is reasonable to assume their equivalence. However, where the vadose zone is thick or includes lithological units where perched water tables may form, the timing and magnitude of irrigation recharge can be significantly affected. A thick vadose zone means that it can take a long period of time (in the order of years or decades) for changes in root zone drainage (e.g., due to irrigation development or the introduction of efficiency measures) to propagate to the water table [8,9,10]. If a layer of relatively low permeability (e.g., a clay unit) occurs within the vadose zone, a perched water table may form above this layer. In these circumstances, the rate of downwards flux will be restricted by the vertical hydraulic conductivity of the low permeability unit and the perched water table may grow vertically and laterally, and some water could be returned to the surface (e.g., via evapotranspiration or via drainage systems) [11,12,13,14,15].
The inclusion of the deeper vadose zone within catchment-scale models is rare, particularly under irrigated settings. Existing vadose zone models, which can be applied at large scales, mostly assume that water moves under gravity (e.g., [16,17]), but this assumption is invalid where perched water tables form [18].
The challenge of including the deeper vadose zone within models has resulted in different approaches to modelling groundwater returns: forward and inverse modelling. The forward method (e.g., [19,20]), aims to model the relationship between irrigation recharge and groundwater returns. The inverse method (e.g., [15,21]) estimates irrigation recharge using observed groundwater level responses or spring discharges and applies the derived irrigation recharge rates to estimate groundwater returns. There are limitations to both methods. The forward method will often involve simplifying assumptions such as ignoring any time lags or losses associated with perching and use uncertain parameters. Errors due to simplifying assumptions and uncertainty are directly transferable to the predicted groundwater returns. The estimation of recharge by inverse method, which is mostly used where there is no appropriate vadose zone model, does not provide unique solutions. It is also difficult to formulate scenarios to model different irrigation practices because on-ground actions and their influence on rootzone drainage are not directly linked to irrigation recharge and groundwater returns within the modelling approach.
Both the forward and inverse methods may lead to biases in estimating groundwater returns from irrigation and create uncertainty when linking on-ground actions (e.g., irrigation efficiency improvements) to impacts on the river. Biases can result in several disbenefits for the management of groundwater returns. If the risks of groundwater returns are overstated or thought to occur more acutely than in reality, control measures might be overdesigned, too expensive, or place an unnecessarily restrictive burden on irrigation development. If the risks are understated or thought to occur more gradually than in reality, control measures may be insufficient to avoid unacceptable impacts. Furthermore, if the modelling approach fails to appropriately link on-ground actions with their effects, there can be an inequitable sharing of the cost burden to manage risks.
Recognising the limitations of current methods, the authors of [22,23] developed a semi-analytical approach to model vadose zone transfers. These transfer functions include the simulation of perching and allow for the time lags inherent in unsaturated flow.
The objective of this study was to make use of the transfer functions developed by [22,23] and develop an integrated modelling method to quantify the groundwater returns from irrigation for the management of salinity in the lower Murray River, Australia. The integrated approach links the various elements of hydrological system involved: (1) the surface/rootzone, (2) the deeper vadose zone, and (3) the saturated zone. The integration of all three elements is intended to reduce the risk of biases that are inherent in current methods by allowing the models to make full use of the datasets available, as well as to create a transparent process to simulate the impact of various management actions. The method must be applicable on a catchment-wide scale and be practical to implement; that is, it should not impose an unnecessary burden on existing model workflows and their data requirements.
2. Study Area Description
2.1. Salinity Management in the Murray River
The Murray River is Australia’s longest river. Its catchment (including that of the Darling River) spans more than 1 million km2. It provides water to more than 1.5 million households, including the city of Adelaide, and supports a substantial irrigation industry, being Australia’s primary food bowl. Along the lower reaches of the Murray River, low salinity river water (in the order of 100–200 mg/L) is used to irrigate a range of horticultural crops across several irrigation districts. Irrigation has significantly altered the hydrology of this semi-arid environment, leading to much higher recharge rates under areas of irrigation. Because the groundwater is naturally highly saline (typically 18,000 to 35,000 mg/L), the higher rates of recharge can mobilise saline groundwater to the river and its floodplains, potentially resulting in deleterious impacts to downstream users and the environment. An extensive policy framework and management system is in place to manage the salinity risks [24]. The policy framework relies on an accounting system that assigns salinity effects (both debits and credits) to specific on-ground actions. Groundwater models, representing different irrigation districts, are used as the principal assessment tools to quantify groundwater returns and the salinity credits and debits resulting from irrigation practices.
2.2. Study Area Location, Climate, and Hydrology
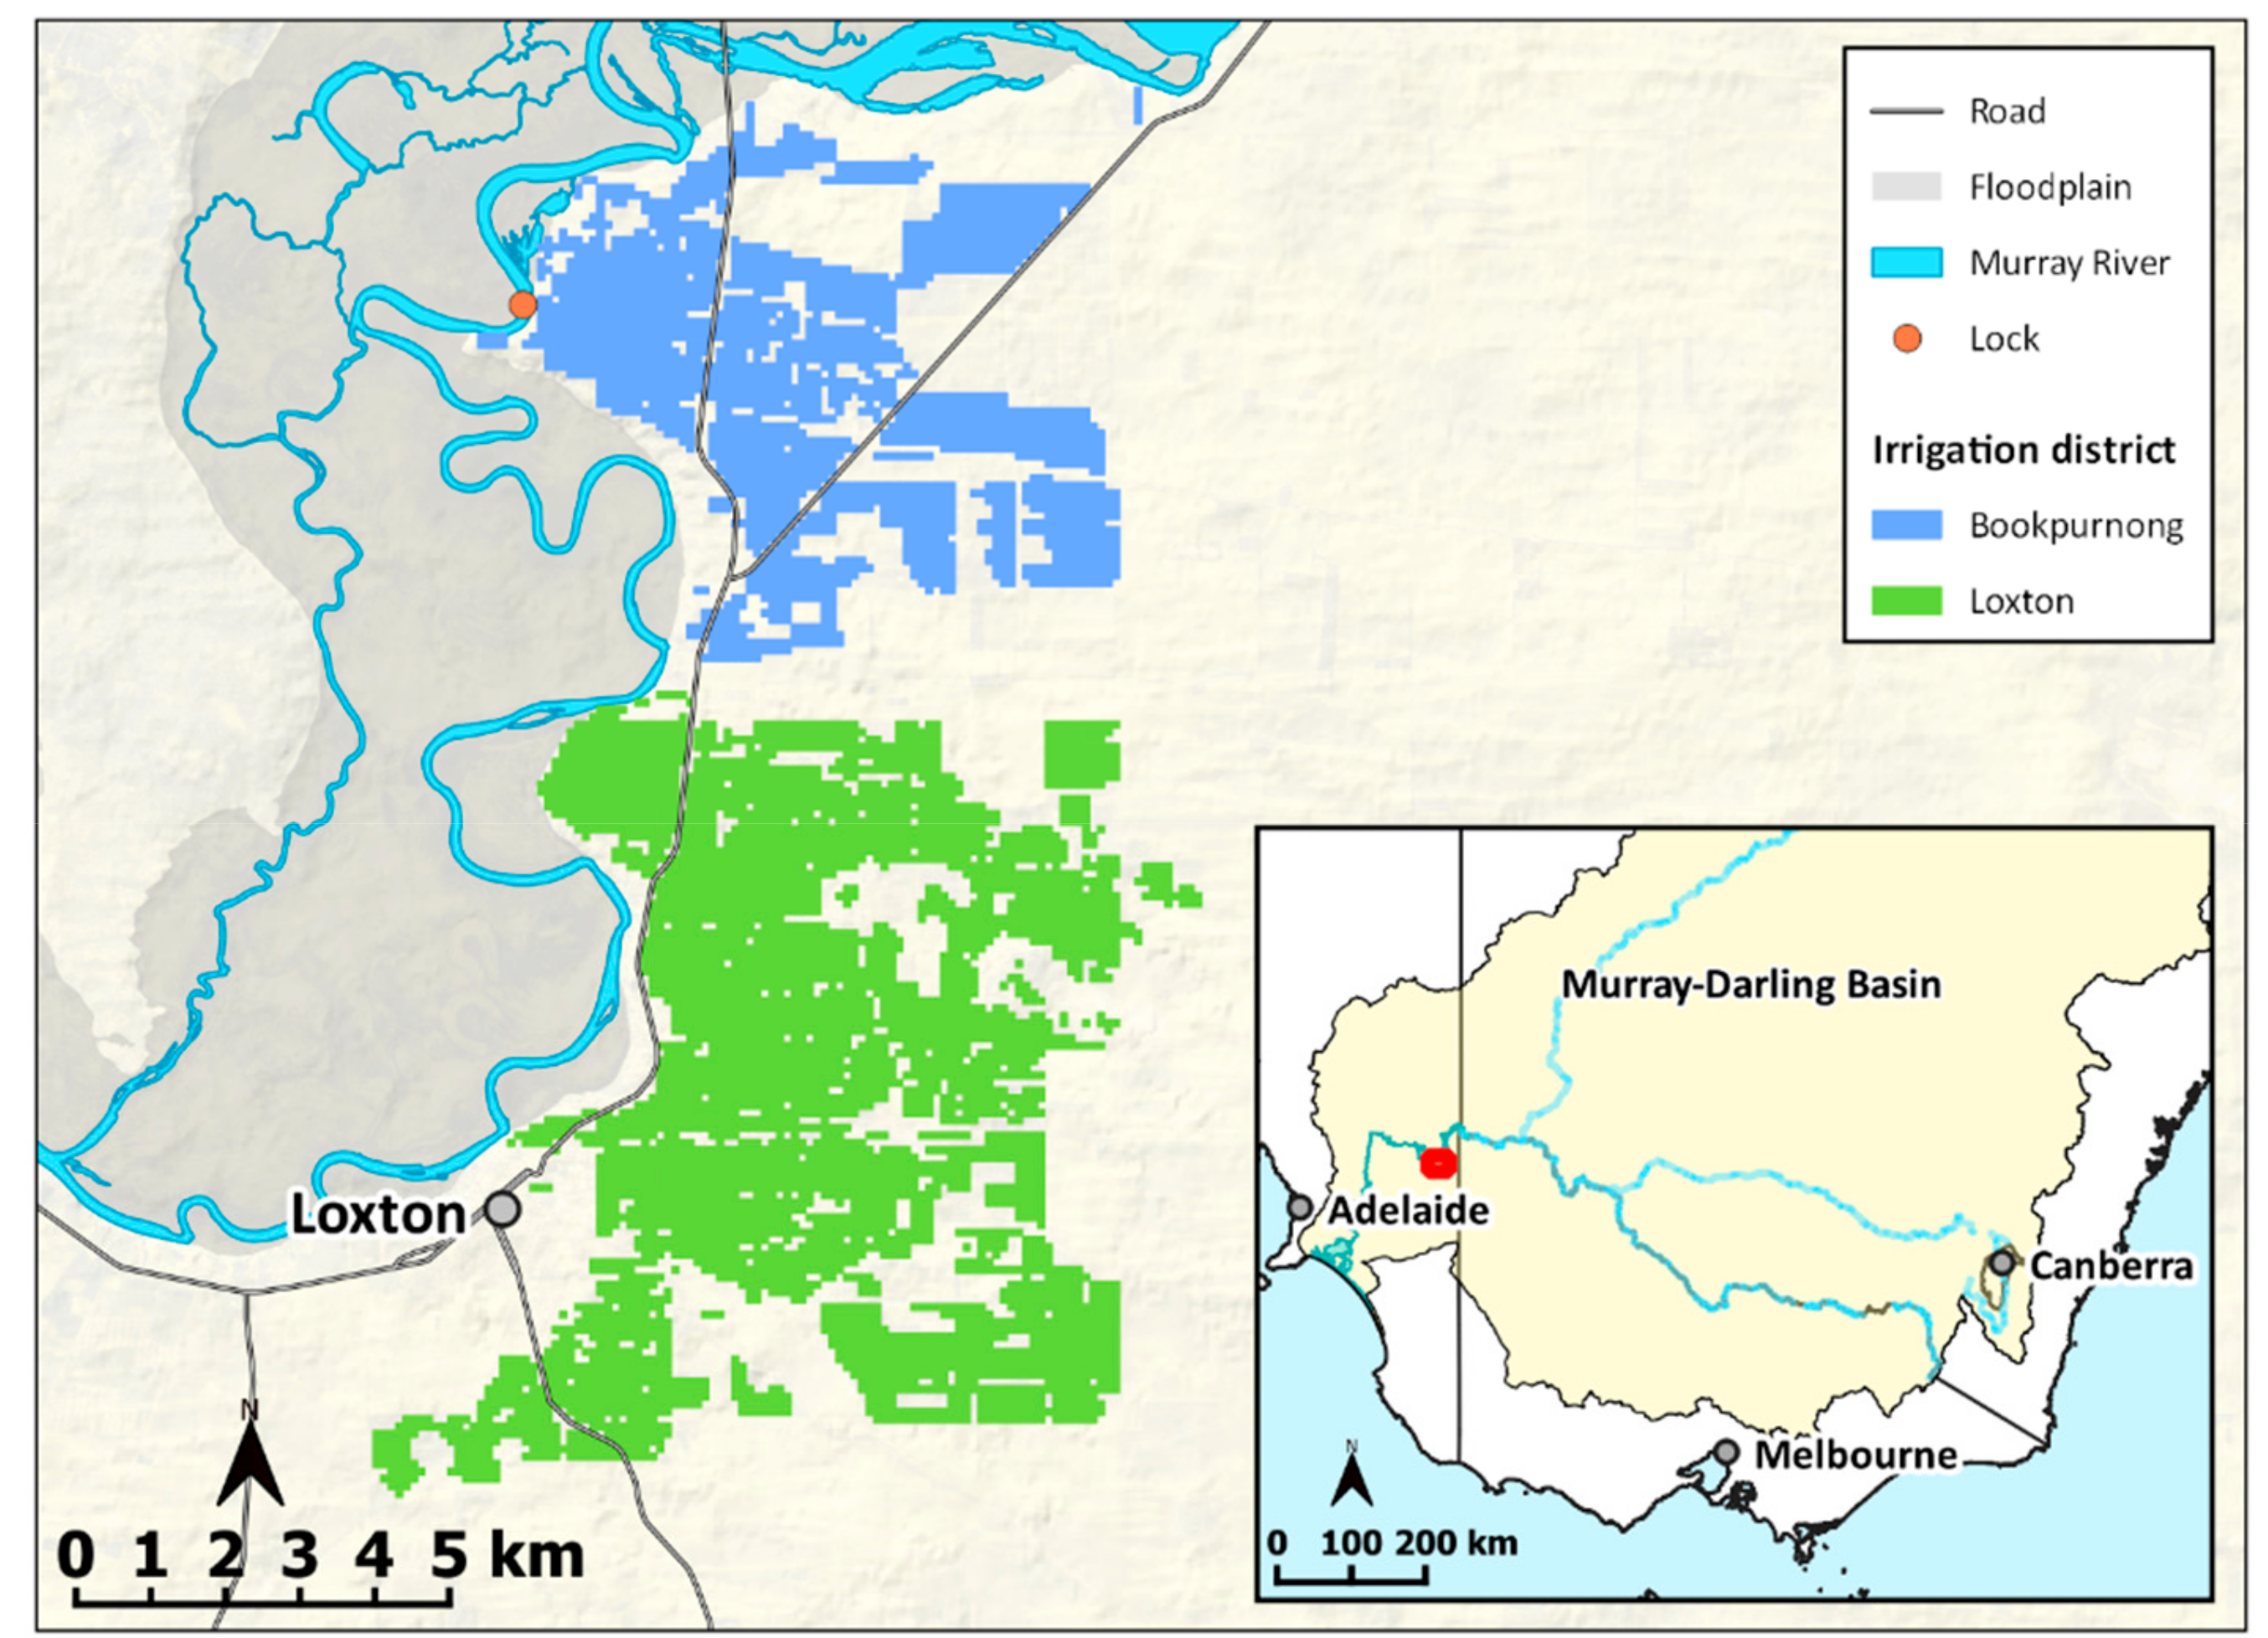
The study area was the Loxton and Bookpurnong irrigation districts of South Australia (Figure 1). Annual rainfall is 275 mm and average maximum temperatures range from 15.6 °C in July to 31.3 °C in February. Irrigation occurs on the “highland” areas that flank the Murray River and its floodplain.
The hydrology of the study area is dominated by the Murray River, which consists of a main river channel and a meandering network of anabranches and wetlands in its floodplain. There are no local tributaries and rainfall runoff is negligible. Flow in the Murray River is highly regulated by dams and storages upstream and by a series of weirs in its lower reaches that were constructed to aid navigation. The weirs have created a regime of near-constant water levels, interspersed by floods that are irregular but large.
2.3. Landscape and Geology
The highland is composed of a dune-swale system, oriented east–west, with relatively subdued relief. It has been incised by the Murray River and its floodplain, which is about 20–30 m below the areas of irrigation.
The landscape is underlain by the Murray geological basin—a 550 m thick sequence of Cenozoic marine sediments. The Murray River has formed a trench through the upper sections of this sedimentary sequence. The floodplain trench is infilled by alluvial sediments to be level with marine Loxton Sands unit of the regional sedimentary sequence. The Loxton Sands are capped by the Blanchetown Clay, a widespread lacustrine deposit that underlies most, but not all, of the irrigation district. It is of variable depth and thickness, tending to occur from depths of 2–3 m below surface as a 5 m thick layer of laminated clays. It is overlain by the aeolian Woorinen Formation, which forms the dune-swale system at the surface and hosts sandy loam soils.
2.4. Hydrogeology
The regional water table occurs in Loxton Sands unit, which is in direct hydraulic connection with the alluvial floodplain aquifers that interact with the river. Groundwater in the Loxton Sands is highly saline (7000–50,000 mg/L). The Murray River is generally gaining along this reach, with groundwater (and salt) entering the river and floodplain by lateral flow from the Loxton Sands and some upwards leakage from deeper units in the Murray Basin [21].
In the areas of irrigation, the vadose zone is characterised by three layers in order of depth: loamy sands of the Woorinen Formation, the Blanchetown Clay (which may or may not be present), and the unsaturated upper sections of the Loxton Sands.
2.5. Irrigation and Drainage
The region is well suited to irrigated horticulture, having abundant sunshine, suitable soils, and access to surface water. Irrigation along the Murray River in South Australia commenced in the 1890s, with more intense development after the Second World War [25]. Most of the development in Loxton occurred in 1948 with the establishment of the Loxton Irrigation Trust, a government-sponsored initiative [26]. The Bookpurnong area was established more recently, from the 1980s onwards, as a private initiative.
The efficiency of irrigation has improved over time [25]. Prior to the 1970s, irrigation practices were either by flood or furrow irrigation with water supplied on a set roster. This has shifted progressively to sprinklers and drippers, and the pressurisation of off-take systems from the river. This has resulted in lower rootzone drainage rates relative to the application rates. The author of [26] estimated irrigation efficiency factors at decadal intervals since irrigation development. The estimates were based on a combination of anecdotal evidence from early time periods, as well as some selected irrigator surveys and benchmarking studies for particular crop types and application methods from later time periods [26]. The estimates are more accurate since 2000 but are uncertain for all time periods.
Rootzone waterlogging became evident soon after the development of irrigation, due the formation of perched water tables on the Blanchetown Clay. Sub-surface drainage systems were installed to manage the issue.
At Loxton, a comprehensive drainage scheme (CDS) was installed. This features a series of gravity flow pipelines that receive water from tile drainage networks on each property and delivers this water to a series of open bottom caissons, where water collects and is pumped to the floodplain for disposal. Data have been collected on the volumes of water intercepted. Drainage volumes increased until the late 1990s and have steadily declined since.
In Bookpurnong, drainage issues do not occur as commonly as at Loxton. About 30% of the irrigated area requires drainage and this is confined mostly to the southwest of the district. The drainage of these properties has been managed privately, in which a tile drainage network transfers water to sumps that are pumped from for disposal. There are no data available on the cumulative drainage volumes.
2.6. Groundwater Returns and Salinisation
Irrigation has caused recharge rates to increase substantially from background levels. Prior to European settlement, the region was covered by native Mallee vegetation that allowed very little water past its rootzone [27]. The clearing of native vegetation for dryland agriculture resulted in recharge rates increasing from 0.1 to 10 mm/year, and irrigation development has resulted in recharge rates exceeding 100 mm/year [28].
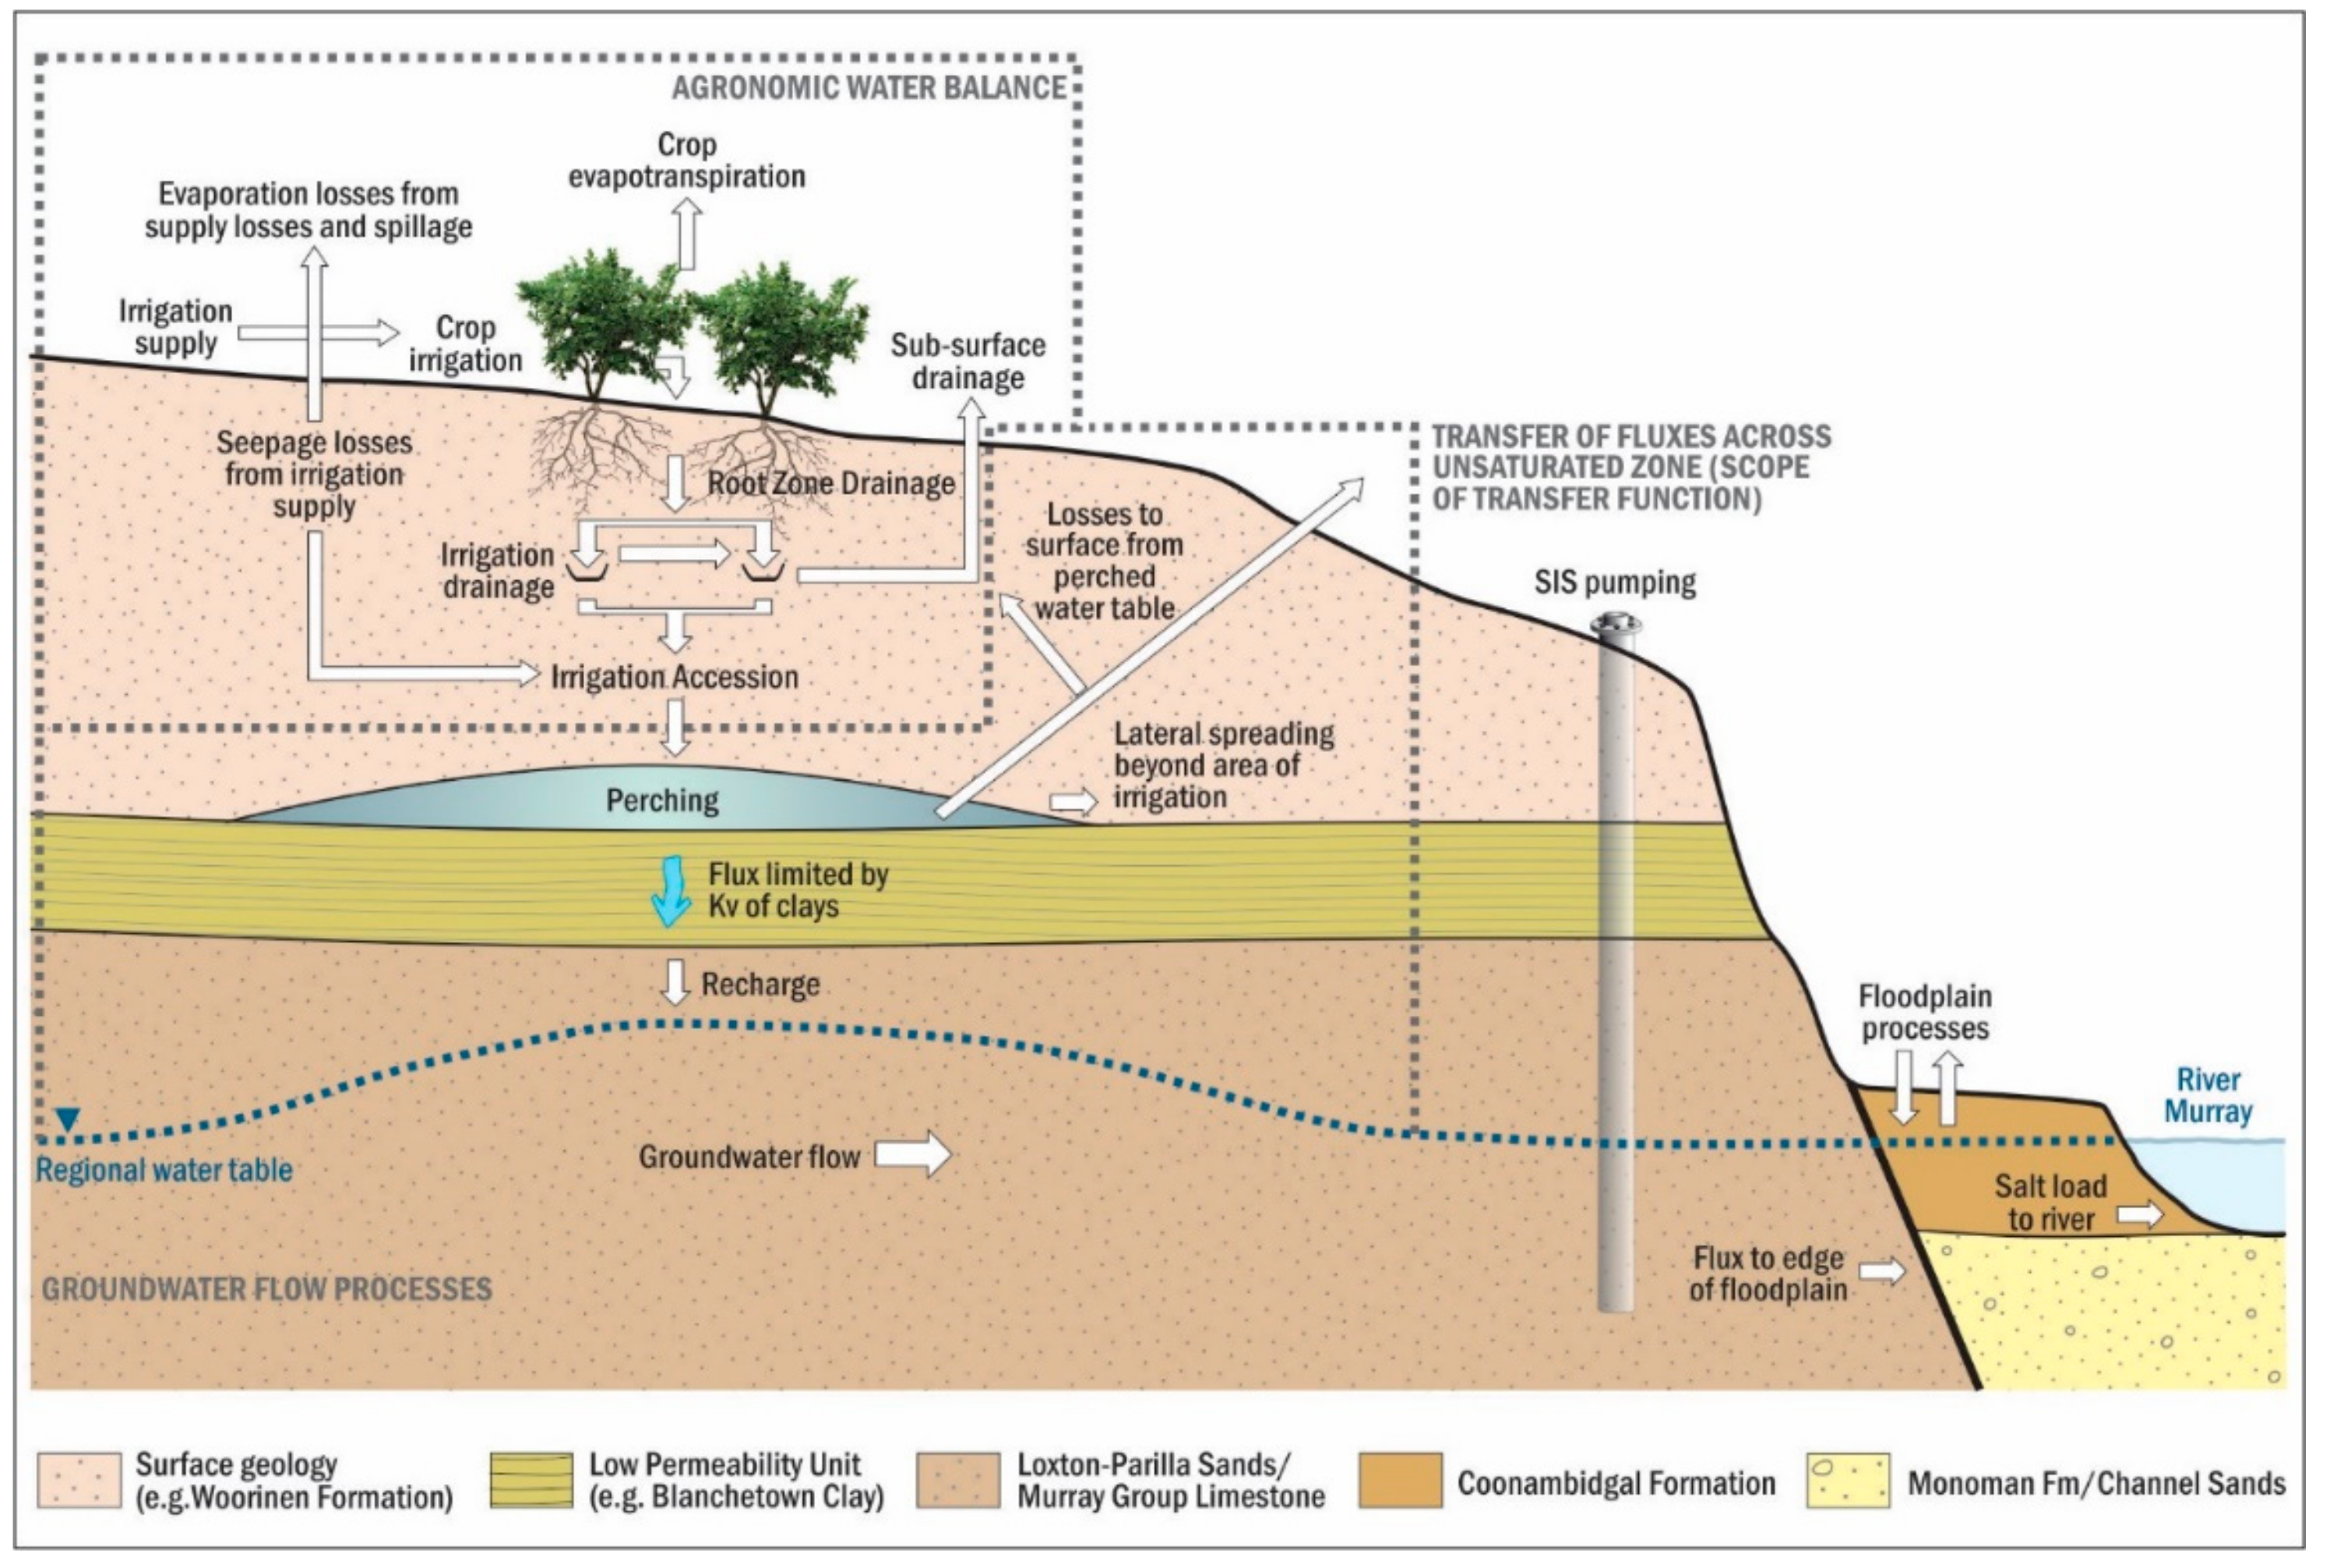
The higher recharge has led to the development of a groundwater mound within the Loxton Sands aquifer, resulting in increased salt loads to the river and the floodplain (see Figure 2). The lateral flow component from the Loxton Sands is thought to be the main mechanism for salt entering the floodplain and the river, and a network of dedicated pumping wells (a salt interception scheme, SIS) was installed in 2006 to actively reduce the groundwater returns to the river.
As illustrated in Figure 2, the quantum of irrigation recharge is the key driving force for groundwater returns, and there are numerous processes that can influence it. These can be separated into three domains: (1) an agronomic water balance (AWB) that occurs at the surface/rootzone and defines the rootzone drainage rate; (2) the deeper vadose zone where variably saturated conditions, including perching, occur; and (3) the saturated zone.
2.7. Existing Methods to Model Groundwater Returns
The salinity management framework requires that groundwater returns (and their salt loads) to the river be quantified over history and into the future on the basis of past and present actions that include irrigation development, the implementation of efficiency measures, and SIS pumping. A 3D MODFLOW groundwater model [30] has been developed for this purpose and is updated over time to provide more refined salt load estimates and to account for any changes in management or observed data [21,31]. The domain of the groundwater model is primarily that of the saturated zone shown in Figure 2.
Estimates of rootzone drainage are obtained from an AWB undertaken on a district-wide scale at annual intervals [26]. Inputs to the water balance are based on measured rainfall and irrigation diversions. Outputs are based largely on an assumed irrigation efficiency factor, which represents the percentage to total water applied that is consumed by crop evapotranspiration. The residual of the water balance is the rootzone drainage rate. It is a comparatively small term relative to the other components (which have large error bands) and is therefore highly uncertain, particularly in early time periods for which there are limited data. It is also heavily dependent on the irrigation efficiency factor used in the calculation.
Although the estimates of rootzone drainage are available, they have not been used directly by the groundwater model. This is due largely to the lack of a simple, yet appropriate, vadose zone modelling tool at the time of the groundwater model development that could simulate the influence of perching of the transfer of rootzone drainage to recharge.
The recharge rates have been derived using the inverse method in which observed groundwater level fluctuations and aquifer pumping test data are used to constrain the hydrogeological parameters so that recharge may be derived inversely during model calibration, which was undertaken manually. The spatial zonation of recharge is based initially on the timing of irrigation development. The zonation evolves during the inversion process and is not highly constrained. The recharge rates over the whole irrigation areas are compared to the root zone drainage rates post-calibration as a check that the rates derived are comparable, but there is significant spatial variability between recharge zones. Other datasets are used, wherever possible, to constrain the model, such as under-river geophysics and river salinity data.
The calibrated groundwater model is then used to predict groundwater returns and salt loads into the future for a range of management scenarios. Under these scenarios, a subjective recharge rate of 100 mm/year has been selected to simulate ongoing irrigation.
The existing method is logical but has some significant limitations related to (1) the non-uniqueness of the recharge–aquifer parameter relationship and its associated uncertainty, and (2) the indirect link between on-ground actions and the derived recharge rates. These limitations result in a model that does not use all of the datasets available to constrain it, and one that relies on a subjective approach for the recharge rates used in predicting of groundwater returns (and salt loads). As such, the method is susceptible to bias.
3. Methods
3.1. Modelling Approach
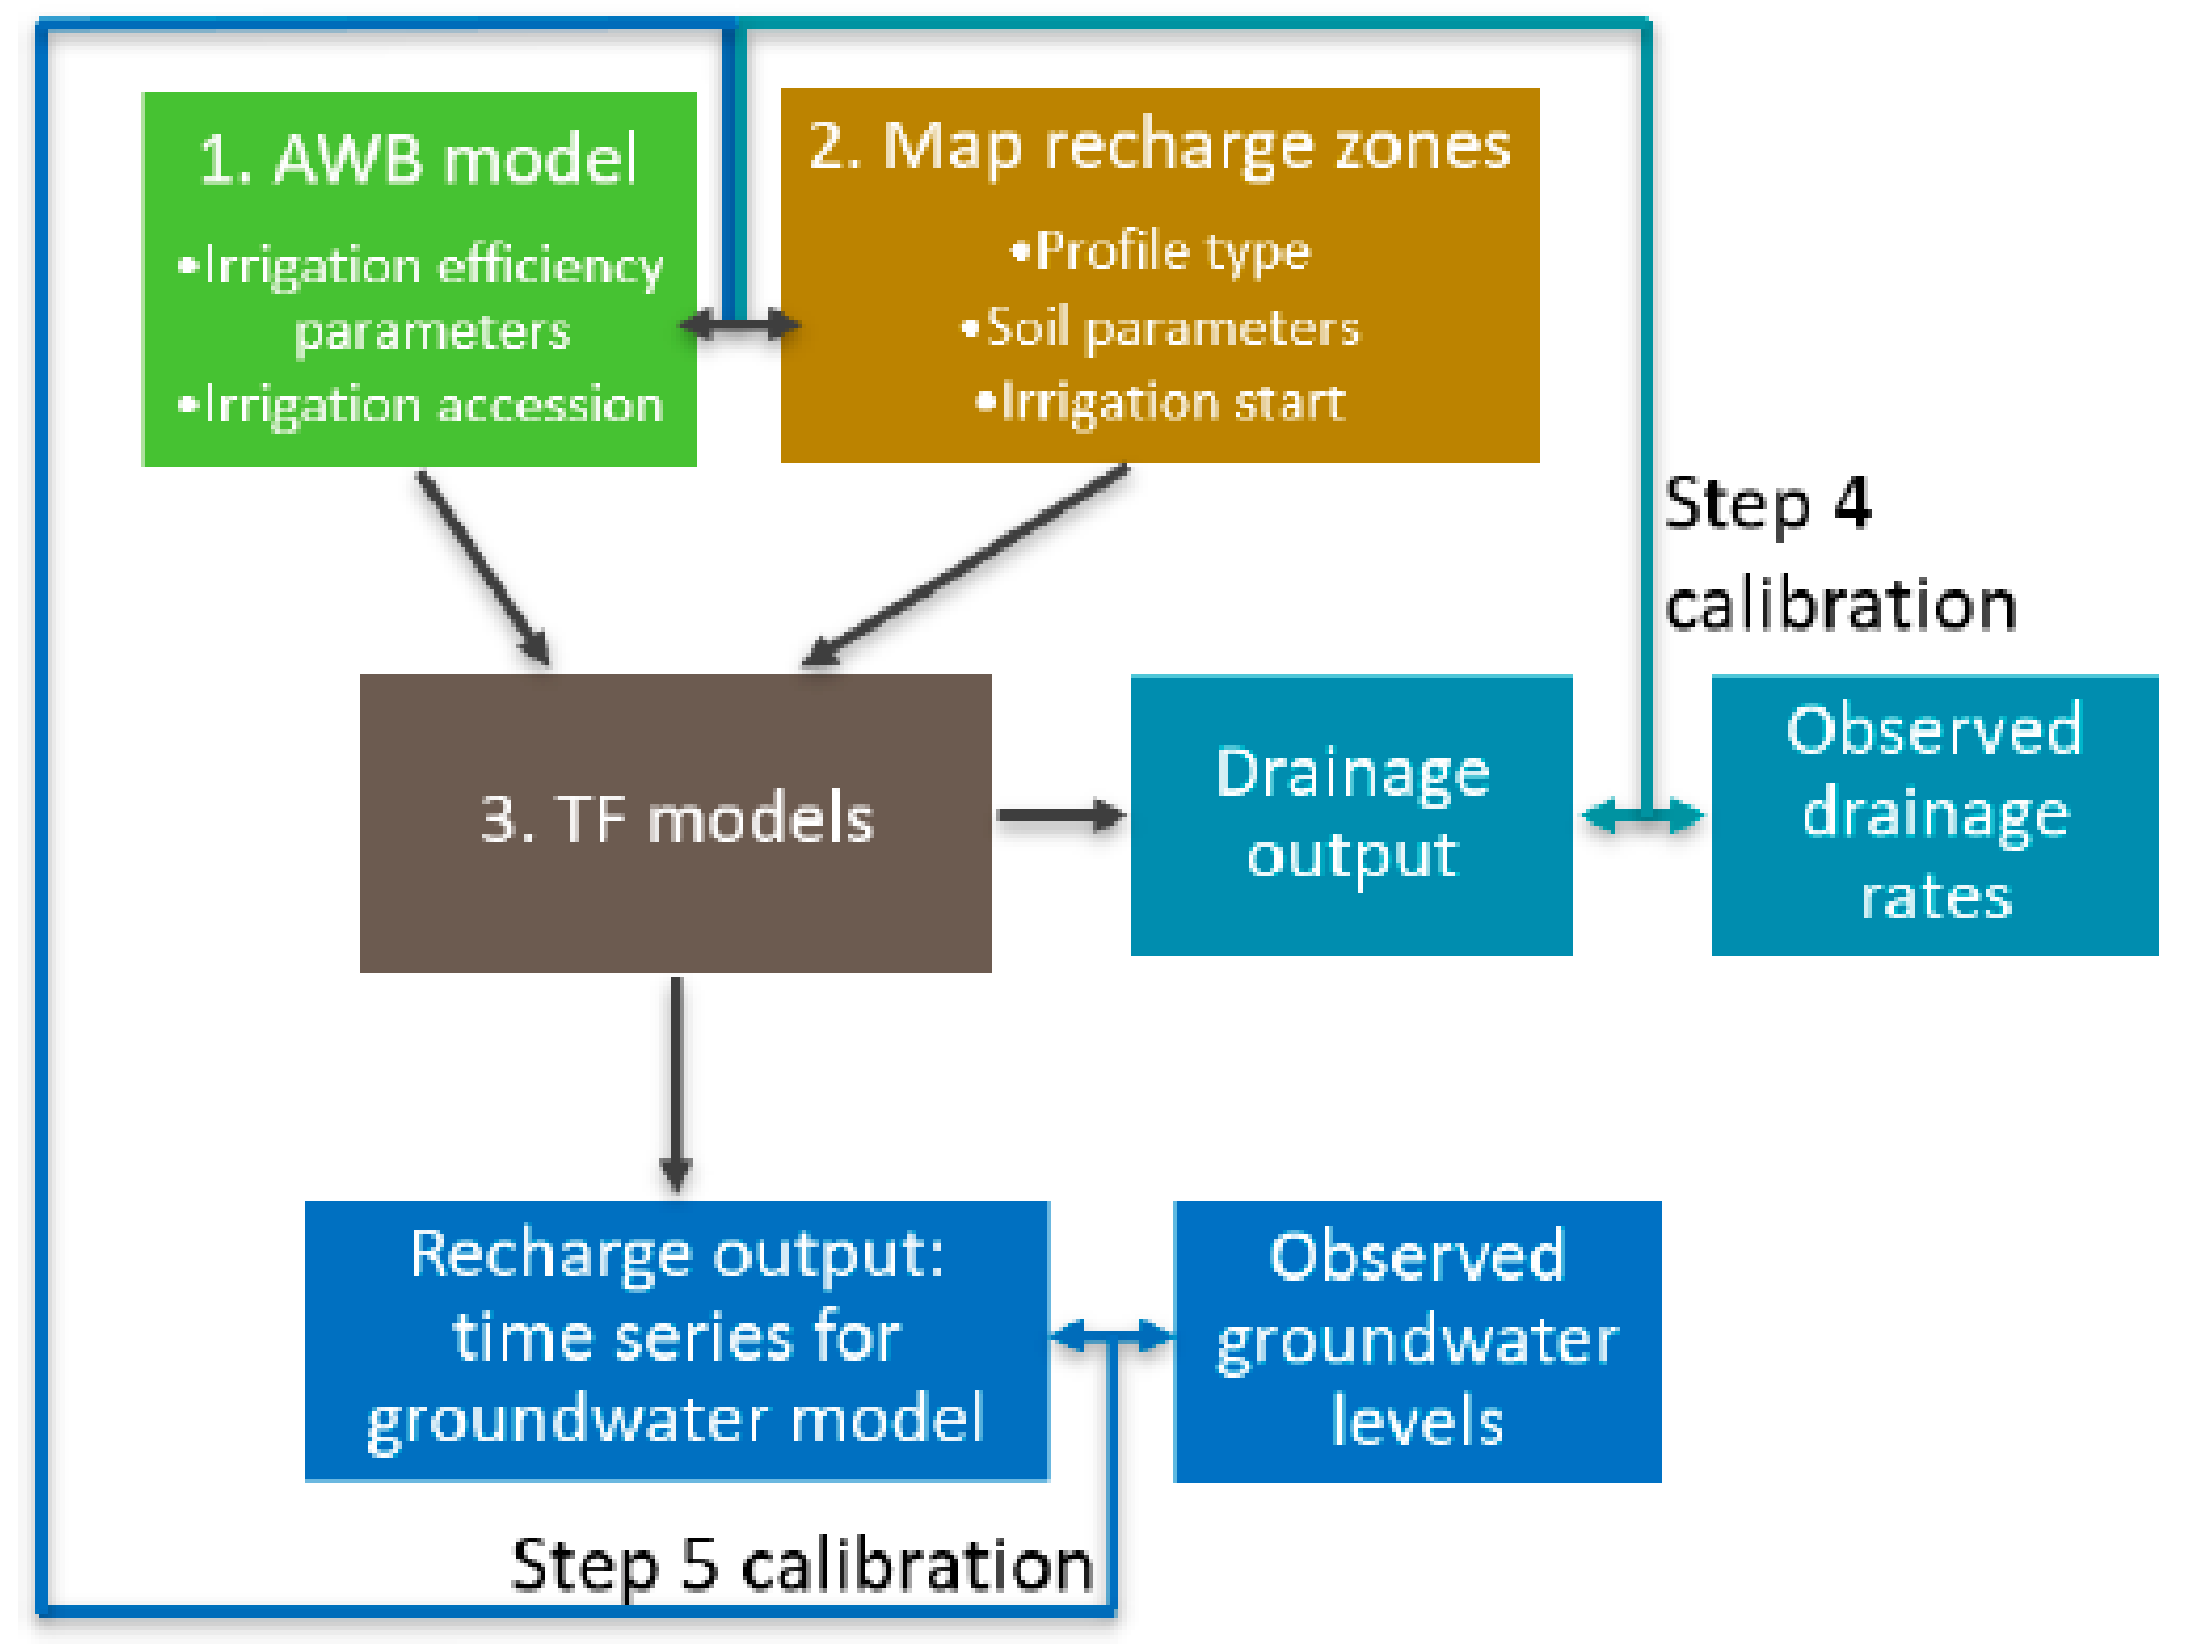
The development of vadose zone transfer functions by [22,23] has allowed for the development of a more integrated modelling method. The method, illustrated in Figure 3, includes three elements that correspond to the three domains of the conceptual model (Figure 2):
- The surface/rootzone is modelled by the AWB [26], which is applied spatially by using a systematic approach to recharge zonation, resulting in a time-varying rootzone drainage rate for each recharge zone.
- The deeper vadose zone is modelled by the transfer functions (TF) developed by [22,23]. The rootzone drainage rates are passed through transfer functions the resulting in two outputs: a time-varying drainage rate representing water that is returned to the surface via perching, and a time-varying irrigation recharge rate.
- The saturated zone is modelled by a groundwater flow model (a modified version of the existing Loxton–Bookpurnong model [21]) to generate groundwater returns and salt load to the river as an output.
The method links on-ground actions directly with predicted groundwater returns and provides for two separate calibration targets: the observed data on drainage rates and groundwater levels.
3.2. Agronomic Water Balance
The AWB, as described by [26], was used to estimate the total rootzone drainage volume across each irrigation district. Unlike [26], who used the observed CDS drainage data as part of the water balance, it was removed from the calculations and set aside to use as a calibration target. The water balance was thus reduced to the following equation,
where RZD is the root zone drainage volume across an entire irrigation district, P is the precipitation volume over the district (L3/L3), I is the total volume of irrigation water diverted to the district (L3/L3), and Eff is the irrigation efficiency factor (%), noting that other factors are included in the water balance during early time periods at Loxton to estimate seepage and transmission losses from open irrigation channels.
3.3. Recharge Zonation
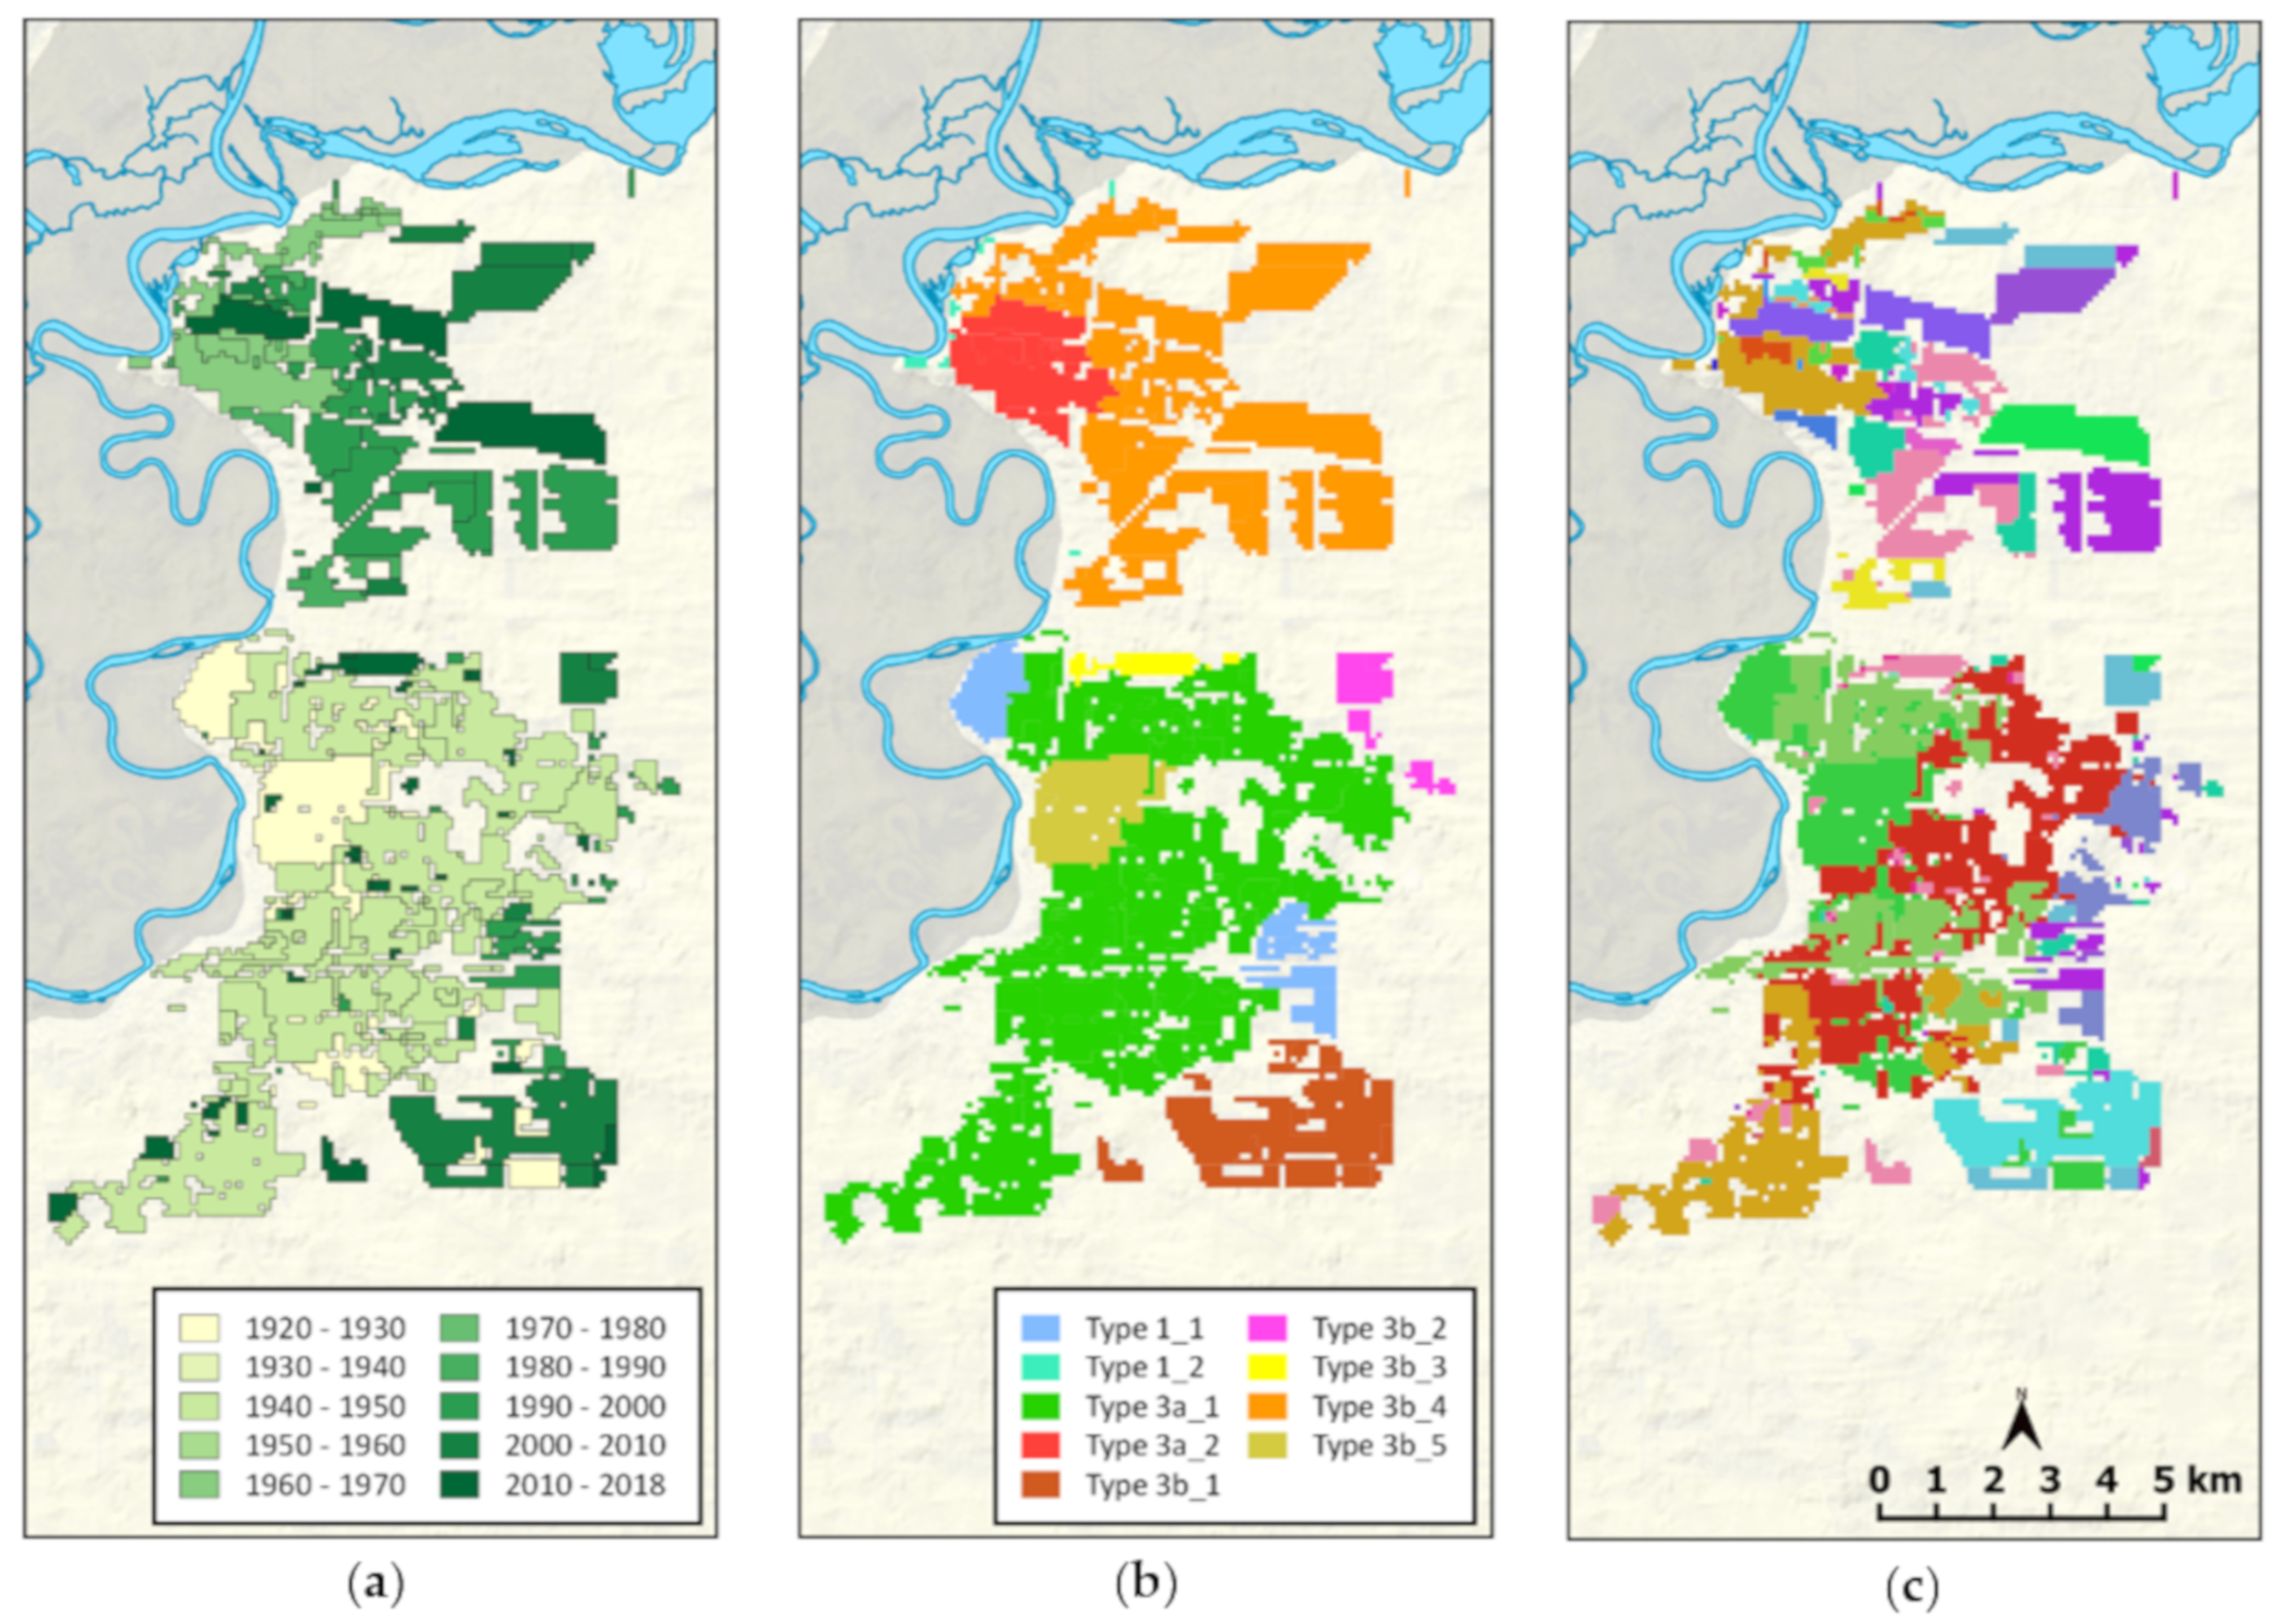
Recharge zones were defined according the year of irrigation development (Figure 4a) and the nature of the vadose zone underlying each irrigation block (Figure 4b). The various combinations of these two factors resulted in 335 recharge zones across both irrigation districts (Figure 4c).
The year of irrigation development was obtained from historical aerial imagery of the irrigation footprint. The vadose zone was classified into units and subunits using the available borehole logs and geological models. The classification relates to the type of vadose zone transfer function required and its parameterisation. If the Blanchetown Clay was absent, a single layer (loam) transfer function was used and sub-units defined the varying thicknesses of the vadose zone. If the Blanchetown Clay was present, then a three-layer (loam–clay–sand) transfer function model was required, and sub-units define the varying layer thicknesses at different points in the landscape. The three-layer zones were also coded by whether a drainage network had been installed or not. This distinction can be used as a calibration target.
3.4. Transfer Functions
The TF models representing a one-layer or three-layer model are described by [22,23]. The one-layer model represents a vadose zone where the clay layer is absent and therefore perching and a requirement for drainage does not occur. The input is the time-varying RZD and the output is the time-varying irrigation recharge rate. The three-layer model was defined to represent a vadose zone where perching may occur due to the presence of a clay layer. The input is the time-varying RZD and the output is the time-varying irrigation recharge rate along with a time varying drainage rate. The drainage occurs when a perched water table reaches the surface of the model.
Both models are parameterized using the modified Maulem–van Genuchten function [32]. The parameters used were based on measured soil water retention data of Mallee soils [33].
A scripting process was developed to run the AWB, distribute RZD across the various recharge zones, and to call and run the TF models for each zone.
3.5. Partial Calibration of Irrigation Recharge
A partial calibration of the AWB-TF models can be performed using drainage data. This calibration can occur externally to any groundwater modelling, and several aspects of the drainage data can be used to constrain the model outputs, as follows:
- Where drainage infrastructure is absent, the modelled drainage should be negligible.
- Where drainage infrastructure is present, the modelled drainage should be non-negligible.
- Where there is observed drainage data, this modelled drainage should approximate these trends.
In calibrating the models at Loxton and Bookpurnong, it was considered that two main parameters could be varied as part of the calibration:
- The irrigation efficiency parameter (Eff) at any point in time, which controls the total recharge and drainage output provided by the model.
- The vertical hydraulic conductivity (Kv) of the Blanchetown Clay, which controls the partitioning between recharge and drainage—a lower Kv leads to more perching and more drainage, a higher Kv leads to less perching and more recharge.
3.6. Groundwater Model and Integration of Transfer Function
Various options can be employed to integrate the AWB and TF models with a groundwater model. In this study, a staged integration was undertaken to assess the merits of the approach. We considered a base case and two potential methods that integrate the AWB and TF models with the groundwater model focusing on different calibration approaches (Table 1).
The base case (LB2011) is the existing Loxton–Bookpurnong groundwater model in MODFLOW from which recharge rates are derived inversely via manual calibration.
TF-A/B uses drainage data to calibrate the AWB and TF models and derived recharge rates that are passed to the groundwater model. The MODFLOW model is recalibrated in accordance with the revised irrigation recharge and the observed groundwater level data. In this instance, the AWB-TF model was calibrated manually and the MODFLOW model was calibrated using an automated calibration procedure incorporating the Parameter ESTimation code, PEST [34].
TF-C calibrates the integrated (AWB-TF-MODFLOW) model simultaneously using drainage and groundwater data. In this instance, the integrated model was calibrated using PEST, but a manual calibration process could also be applied.
4. Results
4.1. Drainage and Irrigation Recharge Using Partial Calibration
An initial calibration of the AWB-TF models was undertaken using drainage data. It was found that the Kv of the clay layer was well constrained by the drainage targets and only minor adjustments were required from the default value of 0.03 cm/day (109.5 mm/year) (Table 2). Non-negligible drainage rates would occur in areas where drainage infrastructure is absent when the Kv was decreased substantially from the default value. Any substantial increases to the Kv were constrained by the observed drainage data at Loxton.
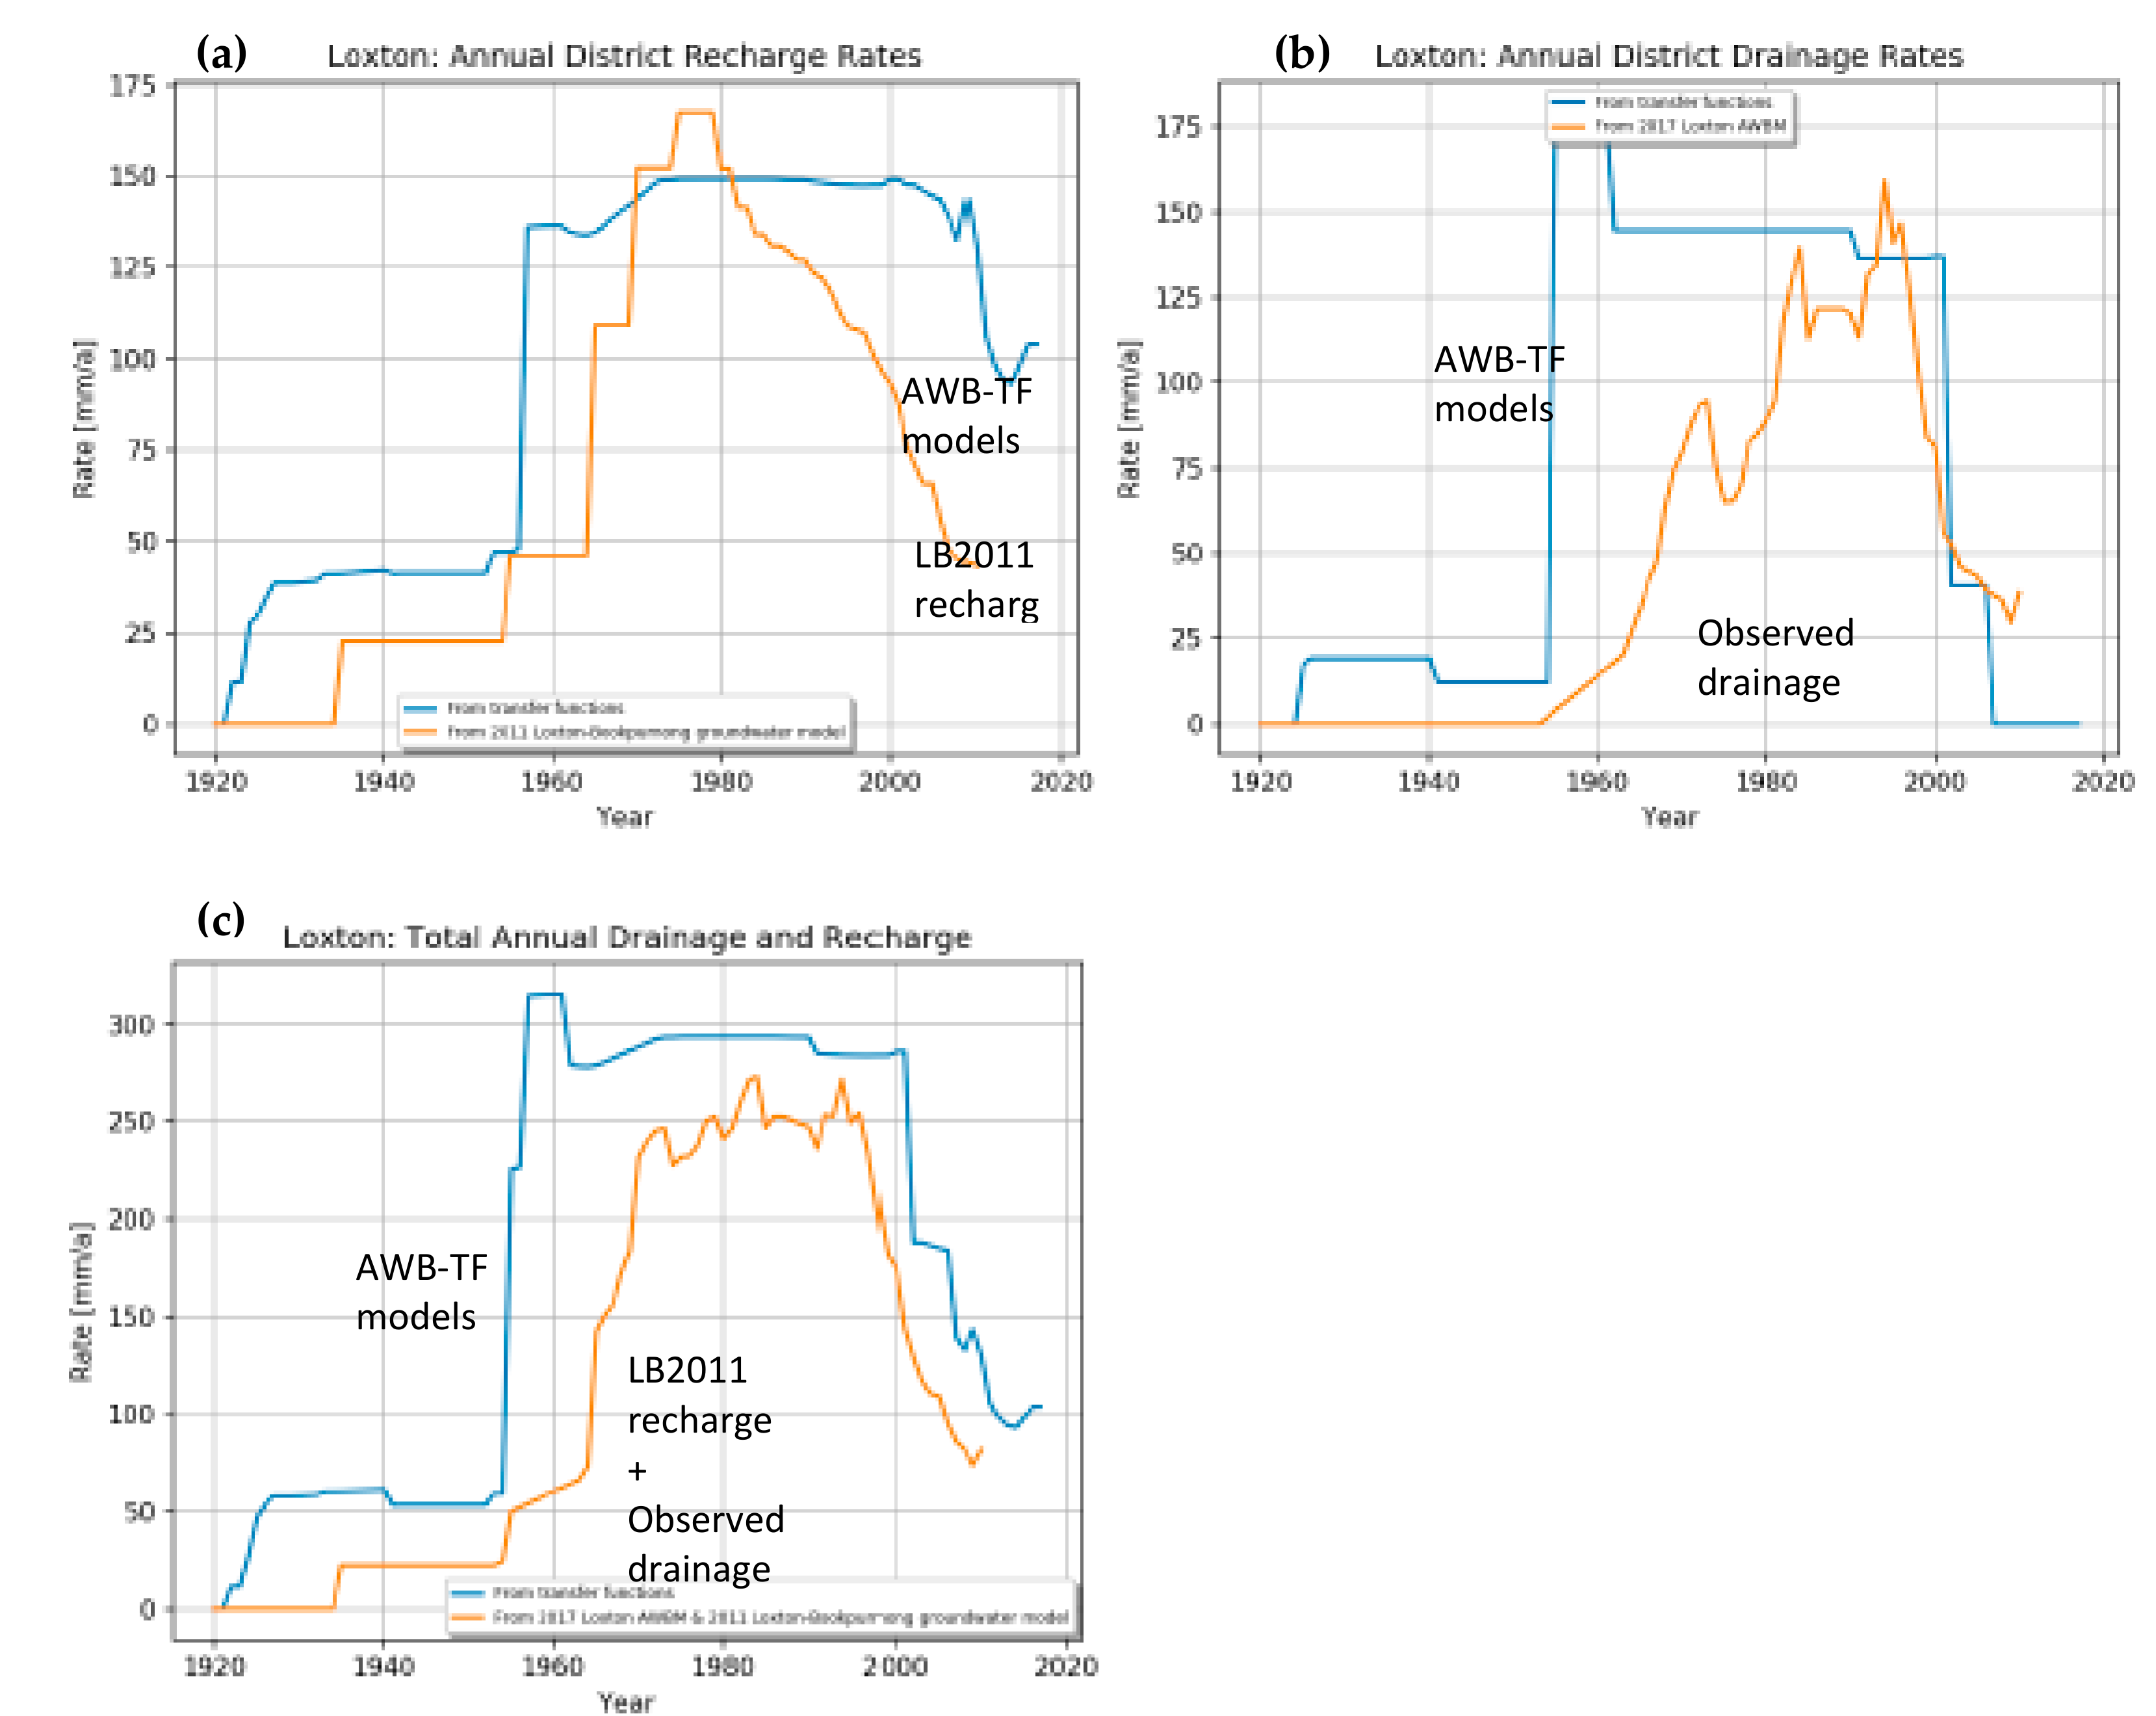
Figure 5 shows a comparison of the recharge and drainage rates derived from the existing methods and datasets to those derived by the new AWB-TF models developed. The AWB-TF models show recharge and drainage outputs that increased substantially in the late 1950s, reflecting the main period of irrigation development and accounting for a short time lag (<5 year), a period of stabilisation between 1960 and 2000, and a decline post-2000 as irrigation efficiency measures were introduced. The calibration focused on the period of late 1990s onwards, as this was where there was more confidence in the available datasets.
When recharge and drainage were combined, the outputs of the AWB-TF models compared reasonably to the combined LB2011 recharge and observed drainage rates (Figure 5c). However, there was divergence in the 1960–2000 period when recharge and drainage were considered separately. The LB2011 model had recharge declining from 1980 onwards at a period when drainage rates were increasing. This is counter-intuitive because if drainage rates were increasing then it would be expected that recharge was also increasing or was at least stable. It may be the result of the regional groundwater mound being intercepted by the drainage infrastructure and the LB2011 model needing to reduce recharge to account for this. Although this is possible, the LB2011 model does not model these processes explicitly, nor does its documentation describe these circumstances as the justification for reducing recharge over a period when drainage was increasing. In contrast, the AWB-TF model estimates gross recharge, and if the interception of the regional groundwater mound is occurring then it can be modelled explicitly by the groundwater model. As shown in this example, the new approach provides a much clearer representation of the irrigation actions affecting groundwater recharge, ultimately creating transparency in the estimation of salinity impacts to the river.
4.2. Comparison of Integrated Models
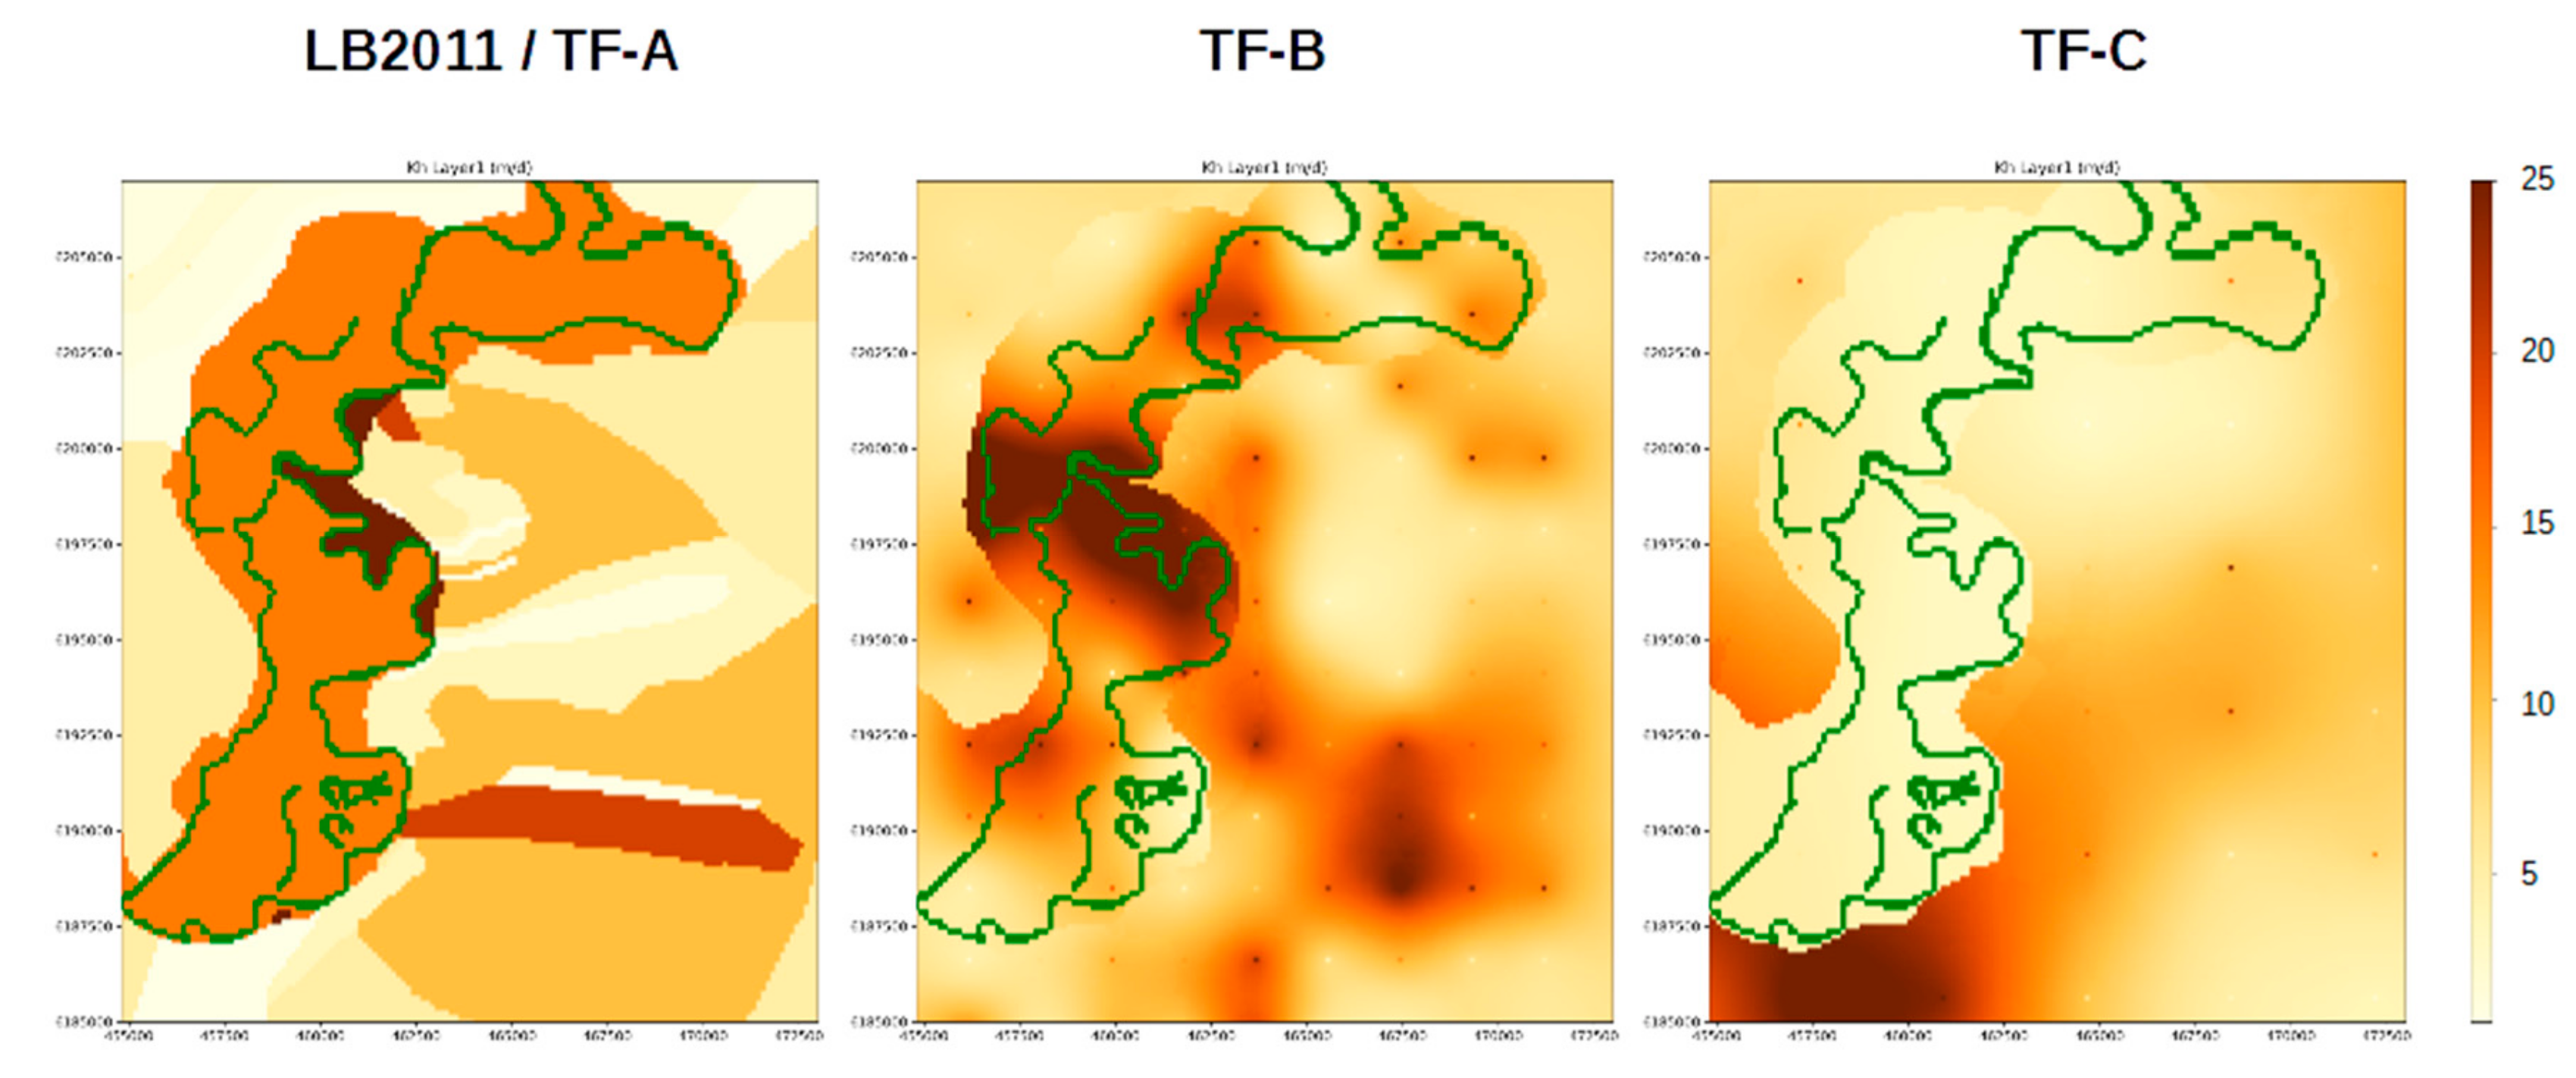
The integrated models obtained comparable calibration statistics to the existing method. The scaled residual mass statistic (SRMS) was 1.6% for the LB2011 model, 1.8% for TF-A/B, and 1.7% for TF-C. The calibrated horizontal hydraulic conductivities, Kh, of the regional water table aquifer are shown in Figure 6. The spatial distribution of Kh under TF-B was broadly similar to LB2011. Given that the conductivity field of TF-B was derived independently of LB2011, this provides some confidence in the new method.
In TF-C, a zone of high Kh was derived in the south of the model domain, which was not replicated by the other models. Closer inspection revealed a complication in this area of the model, with simultaneous calibration of drain conductance and efficiencies in the AWB, whereby greater recharge could be produced by the transfer function only to be offset by increases to drainage conductance in the MODFLOW model. This was a product of the automated calibration procedure, and further work is required to mitigate this effect, but this complication is not reflective of the integrated modelling approach being tested.
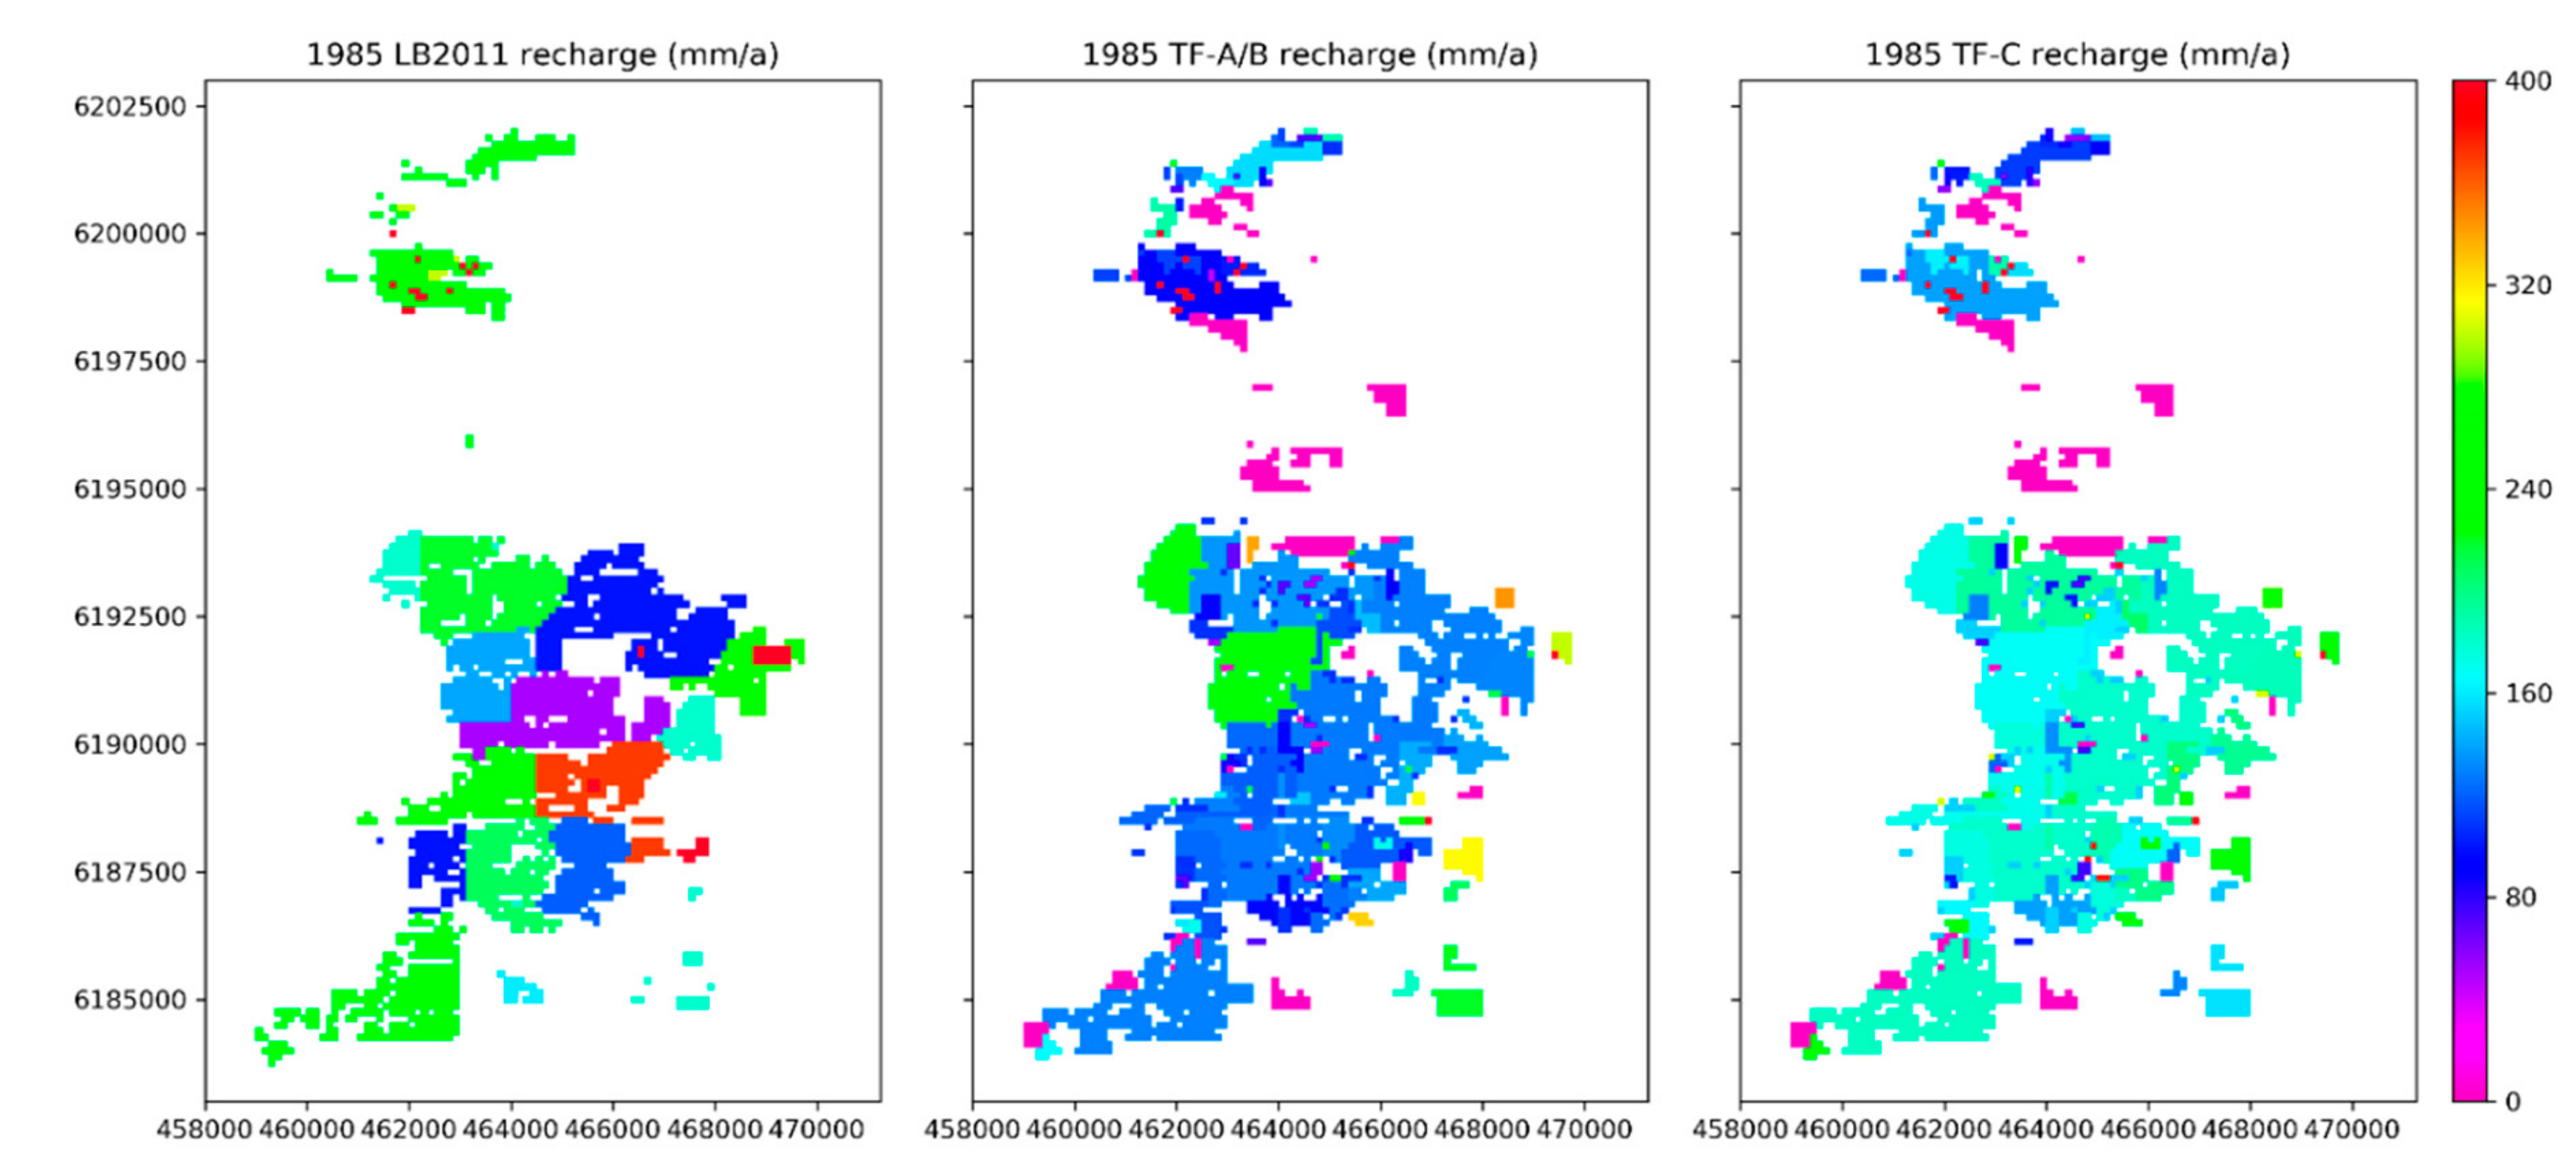
There were some key differences in how irrigation recharge was distributed in space and time. The inclusion of the AWB-TF components to the modelling tended to minimize the spatial variability in recharge rates, which could be considerable in the existing method (Figure 7). The recharge rates of the integrated models were also more stable temporally (see Figure 5a).
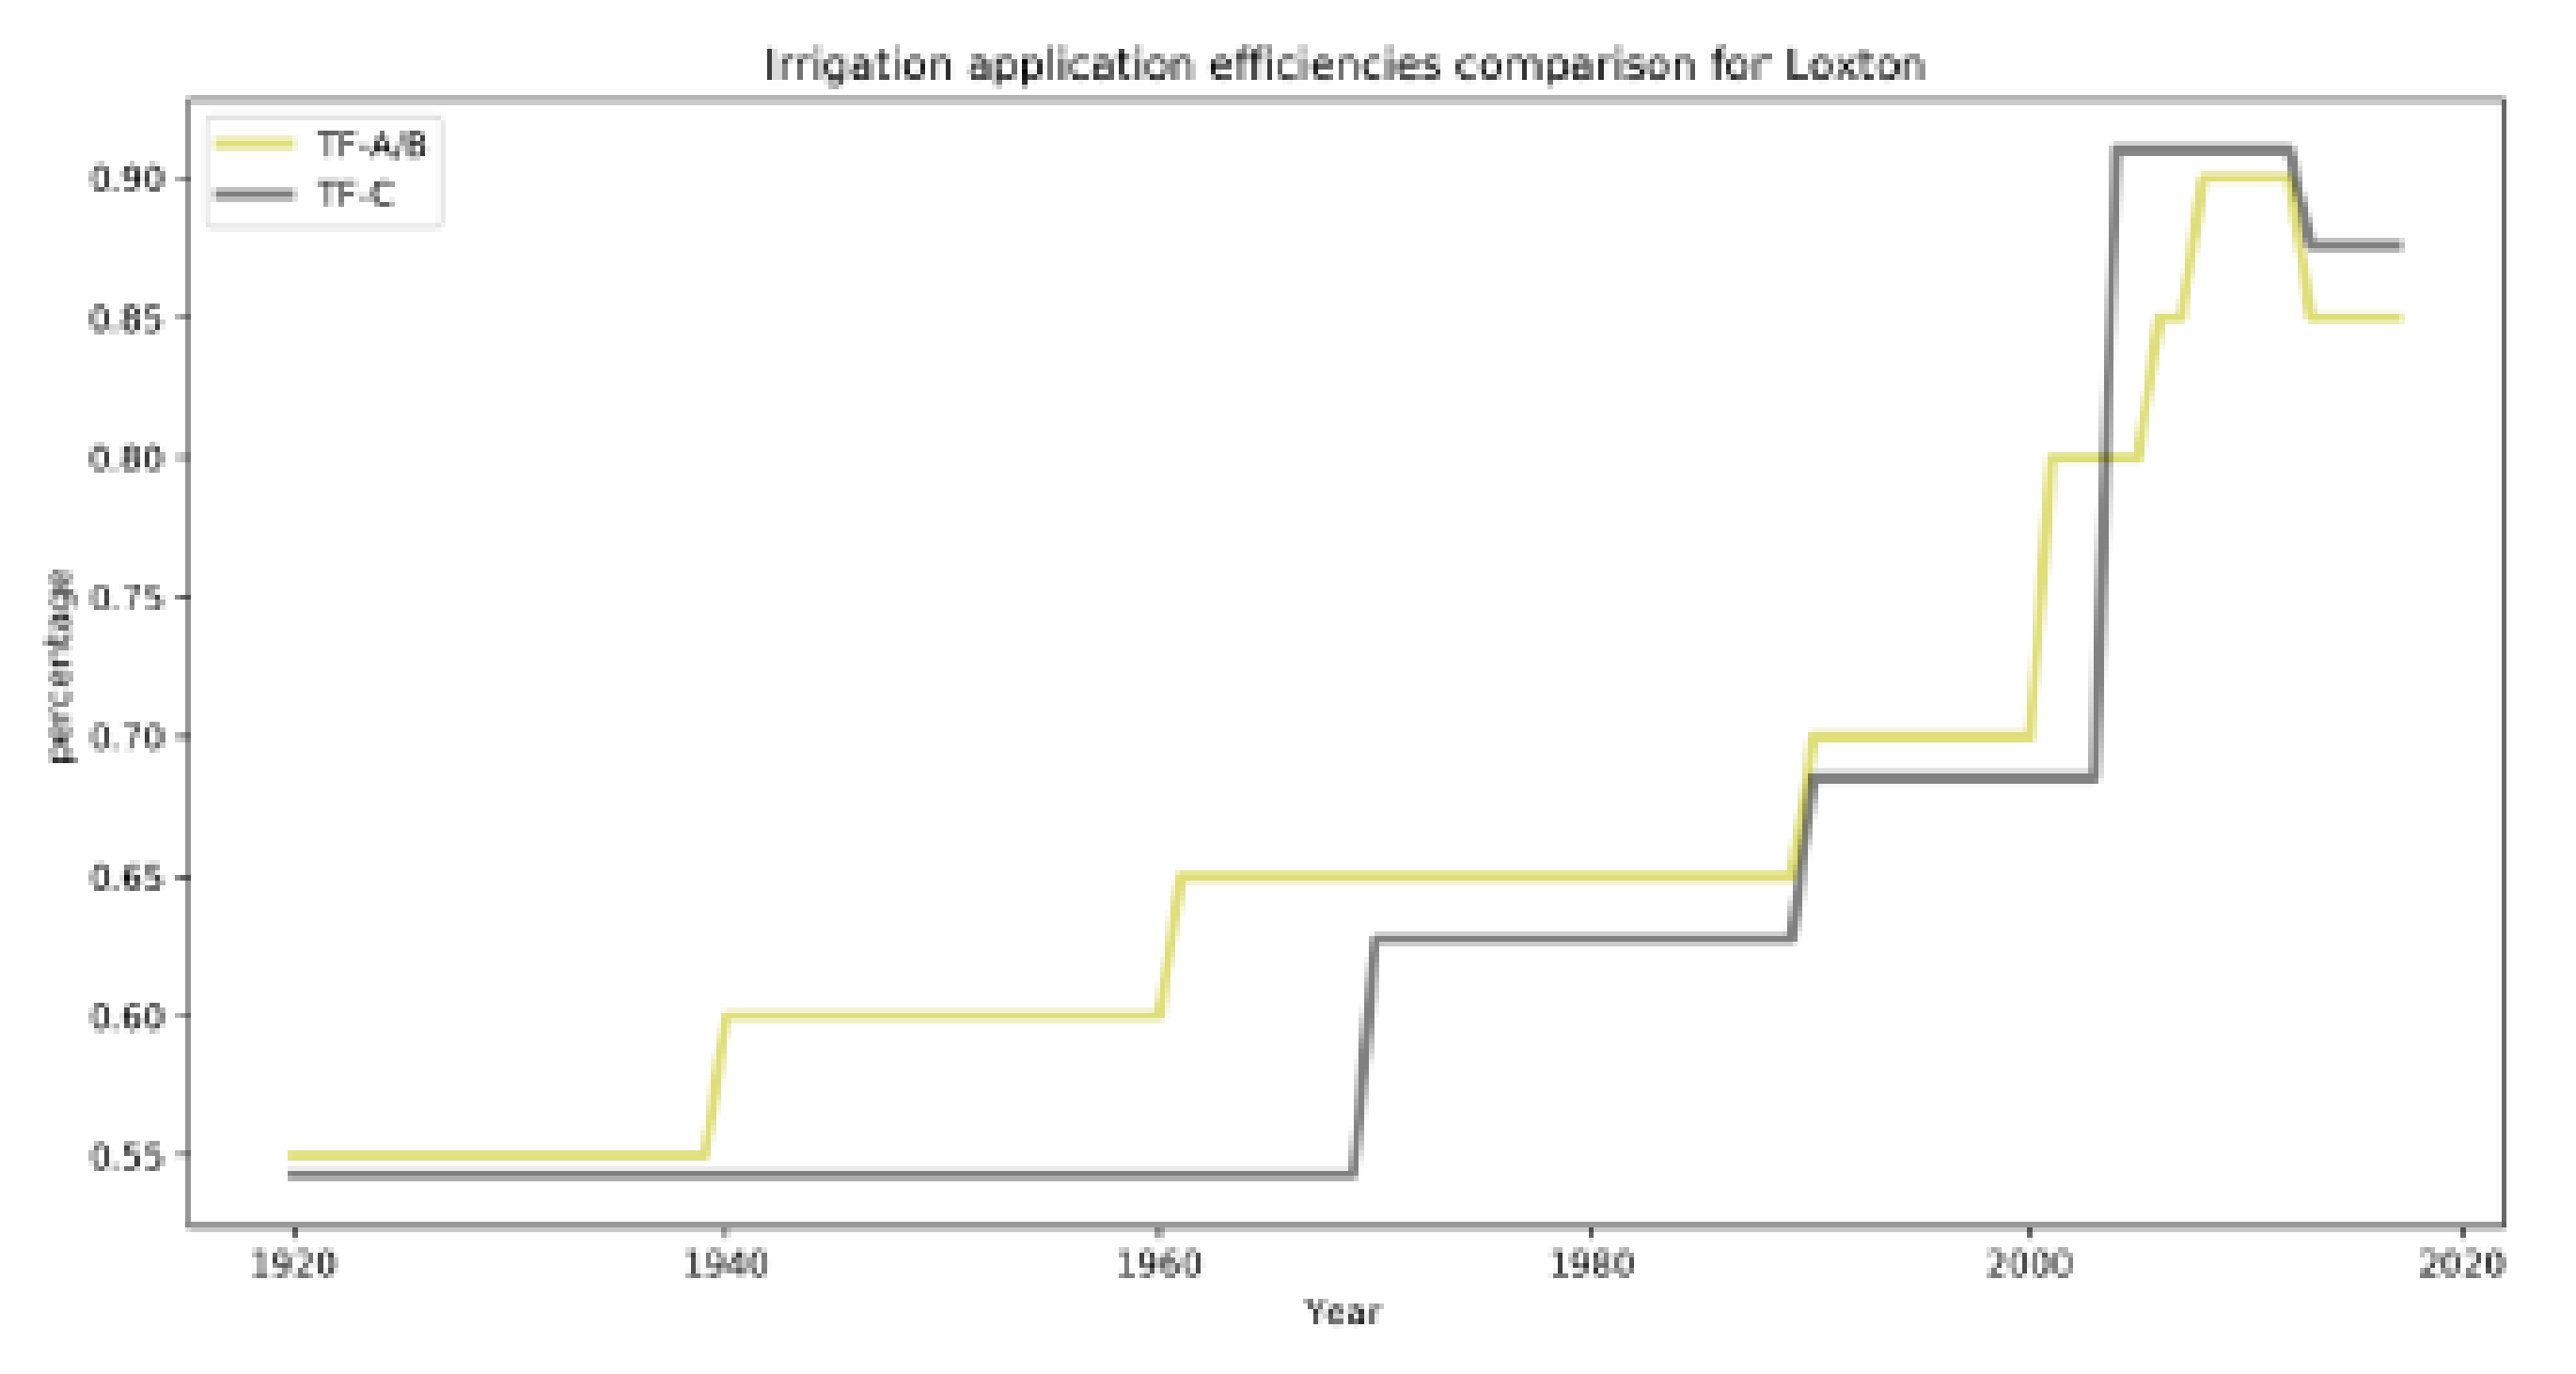
Figure 8 compares the irrigation efficiency factor (Eff) used in the integrated models. In the TF-A/B model, Eff was taken from the default values of [26] and was not varied during the calibration, whereas in TF-C it was varied as part of the calibration. The recharge rates and estimated groundwater returns can be quite sensitive to Eff, and the large increase in the early 2000s was coincidental with the pressurisation of the irrigation supply system at Loxton.
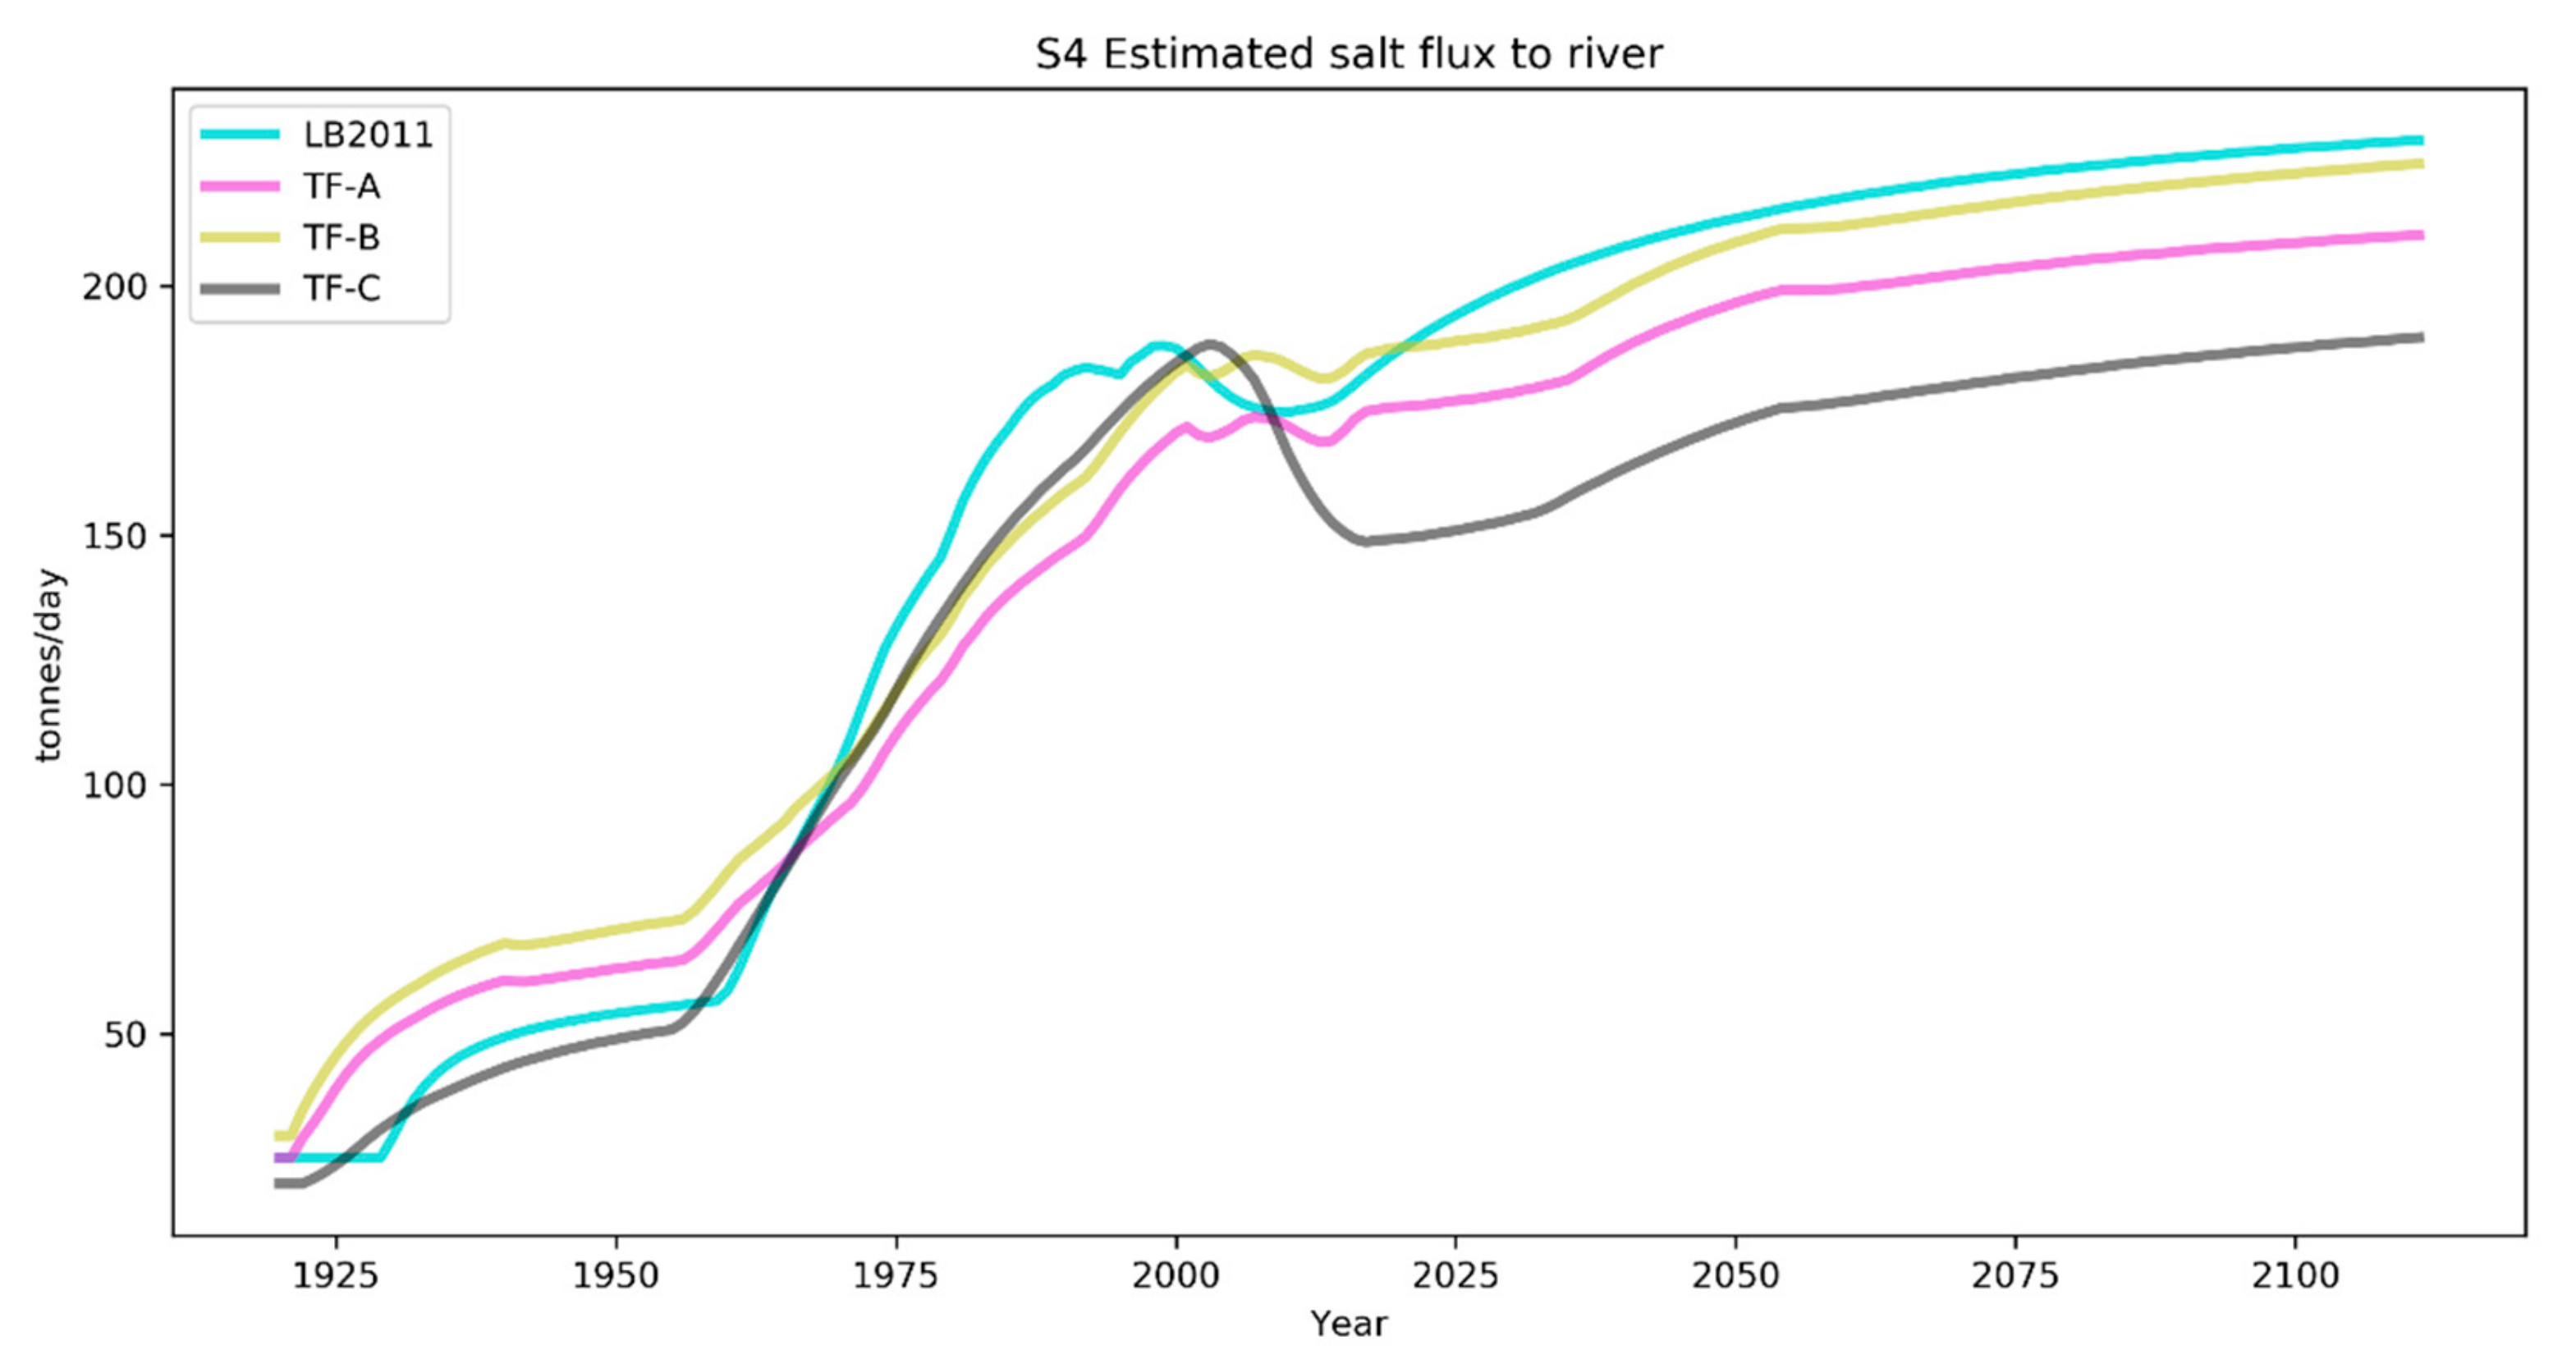
Figure 9 shows the projected salt flux to the river for the different models used. It is highest under the existing method.
The integrated approach offers a transparent method of determining an appropriate recharge rate for estimating future salinity impacts. The basis of the method is to set the irrigation accession rate in accordance with the AWB and calibrated irrigation efficiency for 2011, and to run this into the future. By comparison, the existing methods subjectively select 100 mm/year as the recharge rate into the future on the basis of expert opinion rather than local datasets.
For TF-A/B, the continued Eff was 85% for both districts. For TF-C, the Eff was only adjusted slightly (87% for Loxton and 83% for Bookpurnong) but its sensitivity was such that small changes can result in large changes to the RZD. For instance, at Loxton, an adjustment in Eff from 85% to 83% resulted in a 13% decrease in the RZD (from 129 to 112 mm/year). This influenced the projected groundwater returns and shows the importance of having an objective procedure to calibrate Eff.
5. Discussion
5.1. Benefits of The Integrated Modelling Approach
For the irrigation areas with deep vadose zones in which perching can occur, the only viable approach before the development of the TF models was an inverse approach in which the aquifer conductivity values and then recharge values were inferred (with some limited adjustments of conductivity) on the basis of observed groundwater responses [21]. The integrated modelling approach clearly addresses a deficiency of the inverse approach, namely, not being able to transparently link actions to salt load impacts. In addition, the inverse method requires a complex process for calibrating recharge over many zones and stress periods, and may have few other datasets to constrain what is a non-unique problem. A careful logic and many groundwater model runs are required to provide sensible values. The integrated modelling approach is simpler than this because it is objectively formulated.
The results demonstrate the impact that recharge input values in a groundwater model has on the salt flux to river estimates used for register entries. Given a scenario where there is limited data to constrain recharge values, use of the integrated method provides some means to quantify the reduction in uncertainty of recharge estimates via automated calibration software. There is presently no method to fully quantify reductions to uncertainty using manual calibration. Adopting the transfer function for future assessment promotes transparency and repeatability of the modelling approach. Moreover, it will promote consistency between groundwater models used for other irrigation areas by reducing subjectivity of the calibration process.
5.2. Limitations of the Integrated Modelling Approach
The trial demonstrated that the integrated model may require an increase in model development time. The extent of the increase will be dependent on the modeller’s familiarity with a scripting language such as Python and/or an automated calibration utility such as PEST.
Initially, the method will require time and effort to upskill users and to incorporate routinely into current workflow. However, this additional cost will reduce over time once the approach and the linking script are developed for a particular model.
A lack of data may still affect the success of applying the integrated approach. Drainage data for the Loxton district provided some constraint on the outputs of both the AWB and transfer function in this trial. In addition, attempts to minimize the difference between simulated drainage in the AWB and transfer function provided a further constraint on the calibration of irrigation application efficiencies and clay conductance.
Access to high performance computing is also strongly recommended if the integrated approach is to be used with automated calibration.
5.3. Recommendations
Despite the success of the trial implementing the integrated modelling approach, further areas of investigation are required and include:
- Further testing of ways to optimise the AWB and transfer function parameters to produce recharge trends that better match observed head variation patterns. Use of more discrete time periods within the AWB is one option.
- The development of scripting processes to simulate the deactivation of irrigation blocks.
- Development of transfer function models for situations where there are multiple clay layers in the vadose zone.
6. Conclusions
Irrigation areas have a complex history (spatially and temporally) with respect to the timing of irrigation development, water use efficiency, drainage, climate, and crop type, among other factors. This complexity can lead to a lack of transparency, obscure interpretation, and require additional resources and skills to represent it appropriated within a modelling framework. Any new methodology has to ensure that it does not add to the complexity of prior approaches and it must be widely applicable. Our development of the transfer function and integrated modelling was cognisant of these considerations. It attempted to simulate the transmission of the unsaturated zone with as few parameters as possible. It implemented a flexible method that can be applied in other semi-arid environments where there is a deep vadose zone. It makes use of existing datasets and attempts to use all of these datasets more thoroughly to calibrate and constrain the model outputs.
This paper described an integrated methodology for the estimation of groundwater returns to streams from irrigation areas with deep vadose zones and perched water tables. This methodology was implemented for an irrigation district in south-eastern Australia, adjacent to the lower reaches of the River Murray. An existing surface water balance model and the spatial distribution of the historical irrigation development were used to assess irrigation accessions to the unsaturated zone. A recently developed unsaturated zone model [22,23] estimated the groundwater recharge from the irrigation accession. Two different implementations of a groundwater model using these data were compared to a pre-existing groundwater model by using recharge calibrated using groundwater responses. In the first implementation, the newly estimated recharge values replaced the recharge values in the pre-existing model, that is, the saturated zone properties were the same. In the second implementation, a new set of saturated zone parameters were calibrated.
The study has shown that
- The implementation of the integrated methodology requires some additional data (drainage information, high quality maps of irrigation development, soil maps). However, the pilot study showed that many of these could be either accessed or generated within a constrained time.
- The drainage information could be used to constrain the main soil parameters.
- The irrigation accession, unsaturated zone model, and the recharge data layers were linked through Python scripting. Due to variations between irrigation districts and available data, some changes in the script will be generally be required.
- Recharge data generated by the unsaturated zone model can readily replace those generated by the arduous inversion process, while providing greater transparency.
- The calibration of aquifer conductivity, using the new recharge data, generates credible parameters, even without the use of pump tests and other independent information.
Further work is required to optimize the calibration methodology, standardise scripting approaches, and test the method in other vadose zone settings.
Author Contributions
Conceptualization, G.W.; data curation, D.C., T.L., and K.B.; formal analysis, D.C., T.L., G.W., and T.S.; funding acquisition, D.C. and J.W.; investigation, D.C., T.L., G.W., and T.S.; methodology, D.C., T.L., and G.W.; project administration, D.C.; software, T.L., G.W., and T.S.; supervision, G.W. and J.W.; writing—original draft, D.C.; writing—review and editing, G.W. and J.W. All authors have read and agreed to the published version of the manuscript.
Funding
The authors would like to thank the Murray-Darling Basin Authority (MDBA) and the Department of Environment and Water, South Australia (DEW), for funding support.
Acknowledgments
The authors would like to thank and acknowledge Emmanuel Xevi for his support throughout this work program, and Hugh Middlemis, Ray Evans, and Prathapur for technical advice.
Conflicts of Interest
The authors declare no conflict of interest.
References
- Wang, Q.J.; Walker, G.; Horne, A. Potential Impacts of Groundwater Sustainable Diversion Limits and Irrigation Efficiency Projects on River Flow Volume under the Murray-Darling Basin Plan.: An. Independent Review; Report Written for the MDBA; University of Melbourne, MDBA: Canberra, Australia, 2018; 73p. [Google Scholar]
- Perry, C. Efficient irrigation; inefficient communication; flawed recommendations. Irrig. Drain. 2007, 56, 367–378. [Google Scholar] [CrossRef]
- Meals, D.W.; Dressing, S.A.; Davenport, T.E. Lag time in water quality response to best management practices: A review. J. Env. Q. 2010, 39, 85–96. [Google Scholar] [CrossRef] [PubMed]
- Williams, J.; Grafton, R.Q. Missing in action: Possible effects of water recovery on stream and river flows in the Murray–Darling Basin, Australia. Australas. J. Water Resour. 2019, 23, 78–87. [Google Scholar] [CrossRef] [Green Version]
- Cook, P.G.; Jolly, I.D.; Walker, G.R.; Robinson, N.I. From drainage to recharge to discharge: Some timelags in subsurface hydrology. Developments in Water Science 2003, 50, 319–326. [Google Scholar]
- Khan, S.; Rana, T.; Carroll, J.; Wang, B. Managing Climate, Irrigation and Ground Water Interactions using a Numerical Model.: A Case Study of the Murrumbidgee Irrigation Area; CSIRO Land and Water Technical Report No. 13/04; CSIRO: Canberra, Australia, 2004. [Google Scholar]
- Kurtzman, D.; Scanlon, B.R. Groundwater Recharge through Vertisols: Irrigated Cropland vs. Natural Land, Israel. Vadose Zone J. 2011, 10, 662–674. [Google Scholar] [CrossRef]
- Besbes, M.; de Marsily, G. From infiltration to recharge: Use of a parametric transfer function. J. Hydrol. 1984, 74, 271–293. [Google Scholar] [CrossRef]
- Mattern, S.; Vanclooster, M. Estimating travel time of recharge water through a deep vadose zone using a transfer function model. Environ. Fluid Mech. 2010, 10, 121–135. [Google Scholar] [CrossRef]
- Wang, X.S.; Ma, M.-G.; Li, X.; Zhao, J.; Dong, P.; Zhou, J. Groundwater response to leakage of surface water through a thick vadose zone in the middle reaches area of Heihe River Basin, in China. Hydrol. Earth Syst. Sci. 2010, 14, 639–650. [Google Scholar] [CrossRef] [Green Version]
- Bouwer, H. Effect of Irrigated Agriculture on Groundwater. J. Irr. Drain. Eng. 1987, 113. [Google Scholar] [CrossRef]
- Orr, B.R. A transient numerical simulation of perched groundwater flow at the test reactor area, Idaho National Engineering and Environmental Laboratory, Idaho, 1952–1994; U.S. Geological Survey: Reston, VA, USA, 1999; pp. 99–4277. [Google Scholar]
- Truex, M.J.; Oostrom, M.; Carroll, K.C.; Chronister, G.B. Perched-Water Evaluation for the Deep Vadose Zone Beneath the B, BX, and BY Tank Farms Area of the Hanford Site; Pacific Northwest National Laboratory: Richland, WA, USA, 2013; p. 99352. [Google Scholar]
- Oostrom, M.; Truex, M.J.; Carroll, K.C.; Chronister, G.B. Perched-water analysis related to deep vadose zone contaminant transport and impact to groundwater. J. Hydrol. 2013, 505, 228–239. [Google Scholar] [CrossRef]
- Weiss, M.; Gvirtzman, H. Estimating Ground Water Recharge using Flow Models of Perched Karstic Aquifers. Groundwater 2007, 45, 761–773. [Google Scholar] [CrossRef] [PubMed] [Green Version]
- Jolly, I.D.; Cook, P.G.; Allison, G.B.; Hughes, M.W. Simultaneous water and solute movement through unsaturated soil following an increase in recharge. J. Hydrol. 1989, 111, 391–396. [Google Scholar] [CrossRef]
- Rossman, N.R.; Zlotnik, V.A.; Rowe, C.M.; Szilagyi, J. Vadose zone lag time and potential 21st century climate change effects on spatially distributed groundwater recharge in the semi-arid Nebraska Sand Hills. J. Hydrol. 2014, 519, 656–669. [Google Scholar] [CrossRef] [Green Version]
- Wang, L.; Wu, J.Q.; Hull, L.C.; Schafer, A.L. Modeling Reactive Transport of Strontium-90 in a Heterogeneous, Variably Saturated Subsurface. Vadose Zone J. 2010, 9, 670–685. [Google Scholar] [CrossRef]
- Kendy, E.; Bredehoeft, J.D. Transient effects of groundwater pumping and surface-water-irrigation returns on streamflow. Water Resour. Res. 2006, 42. [Google Scholar] [CrossRef]
- Aquaterra. Sunraysia Sub-Regional Groundwater Flow Model (EM2.3). Final Report; Report Prepared for Goulburn-Murray Water and Murray-Darling Basin Authority; MDBA: Canberra, Australia, 2009. [Google Scholar]
- Yan, W.; Li, C.; Woods, J. Loxton–Bookpurnong Numerical Groundwater Model; DFW Technical Report 2011/22; Government of South Australia: Adelaide, Australia, 2011; Volume 1: Report and Figures. [Google Scholar]
- Walker, G.R.; Currie, D.; Smith, T. Modelling recharge from irrigation developments with a perched water table and deep unsaturated zone. Water 2020. (under review). [Google Scholar]
- Walker, G.R.; Currie, D.; Smith, T. Modelling the effect of efficiency measures and increased irrigation development on groundwater recharge through a deep vadose zone. Water 2020. (under review). [Google Scholar]
- Murray-Darling Basin Authority. Basin Salinity Management 2030, BSM2030; MDBA Publication: Canberra, Australia, 2015. [Google Scholar]
- Adams, A.; Meissner, T. How Efficient Are We? A report on Water Use Efficiency in the South Australian Murray-Darling Basin; Department of Water, Land and Biodiversity Conservation, Government of South Australia: Adelaide, Australia, 2010. [Google Scholar]
- Meissner, T. Estimation of Accession for Loxton and Bookpurnong Irrigation Areas; Report prepared for the Department for Environment and Water; Government of South Australia: Adelaide, Australia, 2019. [Google Scholar]
- Allison, G.B.; Cook, P.G.; Barnett, S.R.; Walker, G.R.; Jolly, I.D.; Hughes, M.W. Land clearance and river salinization in the western Murray Basin, Australia. J. Hydrol. 1989, 119, 1–20. [Google Scholar] [CrossRef]
- Cook, P.G.; Leaney, F.W.; Jolly, I.D. Groundwater recharge in the Mallee Region, and salinity implications for the Murray River; CSIRO Land and Water Technical Report, 45/01; CSIRO: Clayton, VIC, Australia, 2001. [Google Scholar]
- Walker, G.R.; Currie, D.; Smith, T.; Middlemis, H. Development of a transfer function to model irrigation recharge; Report prepared for the Murray-Darling Basin Authority; MDBA: Canberra, Australia, 2018. [Google Scholar]
- McDonald, M.G.; Harbaugh, A.W. A modular three-dimensional finite-difference groundwater flow model. Techniques of Water-Resources Investigations of the United State Geological Survey. In Modelling Techniques—Book 6; United States Geological Survey; McDonald, M.G., Harbaugh, A.W., Eds.; Reston, VA, USA, 1988. [Google Scholar]
- Yan, W.; Howles, S.; Hill, A. Loxton Numerical Groundwater Model. 2004; DWLBC Report Book 2005/16; Department of Water, Land and Biodiversity Conservation, Government of South Australia: Adelaide, Australia, 2005. [Google Scholar]
- Schaap, M.G.; van Genuchten, M.T. A Modified Mualem–van Genuchten Formulation for Improved Description of the Hydraulic Conductivity Near Saturation. Vadose Zone J. 2006, 5, 27–34. [Google Scholar] [CrossRef] [Green Version]
- Meissner, T. Relationship between soil properties of Mallee soils and parameters of two moisture characteristics models. In Proceedings of the 3rd Australian and New Zealand Soils Conference (SuperSoil 2004), Sydney, Australia, 5–9 December 2004. [Google Scholar]
- Doherty, J. Calibration and Uncertainty Analysis for Complex Environmental Models; Watermark Numerical Computing: Brisbane, Australia, 2015. [Google Scholar]
Figure 1.
Location of the Loxton and Bookpurnong irrigation districts (the red marking on the inset map shows the location of the study area map).
Figure 1.
Location of the Loxton and Bookpurnong irrigation districts (the red marking on the inset map shows the location of the study area map).

Figure 2.
Conceptual model of groundwater returns to the Murray River from the Loxton and Bookpurnong irrigation districts, sourced with permission from [29]. Note that the Agronomic Water Balance used in this paper does not include irrigation drainage, which is addressed as an output of the transfer function.

Figure 3.
Process used in the integrated modelling method.

Figure 4.
Method used to allocate recharge zones, showing (a) the timing of irrigation development, (b) classification of the vadose zone, and (c) resulting recharge zones
Figure 4.
Method used to allocate recharge zones, showing (a) the timing of irrigation development, (b) classification of the vadose zone, and (c) resulting recharge zones

Figure 5.
Comparison of recharge and drainage rates derived from existing methods and datasets (plotted in orange) to those derived the new agronomic water balance (AWB)-transfer functions (TF) models (plotted in blue) for the Loxton irrigation area, showing (a) techarge rates, (b) drainage rates, and (c) total drainage and recharge rates.

Figure 6.
Comparison of calibration for horizontal hydraulic conductivity (m/d) of the Loxton Sands (regional water table aquifer) for the three models evaluated: LB2011/TF-A model, TF-B model, TF-C model.
Figure 6.
Comparison of calibration for horizontal hydraulic conductivity (m/d) of the Loxton Sands (regional water table aquifer) for the three models evaluated: LB2011/TF-A model, TF-B model, TF-C model.

Figure 7.
Distribution of irrigation recharge in 1985 within the existing LB2011 model, the TF-A/B model, and TF-C model.
Figure 7.
Distribution of irrigation recharge in 1985 within the existing LB2011 model, the TF-A/B model, and TF-C model.

Figure 8.
Irrigation efficiency factor used in the TF-A/B and TF-C models.

Figure 9.
Estimated salt flux associated with groundwater returns to the river for the different models used. The modelled salt flux was determined using the calibrated models up until 2011. For LB2011, future projections were determined by assigning a constant irrigation recharge of 100 mm/year. For the other models, future projections were determined in accordance with the AWB and calibrated irrigation efficiency for 2011 and running this for 100 years through the TF models to generate a recharge rate into the future.


Table 1.
Methods tested for model integration.
| Method | Recharge | Hydrogeological Parameters |
|---|---|---|
| LB2011 | Inversely calibrated using groundwater data | Existing MODFLOW model |
| TF-A/B | AWB-TF, calibrated using drainage data | Recalibrated MODFLOW model |
| TF-C | AWB-TF-MODFLOW calibrated together using drainage and groundwater data | |
Table 2.
Calibrated hydraulic conductivity (Kv) of Blanchetown Clay from use of drainage data.
| Irrigation Area | Drainage Infrastructure | Blanchetown Clay Kv | |
|---|---|---|---|
| Default Value | Calibrated Value | ||
| Bookpurnong | Present | 0.03 cm/day (109.5 mm/year) | 0.02 cm/day (73 mm/year) |
| Absent | 0.027 cm/day (98.6 mm/year) | ||
| Loxton | Present | 0.02 cm/day (73 mm/day) | |
| Absent | 0.03 cm/day (109.5 mm/day) | ||
© 2020 by the authors. Licensee MDPI, Basel, Switzerland. This article is an open access article distributed under the terms and conditions of the Creative Commons Attribution (CC BY) license (http://creativecommons.org/licenses/by/4.0/).
Share and Cite
MDPI and ACS Style
Currie, D.; Laattoe, T.; Walker, G.; Woods, J.; Smith, T.; Bushaway, K. Modelling Groundwater Returns to Streams From Irrigation Areas with Perched Water Tables. Water 2020, 12, 956. https://doi.org/10.3390/w12040956
AMA Style
Currie D, Laattoe T, Walker G, Woods J, Smith T, Bushaway K. Modelling Groundwater Returns to Streams From Irrigation Areas with Perched Water Tables. Water. 2020; 12(4):956. https://doi.org/10.3390/w12040956
Chicago/Turabian StyleCurrie, Dougal, Tariq Laattoe, Glen Walker, Juliette Woods, Tony Smith, and Kittiya Bushaway. 2020. "Modelling Groundwater Returns to Streams From Irrigation Areas with Perched Water Tables" Water 12, no. 4: 956. https://doi.org/10.3390/w12040956
Note that from the first issue of 2016, this journal uses article numbers instead of page numbers. See further details here.