Effect of Feed Delivery Rate and Pellet Size on Rearing Performance, Feed Wastage and Economic Profitability in Gilthead Seabream (Sparus Aurata) Ongrowing


Instituto Murciano de Investigación y Desarrollo Agrario y Alimentario, Estación de Acuicultura Marina (IMIDA), Puerto de San Pedro del Pinatar, 30740 Murcia, Spain
Water 2020, 12(4), 954; https://doi.org/10.3390/w12040954
Submission received: 19 February 2020
/
Revised: 16 March 2020
/
Accepted: 25 March 2020
/
Published: 27 March 2020
(This article belongs to the Special Issue Recent Advances in Environmental Interactions of Marine Aquaculture)
Abstract
:Gilthead seabream (Sparus aurata) displays a particular eating behaviour that involves considerable oral manipulation and feed waste. We assess the influence of feed delivery rate and pellet size on seabream growth and size variability, feed wastage and economic profitability for a full production cycle. Batches of seabream were fed twice a day according to three different treatments (T1, T2, T3). T1 and T2 fish were fed with the same regime of pellet sizes: 2 mm pellets until the fish reached 0.1 kg, and 4 mm pellets from then on; the feeding rate in T1 was twice that of T2 (20 and 10 g min−1, respectively). T3 fish were fed with pellets of 2 mm until they reached 0.07 kg, with pellets of 4 mm until the fish reached 0.22 kg, and with 6 mm pellets from then on, with a feeding rate of 10 g min−1. T2 showed increased growth, low variability in fish size during the ongrowing and at harvest, less feed wastage both related to the delivery and the chewing behaviour, lower feed costs and improved profitability. Seabream wasted more feed during the second meal. Controlling the feeding process is essential to reduce wastage and increase profitability, which can be achieved by process monitoring and suitable feed pellet management.
1. Introduction
Gilthead seabream (Sparus aurata), hereafter referred to as seabream, has been intensively reared in floating cages in the open sea all along the Spanish Mediterranean coast since the 1980s [1]. Fish density normally ranges from less than 1 kg m−3 at the beginning of the farming process, up to 20–30 kg m−3 before harvesting, depending on cage dimensions and the target commercial size [2]. Size grading of juvenile seabreams is usually carried out in nursery facilities prior to stocking the cages, thus providing more homogeneous batches. This routine enables better growth by facilitating optimal stock and feeding management procedures [3,4] and minimising cannibalism between individuals of different sizes, particularly in the case of juveniles [5,6,7]. In spite of this, fish size dispersion increases as fattening progresses due to a common phenomenon called growth depensation whereby intraspecific differences in growth rate in a captive fish population generate a progressive increase in the variance of size distribution over time [8,9]. Fish that grow less are less proficient at competing for feed, so they tend to feed poorly. This undernourishment causes chronic appetite inhibition [10], inefficient growth [3,11] and impaired welfare in the form of stress, which can lead to depression of the immune system, increasing the risk of disease [12,13], and mortality [14], and therefore a loss of economic profitability [15].
Drawbacks in the farming performance as a result of growth depensation become greater as fattening progresses [16]. A regular grading of fish throughout the farming process was proposed on the premise that the growth of small fish will improve once large fish have been removed [14], although some discrepancies exist in this respect [17]. Furthermore, this kind of operation is not always possible when fish farming takes place in the open sea. Alternatively, a suitable feeding strategy might facilitate better access to feed for most fish [18,19,20,21], minimizing the effects of growth depensation. The combination of feed delivery rate and pellet size determine the instantaneous availability of feed for fish [22]. There are differences in growth and feed efficiency between fish species with respect to the most suitable feeding rate, so that some species grow better feeding at a low rate and others at a high feeding rate [23,24]. However, an inappropriate feed supply rate may lead to feed wastage if it is too high [22] or favour dominance and size dispersion if it is too low [15,25]. In addition, seabream display a particular eating behaviour characterized by playing/tasting and chewing the feed pellets before swallowing them [26], which generates a considerable amount of wasted feed in the form of pellet fragments [27]. The amount of feed wasted by seabream was directly related to the pellet size and the fish size [28]. This way of wasting the feed is related to feed availability and feeding strategy [22], and therefore with the level of competition and satiety. Thus, pellet size is particularly relevant in the case of seabream, since both feed availability and feed wastage depend on it.
From an economic point of view, high feed expenditure (feed accounts for 50–70% of production costs) [29,30,31] and a fall in the sale prices of seabream in recent years [1] are of concern for the Mediterranean seabream industry. Also, the most outstanding environmental impacts derived from fish farming are related to feed waste [32,33]. Hence, it is obvious that feeding is a key factor in the performance of aquaculture companies and sustainability of the activity [34]. On the other hand, the most relevant issue derived from growth depensation is related to the fish size variability at the time of harvest [17]: a variable fraction of the fish population is always below the target commercial size. The sale price of this fraction of small fish is obviously lower, and depending on how large this fraction is, the production performance and profitability may be affected. In this work, which covers a full production cycle, I evaluate the effect of different feeding regimes with different feed delivery rates and pellet sizes on the waste of feed, growth performance and the size frequency distribution of seabream specimens reared in laboratory conditions, simulating realistic intensive culture conditions (temperature, photoperiod, fish density, daily ration and meals per day) [35]. The economic implications of the experimental feeding regimes are also assessed.
2. Materials and Methods
2.1. Experimental Conditions and Procedures
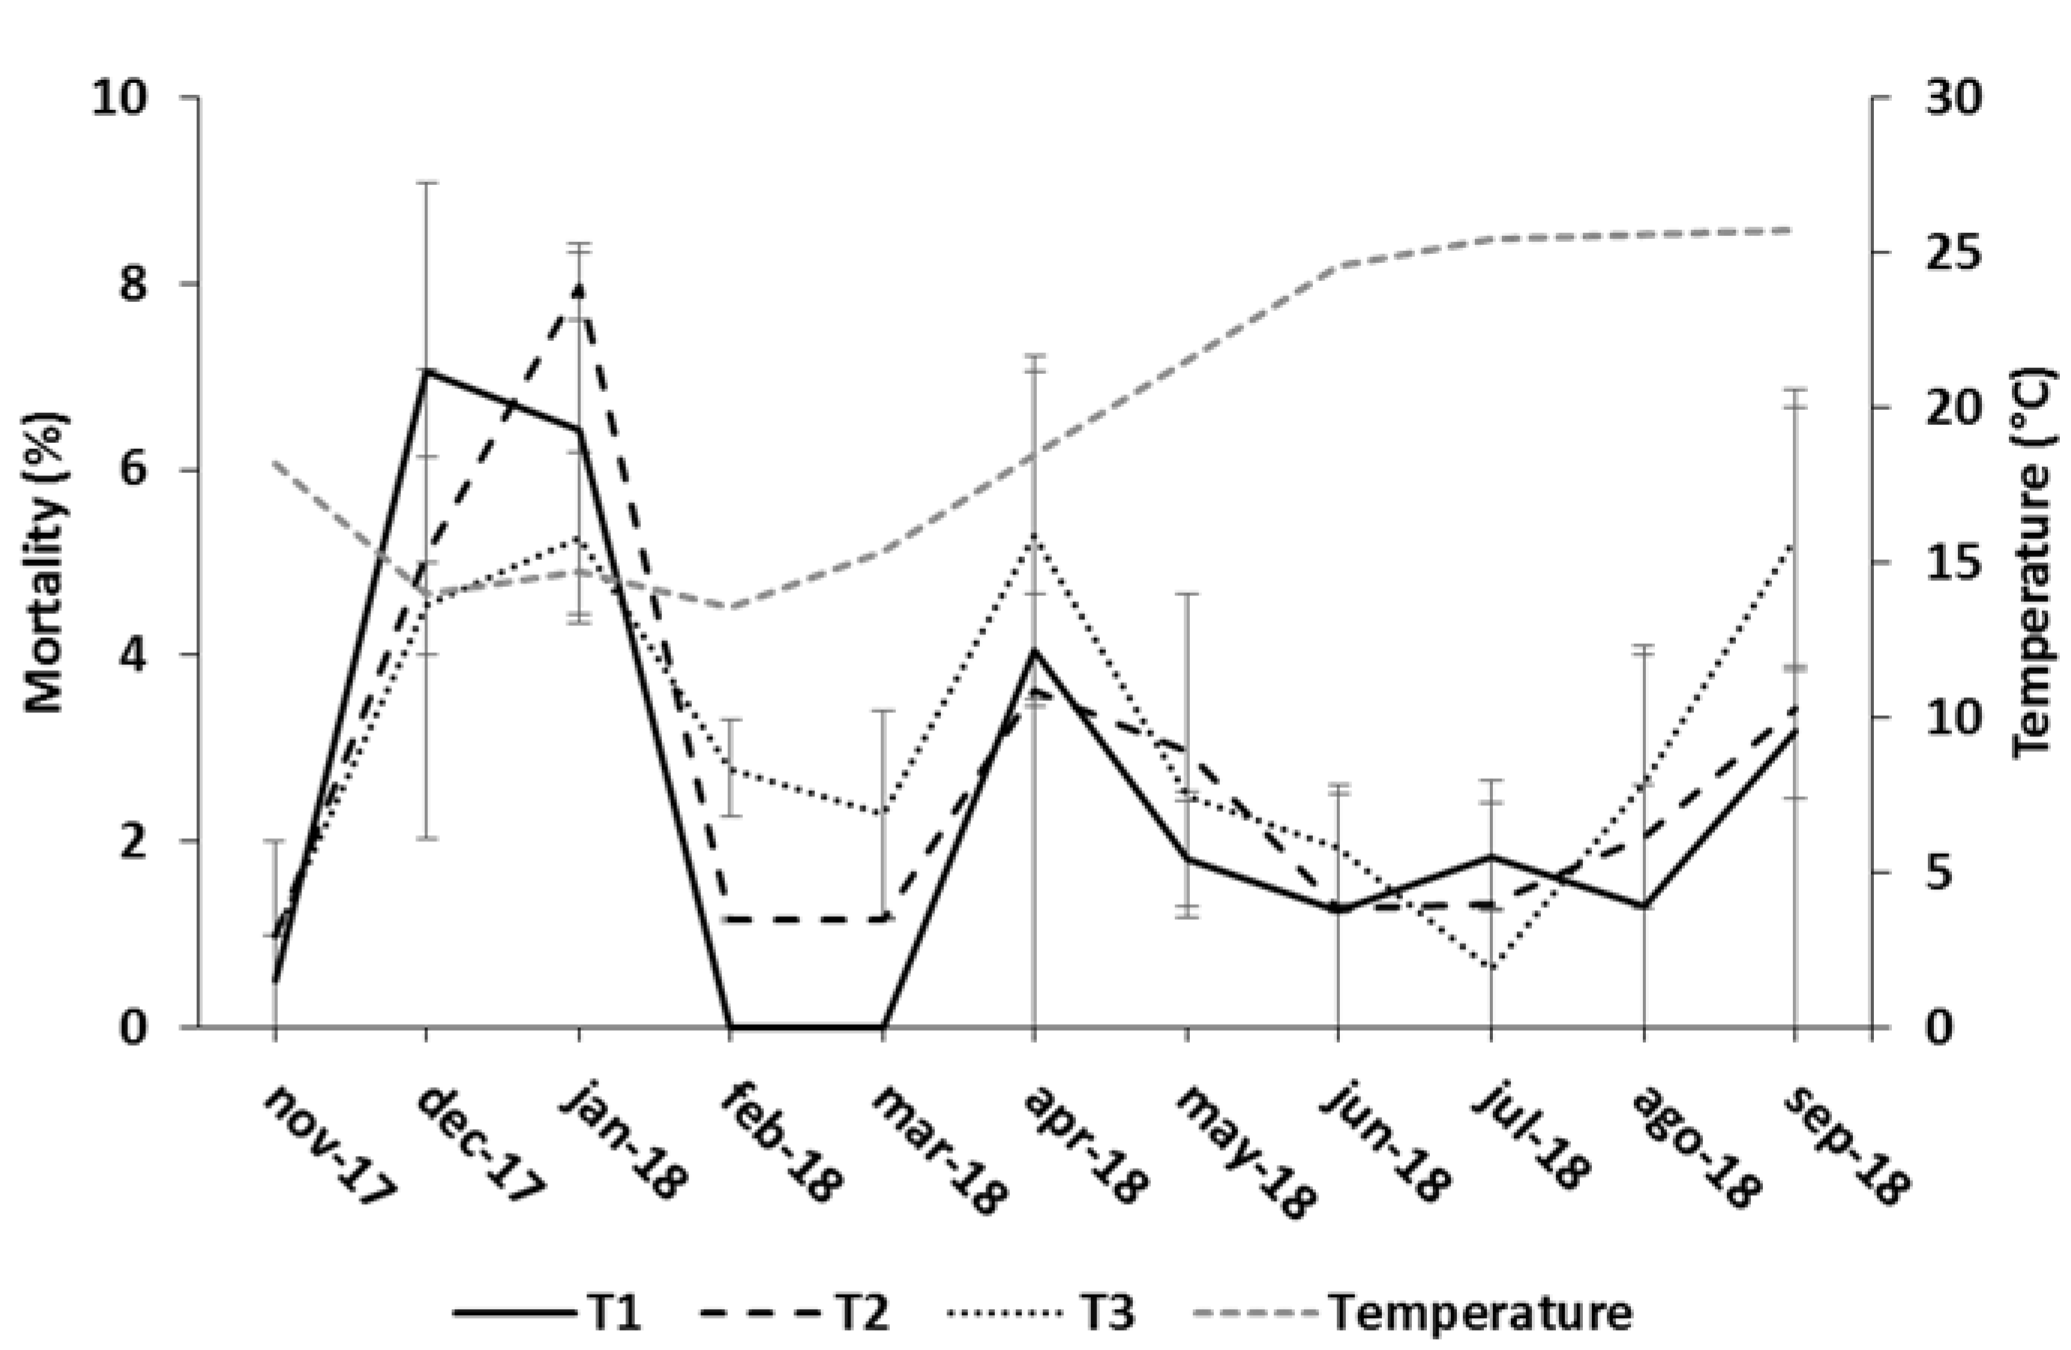
The assays were carried out at the Marine Aquaculture Station belonging to IMIDA, in San Pedro del Pinatar, Murcia (SE Spain), in a recirculating seawater aquaculture system (RAS) including temperature control, biological and mechanical filtration. The RAS comprised six quadrangular tanks (1.7 × 1.7 × 1-m depth) with a practicable volume of 2500 L per tank. Photoperiod and water temperature were natural throughout the trials, except during the summer months (July and August) when water temperature was set at 25 ± 1 °C to prevent overheating (Figure 1). Salinity was about 36 ‰. An aeration flow rate of 60 L h−1 was set inside each tank (six air outlets with microporous diffusers per tank). Dissolved oxygen was always above 85% saturation. Both water temperature and dissolved oxygen were monitored twice a day (HACH HQ30d temperature and oxygen sensor). N-NH3 concentration was monitored twice a week (HANNA HI83399 photometer), and it was always at safe levels for seabream (< 0.26 mg L−1) [36]. The mechanical filter was cleaned on alternate days. Approximately 10–25% of the water volume was renewed daily. Tanks had a removable double bottom consisting of a polyvinyl chloride (PVC) frame with a plastic net (2 cm mesh size) that lay 5 cm above the tank floor, so that wasted feed remained inaccessible to fish once it had passed through so that it could be collected after feeding.
One thousand seabream fingerlings with a mean weight of around 0.025 kg coming directly from a commercial nursery were stocked in three tanks similar to those described above for an acclimation period of about one month. During this time, fish were fed to apparent satiety with feed pellets 2 mm in size following the same feeding schedule that would be set for subsequent trials. After acclimation, fish were weighed and graded before stocking in the definitive experimental tanks so that all the experimental groups had a similar mean weight and size range. One hundred fish were introduced into each of the six tanks in November 2017. Initial mean weight, density and coefficient of variation (CV) were about 0.05 kg, 2 kg m−3, and 10%, respectively (Table 1). During the assay, mortality was recorded daily.
Three feeding regimes were established as experimental treatments (T1, T2 and T3), each of them in duplicate (two batches/tanks for each treatment). Treatment levels and initial conditions are summarized in Table 1. T1 and T2 fish were fed with the same regime of pellet sizes, according to the recommendations taken from [28]: 2 mm pellet until fish reached 0.1 kg in weight, and 4 mm pellets from then to the end of the assay, but the feeding rate in T1 was twice as fast as in T2 (ca. 20 and 10 g min−1, respectively). T3 fish were fed using the pellet sizes recommended by the anonymous feed manufacturer (Table 1): pellets of 2 mm until fish reached 0.07 kg, pellets of 4 mm until fish reached 0.22 kg in weight, and 6 mm pellets from then to the end of the trial, with a feeding rate of ca. 10 g min−1. Feed delivery rates were set according to [22]. The proximate composition of the feed pellets is shown in Table 2. All batches were always fed with feed with the same composition. For the first month, all batches were fed with pellets of 2 mm type A. For the months 2–4, T1 and T2 were fed with 2 mm pellets type B and T3 with 4 mm pellets type A. For the months 5–8, all batches were fed with 4 mm pellets type A. For the months 9–11, T1 and T2 were fed with 4 mm pellets type B and T3 with 6 mm pellets.
For all three treatments, daily ration (DR) was calculated according to the manufacturer’s feeding chart, from which I developed the following specific feeding rate (SFR) equation by multiple regression analysis:
where BWi is the mean initial weight in g and T is the water temperature in °C.
SFR (% BWi∙∙∙day−1) = EXP (−4.594 − 0.289∙∙∙LnBWi + 2.034∙∙∙LnT) (Adj. R2 = 0.90; ANOVA P < 0.001)
DR was divided into two equal meals a day that were always delivered at the same times: 8:30 and 12:30. The daily ration was recalculated weekly based on growth estimates using the Mayer et al. seabream growth model [37]. This model is based on thermal growth coefficients (TGC) [38]. Mayer et al. demonstrated that TGC changes over the seabream cycle, and they identify two stages for the growth of seabream under intensive conditions, with 117 g as a critical value for weight [37]. So, two separate models are needed to accurately estimate seabream growth, as follows:
where BWf and BWi are the mean final and initial body weight in g, respectively, and ST(to-t) is the effective temperature in °C (summation during a given time interval of temperature minus the temperature below which growth is zero: 12 °C for seabream [39]).
BWf = [BWi1/3 + TGC1∙∙∙ST(to-t) ]3, if BW < 117 g; TGC1 = 0.001646
BWf = [BWi2/3 + TGC2∙∙∙ST(to-t)) ]3/2, if BW > 117 g; TGC2 = 0.016095
The number of pellets per gram of each feed type (size) are shown in Table 2. According to the number of fish and their size, the feed delivery rate (g min−1) was expressed as number of pellets fish−1 min−1 (Table 3).
Feeding was carried out manually by three operators trained to supply the feed in pulses at the stipulated rate. To minimize variability between operators, they calibrated their pulses of feed delivery according the amount of pellets that fit between their fingers, so that each operator knew how often he had to supply a pulse according to the corresponding feeding rate and pellet size. Pellets were spread over the seabream shoal so that feed was available to as many fish as possible. A strict visual control of feed intake was kept, so that if the operator perceived symptoms of satiety and pellets began to accumulate under the double bottom, then the delivery speed was reduced to prevent feed wastage, or even stopped if most fish no longer paid attention to the feed. The weight of the feed not supplied was recorded. If this fraction of feed—which has not been delivered—had been supplied, it would have been wasted, so it was considered as overfeed (Of). Ten minutes after feeding, the fraction of supplied feed and pellet fragments that were wasted and remained in the double bottom was siphoned and sieved (60 μm mesh size). Then, the entire pellets were separated with forceps from the mass of wasted feed fragments and counted. Both fractions were dried in an oven (105 ± 1 °C, 24 h) until constant weight and weighed. The mass of wasted pellets and wasted fragments was corrected according to their moisture content (Table 2) to calculate both fractions of wasted feed. The mass of entire pellets was recorded as unused feed (Uf), and the pellet fragments as feed lost by chewing (LbC).
All the fish in each batch were weighed approximately every 30 days from the beginning of the trial and until they reached a final mean weight of about 0.45 kg 11 months later. Harvested seabream are usually classified according to the four commercial size classes set by the Mediterranean seabream industry: (i) below 0.3 kg; (ii) between 0.3 and 0.4 kg; (iii) between 0.4 and 0.6 kg; and (iv) above 0.6 kg. At the end of the trial, the fish size frequency distribution was determined in all six batches according to these size classes. The sale price of each size class used for the calculations mentioned below were 3.8, 4.8, 5.3 and 5.5 € kg−1, respectively. These first sale prices were provided by anonymous seabream farmers.
The following indices were calculated for all batches and for each period between weighing:
where BWf and BWi are the mean final and initial body weight in g, respectively; sd is the standard deviation; BWm is the mean body weight in g; t is the time in days. Specific growth rate (SGR) expresses the fish growth in terms of weight gained in g per day as percentage of BWi; CV is a measure of dispersion that expresses the sd as a percentage of BWm.
where Ff is the weight in g of wasted feed fragments recovered from the tanks bottom (excluding Uf); Fs is the feed supplied in g, as the DR minus total feed wasted (including entire pellets and fragments); Fi is the feed intake in g, as the Fs minus Uf. LbC expresses Ff as a percentage of Fs. WFRDR and WFRFs express the amount of feed wasted as a percentage of DR and Fs, respectively. WFRDR and WFRFs were calculated for both meals together and for each one separately.
| Ongrowing performance: | |
| Specific Growth Rate (SGR): | SGR (% BWi ∙ day−1) = (LnBWf − LnBWi) ∙ 100/t |
| Coefficient of Variation of weight (CV): | CV (% sd) = 100 ∙ (sd/BWm) |
| Waste production: | |
| Feed Lost by Chewing (LbC): | LbC (% Fs) = 100 ∙ Ff/Fs |
| Wasted Feed Ratio (WFR): | |
| As a function of daily ration (WFRDR): | WFRDR (% DR) = 100 − (100 ∙ Fi/DR) |
| As a function of feed supplied (WFRFs): | WFRFs (% Fs) = 100 − (100 ∙ Fi/Fs) |
| Economic analysis: | |
| Economic Feed Conversion Ratio (eFCR): | eFCR (kg feed/kg biomass)= Fs/(Bf − Bi) |
| Economic Conversion Ratio (ECR): | |
| As a function of daily ration: | ECRDR (€ kg−1) = DC ∙ [DR/(Bf − Bi + Bd)] |
| As a function of feed supplied: | ECRFs (€ kg−1) = DC ∙ [Fs/(Bf − Bi + Bd)] |
| As a function of feed intake: | ECRFi (€ kg−1) = DC ∙ [Fi/(Bf − Bi + Bd)] |
| As a function of truly ingested feed: | ECRTFi (€ kg−1) = DC ∙ [TFi/(Bf − Bi+ Bd)] |
Economic Profit Index (EPI) [40] was calculated for each batch for the overall trial so that the corresponding ECRs were averaged for all the periods between samplings:
where DC is the diet cost in € kg−1, calculated according to the feed prices shown in Table 2 and the contribution of each feed type to the amount of feed used in each batch between samplings; Bi and Bf are the mean initial and final biomass in kg; Bd is the biomass of dead fish in kg; TFi is the truly ingested feed in kg, as Fi minus LbC in kg; SSP is the seabream sale price in € kg−1 weighted calculated according to the frequencies of the aforementioned size classes obtained for each batch at the end of the trial; ∆BW is the mean body weight increase in kg from the beginning to the end of the trial. ECR (economic conversion ratio) expresses the feed efficiency in terms of the feed cost in € kg−1 of seabream produced. EPI indicates the profit in € made by producing a seabream of a mean weight of about 0.45 kg from an initial weight of about 0.05 kg (€ fish−1), considering the size dispersion obtained at the end of the ongrowing process. The different ways of calculating ECR and EPI demonstrate the influence of the feeding regimes on the economic profitability respect to the control of the feeding process and of the left-over feed. ECRDR and EPIDR represents the unfortunate practical case in which the operator always provides the full daily ration regardless of fish appetite, as if feed delivery was not been supervised, and ECRFs and EPIFs when the operator takes into consideration fish appetite and modulates or stops the supply of feed accordingly. ECRFi and EPIFi assume the feed cost considering that no entire pellets are wasted during delivery, and ECRTFi and EPITFi as if, as well, there was no waste due to chewing.
| As a function of daily ration: | EPIDR (€ fish−1) = (BWf ∙ SSP) − (ECRDR ∙ ∆BW) |
| As a function of supplied feed: | EPIFs (€ fish−1) = (BWf ∙ SSP) − (ECRFs ∙ ∆BW) |
| As a function feed intake: | EPIFi (€ fish−1) = (BWf ∙ SSP) − (ECRFi ∙ ∆BW) |
| As a function of truly ingested feed: | EPITFi (€ fish−1) = (BWf ∙ SSP) − (ECRTFi ∙ ∆BW) |
2.2. Statistical Analyses
Differences between the experimental feeding regimes in relation to feeding variables (SFR, DR, Of, Fs, Uf, Fi, LbC and TFi), growth performance (CV and SGR), waste production (LbC as a function of Fi, WFRDR and WFRFs) and economic profitability (eFCR and ECRs), were tested by means of repeated measures analysis of variance (RM-ANOVA) following a generalized lineal model with “treatment” (fixed, three levels: T1, T2 and T3) as main factor, and with sampling times (random, 11 levels) as a factor of repeated measures in the different sampling events. To detect a possible batch/tank effect, the difference between batches/tanks of the same feeding regime was checked using the t-test for independent samples. Homocedasticity (Levene test) and sphericity (Mauchley test) were previously checked. If these statistical assumptions were not met, data were log(x + 1) transformed. For WFRDR and WFRFs, “meal” was included as a second main factor (fixed, two levels: 8:30 and 12:30) in the repeated measures model. Since the EPIs were calculated for each batch for the overall experiment, comparisons between feeding regimes were made by one-way ANOVA. A Tukey’s honest significant difference (HSD) post hoc test was performed to check for differences between levels of the main factors.
3. Results
The resulting feeding rates expressed as number of pellets per fish and minute, and the resulting duration of meals are shown in Table 3. As DR increased during the course of the trial, the number of pellets per fish and time also increased in all three treatments. T1 and T3 provided the same number of pellets per fish and time when both used the same pellet size (months 1 and 5–8), while for the remaining periods (months 2–4 and 9–11) T3 supplied fewer pellets per fish and time than T1 and T2. The T2 treatment always supplied a lower number of pellets per fish and time than T1 and T3, except for the last three months of the trial, when the number of pellets per fish and time in T2 and T3 were very similar. However, the pellet size was larger in T3 and the duration of the meals were longer in T2. Table 4 shows the monthly feed utilization data for each feeding regime. t-test for independent samples revealed that there was no batch/tank effect for any feeding treatment and variables. No significant differences between feeding regimes were observed for SFR, DR, Fs, Uf, Fi and TFi (RM-ANOVA, P > 0.25), but for Of and LbC (RM-ANOVA, P < 0.05). For the whole trial, feed wastage due to Of was 2.8-fold and 1.4-fold higher in T1 than in T2 and T3, respectively. Of in T3 was 1.9-fold higher than in T2. The Uf fraction was below 1% of Fs in the three treatments, but the lowest fraction occurred in T2. The lowest LbC as a function of Fi was obtained with T2 and the highest with T3, with intermediate values in T1. Fish fed with the T2 regime showed the highest weight increase and final weight (Table 5). Cumulative mortality was very similar in all three treatments, below 30% in all the batches (Table 5). Mortality was higher at the beginning of the experiment during the coldest months (5%–8%) and then stabilized at around 2%–4% per month until the end of the trial (Figure 1).
3.1. Growth Performance
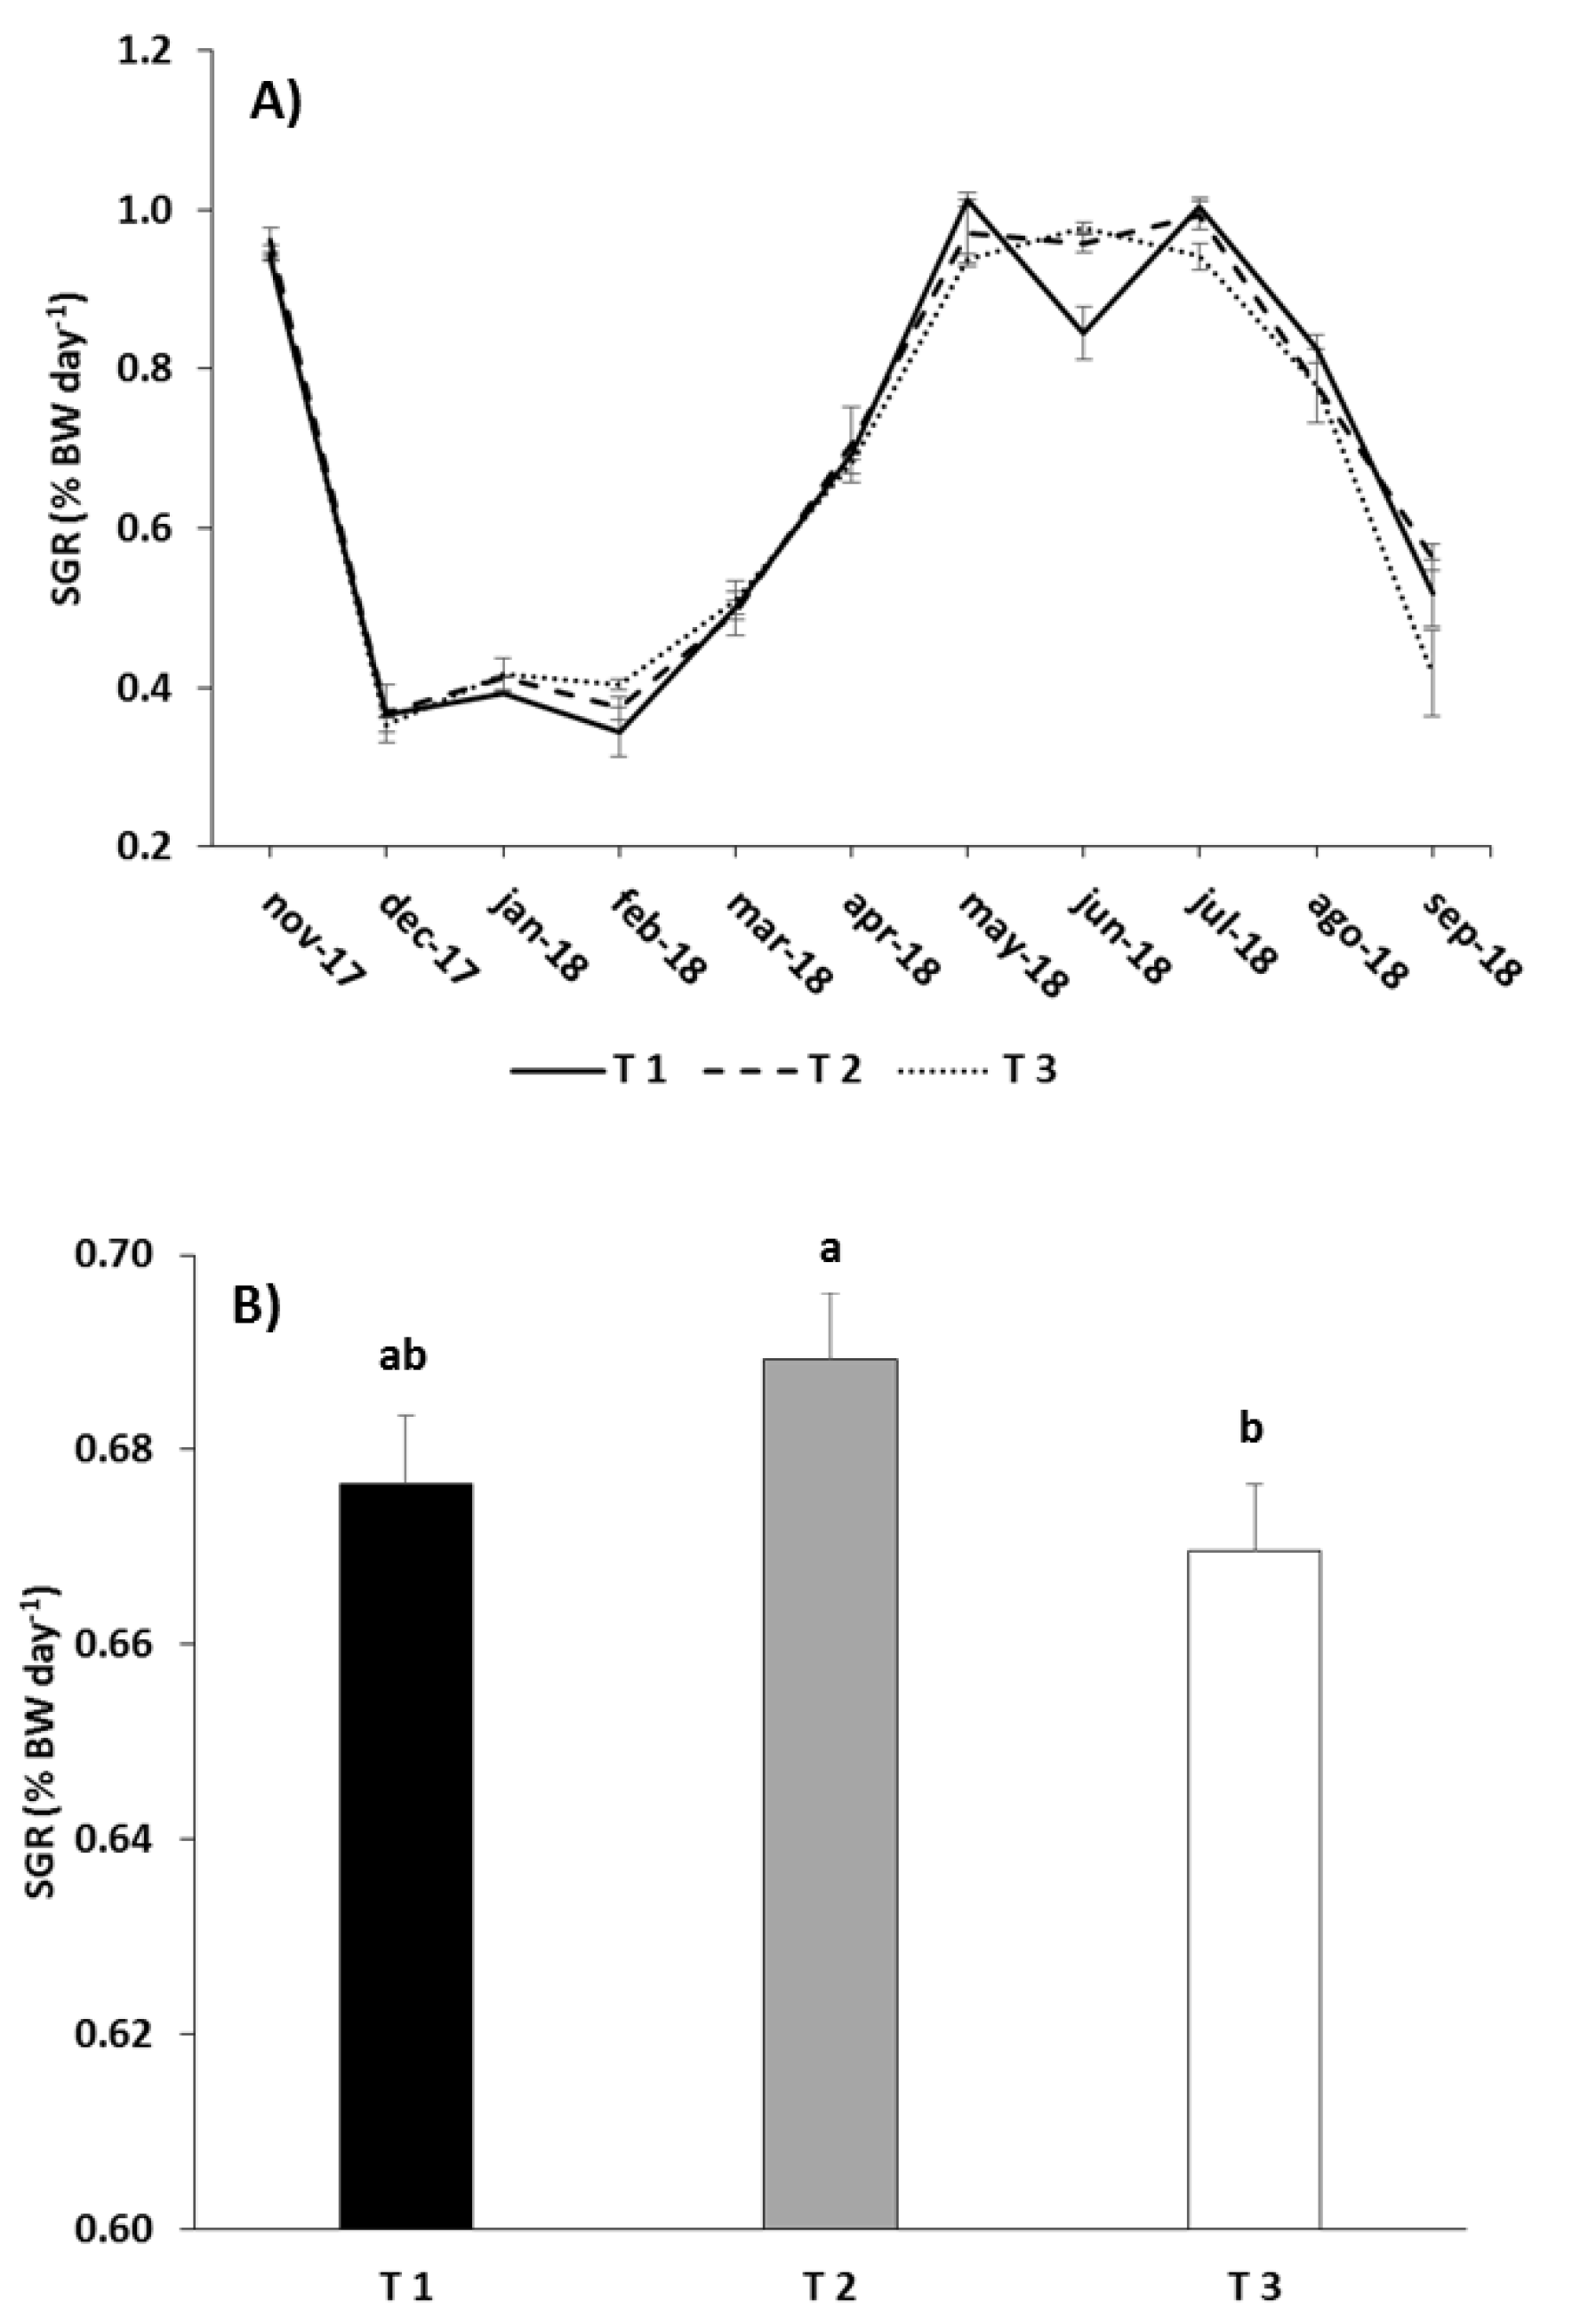
SGR was very similar way in all three treatments throughout the experiment (Figure 2A). At the beginning of the trial when fish were still fry, SGR was close to 1% BW day−1, but it decreased as water temperature dropped, remaining low during the winter months. From then onwards (fish weighed around 100 g) and up to late spring SGR with the temperature, remaining high until the end of the summer. Finally when fish were close to the target size, SGR fell over the last two months. In spite of the similarity in SGR between the three feeding treatments, RM-ANOVA revealed that there were significant differences between them when the overall trial was considered due to the feeding regime (p < 0.05; Table 6). SGR was significantly higher in T2 than in T3, but SGR in T1 did not differ from the other treatments (Tukey, p < 0.05; Figure 2B).
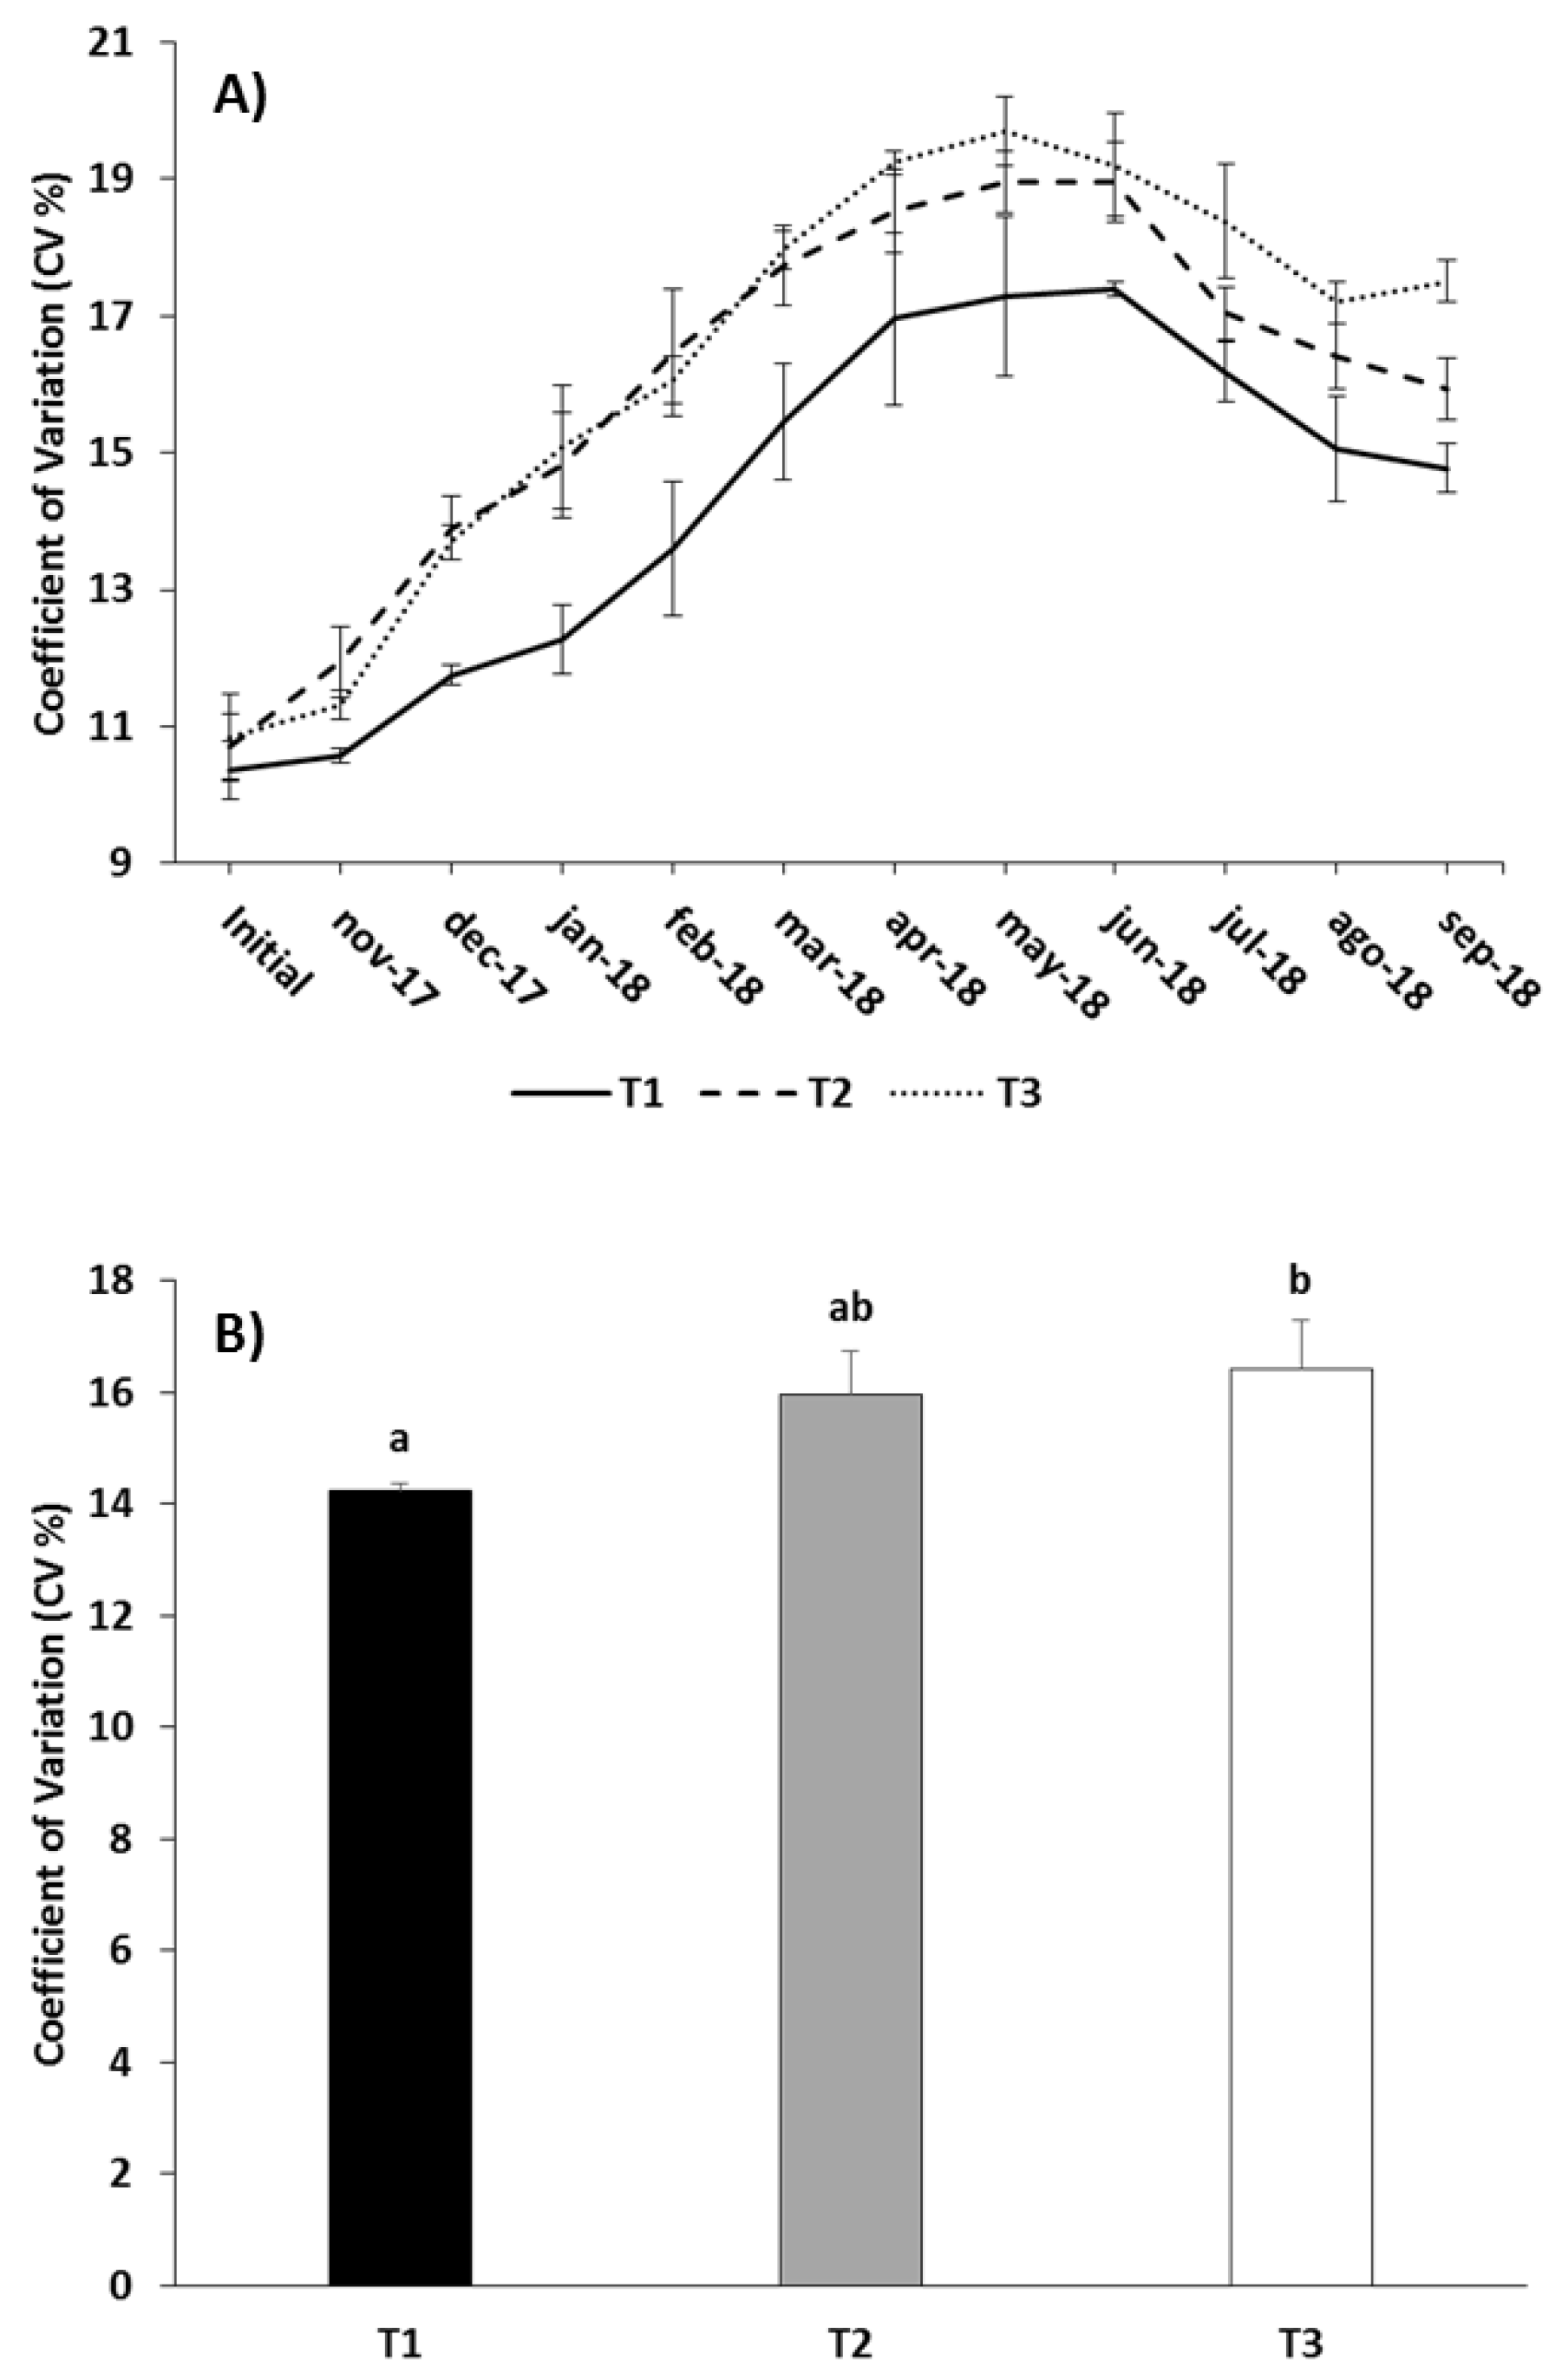
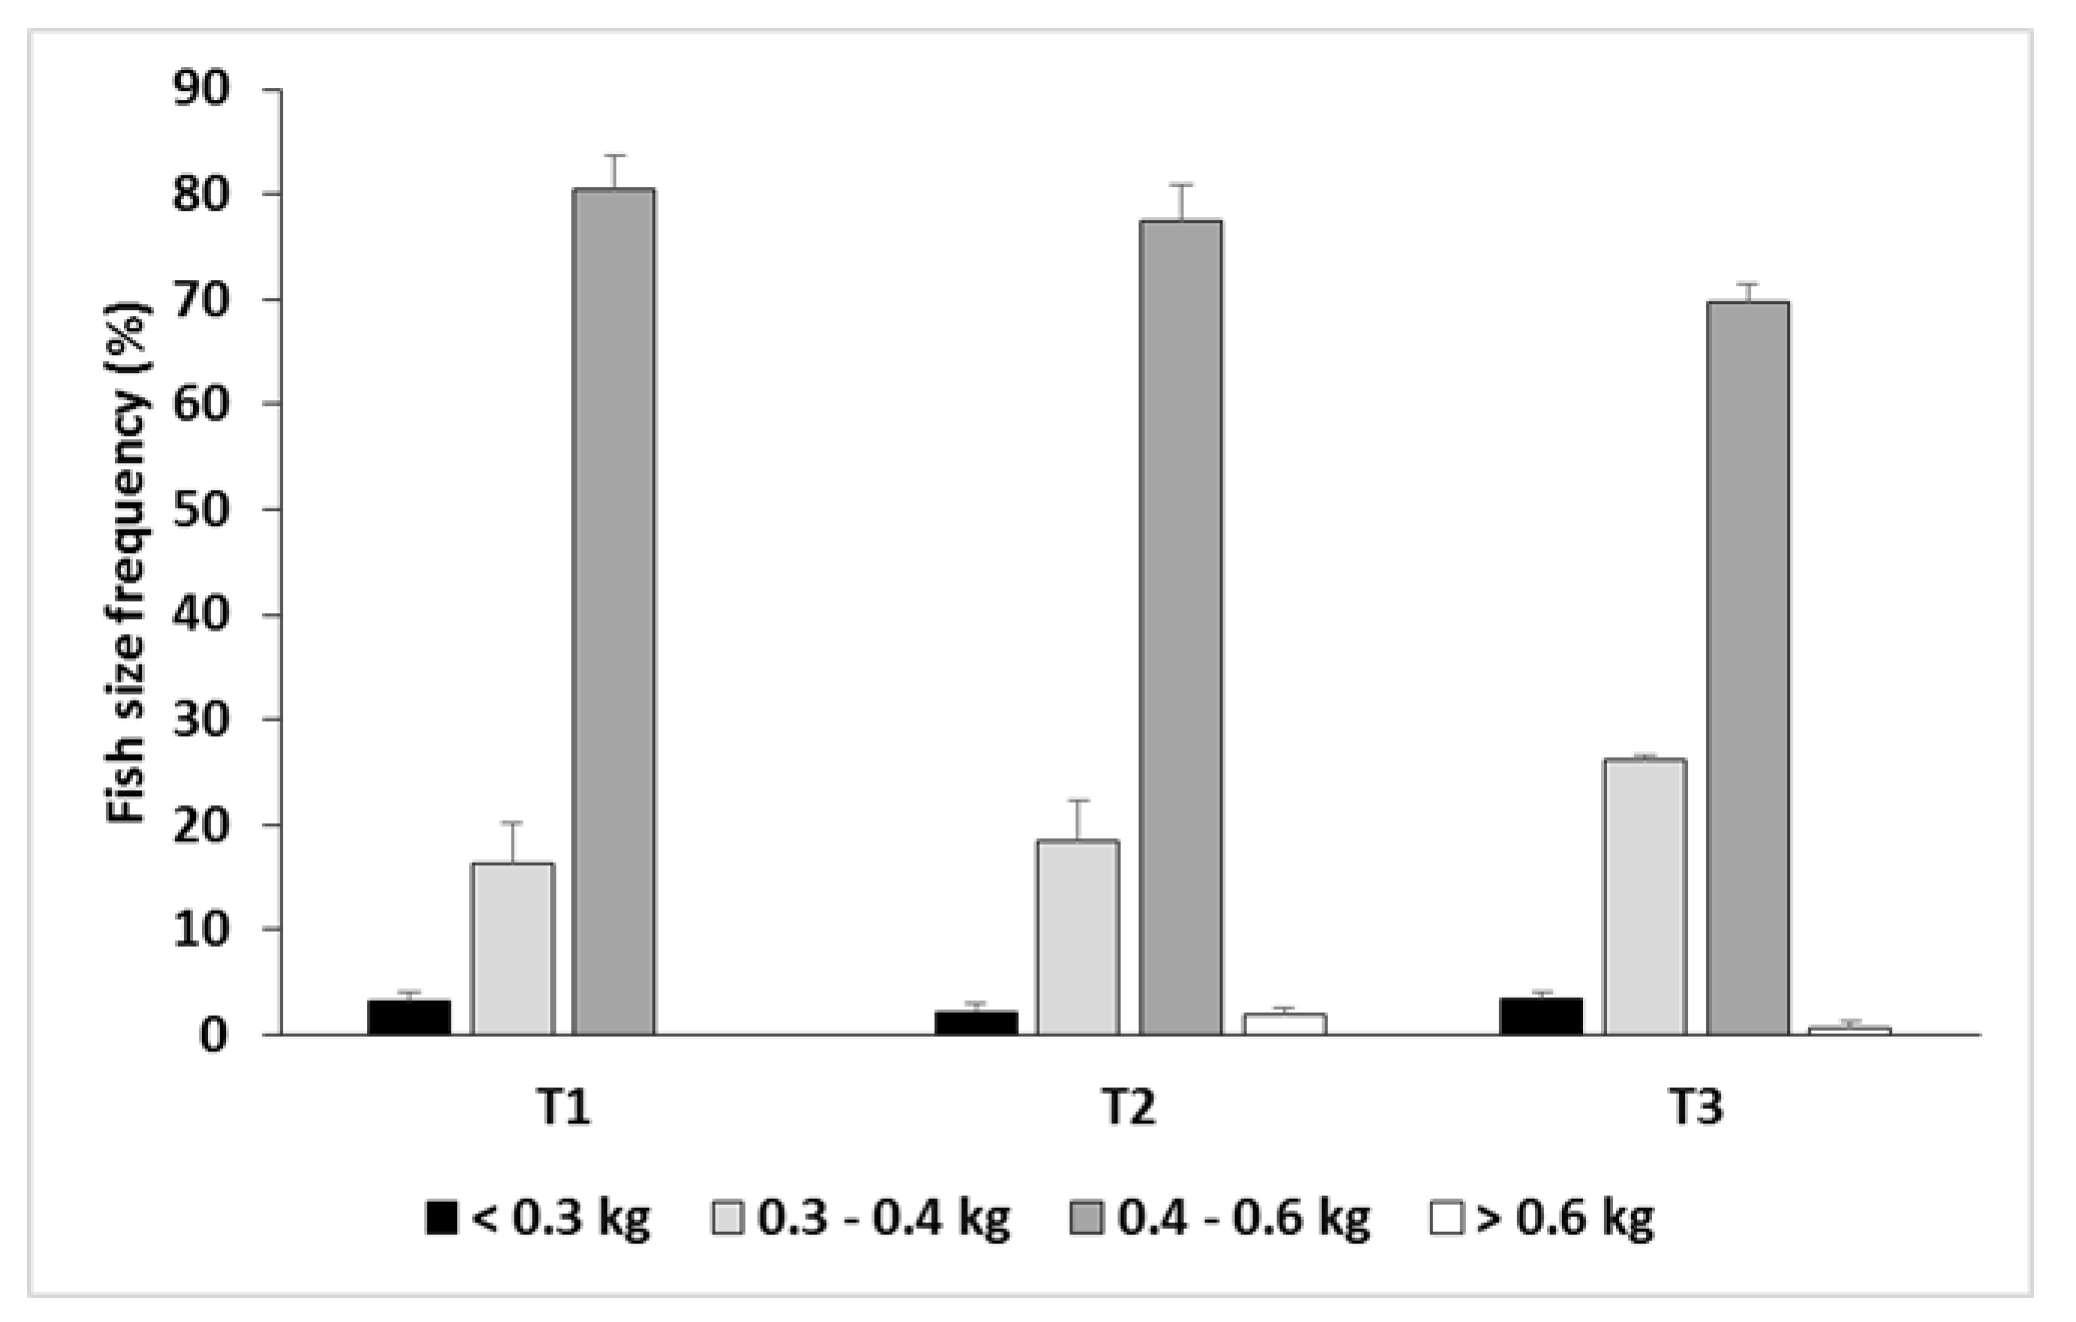
Fish size distribution in the three treatments was very similar at the beginning of the experiment, with a CV of around 10% (Table 1). As the trial progressed the CV in all batches was gradually increased until mid-spring, after which it decreased during the last months of the trial (Figure 3A). The CV was similar in T2 and T3 from the beginning of the trial to late-winter; from then onwards and until the end of the trial CV values in T2 were lower than in T3 (Figure 3A). The RM-ANOVA pointed to significant differences between treatments in relation to CV (p < 0.05; Table 6). For the whole trial, T1 had the lowest CV, and T3 the highest, with intermediate values in T2 but very close to those of T1 (Tukey, p < 0.05; Figure 3B; Table 5). The fish size frequency distribution obtained at the end of the trial according to the aforementioned commercial seabream size classes is shown in Figure 4. The highest proportion of the target size classes (0.4–0.6 kg and > 0.6 kg) were obtained with the T1 feeding regime (80.5%), closely followed by T2 (79.5%). The proportion of fish with a final weight lower than 0.4 kg was around 20% for both treatments. T3 provided the highest frequency (29.6%) for the size classes below the target commercial size (< 0.3 kg and 0.3–0.4 kg size classes), and the lowest proportion (70.4%) of fish heavier than 0.4 kg.
3.2. Waste Production
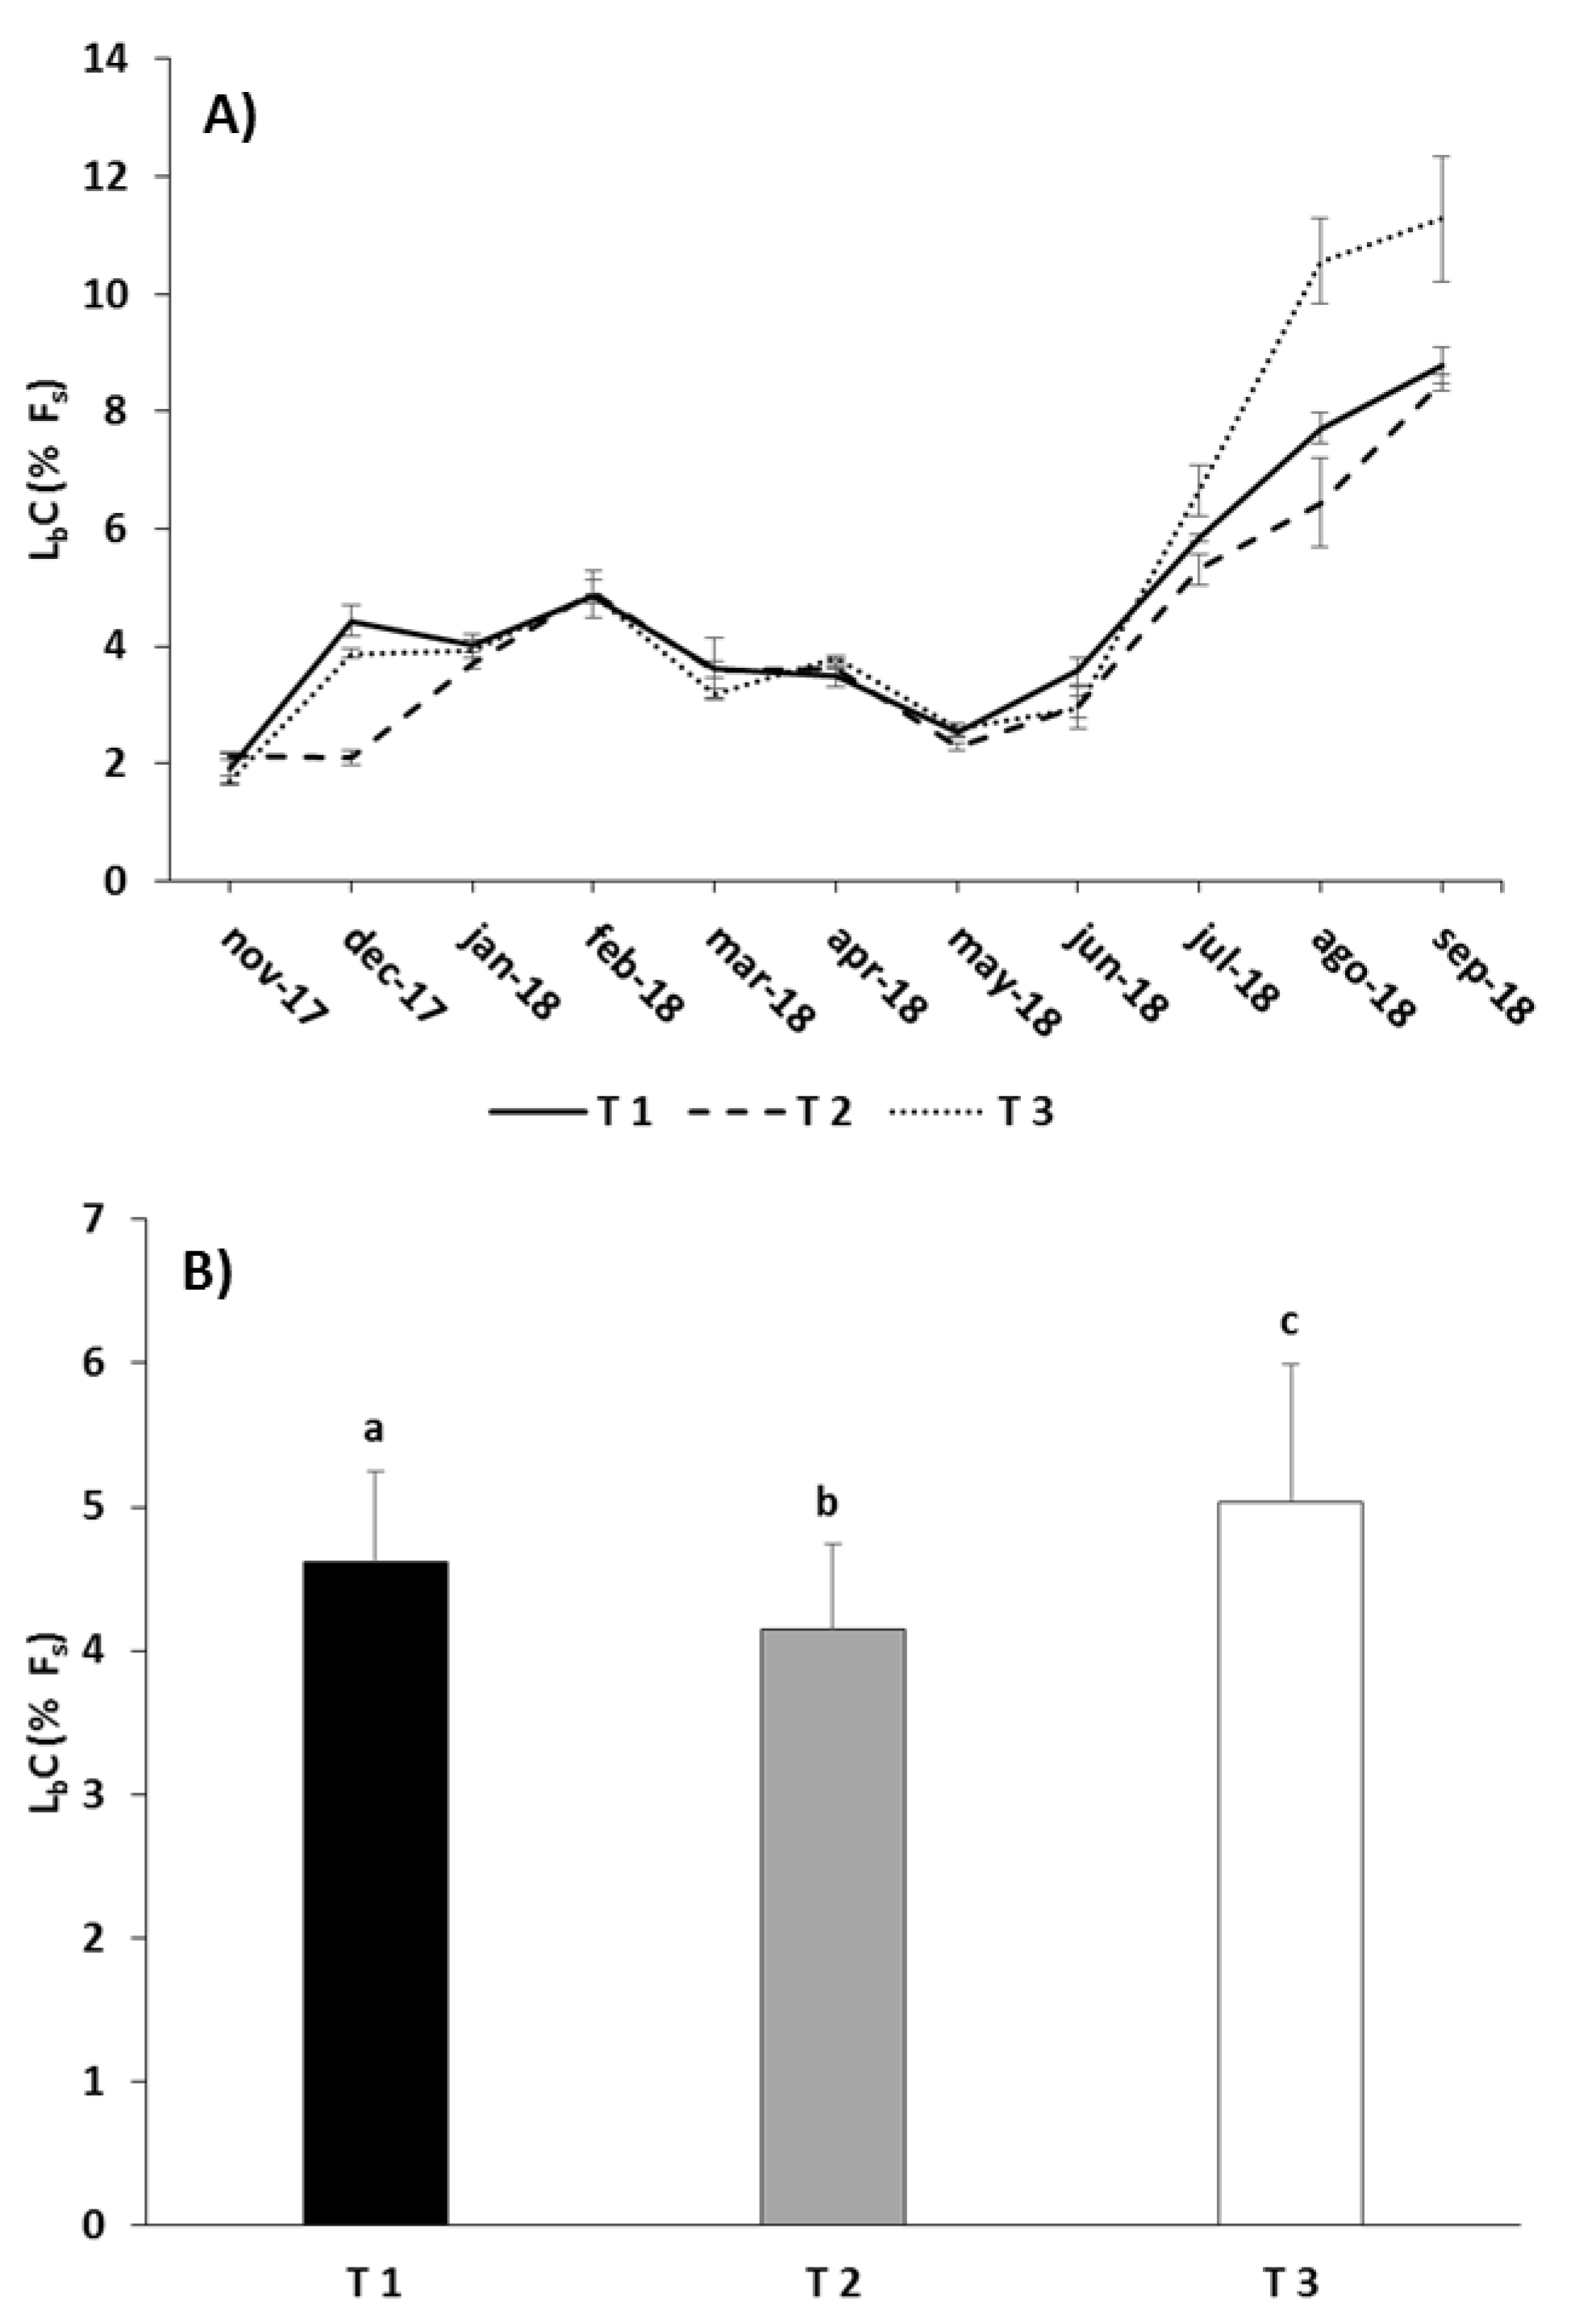
Figure 5A shows that LbC was very similar in all feeding regimes until mid-spring, with values ranging from 2% to 5% of Fs. From that moment, LbC increased in all treatments, but more sharply in T3 coinciding with the provision of pellets of 6 mm in size. For the whole assay there were significant differences because of the feeding regimes (RM-ANOVA, p < 0.01; Table 6): the lowest LbC was obtained with T2, and the highest with T3, with intermediate values obtained for T1 (Tukey, p < 0.05; Figure 5B).
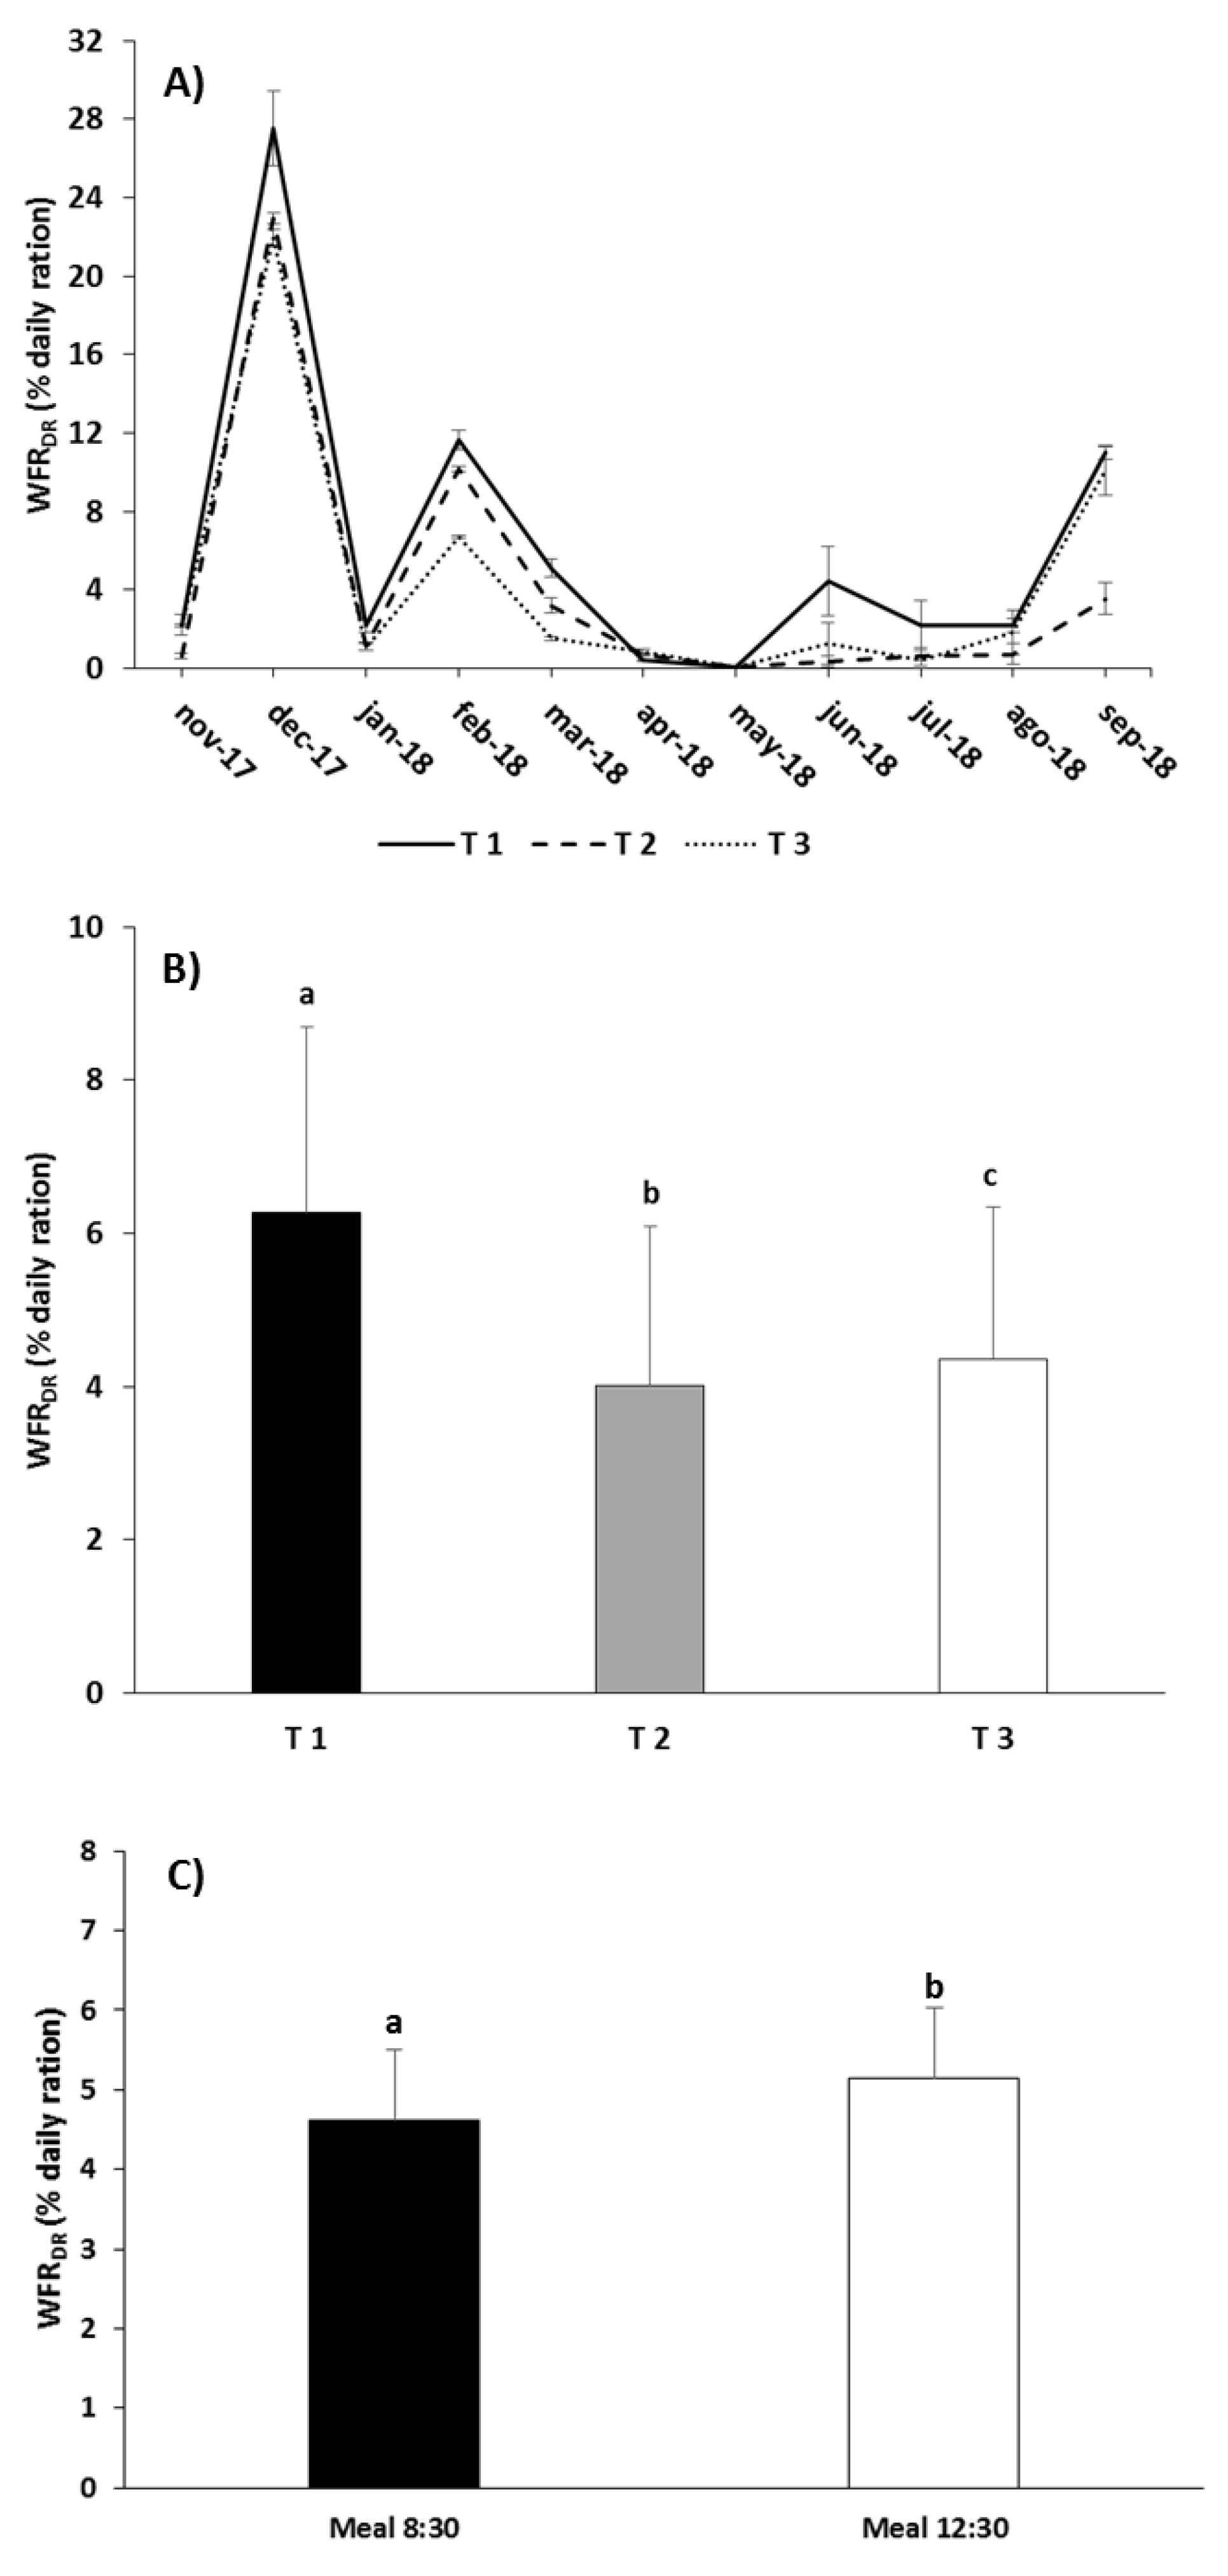
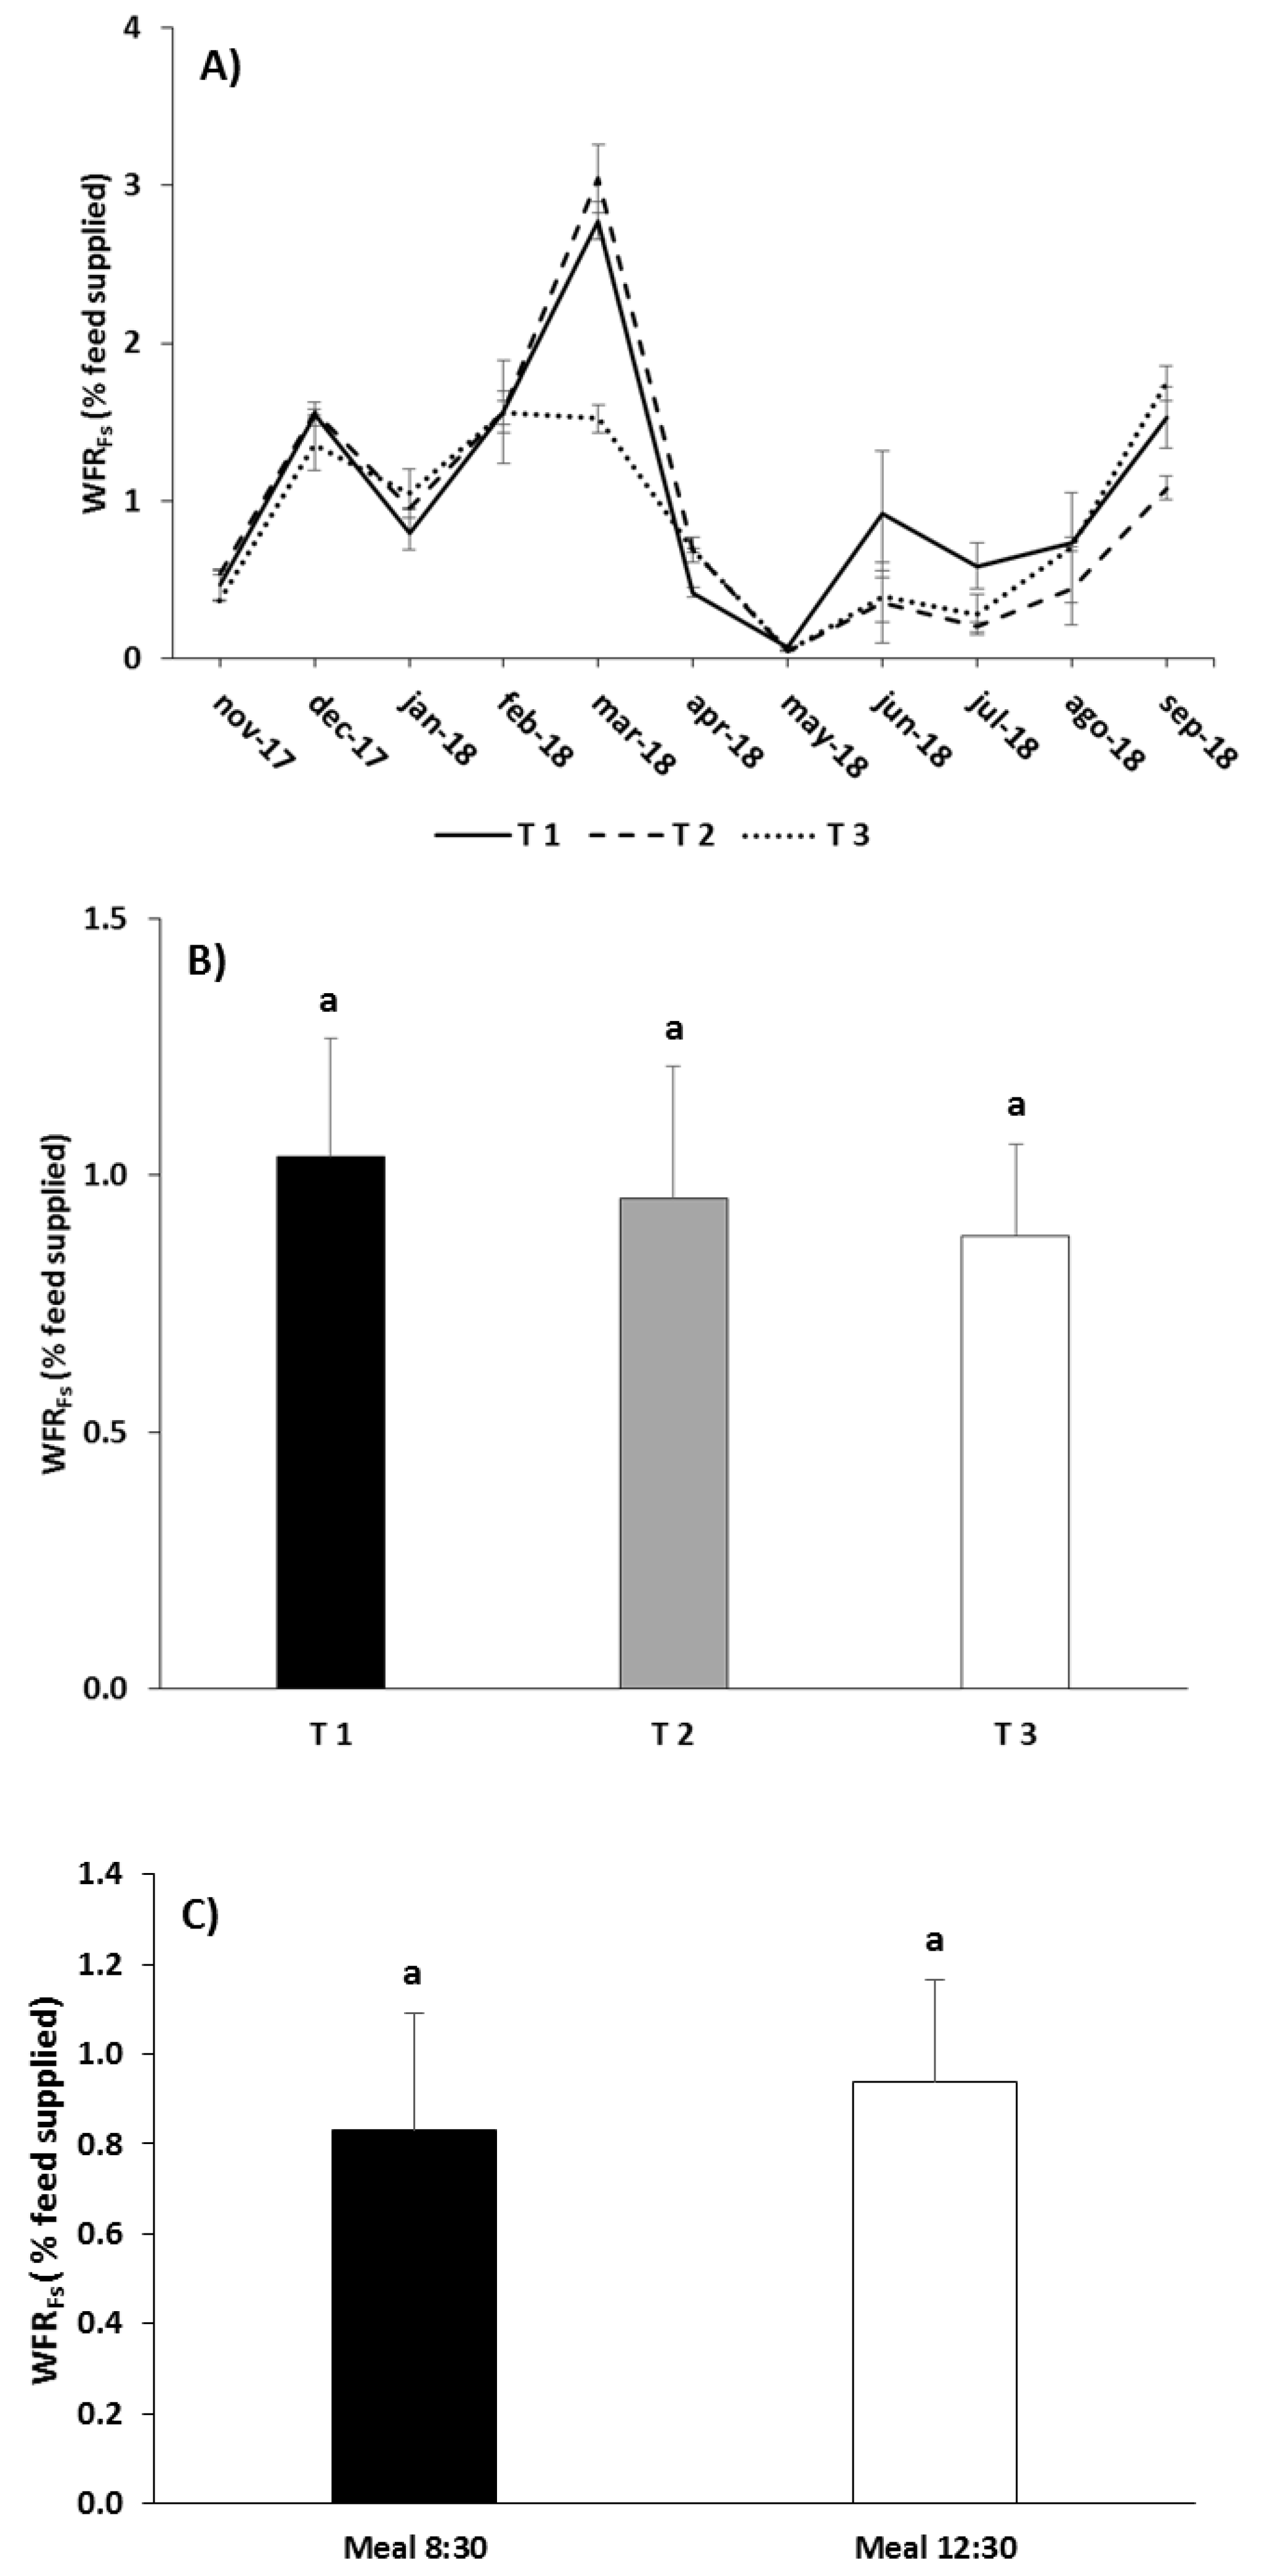
As regards WFRDR, the RM-ANOVA did not detect significant differences due to the interaction “Treatment” × “Meal”, but it did for both factors separately (“Treatment”: p < 0.001; “Meal”: p < 0.05; Table 6). The highest WFRDR occurred during the coldest months and at the end of the trial (Figure 6A). For the entire assay, T1 caused the highest WFRDR and T2 the lowest, with intermediate values in T3 and significant differences among all three treatments (Tukey, p < 0.05; Figure 6B). The second meal at noon produced higher WFRDR values than the first meal (Tukey, p < 0.05; Figure 6C). In the case of WFRFs, there were no significant differences for the interaction of factors or for the factors separately (RM-ANOVA p > 0.05; Table 6). However, it is of note that WFRFs was higher during the coldest months and at the end of the assay (Figure 7A). The highest values were obtained with T1 and the lowest with T3, while T2 showed intermediate values (Figure 7B). Although the differences were not significant, the second meal caused a higher WFRFs than the first meal (Figure 7C).
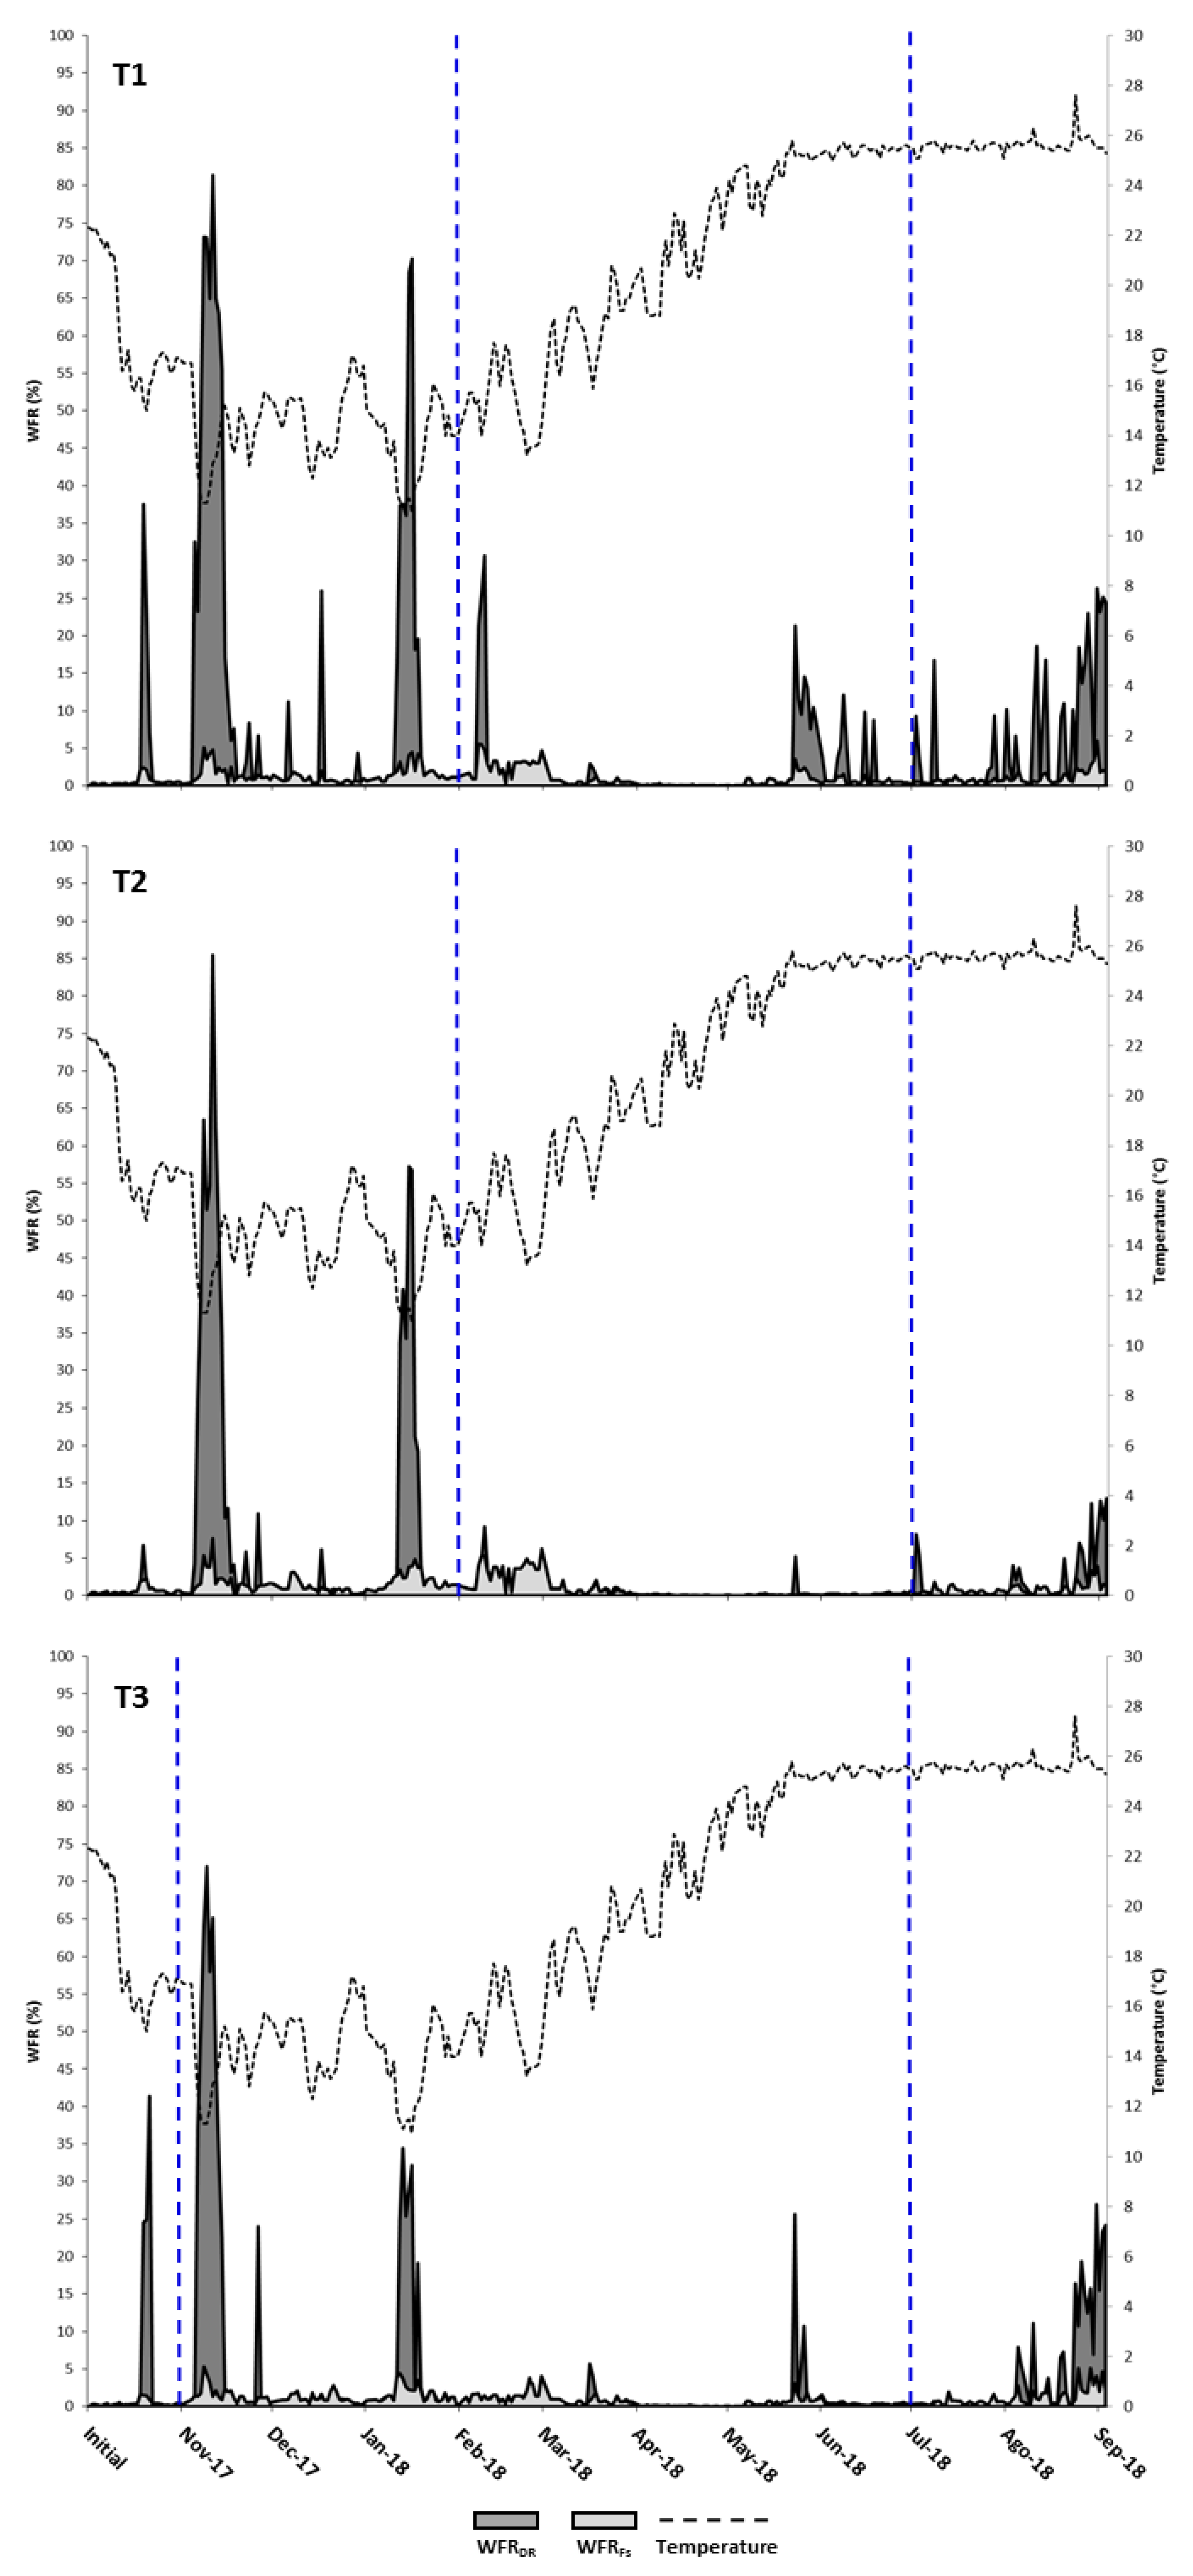
The time series of waste production (Figure 8A–C) showed that WFRFs values remained below 5% for almost the entire trial. Several noteworthy peaks of WFRDR with maximum values of 75%–85% of DR were recorded for all three treatments during winter months, coinciding with a sudden fall in temperature. During the spring months, when the water temperature was rising, the amount of feed wasted in all three treatments remained low, with the exception of some sharp peaks of WFRDR, especially in T1 and, to a lesser extent, in T3. During the summer months, water temperatures remained high and notable peaks of WFRDR were observed in all treatments but especially in T1 and T3 during the last month. Also, feed waste intensified for a few days after changing the type of pellets, particularly in T1.
3.3. Economic Analysis
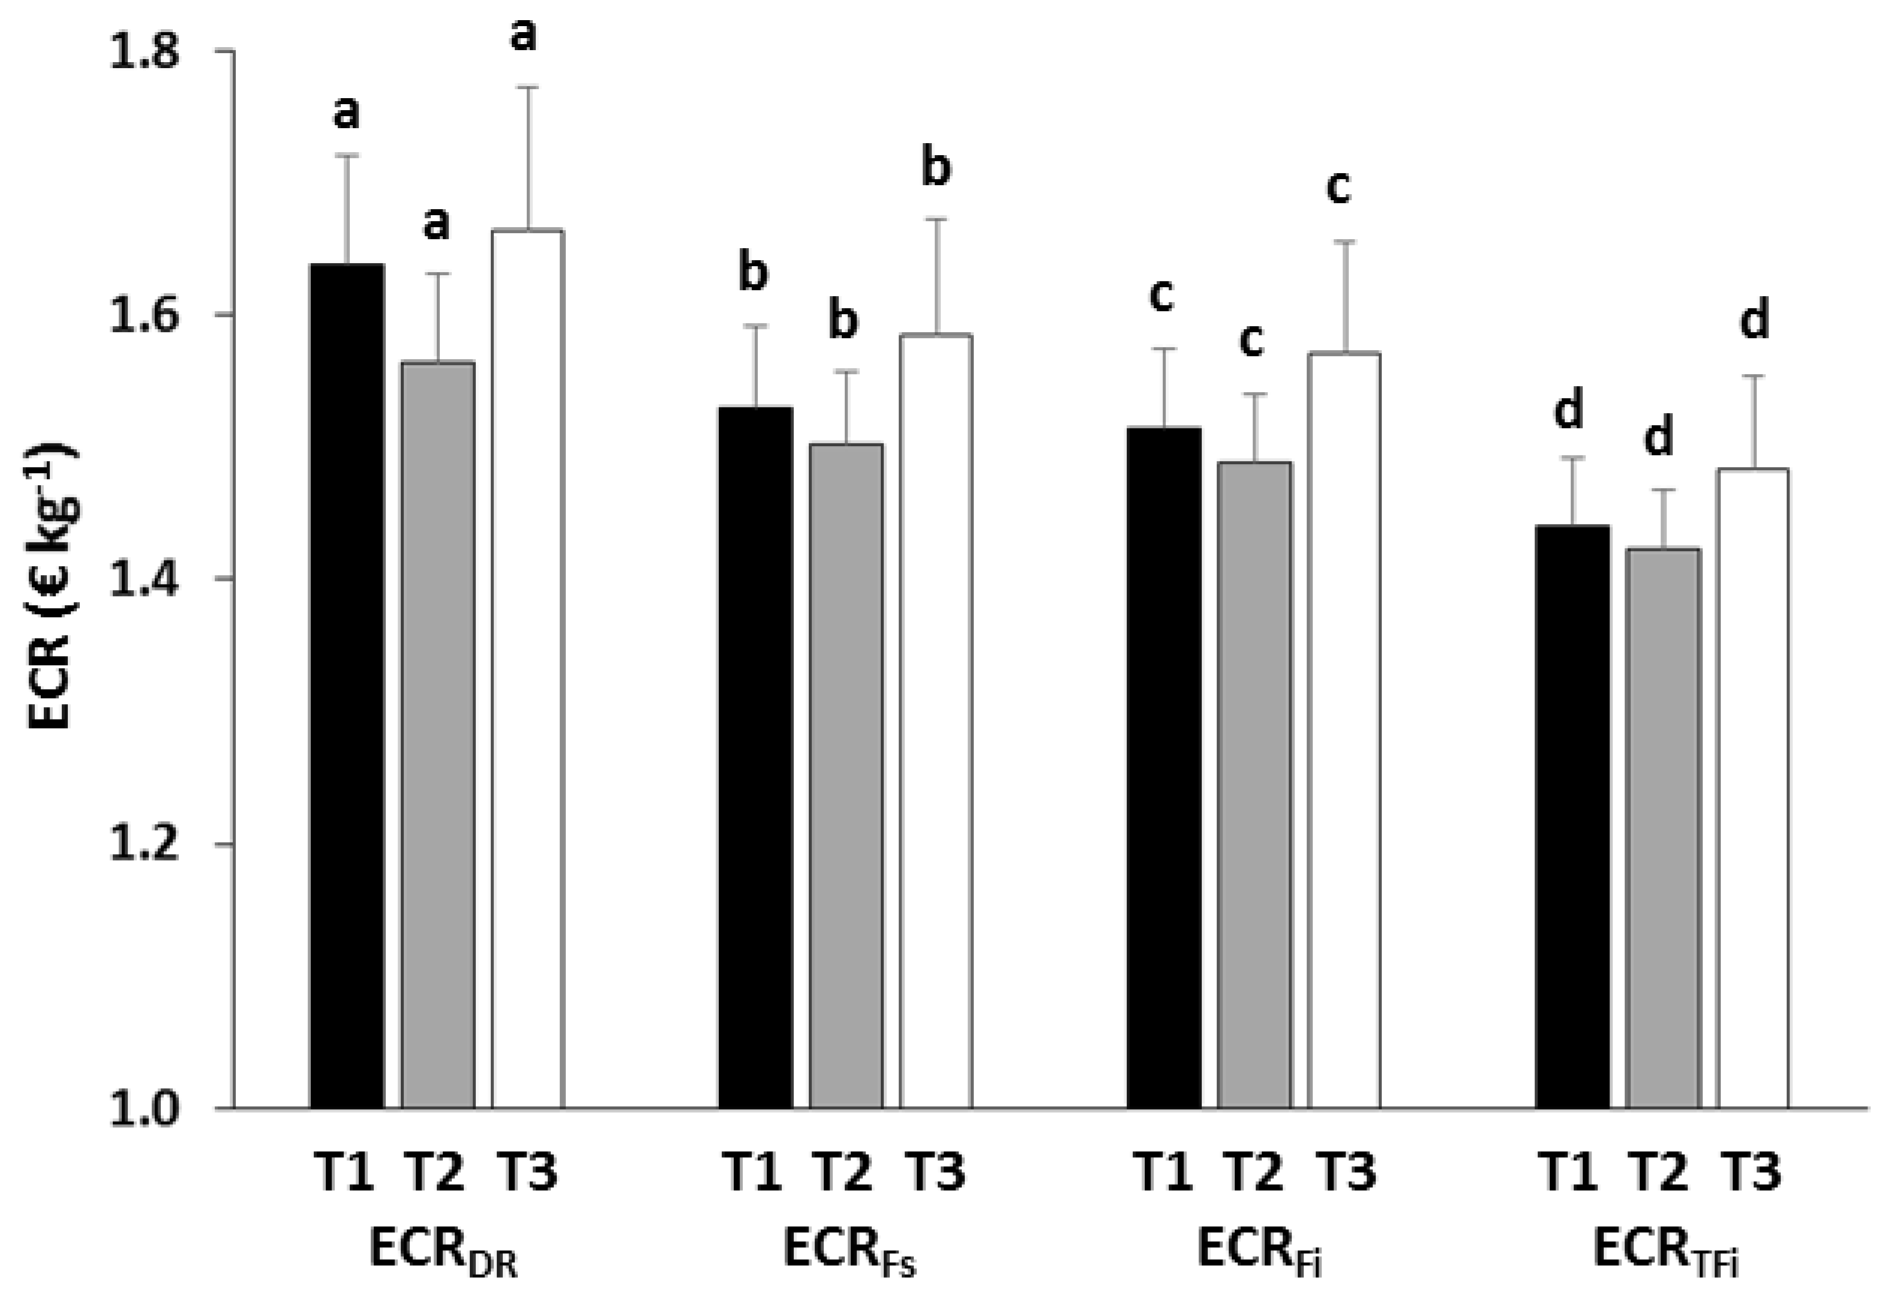
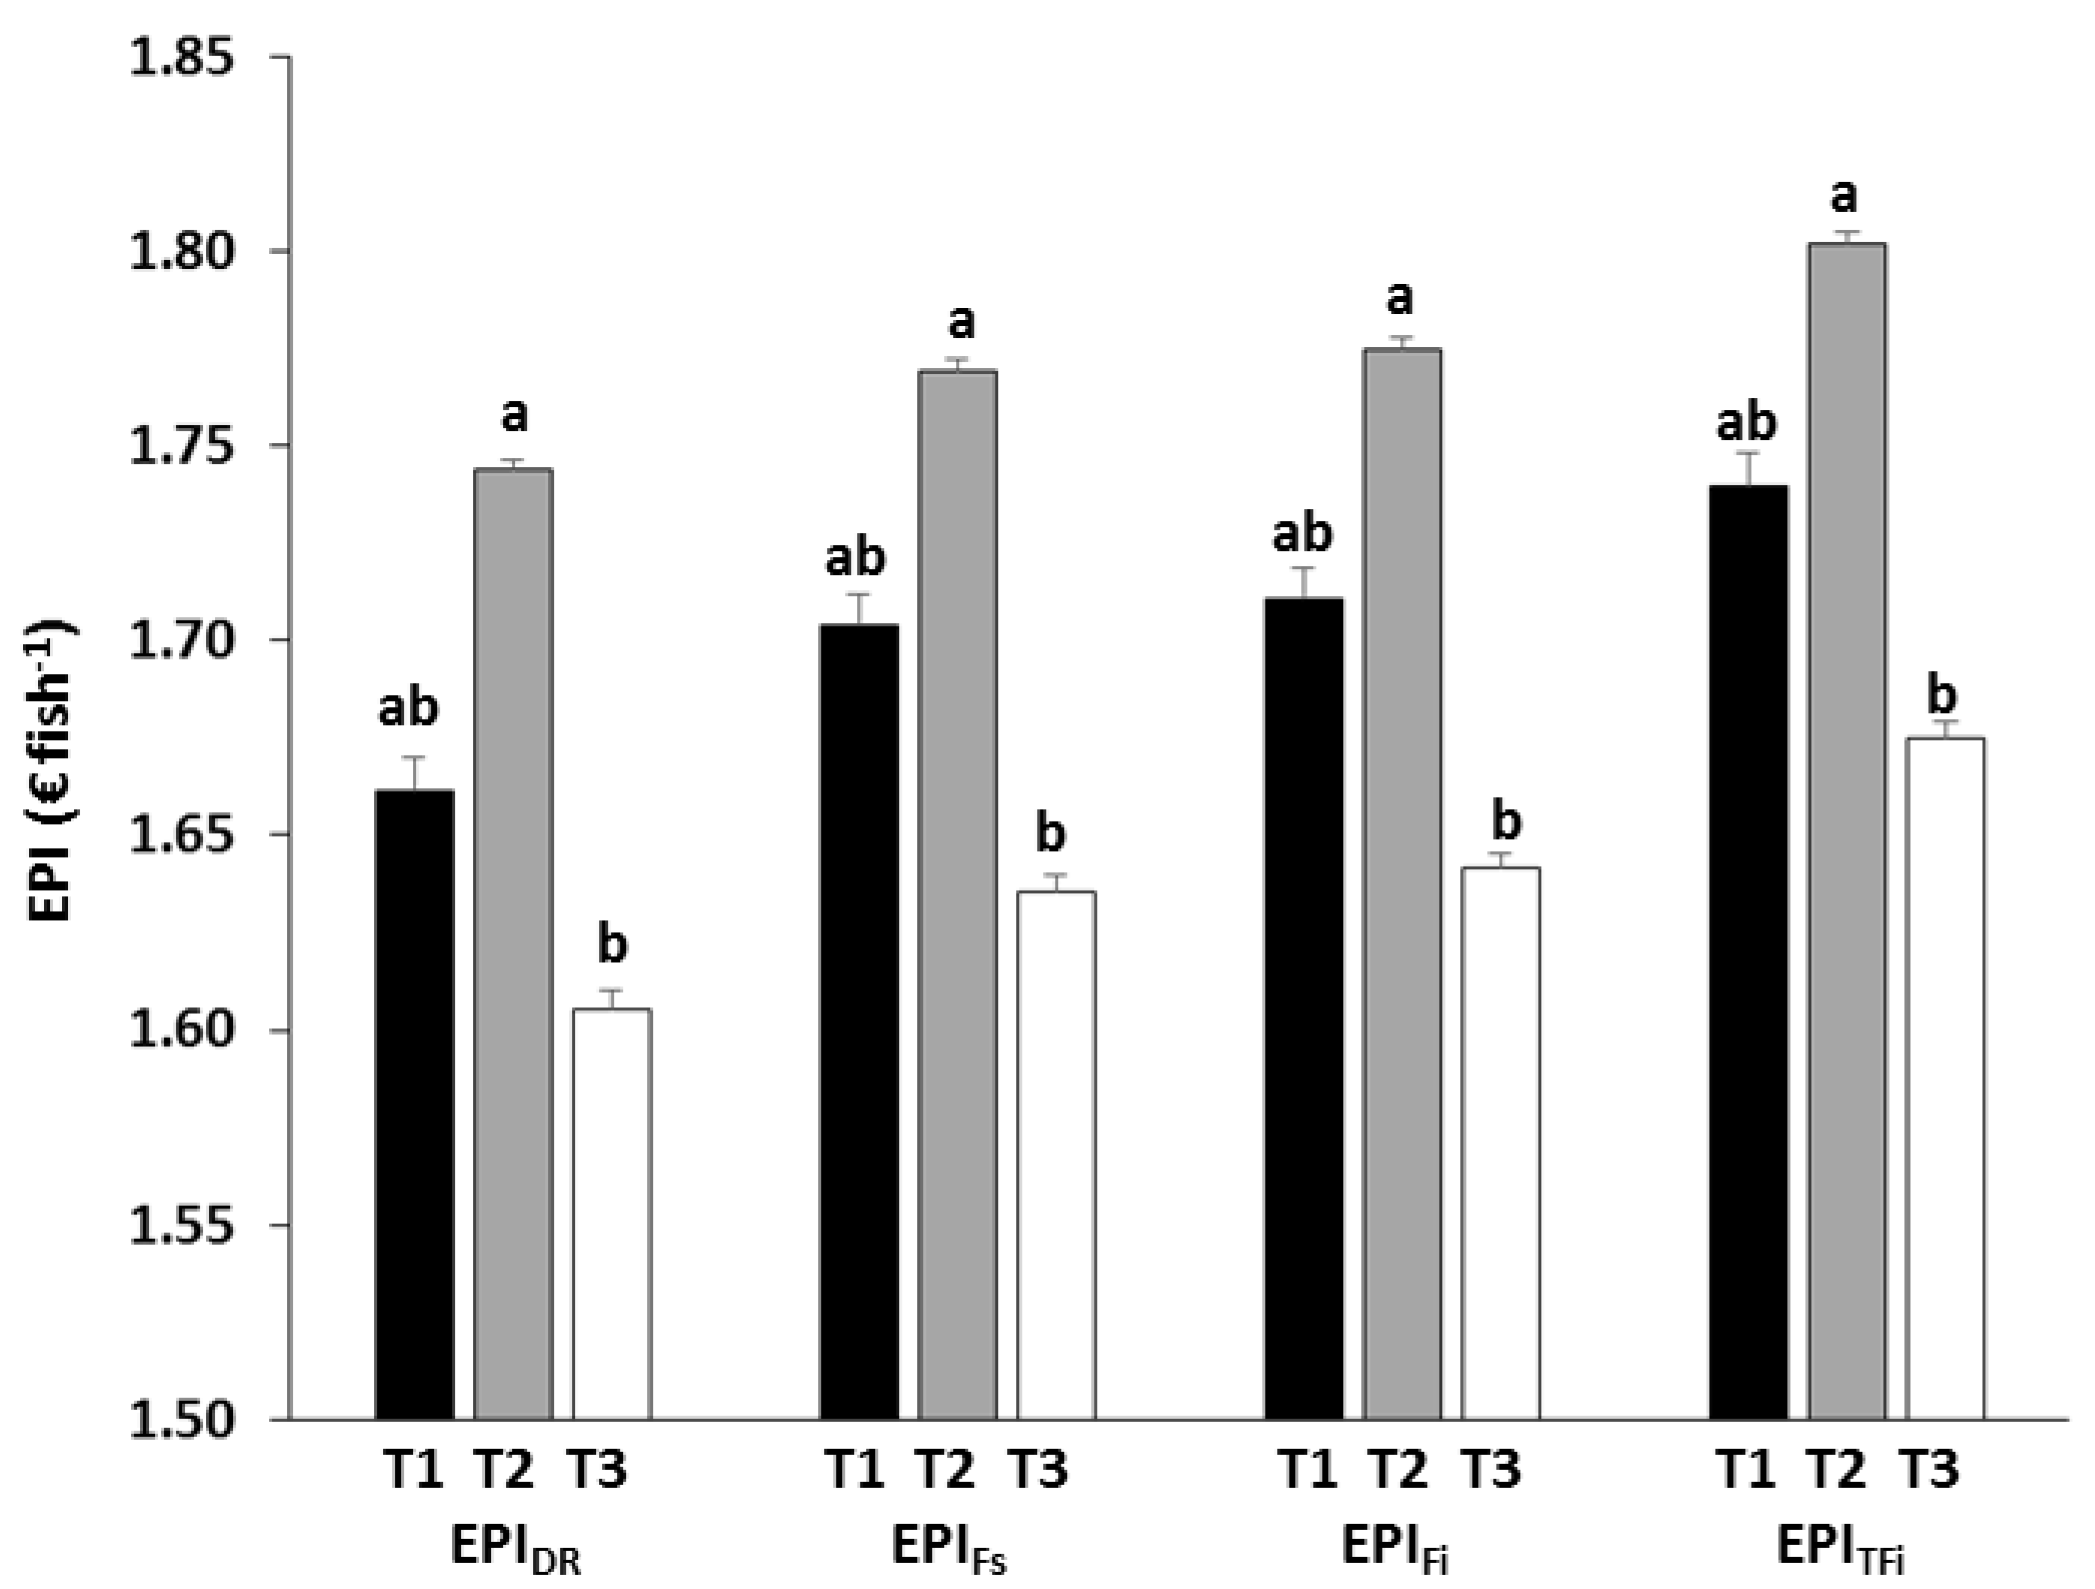
The eFCR was very similar for T1 and T2, and slightly higher in T3 (Table 5), but no significant differences between treatments were detected for the full trial (RM-ANOVA, p > 0.05; Table 6). The ECRs fell since the index was expressed as a function of DR, Fs, Fi and TFi, that is to say, as the control over feeding increased (Figure 9). Despite no significant differences due to treatments were found (RM-ANOVA, p > 0.05; Table 6), the ECRs were always lowest in T2, and highest in T3. The average feed cost of producing one kilogram of seabream using T2 was 2.3% and 5.1% lower than when using T1 and T3, respectively, and the cost of using T1 was 2.9% lower than that obtained with T3. Regarding the EPIs, the one-way ANOVA showed that there were significant differences between treatments (p < 0.05; Table 6). Regardless of what fraction of the feed was used to calculate the EPI (DR, Fs, Fi or TFi), the highest profit per fish was always obtained with T2 and the lowest with T3, with intermediate values obtained for T1 (Figure 10). Significant differences occurred between T2 and T3 (Tukey, p < 0.05), but not between T1 and the other feeding regimes (Tukey, p > 0.05).
4. Discussion
Feeding seabream with a diet consisting of the extended use of pellets of 2 mm, not using feed pellets larger than 4 mm in size (as suggested in [28]), and using a slower suitable feeding rate (T2) for a full fattening cycle led to increased growth, low variability in fish size throughout the fattening process and at harvest, less feed wastage (both related to the delivery rate and the chewing behaviour), lower feed costs and improved economic profitability than when the feed supply rate was higher (T1 and T3) or if, in addition, larger pellets were used (T3). Both T1 and T3 led to higher feed wastage and consequently lower cost-effectiveness. This was the result of an inadequate delivery rate in T1, and due to the greater production of feed fragments after chewing when pellets of 6 mm in size were supplied in T3. It was also found that seabream fed two meals a day wasted more feed during the second meal.
4.1. Growth Performance
It is well known that growth and feed utilization in a fish species differ between individuals due to genetic variability [41,42], and both variables are influenced by interactions between individuals [14,41,43]. Several authors have postulated that direct competition for feed is the main driver controlling growth in seabream [3,15,44,45], since it conditions individual feed intake and causes growth depensation at population level, i.e., increased fish size variability. By suppressing the use of pellets larger than 4 mm (T1 and T2), access to feed was facilitated for a higher number of fish simultaneously and so TFi and SGR were higher than when 6 mm pellets were included in the diet (T3). Consequently, both T1 and T2 feeding regimes lessened the extent of growth depensation and increased the fraction of the population that reached the most valuable marketable sizes compared with T3 at the end of the trial. This could be due to lower competition for feed since instant feed availability was higher when smaller pellets were delivered. When feed was supplied more slowly as in T2, it favoured a higher TFi and growth than when the feed was delivered faster as in T1, because T2 fish could always consume most of the feed supplied. Conversely, the feed supply rate in T1 must have been too high and fish were not able to consume a significant part of the daily ration before it was out of reach [46]. Hence, a combination of the feed supply rate and pellet size used in T2 seems to be better balanced, taking fuller advantage of seabream growth potential at batch level than T1. In T3, when 6 mm pellets were offered, the feed delivery rate became too slow for that particular pellet size, which could have favoured a degree of monopolization of the feed and increased fish size dispersion.
When smaller pellets are supplied the fish need to catch more units to obtain the same ration as when larger pellets are delivered, and this may involve higher energy expenditure [31,47]. Nevertheless, it was found that oxygen consumption did not differ between seabream given identical rations but different pellet sizes [48,49]. With more and smaller pellets available, competition for feed was reduced, and so more energy can be allocated for growth [12,45]. With regards to T3, once the fish began to be fed with larger pellets (the last three months of the trial), differences in growth began to be more prominent. Feeding rates in T3 and T1 in g min−1 were the same but since pellets were larger in T3 the number of pellets per fish and time was lower. So, in T3 competition for feed increased and fewer fish had access to feed simultaneously, which meant a lower TFi and SGR in T3. Thus, fish size variability at the end of the trial was more pronounced inT3, with fewer fish within the most valuable commercial size classes. Due to limitations in the facilities it was not possible to carry out a trial feeding with large pellets at slow feeding rate, but one expects that it would have further favoured the dominant fish, increasing growth depensation effects.
The present study is the only one in the scientific literature dealing with the joint influence of feed supply rate and pellet size on seabream growth. Some studies with Atlantic salmon (Salmo salar) and Eurasian perch (Perca fluviatilis) shared some methodological similarities with ours [24,50,51]. These studies show that feeding rate, delivery rate and pellet size have negligible effects on feed intake and growth in Atlantic salmon (Salmo salar) [50,51], and that feed supply rate does not have a consistent influence on perch growth [24]. Both species studied therefore showed a high degree of flexibility in adapting to different feeding regimes. However, none of the papers mentioned quantified the feed wastage or the financial profit of their feeding strategies. As in the studies mentioned above, seabream also accept different pellet sizes [28] but, by contrast, pellet size combined with the supply rate as feeding factors did have a significant effect on seabream growth. Nevertheless, the different feeding behaviours of these fish species and differences in experimental design mean that any comparison must be made with caution.
4.2. Waste Production
Feed wastage in pisciculture is closely related to feed composition, fish feeding behaviour and feed management [52,53,54]. Also, fish feeding behaviour is strongly influenced by environmental conditions, especially by water temperature. As poikilothermic animals, the fish metabolism slows down as water temperature decreases. In this study during the coldest months the appetite of small seabreams diminished sharply when there were sudden drops in temperature. In light of this and regardless of pellet size and feed delivery rate, feeding requires special attention on the operator´s part since feed waste could become very high [53]. The results also reveal that when feed size is changed more feed may be wasted, so additional attention is required to prevent overfeeding until the fish get used to the new feed. On the other hand, it is also known that fish appetite and feed intake can vary within and between days [55]. In this regard it was noteworthy that seabream fed in two meals wasted more feed in the second meal. This could be related not only with the level of satiety (stomach filling) of the fish [56] but also with their feeding behaviour [26]: after the first meal, seabream are partially satiated so their voracity and appetite are repressed during the second meal, and it was at this time that their peculiar playing/chewing behaviour was emphasized, which involves considerable feed wastage, which may confuse the feeding operators. Hence, the feed supply should be carefully monitored during second or subsequent meals to minimize feed wastage. Regardless of the feeding regime, it was also noticeable that during the warmest months, when feed intake was at its maximum, seabream did not always accept the full daily ration, and a considerable amount of feed would have been wasted without an efficient feeding control. This is because feed intake regulation in fish is carried out at variable time scales [55], and satiety may appear after several consecutive days of intense feed intake.
Simultaneous feed availability for the largest possible number of fish in a rearing unit during feeding depends on the delivery rate and the pellet size [22]. Competition for feed is also related to feed availability, so that feeding too slowly would reduce feed wastage since dominant fish would consume the feed immediately, but it would increase growth depensation effects [3]. Conversely, a feeding rate that is too fast involves higher feed wastage because fish may not be able to capture all the feed before it flows out from the rearing unit [22,24,46]. Under intensive cage seabream farming conditions feed is indefensible and dominant behaviour fades out during feeding [19,21,57]. Nevertheless, it is known that there are always behavioural hierarchies in a fish population in culture conditions, but dominance behaviour could be displayed during non-feeding phases, just before feeding (related to anticipatory activity) [58] or between meals (due to inadequate feeding or territorial defence) [21], so that subjugated fish are increasingly inhibited and less capable of competing efficiently against stronger fish when feed is delivered at a rate that does not allow them to access feed. Therefore, since a given feed supply rate may be too high or too low depending on the size of the pellet used, it is crucial to adjust the feeding strategy accordingly [46] to minimize feed wastage.
For a given size of fish it is obvious that larger pellets should be delivered at a higher rate than smaller ones, so that feed was available to as many fish as possible. However, under these experimental conditions, the most noticeable differences between feeding regimes as regards feed wastage can be attributed mainly to the size of the pellets, and to a lesser extent to the supply rate, since the most pronounced divergence among treatments started to be noticed at the moment T3 began to be fed with 6 mm pellets. Nevertheless, the results also demonstrated that it was easier to control feed wastage when the delivery rate was slower. Supplying smaller pellets at a lower feeding rate (T2 vs. T1) meant there was a greater chance that a higher number of fish could feed simultaneously with less competition and only a moderate waste of feed through chewing, which reduced overall feed wastage. As pellet size increases, seabreams waste more feed since they have to subject the feed to a considerable oral manipulation to reduce its size before swallowing, and consequently a significant amount of feed fragments escape from their mouth [27,28]. Therefore, seabream needs more time to process the feed before taking another pellet. In this way it is also usual that seabream leave the pellets half-processed and go in search of others in the heat of competition for feed, further increasing the fraction of uneaten feed in the form of pellet fragments. Furthermore, if feed delivery rate is also too high, then not only pellet fragments are wasted, but also entire pellets, increasing the feed waste bill.
4.3. Economic Implications
The fish farming industry evaluates its rearing performance in terms of the resources supplied (feed) and obtained (fish biomass) from stocking to harvest, normally through the well-known “economic feed conversion ratio” (eFCR) [31]. Farmers and feed companies consider this index to be a very strong tool for tracking the use of resources and performance of diets, respectively. The eFCR integrates some important resources that are lost in practice, such as fish mortality and escapes, and wasted feed in their different forms, which in the case of seabream are uneaten feed and feed lost by chewing. These lost resources are difficult to measure in real farming conditions, but under experimental conditions it is possible to quantify them, so that feeding strategies and performance can be compared by means of useful economic parameters of concern to the industry, which would help them to define their productive strategy. ECR and EPI include the resources used and obtained and fish mortality during the trial, and also the feed cost (ECR) as well as the sale price of the product (EPI) [40]. Each feeding treatment used varying amounts of different feed types (sizes), whose costs are also different, and which gave rise to different frequency distributions of commercial size classes at the end of the trial and whose sale costs also differed from each other. ECR and EPI were calculated for different levels of feed utilization that exemplified different levels of control over the feeding process, including no control (as if the full rations were always supplied: ECRDR and EPIDR), partial (visual) control of appetite (ECRFs and EPIFs), absolute control of appetite (absence of uneaten feed: ECRFi and EPIFi), and control of feeding behaviour (absence of feed lost by chewing: ECRTFi and EPITFi). Obviously, as the control over feeding increased feed costs decreased and profit increased in all three feeding treatments. Overall, the eFCR showed that T1 and T2 feeding regimes were very similar from a profitability point of view. However, the ECR results revealed that T2 involved the lowest feed costs, regardless of the extent of feeding control, but no significant differences between treatments were detected. For this part, EPI calculation includes ECR and sale prices of the marketable size classes obtained with the experimental treatments, and in this way it was demonstrated that the T2 regime was more profitable than the others, not only because of its lower feed cost and wastes, but also because the lower fish size dispersion obtained with this regime at the end of the trial provided an additional benefit. Hence, ECR and particularly EPI are much more integrative management tools than eFCR, allowing more comprehensive comparisons between feeding regimes.
Feeding performance and, therefore, fish farming sustainability strongly depend on feed formulation and feeding methods [34]. Despite significant advances in fish feed formulation, including alternative raw material to fish meal and oil, there are still unsolved issues to enable the production of safe, suitable and functional feeds to underpin the pisciculture industry [59]. However, even if these gaps were resolved or at least amended, profitability would not improve without adequate on-farm feeding management [31]. Defining how much, how often, at what time/s, and how fast to supply the feed is essential. Under the experimental conditions of the present study, the working effort to feed seabream with the T2 regime was twice that of the other two regimes. Apart from the fact that feed dispensing rate could be better adjusted, the economic impact of implementing a feeding strategy like T2 (smaller pellets, slower delivery rate) with the on-farm feeding methods normally used by the seabream industry would be unaffordable, since the impact of doubling the feeding staff could not be compensated by the benefits of such a feeding strategy. Monitoring the feeding process is even more important than defining an optimal feeding strategy. Supplying the whole daily ration without any control is an inconceivable practice both economically and environmentally [60,61]. In open-sea cage fish farms, controlling the supply of feed through direct observation of fish appetite by farm operators is only possible if operator have the skill and training, and there are many variables that can hinder visual control from outside the culture unit (wind, currents, waves, light, cage size) increasing the risk of overfeeding. Under these conditions, much feed can be wasted when the visual control of fish appetite during feeding is deficient [53]. It is impossible to reduce feed waste to zero, but there is scope for improvement and technological resources can help to reduce waste [54]. Most Mediterranean seabream farms do not have feeding control systems, and feed supply control is still based on the operator´s subjective experience, and on obsolete recommendations of feed manufacturers that do not take into account the particular feeding behaviour of this species. Yet, improving the profitability of seabream industry cannot be understood without a knowledge-based approach, implementing technology to control operational processes [34,62]. The application of T2-type feeding strategies only makes sense if accompanied by a technology-based supply and waste control system, so that a single operator could remotely monitor the process. This lesson was learnt by the salmon industry many years ago [63], and at present the conversion of feed into biomass is close to 1 largely thanks to technology [64]. Seabream farming performance can never reach this level of efficiency because seabream will always chew and play with the feed, but technology can help to improve it. Therefore, the only effective way to reduce this waste is by providing an appropriate pellet size. Hence, there is a need to change in the management of feed pellet size to minimize the fraction of feed wasted by chewing [28], adjusting the feed delivery rate accordingly, and implementing technology to compensate the extra-time needed to feed with smaller pellets more slowly. The latter issue deserves special attention for seabream farming, and more research is needed in this regard.
Funding
This research was funded by the European Regional Development Fund (80%) and the Council for Water, Agriculture, Forestry and Fisheries of the Autonomous Government of the Region of Murcia, Spain (20%), grant number 1420-10.
Acknowledgments
The author would like to thank Antonio Carrión, Carmelo Martínez, Carmen Ballester, Cristino Martínez, Irene Lozano and Jorge López, technicians of IMIDA, for their dedication and commitment throughout the trial. In memoriam of Pedro López Vicente, an aquaculture technician expert in the observation of seabream behaviour and maintenance of aquaculture experimental facilities.
Conflicts of Interest
Maintenance of experimental seabream and trial development were carried out by authorized personnel (ECC/566/2015) in accordance with current EU (Directive 2010/63/UE) and national legislation (Law 32/2007; RD 53/2013).
References
- APROMAR. La Acuicultura en España 2018. Asociación Empresarial de Acuicultura de España. Available online: http://www.apromar.es (accessed on 20 March 2020).
- Colloca, F.; Cerasi, S. Sparus Aurata. In Cultured Aquatic Species Fact Sheets; Crespi, V., New, M., Eds.; FAO: Rome, Italy, 2009; Available online: http://www.fao.org/tempref/FI/DOCUMENT/aquaculture/CulturedSpecies/file/en/en_giltheadseabr.htm (accessed on 20 March 2020).
- Goldan, O.; Popper, D.; Karplus, I. Food competition in small groups of juvenile gilthead seabream (Sparus aurata). Isr. J. Aquac. Bamidgeh 2003, 55, 94–106. [Google Scholar]
- Saoud, I.P.; Davies, D.A.; Roy, L.A.; Phelps, R.P. Evaluating the benefits of size-sorting tilapia fry before stocking. J. Appl. Aquac. 2005, 17, 73–85. [Google Scholar] [CrossRef]
- Brown, R.C. Genetic Management and Selective Breeding in Farmed Populations of Gilthead Seabream (Sparus Aurata). Ph.D. Thesis, University of Stirling, Stirling, Scotland, 2003. [Google Scholar]
- Kuhl, H.; Sarrapoulou, E.; Tine, M.; Kotoulas, G.; Magoulas, A.; Reinhart, R. A comparative BAC map for the gilthead seabream (Sparus aurata L.). J. Biomed. Biotech. 2010, 2011, 329025. [Google Scholar]
- Baras, E.; Dugué, R.; Legendre, M. Do cannibalistic fish forage optimally? An experimental study of prey size preference, bioenergetics of cannibalism and their ontogenic variation in the African catfish Heterobranchus longifilis. Aquat. Living Resour. 2014, 27, 51–62. [Google Scholar] [CrossRef] [Green Version]
- Magnuson, J.J. An analysis of aggressive behaviour, growth and competition for food and space in medaka (Oryzias latipes). Can. J. Zool. 1962, 40, 313–363. [Google Scholar] [CrossRef]
- Hernández, J.; Gasca-Leyva, E. A Size Distribution Model Applied to Fish Farming. In Numerical Methods and Applications. Lecture Notes in Computer Science; Dimov, I., Lirkov, I., Margenov, S., Zlatev, Z., Eds.; Springer: Berlin/Heidelberg, Germany, 2003; Volume 2542, pp. 221–229. [Google Scholar]
- Cammarata, M.; Vazzana, M.; Accardi, D.; Parrinello, N. Seabream (Sparus aurata) long-term dominant-subordinate interplays affects phagocytosis by peroneal cavity cells. Brain Behav. Immun. 2012, 26, 580–587. [Google Scholar] [CrossRef] [PubMed] [Green Version]
- McCarthy, I.D.; Carter, C.G.; Houlihan, D.F. The effect of feeding hierarchy on individual variability in daily feeding of rainbow trout, Oncorhynchus mykiis (Walbaum). J. Fish Biol. 1992, 41, 257–263. [Google Scholar] [CrossRef]
- Montero, D.; Lalumera, G.; Izquierdo, M.S.; Caballero, M.J.; Saroglia, M.; Tort, L. Establishment of dominance relationships in gilthead seabream Sparus aurata juveniles during feeding: Effects on feeding behaviour, feed utilization and fish health. J. Fish Biol. 2009, 74, 790–805. [Google Scholar] [CrossRef]
- Damsgård, B.; Huntingford, F. Fighting and aggression. In Aquaculture and Behaviour; Huntingford, F., Jobling, M., Kadri, S., Eds.; Blackwell Publishing Ltd.: Oxford, UK, 2012; pp. 248–285. [Google Scholar]
- Jobling, M.; Reinsnes, T.G. Physiological and social constraints on growth of Arctic charr, Salvelinus alpinus L.: An investigation of factors leading to stunting. J. Fish Biol. 1986, 28, 379–384. [Google Scholar] [CrossRef]
- Goldan, O.; Popper, D.; Karplus, I. Management of size variation in juvenile gilthead seabream (Sparus aurata) I: Particle size and frequency of feeding dry and live food. Aquaculture 1997, 152, 181–190. [Google Scholar] [CrossRef]
- Ruzzante, D.E. Domestication effects on aggressive and schooling behavior in fish. Aquaculture 1994, 120, 1–24. [Google Scholar] [CrossRef]
- Barki, A.; Harpaz, S.; Hulata, G.; Karplus, I. Effect of larger fish and size grading on growth and size variation in fingerling silver perch. Aquac. Int. 2000, 8, 391–401. [Google Scholar] [CrossRef]
- Jobling, M. Effect of feeding frequency on food intake and growth of Artic charr, Salvelinus alpinus L. J. Fish Biol. 1983, 23, 177–185. [Google Scholar] [CrossRef]
- Ryer, C.H.; Olla, B.L. The influence of food distribution upon the development of aggresive and competitive behaviour in juvenile chum salmon, Oncorhynchus keta. J. Fish Biol. 1995, 46, 264–272. [Google Scholar] [CrossRef]
- Hakoyama, H.; Iguchi, K. Why is competition more intense if food is supplied more slowly? Behav. Ecol. Sociobiol. 1997, 40, 159–168. [Google Scholar] [CrossRef]
- Papadakis, V.M.; Glaropoulos, A.; Alvanopoulou, M.; Kentouri, M. A behavioural approach of dominance establishment in tank-held seabream (Sparus aurata L.) under different feeding conditions. Aquac. Res. 2016, 47, 4015–4023. [Google Scholar] [CrossRef]
- Andrew, J.E.; Holm, J.; Kadri, S.; Huntingford, F.A. The effect of competition on the feeding efficiency and feed handling behaviour in gilthead seabream (Sparus aurata L.) held in tanks. Aquaculture 2004, 232, 317–331. [Google Scholar] [CrossRef]
- Linnér, J.; Brännäs, E. Growth in Arctic charr and rainbow trout fed temporally concentrated of spaced daily meals. Aquac. Int. 2001, 9, 35–44. [Google Scholar] [CrossRef]
- Juell, J.-E.; Lekang, O.I. The effect of feed supply rate on growth of juvenile perch (Perca fluviatilis). Aquac. Res. 2002, 32, 459–464. [Google Scholar] [CrossRef]
- Dwyer, K.S.; Brown, J.A.; Parrish, C.; Lall, S.P. Feeding frequency affects food consumption, feeding pattern and growth of juvenile yellowtail flounder (Limanda ferruginea). Aquaculture 2002, 213, 279–292. [Google Scholar] [CrossRef]
- Artigas, E.G. Feeding Policy for Marine Fish; Pro Aqua Nutrición: Burgos, Spain, 1999; pp. 21–22. [Google Scholar]
- Andrew, J.E.; Anras, M.L.B.; Kadri, S.; Holm, J.; Huntingford, F.A. Feeding responses of hatchery-reared Gilthead Sea bream (Sparus aurata L.) to a commercial diet and natural prey items. Mar. Freshw. Behav. Physiol. 2003, 36, 77–86. [Google Scholar] [CrossRef] [Green Version]
- Ballester-Moltó, M.; Sanchez-Jerez, P.; García-García, J.; Cerezo-Valverde, J.; Aguado- Giménez, F. Controlling feed losses by chewing in gilthead sea bream (Sparus aurata) ongrowing may improve the fish farming environmental sustainability. Aquaculture 2016, 464, 111–116. [Google Scholar] [CrossRef]
- Koçak, Ö.; Tathdil, F.F. Cost analysis in gilthead seabream (Sparus aurata Linnaeus, 1758) and seabass (Dicentrarchus labrax Linnaeus, 1758) production in Milas District—Muğla province, Turkey. Turk. J. Fish. Aquat. Sci. 2004, 4, 33–38. [Google Scholar]
- Rana, K.J.; Siriwardena, S.; Mohammed, R.H. Impact of Rising Feed Ingredient Prices on Aquafeeds and Aquaculture Production; FAO Fisheries and Aquaculture Technical Paper: Rome, Italy, 2009; Volume 541, pp. 1–78. [Google Scholar]
- Robb, D.H.F.; Crampton, V.O. On-farm feeding and feed management: Perspectives from the fish feed industry. In On-Farm, Feeding and Feed Management in Aquaculture; Hasan, M.R., New, M.B., Eds.; FAO Fisheries and Aquaculture Technical Paper: Rome, Italy, 2013; Volume 583, pp. 489–518. [Google Scholar]
- Amirkolaie, A.K. Reduction in the environmental impact of waste discharged by fish farms through feed and feeding. Rev. Aquac. 2011, 3, 19–26. [Google Scholar] [CrossRef]
- White, P. Environmental consequences of poor feed quality and feed management. In On-Farm, Feeding and Feed Management in Aquaculture; Hasan, M.R., New, M.B., Eds.; FAO Fisheries and Aquaculture Technical Paper: Rome, Italy, 2013; Volume 583, pp. 553–564. [Google Scholar]
- García-García, B.; Rosique-Jiménez, C.; Aguado-Giménez, F.; García-García, J. Life cycle assessment of gilthead seabream (Sparus aurata) production in offshore fish farms. Sustainability 2016, 8, 1228–1237. [Google Scholar] [CrossRef] [Green Version]
- Ortega, A. Cultivo de Dorada (Sparus Aurata), 1st ed.; Serie Cuadernos de Acuicultura nº 1; Fundación Observatorio Español de Acuicultura, Consejo Superior de Investigaciones Científicas, Ministerio de Medio Ambiente y Medio Rural y Marino: Madrid, Spain, 2008; pp. 1–44. [Google Scholar]
- Tucker, J.W. Marine Fish. In Culture, 1st ed.; Kluwer Academic Publishers: Massachusetts, MA, USA, 1998; pp. 72–81. [Google Scholar]
- Mayer, P.; Estruch, V.D.; Jover, M. A two-stage growth model for gilthead sea bream (Sparus aurata) based on the thermal growth coefficient. Aquaculture 2012, 358–359, 6–13. [Google Scholar] [CrossRef]
- Cho, C.Y.; Bureau, D.P. Development of bioenergetics models and the Fish-PrFEQ software to estimate production, feeding ration and waste output in aquaculture. Aquat. Living Res. 1998, 11, 199–210. [Google Scholar] [CrossRef]
- Mayer, P.; Estruch, V.D.; Blasco, J.; Jover, M. Predicting growth of gilthead sea bream (Sparus aurata) in marine farms under real productions conditions using temperature and time-dependent models. Aquac. Res. 2008, 39, 1046–1052. [Google Scholar] [CrossRef]
- Martínez-Llorens, S.; Tomás, A.; Jover, M. A new tool for determining the optimum fish meal and vegetable meals in diets for maximizing the economic profitability of gilthead seabream (Sparus aurata L.) feeding. Aquac. Res. 2011, 43, 1697–1709. [Google Scholar] [CrossRef]
- Weatherley, A.H.; Gill, H.S. The Biology of Fish. In Growth, 1st ed.; Academic Press: London, UK, 1987; pp. 256–262. [Google Scholar]
- Wedemeyer, G.A. Physiology of Fish. In Intensive Culture Systems, 1st ed.; Chapman & Hall, International Thompson Publishing: New York, NY, USA, 1996; pp. 166–170. [Google Scholar]
- Lall, S.P.; Tibbetts, S.M. Nutrition, feeding and behavior of fish. Vet. Clin. Exot. Anim. 2009, 12, 361–372. [Google Scholar] [CrossRef] [Green Version]
- Karplus, I.; Popper, D.; Goldan, O. The effect of food competition and relative size of group members on growth of juvenile gilthead seabream, Sparus aurata. Fish Physiol. Biochem. 2000, 22, 119–123. [Google Scholar] [CrossRef]
- Okinomidou, E.; Batzina, A.; Karakatsouli, N. Effects of food quantity and distribution on aggressive behaviour of gilthead seabream and European seabass. Appl. Anim. Behav. Sci. 2019, 213, 124–130. [Google Scholar] [CrossRef]
- Alanärä, A.; Kadri, S.; Paspatis, M. Feeding management. In Food Intake in Fish; Houlihan, D., Boujard, T., Jobling, M., Eds.; Blackwell Science Ltd.: London, UK, 2001; pp. 332–353. [Google Scholar]
- Smith, I.P.; Metcalfe, N.B.; Huntingford, F.A. The effect of food pellet dimensions on feeding responses by Atlantic salmon (Salmo salar L.) in a marine net pen. Aquaculture 1995, 130, 167–175. [Google Scholar] [CrossRef]
- Aguado-Giménez, F. Final Report of the Project Reduction of Production Costs due to Feeding, and the Environmental Impact of Gilthead Seabream (Sparus Aurata) Farming. Inclusion of Microalgae in the Diet and Establishment of Optimal Feeding Strategies; Murcian Institute for Agricultural and Food Research and Development (IMIDA), European Fund for Regional Development (EFRD; 80%) and Council for Water, Agriculture, Forestry and Fisheries of the Autonomous Government of the Region of Murcia: Murcia, Spain, 2018; pp. 1–68. [Google Scholar]
- Aguado-Giménez, F. Training and Technology Transfer Service, Council of Water, Agriculture, Forestry and Fisheries. In Practical Recommendations to Improve Feeding of Gilthead Seabream (Sparus Aurata) Reared in Floating Cages, 1st ed.; Autonomous Government of the Region of Murcia: Murcia, Spain, 2019; pp. 1–49. [Google Scholar]
- Juell, J.-E.; Bjordal, A.; Fernö, A.; Huse, I. Effect of feeding intensity on food intake and growth of Atlantic salmon, Salmo salar L., in sea cages. Aquac. Fish. Manag. 1994, 25, 453–464. [Google Scholar] [CrossRef]
- Bailey, J.; Alanärä, A.; Crampton, V. Do delivery rate and pellet size affect growth rate in Atlantic salmon (Salmo salar L.) raised under semi-commercial farming conditions? Aquaculture 2003, 224, 79–88. [Google Scholar] [CrossRef]
- Cho, C.Y.; Bureau, D.P. A review of diet formulation strategies and feeding systems to reduce excretory and feed wastes in aquaculture. Aquac. Res. 2001, 32, 349–360. [Google Scholar] [CrossRef]
- Ballester-Moltó, M.; Sanchez-Jerez, P.; Cerezo-Valverde, J.; Aguado- Giménez, F. Particulate waste outflow from fish-farming cages. How much is uneaten feed? Mar. Pollut. Bull. 2017, 119, 23–30. [Google Scholar] [CrossRef]
- Zhou, C.; Xu, D.; Lin, K.; Sun, C.; Yang, X. Intelligent feeding control methods in aquaculture with an emphasis on fish: A review. Rev. Aquac. 2018, 10, 975–993. [Google Scholar] [CrossRef]
- Jobling, M.; Baardvik, B.M. Patterns of growth of maturing and immature Arctic charr, Salvelinus alpinus, in a hatchery population. Aquaculture 1991, 94, 343–354. [Google Scholar] [CrossRef]
- Carter, C.; Houlihan, D.; Kiessling, A.; Médale, F.; Jobling, M. Physiological effects of feeding. In Food Intake in Fish; Houlihan, D., Boujard, T., Jobling, M., Eds.; Blackwell Science Ltd.: London, UK, 2001; pp. 297–331. [Google Scholar]
- Grant, J.W.A. Whether or not to defend? The influence of resource distribution. Mar. Behav. Physiol. 1993, 23, 137–153. [Google Scholar] [CrossRef]
- Sánchez, J.A.; López-Olmeda, J.F.; Blanco-Vives, B.; Sánchez-Vázquez, F.J. Effects of feeding schedule on locomotor activity rhythms and stress response in seabream. Physiol. Behav. 2009, 98, 125–129. [Google Scholar] [CrossRef]
- Glencross, B.D.; Baily, J.; Berntssen, M.H.G.; Hardy, R.; MacKenzie, S.; Tocher, D.R. Risk assessment of the use of alternative animal and plant raw material resources in aquaculture feeds. Rev. Aquac 2019. [Google Scholar] [CrossRef] [Green Version]
- Naylor, R.L.; Goldburg, R.J.; Primavera, J.H.; Kautsky, N.; Beveridge, M.C. Effect of aquaculture on world fish supplies. Nature 2000, 405, 1017–1024. [Google Scholar] [CrossRef] [Green Version]
- Li, D.; Xu, L.; Liu, H. Detection of uneaten fish food pellets in underwater images for aquaculture. Aquac. Eng. 2017, 78, 85–94. [Google Scholar] [CrossRef]
- Føre, M.; Frank, K.; Norton, T.; Svendsen, E.; Alfredsen, J.A.; Dempster, T.; Eguiraun, H.; Watson, W.; Stahl, A.; Sunde, L.M.; et al. Precision fish farming: A new framework to improve production in aquaculture. Biosyst. Eng. 2017, 173, 176–193. [Google Scholar] [CrossRef]
- Tveteras, S. Norwegian salmon aquaculture and sustainability: The relationship between environmental quality and industry growth. Mar. Res. Econ. 2002, 17, 131–132. [Google Scholar] [CrossRef] [Green Version]
- Marine Harvest. The Marine Harvest Salmon Farming Industry Handbook; Marine Harvest ASA: Norway, 2019; pp. 1–114. Available online: https://ml.globenewswire.com/Resource/Download/1766f220-c83b-499a-a46e-3941577e038b (accessed on 20 March 2020).
Figure 1.
Reported monthly mortality (mean ± standard error) in the different feeding treatments, and water temperature during the trial.
Figure 1.
Reported monthly mortality (mean ± standard error) in the different feeding treatments, and water temperature during the trial.

Figure 2.
Monthly (A) and overall (B) values of specific growth rate (SGR) in the different experimental feeding treatments (mean ± standard error). Different letters above the columns indicate significant differences (Tukey HSD, P < 0.05) between feeding treatments.
Figure 2.
Monthly (A) and overall (B) values of specific growth rate (SGR) in the different experimental feeding treatments (mean ± standard error). Different letters above the columns indicate significant differences (Tukey HSD, P < 0.05) between feeding treatments.

Figure 3.
Monthly (A) and overall (B) values of the coefficient of variation (CV) in the different experimental feeding treatments (mean ± standard error). Different letters above the columns indicate significant differences (Tukey HSD, P < 0.05) between feeding treatments.
Figure 3.
Monthly (A) and overall (B) values of the coefficient of variation (CV) in the different experimental feeding treatments (mean ± standard error). Different letters above the columns indicate significant differences (Tukey HSD, P < 0.05) between feeding treatments.

Figure 4.
Fish size frequency distribution according to the commercial sizes managed by the seabream industry (mean ± standard error).
Figure 4.
Fish size frequency distribution according to the commercial sizes managed by the seabream industry (mean ± standard error).

Figure 5.
Monthly (A) and overall (B) values of the feed lost by chewing (LbC, as a function of the feed supplied (Fs)) in the different experimental feeding treatments (mean ± standard error). Different letters above the columns indicate significant differences (Tukey HSD, P < 0.05) between feeding treatments.

Figure 6.
Monthly (A), overall by treatment (B), and overall by meal time (C) values of the waste feed rate (WFRDR, as a function of the daily ration) in the different experimental feeding treatments (mean ± standard error). Different letters above the columns indicate significant differences (Tukey HSD, p < 0.05) between feeding treatments.

Figure 7.
Monthly (A), overall by treatment (B), and overall by meal time (C) values of the waste feed rate (WFRFs, as a function of the feed supplied) in the different experimental feeding treatments (mean ± standard error). Different letters over the columns indicate significant differences (Tukey HSD, p < 0.05) between feeding treatments.

Figure 8.
Daily mean values of WFRDR and WFRFs in each feeding treatment throughout the trial and water temperature. Vertical blue dotted lines indicate the dates of change of feed type.
Figure 8.
Daily mean values of WFRDR and WFRFs in each feeding treatment throughout the trial and water temperature. Vertical blue dotted lines indicate the dates of change of feed type.

Figure 9.
Overall values (mean ± standard error) of the different economic conversion ratios (ECR). Different letters over the columns indicate significant differences (Tukey HSD, p < 0.05) between feeding treatments.
Figure 9.
Overall values (mean ± standard error) of the different economic conversion ratios (ECR). Different letters over the columns indicate significant differences (Tukey HSD, p < 0.05) between feeding treatments.

Figure 10.
Overall values (mean ± standard error) of the different economic profit index (EPI). Different letters over the columns indicate significant differences (Tukey HSD, p < 0.05) between feeding treatments.
Figure 10.
Overall values (mean ± standard error) of the different economic profit index (EPI). Different letters over the columns indicate significant differences (Tukey HSD, p < 0.05) between feeding treatments.


Table 1.
Stocking conditions (mean ± standard error) of the experimental feeding treatments BWi: initial body weight; CVi: initial coefficient of variation; Di: initial fish density.
Table 1.
Stocking conditions (mean ± standard error) of the experimental feeding treatments BWi: initial body weight; CVi: initial coefficient of variation; Di: initial fish density.
| Feeding Regime | Pellet Size/Fish Weight | Feeding Rate (g min−1) | BWi (kg) | CVi (%) | Di (kg m−3) |
|---|---|---|---|---|---|
| T1 | 2 mm: from 50 to 100 g | 20 | 0.049 ± 0.004 | 10.36 ± 0.43 | 2.07 ± 0.02 |
| 4 mm: from 100 to 450 g | |||||
| T2 | 2 mm: from 50 to 100 g | 10 | 0.049 ± 0.005 | 10.71 ± 0.49 | 2.08 ± 0.03 |
| 4 mm: from 100 to 450 g | |||||
| T3 | 2 mm: from 50 to 70 g | 20 | 0.050 ± 0.005 | 10.83 ± 0.63 | 2.10 ± 0.03 |
| 4 mm: from 70 to 220 g | |||||
| 6 mm from 220 to 450 g |
Table 2.
Proximate composition, number of pellets per weight and price of the different fish feeds used in the trial.
Table 2.
Proximate composition, number of pellets per weight and price of the different fish feeds used in the trial.
| Pellet Size: | 2 mm A | 2 mm B/4 mm A | 4 mm B/6 mm |
|---|---|---|---|
| Crude proteins (%) | 48.5 | 46.0 | 44.0 |
| Crude lipids (%) | 18.0 | 19.0 | 21.0 |
| Ash (%) | 6.4 | 5.9 | 6.3 |
| Fibre (%) | 2.7 | 4.5 | 3.0 |
| Moisture (%) | 8.7 | 7.9 | 8.2 |
| N°. pellets g−1 | 90 | 90/23 | 23/9 |
| Feed price (€ kg−1) | 1.09 | 1.09/1.00 | 1.00/0.96 |
Table 3.
Feeding schedule and cost of the feed for the different experimental feeding regimes. Diet cost is the weighed cost of each feeding regime according to the amount of feed of each type used.
Table 3.
Feeding schedule and cost of the feed for the different experimental feeding regimes. Diet cost is the weighed cost of each feeding regime according to the amount of feed of each type used.
| Pellet Size | ||||||
|---|---|---|---|---|---|---|
| Feeding Regime | 2 mm A | 2 mm B | 4 mm A | 4 mm B | 6 mm | Diet Cost (€ kg−1) |
| T1 Months delivering | 1 | 3 | 4 | 3 | - | 1.012 |
| Feeding rate: g min−1 | 20 | 20 | 20 | 20 | - | |
| Pellets fish−1 min−1: | 36–54 | 36–54 | 10–12 | 10–12 | - | |
| Meal duration (min): | 0.9–2 | 0.9–2 | 1.5–9 | 1.5–9 | - | |
| T2 Months delivering | 1 | 3 | 4 | 3 | - | 1.012 |
| Feeding rate: g min−1 | 10 | 10 | 10 | 10 | - | |
| Pellets fish−1 min−1: | 18–27 | 18–27 | 5–6 | 5–6 | - | |
| Meal duration (min): | 1.2–4 | 1.2–4 | 3–23 | 3–23 | - | |
| T3 Months delivering | 1 | - | 7 | - | 3 | 0.979 |
| Feeding rate: g min−1 | 20 | - | 20 | - | 20 | |
| Pellets fish−1 min−1: | 36–54 | - | 10–12 | - | 4–6 | |
| Meal duration (min): | 0.9–2 | - | 1.5–9 | - | 6–10 | |
Table 4.
Monthly (mean ± standard error) SFR (specific feeding rate, as % of fish body weight ∙ day−1) and feed fractions (in g) throughout the trial. DR: daily ration; Of: “overfeed” is the feed that would have been wasted if it had been supplied considering that the whole DR was delivered; Fs: supplied feed (DR - Of); Uf: “uneaten feed” is the supplied but unconsumed feed; Fi: feed intake (Fs - Uf); LbC: feed lost by chewing; TFi: truly ingested feed (Fi - LbC). Different letter over the column indicates significant differences between feeding regimes (Tukey’s honest significant difference (HSD), P < 0.05).
| T1 | a | a | a | a | a | a | ab | a |
|---|---|---|---|---|---|---|---|---|
| Month | SFR | DR | Of | Fs | Uf | Fi | LbC | TFi |
| November-17 | 1.15 ± 0.00 | 2143 ± 3 | 37 ± 3 | 2106 ± 6 | 10 ± 2 | 2096 ± 4 | 40 ± 5 | 2056 ± 1 |
| December-17 | 0.69 ± 0.00 | 1368 ± 0 | 361 ± 27 | 1007 ± 27 | 16 ± 1 | 991 ± 26 | 44 ± 2 | 947 ± 28 |
| January-18 | 0.54 ± 0.00 | 1144 ± 14 | 16 ± 4 | 1128 ± 18 | 9 ± 1 | 1119 ± 17 | 45 ± 2 | 1074 ± 15 |
| February-18 | 0.56 ± 0.00 | 1198 ± 0 | 123 ± 5 | 1075 ± 5 | 17 ± 1 | 1058 ± 6 | 51 ± 0 | 1007 ± 6 |
| March-18 | 0.73 ± 0.01 | 1618 ± 0 | 39 ± 6 | 1579 ± 6 | 44 ± 2 | 1535 ± 7 | 56 ± 8 | 1480 ± 15 |
| April-18 | 0.86 ± 0.01 | 2400 ± 0 | 0 ± 0 | 2400 ± 0 | 10 ± 1 | 2390 ± 1 | 84 ± 5 | 2306 ± 6 |
| May-18 | 1.18 ± 0.02 | 4727 ± 31 | 0 ± 0 | 4727 ± 31 | 3 ± 0 | 4724 ± 31 | 119 ± 3 | 4605 ± 34 |
| June-18 | 1.47 ± 0.05 | 5610 ± 138 | 201 ± 83 | 5409 ± 55 | 50 ± 22 | 5359 ± 33 | 191 ± 14 | 5168 ± 19 |
| July-18 | 1.40 ± 0.03 | 9950 ± 242 | 164 ± 119 | 9786 ± 123 | 58 ± 15 | 9728 ± 108 | 567 ± 0 | 9161 ± 109 |
| August-18 | 1.29 ± 0.03 | 10,987 ± 319 | 162 ± 40 | 10825 ± 279 | 80 ± 5 | 10,745 ± 274 | 828 ± 9 | 9917 ± 282 |
| September-18 | 1.26 ± 0.01 | 10,719 ± 361 | 1030 ± 20 | 9689 ± 341 | 148 ± 14 | 9958 ± 819 | 837 ± 1 | 8705 ± 353 |
| Total | 51,864 ± 1102 | 2132 ± 224 | 49,732 ± 878 | 443 ± 27 | 49,288 ± 851 | 2861 ± 5 | 46,427 ± 857 | |
| 4.11% DR | 95.89% DR | 0.89% Fs | 99.11% Fs | 5.81% Fi | 89.51% DR | |||
| T2 | a | a | b | a | a | a | a | a |
| November-17 | 1.14 ± 0.00 | 2146 ± 0 | 3 ± 3 | 2143 ± 3 | 12 ± 0 | 2132 ± 3 | 45 ± 1 | 2086 ± 4 |
| December-17 | 0.69 ± 0.01 | 1368 ± 0 | 297 ± 4 | 1071 ± 4 | 17 ± 0 | 1054 ± 4 | 22 ± 1 | 1032 ± 5 |
| January-18 | 0.52 ± 0.00 | 1138 ± 20 | 2 ± 2 | 1136 ± 22 | 11 ± 0 | 1125 ± 22 | 42 ± 2 | 1083 ± 20 |
| February-18 | 0.56 ± 0.00 | 1205 ± 13 | 105 ± 3 | 1100 ± 18 | 17 ± 4 | 1082 ± 14 | 53 ± 3 | 1029 ± 11 |
| March-18 | 0.73 ± 0.01 | 1618 ± 0 | 3 ± 3 | 1615 ± 3 | 49 ± 3 | 1566 ± 6 | 56 ± 2 | 1510 ± 4 |
| April-18 | 0.86 ± 0.01 | 2400 ± 0 | 0 ± 0 | 2400 ± 0 | 17 ± 2 | 2383 ± 2 | 86 ± 1 | 2297 ± 2 |
| May-18 | 1.16 ± 0.03 | 4649 ± 131 | 0 ± 0 | 4649 ± 131 | 2 ± 0 | 4647 ± 131 | 107 ± 0 | 4540 ± 131 |
| June-18 | 1.43 ± 0.02 | 5427 ± 183 | 0 ± 0 | 5427 ± 183 | 20 ± 14 | 5407 ± 169 | 160 ± 5 | 5248 ± 173 |
| July-18 | 1.36 ± 0.01 | 9701 ± 377 | 42 ± 42 | 9659 ± 335 | 20 ± 4 | 9636 ± 331 | 510 ± 8 | 9129 ± 339 |
| August-18 | 1.26 ± 0.02 | 10,684 ± 622 | 32 ± 32 | 10652 ± 590 | 49 ± 28 | 10,603 ± 562 | 687 ± 116 | 9916 ± 446 |
| September-18 | 1.22 ± 0.01 | 10,318 ± 762 | 250 ± 74 | 10068 ± 836 | 110 ± 17 | 9958 ± 819 | 847 ± 83 | 9111 ± 736 |
| Total | 50,654 ± 2108 | 735 ± 5 | 49,919 ± 2113 | 322 ± 69 | 49,597 ± 2045 | 2616 ± 189 | 46,981 ± 1855 | |
| 1.45% DR | 98.55% DR | 0.65% Fs | 99.35% Fs | 5.27% Fi | 92.74% DR | |||
| T3 | a | a | ab | a | a | a | b | a |
| November-17 | 1.13 ± 0.01 | 2146 ± 0 | 40 ± 11 | 2106 ± 11 | 8 ± 0 | 2099 ± 11 | 36 ± 2 | 2063 ± 9 |
| December-17 | 0.69 ± 0.01 | 1368 ± 0 | 286 ± 4 | 1082 ± 4 | 15 ± 2 | 1068 ± 6 | 41 ± 1 | 1026 ± 6 |
| January-18 | 0.53 ± 0.00 | 1157 ± 27 | 1 ± 1 | 1157 ± 28 | 12 ± 2 | 1144 ± 29 | 45 ± 2 | 1100 ± 31 |
| February-18 | 0.54 ± 0.00 | 1229 ± 11 | 64 ± 0 | 1165 ± 11 | 18 ± 1 | 1147 ± 11 | 56 ± 4 | 1091 ± 15 |
| March-18 | 0.70 ± 0.00 | 1618 ± 0 | 0 ± 0 | 1618 ± 0 | 25 ± 1 | 1593 ± 1 | 51 ± 1 | 1542 ± 2 |
| April-18 | 0.84 ± 0.01 | 2400 ± 0 | 4 ± 4 | 2396 ± 4 | 16 ± 0 | 2380 ± 3 | 90 ± 1 | 2290 ± 4 |
| May-18 | 1.16 ± 0.02 | 4620 ± 62 | 0 ± 0 | 4620 ± 62 | 2 ± 0 | 4618 ± 62 | 119 ± 3 | 4498 ± 66 |
| June-18 | 1.42 ± 0.03 | 5410 ± 82 | 47 ± 47 | 5363 ± 129 | 21 ± 8 | 5342 ± 137 | 156 ± 15 | 5186 ± 152 |
| July-18 | 1.37 ± 0.03 | 9572 ± 248 | 13 ± 13 | 9559 ± 235 | 27 ± 12 | 9532 ± 247 | 632 ± 25 | 8901 ± 272 |
| August-18 | 1.27 ± 0.02 | 10,577 ± 179 | 124 ± 84 | 10,453 ± 95 | 74 ± 37 | 10,379 ± 58 | 1096 ± 82 | 9283 ± 24 |
| September-18 | 1.27 ± 0.00 | 10,283 ± 333 | 882 ± 172 | 9401 ± 161 | 164 ± 8 | 9237 ± 168 | 1040 ± 79 | 8197 ± 247 |
| Total | 50,380 ± 866 | 1459 ± 211 | 48,921 ± 655 | 382 ± 15 | 48,539 ± 640 | 3362 ± 31 | 45,177 ± 671 | |
| 2.90% DR | 97.10% DR | 0.78% Fs | 99.22% Fs | 6.93% Fi | 89.67% DR |
Table 5.
Final harvesting results and cumulative mortality (mean ± standard error) in the experimental feeding treatments. BWf: final body weight; ∆BW: body weight increase; eFCR: economic Feed Conversion Ratio (from stocking to harvest); CVf: final coefficient of variation; Df: final fish density.
Table 5.
Final harvesting results and cumulative mortality (mean ± standard error) in the experimental feeding treatments. BWf: final body weight; ∆BW: body weight increase; eFCR: economic Feed Conversion Ratio (from stocking to harvest); CVf: final coefficient of variation; Df: final fish density.
| Feeding Regime | BWf (kg) | ∆BW (kg) | eFCR | CVf (%) | Df (kg m−3) | Cum. Mort. (%) |
|---|---|---|---|---|---|---|
| T1 | 0.447 ± 0.004 | 0.397 ± 0.004 | 1.70 ± 0.01 | 14.78 ± 0.36 | 14.23 ± 0.12 | 23.50 ± 2.50 |
| T2 | 0.460 ± 0.003 | 0.410 ± 0.003 | 1.71 ± 0.07 | 15.94 ± 0.44 | 14.29 ± 0.22 | 25.50 ± 4.00 |
| T3 | 0.440 ± 0.002 | 0.389 ± 0.002 | 1.82 ± 0.03 | 17.51 ± 0.31 | 13.80 ± 0.43 | 27.50 ± 2.50 |
Table 6.
Results of the repeated measures analysis of variance (RM-ANOVA) comparing growth performance, waste production and economic profitability variables among experimental feeding treatments (p-values in bold indicate significant differences).
Table 6.
Results of the repeated measures analysis of variance (RM-ANOVA) comparing growth performance, waste production and economic profitability variables among experimental feeding treatments (p-values in bold indicate significant differences).
| Variables | Factors | F | P |
|---|---|---|---|
| CV | Treatment | 12.663 | 0.034 |
| SGR | Treatment | 9.594 | 0.049 |
| LbC | Treatment | 36.561 | 0.008 |
| WFRDR | Meal | 9.996 | 0.020 |
| Treatment | 68.818 | 0.001 | |
| Treatment × Meal | 3.760 | 0.087 | |
| WFRFs | Treatment | 1.882 | 0.232 |
| Meal | 1.703 | 0.240 | |
| Treatment × Meal | 0.134 | 0.878 | |
| eFCR | Treatment | 0.408 | 0.697 |
| ECRDR | Treatment | 1.086 | 0.442 |
| ECRFs | Treatment | 0.347 | 0.732 |
| ECRFi | Treatment | 4.882 | 0.114 |
| ECRRFi | Treatment | 0.887 | 0.498 |
| EPIDR | Treatment | 12.426 | 0.035 |
| EPIFs | Treatment | 12.384 | 0.036 |
| EPIFi | Treatment | 13.072 | 0.033 |
| EPIRFi | Treatment | 11.352 | 0.040 |
© 2020 by the author. Licensee MDPI, Basel, Switzerland. This article is an open access article distributed under the terms and conditions of the Creative Commons Attribution (CC BY) license (http://creativecommons.org/licenses/by/4.0/).
Share and Cite
MDPI and ACS Style
Aguado-Giménez, F. Effect of Feed Delivery Rate and Pellet Size on Rearing Performance, Feed Wastage and Economic Profitability in Gilthead Seabream (Sparus Aurata) Ongrowing. Water 2020, 12, 954. https://doi.org/10.3390/w12040954
AMA Style
Aguado-Giménez F. Effect of Feed Delivery Rate and Pellet Size on Rearing Performance, Feed Wastage and Economic Profitability in Gilthead Seabream (Sparus Aurata) Ongrowing. Water. 2020; 12(4):954. https://doi.org/10.3390/w12040954
Chicago/Turabian StyleAguado-Giménez, Felipe. 2020. "Effect of Feed Delivery Rate and Pellet Size on Rearing Performance, Feed Wastage and Economic Profitability in Gilthead Seabream (Sparus Aurata) Ongrowing" Water 12, no. 4: 954. https://doi.org/10.3390/w12040954
Note that from the first issue of 2016, this journal uses article numbers instead of page numbers. See further details here.