Article

Hydrochemical Characteristics and Water Quality Evaluation of Rivers in Different Regions of Cities: A Case Study of Suzhou City in Northern Anhui Province, China

1
School of Earth and Environment, Anhui University of Science and Technology, Huainan 232001, China
2
National Engineering Research Center of Coal Mine Water Hazard Controlling (Suzhou University), Suzhou 234000, China
*
Author to whom correspondence should be addressed.
Water 2020, 12(4), 950; https://doi.org/10.3390/w12040950
Submission received: 23 February 2020 / Revised: 23 March 2020 / Accepted: 24 March 2020 / Published: 27 March 2020
(This article belongs to the Section Water Use and Scarcity)

Abstract

:
To study the disparity of river hydrochemical characteristics and water quality in different regions of the city, this paper took the Tuo River in the center of Suzhou, Northern Anhui, China and the Bian River on the edge of the urban area as the research objects, used Piper trigram, Gibbs diagram, and hydrogen and oxygen isotope content characteristics to analyze the geochemical characteristics of surface water in the study area, and then the improved fuzzy comprehensive evaluation method was used to evaluate the water quality. The results showed that the hydrochemical types of the two rivers were SO4-Cl-Na type, and the contents of Na+, K+, SO42−, Cl, Ca2+, total phosphorus (TP) in the Bian River at the edge of the city were much higher than those in the Tuo River at the center of the city (ANOVA, p < 0.001). Gibbs diagram showed that the ion composition of the two rivers was mainly affected by rock weathering. The results of correlation analysis and water quality evaluation showed that Bian River was greatly affected by agricultural non-point source pollution, and its water quality was poor, class IV and class V water account for 95%, while, for Tuo River, due to the strong artificial protection, class II and class III accounted for 40.74% and 59.26%, respectively, and the overall water quality was better than that of Bian River. The evaluation results of irrigation water quality showed that the samples from Tuo River were high in salt and low in alkali, which could be used for irrigation when the soil leaching conditions were good, while Bian River water samples were high in salt and medium in alkali, which was suitable for irrigation of plants with strong salt tolerance.

1. Introduction

Water is not only an indispensable material resource for human survival and development but also an important material basis for sustainable development [1]. In recent years, with the continuous development of urbanization and industrialization, the total amount of available water resources is decreasing [2], especially in the semi-humid and arid water shortage areas [3,4]. Over the past few decades, river flows have continued to decline, especially in developing countries such as China and India, due to climate change and human activities [5,6]. Therefore, the sustainable development of human society and ecosystem needs to study the river water quality under the influence of natural and human activities [7].
Hydrochemical characteristics are the result of long-term interaction between the water body and the surrounding environment in the process of circulation, which can indicate the history of water formation and migration [8,9]. In addition, water quality assessment is an important link in the study of aquatic ecological environment quality and is the basis for the protection and rational development and utilization of river water resources [10]. In previous years, many scholars have done a lot of analysis and research on the water quality of rivers. Kun et al. [11] studied the ion components of surface water and groundwater in the Fen River Basin and showed that evaporite dissolution was the main example source of water, and it was also affected by humans and cation exchange. Seth et al. [12] studied the effects of urbanization on the hydrochemistry of base flow within the Chattahoochee River Basin (Georgia, USA), found that the concentration of sulfate, chloride, bicarbonate, and sodium increased with the degree of urbanization. By evaluating the water quality of the Wei River, a major river in Guanzhong, China, Lu et al. [13] identified the main pollutants as mercury-containing compounds and proposed that domestic and industrial wastewater discharge regulations should be strictly enforced in the region. Misaghi et al. [10] took the Ghezel Ozan River as the research object and used the improved water quality index method to evaluate its water quality according to its main use, which provides a reference for the rational utilization of water resources.
Suzhou, Anhui Province, is located in the semi-humid area of the Huanghuai region and epitomizes the rapid urbanization and modern agricultural cities in China. Tuo River running through the city center and Bian River in the edge area of the city were selected as the research objects, and the environmental hydrogeochemical characteristics of the two rivers were studied. Through the comparative analysis and evaluation of water quality, the environmental quality of the rivers in the area was clarified, which is of great significance for the environmental protection of surface water and the rational development and utilization of water resources in different areas in the process of urbanization [14].

2. Materials and Methods
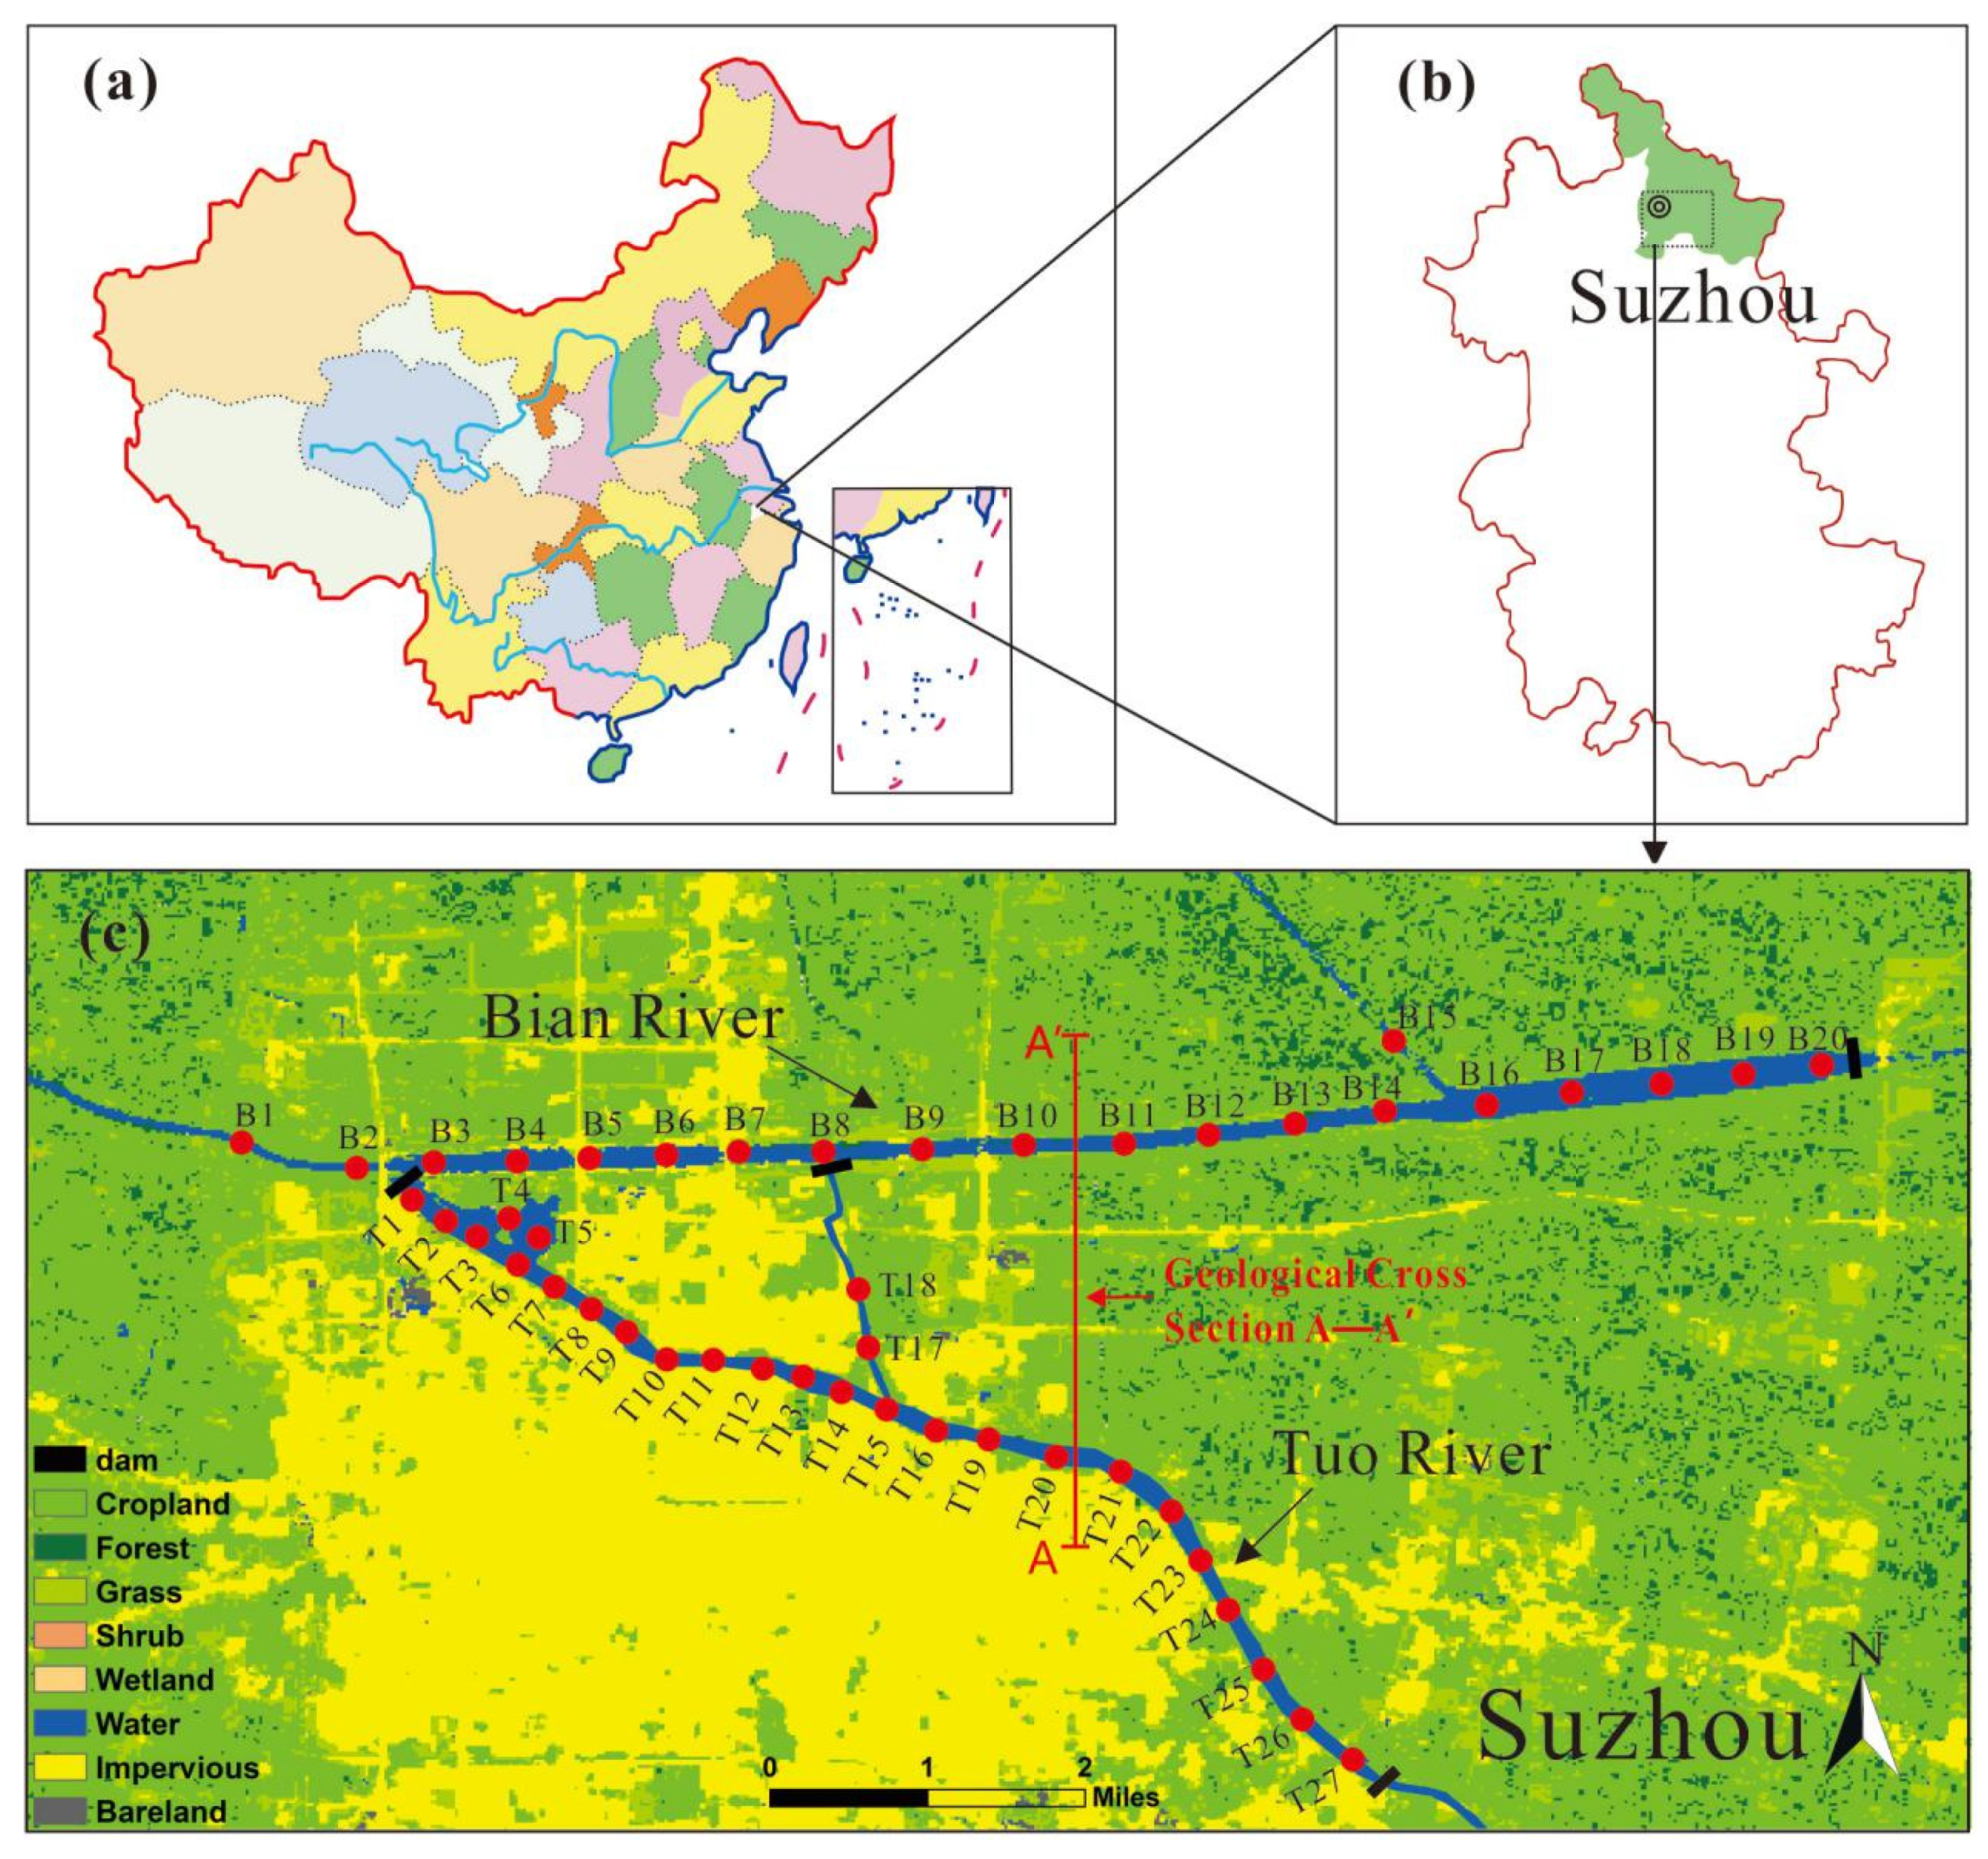
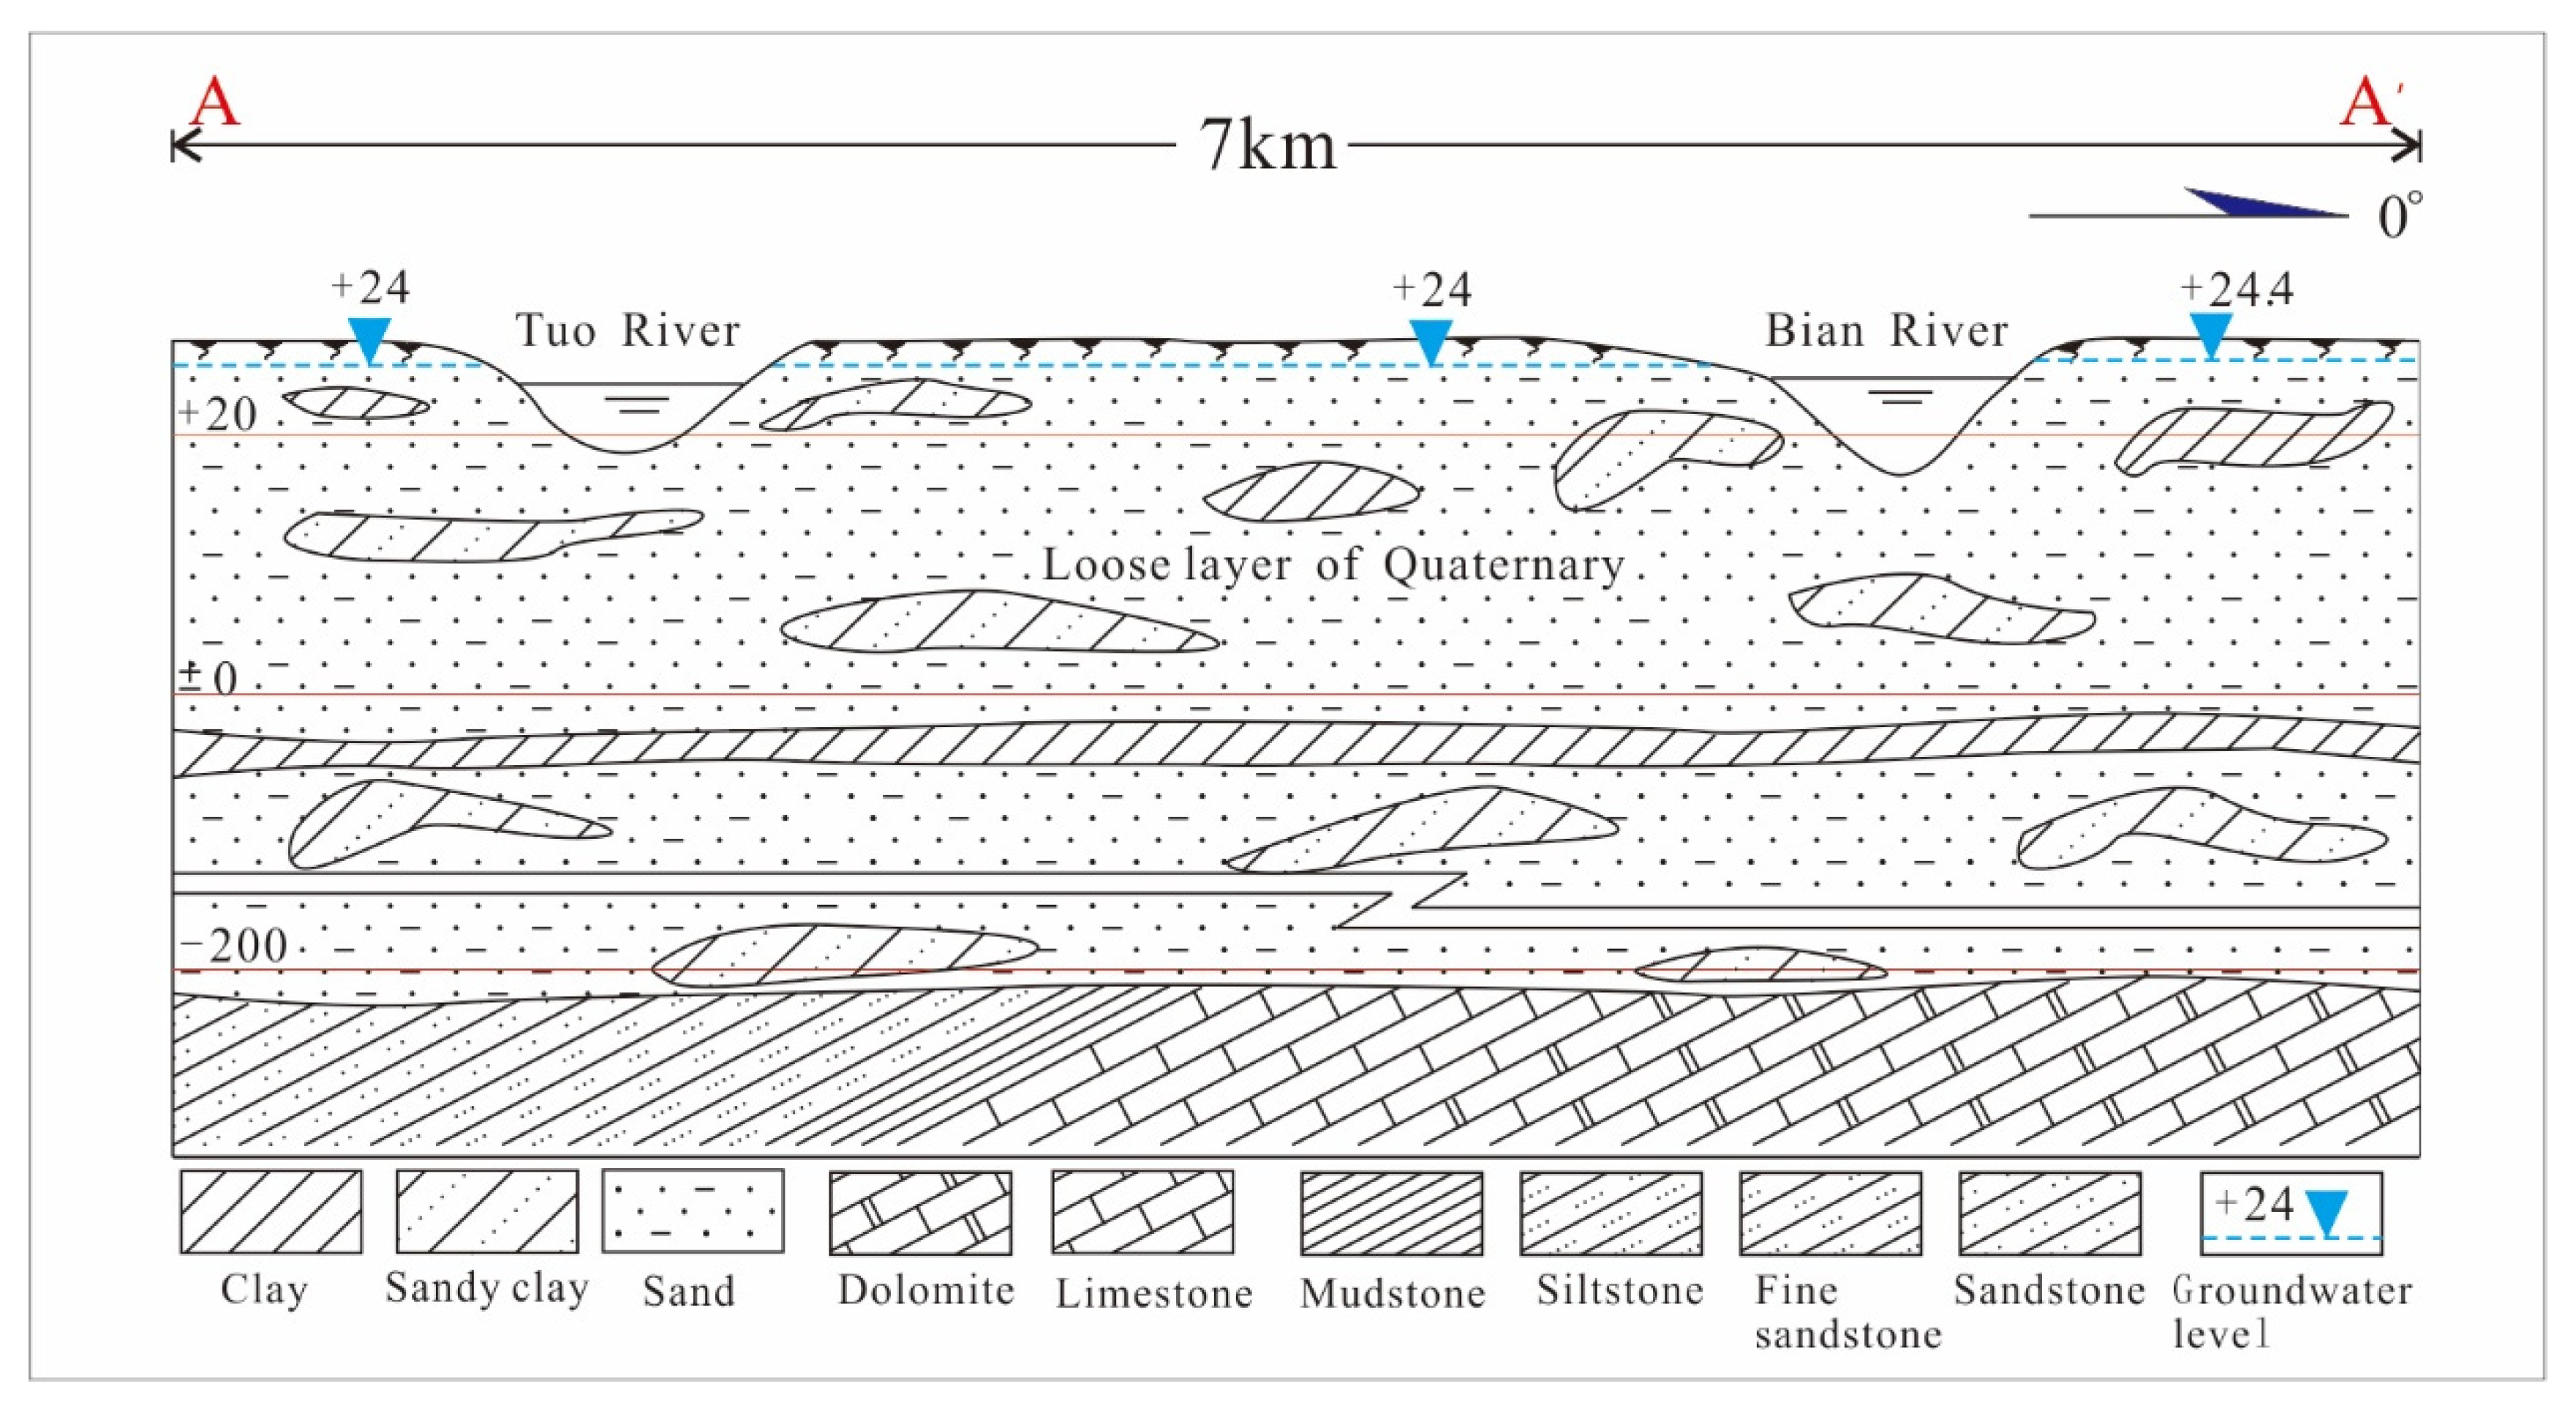
2.1. Study Area

Suzhou is located in the Huaibei plain of the Huanghuai region. It is a large industrial and agricultural city in the north of Anhui Province (Figure 1b), with a total area of 9787 km2 and a population of 6.5 million. There are two large rivers in the center and the edge of the city, namely Tuo River and Bian River (Figure 1c). The total length of the Tuo River is 243 km, and the drainage area is 2983 km2. It flows in from the northwest of Suzhou and flows out from the southeast. It passes through the residential area and commercial entertainment area of Suzhou. The annual average flow is 3.03–56.79 m3/s and the annual average water level elevation is +13.13–25.03 m. The Bian River, with a total length of 127.2 km and a drainage area of 6562 km2, the annual average flow, and the annual average water level elevation are, respectively, 3.52–72.10 m3/s and +14.73–26.56 m; the main function of Bian River is to prevent external flooding and waterlogging disasters, and to take into account agricultural irrigation and shipping. The study area has four distinct seasons, with dry and cold winters and hot summers. The annual average temperature is 14–14.6 °C, the historical highest temperature is 40 °C, and the lowest temperature is −12.5 °C. The annual rainfall is 774–855 mm, and the annual evaporation is 832.4 mm.
In the study area, the thickness of Quaternary loose layer of Cenozoic is 200–250 m (Figure 2), which is composed of sand, sandy clay and clay; the shallow part is phreatic aquifer, about 25–30 m thick, water level +24–25 m, and the buried depth of clay aquiclude is about 30 m [15]. Below the Quaternary loose layer are Ordovician and Carboniferous carbonate rocks (dolomite and limestone), and Permian clastic rocks (mudstone, siltstone, fine sandstone and sandstone) [16]. Precipitation is the main recharge source of the aquifers.

2.2. Sampling and Testing

In order to study the hydrochemical differences between central river (Tuo River) and marginal river (Bian River) in Suzhou, in July 2019, 47 water samples were collected, 27 of them in the Tuo River and 20 in the Bian River. The location of the sampling points is shown in Figure 1. According to relevant standards in Surface Water and Sewage Detection Technology (HJ/T91-2002), Water and Wastewater Detection and Analysis Methods (Fourth Edition), each sample was taken at about 0.5 m below the surface water. All sampling sites were located by GPS, and field measurements of conductivity (EC), pH, and total soluble solids (TDS) were made using portable devices from OHAUS (Shanghai, China). Portable instruments to test pH and TDS were ST20 and ST20T-B, respectively. The measurement accuracy of ST20 reaches 0.05 pH, and that of ST20T-B reaches 1 mg/L. All samples were sent to the laboratory within 24 h and stored in a 4 °C refrigerator.
After the water sample was filtered by a 0.45 μm filter membrane, the content of Na+, K+, Ca2+, Mg2+, Cl, F, and SO42− in the water were tested by an ion chromatograph (ICS-600-900). The contents of CO32− and HCO32− were determined by acid-base titration. The stable isotopes of hydrogen and oxygen were determined by LGR-LWIA-45EP. The accuracy of hydrogen and oxygen was 0.2%. Total nitrogen (TN) was measured by potassium persulfate digestion UV spectrophotometric (HJ 636-2012), total phosphorus (TP) determination using the Ammonium molybdate spectrophotometric method (GB 11893-89), and determination of the chemical oxygen demand (COD) using the dichromate method (HJ 828-2017). Before the test, the stability of the test instrument was tested with the standard sample of known concentration, and the parallel sample was set, and the relative deviation of the parallel sample was less than 5%.

2.3. Software

ArcGis (version 10.6, Esri, Redlands, CA, USA) was used for mapping sample locations and land use. Excel (version 2016, Microsoft, Redmond, WA, USA) was used to conduct statistics on the original data, and R (version 3.6.2, UoA, Auckland, New Zealand) and OriginPro (version 9.1, Originlab, Northampton, MA, USA) were used for visual analysis of the data. A one-way ANOVA test was carried out to determine significant differences, at a significant level of 0.05. Pearson correlation analysis was to assess water quality parameter associations.

2.4. Improved Fuzzy Comprehensive Evaluation

There are many water quality evaluation indexes if only using a single index for water quality evaluation is not comprehensive enough [17]. The fuzzy comprehensive evaluation method is a common method for a comprehensive evaluation of water quality. It is based on fuzzy mathematics and applies the principle of fuzzy relation synthesis to deal with the phenomenon of “fuzzy”, and it makes a comprehensive evaluation after quantifying some fuzzy and uncertain factors [18]. When a certain indicator is polluted in the traditional fuzzy evaluation method, the evaluation result will be affected to some extent [19]. Therefore, this paper used the improved fuzzy comprehensive evaluation method for water quality evaluation. The steps of the improved fuzzy comprehensive evaluation method were as follows:
(1) Establish Factor Subsets and Evaluation Language Set
First, consider the pollution indicators that affect water quality and establish a set of evaluation factors U = {U1, U2, …Un};
Then, according to the China Surface Water Environmental Quality Standard (GB 3838-2002), establish an evaluation set V = {Ⅰ, Ⅱ, Ⅲ, Ⅳ, Ⅴ}. The evaluation factors (TN, TP, COD, SO42−, Cl) and evaluation sets selected in this paper were shown in Table 1.
(2) Establish a Fuzzy Relationship Matrix
The membership function is the foundation of a fuzzy comprehensive evaluation. At present, the “reduced half trapezoidal stepwise method” is generally used to calculate the membership function. According to the evaluation standard of China Surface Water Environmental Quality Standard (GB 3838-2002), surface water is divided into five levels. The formula for the grade of membership of water quality is as follows:
  • Class I:
    r i 1 = { 1 x i s i 1 s i 2 x i s i 2 s i 1 s i 1 < x i < s i 2 0 x i > s i 1
  • Class II–IV:
    r i j = { 1 s i j x i s i j s i j 1 s i j 1 x i s i j 0 x i s i j 1 , x i > s i j + 1 s i j + 1 x i s i j + 1 s i j s i j < x i < s i j + 1
  • Class V
    r i j = { 0 x i s i 4 1 s i 5 x i s i 5 s i 4 s i n 1 < x i < s i n 1 x i > s i 5
In the formula, xi is the measured concentration of the i-th evaluation index, sij is the j-level standard value of the i-th evaluation index, and rij is the membership degree of the i-level evaluation index to the j-level water quality.
The fuzzy relation evaluation matrix R can be determined from the membership function established above, namely:
R = ( r 11 r 12 r 13 r 14 r 15 r 21 r 22 r 23 r 24 r 25 r n 1 r n 2 r n 3 r n 4 r n 5 )
(3) Determine the Weight Coefficient Matrix
Different factors have different influences on water quality, so it is necessary to calculate the weight of each factor to make the evaluation model more scientific. The steps to determine the entropy weight coefficient were as follows:
Standardize the measured data. The data consist of n evaluation indexes and m evaluation objects that form an X matrix:
X = ( x 11 x 12 x 1 m x n 1 x n 2 x n m )
Use the formula:
y i j = max j { x i j } x i j max j { x i j } min j { x i j }
Standardize and get the judgment matrix Y:
Y = ( y 11 y 12 y 1 m y n 1 y n 2 y n m )
The formula of entropy weight is:
w e i = 1 H i n i = 1 n H i
In the formula: H i = j = 1 m f i j ln f i j ln m , f i j = ( 1 + y i j ) / j = 1 m ( 1 + y i j )
(4) Calculation of Comprehensive Evaluation Results
The purpose of a fuzzy comprehensive evaluation is to comprehensively evaluate the impact of all indicators on the evaluation water body, get comprehensive and correct evaluation results, and determine the water quality grade, that is to say, W and R fuzzy matrices are used for composite operation, namely:
B = W × R
The result B of the composite operation is the membership degree of each water sample concerning the water quality of different levels, among which the grade of the highest membership degree is the water quality grade of the water sample.

2.5. Water Quality Evaluation of Irrigation Water

Sodium percentage (%Na) is an important indicator of sodium hazard. The higher the Na% value, the greater the risk of alkali damage. Higher Na% may affect soil structure, reduce soil permeability, and cause soil compaction, thereby blocking gas exchange between soil and atmosphere [10,20]. The calculation formula is as follows:
% Na = Na + Ca 2 + + Mg 2 + + Na + + K + × 100 %
Sodium absorption ratio (SAR) is an important parameter to consider the suitability of the surface water for irrigation purposes, which can reflect the degree of sodium replacing the absorbed magnesium and calcium occurs in soil. When irrigated with water containing high concentrations of Na+, the damage is greater because the Na+ is adsorbed into the soil, causing the polymer to disperse and the permeability to decrease [21]. The calculation formula is as follows:
SAR = Na + ( Ca 2 + + Mg 2 + ) / 2

3. Results

Through the statistical analysis of the pH, COD, TN, TP, EC, TDS, Na+, K+, Ca2+, Mg2+, F, Cl, SO42−, HCO3, and CO32− of the water samples collected from Tuo River and Bian River, the relevant parameters are shown in Table 2.
Table 2 shows that, except for pH, the average content of water quality parameters of the Tuo River was less than the Bian River. The changes of cations in both rivers were as follows: Na+ > Mg2+ > K+ > Ca2+. The anion changes in both rivers were: SO42− > HCO3 > Cl > CO32− > F. Further analysis of water quality parameters of urban central and marginal rivers by one-way ANOVA analysis can be seen from Figure 3: The contents of Na+, K+, SO42−, Cl, Ca2+, and TP in the Bian River were much higher than that in the Tuo River (ANOVA, p < 0.001). The concentrations of Na+, K+, SO42−, Cl, Ca2+, and TP were enriched in the river disturbed by human activities, indicating that the intensity of the disturbance by human activities in the Bian River should be greater than that in the Tuo River [22]. The contents of Na+, SO42−, and Cl in the two rivers were significantly different. The average contents of these three ions in the Tuo River were 175.93 mg/L, 231.52 mg/L, and 112.03 mg/L, respectively; in the Bian River, they were 241.10 mg/L, 306.81 mg/L, and 151.04 mg/L. The contents of Na+ and SO42− in the Bian River exceeded the limits of Na+ and SO42− (<200 mg/L and <250 mg/L) in the World Health Organization (WHO) guideline value (2011) [23] and the Chinese national standard (GB5749-2006), while the content of Cl was not exceeded.
In the Eutrophication Indexes TN, TP, and COD, the average contents of TN and COD in the two rivers exceed the three types of water defined in China Surface Water Environmental Quality standard (GB 3838-2002). The types of land use, water conservancy conditions, and environmental management are closely related to water quality [24,25,26], In this study, the content of N and P in the water body of Bian River was relatively high, and the land-use types shown in Figure 1c around Bian River are mostly cropland, while those around Tuo River are mostly urban areas with a small amount of cropland, which is consistent with the relevant research; that is, the content of N and P in the river located in the agricultural area is relatively high [27,28].

4. Discussion

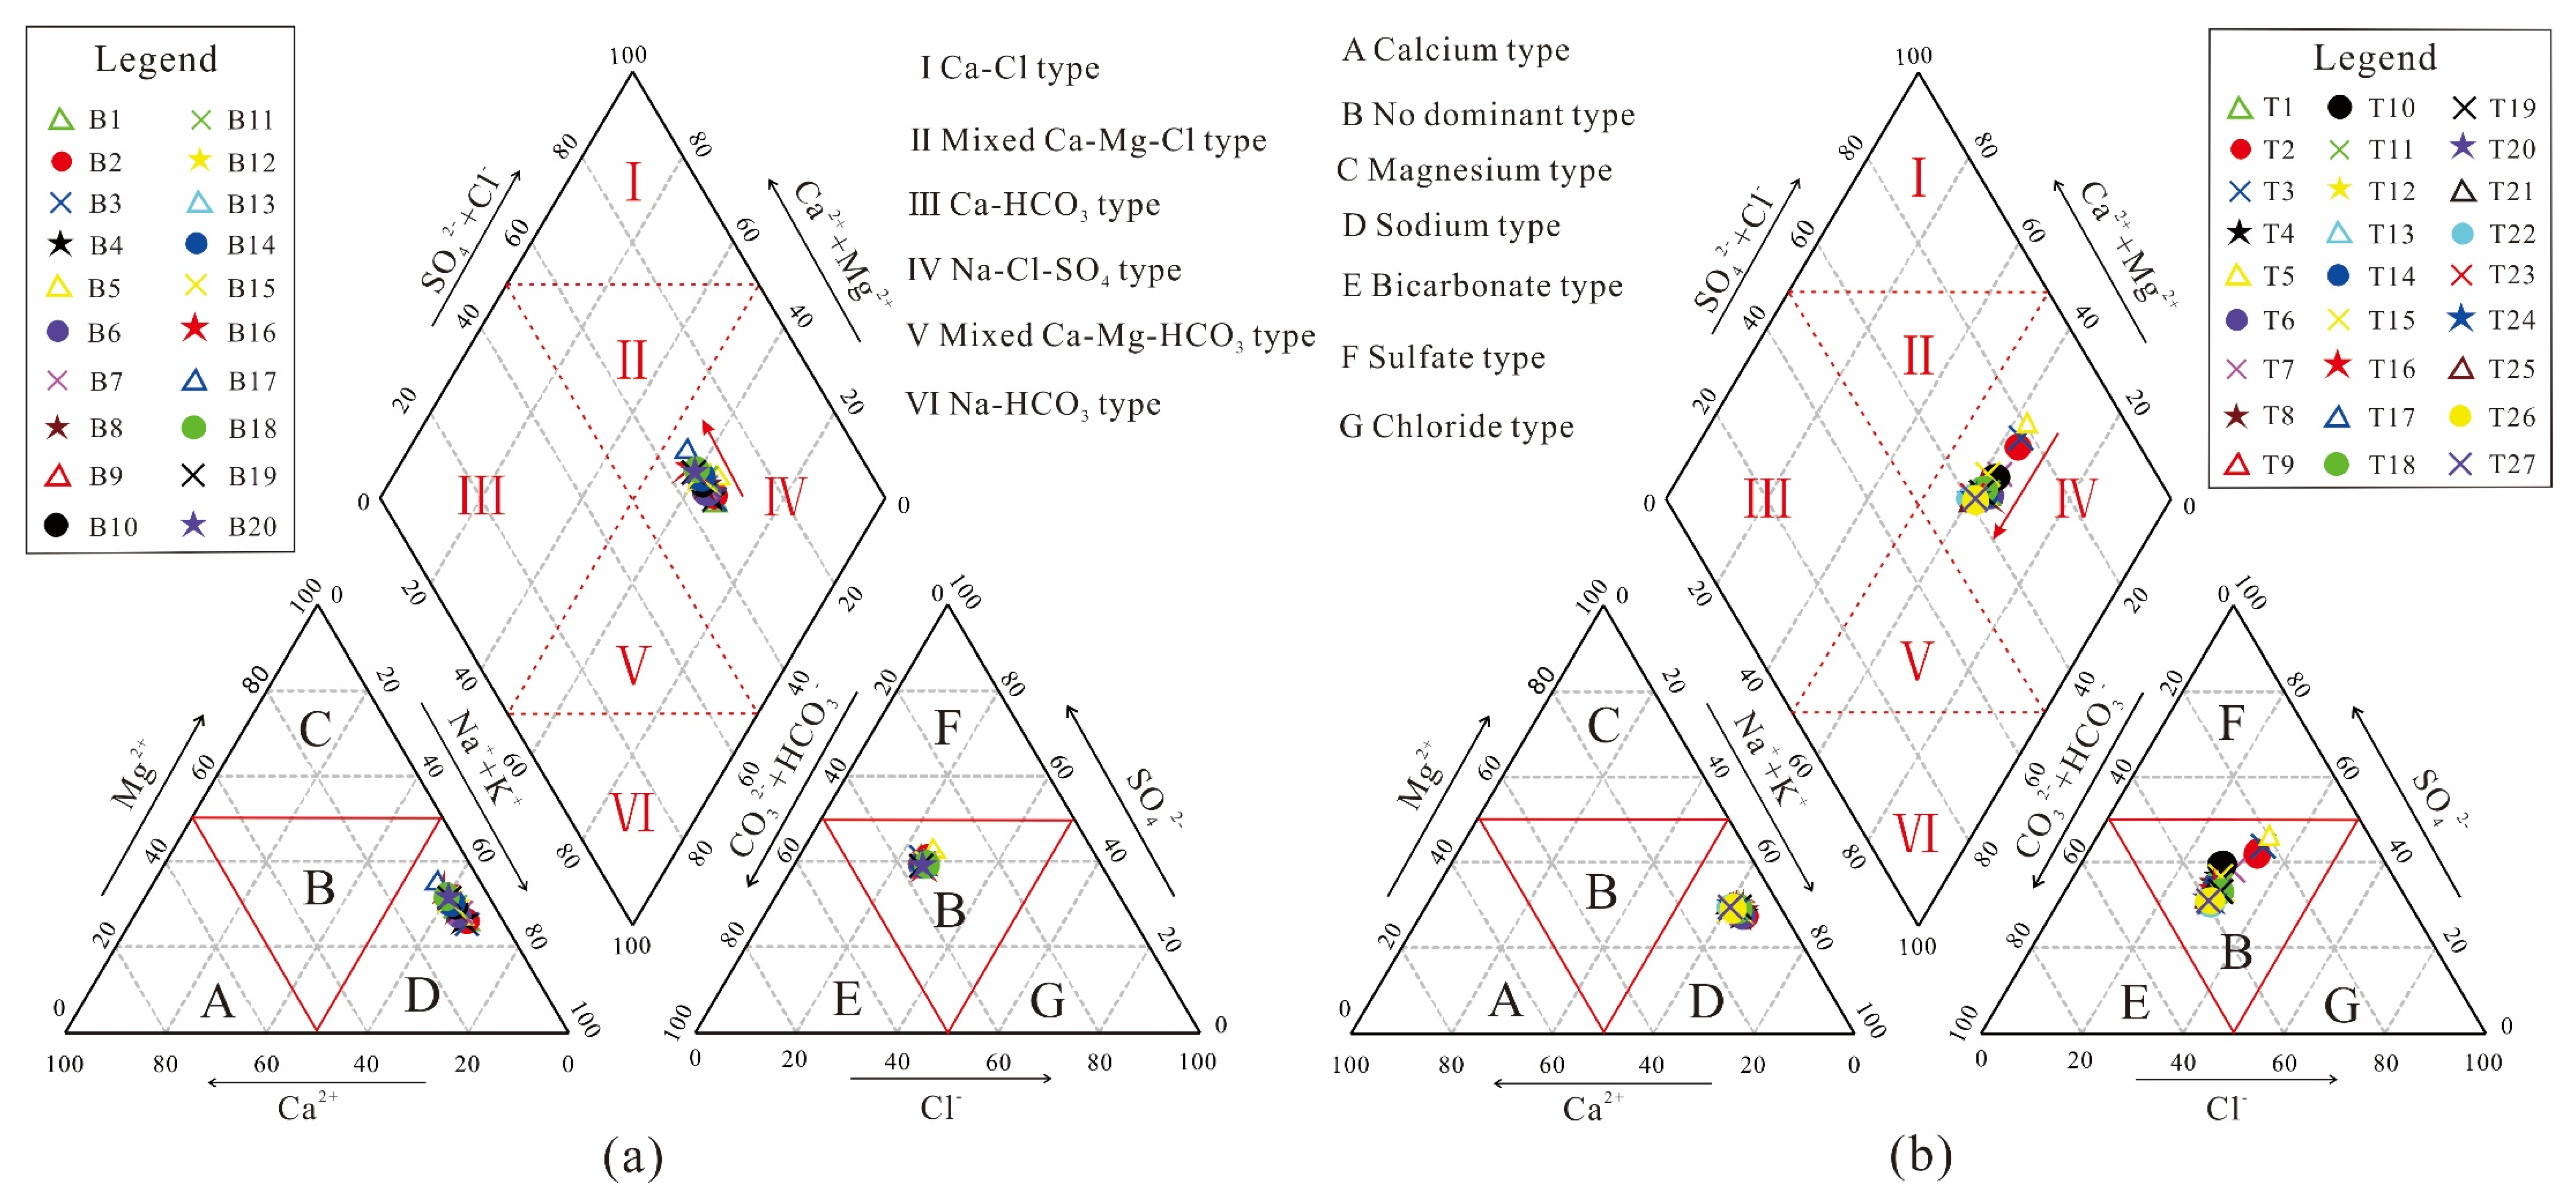
4.1. Sources and Influencing Factors for Major Ions

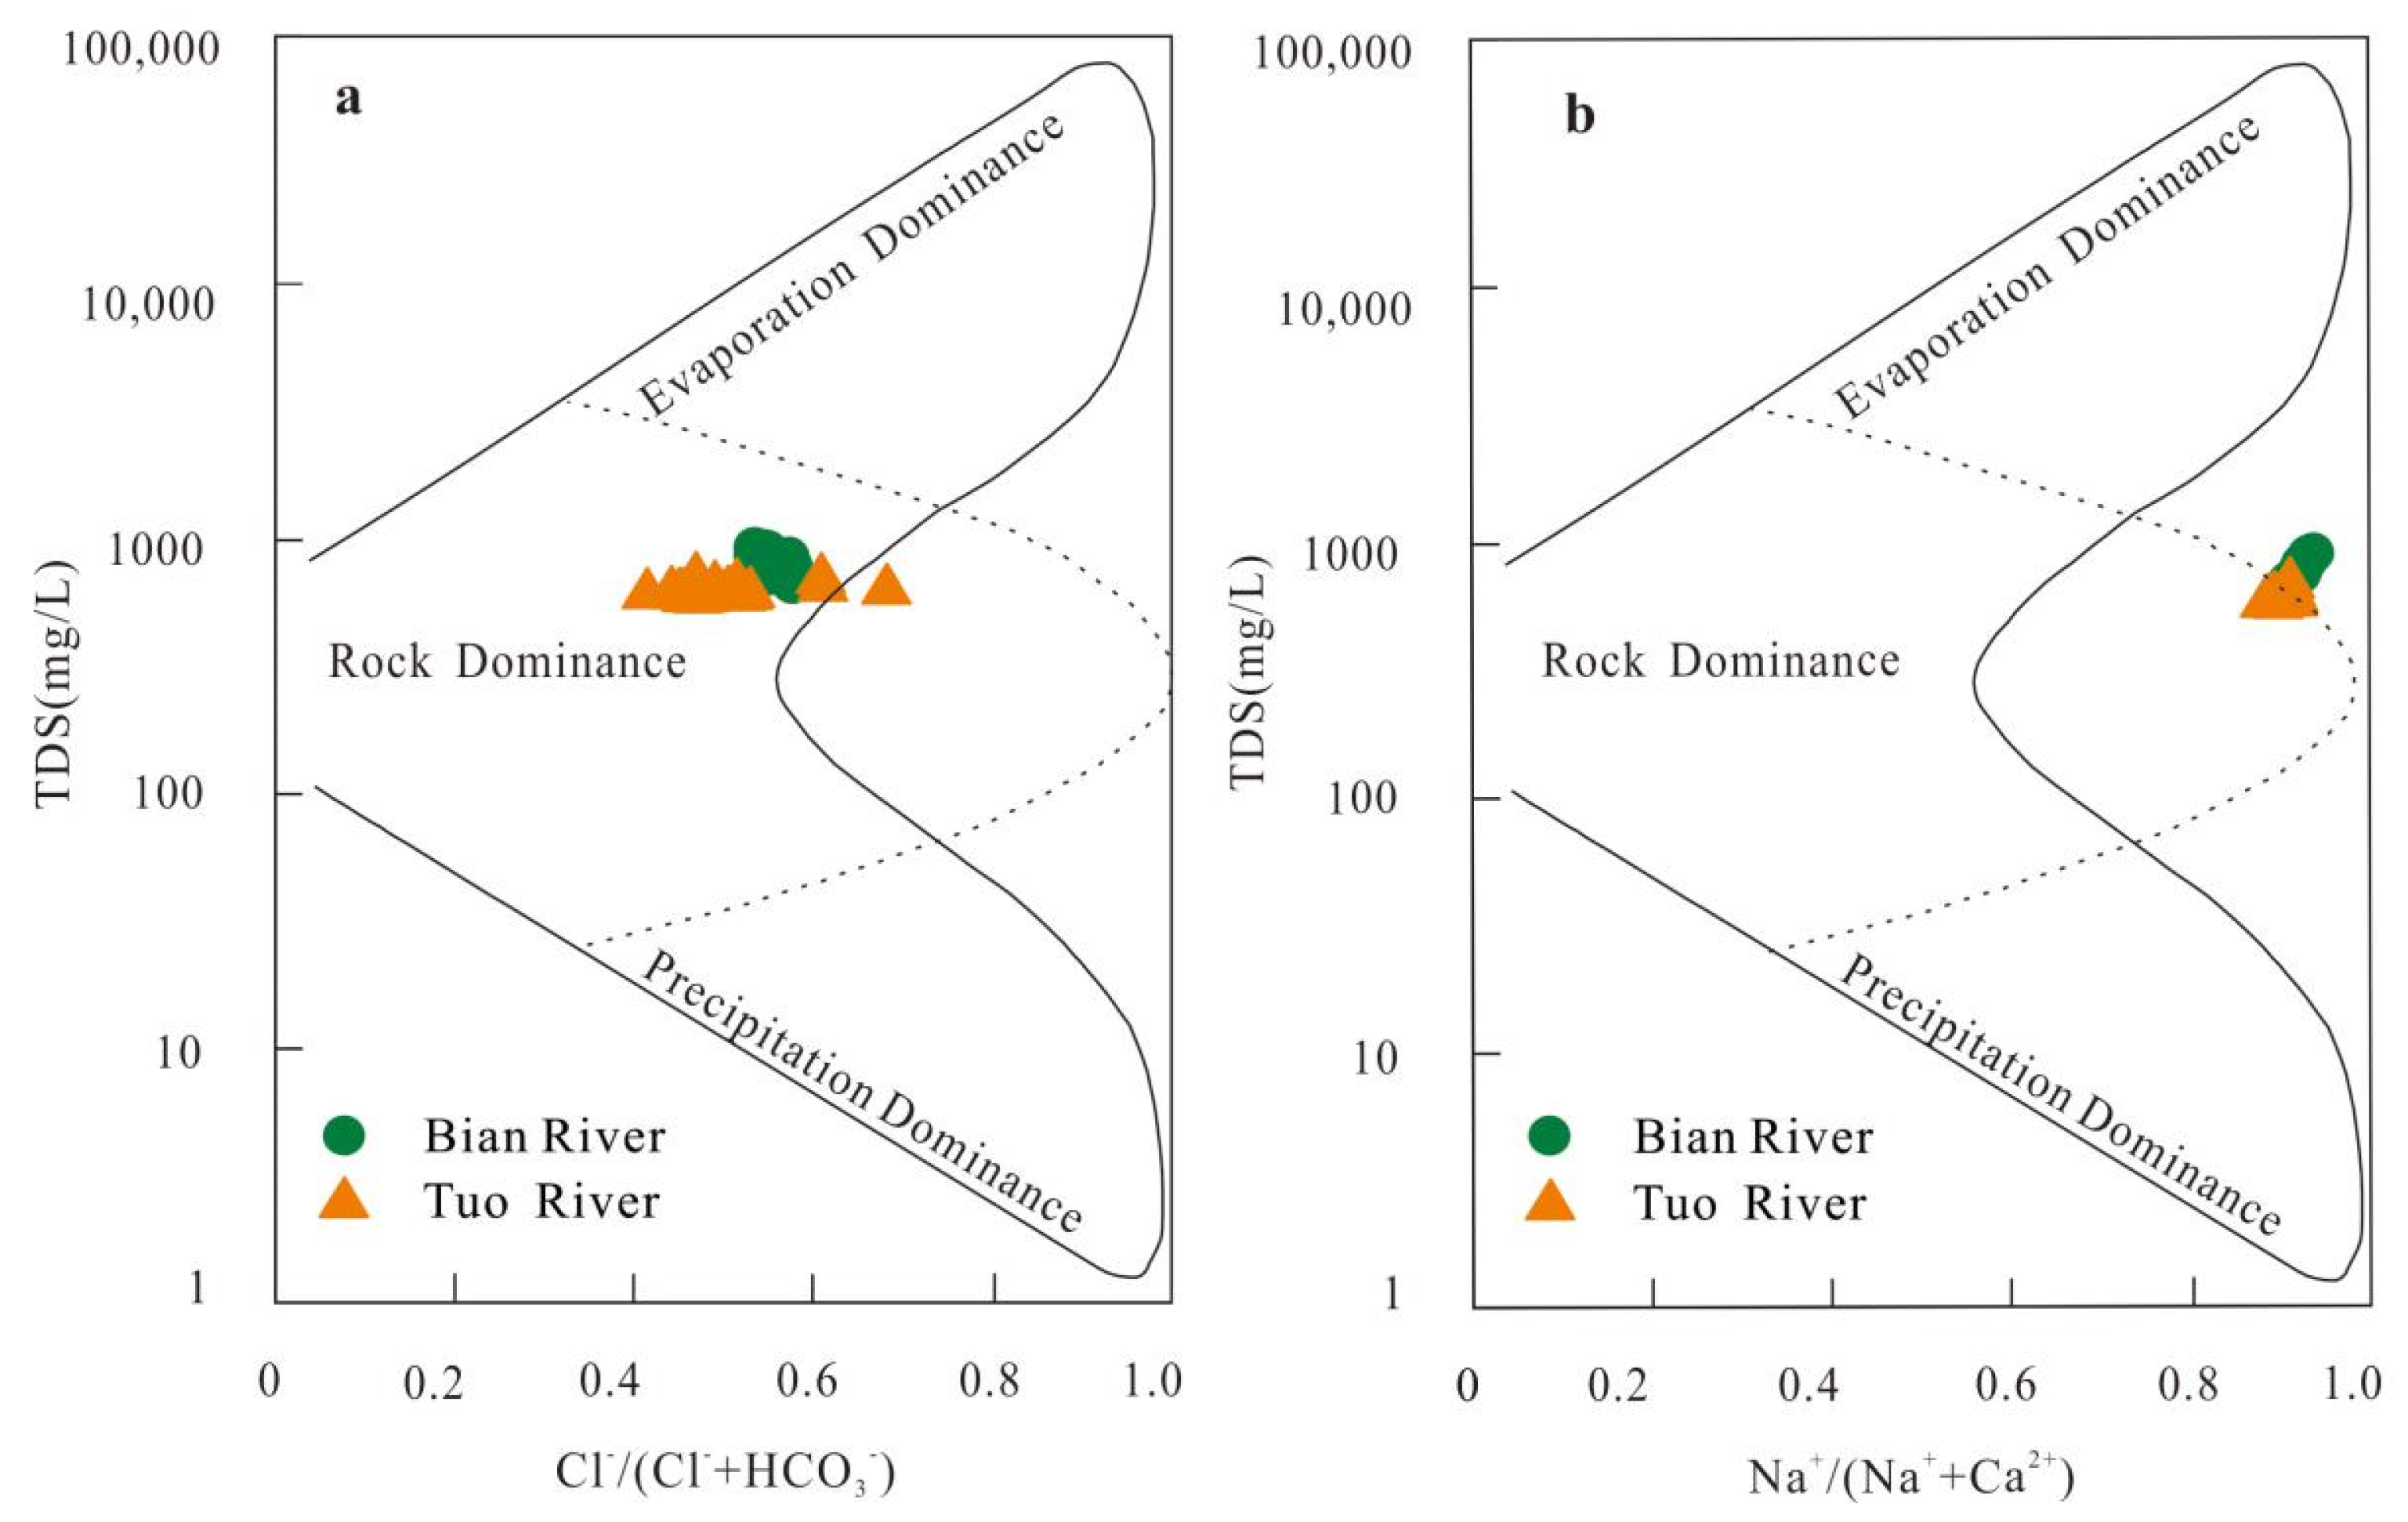
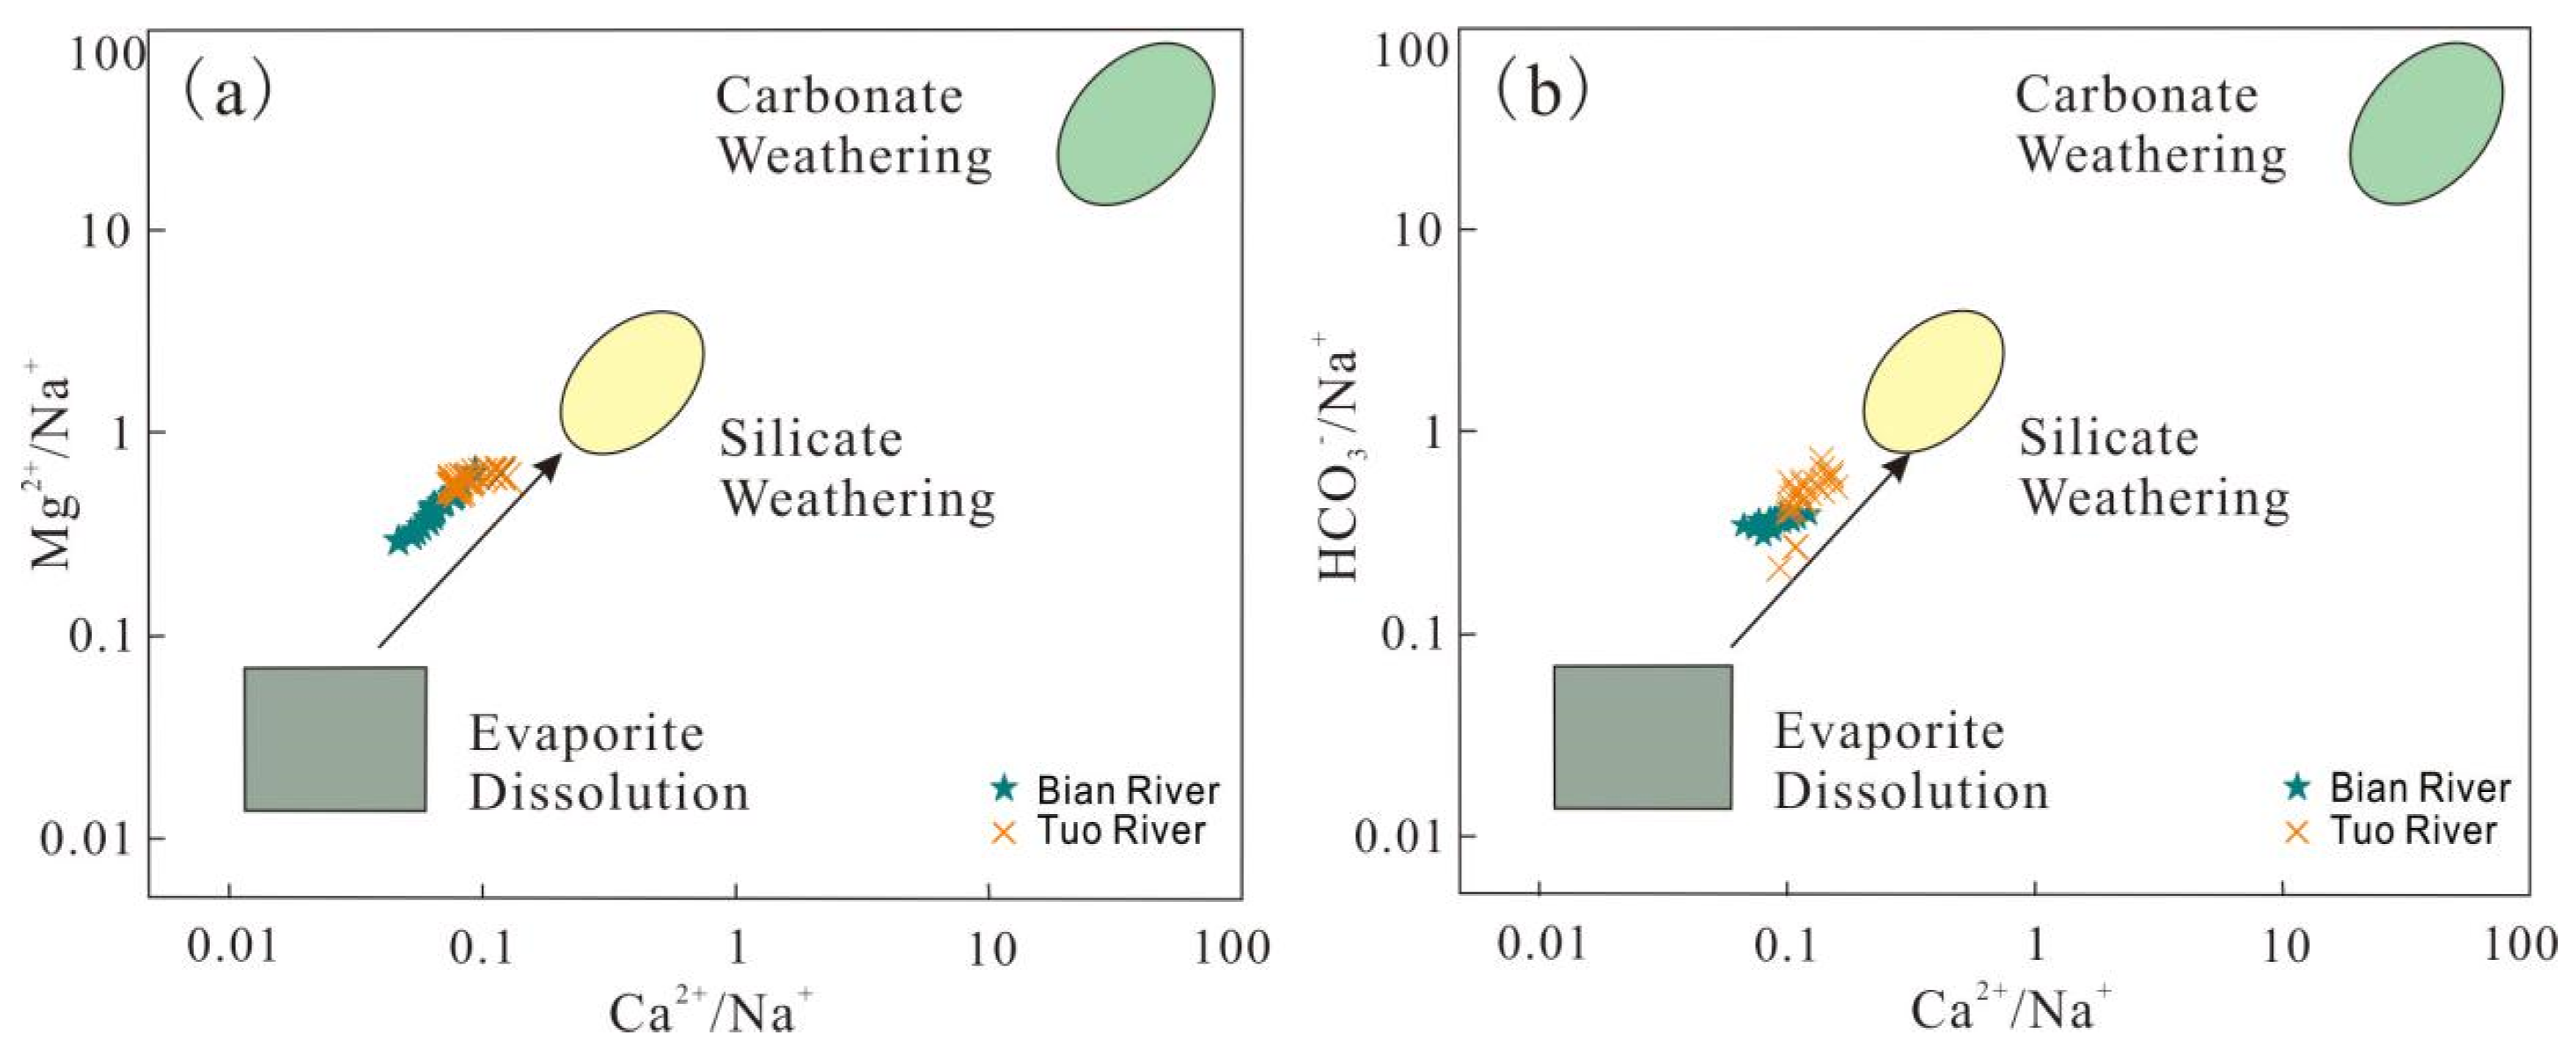
4.1.1. Processes Controlling River Solute

Natural process and human factors control the ion composition of river water samples [29]. In the 1970s, Gibbs designed a semi logarithmic coordinate diagram (Gibbs diagram) to distinguish the influence of rock weathering, evaporation, and precipitation on the chemical composition of water by studying the chemical composition of the world’s surface water [30]; Gibbs diagram can be used to intuitively judge the influence of these factors on the main chemical composition of river water [31]. The area of atmospheric precipitation in the Gibbs chart is at the lower right, where the TDS of water sample point is relatively low and Na+/(Na+ + Ca2+) or Cl/(Cl + HCO3) is relatively high. To the left of the middle is the rock weathering zone, where the TDS of water sample point is medium and the ratio of Na+/(Na+ + Ca2+) or Cl/(Cl + HCO3) is about 0.5. The water sample point distributed at the upper right belongs to evaporation concentration area with high TDS and high Na+/(Na+ + Ca2+) or Cl/(Cl + HCO3) value [32,33].
The Gibbs diagrams of the water samples in the study area are shown in Figure 4. From Figure 4a, it can be seen that all the water samples of Tuo River and Bian River in the study area were concentrated in the dominant area of rock weathering, indicating that the main ion content of the two rivers was mainly dominated by rock weathering. However, in Figure 4b, the water sample points of the two rivers fell outside of the solid line, which showed that other influence factors, such as cation exchange, evaporation, and human factors, had a certain influence on the main ions in the water [34]. The natural rivers and lakes are commonly controlled significantly by evaporation [35]. Taking the shallow groundwater around Suzhou city as the research object, it is concluded that rock weathering is the main source of ions in this area [15]. However, in this study, the hydrochemical formation mechanism of surface water is similar to that of groundwater, indicating the interaction between groundwater and surface water.
To further illustrate the effects of rock weathering (silicate weathering, carbonate, and Evaporite dissolution), Na-normalized Ca2+ versus Mg2+ is presented in Figure 5a and Na-normalized Ca2+ versus HCO3 is presented in Figure 5b.
It is determined that the high values of the Ca2+/Mg2+ ratio indicate the domain of the bicarbonate dissolution [36], while low values of this ratio mean the dissolution of silicates [37,38]. Through the use of bivariate diagrams of Figure 5, samples of river water (Bian and Tuo) are concentrated and mainly affected by silicate weathering; there is a partial influence of evaporate dissolution.
Piper trigram can analyze the hydrogeochemical composition and type of surface water and reveal its evolution process [39]. It can be seen from Figure 6 that all water sample points were concentrated in zone Ⅳ. The content of alkali metal ions was higher than that of alkaline earth metal ions, and the content of strong acid roots was higher than that of weak acid roots; the results showed that the hydrochemical types of Tuo River and Bian River were the SO4-Cl-Na type. It can be seen from the cation distribution of the two rivers that all the water sample points were located in the D region in Figure 6, which were Na+ dominates. From their anion distribution, it can be known that all water sample points fell in zone B, which is the mixing zone. As shown in Figure 6a, the proportion of Ca2+ + Mg2+ flowing along the river gradually increases; however, the proportion of (Cl + SO42−) in the flow direction of Tuo River decreased (Figure 6b).

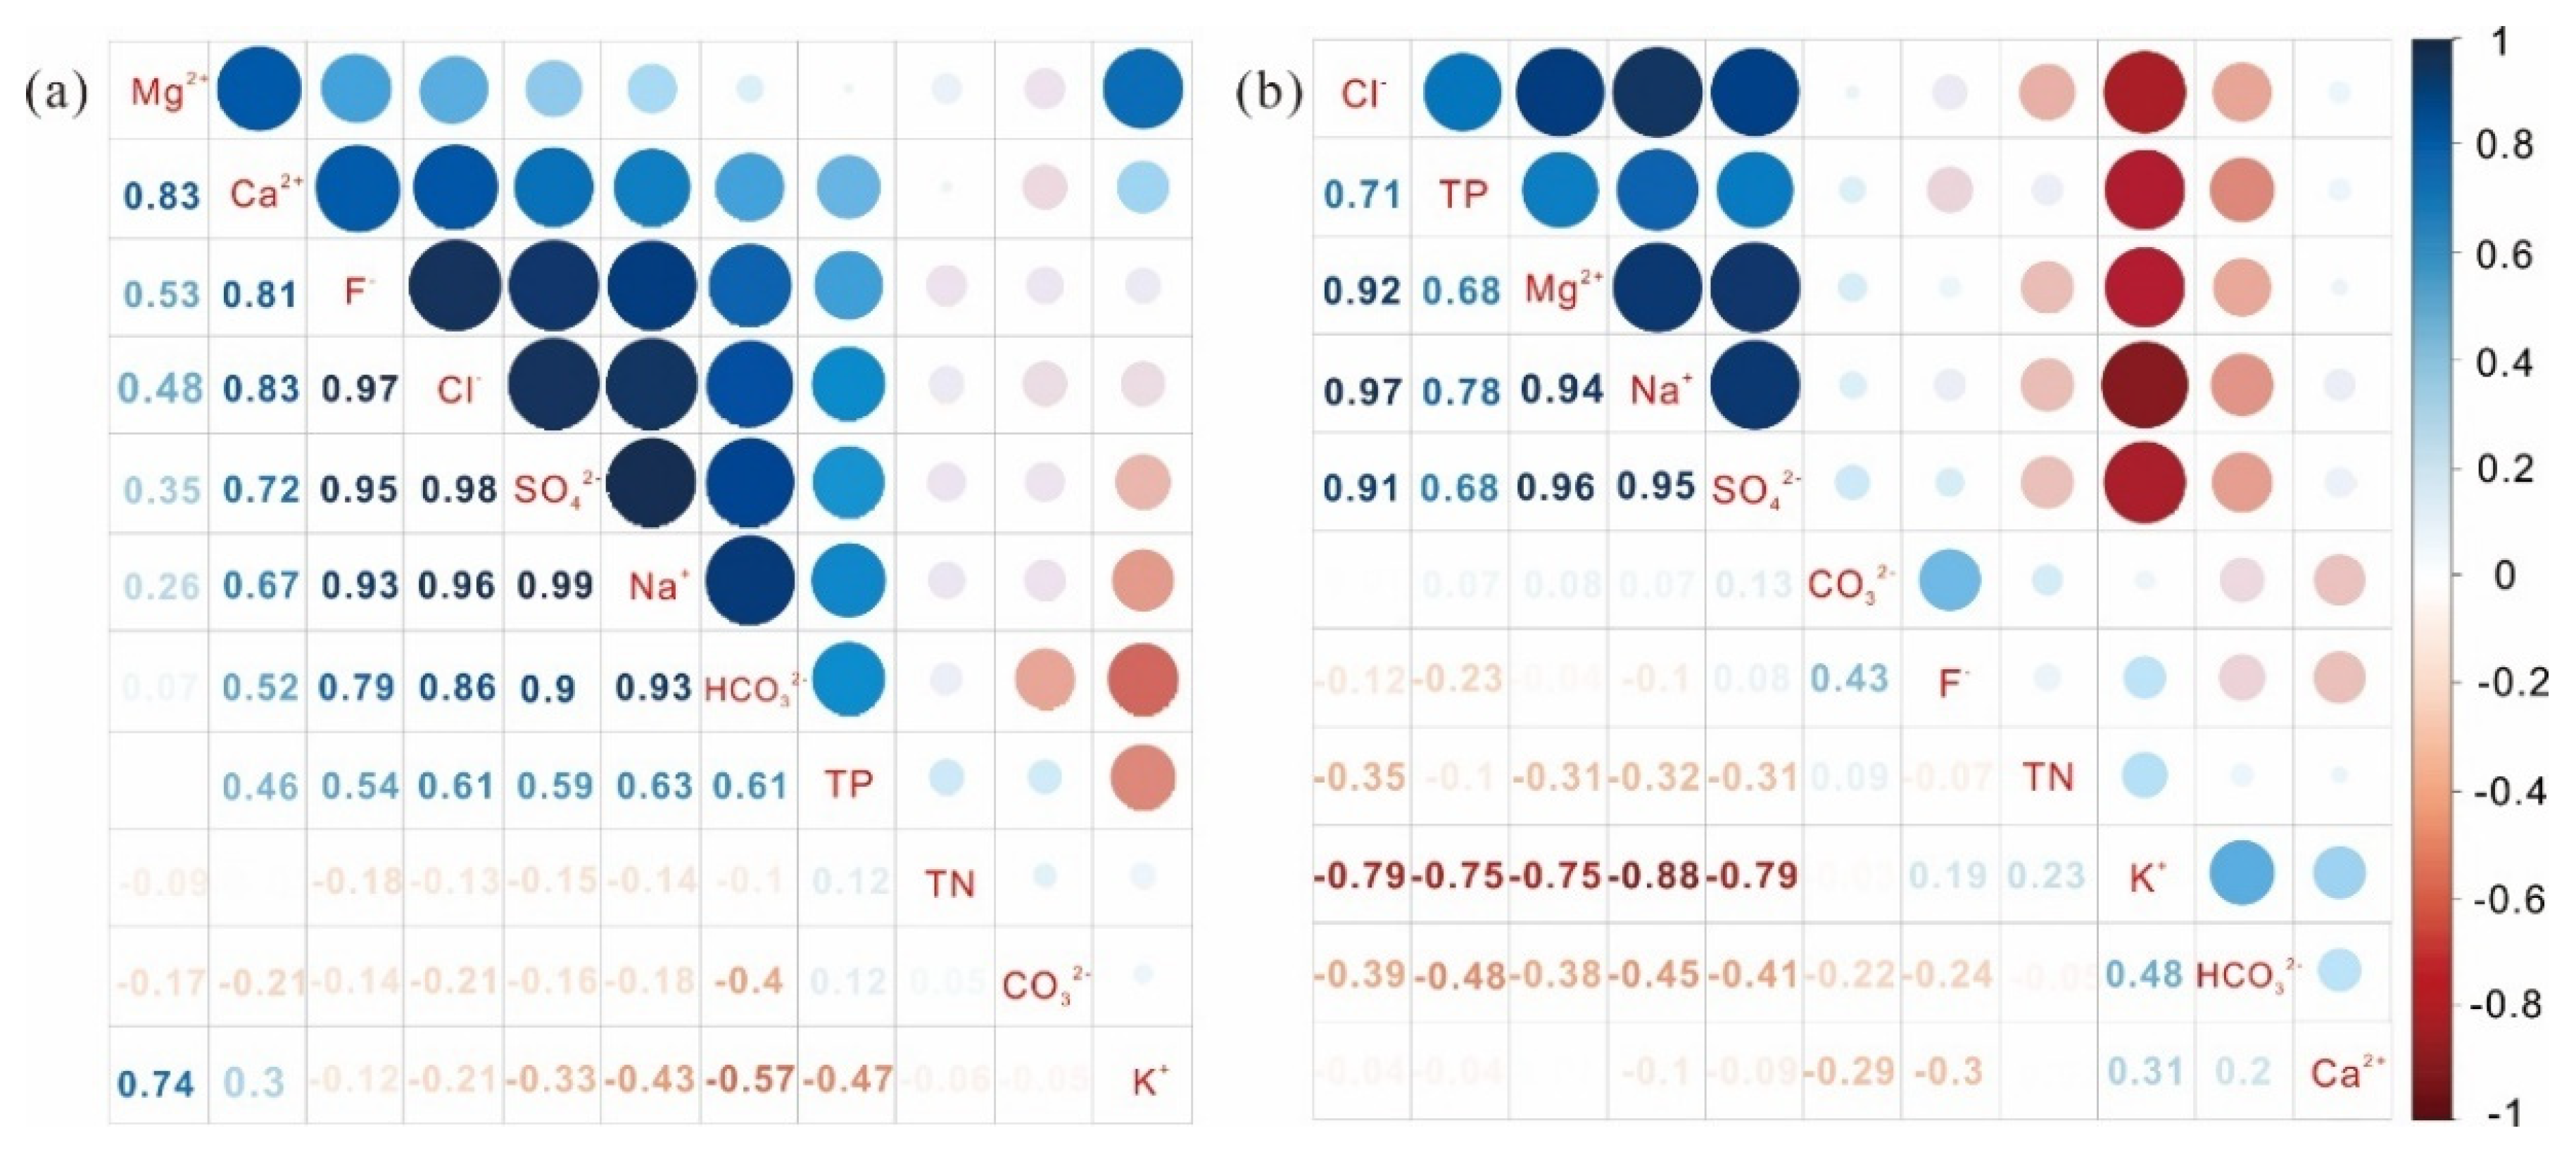
4.1.2. Correlation Analysis of Water Quality Parameters

Correlation analysis among the water quality parameters in the water can facilitate understanding the relationships among those parameters, determining the sources of pollutants [40]. Meanwhile, correlation analysis was often used to reveal consistencies and differences between the ion sources [41]. Correlation analysis was conducted on the nutrition indicators (TP and TN) and major hydrochemical parameters of surface water in the study area, and the results are shown in Figure 7.
Because the shallow groundwater in the study area is usually about three meters deep, surface water replenishes groundwater during the rainy season and shallow groundwater replenishes the river during the dry season [15].As can be seen from Figure 7a, Ca2+ had a good correlation with Mg2+, F, Cl, SO42−, and HCO3, indicating the diversity of sources of calcium ions. However, in Figure 7b, Ca2+ are not well correlated with other water quality parameters; this may indicate the monotony of Ca2+ source in the Tuo River. Fluorite has been reported to be the primary source of fluoride concentrations in groundwater [7]. The correlation between F and Ca2+, Cl, SO42−, Na+ and HCO3 indicated that the dissolution of rock minerals may be an important source of fluoride ions, while the correlation between F and TP suggested that agricultural non-point source pollution may be another important source of fluoride ions in the Bian River. Studies have shown that there are some fluorine-containing compounds in phosphate fertilizer [42]. From Figure 7b, we can know that there was a significant negative correlation between K+ and Na+ in the Tuo River, indicating that there may be inhibition between K+ and Na+. There was no significant correlation between F and TP in the Tuo River, indicating that the Tuo River was less polluted by agricultural non-point sources. In addition, the main cations and HCO3 and CO32− did not show a good correlation; this shows that carbonate minerals have little effect on the main ions in the Tuo River.

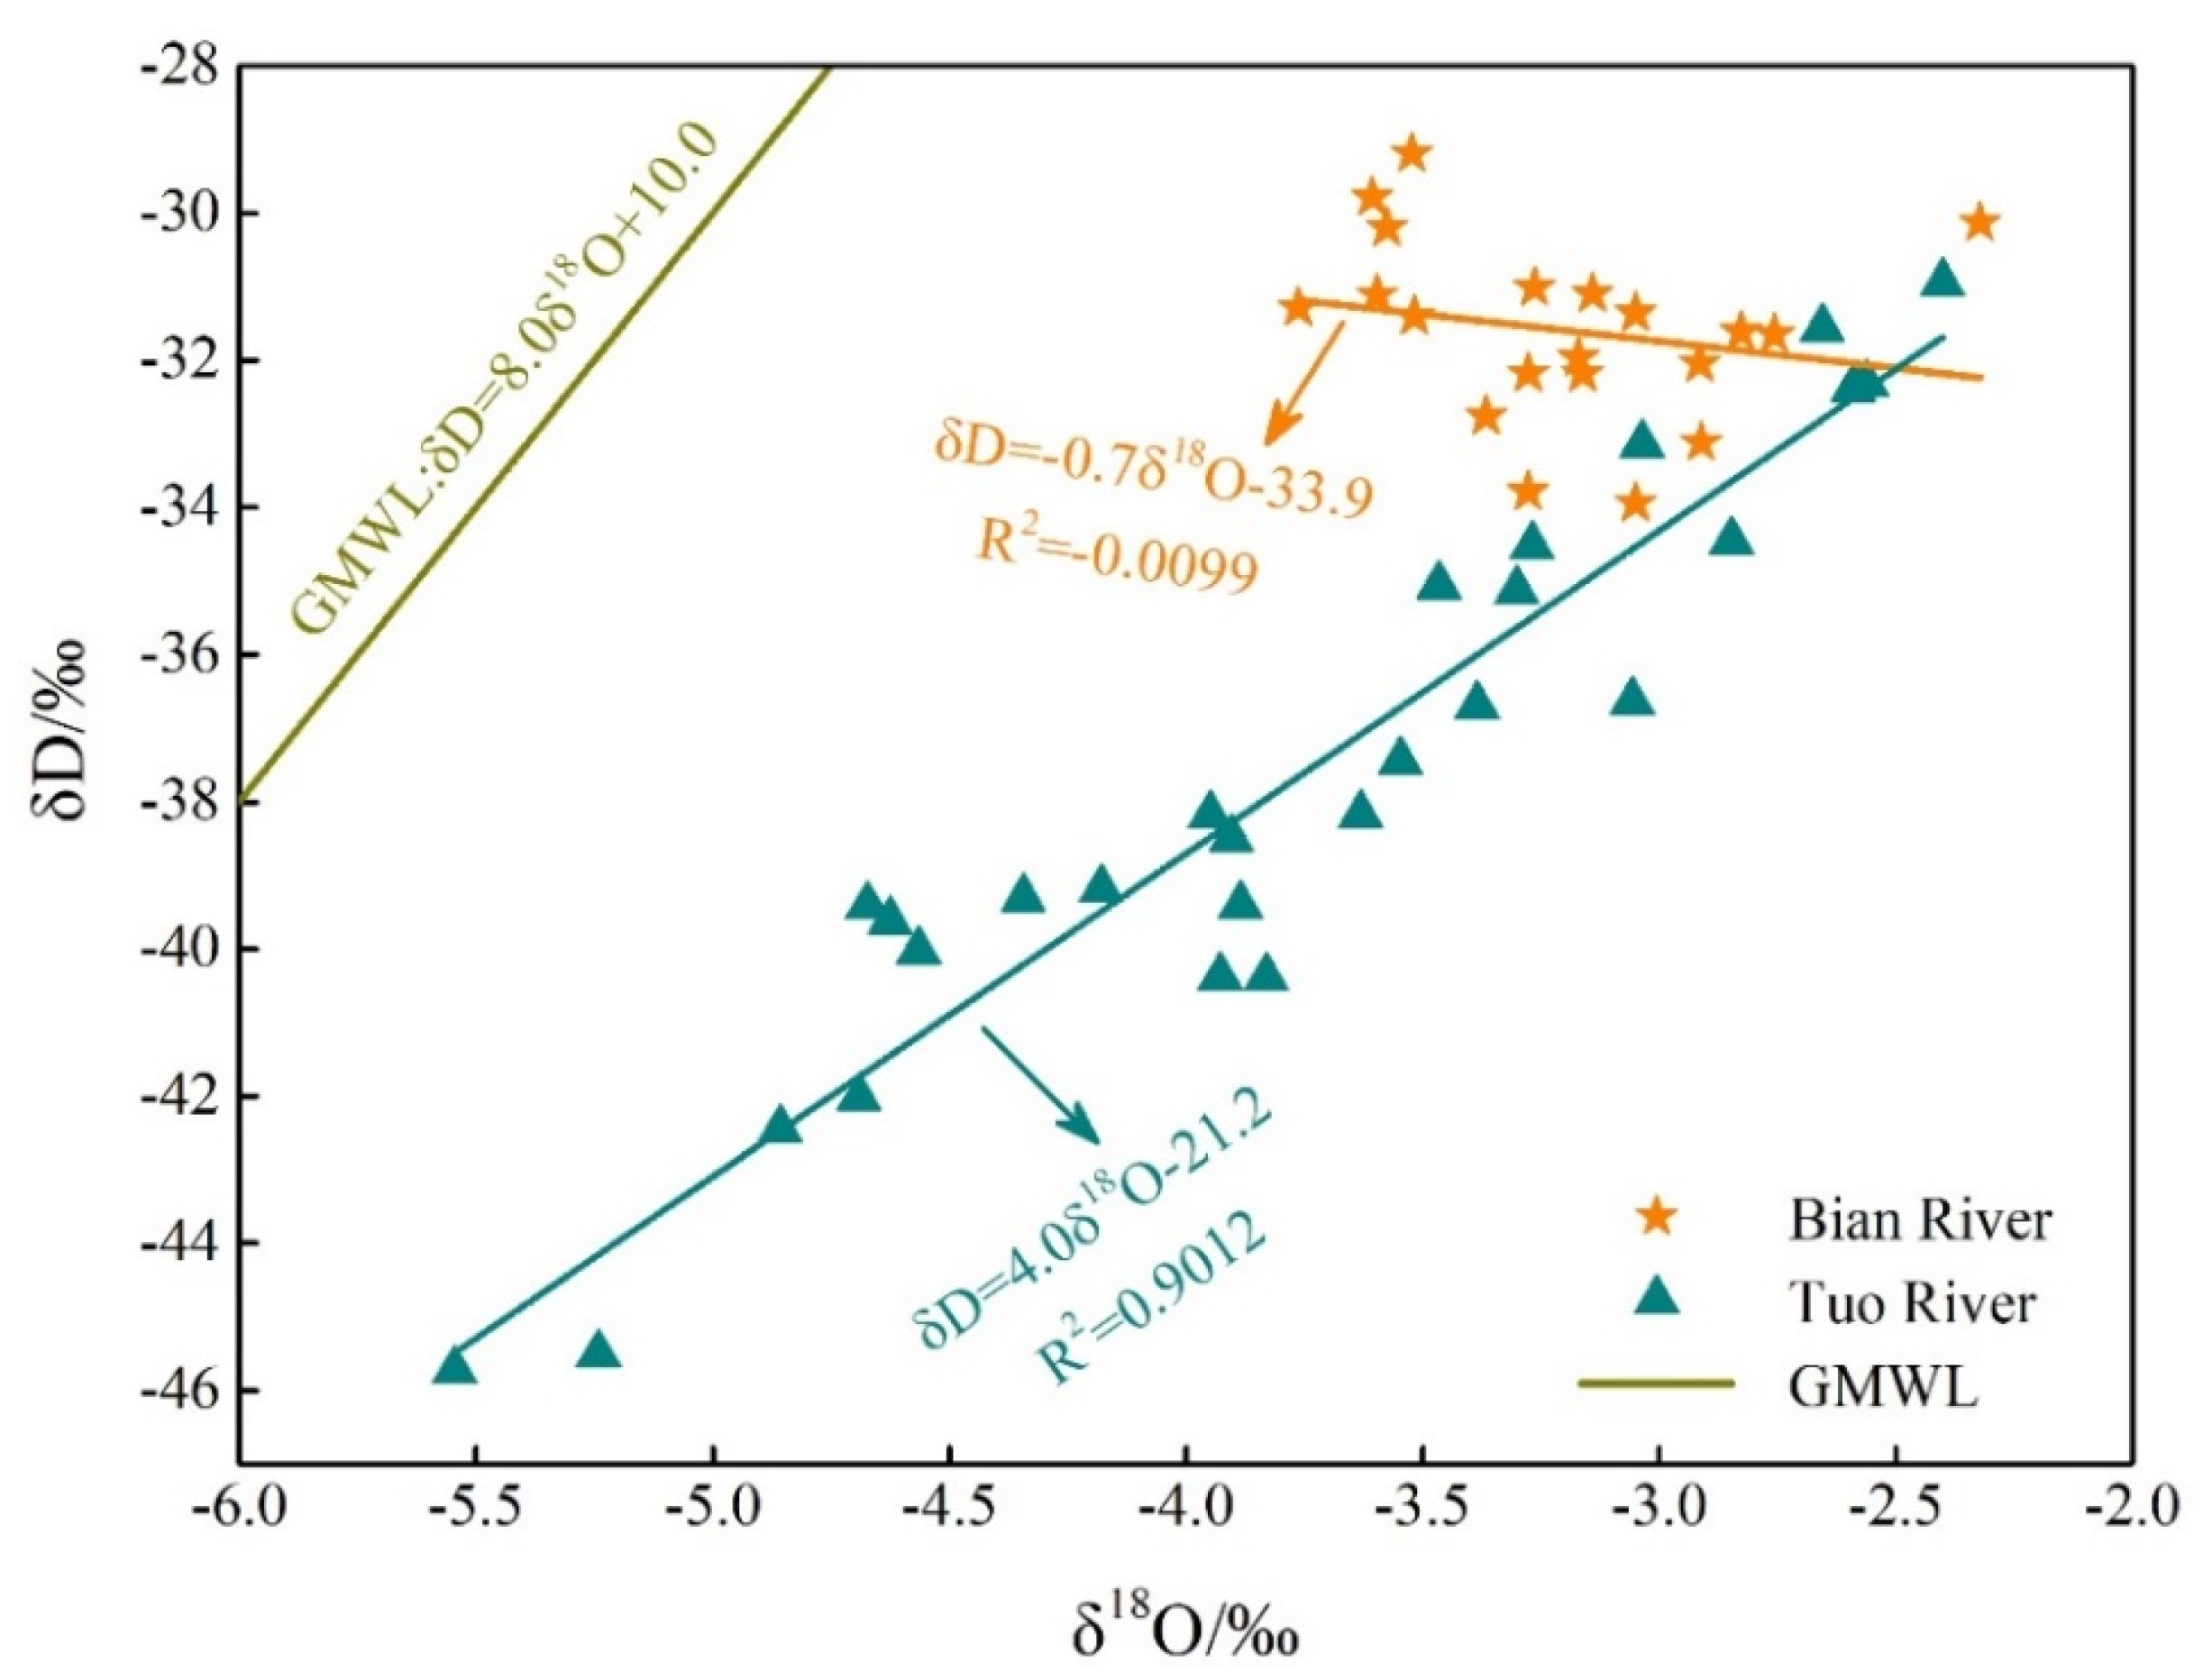
4.1.3. Analysis of River Replenishment Sources

Generally, the composition of river ions is restricted by the source of replenishment, evaporation and mixing, and can reflect different characteristics of hydrogen and oxygen isotopes. Hydrogen and oxygen isotopes can trace the environmental information carried by the hydrogeochemical process of rivers and play an important role in the study of river water source and water cycle [43]. Hydrogen and oxygen isotopes are the intrinsic components of water molecules, which generally do not change with the change of water rock interaction when the temperature is low. They are ideal natural tracers [8].
By studying the natural meteoric waters from many parts of the word, Craig [44] found that there is a linear relationship between δD and δ18O in surface water, which is expressed as δD = 8.0δ18O + 10, which is called the Global Meteoric Water Line, referred to as GMWL. D-excess (d = δD − 818O), that is to say, the intercept of Global Meteoric Water Line, can reflect the degree of imbalance of evaporation and condensation process of regional atmospheric precipitation [45]. The larger the d value is, the more positive the values δD and δ18O are; the stronger the imbalance of evaporation and condensation is, and the smaller the d value is, the weaker the imbalance. The values of δD, δ18O, and d-excess in the study area are shown in Table 3.
It can be seen from Table 3 that the d values of Tuo River and Bian River were significantly smaller than the d values of the Global Meteoric Water Line (10‰), indicating an evaporative effect, leading to the enrichment of hydrogen and oxygen isotopes; meanwhile, the d value of Bian River is larger than that of Tuo River, indicating that the evaporation of Bian River is stronger than that of Tuo River, which may be due to the wide Bian River and the long-term exposure to sunlight at the edge of the city. The water evaporation lines of Bian River and Tuo River were obtained by the linear fitting. Now, the GMWL and Bian and Tuo River water evaporation lines were drawn on the δD-δ18O coordinate map, as shown in Figure 8. The δD and δ18O of Tuo River (R2 = 0.9012) show good linearity, while those of Bian River (R2 = −0.0099) are poor, and, combined with Figure 3, the contents of Na+, K+, SO42−, Cl, Ca2+, and TP in the Bian River were much higher than that in the Tuo River (ANOVA, p < 0.001); it can be concluded that the Bian River δD and δ18O content was affected by many factors, such as land use, hydrological, and anthropogenic activities. From Figure 8, it can be seen that the sampling points of the two rivers fell below the GMWL, and the slope of the evaporation line was also significantly lower than that of the GMWL, which showed that the collected water samples for summer precipitation recharge water bodies or the evaporation effect of atmospheric precipitation was produced before the formation of surface water, which was consistent with the evaporation characteristics and sampling time (summer) of surface water in temperate climate zone.

4.2. Water Quality Evaluation of the Study Area

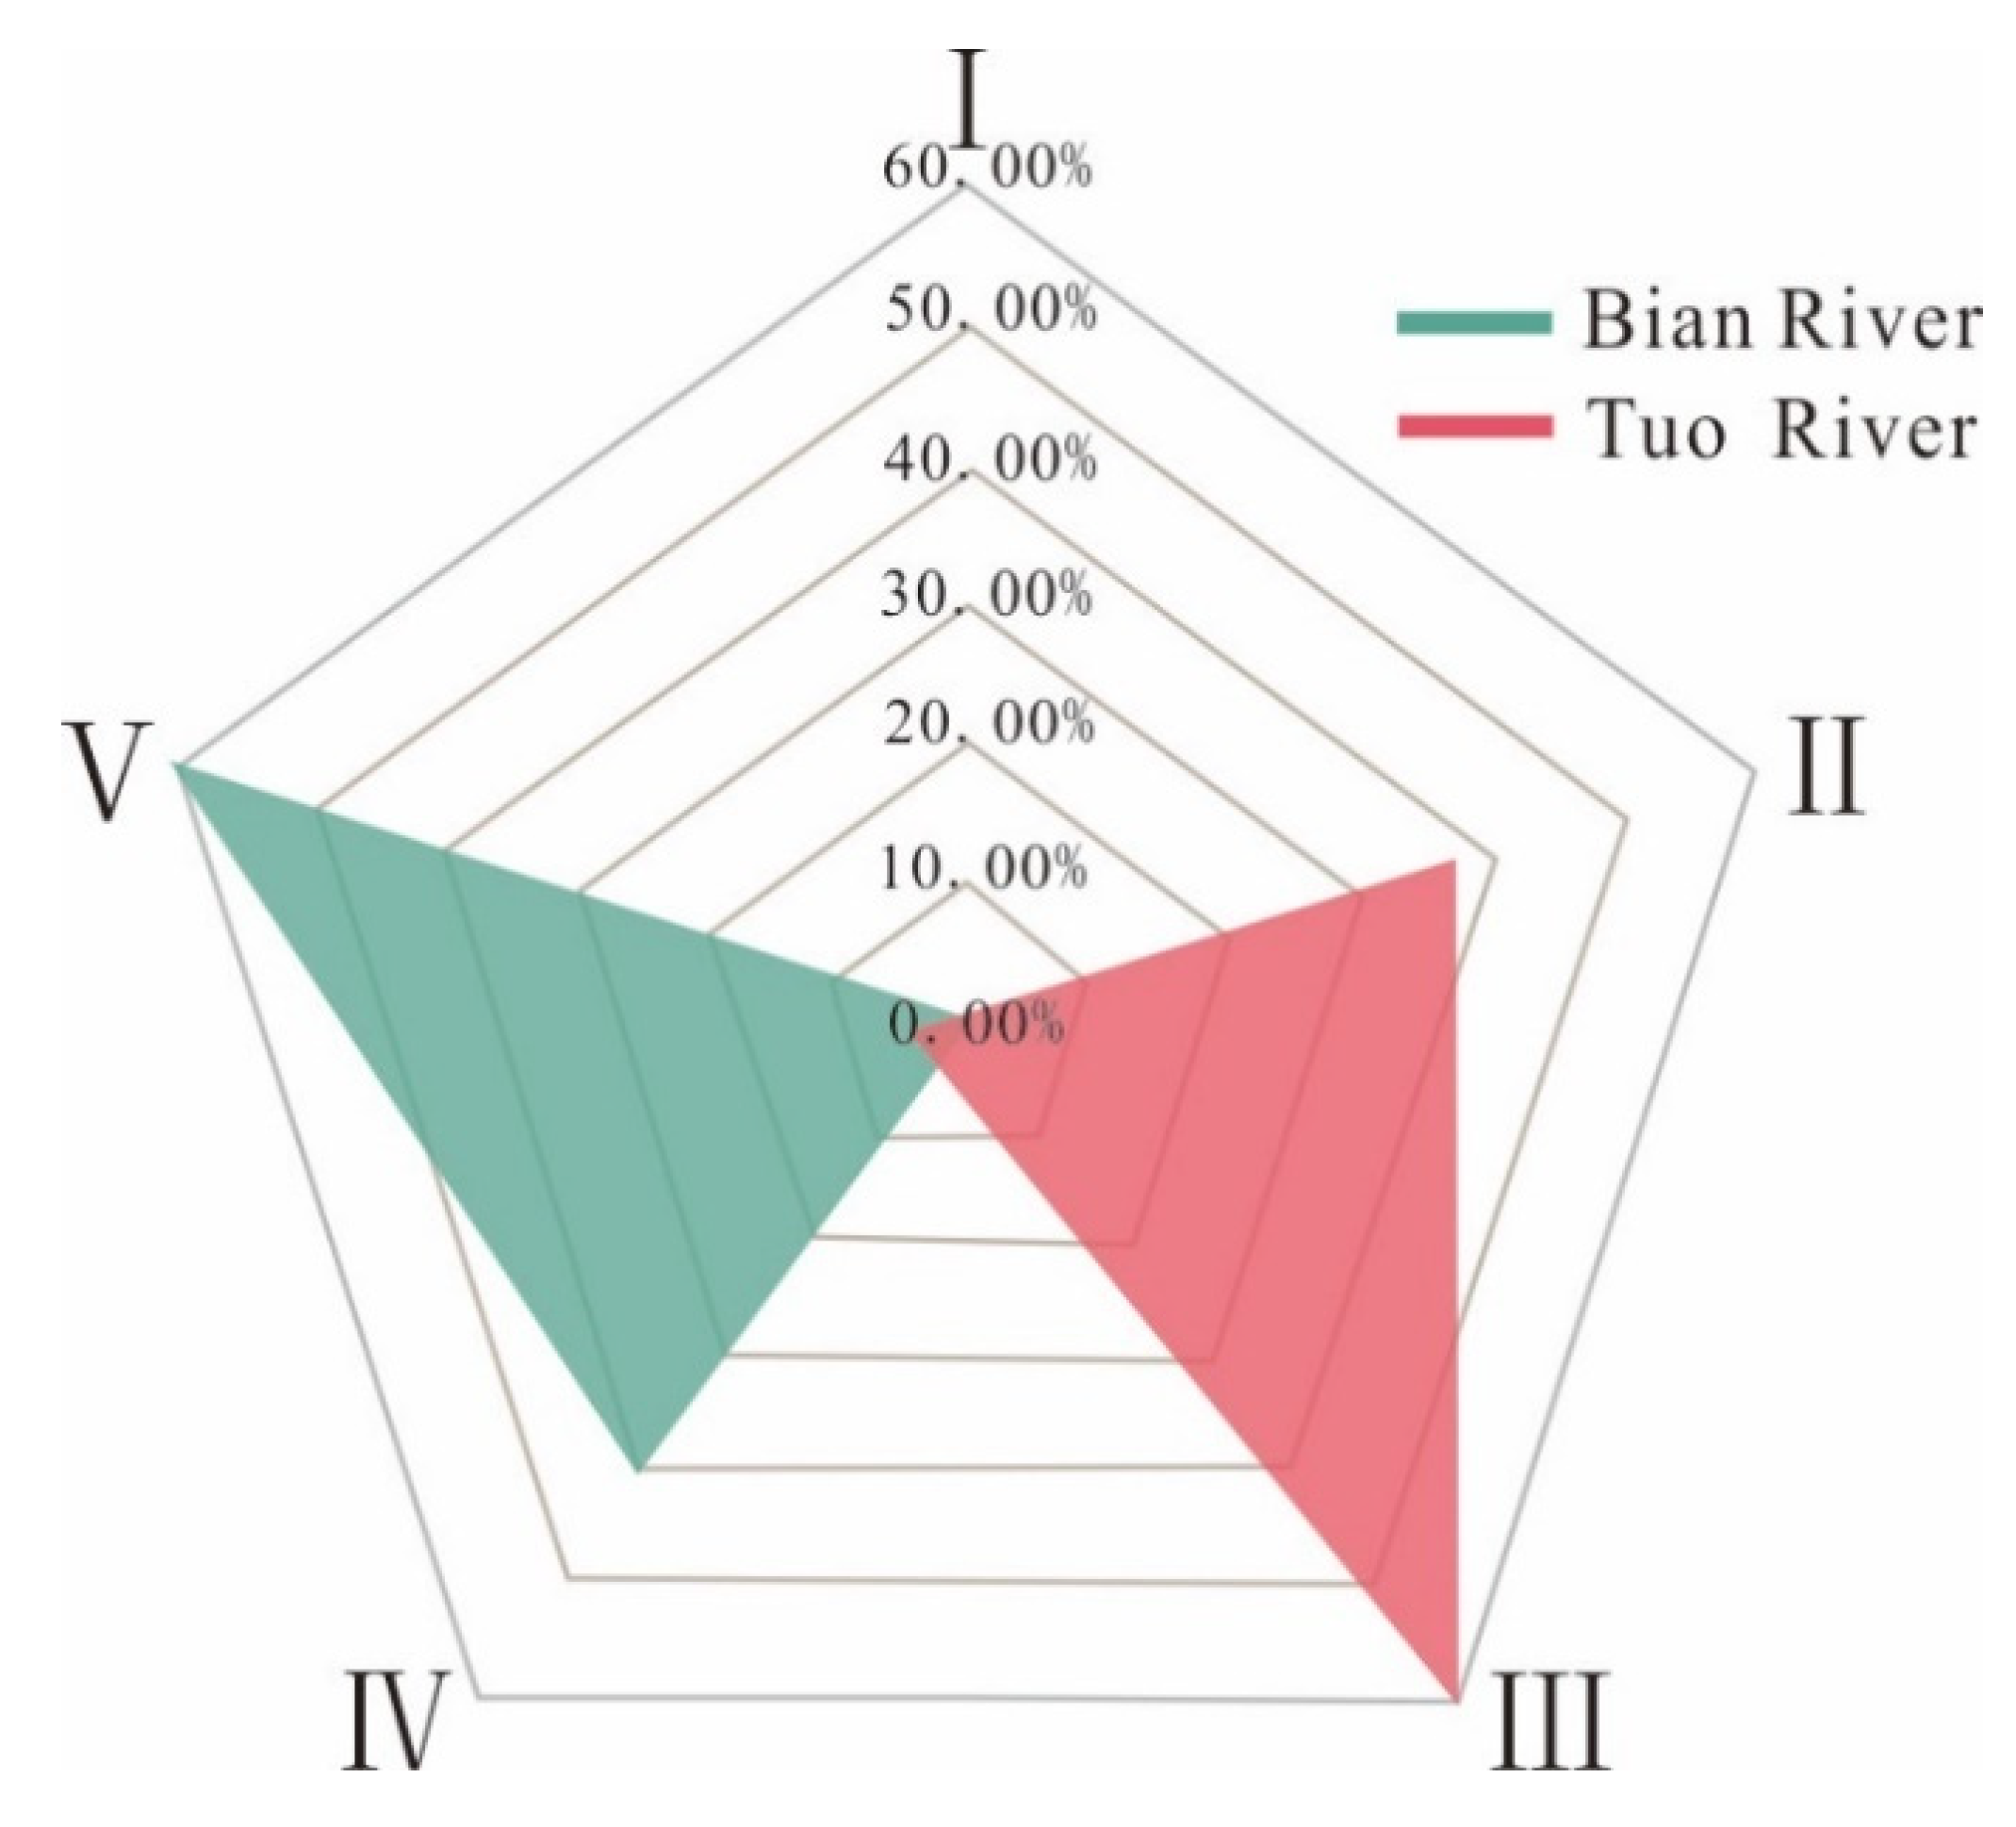
4.2.1. Water Quality Grade Evaluation

In this paper, the improved fuzzy comprehensive evaluation method was adopted, and the China Surface Water Environmental Quality Standard (GB 3838-20002) was used as the evaluation standard. The five parameters of TN, TP, COD, Cl, and SO42− were selected to check the water quality of the two rivers. Based on the improved fuzzy comprehensive evaluation method, the measured data were calculated step by step.
Taking the B3 test data as an example, the membership degree can be calculated according to Formulas (4) to determine the fuzzy relation matrix:
R = ( 0 0 0.0268 0.9732 0 0 0.8795 0.1205 0 0 0 0 0.743 0.257 0 0 0 0 0 1 0 0 0 0.31 0.69 ) COD TN TP SO 4 2 Cl
According to the entropy weight method, the weight of different evaluation factors in fuzzy comprehensive evaluation was calculated by Formula (8):
W = (0.1854, 0.1410, 0.2606, 0.1803, 0.2328)
In line with Formula (9), the membership degree of B3 to various quality levels of surface water was calculated:
B = W × R = (0, 0.1240, 0.2156, 0.3195, 0.3409)
According to the principle of maximum membership, 0.3409 was the maximum of the five numbers. Thus, B3 belonged to class Ⅴ.
In accordance with the above steps, the water quality evaluation results of Bian River and Tuo River are shown in Table 4 and Table 5, respectively. The results of Tuo River and Bian River are plotted as Figure 9. We can see that, among the surface water samples of the Tuo River flowing through the center of the urban area in the study area, class II and class III accounted for 40.74% and 59.26%, respectively. The water quality of these two types of water was relatively good, which were suitable for fish breeding, landscape entertainment, and industrial and agricultural water use. Among the surface water samples of Bian River in the urban fringe area, 35% were of class IV water and 60% were of class V water. Generally speaking, the water quality of Bian River was poor.
Based on the water quality requirements of agricultural and industrial water, it may only be used for general agricultural irrigation or after selection or treatment according to the purpose of water use. There are agricultural activities near the two rivers in the study area. In order to evaluate the agricultural value of the two rivers in the study area more reasonably and effectively, it was further used for irrigation water quality analysis.

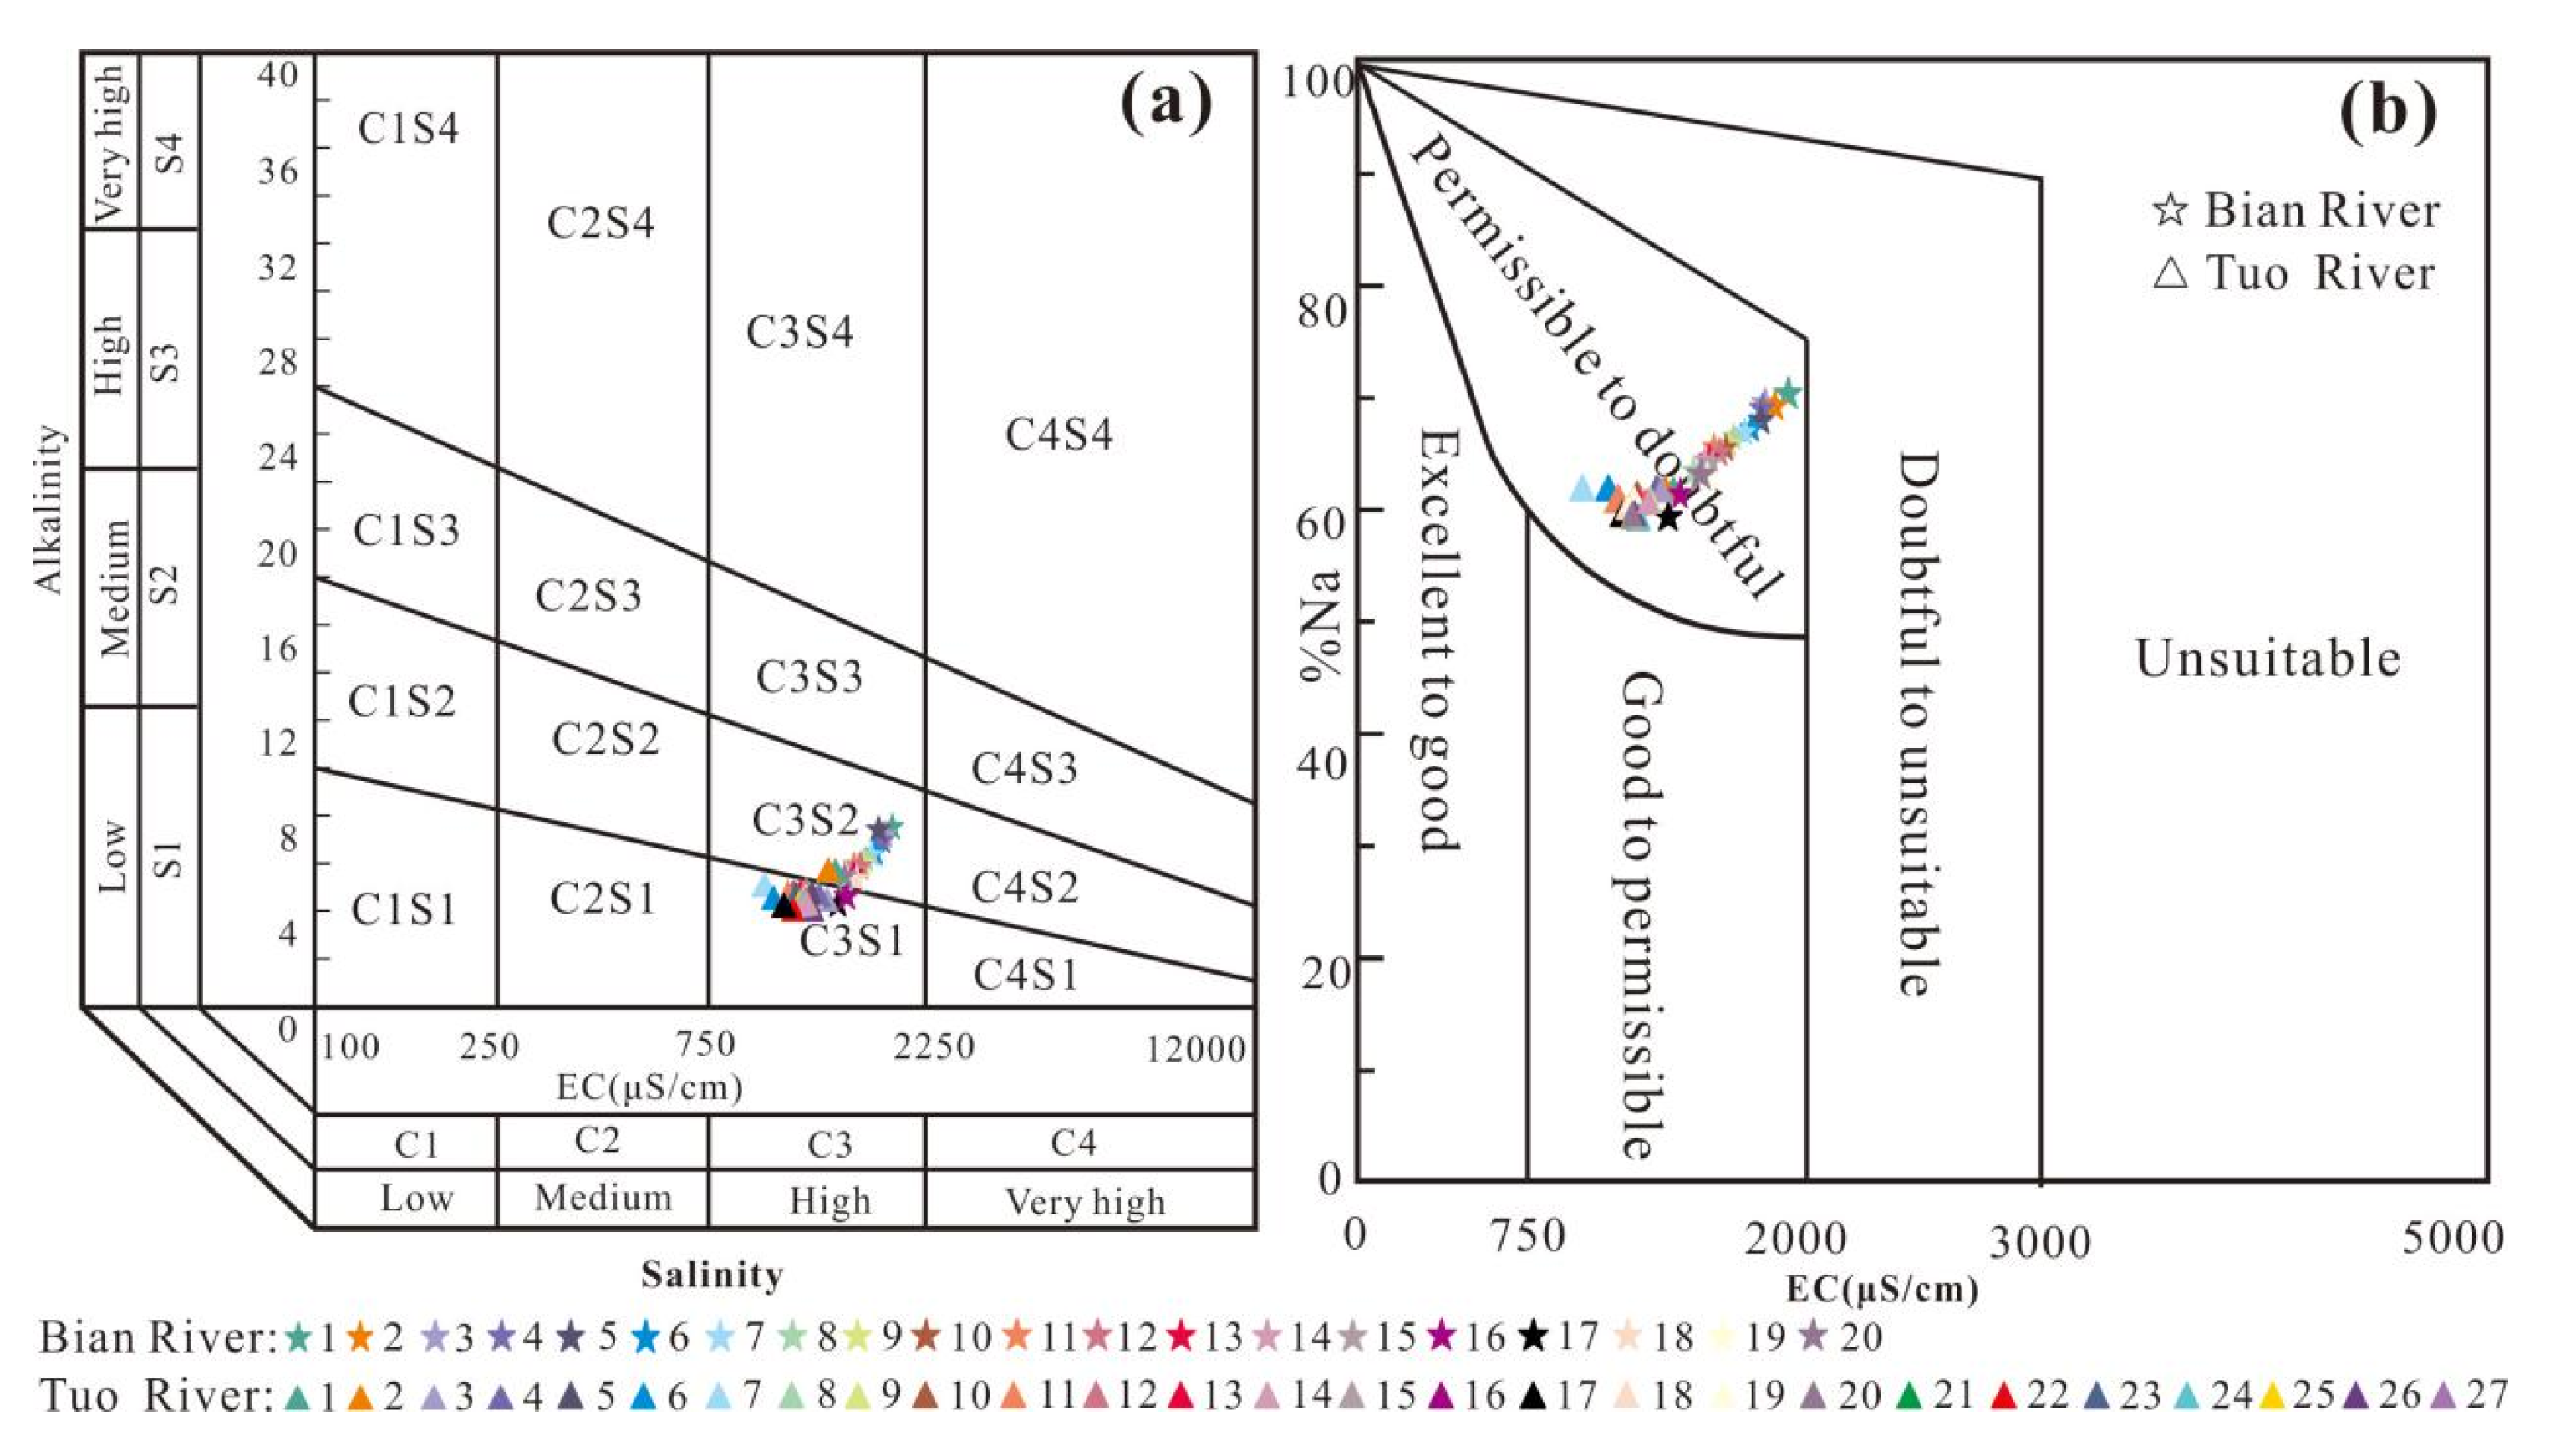
4.2.2. Water Quality Evaluation of Irrigation Water

If there are too many dissolved ions in the irrigation water, it will affect the physical and chemical properties of the soil and plant growth, and reduce the productivity of the soil [46]. The USSL diagram can comprehensively reflect the effects of SAR and EC values on the soil, and the Wilcox diagram can simultaneously represent the effects of Na% and EC on the soil and crops. Therefore, the USSL diagram and Wilcox diagram were used to evaluate irrigation water in the two rivers.
Wilcox diagram can be divided into five areas: excellent good irrigation water quality area, good irrigation water quality area, allowable suspected area, suspected reserve area, and unavailable area. According to the %Na value calculated by Formula (10), the Wilcox diagram of Figure 10b can be obtained. It can be seen from the figure that all water sample points of the two rivers belonged to the allowable suspected area. Although this kind of water used for irrigation may cause the risk of alkali damage, the risk is relatively small, and appropriate measures can be taken to prevent alkali damage.
Irrigated water with higher conductivity (EC) can cause soil salinization. According to the conductivity, the irrigation water body can be divided into C1 low salinization (EC <250 μS/cm), C2 medium salinization (250−750 μS/cm), C3 high salinization (750−2250 μS/cm), and C4 is higher salinized (>2250 μS/cm). The SAR value obtained by Formula (11), combined with EC, gave the USSL diagram (Figure 10a). For the Tuo River, most of the water sample points (92.6%) falled in C3S1 area with high salt damage. If the soil leaching conditions are good, it can be used for irrigation. For the Bian River, most of the water samples (99%) fell into the C3S2 area with high salt and medium alkali damage, which was suitable for irrigation of plants with strong salt tolerance. It can be seen from Figure 10 that the EC Value of Bian River decreases successively from sample No. 1 to No. 20.

4.3. Implications for Water Resource Management

The result of this study has implications for urban surface water management. The result of water quality evaluation shows that Tuo River has better water quality than Bian River; according to Figure 3, the average content of sulfate in the Bian River is 306.81 mg/L, which is far beyond the quality standards of surface water in China (250 mg/L) and drinking water under the guidance of the World Health Organization (250 mg/L). Zheng et al. [47] studied the δ34S-SO4 content of the main surface water in this area and found that coal mining had a certain impact on the sulfate content in this area.
Therefore, the management of non-point agricultural pollution and discharge of mining wastewater in the Bian River should be strengthened. At the same time, the water quality of Tuo River is better, which may be due to the fact that Tuo River is located in the urban area. In order to ensure the ecological water use of urban rivers, the upstream and downstream of Tuo River are equipped with sluice gates (Figure 1c).
In addition, peri-urban zones are transitional areas with unique structures that link urban and rural ecosystems, which can provide raw materials, energy, and food for the city, and also absorb industrial and domestic pollutants and wastes generated by the city [48]. Therefore, in the process of urbanization, it is necessary to optimize urban functional zoning and regularly monitor the health of urban water environments.

5. Conclusions

Based on the data of stream hydrochemistry, the main hydrochemistry process and water quality of Bian River and Tuo River are analyzed. The results are as follows:
(1)
The content of cations in the Tuo River and Bian River of the study area changed to Na+ > Mg2+ > K+ > Ca2+, and the content of anions changed to SO42− > HCO3 > Cl > CO32− > F. The contents of main ions and nutrition indexes in the Bian River are higher than those in the Tuo River, especially the contents of Na+, K+, SO42−, Cl, Ca2+, and TP (ANOVA, p < 0.001).
(2)
The hydrochemical types of the two rivers were the SO4-Cl-Na type. The chemical composition of the two rivers was mainly mainly affected by silicate weathering; there is a partial influence of evaporate dissolution. The results of correlation analysis show that Bian River is greatly affected by agricultural non-point source pollution. The analysis of hydrogen and oxygen isotopes shows that precipitation is the supply source of the Bian River and Tuo River.
(3)
The results of fuzzy comprehensive evaluation showed that the water quality of the Tuo River water sample was good, which was suitable for fish breeding, landscape entertainment and industrial and agricultural water; while that of the Bian River water sample was poor, which may only be suitable for general agricultural irrigation or need to be selected or treated according to the purpose of water use. The evaluation results of irrigation water quality showed that the water samples of the Tuo River were high in salt and low in alkali. When the soil leaching conditions were good, they could be used for irrigation, while the water samples of the Bian River were high in salt and alkali, suitable for irrigating plants with strong salt tolerance.

Author Contributions

Conceptualization, H.G. and M.W.; methodology, H.G.; software, H.F.; validation, C.C. and Y.Z.; formal analysis, H.G. and H.Y.; investigation, Y.J. and H.Y.; writing—original draft preparation, Y.J.; writing—review and editing, Y.J.; visualization, Y.J. and C.W.; supervision, H.G.; project administration, Y.H.; funding acquisition, H.G. All authors have read and agreed to the published version of the manuscript.

Funding

This research was funded by the National Natural Science Foundation of China (41773100 and 41373095), the Research Project of Huaibei Mining Group Co. (2020), and the Research Project of Wanbei Coal-Electricity Group Co. Ltd (2020).

Acknowledgments

We sincerely thank the National Engineering Research Center of Coal Mine Water Hazard Controlling (Suzhou University) for providing the experimental site.

Conflicts of Interest

The authors declare no conflict of interest.

References

  1. Vorosmarty, C.J. Global Water Resources: Vulnerability from Climate Change and Population Growth. Science 2000, 289, 284–288. [Google Scholar] [CrossRef] [Green Version]
  2. Jasechko, S.; Perrone, D.; Befus, K.M.; Cardenas, M.B.; Ferguson, G.; Gleeson, T.; Luijendijk, E.; McDonnell, J.J.; Taylor, R.G.; Wada, Y.; et al. Global aquifers dominated by fossil groundwaters but wells vulnerable to modern contamination. Nat. Geosci. 2017, 10, 425–429. [Google Scholar] [CrossRef] [Green Version]
  3. Meng, Z.; Yang, Y.; Qin, Z.; Huang, L. Evaluating Temporal and Spatial Variation in Nitrogen Sources along the Lower Reach of Fenhe River (Shanxi Province, China) Using Stable Isotope and Hydrochemical Tracers. Water 2018, 10, 231. [Google Scholar] [CrossRef] [Green Version]
  4. Torres Lopez, S.; de los Angeles Barrionuevo, M.; Rodriguez-Labajos, B. Water accounts in decision-making processes of urban water management: Benefits, limitations and implications in a real implementation. Sustain. Cities Soc. 2019, 50, 101676. [Google Scholar] [CrossRef]
  5. Chen, J.; Wang, F.; Xia, X.; Zhang, L. Major element chemistry of the Changjiang (Yangtze River). Chem. Geol. 2002, 187, 231–255. [Google Scholar] [CrossRef]
  6. Yu, Z.; Wang, Y.; Li, Y.; Zwahlen, F.; Boillat, J. Hydrogeochemical characteristics of central Jianghan Plain, China. Environ. Earth Sci. 2013, 68, 765–778. [Google Scholar]
  7. Fu, C.; Li, X.; Ma, J.; Liu, L.; Gao, M.; Bai, Z. A hydrochemistry and multi-isotopic study of groundwater origin and hydrochemical evolution in the middle reaches of the Kuye River basin. Appl. Geochem. 2018, 98, 82–93. [Google Scholar] [CrossRef]
  8. Kanduc, T.; Kocman, D.; Ogrinc, N. Hydrogeochemical and stable isotope characteristics of the River Idrijca (Slovenia), the boundary watershed between the Adriatic and Black Seas. Aquat. Geochem. 2008, 14, 239–262. [Google Scholar] [CrossRef]
  9. Rashid, I.; Romshoo, S.A. Impact of anthropogenic activities on water quality of Lidder River in Kashmir Himalayas. Environ. Monit. Assess. 2013, 185, 4705–4719. [Google Scholar] [CrossRef]
  10. Misaghi, F.; Delgosha, F.; Razzaghmanesh, M.; Myers, B. Introducing a water quality index for assessing water for irrigation purposes: A case study of the Ghezel Ozan River. Sci. Total Environ. 2017, 589, 107–116. [Google Scholar] [CrossRef]
  11. Hua, K.; Xiao, J.; Li, S.; Li, Z. Analysis of hydrochemical characteristics and their controlling factors in the Fen River of China. Sustain. Cities Soc. 2020, 52, 101827. [Google Scholar] [CrossRef]
  12. Rose, S. The effects of urbanization on the hydrochemistry of base flow within the Chattahoochee River Basin (Georgia, USA). J. Hydrol. 2007, 341, 42–54. [Google Scholar] [CrossRef]
  13. Lu, X.; Li, L.Y.; Lei, K.; Wang, L.; Zhai, Y.; Zhai, M. Water quality assessment of Wei River, China using fuzzy synthetic evaluation. Environ. Earth Sci. 2010, 60, 1693–1699. [Google Scholar] [CrossRef]
  14. Qin, H.; Gao, B.; He, L.; Hu, X.; Dong, L.; Sanjay, D.; Dong, A.; Sun, Z.; Wan, W. Hydrogeochemical Characteristics and Controlling Factors of the Lhasa River under the Influence of Anthropogenic Activities. Water 2019, 11, 948. [Google Scholar] [CrossRef] [Green Version]
  15. Qiu, H.; Gui, H.; Cui, L.; Pan, Z.; Lu, B. Hydrogeochemical characteristics and water quality assessment of shallow groundwater: A case study from Linhuan coal-mining district in northern Anhui Province, China. Water Sci. Technol.-Water Supply 2019, 19, 1572–1578. [Google Scholar] [CrossRef]
  16. Qiu, H.; Gui, H. Heavy metals contamination in shallow groundwater of a coal-mining district and a probabilistic assessment of its human health risk. Hum. Ecol. Risk Assess. Int. J. 2019, 25, 548–563. [Google Scholar] [CrossRef]
  17. Wang, Y.; Sheng, D.; Wang, D.; Ma, H.; Wu, J.; Xu, F. Variable Fuzzy Set Theory to Assess Water Quality of the Meiliang Bay in Taihu Lake Basin. Water Resour. Manag. 2014, 28, 867–880. [Google Scholar] [CrossRef]
  18. Dahiya, S.; Singh, B.; Gaur, S.; Garg, V.K.; Kushwaha, H.S. Analysis of groundwater quality using fuzzy synthetic evaluation. J. Hazard. Mater. 2007, 147, 938–946. [Google Scholar] [CrossRef]
  19. Li, Z.; Zhou, B.; Teng, D.; Yang, W.; Qiu, D. Comprehensive evaluation method of groundwater environment in a mining area based on fuzzy set theory. Geosyst. Eng. 2018, 21, 103–112. [Google Scholar] [CrossRef]
  20. Masoud, A.A.; El-Horiny, M.M.; Atwia, M.G.; Gemail, K.S.; Koike, K. Assessment of groundwater and soil quality degradation using multivariate and geostatistical analyses, Dakhla Oasis, Egypt. J. Afr. Earth Sci. 2018, 142, 64–81. [Google Scholar] [CrossRef]
  21. Jalali, M. Groundwater geochemistry in the Alisadr, Hamadan, western Iran. Environ. Monit. Assess. 2010, 166, 359–369. [Google Scholar] [CrossRef] [PubMed]
  22. Li, Z.; Xiao, J.; Evaristo, J.; Li, Z. Spatiotemporal variations in the hydrochemical characteristics and controlling factors of streamflow and groundwater in the Wei River of China. Environ. Pollut. 2019, 254, 113006. [Google Scholar] [CrossRef] [PubMed]
  23. World Health Organization. Guidelines for Drinking-Water Quality, 4th ed.; World Health Organization: Geneva, Switzerland, 2011; pp. 104–108. [Google Scholar]
  24. Liu, S.; Ryu, D.; Webb, J.A.; Lintern, A.; Waters, D.; Guo, D.; Western, A.W. Characterisation of spatial variability in water quality in the Great Barrier Reef catchments using multivariate statistical analysis. Mar. Pollut. Bull. 2018, 137, 137–151. [Google Scholar] [CrossRef] [PubMed]
  25. Bu, H.; Song, X.; Zhang, Y. Using multivariate statistical analyses to identify and evaluate the main sources of contamination in a polluted river near to the Liaodong Bay in Northeast China. Environ. Pollut. 2019, 245, 1058–1070. [Google Scholar] [CrossRef]
  26. Rodrigues, V.; Estrany, J.; Ranzini, M.; de Cicco, V.; Tarjuelo Martin-Benito, J.M.; Hedo, J.; Lucas-Borja, M.E. Effects of land use and seasonality on stream water quality in a small tropical catchment: The headwater of Corrego Agua Limpa, Sao Paulo (Brazil). Sci. Total Environ. 2018, 622, 1553–1561. [Google Scholar] [CrossRef] [Green Version]
  27. Chen, Q.; Mei, K.; Dahlgren, R.A.; Wang, T.; Gong, J.; Zhang, M. Impacts of land use and population density on seasonal surface water quality using a modified geographically weighted regression. Sci. Total Environ. 2016, 572, 450–466. [Google Scholar] [CrossRef] [Green Version]
  28. Adimalla, N. Groundwater Quality for Drinking and Irrigation Purposes and Potential Health Risks Assessment: A Case Study from Semi-Arid Region of South India. Expo. Health 2019, 11, 109–123. [Google Scholar] [CrossRef]
  29. Ma, L.; Abuduwaili, J.; Li, Y.; Uulu, S.A.; Mu, S. Hydrochemical Characteristics and Water Quality Assessment for the Upper Reaches of Syr Darya River in Aral Sea Basin, Central Asia. Water 2019, 11, 1893. [Google Scholar] [CrossRef] [Green Version]
  30. Reeburgh, W.S. Global environment: Water, air, and geochemical cycles (BR). Int. J. Environ. Stud. 1996, 70, 155–156. [Google Scholar]
  31. Gibbs, R.J. Mechanisms Controlling World Water Chemistry. Science 1970, 170, 1088–1090. [Google Scholar] [CrossRef]
  32. Neogi, B.; Singh, A.K.; Pathak, D.D.; Chaturvedi, A. Hydrogeochemistry of coal mine water of North Karanpura coalfields, India: Implication for solute acquisition processes, dissolved fluxes and water quality assessment. Environ. Earth Sci. 2017, 76, 489. [Google Scholar] [CrossRef]
  33. Marghade, D.; Malpe, D.B.; Zade, A.B. Major ion chemistry of shallow groundwater of a fast growing city of Central India. Environ. Monit. Assess. 2012, 184, 2405–2418. [Google Scholar] [CrossRef] [PubMed]
  34. Singh, G.; Rishi, M.S.; Herojeet, R.; Kaur, L.; Priyanka; Sharma, K. Multivariate analysis and geochemical signatures of groundwater in the agricultural dominated taluks of Jalandhar district, Punjab, India. J. Geochem. Explor. 2020, 208, 106395. [Google Scholar] [CrossRef]
  35. Pan, G.; Li, X.; Zhang, J.; Liu, Y.; Liang, H. Groundwater-flow-system characterization with hydrogeochemistry: A case in the lakes discharge area of the Ordos Plateau, China. Hydrogeol. J. 2019, 27, 669–683. [Google Scholar] [CrossRef]
  36. Manoj, S.; Thirumurugan, M.; Elango, L. Hydrogeochemical modelling to understand the surface water–groundwater interaction around a proposed uranium mining site. J. Earth Syst. Sci. 2019, 128, 49. [Google Scholar] [CrossRef] [Green Version]
  37. Singh, S.K.; Sarin, M.M.; France-Lanord, C. Chemical erosion in the eastern Himalaya: Major ion composition of the Brahmaputra and δ13C of dissolved inorganic carbon. Geochim. Cosmochim. Acta 2005, 69, 3573–3588. [Google Scholar] [CrossRef]
  38. Hydrogeological and hydrogeochemical characterization of a karstic mountain region. Environ. Geol. 2008, 54, 309–310. [CrossRef] [Green Version]
  39. Wang, M.; Gui, H.; Hu, R.; Zhao, H.; Li, J.; Yu, H.; Fang, H. Hydrogeochemical Characteristics and Water Quality Evaluation of Carboniferous Taiyuan Formation Limestone Water in Sulin Mining Area in Northern Anhui, China. Int. J. Environ. Res. Public. Health 2019, 16, 2512. [Google Scholar] [CrossRef] [Green Version]
  40. Zong-Jie, L.; Zong-Xing, L.; Ling-Ling, S.; Jin-Zhu, M.; Yong, S. Environment significance and hydrochemical characteristics of supra-permafrost water in the source region of the Yangtze River. Sci. Total Environ. 2018, 644, 1141–1151. [Google Scholar] [CrossRef]
  41. Tarawaneh, M.S.M.; Janardhana, M.R.; Ahmed, M.M. Hydrochemical processes and groundwater quality assessment in North eastern region of Jordan valley, Jordan. HydroResearch 2019, 2, 129–145. [Google Scholar] [CrossRef]
  42. Yu, Y.; Yang, J. Health risk assessment of fluorine in fertilizers from a fluorine contaminated region based on the oral bioaccessibility determined by Biomimetic Whole Digestion-Plasma in-vitro Method (BWDPM). J. Hazard. Mater. 2020, 383, 121124. [Google Scholar] [CrossRef] [PubMed]
  43. Machavaram, M.V.; Whittemore, D.O.; Conrad, M.E.; Miller, N.L. Precipitation induced stream flow: An event based chemical and isotopic study of a small stream in the Great Plains region of the USA. J. Hydrol. 2006, 330, 470–480. [Google Scholar] [CrossRef]
  44. Craig, H. Isotopic Variations in Meteoric Waters. Science 1961, 133, 1702–1703. [Google Scholar] [CrossRef] [PubMed]
  45. Dixon, R.K.; Solomon, A.M.; Brown, S.; Houghton, R.A.; Trexier, M.C.; Wisniewski, J. Carbon Pools and Flux of Global Forest Ecosystems. Science 1994, 263, 185–190. [Google Scholar] [CrossRef]
  46. Ehya, F.; Mosleh, A. Hydrochemistry and quality assessment of groundwater in Basht Plain, Kohgiluyeh-va-Boyer Ahmad Province, SW Iran. Environ. Earth Sci. 2018, 77, 164. [Google Scholar] [CrossRef]
  47. Zheng, L.; Chen, X.; Dong, X.; Wei, X.; Jiang, C.; Tang, Q. Using δ34S–SO4 and δ18O–SO4 to trace the sources of sulfate in different types of surface water from the Linhuan coal-mining subsidence area of Huaibei, China. Ecotoxicol. Environ. Saf. 2019, 181, 231–240. [Google Scholar] [CrossRef]
  48. Tang, J.; Wang, W.; Yang, L.; Qiu, Q.; Lin, M.; Cao, C.; Li, X. Seasonal variation and ecological risk assessment of dissolved organic matter in a peri-urban critical zone observatory watershed. Sci. Total Environ. 2020, 707, 136093. [Google Scholar] [CrossRef]
Figure 1. Geographic location and land cover of the study area and sampling stations. (a) China; (b) the location of study regions; (c) the location of sampling sites and land use.
Water 12 00950 g001
Figure 2. Hydrogeological profile of A—A’.
Water 12 00950 g002
Figure 3. Values of water quality parameters in the Bian River and Tuo River (*** and **** mean significant different).
Water 12 00950 g003
Figure 4. Gibbs diagrams indicating the Tuo and Bian River naturel evolution mechanisms. (a) TDS vs Cl/(Cl + HCO3); (b) TDS vs Na+/(Na+ + Ca2+).
Water 12 00950 g004
Figure 5. The normalized diagram (a) Mg2+/Na+ vs Ca2+/Na+; (b) HCO3/Na+ vs Ca2+/Na+.
Water 12 00950 g005
Figure 6. Piper diagram for Bian River (a) and Tuo River (b); the red arrow represents river direction.
Water 12 00950 g006
Figure 7. Correlation matrices between nutrition indicators (TP and TN) and major hydrochemical parameters, (a) Bian River; (b) Tuo River.
Water 12 00950 g007
Figure 8. Relationship between oxygen and hydrogen isotope composition of the Tuo and Bian Rivers.
Water 12 00950 g008
Figure 9. Radar chart of fuzzy comprehensive evaluation results.
Water 12 00950 g009
Figure 10. USSL diagram (a) and Wilcox diagram (b).
Water 12 00950 g010
Table 1. Chinese surface water environmental quality standards about TN, TP, COD, SO42−, Cl.
GradeClassificationParameters(Unit: mg/L)
TNTPCODSO42−Cl
Excellent suitable for drinking water0.20.0115
Good suitable for drinking water0.50.02515
Moderate suitable for drinking water10.0520250250
Poor suitable for drinking water1.50.130
Unsuitable suitable for drinking water20.240
Table 2. Statistical analyses of the major ions of Bian River and Tuo River. C.V: Coefficient of variation.
Samples of Bian RiverNa+
(mg/L)
K+
(mg/L)
Mg2+
(mg/L)
Ca2+
(mg/L)
F
(mg/L)
Cl
(mg/L)
SO42−
(mg/L)
HCO3
(mg/L)
CO32−
(mg/L)
pH
-
TDS
(mg/L)
EC
(μS/cm)
TN
(mg/L)
TP
(mg/L)
COD
(mg/L)
B1294.8524.8357.0517.071.06163.30359.43260.6433.698.7695319101.840.1220.57
B2282.2825.4357.6917.681.07163.97347.61250.6229.368.5292918331.800.1515.05
B3284.2825.1357.4617.881.01162.05347.32243.4136.848.5892118482.150.1720.57
B4273.0425.0856.9917.631.00158.68327.15253.4328.578.6189118181.720.1618.06
B5316.1230.4568.4621.101.20186.40388.43254.6328.968.5787517882.270.1618.06
B6254.0125.8757.2817.740.99155.44313.13239.8131.728.6386217523.100.1721.11
B7251.3526.1457.8117.401.00154.98314.89230.3935.078.5784517242.420.1822.61
B8245.1526.1657.6317.560.96151.41308.93222.1835.078.6783216745.170.1725.65
B9239.2726.4158.0517.250.95151.14303.67220.1732.718.6281916464.560.1328.10
B10233.4926.5957.9917.040.96148.05295.64221.3830.748.7281016344.320.1430.62
B11234.2326.8258.4016.750.95147.14297.69197.9437.838.7579516002.020.1331.18
B12234.2527.3059.2316.910.94144.98300.21219.5730.938.6078016142.100.1334.62
B13223.1826.8558.0416.860.91143.89285.64219.5728.968.6077615763.230.1325.59
B14221.4327.4657.9816.830.88143.97286.91219.9726.808.5676615491.680.1330.11
B15220.5227.1258.1016.950.93144.70286.75201.7436.258.6577115791.600.1529.10
B16196.3228.6258.7816.830.90136.78266.75186.7238.228.6973214372.750.1232.66
B17177.9229.8358.9416.500.88130.81249.97176.1032.128.7668213752.060.0933.65
B18214.7228.3660.0617.630.94145.53285.71198.1435.478.5774515301.710.1232.12
B19216.4827.9959.5417.620.92143.58286.07206.9535.078.7674715223.310.1536.14
B20215.1527.6858.9717.380.91144.03284.39214.9627.988.4773815063.790.1131.11
Min177.9224.8356.9916.500.88130.81249.97176.1026.808.4768213751.600.0915.05
Max316.1230.4568.4621.101.20186.40388.43260.6438.228.7695319105.170.1836.14
Mean241.4027.0158.7217.430.97151.04306.81221.9232.628.6381316462.600.1426.83
SV(%)13.945.484.045.317.647.7410.5610.2810.480.968.458.6038.8916.7422.81
T1200.42 19.55 56.78 16.74 0.89 120.85 261.57 250.83 32.12 8.96 71514452.380.1122.59
T2198.22 19.01 56.99 16.79 0.92 120.50 259.44 142.24 25.61 9.02 70914072.780.1224.61
T3195.08 19.19 57.10 16.34 0.96 119.42 258.81 139.44 18.52 8.85 66113982.210.0921.57
T4194.30 19.28 56.99 15.99 0.94 118.88 258.12 226.38 31.52 8.72 66613792.800.0923.58
T5193.09 19.12 56.78 15.61 0.96 116.27 257.97 100.17 27.39 9.14 64613432.900.1120.57
T6192.99 19.06 56.63 15.55 0.95 118.37 256.81 211.96 46.11 8.92 63411381.760.0928.38
T7193.84 19.21 56.79 15.52 0.95 119.72 258.28 194.73 30.74 8.24 62410232.410.0821.08
T8189.64 21.72 57.43 15.84 0.98 113.92 249.67 196.53 53.40 8.45 67813452.310.0920.32
T9179.54 20.89 55.52 16.00 0.93 112.50 238.36 238.00 22.86 8.76 64913162.190.0915.80
T10187.91 22.57 57.53 15.15 1.11 115.65 287.44 195.93 45.71 8.30 61012462.290.0820.56
T11176.33 21.83 54.76 14.26 0.88 112.70 232.39 239.41 20.69 8.65 63211843.000.0726.60
T12176.28 22.09 54.91 14.84 0.95 111.33 231.03 211.16 36.45 8.92 63812702.430.1021.07
T13177.31 21.98 55.25 15.78 0.92 112.81 235.55 243.01 21.08 8.54 63112632.250.0819.56
T14175.30 21.94 54.63 15.74 0.94 111.47 232.40 199.94 44.73 8.71 63312952.390.0923.08
T15182.24 25.84 57.93 20.63 0.89 117.64 253.89 236.20 23.05 8.53 60512382.280.0821.06
T16165.91 23.63 53.92 15.46 0.93 107.83 219.44 202.14 38.42 8.58 62212482.290.0819.56
T17161.41 24.30 52.93 15.70 0.96 106.02 207.19 218.37 31.92 8.88 59812022.960.0621.07
T18164.69 24.72 52.25 14.91 0.98 110.07 212.14 180.91 44.73 8.92 61412392.350.0722.58
T19173.08 26.20 54.74 14.94 1.00 115.03 221.58 213.16 35.07 8.92 61412342.130.0821.98
T20158.99 25.15 52.47 16.31 0.96 104.52 200.53 197.53 42.76 8.88 60812312.990.0829.15
T21158.90 25.01 52.71 17.17 0.96 105.58 204.54 222.58 33.30 8.68 61512222.720.0719.50
T22158.85 25.55 52.51 17.33 0.97 105.76 197.77 228.59 30.54 8.80 60412182.030.0628.63
T23157.78 25.29 51.93 17.21 0.94 105.33 201.53 235.60 25.61 8.94 62112601.220.0618.06
T24159.78 25.75 52.40 16.37 0.98 106.93 203.79 247.62 21.08 8.78 63012612.090.0716.55
T25158.06 25.67 52.21 16.07 0.95 104.10 200.59 269.86 14.78 8.63 62112332.100.0717.31
T26158.74 25.19 51.85 16.44 0.95 104.90 204.04 219.37 35.07 8.92 61112462.980.0726.86
T27161.59 25.47 52.45 17.60 0.96 106.65 206.21 235.60 29.55 9.11 61812432.770.0827.37
Min157.7819.0151.8514.260.88104.10197.77100.1714.788.2459810231.220.0615.80
Max200.4226.2057.9220.631.11120.85287.44269.8653.409.1471514453.000.1229.15
Mean175.9322.7954.7616.160.95112.03231.52211.0131.968.7863412642.410.0822.19
SV(%)8.3411.333.787.364.374.9710.9217.2430.032.504.626.7216.916.7416.32
Table 3. Content characteristic statistics of oxygen and hydrogen isotope.
ParametersUnitTuo RiverBian River
MinMaxMeanMinMaxMean
δD−45.72−30.94−37.72−33.94−29.19−31.59
δ18O−5.55−2.40−3.78−3.76−2.32−3.20
d-excess−12.18−1.36−7.52−11.56−0.93−5.97
Table 4. Fuzzy comprehensive evaluation results of the water quality in the Bian River.
SampleWater Quality Level
B1 0.0000 0.1222 0.2124 0.3001 0.3652
B2 0.0000 0.3793 0.0267 0.3535 0.2404
B3 0.0000 0.1240 0.2156 0.3195 0.3409
B4 0.0000 0.2299 0.2141 0.3397 0.2163
B5 0.0000 0.1908 0.2108 0.0908 0.5076
B6 0.0000 0.1333 0.0760 0.3618 0.4289
B7 0.0000 0.1340 0.0721 0.3003 0.4936
B8 0.0000 0.1390 0.0781 0.1860 0.5968
B9 0.0000 0.1394 0.0875 0.5111 0.2620
B10 0.0027 0.1382 0.1008 0.2793 0.4789
B11 0.0040 0.1369 0.0970 0.2490 0.5130
B12 0.0071 0.1339 0.0923 0.3180 0.4487
B13 0.0086 0.1324 0.1561 0.4622 0.2408
B14 0.0112 0.1325 0.1169 0.5367 0.2054
B15 0.0075 0.1335 0.1172 0.5876 0.1542
B16 0.0186 0.1223 0.1543 0.2196 0.4851
B17 0.0271 0.1140 0.2505 0.1676 0.4409
B18 0.0063 0.1347 0.1192 0.4635 0.2764
B19 0.0091 0.1319 0.1185 0.1949 0.5456
B20 0.0084 0.1326 0.1216 0.4505 0.2869
Table 5. Fuzzy comprehensive evaluation results of the water quality in the Tuo River.
SampleWater Quality Level
T1 0.1054 0.2562 0.2196 0.2801 0.1387
T2 0.1067 0.2550 0.2097 0.2290 0.1997
T3 0.1106 0.2510 0.3394 0.1764 0.1226
T4 0.1125 0.2491 0.2879 0.2279 0.1226
T5 0.1220 0.2396 0.2912 0.2138 0.1333
T6 0.1144 0.2472 0.2695 0.2170 0.1519
T7 0.1095 0.2521 0.3391 0.1767 0.1226
T8 0.1305 0.2319 0.3827 0.1323 0.1226
T9 0.1356 0.3413 0.2751 0.1254 0.1226
T10 0.1242 0.2374 0.2912 0.2246 0.1226
T11 0.1349 0.2675 0.2839 0.1743 0.1394
T12 0.1398 0.2657 0.2994 0.1724 0.1226
T13 0.1345 0.2699 0.3513 0.1218 0.1226
T14 0.1393 0.2630 0.2745 0.2005 0.1226
T15 0.1170 0.2446 0.3918 0.1240 0.1226
T16 0.1525 0.2845 0.3509 0.0895 0.1226
T17 0.1590 0.3017 0.3696 0.0471 0.1226
T18 0.1444 0.3049 0.3050 0.1231 0.1226
T19 0.1265 0.3010 0.3175 0.1324 0.1226
T20 0.1645 0.3117 0.1851 0.1110 0.2277
T210.1606 0.3062 0.2338 0.0716 0.2277
T220.1600 0.3226 0.2396 0.0646 0.2133
T230.1615 0.3531 0.3162 0.1155 0.0537
T240.1557 0.3854 0.2646 0.0716 0.1226
T250.1660 0.3666 0.2803 0.0645 0.1226
T260.1631 0.3049 0.2218 0.1469 0.1632
T270.1567 0.3063 0.2018 0.1561 0.1791

