Article

Experimental Evaluation for the Impacts of Conservation Agriculture with Drip Irrigation on Crop Coefficient and Soil Properties in the Sub-Humid Ethiopian Highlands

1
Faculty of Civil and Water Resource Engineering, Bahir Dar Institute of Technology, Bahir Dar University 26, Ethiopia
2
Department of Water Technology, Bahir Dar Poly Technique Collage, Bahir Dar 26, Ethiopia
3
Department of Civil, Architectural and Environmental Engineering, North Carolina A & T State University, Greensboro, NC 27411, USA
4
Sustainable Intensification Innovation Lab (SIIL), Kansas State University, Manhattan, KS 66506, USA
*
Author to whom correspondence should be addressed.
Water 2020, 12(4), 947; https://doi.org/10.3390/w12040947
Submission received: 12 February 2020 / Revised: 18 March 2020 / Accepted: 19 March 2020 / Published: 26 March 2020
(This article belongs to the Section Water Use and Scarcity)

Abstract

:
A field experiment consists of conservation agriculture (CA) and conventional tillage (CT) practices were set up in two areas, Robit and Dangishta, in sub-humid Ethiopian highlands. Irrigation water use, soil moisture, and agronomic data were monitored, and laboratory testing was conducted for soil samples, which were collected from 0 to 40 cm depth before planting and after harvest during the study period of 2015–2017. Calculation of crop coefficient (Kc) revealed a significant decrease in Kc values under CA as compared to CT. The result depicted that CA with a drip irrigation system significantly (α = 0.05) reduced Kc values of crops as compared to CT. Specifically, 20% reductions were observed for onion, cabbage, and garlic under CA whereas 10% reductions were observed for pepper throughout the crop base period. Consequently, irrigation water measurement showed that about 18% to 28% of a significant irrigation water savings were observed for the range of vegetables under CA as compared to CT. On the other hand, the results of soil measurement showed the CA practice significantly (α = 0.05) increased soil moisture (4%, 7%, 8%, and 10% increment for onion, cabbage, garlic, pepper) than CT practice even if irrigation input was small in CA practice. In addition, CA was found to improve the soil physico-chemical properties with significant improvement on organic matter (10%), field capacity (4%), and total nitrogen (10%) in the Dangishta experimental site. CA with drip irrigation is evidenced to be an efficient water-saving technology while improving soil properties to support sustainable intensification in the region.

1. Introduction

Agriculture is the core driver for the economy of Ethiopia and long-term food security which supports about 85% of the population’s livelihoods, and 43% of gross domestic product (GDP) [1,2,3]. However, the current farming practices in the nation are mainly traditional tillage using animals and hand tools; which resulted in the loss of soil fertility and crop productivity [4,5,6,7,8]. On the other hand, water is a valuable resource in food production, nevertheless, the competition for water is high among various sectors due to several reasons including population growth, climate change, and poor management of rainwater. Crop production from smallholder farmers constitutes more than 90% of the food supply in the nation [9]. This production system is highly dependent on rainfall and the system uses the traditional approach [10]. The combined effects of traditional farming practices [11], with poor rainwater management [12] caused severe soil degradation [13,14]. Consequently, food production and water uses were incompetent in the region [15,16,17]. Therefore, it is critical to advance the farming system and restore degraded soil to efficiently utilize available water resources for sustainable food production [7,18,19].
Rainfall variability and irregularity are major concerns in a rainfed production system and smallholder farmers are vulnerable in crop production. Crop failures are common in the region due to rainfall variability and frequent drought [20,21]. Consequently, food insecurity often turns into famine with the least adverse climatic incident, predominantly, affecting the livelihoods of the rural poor [22,23]. Expanding small-scale irrigated agriculture could play a significant role in sustaining the livelihood of smallholder farmers. However, only 4% to 5% of the cultivated land in Ethiopia is under irrigation [1] with poor water use efficiency, about 40% [24]. Water availability is limited in the long dry season in the nation which necessitates the use of efficient water application technology in expanding irrigated agriculture.
Ineffective on-farm irrigation management practices lead to poor water distribution, nonuniform crop growth, excessive leaching of soil nutrients all of which decrease water and crop productivity [25,26,27]. Conservation agriculture (CA) is found to be an effective strategy in the region to improve soil quality, water management, and crop yield [5,6,28]. Conservation agriculture (CA) is defined as minimal soil disturbance (no-till, NT) and year-round permanent soil cover (mulch) combined with rotation in time [29,30]. CA continued being promoted over conventional agriculture (CT) practice to enhance soil health and sustain long-term crop productivity and reduce soil erosion [29,30]. The overall goal of CA is to make better use of agricultural resources with limited external inputs by enhancing the ecosystem through integrated management of soil and water [31,32,33]. On the other hand, drip irrigation is considered as the most efficient water application technology and has the potential to improve water productivity [34,35]. Combining CA with drip irrigation is found to be an ideal approach to maximize crop production while conserving the environment [6,28,36,37]. Crop coefficient can be used as an indicator to measure the effectiveness of a particular soil and water management practices [38]. Therefore, the main aim of this study was to evaluate the effects of CA with drip irrigation on crop coefficients in the sub-humid Ethiopian highlands. The specific objectives were (1) to evaluate irrigation water savings for irrigated crops under CA and CT water management systems and (2) to evaluate the impacts of CA and CT management practices on crop coefficients both under drip irrigation. The results of this study would assist stakeholders to determine the amount of irrigation needed precisely under CA and CT practices in the regions.

2. Materials and Methods
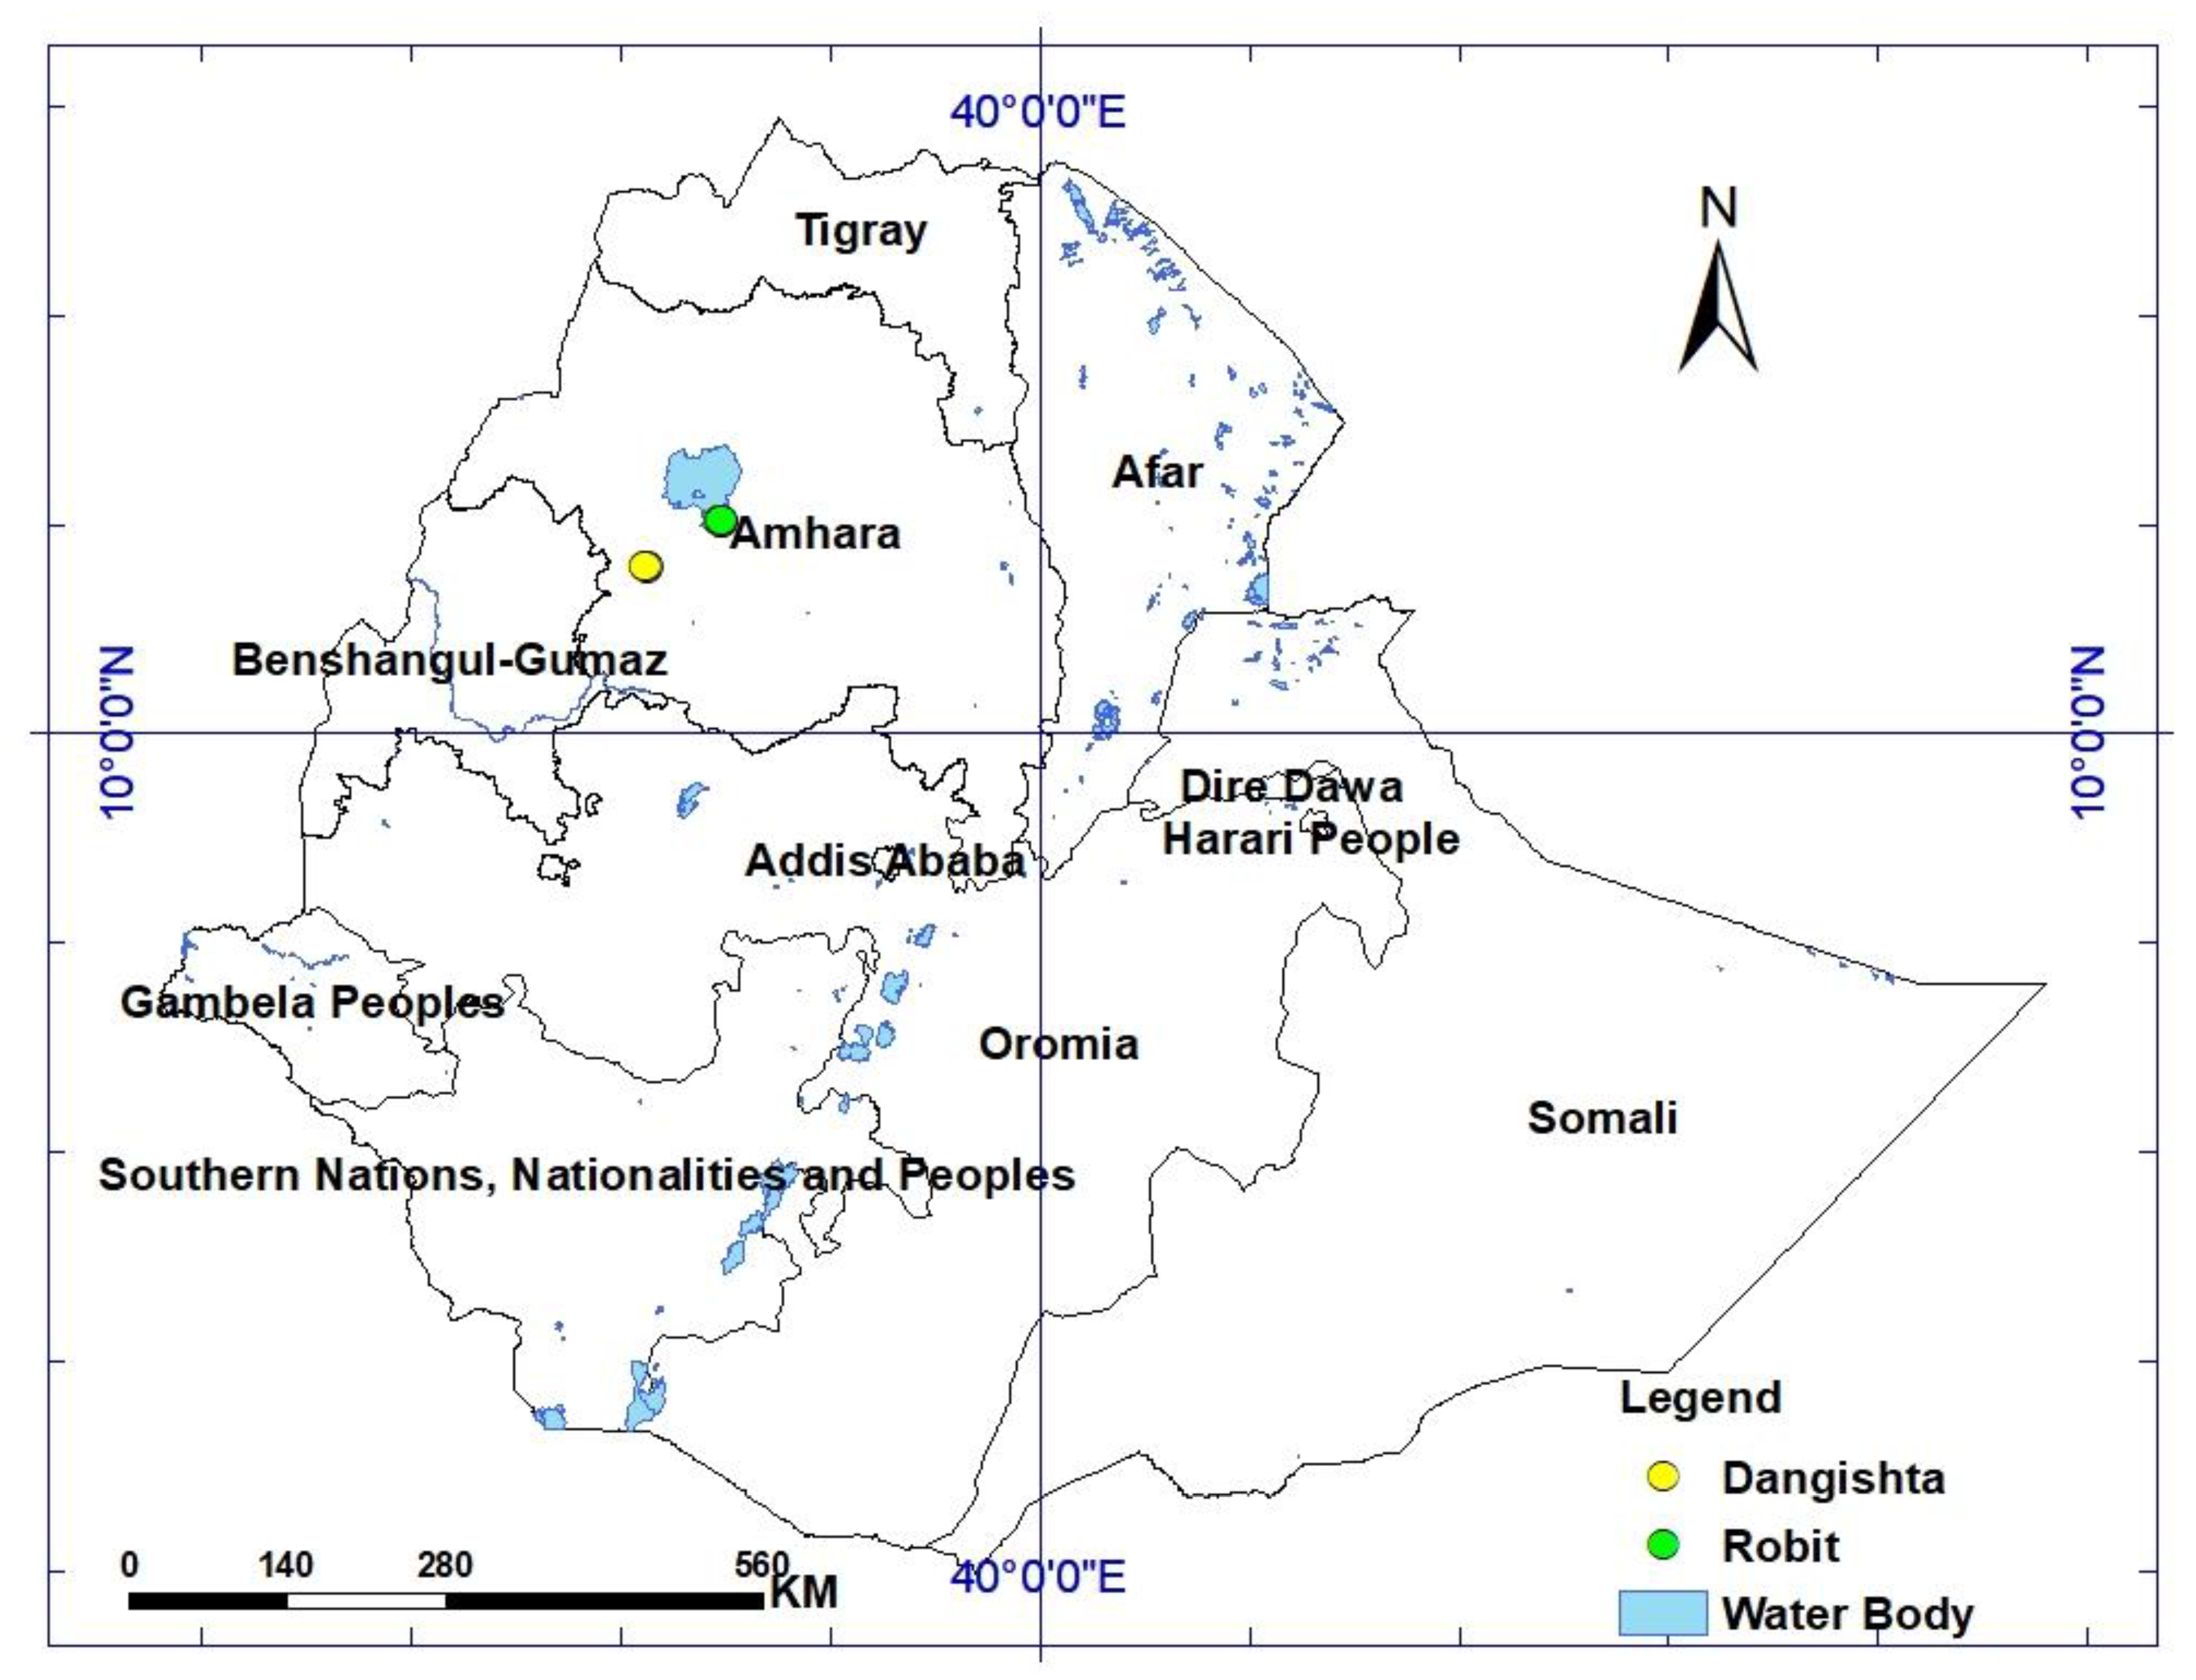
2.1. Study Area

This study was conducted in the sub-humid Ethiopian highlands at two experimental watersheds; Dangishta and Robit (Figure 1). The Dangishta watershed is in Dangila Woreda, about 80 km northwest of Bahir Dar whereas Robit watershed is about 12 km northeast of Bahir Dar. The climate of Dangila Woreda is sub-humid with an average annual rainfall of 1600 mm and an average annual potential evaporation of 1250 mm [39]. The maximum and minimum temperature during the study period (from 2015 to 2017) in Dangishta was 33 and 25 °C, respectively. The average annual rainfall in Robit is about 1400 mm with a minimum temperature of 23 °C and a maximum temperature of 31 °C. Dangila and Robit are one of the Agricultural Growth Program (AGP) and feed the future Woredas in Amhara Regional State. Rainfed agriculture and livestock production are the main livelihood systems in these regions where the dominant crops produced in the regions are maize, millet, barley, and teff [40]. On the other hand, tomato, onion, potato, cabbage, pepper, and garlic are the dominant irrigated vegetables produced in the regions. Shallow groundwater is the source of irrigation in Dangila [39] in which manual pulley systems are widely practiced to lift water from the wells. Groundwater level ranges from 4 to 15 m below the ground surface in the dry season [41]. In the rainy season, the groundwater level for shallow wells was observed close to the ground surface (as low as 1 m in some shallow wells). Similarly, in Robit, irrigation is widely practiced using shallow groundwater with water table depth that varies from 8 to 20 m [42] using a manual pulley system as a means of water lifting technology.

2.2. Experimental Design and Field Setup Procedures

2.2.1. Experimental Design

The effects of CA and CT practice on crop coefficients was evaluated using a paired ‘t’ experimental design (Figure 2) which is mathematically powerful and allows good control of individual differences [18,43]. De Winter [43] evaluated the paired t-test for an extremely small sample size and concluded that the applicability of the t-test as low as two replicates. Detailed description of the experimental design in Dangishta and Robit study sites can be found in Assefa [5] and Assefa et al. [18]. The experimental setup was established in 2015 on a 100 m2 plot size where half of this size was assigned to CA and another half to the CT practice through randomization. A total of 14 farmers participated in this experiment; seven farmers in Robit and seven farmers in Dangishita for each cropping season. Farmers have grown various vegetables in different seasons on the experimental plots; cabbage, pepper, garlic, and onion and their detailed cropping pattern are shown in Table 1. The gravity based drip irrigation system was applied for all plots. Shallow groundwater was the source of irrigated agriculture for the experimental sites. Farmers use a rope and pulley system to extract water from the shallow well to an elevated water tank. Irrigation water was then applied to the plots from the water storage tanks through gravity using the drip system.

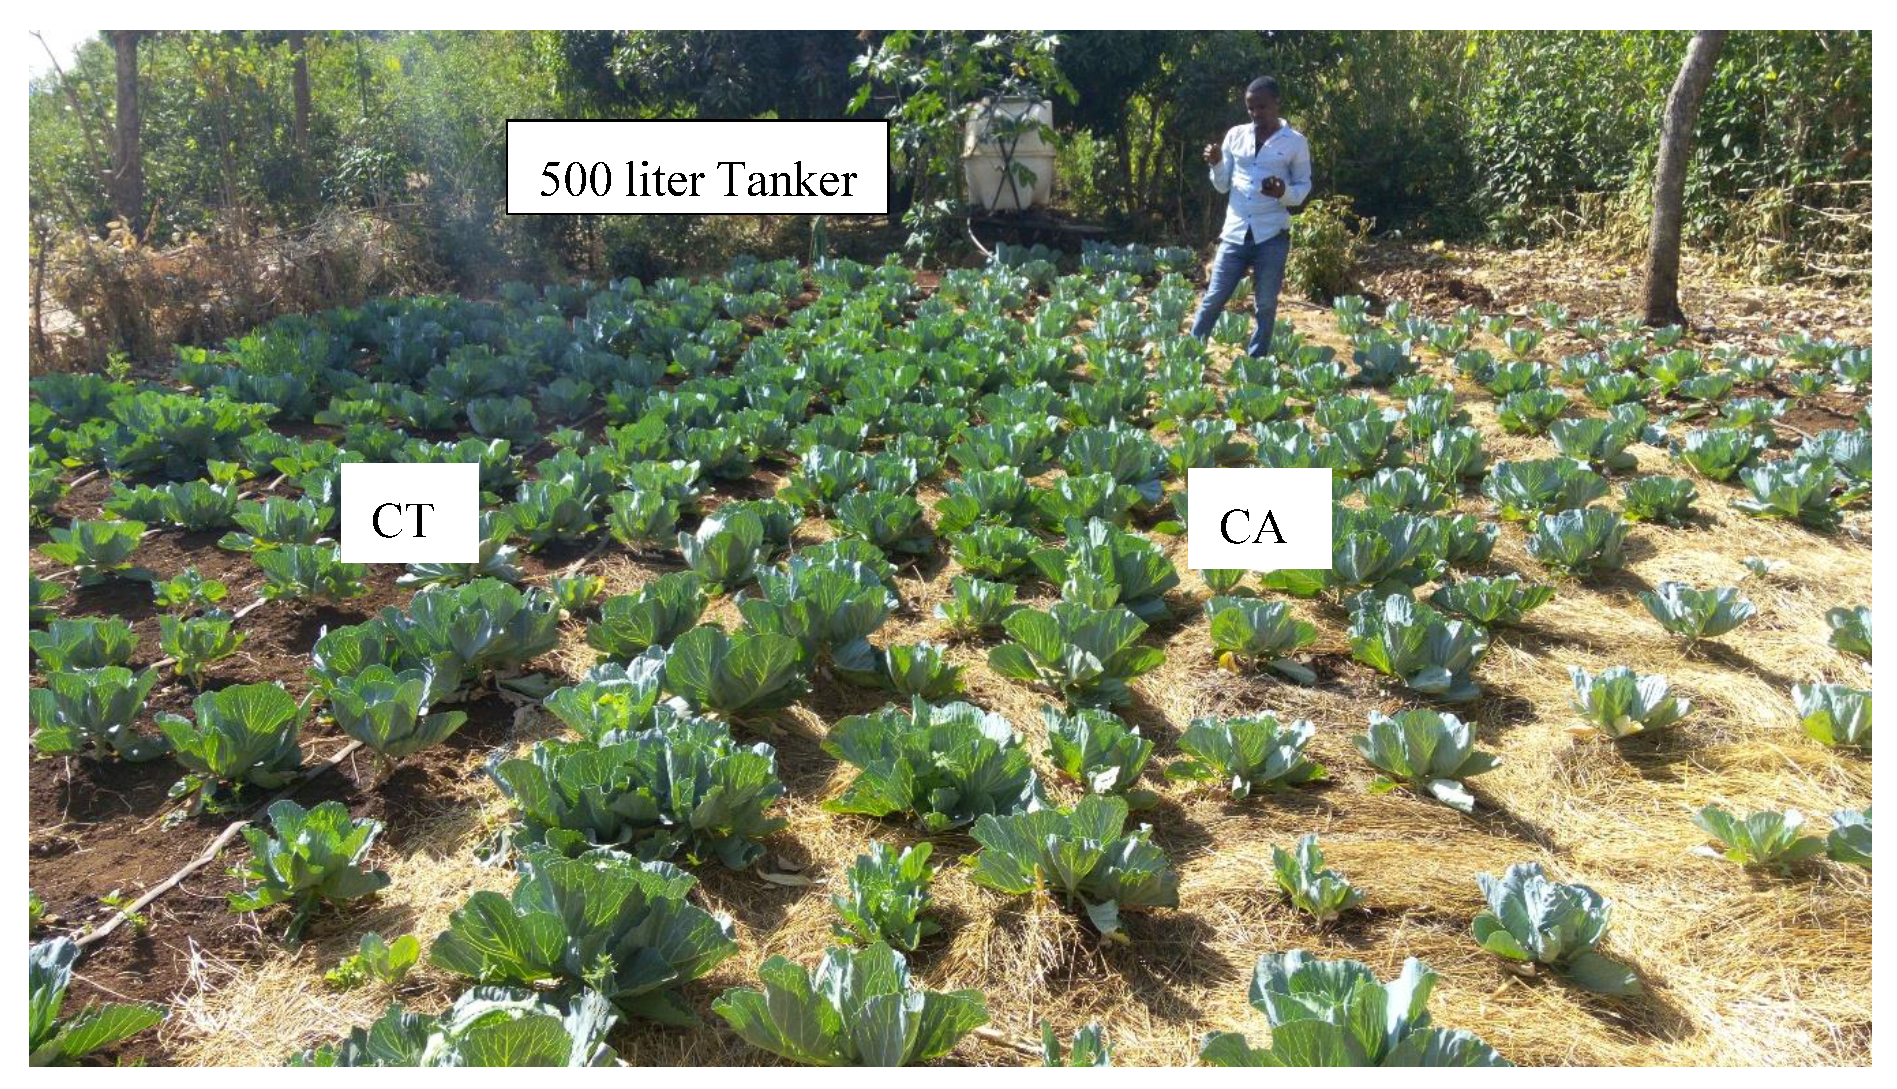
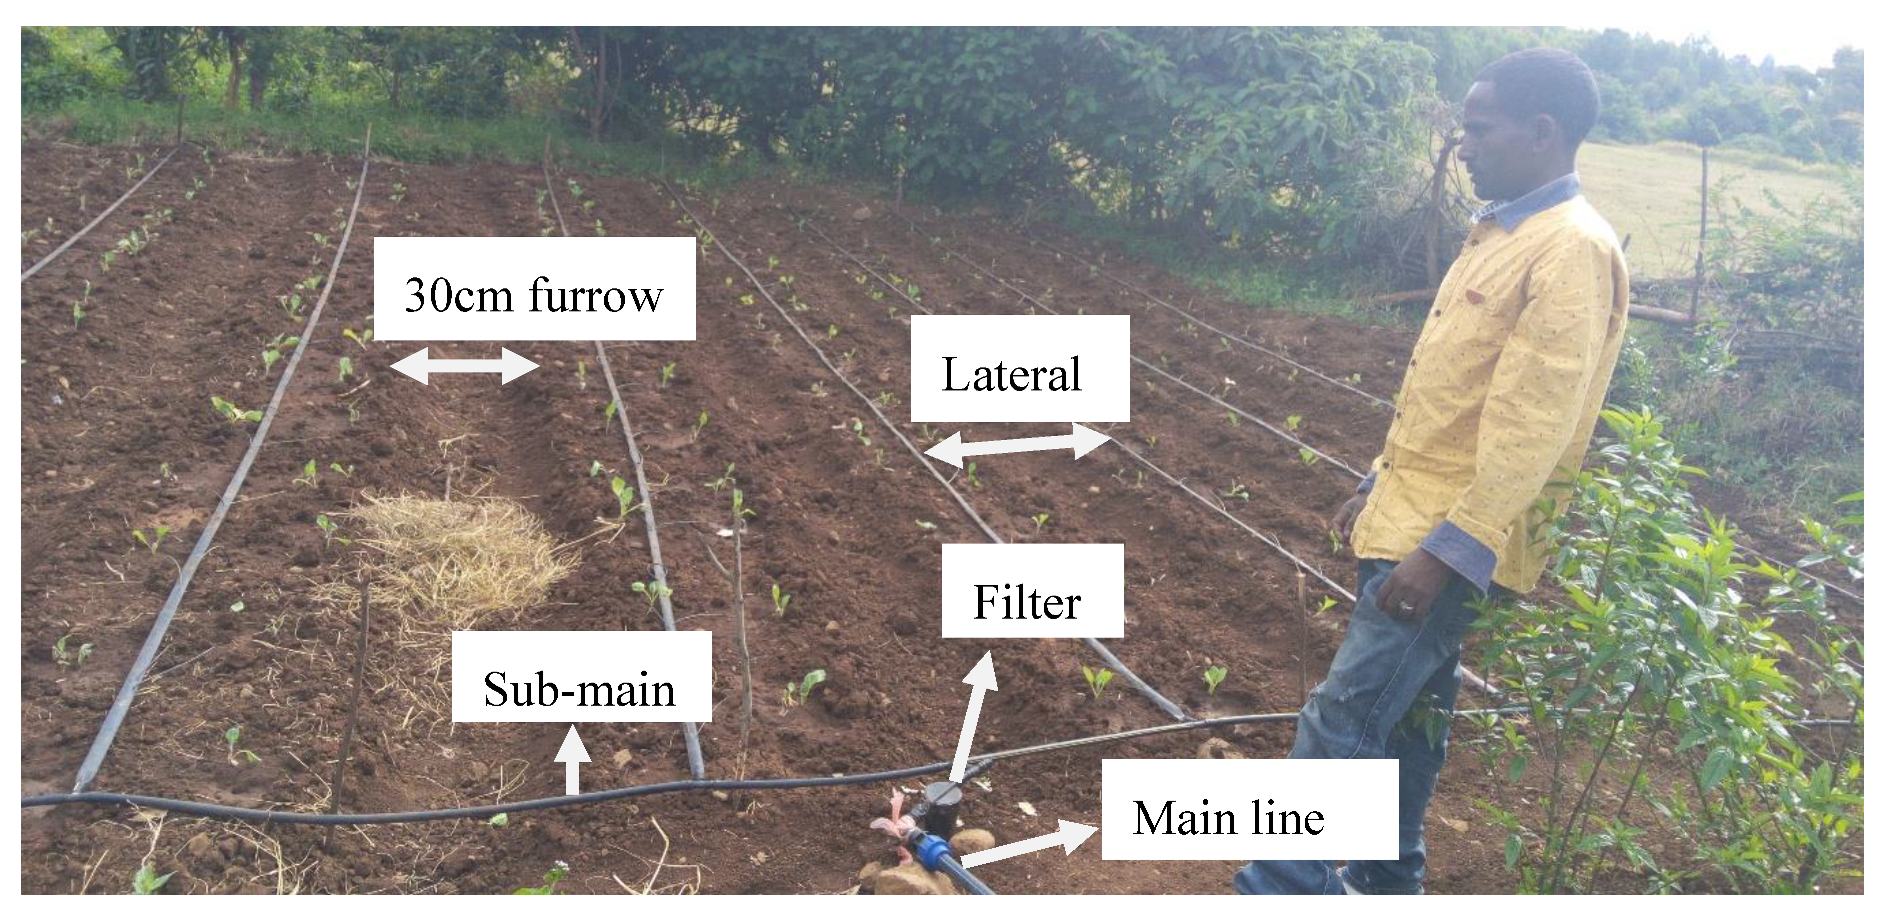
2.2.2. Field Setup Procedures

A serious discussion was conducted with the local government and community to select potential farmers for this experiment. Additionally, a focus group discussion was followed with farmers for their willingness to participate in this experiment and the availability of shallow groundwater wells close to their gardens was checked. A 10 by 10 m plot close to the household or at a walking distance was identified and prepared for CA and CT managements. A total of 10 beds were prepared on a 100 m2 plot 30 cm furrows in between. The size of the beds was kept uniform for the entire plots in the experimental sites. CA and CT beds were decided randomly by tossing a coin. The drip irrigation system (main line, submain line, drip kit, sediment filter, and laterals) was installed on the beds attached to water storage tanks, 500 L size for each plot. The water storage tanks were installed about 1.5 m high from the ground for gravity flow with optimum pressures in the drip pipes (Figure 2 and Figure 3). All CA beds were then mulched using thick dried grass even if Robit farmers were a bit difficult in adopting the intervention. The farmers discuss and select the type of vegetable to be planted for each season. The same variety of seeds were given to the farmers, either direct seeded or the seedlings were grown on a nursery bed. For the case of seedlings, the vegetables were transplanted on the prepared beds. A data protocol was prepared and monitored by a local trained expert.

2.3. Data Monitoring and Collection

2.3.1. Soil Physio-Chemical Property

Soil samples were taken from both CA and CT plots before and after harvest during the 3rd cycle of vegetable production (Table 1) from Dangishta and Robit experimental sites. A total of 16 soil samples from Robit and 20 soil samples from Dangishta were taken from the surface 10 cm depth; half of the samples were taken before transplanting hereafter called the beginning of the experiment and the remainder immediately after harvest hereafter called the end of the experiment. In addition, during the 2nd cycle vegetable production in Dangishta a total of 20 samples before transplanting from two depths; 0–20 and 20–40 cm depth were collected from five plots. In both Dangishita and Robit sites, a representative soil mass of about 1 to 1.5 kg was sampled. The samples were analyzed in the Amhara Design Supervision Works Enterprise (ADSWE) soil laboratory. The samples were analyzed for field capacity, permanent wilting point, soil texture, available organic matter, pH, electrical conductivity, total nitrogen, available P, available K, iron status, and cat-ion exchange capacity. Laboratory analysis of these parameters is quite cumbersome and the details of each analysis and approaches done by ADSWE can be referred from Tesema et al. [39].

2.3.2. Meteorological Data

Climatic data (rainfall, maximum and minimum temperature, wind speed, sunshine hour, relative humidity) were collected from the nearby meteorological station, Dangila for Dangishta sites, and Bahir Dar for Robit sites. Evapotranspiration (ETo) was estimated using the Penman-Monteith method [44] as it incorporates more climatic variables than other methods.
The effective rainfall (Pe) was computed based on Bos et al. [45] as shown in Equation (1).
( P e = 0.8 × P 25 P > 75 m m / m o n t h P e = 0.6 × P 10 P < 75 m m / m o n t h )

2.3.3. Agronomic and Water Use Data

The length of the growing period and water requirement of crops depends on various conditions including climate, variety of crops, date of planting (growing season), water, and other agricultural inputs. Wellens et al. [46], for instance, stated that the growing period of cabbage may range from 120 to 140 days with a root depth ranging from 40 to 50 cm and its water requirement ranges from 350 to 500 mm with variable irrigation frequency, 3 to 12 days [47]. The cabbage was transplanted in Robit at a recommended spacing of 20 cm between plants and 30 cm between rows having a maximum rooting depth of 50 cm. The length of the four growing stages of cabbage was 21 days for initial, 25 days for development, 65 days for mid, and 15 days for the end stage. Crop water use increases during the growing period with a peak towards the mid-stage of the season. The rotation of crops at each study site is shown in Table 1. Garlic was directly seeded in Dangishita at a depth of 40 cm and with 20 cm spacing between rows and 30 cm spacing between plants. The length of the four growth stages of garlic were 20 days for initial, 30 days for development, 40 days for mid, and 30 days for the end stage. After garlic was harvested onion and pepper were irrigated in Dangishta with a similar spacing of garlic. Their length of growth stages for initial, development, mid, and late stages were 5-day, 25-day, 40-day, and 30-days for onion, respectively. On the other hand, 25, 35, 40, and 25 days were the growing stage of pepper for initial, development, mid, and late stages, respectively.
Irrigation water use for CA and CT was monitored separately during each irrigation period under the farmers’ practice. Participant farmers were trained on the water saving potential of conservation practice. Farmers observe soil moisture and use their intrinsic knowledge to determine if irrigation was needed. We observed that farmers used a different irrigation frequency by themselves; once in three days for CA and every day for CT management in most cases. For ease of measurement, a 500 L taker was installed at an elevated position and its outlet was attached to the drip hose for each plot. At the end of the drip, the hose flow control valve was fitted, and farmers control the flow manually during the irrigation of CA and CT plots. The number of water storage tanks used was counted separately for CA and CT plots to determine the volume of water used for irrigation. Soil moisture at the top 20 cm depth was monitored using TDR (total domain reflectometer) probes every two or three days for CA and CT. Readings were taken by trained agricultural extension agents by inserting a pair of 20 cm length TDR roads into the soil from representative points on the plot (CA and CT) and averaged for each recording. TDR probes were calibrated using gravimetric soil moisture determination techniques to increase data quality. Soil samples were collected from TDR measurement locations. The samples were weighted and put to oven at 105 °C for 24 hr. The dry soil mass was measured after oven drying. The gravimetric moisture content was determined as a ratio of weights of water to weight of dry soil. The gravimetric water content was then converted to volumetric water content and plotted against the TDR readings for calibration.

2.4. Crop Coefficients

The precision of irrigation water use for various crops depends on the proper estimation of reference evapotranspiration (ETo) and crop coefficient (Kc) [48]. Crop coefficient (Kc) was computed by dividing actual evapotranspiration by reference evapotranspiration on a daily basis for each growing season for both CA and CT management practices, as shown in Equation (2) [18]. Average Kc for the growing period was used to evaluate the effect of CA practice over CT. A paired t-test was used to compare the two means, for CA and CT practices, at a 5% significance level and determine if changes in the mean values were significant.
K C = E T c / E T o
where Kc, ETc, and ETo are crop coefficients, crop evapotranspiration, and reference crop evapotranspiration, respectively. Crop evapotranspiration was computed from soil water balance Equation (3) and reference crop evapotranspiration was computed by the Penman-Monteith method using meteorological data using Equation (4). The soil water balance equation [39] can be expressed as shown in Equation (3).
E T c = P + I + U R D + Q i Q o
where P, I, U, R, D, ETc, Qi and Qo are effective rainfall (mm), irrigation (mm), upward capillary rise into the root zone (mm), runoff (mm), deep percolation beyond the root zone (mm), crop evapotranspiration (mm), amount of water in the root zone at time ti (mm), and amount of water in the root zone at time ti+1 (mm), respectively. Qi and Qo are determined by multiplying volumetric soil moisture content measured by TDR at time ti and ti+1 by plant root depth, respectively. The difference between the amount of water in the root zone (Qi) and the amount of water in the root zone after a given time interval (Qo) is the change in storage. Upward capillary rise into the root zone (mm), runoff (mm), and deep percolation beyond the root zone (mm) were assumed null in the drip irrigation managed system. This experiment was focused on dry season production with drip irrigation. Several studies including Bozkurt et al. [49], Sezen et al. [50], and Shedeed et al. [51] showed that deep percolation, runoff, and capillary rise under drip irrigation is very small and can be neglected. Assefa et al. [19] in the same experimental site showed that the deep percolation and runoff in the dry irrigation period under drip irrigation was minimal. The upward capillary rise depends on depth of groundwater table and the rooting depths. The root depth is dynamic throughout the crop growth stages and varies depending on crop types. However, from the field observation during harvest, the maximum rooting depths for onion, garlic, cabbage, and pepper are less than 60 cm. On the other hand, the depth of groundwater level varies spatially and temporarily; in the dry season 4–15 m in Dangishta and 8–20 m in Robit was observed [52]. Gao et al. [53] explained that the upward capillary rise is negligible when the groundwater depth is more than 2.5 m.
Reference crop evapotranspiration (ETo) can be computed using the Penman-Monteith equation as shown in Equation (4). The Penman-Monteith method uses several climatic parameters and gives relatively more accurate results [44].
E T o = { 0.408 Δ ( R n G ) + γ ( 900 / T + 273 ) U 2 ( e s e a ) } / { Δ + γ ( 1 + 0.34 U 2 ) }
where ETo, Rn, G, T, U2, es, ea, Δ, γ are reference evapotranspiration (mm day−1), net radiation at the crop surface (MJm−2day−1), soil heat flux density (MJm−2day−1), air temperature at 2 m height (°C), wind speed at 2 m height (ms−1), saturation vapor pressure (KPa), actual vapor pressure (KPa), slope vapor pressure curve (KPa°C−1), and psychometric constant (KPa°C−1), respectively.

3. Results and Discussion

3.1. Effects of CA with Drip Irrigation on Soil Physico-Chemical Properties

The effects of CA with drip irrigation on soil physico-chemical properties were analyzed from soil samples at the experimental sites and tested at 10% significant level. Table 2 shows soil sample analysis collected from Robit and Dangishta sites for the impact of CA on soil physico-chemical properties.
The soil physico-chemical properties, (Table 2) vary across the management conditions. Optimum plant growth is attained for a range of pH 5.5 to 7 [54]. The result obtained from the soil test showed that the average value of pH for both experimental sites (Robit and Dangishta) is within the suitability range for plant growth. The change between treatments in Dangishta was significant whereas the reverse is true for Robit at a 10% significance level (Table A1).
Tillage practice affects organic matter availability in the soil in which its amount depends on various site-specific conditions; rainfall, air temperature, management practice, type of plant, soil temperature, and drainage condition [55] and has its consequence on soil structural stability, soil erosion, and nutrient availability in the soil [56]. As shown from Table 2, at the beginning of the experiment (3rd cycle vegetable production, after two years of mulch application), CA has a greater mean difference in organic matter (4.8) than CT (4.3) which is significantly higher at 10% significant level in Dangishta (Table A1). This is because CA improves organic matter availability in the soil as a result of the biological decomposition of organic mulch covers.
The variation in the organic matter between CA and CT in the Robit experimental site at the beginning and end of the experiment was not significant (Table A1) even if CA has a higher average organic matter than CT (Table 2). This may be due to a decrease in organic matter supply caused by a decrease in mulch cover in CA. The macronutrients which are usable for plant growth (nitrogen, potassium, and phosphorous) have a higher mean value in the CA management than CT systems. Statistically (α = 0.1), at the beginning of the experiment in Dangishta, nitrogen showed a significant difference in CA than CT, but the reverse is true for phosphorus and potassium (Table A1). The result from Robit showed there was no significant difference in micronutrients (nitrogen, potassium, and phosphorous) between the two treatments at (α = 0.1) (Table A1).
The water holding capacity of the treated soil (CA) is higher than the untreated soil (CT) and as a result, the permanent wilting point for CA is less than CT. As shown in Table 2, the average field capacity of CA (36.8%) is larger than CT (35.5%) in Dangishta experimental site which is significant at (α = 0.1) (Table A1). At the end of the experiment in Robit site, the average field capacity of the soil is significantly higher in CA (34.5%) treatment than CT (24.6%) at a 10% significant level (Table A1). In general, the soil physio-chemical properties for the successive irrigation season were variable due to change in climate, management conditions, and type of crop to be planted.
The soil physico-chemical analysis result taken from a sample of soil at 20 and 40 cm depth showed that soil properties vary with soil depth. Figure 4 showed that the surface soil or top-soil (0–20 cm depth from the surface) contains more organic matter (4.98%) in CA treatment than CT (4.15%) which is significant (Table A2) at 5% significant level. The lower layer (20–40 cm depth from the surface) has an average organic matter content of 3.93% in CA and 3.42% in CT and is significant at a 10% significant level (Table A2). Electrical conductivity (EC), cation exchange capacity (CEC), soil pH, potassium (K), phosphorus (P), and total nitrogen (N) showed a variation in magnitude across depth in the two treatment conditions (CA and CT) but statistically there was no significant difference between CA and CT across soil depth at 10% level of significance (Table A2).

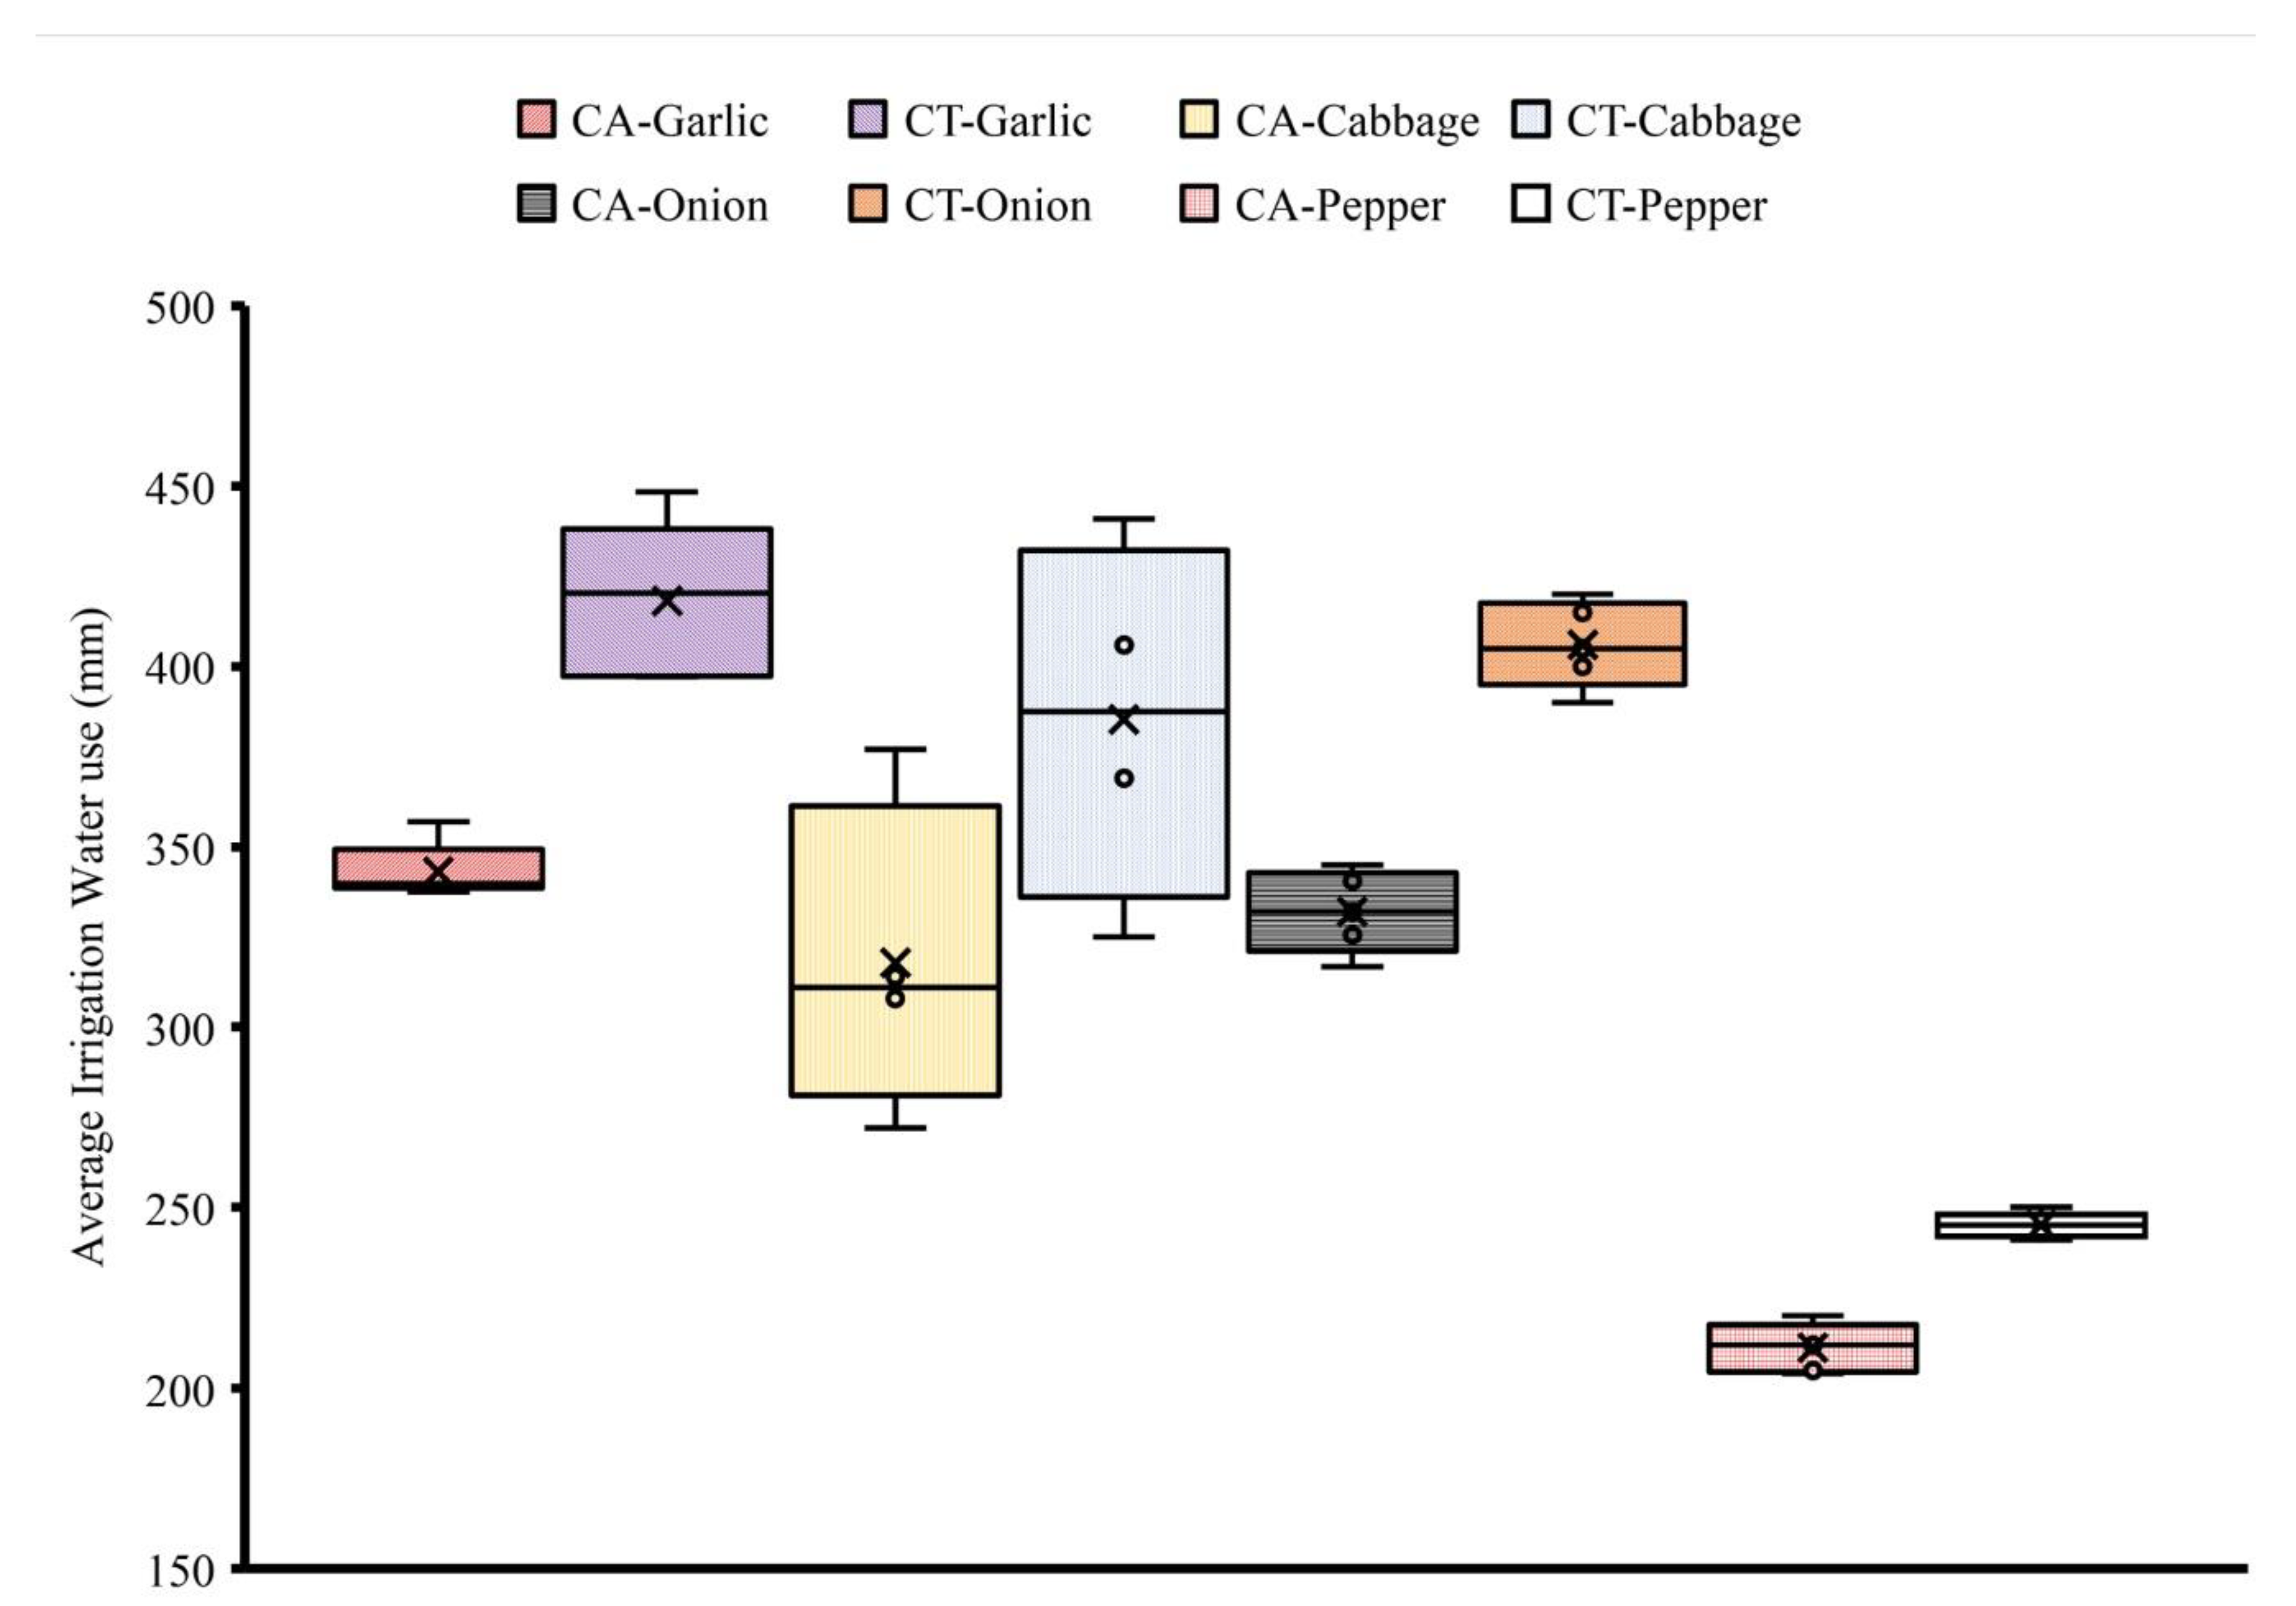
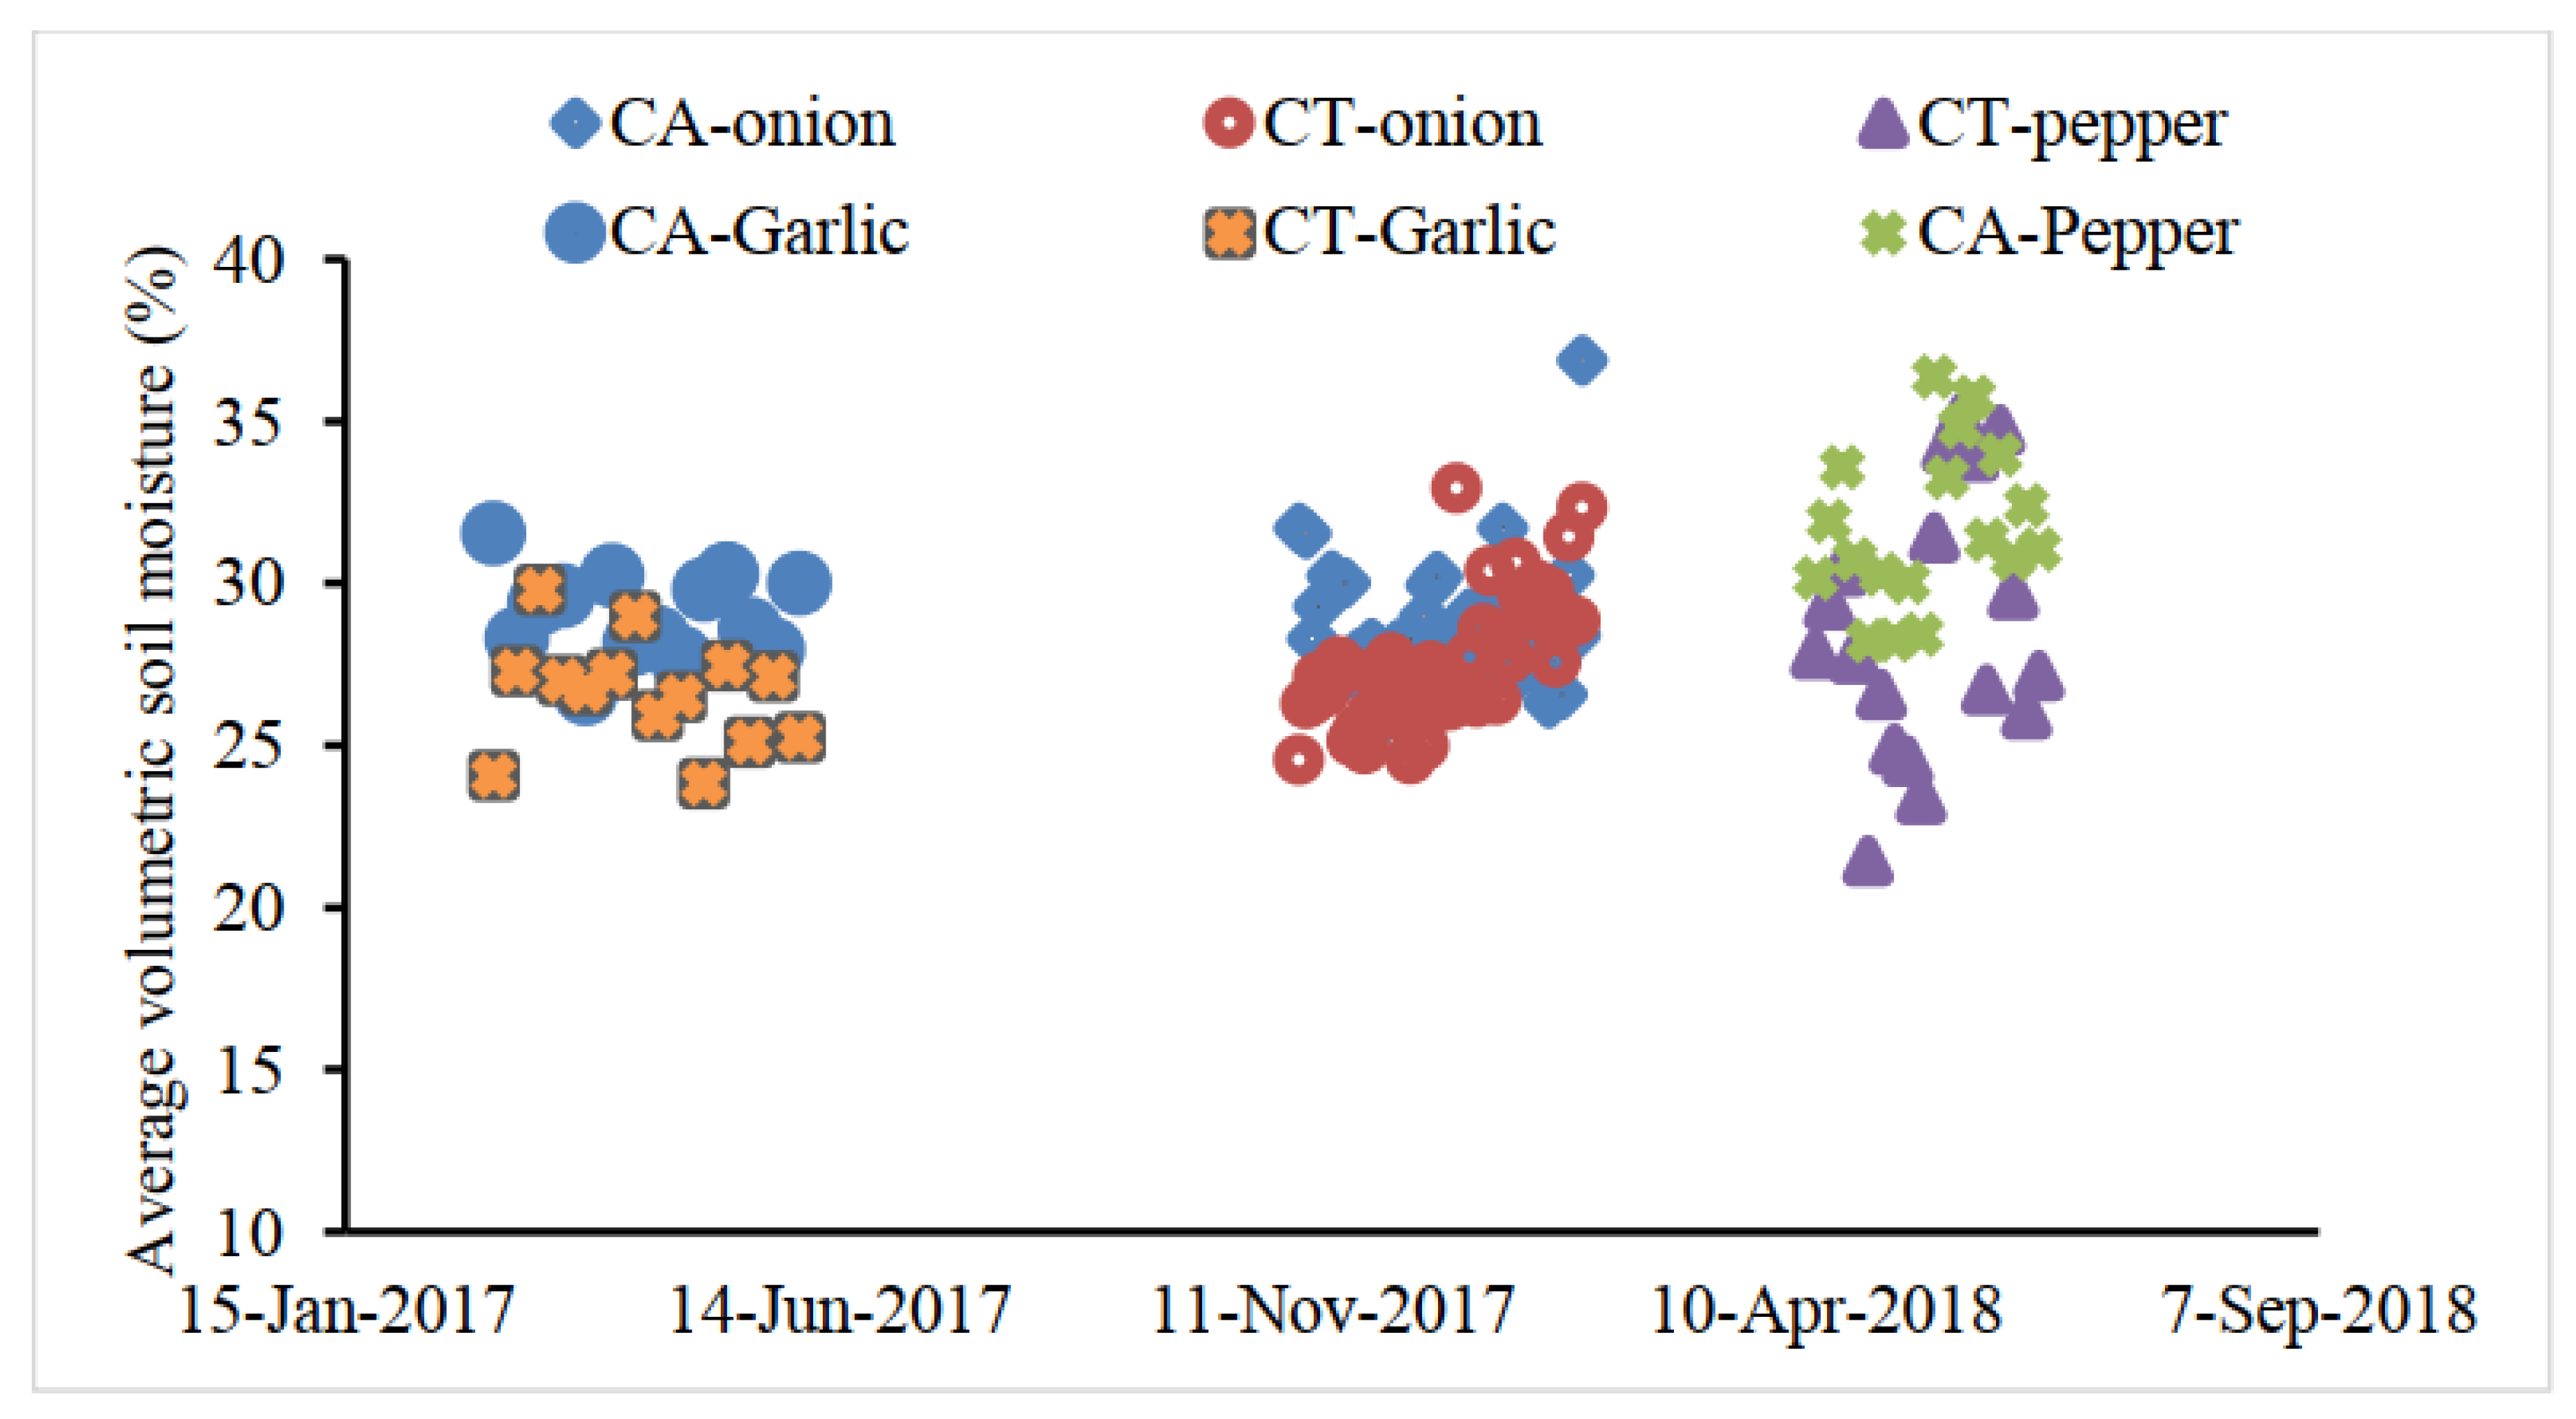
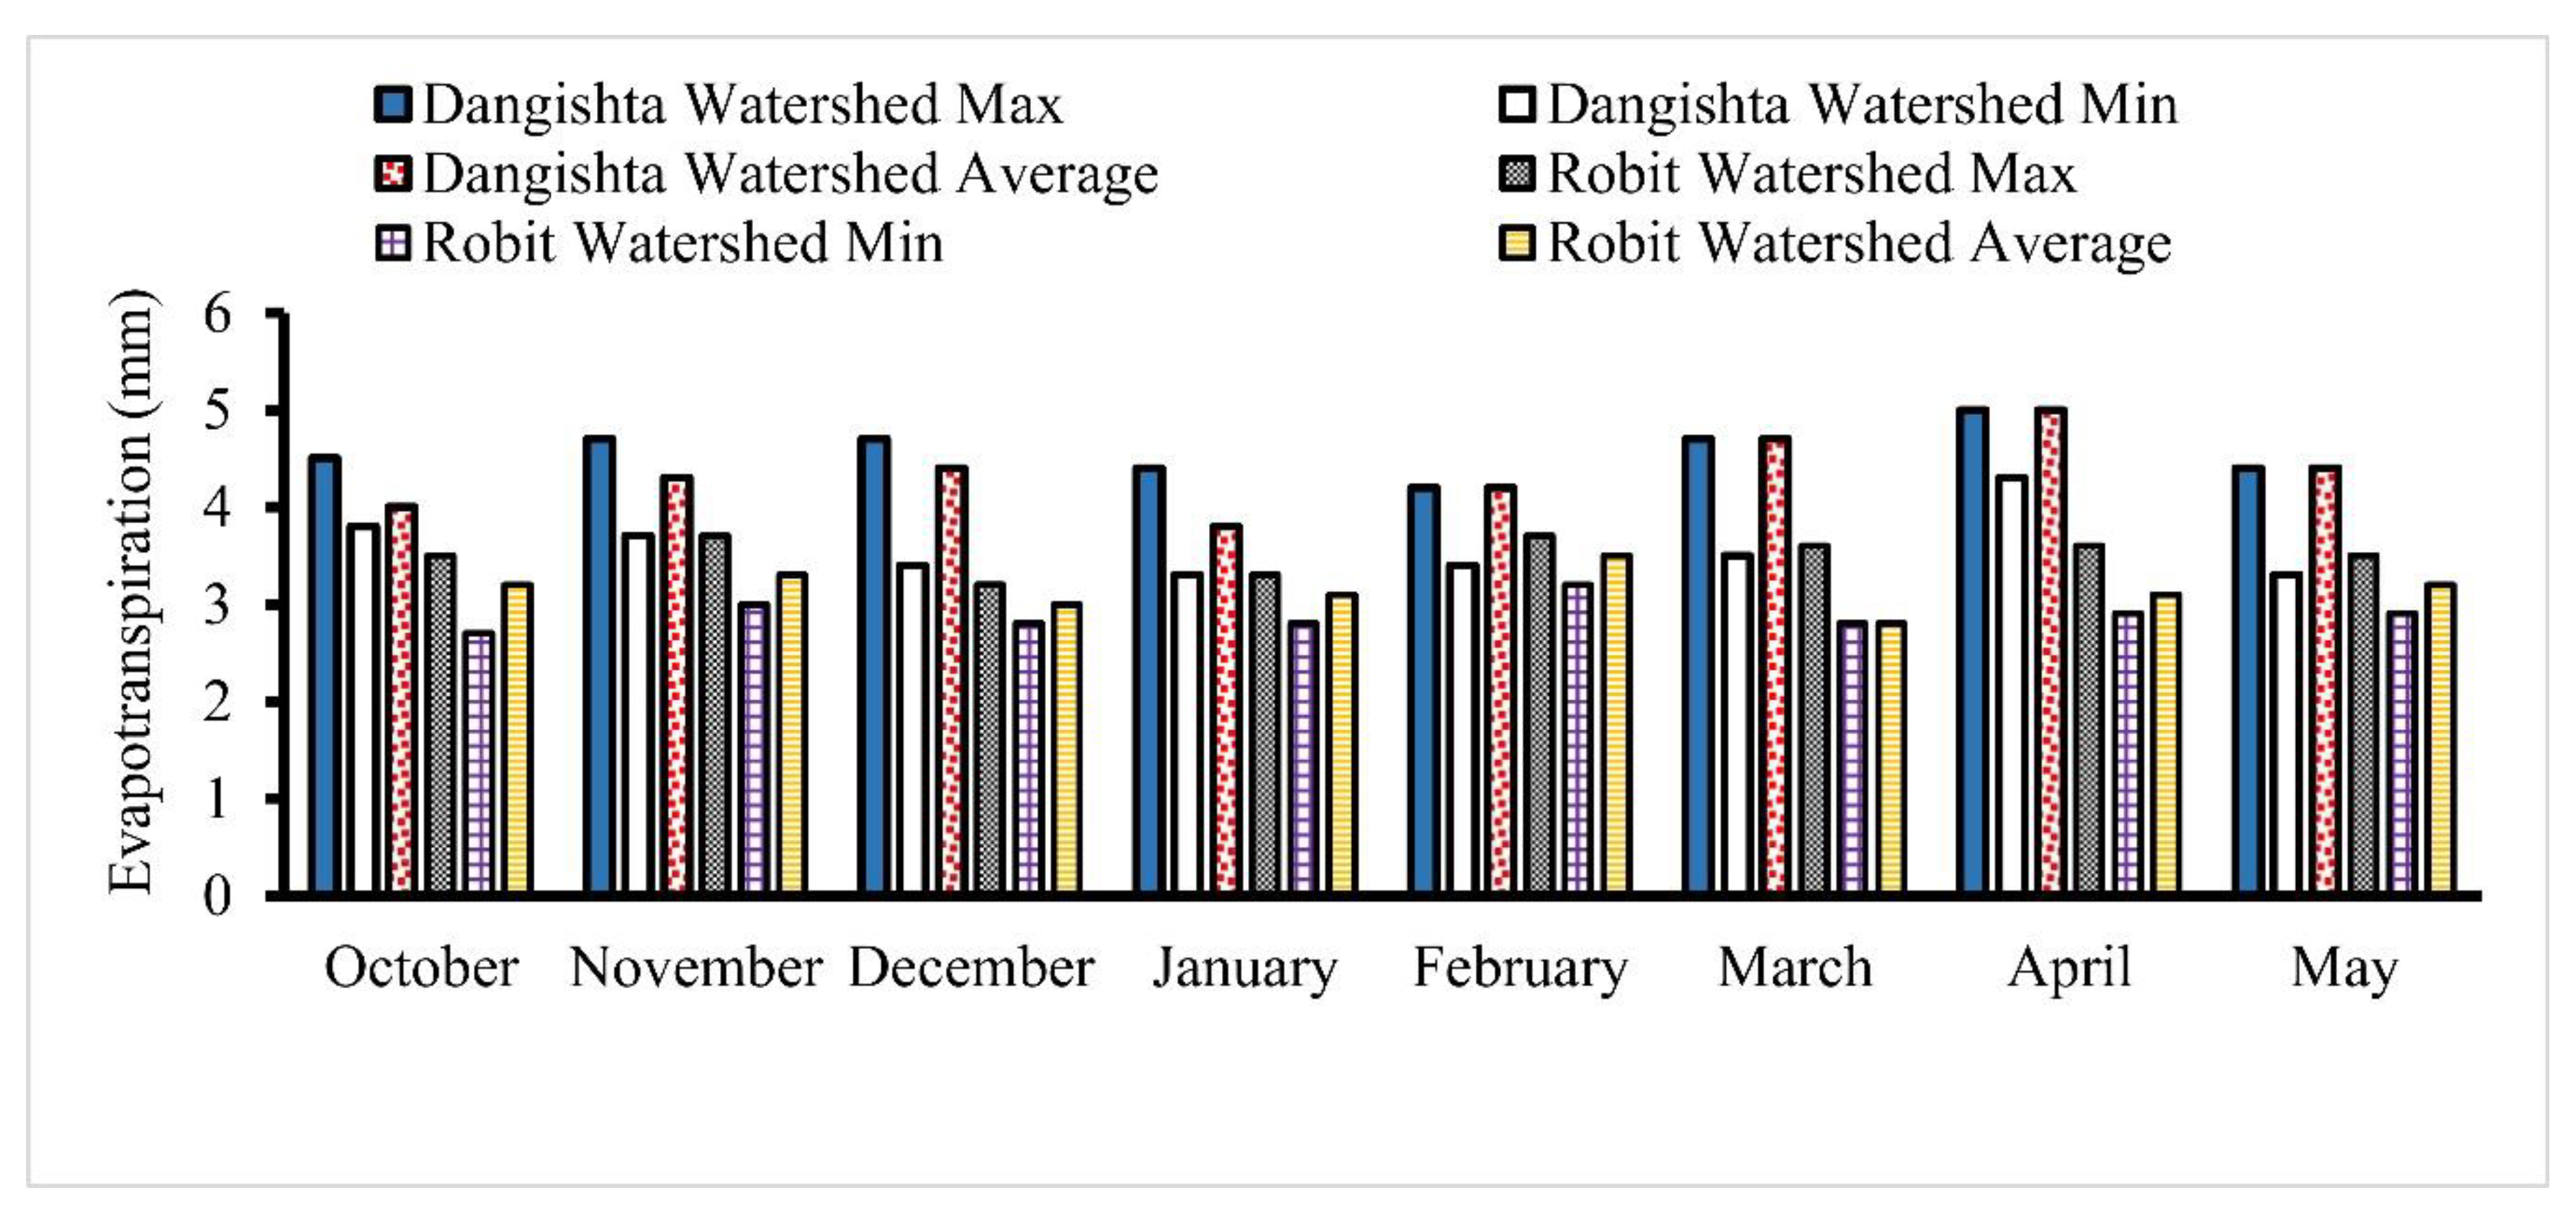
3.2. Amount of Water Used and Soil Moisture Content

Farmers applied a relatively small amount of irrigation water on CA as compared to CT. A one tailed paired t-test was done (Table A3) and the average irrigation water use of cabbage, onion, garlic, and pepper was significantly (α = 0.1) higher in CT than CA. The average irrigation water used in CA showed a significant decrease (18%) as compared to CT in the cabbage experiment. About 385 and 318 mm of average irrigation water was applied to the CT and CA systems (Figure 5) for cabbage production, respectively. Allen et al. [47] explained that the average water consumption of cabbage varies from 350 to 500 mm depending on differences in the climate and soil condition. The amount of water applied to cabbage in the CA plot (318 mm) was below the lower limit suggested by Allen et al. [47] indicating significant soil moisture improvement under CA practice. CA reduces soil evaporation and preserves soil moisture due to the mulch cover and improvement of soil quality and structure through the biological decomposition of the organic mulch. The amount of water applied to cabbage in CT plots was consistent with Allen et al. [47] findings. Similarly, Tiwari et al. [57] estimated the average seasonal water requirement of cabbage to be 400 mm on clay soil and sub-humid climate. The average irrigation water applied to garlic was 275 mm in CT and 199 mm in CA plots. A significant irrigation water use was observed for garlic (28%) in CA when compared with CT. Similarly, a significant irrigation water saving was observed for onion and pepper under the CA treatment. The result showed there was 18% and 14% irrigation water savings under CA over CT treatment for onion and pepper, respectively. The average irrigation water applied in the onion experiment (Figure 5) is consistent with Bossie et al. [58] and with Tebal [59] for pepper in the CT plots. A one-tailed paired t-test analysis is presented in the Appendix B (Table A3).
The result from the soil moisture measurement showed that the average volumetric soil moisture content in the treated soil (CA) was higher than the conventional tillage (CT) practice in most of the irrigation periods. This shows conservation agriculture is a means of saving irrigation water which is essential in water scares areas and the driest season of irrigation (Figure 6).

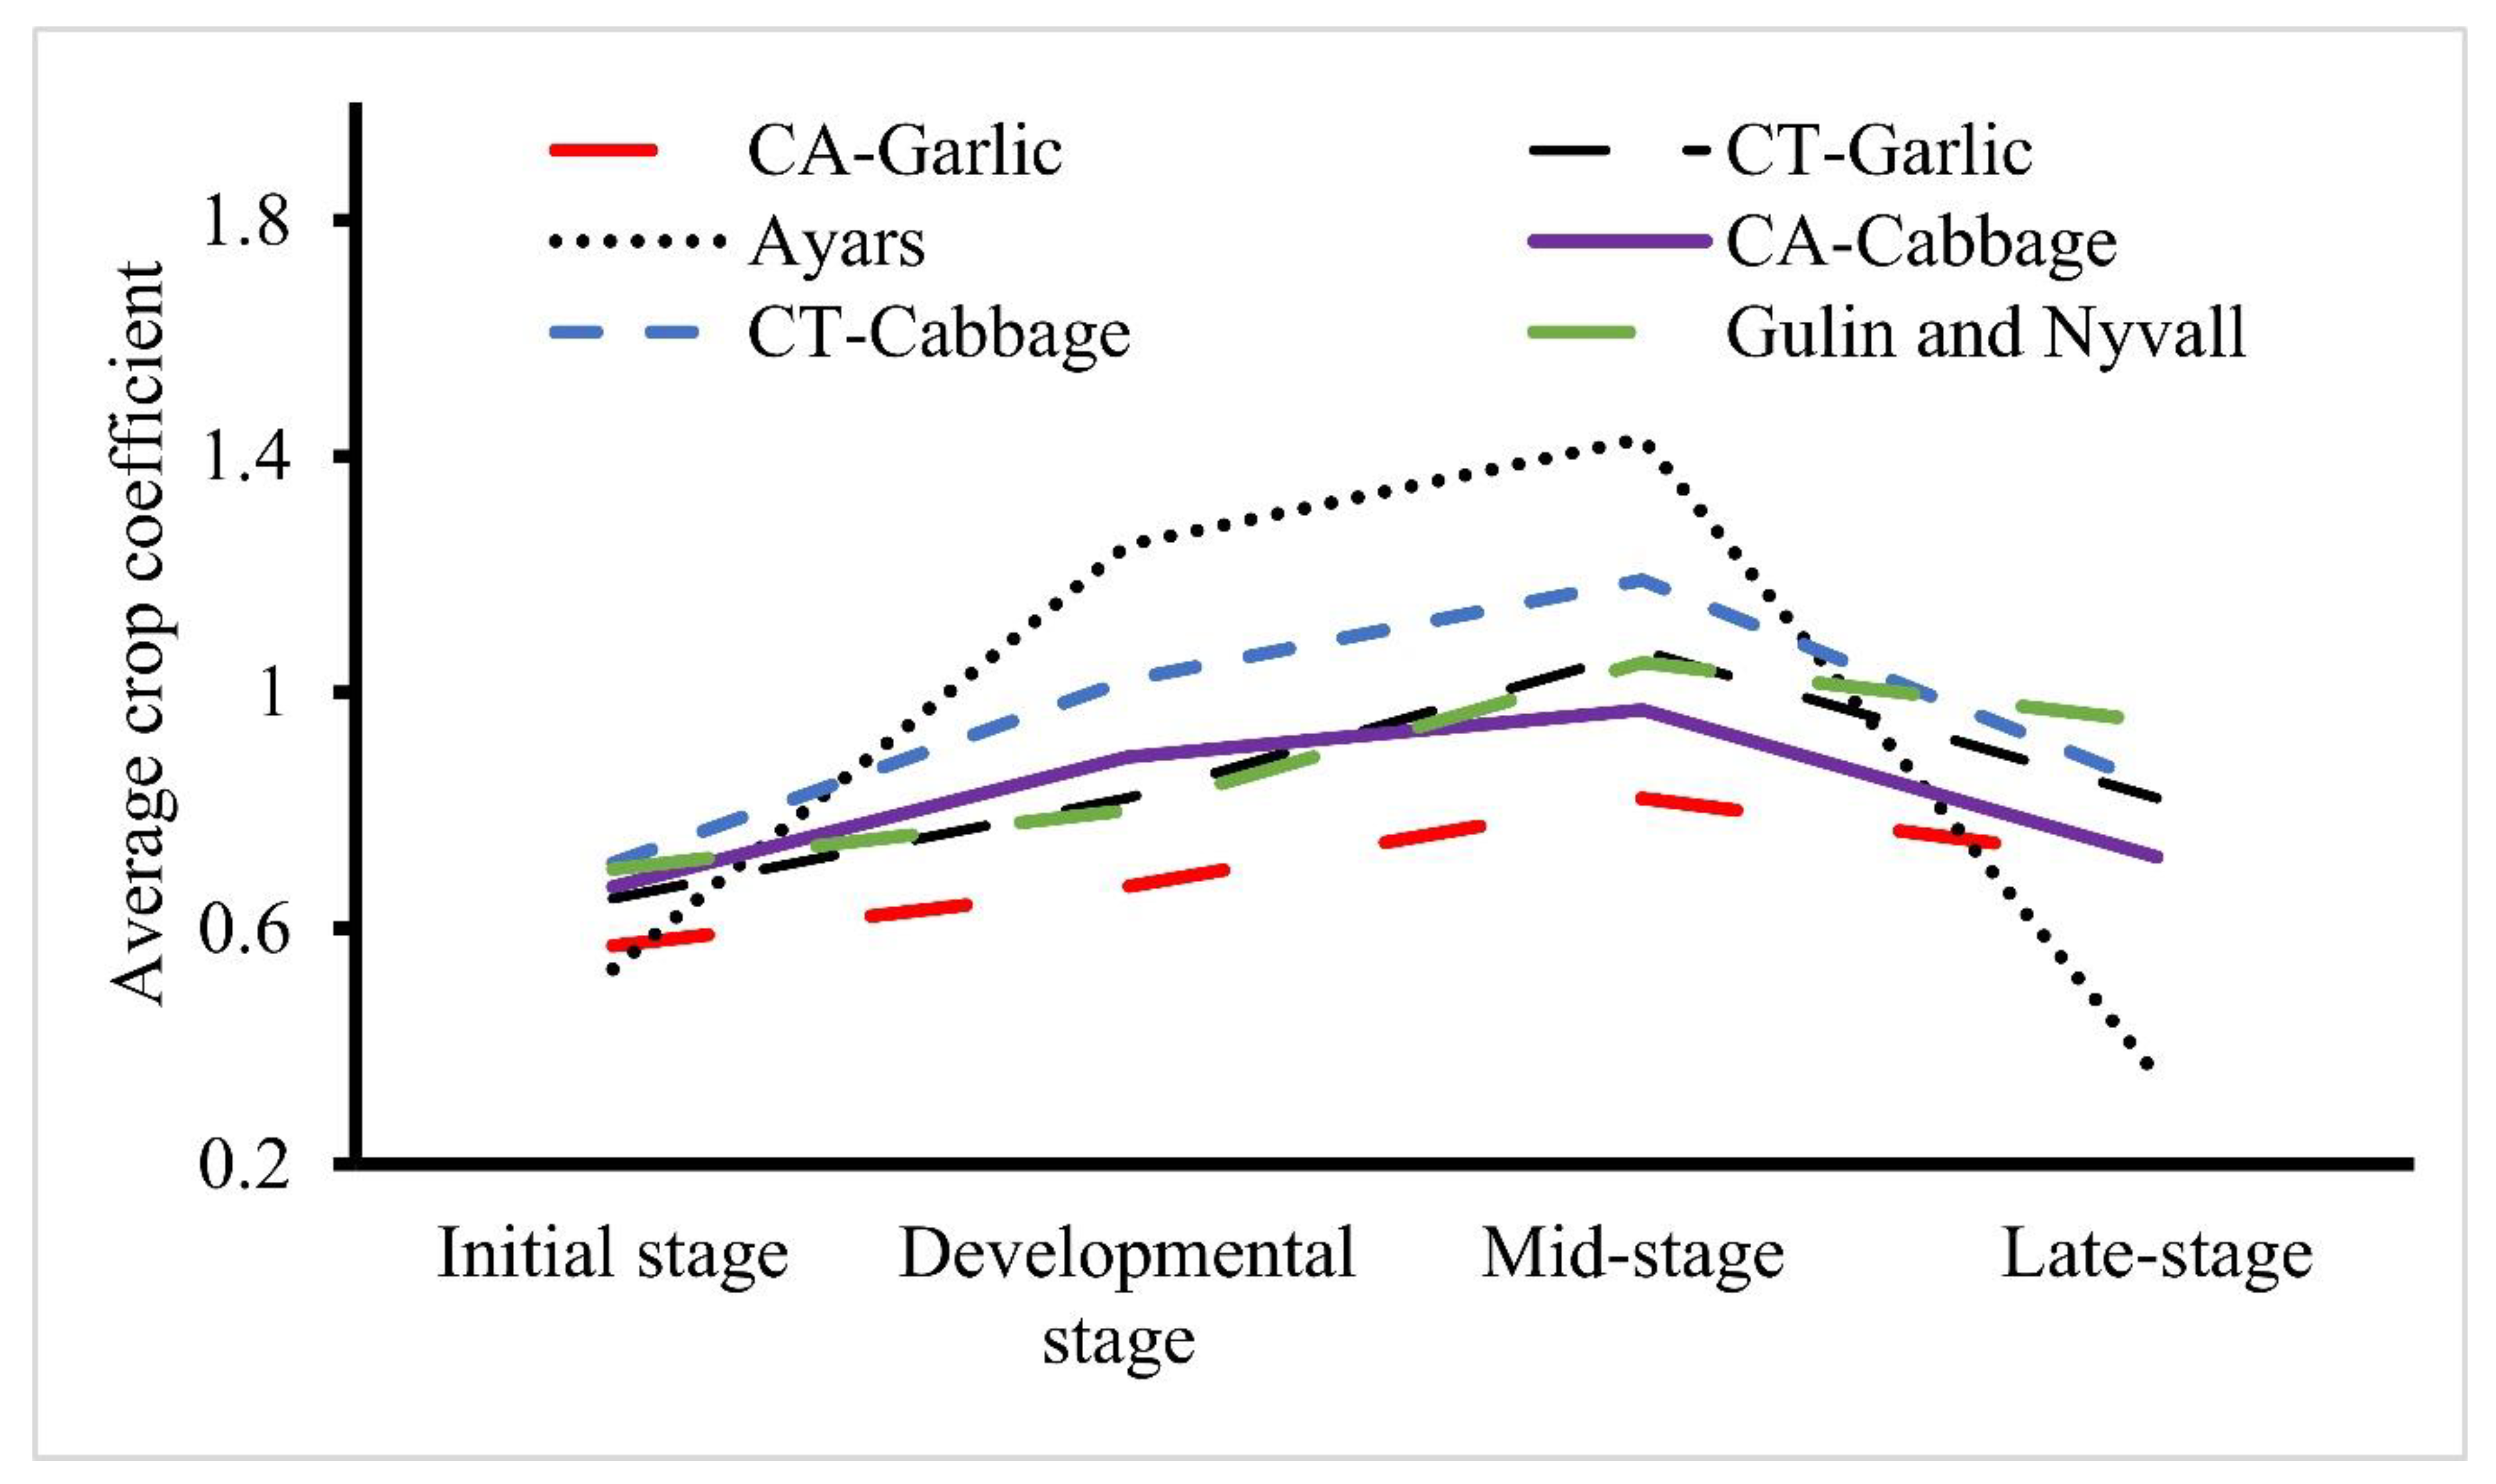
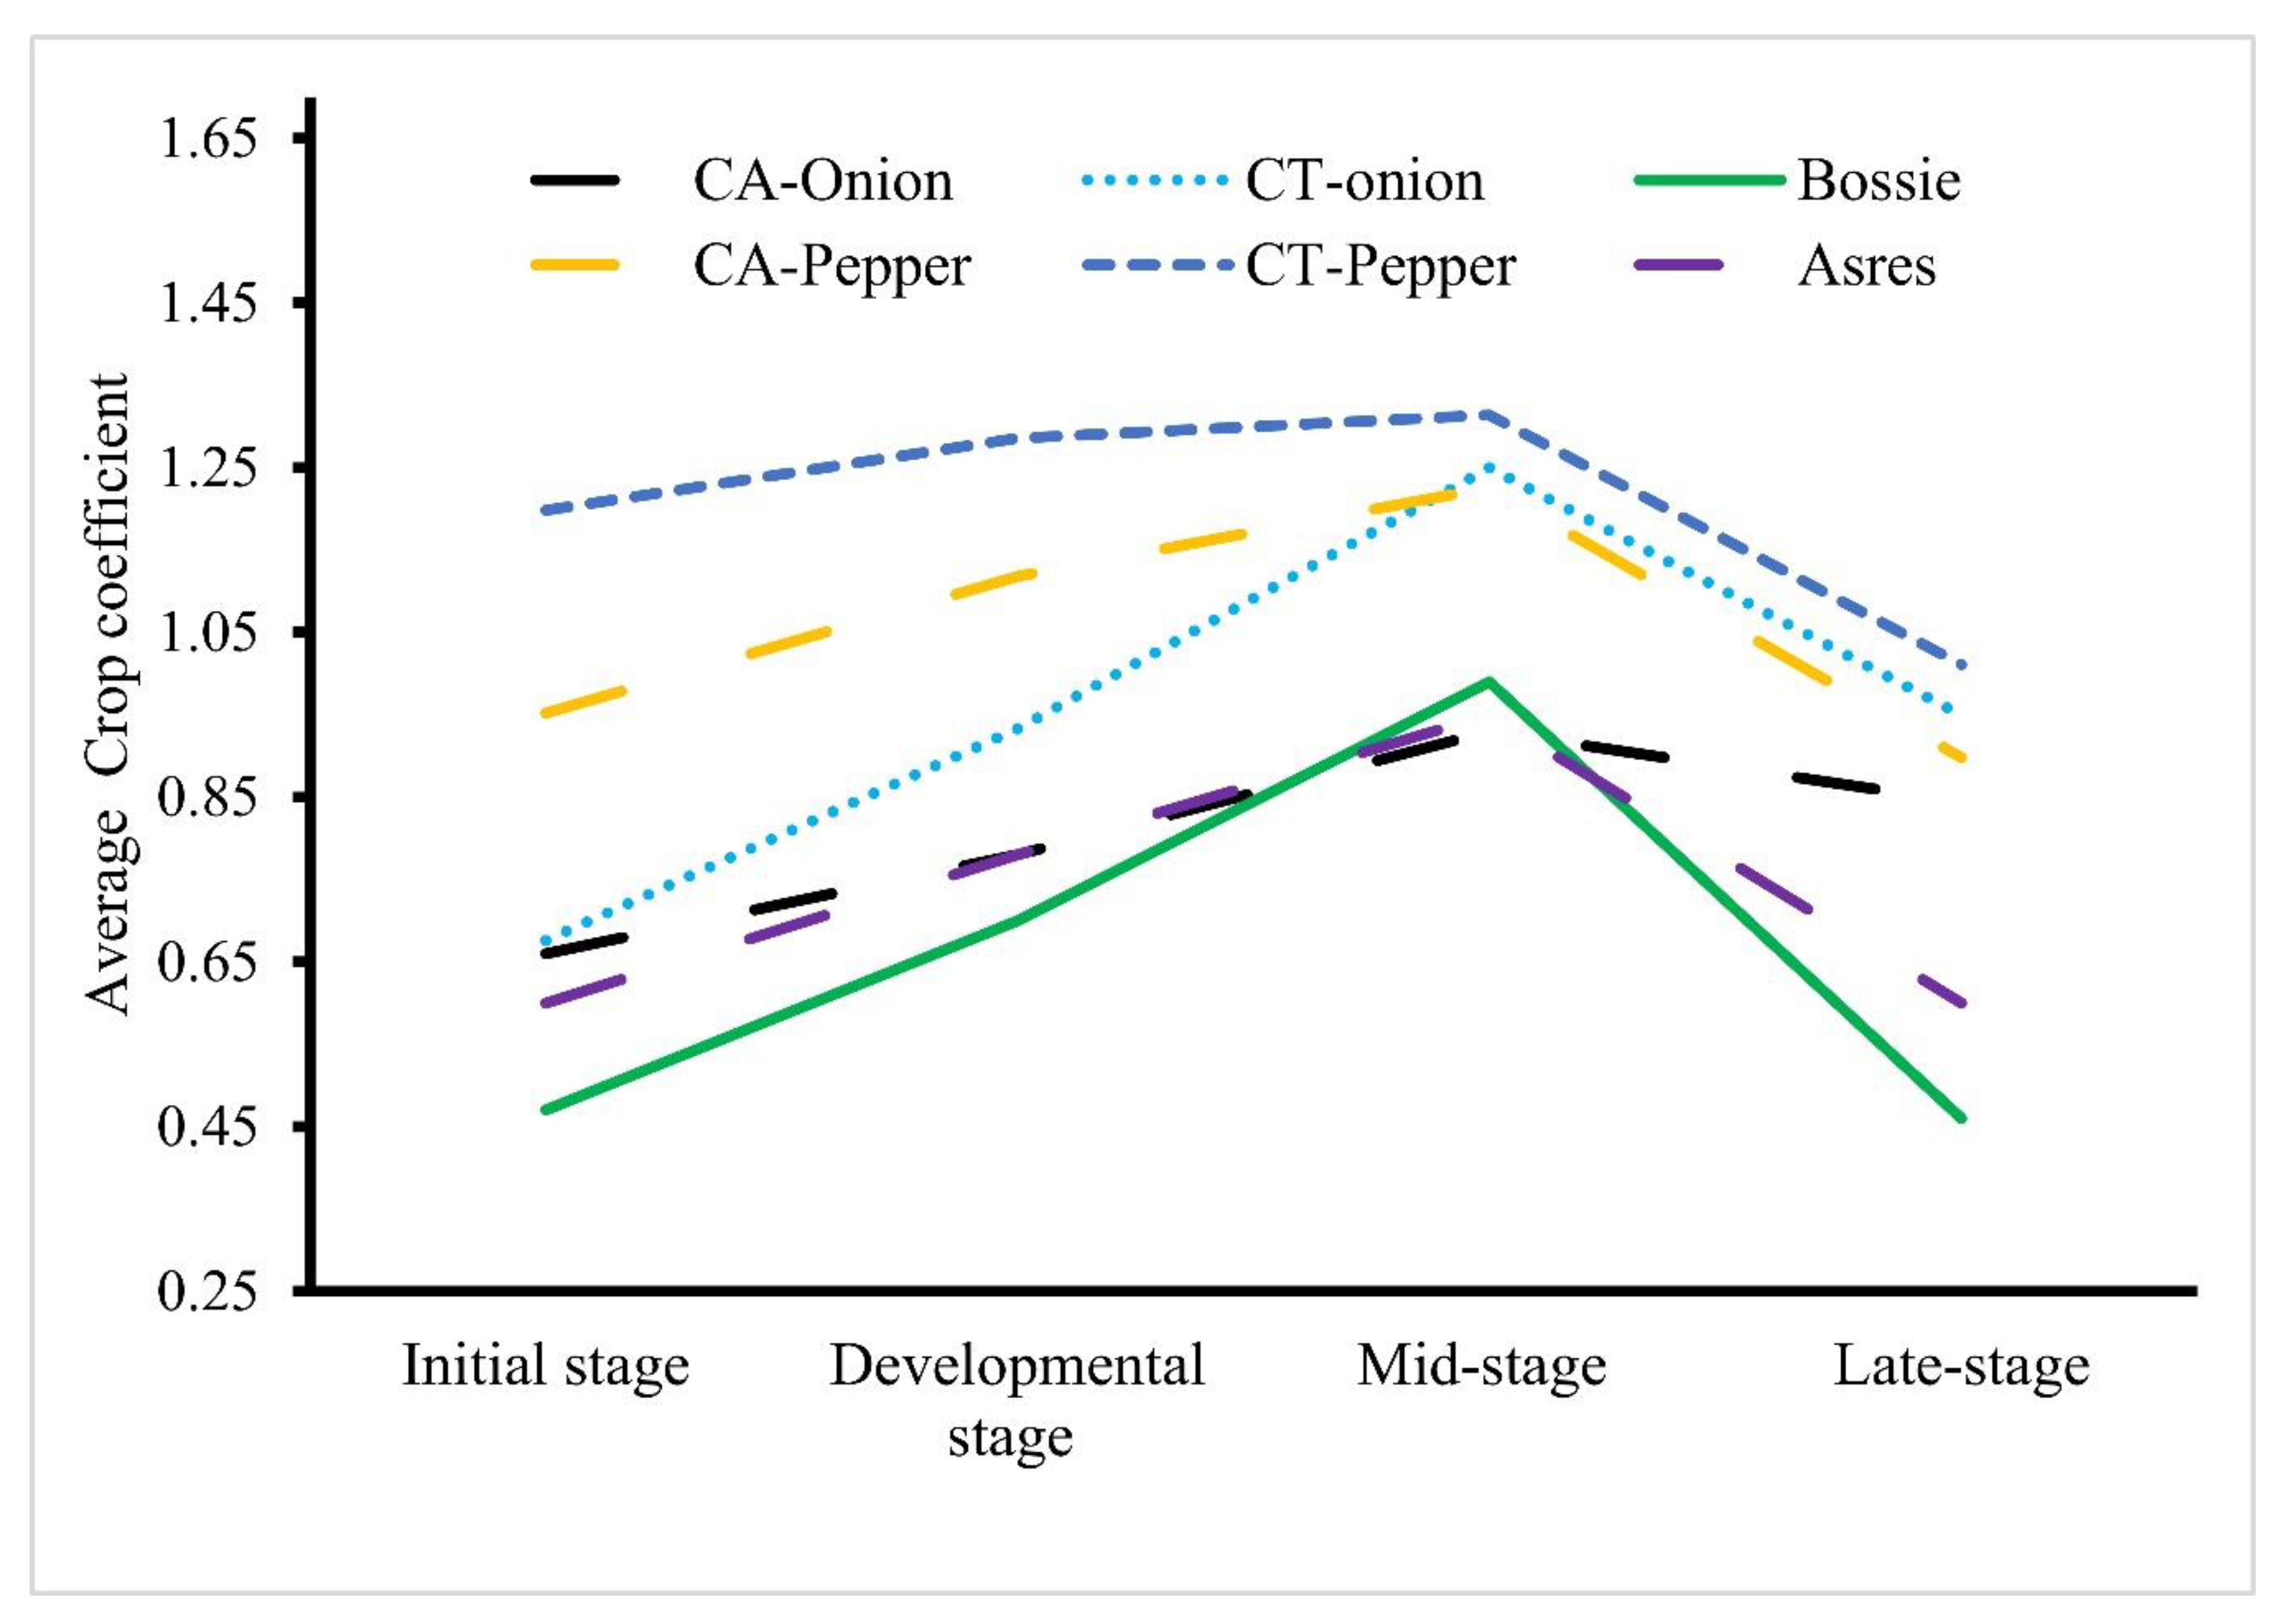
3.3. Effect on Crop Coefficient (Kc)

The crop coefficient was determined as a function of reference and actual evapotranspiration. Reference evapotranspiration ranges from 2.8 to 5 mm per day (Figure 7) both for Dangishta and Robit watersheds which is consistent with Enku and Melesse [60] findings.
As shown in Table 3 and Table A4, the consumptive use of crops for the CA treatment was significantly (α = 0.05) less than the CT treatment for both experimental sites (Robit and Dangishta). This is because the conservation of irrigation water is mainly achieved through the mulch system. This indicates that the amount of stored water in the root zone for the CA treatment will be conserved than the CT practice.
A relatively higher crop coefficient result has been found under CT practice than CA (Table 4). The higher crop coefficient obtained under CT management system can be associated with higher irrigation water use and losses associated with soil evaporation. The dual crop coefficient approach is ideal to understand the impacts of soil wetting by rainfall or irrigation and for estimating the effect of conservation practice in reducing soil evaporation. In this study, the single crop coefficient approach was used for determining crop coefficients at the different growing stages. The dual approach divides the crop coefficient in to crop transpiration and soil evaporation coefficients [61,62,63]. The crop transpiration coefficient “basal coefficient” needs more parameters to be determined and needs more numerical calculations. The soil evaporation coefficient (Ke) also needs estimation of constant parameters from a range of values which results in overestimation or underestimation of the coefficients. The crop height at each growing stage was not measured for basal coefficient determination and therefore the single crop coefficient was used. As the crop develops, the ground cover, crop height, and the leaf area also change which brings differences in the amount of evapotranspiration during the various growth stages, which finally brings variation in the crop coefficient.
During the initial period, the leaf area is small, and evapotranspiration is mainly in the form of soil evaporation. The crop coefficient during the initial period is high when the soil is wet during irrigation and low when the soil surface is dry. Particularly in the CT water management system, the irrigation applied to the plot is evaporated without any control and the major evapotranspiration in this stage is soil evaporation. The average crop coefficient of cabbage in developmental, mid, and late stage was 0.89, 0.97, 0.72 for CA treatment and 1.02, 1.19, 0.84 for CT practice, respectively.
The average initial crop coefficient for the cabbage experiment was 0.67 for CA and 0.71 for CT. This result showed a difference from crop coefficient developed by FAO for cabbage (i.e., Kc = 0.45), for non-stressed, well-managed crops in sub-humid climates. For the garlic experiment, a crop coefficient of 0.59 for CA and 0.65 for CT was found.
According to the previous studies conducted by Ayars [64] an initial crop coefficient of 0.53 for garlic was estimated which shows a difference from this experiment. The difference may be due to variations in climate, soil conditions, and water management practices. A coefficient of 0.67, 0.82, 0.75 for CA and 0.82, 1.07, 0.82 for CT treatment were found (Table 4) for garlic. A 20% average Kc reduction was observed for both cabbage and garlic. The results were compared with previous studies conducted by Ayars [64] for garlic and Gulik and Nyvall [65] for cabbage (Figure 8). The minimum crop coefficient value was observed in the initial stage and gets increased in the development stage. The maximum crop coefficient was observed in the mid-stage and finally decreased in the harvesting stage as shown in Figure 8. This trend was seen both in the CA and CT water management system. During the mid and late-stage plant, leaves begin to age, and Kc gets decreased at the end of the growing period.
In CA and CT water management systems, a higher crop coefficient was observed at the mid-stage because the leaf area is large and crop evapotranspiration (ETc) is in the form of evaporation from the soil and transpiration from the plant leaf. During the late stage, the plant leaves begin to die which resulted in a decrease in Kc value. At the initial and developmental stages, the variation of crop coefficient was not statistically significant (Table A4). Whereas in the mid-stage except for pepper, the variation in crop coefficient between CA and CT is significant (α = 0.05) (Table A4). The average crop coefficient values for cabbage, garlic, and onion throughout the crop base period showed a significant (α = 0.05 and α = 0.1) increase in CT than CA (Table A5). Therefore, CA is a promising strategy to save scarce water resources through a decrease in runoff, evaporation, and an increase in soil moisture and groundwater recharge. An improvement in soil fertility was observed in CA practice from the biological processes happening in the soil environment.
Similar findings in the crop coefficient of onion and pepper showed an increasing pattern from initial to mid-stage and finally decreased at the late stage (Figure 9). For onion experiments a coefficient of 0.67, 0.93, 1.24, and 0.95 were observed in the CT plots whereas in CA plots a coefficient of 0.66, 0.78, 0.93, and 0.84 were found at the initial, developmental, mid, and late stages, respectively. A significant (α = 0.05) reduction in Kc (10%) was observed for pepper. The variations in Kc were found to be consistent with Bossie et al., [58] findings which are (0.47 at the initial stage, 0.7 at the developmental stage, 0.99 at mid-stage, and 0.46 at a late stage). The result found from the pepper experiment showed a rapid increase in Kc value when compared with other crops (Table 4). In the CT experiment, a crop coefficient of 1.19, 1.28, 1.31, and 1.01 was observed in the four growing stages which are different from Asres [66] findings (Kc value of 0.6 at initial, 0.78 at developmental, 0.95 at mid-stage, and 0.6 at harvest), respectively. The result obtained from the CA experimental showed a Kc value of 0.95 at the initial stage, 1.1 at the developmental stage, 1.2 at mid-stage, and 0.9 at the late stage.
The variation in CA and CT was also clearly seen in vegetable production (yield of vegetable per hectare of land). The CA management system increased productivity than the CT practice. The average vegetable yield in CA was 3.2, 3.05, 23.58, and 19 tha-1 for onion, garlic, cabbage, and pepper, respectively. Whereas in the CT, the average vegetable yield was 2.81, 1.96, 21.54, and 13.6 tha-1 for onion, garlic, cabbage, and pepper, respectively. The result depicts that CA increased productivity by 16%, 56%, 9%, and 40% for onion, garlic, cabbage, and pepper, respectively. This was due to the improvements in soil quality and structure [19,67].

4. Conclusions

Conservation agriculture with a drip irrigation system was found efficient for agricultural water management than the conventional tillage system. About 18% of irrigation water saving was observed for cabbage and onion experiment under conservation agriculture than conventional tillage. Similarly, 14% and 28% of water savings were also achieved in the pepper and garlic experiment in Dangishta, respectively.
Calculation of crop coefficient revealed a significant decrease under conservation agriculture as compared to conventional tillage practice. The result depicted that conservation agriculture with a drip irrigation system significantly (α = 0.05) reduced crop coefficient values of crops as compared to conventional tillage. Specifically, 20% reductions were observed for onion, cabbage, and garlic under conservation agriculture whereas 10% reductions were observed for pepper throughout the crop base period.
Similarly, the result obtained from the soil test indicated that conservation agriculture was a promising approach for soil quality improvement than the conventional tillage practice. A significant improvement was observed in organic matter (10%), field capacity (4%), and total nitrogen (10%) under conservation agriculture than conventional tillage practice at a 10% significant level corroborates this finding. Therefore, shifting the current agricultural practice is worth enough for improving water and crop productivity in the region.

Author Contributions

A.Y.Y. contributed to the experimental design, data analysis and interpretation, and drafted the manuscript; T.T.A. contributed to the experimental design, data acquisition and analysis, and revised the manuscript for the scientific content; N.F.A. contributed to data collection and analysis; S.A.T. contributed to the experiment, data analysis and interpretation, and revised the manuscript; M.K.J. contributed to data analysis and revised the manuscript; M.R.R. contributed to data acquisition and revised the manuscript. All authors have read and agreed to the published version of the manuscript.

Funding

This research and publication are made possible by the generous support of the American people through support by the United States Agency for International Development Feed the Future Innovation Labs for Collaborative Research on Sustainable Intensification (Cooperative Agreement No. AID-OAA-L-14-00006, Kansas State University) Appropriate Scale Mechanization Consortium, and the Sustainably Intensified Production Systems Impact on Nutrition projects; and Feed the Future Innovation Lab for Collaborative Research on Small Scale Irrigation (Cooperative Agreement No. AID-OAA-A-13-0005, Texas A&M University). The opinions expressed herein are those of the author(s) and do not necessarily reflect the views of the U.S. Agency for International Development.

Acknowledgments

We would like to acknowledge the Ethiopian National Meteorological Agency (ENMA) for providing quality data for this research.

Conflicts of Interest

The authors declare no conflict of interest.

Appendix A. Soil Physico-Chemical Properties

Table A1. A one tailed paired t-test for the average soil physico-chemical properties, where OM, EC, TN, Av. K, Av.P, Av. FC, Av.Pwp, Fe, and Av. CEC are organic matter, electrical conductivity, total nitrogen, average potassium, phosphorous, field capacity, permanent wilting point, iron, and cation exchange capacity, respectively.
Items pHOM (%)EC (ds/m)TN (%)Av. k (ppm)Av. P (ppm)Av. FC (%)Av. Pwp (%)Fe (%)Av. CEC (%)
CA5.94.80.10.3134924.736.824.218.521.5
CT5.84.30.10.2141125.435.52518.417.4
N5555555555
p-value0.15 **,a0.01 *,a0.5 **,a0.05 **,a0.3 **,a0.4 **,a0.08 **,a0.37 **,a0.4 **,a0.06 **,a
CA6.440.10.2111832.2n.an.an.a25.8
CT6.23.70.10.299724.2n.an.an.a23.3
N555555 5
p-value0.09 **,b0.02 *,b0.2 **,b0.03 *,b0.2 **,b0.24 **,b 0.02 *,b
CA5.13.20.40.2305.621.632.822.212.925.6
CT5.230.40.2496.313.732.722.21227
N4444444444
p-value0.15 **,c0.24 **,c0.11 **,c0.35 **,c0.18 **,c0.07 **,c0.43 **,c0.5 **,c0.04 *,c0.16 **,c
CA5.54.90.10.2454.418.334.526.816.928
CT5.64.80.10.2415.519.124.624.513.632.8
N4444444444
p-value0.15 **,d0.4 **,d0.35 **,d0.38 **,d0.45 **,d0.44 **,d0.1 **,d0.13 **,d0.03 *,d0.06 **,d
Note: N = number of replicates, a = Dangishta at beginning, b = Dangishta at end, c = Robit at beginning, d = Robit at end, * α = 0.05, ** α = 0.1.
Table A2. A one tailed paired t-test for the average depth integrated soil physico-chemical properties taken from Dangishta experimental site.
ItemspHOM (%)EC (ds/m)TN (%)Av. k (ppm)Av. P (ppm)Av. CEC (%)Fe (%)
CA5.3884.9820.2220.228250.9221.20433.9230.094
CT5.2684.1560.280.238289.3424.68431.8831.186
N55555555
P-value0.3 **,a0.005 *,a0.25 **,a0.21 **,a0.27 **,a0.13 **,a0.08 **,a0.36 **,a
CA5.4063.9320.1920.204203.049.42630.7226.516
CT5.5823.420.1420.17316.769.43229.7626.592
N55555555
P-value0.14 **,b0.06 **,b0.16 **,b0.05 **,b0.05 **,b0.49 **,b0.37 **,b0.48 **,b
Note: N = number of replicates, a = sample taken from 0–20 cm depth, b = sample taken from 20–40 cm depth, * α = 0.05, ** α = 0.1.

Appendix B. Average Irrigation Water Use and Crop Coefficient

Table A3. A one tailed paired t-test for the average irrigation water use for variety of vegetables.
ItemsCabbageGarlicOnionPepper
CA318.1199.2332.4211.4
CT385.2275.4406.4245.4
N5555
P-value0.006 *,a0.0000236 *,b0.00074 *,b0.0074 *,b
Note: N = number of replicates, a = Robit experimental site, b = Dangishta experimental site, * α = 0.05, ** α = 0.1.
Table A4. A one tailed paired t-test of crop coefficient values of different vegetables under their respective growth stages at 5% significance level.
A, Initial stageB, Mid-stage
ItemCabbageOnionGarlicPepperItemCabbageOnionGarlicPepper
CA0.670.660.590.59CA0.970.930.821.22
CT0.710.670.650.65CT1.191.241.071.31
N4555N4555
p-value0.130.440.260.12p-value0.040.0030.020.27
C, Developmental stageD, Late-stage
ItemCabbageOnionGarlicPepperItemCabbageOnionGarlicPepper
CA0.890.780.671.12CA0.720.840.750.89
CT1.020.930.821.28CT0.840.950.821.01
N4555N4555
p-value0.180.100.100.26p-value0.080.190.200.04
Table A5. A one tailed paired t-test of average crop coefficient values of cabbage, onion, garlic, and pepper throughout the crop base period.
ItemCabbageOnionGarlicPepper
CA0.810.800.711.05
CT0.940.950.841.20
N16202020
p-value0.007 *0.005 *0.003 *0.054 **
Note: N = number of replicates, * α = 0.05, ** α = 0.1.

References

  1. Awulachew, S.B. Irrigation potential in Ethiopia: Constraints and opportunities for enhancing the system. Gates Open Res. 2019, 3, 12–58. [Google Scholar]
  2. Gebremariam, M.; Kebede, F. Land use change effect on soil carbon stock, above ground biomass, aggregate stability and soil Crust: A case from Tahtay Adyabo, North Western Tigray, Northern Ethiopia. J. Drylands 2010, 3, 220–225. [Google Scholar]
  3. Zegeye, H.; Rasheed, A.; Makdis, F.; Badebo, A.; Ogbonnaya, F.C. Genome-wide association mapping for seedling and adult plant resistance to stripe rust in synthetic hexaploid wheat. PLoS ONE 2014, 9, e105593. [Google Scholar] [CrossRef] [PubMed] [Green Version]
  4. Mhiret, D.A.; Dagnew, D.C.; Assefa, T.T.; Tilahun, S.A.; Zaitchik, B.F.; Steenhuis, T.S. Erosion hotspot identification in the sub-humid Ethiopian highlands. Ecohydrol. Hydrobiol. 2019, 19, 146–154. [Google Scholar] [CrossRef]
  5. Assefa, T.T. Experimental and Modeling Evaluation of Conservation Agriculture with Drip Irrigation for Small-Scale Agriculture in Sub-Saharan Africa. Ph.D. Thesis, North Carolina Agricultural and Technical State University, Greensboro, NC, USA, 2018. [Google Scholar]
  6. Assefa, T.; Jha, M.; Reyes, M.; Srinivasan, R.; Worqlul, A.W. Assessment of Suitable Areas for Home Gardens for Irrigation Potential, Water Availability, and Water-Lifting Technologies. Water 2018, 10, 495. [Google Scholar] [CrossRef] [Green Version]
  7. Worqlul, A.W.; Jeong, J.; Dile, Y.T.; Osorio, J.; Schmitter, P.; Gerik, T.; Srinivasan, R.; Clark, N. Assessing potential land suitable for surface irrigation using groundwater in Ethiopia. Appl. Geogr. 2017, 85, 1–13. [Google Scholar] [CrossRef]
  8. Sassenrath, G.; Lin, X.; Shoup, D. Identification of Yield-Limiting Factors in Southeast Kansas Cropping Systems. Kans. Agric. Exp. Stn. Res. Rep. 2015, 1, 5. [Google Scholar] [CrossRef] [Green Version]
  9. Abittew, A.B.; Fufa, B. Determinants of Farmers’ Willing Ness to Pay for the Conservation Strategy of National Parks: The Case for Simen Mountains National Park; Haramaya University: Haramaya, Ethiopia, 2006. [Google Scholar]
  10. Abebe, T.H.; Bogale, A. Willingness to pay for rainfall based insurance by smallholder farmers in Central Rift Valley of Ethiopia: The case of Dugda and Mieso Woredas. Asia Pac. J. Energy Environ. 2014, 1, 121–155. [Google Scholar] [CrossRef]
  11. Hobbs, P.R. Conservation agriculture: What is it and why is it important for future sustainable food production? J. Agric. Sci. Camb. 2007, 145, 127. [Google Scholar] [CrossRef] [Green Version]
  12. Fereres, E.; Soriano, M.A. Deficit irrigation for reducing agricultural water use. J. Exp. Bot. 2006, 58, 147–159. [Google Scholar] [CrossRef] [PubMed] [Green Version]
  13. Lal, R. Soil degradation by erosion. Land Degrad. Dev. 2001, 12, 519–539. [Google Scholar] [CrossRef]
  14. Assefa, T.T.; Jha, M.K.; Tilahun, S.A.; Yetbarek, E.; Adem, A.A.; Wale, A. Identification of erosion hotspot area using GIS and MCE technique for Koga watershed in the Upper Blue Nile Basin, Ethiopia. Am. J. Environ. Sci. 2015, 11, 245. [Google Scholar] [CrossRef] [Green Version]
  15. Beddington, J.; Asaduzzaman, M.; Clark, M.; Fernández, A.; Guillou, M.; Jahn, M.; Erda, L.; Mamo, T.; Van Bo, N.; Nobre, C.A.; et al. Achieving Food Security in the Face of Climate Change: Final Report from the Commission on Sustainable Agriculture and Climate Change; CGIAR Research Program on Climate Change, Agriculture and Food Security (CCAFS): Copenhagen, Denmark, 2012. [Google Scholar]
  16. Ward, F.A.; Pulido-Velazquez, M. Water conservation in irrigation can increase water use. Proc. Natl. Acad. Sci. USA 2008, 105, 18215–18220. [Google Scholar] [CrossRef] [PubMed] [Green Version]
  17. Wada, Y.; Wisser, D.; Bierkens, M.F. Global modeling of withdrawal, allocation and consumptive use of surface water and groundwater resources. Earth Syst. Dyn. Discuss. 2014, 5, 15–40. [Google Scholar] [CrossRef] [Green Version]
  18. Assefa, T.; Jha, M.; Reyes, M.; Tilahun, S.; Worqlul, A.W. Experimental Evaluation of Conservation Agriculture with Drip Irrigation for Water Productivity in Sub-Saharan Africa. Water 2019, 11, 530. [Google Scholar] [CrossRef] [Green Version]
  19. Assefa, T.; Jha, M.; Reyes, M.; Worqlul, A. Modeling the Impacts of Conservation Agriculture with a Drip Irrigation System on the Hydrology and Water Management in Sub-Saharan Africa. Sustainability 2018, 10, 4763. [Google Scholar] [CrossRef] [Green Version]
  20. Challinor, A.J.; Simelton, E.S.; Fraser, E.D.; Hemming, D.; Collins, M. Increased crop failure due to climate change: Assessing adaptation options using models and socio-economic data for wheat in China. Environ. Res. Lett. 2010, 5, 034012. [Google Scholar] [CrossRef]
  21. Lobell, D.B.; Gourdji, S.M. The influence of climate change on global crop productivity. Plant Physiol. 2012, 160, 1686–1697. [Google Scholar] [CrossRef] [Green Version]
  22. Rosegrant, M.W.; Cline, S.A. Global food security: Challenges and policies. Science 2003, 302, 1917–1919. [Google Scholar] [CrossRef] [Green Version]
  23. Barrett, C.B.; Reardon, T.; Webb, P. Nonfarm income diversification and household livelihood strategies in rural Africa: Concepts, dynamics, and policy implications. Food Policy 2001, 26, 315–331. [Google Scholar] [CrossRef]
  24. Worqlul, A.W.; Collick, A.S.; Rossiter, D.G.; Langan, S.; Steenhuis, T.S. Assessment of surface water irrigation potential in the Ethiopian highlands: The Lake Tana Basin. Catena 2015, 129, 76–85. [Google Scholar] [CrossRef]
  25. Strelkoff, T.; Clemmens, A.; El-Ansary, M.; Awad, M. Surface-irrigation evaluation models: Application to level basins in Egypt. Trans. Asae 1999, 42, 1027. [Google Scholar] [CrossRef]
  26. Ritzema, H. Drain for Gain: Managing salinity in irrigated lands—A review. Agric. Water Manag. 2016, 176, 18–28. [Google Scholar] [CrossRef] [Green Version]
  27. Pereira, L.S.; Cordery, I.; Iacovides, I. Improved indicators of water use performance and productivity for sustainable water conservation and saving. Agric. Water Manag. 2012, 108, 39–51. [Google Scholar] [CrossRef]
  28. Assefa, T.T.; Jha, M.K.; Reyes, M.R.; Schimmel, K.; Tilahun, S.A. Commercial Home Gardens under Conservation Agriculture and Drip Irrigation for Small Holder Farming in sub-Saharan Africa. In Proceedings of the 2017 ASABE Annual International Meeting, Washington, DC, USA, 16–19 July 2017; p. 1. [Google Scholar]
  29. Hobbs, P. Conservation agriculture (CA), defined as minimal soil disturbance (no-till) and permanent soil cover (mulch) combined with rotations, is a more sustainable cultivation system for the future than those presently practised. J. Agric. Sci 2007, 145, 127–137. [Google Scholar] [CrossRef] [Green Version]
  30. Thierfelder, C.; Wall, P.C. Effects of conservation agriculture techniques on infiltration and soil water content in Zambia and Zimbabwe. Soil Tillage Res. 2009, 105, 217–227. [Google Scholar] [CrossRef]
  31. Knowler, D.; Bradshaw, B. Farmers’ adoption of conservation agriculture: A review and synthesis of recent research. Food Policy 2007, 32, 25–48. [Google Scholar] [CrossRef]
  32. Kassam, A.; Friedrich, T.; Shaxson, F.; Pretty, J. The spread of conservation agriculture: Justification, sustainability and uptake. Int. J. Agric. Sustain. 2009, 7, 292–320. [Google Scholar] [CrossRef]
  33. Chivenge, P.; Murwira, H.; Giller, K.; Mapfumo, P.; Six, J. Long-term impact of reduced tillage and residue management on soil carbon stabilization: Implications for conservation agriculture on contrasting soils. Soil Tillage Res. 2007, 94, 328–337. [Google Scholar] [CrossRef]
  34. Rajak, D.; Manjunatha, M.; Rajkumar, G.; Hebbara, M.; Minhas, P. Comparative effects of drip and furrow irrigation on the yield and water productivity of cotton (Gossypium hirsutum L.) in a saline and waterlogged vertisol. Agric. Water Manag. 2006, 83, 30–36. [Google Scholar] [CrossRef]
  35. Maisiri, N.; Senzanje, A.; Rockstrom, J.; Twomlow, S. On farm evaluation of the effect of low cost drip irrigation on water and crop productivity compared to conventional surface irrigation system. Phys. Chem. Earthparts A/B/C 2005, 30, 783–791. [Google Scholar] [CrossRef]
  36. Edralin, D.; Sigua, G.; Reyes, M. Dynamics of soil carbon, nitrogen and soil respiration in farmer’s field with conservation agriculture Siem Reap, Cambodia. Int. J. 2016, 11, 1–13. [Google Scholar]
  37. Assefa, T.; Jha, M.; Worqlul, A.W.; Reyes, M.; Tilahun, S. Scaling-Up Conservation Agriculture Production System with Drip Irrigation by Integrating MCE Technique and the APEX Model. Water 2019, 11, 2007. [Google Scholar] [CrossRef] [Green Version]
  38. Kang, S.; Gu, B.; Du, T.; Zhang, J. Crop coefficient and ratio of transpiration to evapotranspiration of winter wheat and maize in a semi-humid region. Agric. Water Manag. 2003, 59, 239–254. [Google Scholar] [CrossRef]
  39. Tesema, M.; Schmitter, P.; Nakawuka, P.; Tilahun, S.A.; Steenhuis, T.; Langan, S. Evaluating irrigation technologies to improve crop and water productivity of onion in Dangishta watershed during the dry monsoon phase. In Proceedings of the Fourth International Conference on the Advancements of Science and Technology in Civil and Water Resources Engineering, Online, 13–29 November 2019. [Google Scholar]
  40. Walker, D.; Parkin, G.; Schmitter, P.; Gowing, J.; Tilahun, S.A.; Haile, A.T.; Yimam, A.Y. Insights from a multi-method recharge estimation comparison study. Groundwater 2018, 57, 245–258. [Google Scholar] [CrossRef] [Green Version]
  41. Yimam, A.Y.; Bekele, A.M.; Nakawuka, P.; Schmitter, P.; Tilahun, S.A. Rainfall-Runoff Process and Groundwater Recharge in the Upper Blue Nile Basin: The Case of Dangishta Watershed. In Proceedings of the International Conference on Advances of Science and Technology, Bahir Dar, Ethiopia, 5–7 October 2018; pp. 536–549. [Google Scholar]
  42. Yiak, D.; Tilahun, S.; Schmitter, P.S.; Nakawuka, P.; Steenhuis, T. Groundwater recharge of Robit-Bata Experimental Watershed, Lake Tana Basin, Ethiopia. In Proceedings of the 3rd International Conference on the Advancements of Science and Technology [ICAST], Bahir Dar, Ethiopia, 8–9 May 2015. [Google Scholar]
  43. De Winter, J.C. Using the Student’s t-test with extremely small sample sizes. Pract. Assess. Res. Eval. 2013, 18, 1–12. [Google Scholar]
  44. Zotarelli, L.; Dukes, M.D.; Romero, C.C.; Migliaccio, K.W.; Morgan, K.T. Step by step calculation of the Penman-Monteith Evapotranspiration (FAO-56 Method); Institute of Food and Agricultural Sciences, University of Florida: Gainesville, FL, USA, 2010. [Google Scholar]
  45. Bos, M.G.; Kselik, R.A.; Allen, R.G.; Molden, D. Water Requirements for Irrigation and the Environment; Springer Science & Business Media: Berlin, Germany, 2008. [Google Scholar]
  46. Wellens, J.; Raes, D.; Traore, F.; Denis, A.; Djaby, B.; Tychon, B. Performance assessment of the FAO AquaCrop model for irrigated cabbage on farmer plots in a semi-arid environment. Agric. Water Manag. 2013, 127, 40–47. [Google Scholar] [CrossRef]
  47. Allen, R.G.; Pereira, L.S.; Raes, D.; Smith, M. Crop evapotranspiration-Guidelines for computing crop water requirements-FAO Irrigation and drainage paper 56. Faorome 1998, 300, D05109. [Google Scholar]
  48. Yoder, R.; Odhiambo, L.O.; Wright, W.C. Evaluation of methods for estimating daily reference crop evapotranspiration at a site in the humid southeast United States. Appl. Eng. Agric. 2005, 21, 197–202. [Google Scholar] [CrossRef]
  49. Bozkurt, Y.; Yazar, A.; Gençel, B.; Sezen, M.S. Optimum lateral spacing for drip-irrigated corn in the Mediterranean Region of Turkey. Agric. Water Manag. 2006, 85, 113–120. [Google Scholar] [CrossRef]
  50. Sezen, S.M.; Yazar, A.; Eker, S. Effect of drip irrigation regimes on yield and quality of field grown bell pepper. Agric. Water Manag. 2006, 81, 115–131. [Google Scholar] [CrossRef]
  51. Shedeed, S.I.; Zaghloul, S.M.; Yassen, A. Effect of method and rate of fertilizer application under drip irrigation on yield and nutrient uptake by tomato. Ozean J. Appl. Sci. 2009, 2, 139–147. [Google Scholar]
  52. Tilahun, S.A.; Yilak, D.L.; Schmitter, P.; Zimale, F.A.; Langan, S.; Barron, J.; Parlange, J.Y.; Steenhuis, T.S. Establishing irrigation potential of a hillside aquifer in the African highlands. Hydrol. Process. 2020, 1–13. [Google Scholar] [CrossRef] [Green Version]
  53. Gao, X.; Huo, Z.; Qu, Z.; Xu, X.; Huang, G.; Steenhuis, T.S. Modeling contribution of shallow groundwater to evapotranspiration and yield of maize in an arid area. Sci. Rep. 2017, 7, 1–13. [Google Scholar] [CrossRef] [Green Version]
  54. Islam, A.; Edwards, D.; Asher, C. pH optima for crop growth. Plant Soil 1980, 54, 339–357. [Google Scholar] [CrossRef]
  55. McCauley, A.; Jones, C.; Jacobsen, J. Soil pH and organic matter. Nutr. Manag. Modul. 2009, 8, 1–12. [Google Scholar]
  56. Balesdent, J.; Chenu, C.; Balabane, M. Relationship of soil organic matter dynamics to physical protection and tillage. Soil Tillage Res. 2000, 53, 215–230. [Google Scholar] [CrossRef]
  57. Tiwari, K.; Singh, A.; Mal, P. Effect of drip irrigation on yield of cabbage (Brassica oleracea L. var. capitata) under mulch and non-mulch conditions. Agric. Water Manag. 2003, 58, 19–28. [Google Scholar] [CrossRef]
  58. Bossie, M.; Tilahun, K.; Hordofa, T. Crop coefficient and evaptranspiration of onion at Awash Melkassa, Central Rift Valley of Ethiopia. Irrig. Drain. Syst. 2009, 23, 1–10. [Google Scholar] [CrossRef]
  59. Tebal, N. Growth, yield and water use pattern of chilli pepper under different irrigation scheduling and management. Asian J. Agric. Res. 2011, 5, 154–163. [Google Scholar]
  60. Enku, T.; Melesse, A.M. A simple temperature method for the estimation of evapotranspiration. Hydrol. Process. 2014, 28, 2945–2960. [Google Scholar] [CrossRef]
  61. Parekh, F. Crop water requirement using single and dual crop coefficient approach. Int. J. Innov. Res. Sci. Eng. Technol 2013, 2, 4493–4499. [Google Scholar]
  62. Allen, R.G.; Pereira, L.S.; Smith, M.; Raes, D.; Wright, J.L. FAO-56 dual crop coefficient method for estimating evaporation from soil and application extensions. J. Irrig. Drain. Eng. 2005, 131, 2–13. [Google Scholar] [CrossRef] [Green Version]
  63. Zhang, B.; Liu, Y.; Xu, D.; Zhao, N.; Lei, B.; Rosa, R.D.; Paredes, P.; Paço, T.A.; Pereira, L.S. The dual crop coefficient approach to estimate and partitioning evapotranspiration of the winter wheat–summer maize crop sequence in North China Plain. Irrig. Sci. 2013, 31, 1303–1316. [Google Scholar] [CrossRef]
  64. Ayars, J.E. Water requirement of irrigated garlic. Trans. Asabe 2008, 51, 1683–1688. [Google Scholar] [CrossRef]
  65. Gulik, T.; Nyvall, J. Crop Coefficients for use in Irrigation Scheduling; Ministry of Agriculture, Food and Fisheries of British Columbia: Victoria, BC, Canada, 2001; pp. 1–6.
  66. Asres, S.B. Evaluating and enhancing irrigation water management in the upper Blue Nile basin, Ethiopia: The case of Koga large scale irrigation scheme. Agric. Water Manag. 2016, 170, 26–35. [Google Scholar] [CrossRef]
  67. Assefa, T.; Jha, M.; Reyes, M.; Worqlul, A.; Doro, L.; Tilahun, S. Conservation agriculture with drip irrigation: Effects on soil quality and crop yield in sub-Saharan Africa. J. Soil Water Conserv. 2020, 75, 209–217. [Google Scholar] [CrossRef]
Figure 1. Dangishta and Robit experimental sites in Ethiopia; adopted from Assefa et al. [37].
Water 12 00947 g001
Figure 2. Gravity based drip irrigation system on a paired ‘t’ experimental design; half of the plot was used for conservation practice and the other half is the conventional tillage practice.
Water 12 00947 g002
Figure 3. Layout of drip irrigation system (mains, submains, drip kits, and laterals including sand filter) with transplanted vegetables.
Water 12 00947 g003
Figure 4. Average soil physico-chemical analysis result for CA and conventional tillage (CT) in which soil samples were taken from topsoil (0–20 cm) and subsoil (20–40 cm) from Dangishta experimental site. Note: Electrical conductivity (EC) and total nitrogen (N) values are multiples of ten, Potassium (K) is quotient of ten.
Water 12 00947 g004
Figure 5. Average irrigation water uses for cabbage, garlic, onion, and pepper in Dangishta and Robit under CA and CT plots.
Water 12 00947 g005
Figure 6. Average volumetric soil moisture content for CA management and CT practice in Dangishta experimental watershed under onion, garlic, and pepper experiment.
Water 12 00947 g006
Figure 7. Maximum, minimum, and average reference evapotranspiration (ETo) in mm/day for Dangishta and Robit watersheds.
Water 12 00947 g007
Figure 8. Crop coefficient values of garlic compared with Ayars [64] and cabbage compared with Gulik and Nyvall [65] for CA management and CT practice.
Water 12 00947 g008
Figure 9. Crop coefficient values of onion compared with Bossie et al. [58] and pepper compared with Asres [66] for CA management and CT practice.
Water 12 00947 g009
Table 1. Rotation of crops and management activities at Dangishta and Robit experimental watersheds adopted from Assefa et al. [19].
SiteVegetableManagement ActivityDate
DangishitaGarlic (1st cycle)Tillage 113 October 2015 and 16 October 2015
Mulch application 225 October 2015
Planting28 October 2015
UREA application28 November 2015
Irrigation Application6 November 2015–22 February 2016
Harvesting3–4 March 2016
Onion (2nd cycle)Tillage 114 March 2016 and 16 March 2016
Mulch application 215 March 2016
Planting17 March 2016
Irrigation Application15 March–3 May 2016
Harvesting24–26 June 2016
Garlic (3rd cycle)Tillage 115 February 2017
Mulch application 217 February 2017
Planting17 February 2017
DAP 3 application4 March 2017
Irrigation Application17 March–3 June 2017
Harvesting20–22 June 2017
Pepper (4th cycle)Tillage 112 March 2018
Mulch application 214 March 2018
Planting15 March 2018
Irrigation Application15 March–9 June 2018
Harvesting12–20 July 2018
RobitTomato (1st cycle)Tillage 12 September 2015
Mulch application 223 October 2015
Planting24 October 2015
Malathion 4 application22 November 2015
Irrigation Application24 October 2015–12 March 2016
Harvesting1–15 March 2016
Garlic (2nd cycle)Tillage 119 March 2016
Mulch application 221 March 2016
Planting22 March 2016
Irrigation Application23 March–21 June 2016
Harvesting10–18 July 2016
Cabbage (3rd cycle)Tillage 127 October 2016
Mulch application 28 November 2016
Planting9 November 2016
UREA 3 application20 December 2016
Dimeto 4 40% application15 November 2016
Irrigation Application9 November 2016–25 February 2017
Harvesting15–26 February 2017
Note: 1 Only for CT plots; 2 only for CA plots; 3 Fertilizer; 4 Pesticide.
Table 2. Average soil physico-chemical properties during the 3rd cycle vegetable production (Table 1) both at the beginning and end of this experiment. Beginning stands for before transplanting, end stands for immediately after harvest during 3rd cycle vegetable production (after two years of conservation agriculture (CA) practice).
Experimental SiteDangishtaRobit
Irrigation SeasonBeginningEndBeginningEnd
Parameter\TreatmentCACTCACTCACTCACT
Soil PH5.95.86.46.25.15.25.55.6
Organic matter (%)4.84.343.73.234.94.8
Electrical Conductivity (ds/m)0.10.10.10.10.40.40.10.1
Total Nitrogen (%)0.30.20.20.20.20.20.20.2
Average Potassium (ppm)134914111118997305.6496.3454.4415.5
Average phosphorous (ppm)24.725.432.224.221.613.718.319.1
Average field capacity (%)36.835.5n.an.a32.832.734.524.6
Sand (%)46.436.429.22619.51920.522.5
Silt (%)24.629.434.43229.528.527.529
Clay (%)2934.236.4425152.55545.5
Average Permanent wilting point (%)24.225n.an.a22.222.226.824.5
Iron (%)18.518.4n.an.a12.91216.913.6
Average cation exchange Capacity (%)21.517.425.823.325.6272832.8
Note: N.a. refers to data not available.
Table 3. Maximum, minimum, and average crop evapotranspiration (ETc) in mm/day for Robit and Dangishta watersheds.
WatershedTreatmentMaxMinAverage
RobitCA4.02.83.4
CT4.33.03.6
DangishtaCA32.82.8
CT3.753.33.5
Table 4. Average crop coefficients of cabbage in Robit, garlic, onion, and pepper in the Dangishta experimental site, respectively.
TreatmentInitialDevelopmentalMidLateCrop Type
CA0.670.890.970.72Cabbage
0.590.670.820.75Garlic
0.951.121.220.89Pepper
0.660.780.930.84Onion
CT0.711.021.190.84Cabbage
0.650.821.070.82Garlic
1.191.281.311.01Pepper
0.670.931.240.95Onion

