Article

The Effect of Submergence and Eutrophication on the Trait’s Performance of Wedelia Trilobata over Its Congener Native Wedelia Chinensis

1
School of the Environment and Safety Engineering, Jiangsu University, Zhenjiang 212013, China
2
Department of Plant Production and Technologies, Faculty of Agricultural Sciences and Technologies, Nigde Omer Halisdemir University, Nigde 51200, Turkey
*
Authors to whom correspondence should be addressed.
Water 2020, 12(4), 934; https://doi.org/10.3390/w12040934
Submission received: 20 January 2020 / Revised: 17 March 2020 / Accepted: 23 March 2020 / Published: 26 March 2020
(This article belongs to the Special Issue Water Quality Engineering and Wastewater Treatment)

Abstract

:
Climate change and artificial disturbance may lead to increased submergence and eutrophication near a riparian zone and the shift of terrestrial plants into a riparian zone. In this study, the responses of terrestrial invasive Wedelia trilobata (WT) and congener native Wedelia chinensis (WC) plants were examined under submergence and eutrophication. A greenhouse experiment was conducted in which ramets of WT and WC were investigated under two levels of submergence (S1 and S2) and three levels of nutrients (N1, N2 and N3) along with two cultures (mono and mixed). Submergence (S) did not affect the morphological traits of both the species but nutrients (N), culture (C) and their interaction, along with submergence, had a significant effect on the morphological traits of both the species. The growth of WC under high submergence and high nutrients was decreased compared with low nutrients (N1, N2) but WT maintained its growth in monoculture. In mixed culture, low submergence (S1) and low nutrients (N1, N2) made WC more dominant but high submergence (S2) and high nutrients (N3) made WT more successful than WC due to its high phenotypic plasticity and negative effect of competition intensity. It was concluded that both species survive and grow well under submergence and eutrophication, but high submergence and eutrophication provide better conditions for WT to grow well.

1. Introduction

Globalization causes many invasive plant species to develop their wild population, where they were not introduced before [1,2]. Many of these species have successfully spread in the introduced ranges and now they occupy large areas because of decreased environment suitability for native plant species [3,4] and increased resource availability due to global change that helps invasive plant species [5,6]. Native diversity is under threat due to increases in precipitation and nutrients enrichment [7], and disturbance in environmental conditions makes invasive plant species more dominant, especially in wetland or a riparian zone [8]. Subsequently, better traits’ performance under different environmental conditions makes invasive plant species successful and allows them to spread in the introduced habitat [9,10,11,12].
High phenotypic plasticity seems to benefit plants to cope with environmental changes and get the advantage of increases in resources, and invasive plant species have been better on it compared to native plant species [13,14]. The success of invasive plant species in a new region was faster than native plant species because of higher phenotypic plasticity, and invasive plant species could outperform native plant species under interspecific competition [15,16]. It was found in a meta-analysis that with increasing resources, invasive plant species were more dominant than native plant species because of higher phenotypic plasticity and a more negative response under interspecific competition [17,18,19]. Several studies were conducted to test this hypothesis based on phenotypic plasticity and relative competition intensity against the environmental factors, such as water, temperature, nutrients, soil types, light and CO2 [2,20]. While environmental variability is affected by environmental factors, such as water fluctuation, nutrient variations and light availability as well [21]. Therefore, it is important to test these responses of invasive and native plant species to variability, other than changes in mean environmental factors.
There are many global change environmental factors, i.e., temperature, light, water, CO2 and nutrients, that are affecting the growth of plant species, but in riparian zones or wetland, the major factors are submergence and eutrophication [22]. Submergence is the modern form of flood, in which shoots of the plant are under water. A discharge from riversides, canals and dams will lead to submergence near these areas and plants will face a submergence period. The strategies in which plants cope with submergence have been reported in many studies [23,24,25]. Mostly, plants use two main techniques, “escape or quiescence”, to cope with submergence [26,27]. In the escape technique, plants re-establish a relationship with the atmosphere to increase shoot elongation and the number of leaves [28,29]. Under the quiescence technique, plants limit or cease their growth under water to tolerate submergence [26,30]. Submergence imposes considerable stress or negative effects on all plant characteristics because of a decrease in energy and carbohydrates [31] and also severely influences the photosynthesis [32]. Although, adaptive growth of invasive plant species assists in submergence and complete or incomplete submergence significantly inhibits their growth [25,27].
Eutrophication on the water surface is another major global environmental factor, which has negative effects on aquatic ecosystems. Eutrophication is the major threat in the 21st century because it reduces the diversity of native plant species in the aquatic ecosystems and boosts invasive plant species [16,33]. Eutrophication is the syndrome associated with an excess of macronutrients that boost invasive plant growth to outcompete the native plant species [34]. Eutrophication has been increasing in the aquatic ecosystems because of agriculture and urban activities (i.e., point and nonpoint source pollution). Eutrophication creates excessive nutrient enrichment on the water surface that promotes algae biomass accumulation on the water surface, which enhances invasive plant growth [35]. The native plant species diversity has declined in the aquatic ecosystems due to the occurrence and expansion of certain macrophytes [20,36]. Invasive plant species require light, water and nutrients for growth development, and CO2 for photosynthesis and oxygen for respiration [34]. Eutrophication reduces the stress of submergence by increasing shoots of invasive plant species that ultimately get more light, CO2 and oxygen for photosynthesis and also increase belowground biomass under submergence to outcompete the native competitor [27].
Nutrients travel from terrestrial to aquatic ecosystems through the primary source, i.e., surface runoff [35]. Flooding and excess rain boost the surface runoff, collecting more nutrients into aquatic ecosystems. By considering the negative effect of submergence and the positive effect of a high amount of nutrients on plant growth, we hypothesized that increasing nutrients under a submergence condition might alleviate submergence stress, that is, plants would grow well under high nutrients compared to low nutrients when the plants were submerged. We also hypothesized that invasive plant species under submergence and high nutrient conditions would be growing faster than native plant species when growing together, even they were introduced from terrestrial regions to aquatic regions.
To test this hypothesis, a greenhouse experiment has been conducted. The species chosen for this study belong to the Asteraceae family. Wedelia trilobata (WT), an annual invasive plant species, and Wedelia chinensis (WC), which is a congener native species in China. In China, initially, WT was introduced as a groundcover species, but it spread rapidly amongst gardens, roadsides, agricultural fields and near riversides [37,38]. Furthermore, WT was mostly found in the arid and semi-arid regions and also in the wetland area of Hainan province of China, which indicated that water fluctuation and nutrient enrichment made WT successful in these habitats [39]. WC, the native congener of WT, is mostly used as a medicinal plant, but the growth rate of WC is very slow compared to WT [39,40]. The introduction of WT in the riparian or wetland areas is not well understood, so studying the effects of submergence and eutrophication on WT is a crucial step toward understanding the mechanism of its invasion and predicting its development trends in the riparian and wetland regions. For this purpose, plants of WT and WC were tested with two levels of submergence combined with three levels of nutrient concentrations to attain a eutrophication effect, although biomass allocation and morphological traits were measured.

2. Materials and Methods

This study was conducted in the school of Environmental and Safety Engineering at Jiangsu University, Zhenjiang China, from September to mid-November 2019 (32.20° N, 119.45° E). Ramets of Wedelia trilobata (WT) and Wedelia chinensis (WC) were collected from the vicinity of the study site. These collected ramets of WT and WC were prepared in the seedling tray with sand as the growing medium. These trays were placed in a greenhouse that had a 25 ± 5 °C temperature with 60% relative humidity. The distilled water was supplied every day and Hoagland solution was supplied weekly. When these ramets had two fully expanded leaves, then the ramets were transformed into a plastic pot (12 cm diameter and 7 cm height) containing sand as a growing medium, and these pots were placed in a bin (80 × 40 × 20 cm) for the mesocosm experiment under greenhouse. There were two cultures used: monoculture and mixed culture of both species, with six replicates of each treatment. These ramets were allowed to be settled in these new habitats for one week, and then divided equally into two submergence and three nutrients groups, in order to stimulate the naturally occurring submergence and eutrophication in a wetland ecosystem. Submergence levels differed from water levels in the bins (7 and 14 cm, labeled as S1 and S2, respectively) so that the actual water level at which WT and WC were growing was 0 and 7 cm. Eutrophication levels were made according to the nutrient concentration in the Yangzi river [41]. There were three nutrient concentrations with Ck, 10- and 100-fold dilution of modified concentration respectively, as N1, N2 and N3. Submergence, nutrient concentrations and the plant culture method have been explained in Figure 1. There was a total of 108 pots. After applying treatments to each bin, tap water was added every day to keep the submergence level constant and renewal of the solution was done once a week. After four weeks of treatments, the plants were harvested.

2.1. Morphological Traits Measurement

Plant height and root length were measured with the help of a ruler at the end of the experiment. The number of leaves and nodes per plant were counted carefully. The leaf area of each treatment plant with six replicates was measured with the help of ImageJ software. The plants were oven-dried at ≤80 °C for 48 h to measure total biomass of each treatment plant; afterwards, plants were divided into leaves, stems and roots. We also calculated leaves mass ratio, stem mass ratio and root-to-shoot ratio of each treatment. Specific leaf area (SLA) was measured with leaf area to dry mass.
The plasticity index (PI) of plant height and root length of WT and WC under different submergence and eutrophication treatments were calculated by using the following equation [42,43]:
P I = Maximum Value Minimum Value Maximum Value
where maximum and minimum value represent the maximum and minimum values of plant height and root length of WT and WC under all treatments to determine plasticity indices of plant height and root length for different species and for different treatments, respectively. The value of PI ranged from 0 to 1, where 0 represents zero and 1 represents a higher PI.

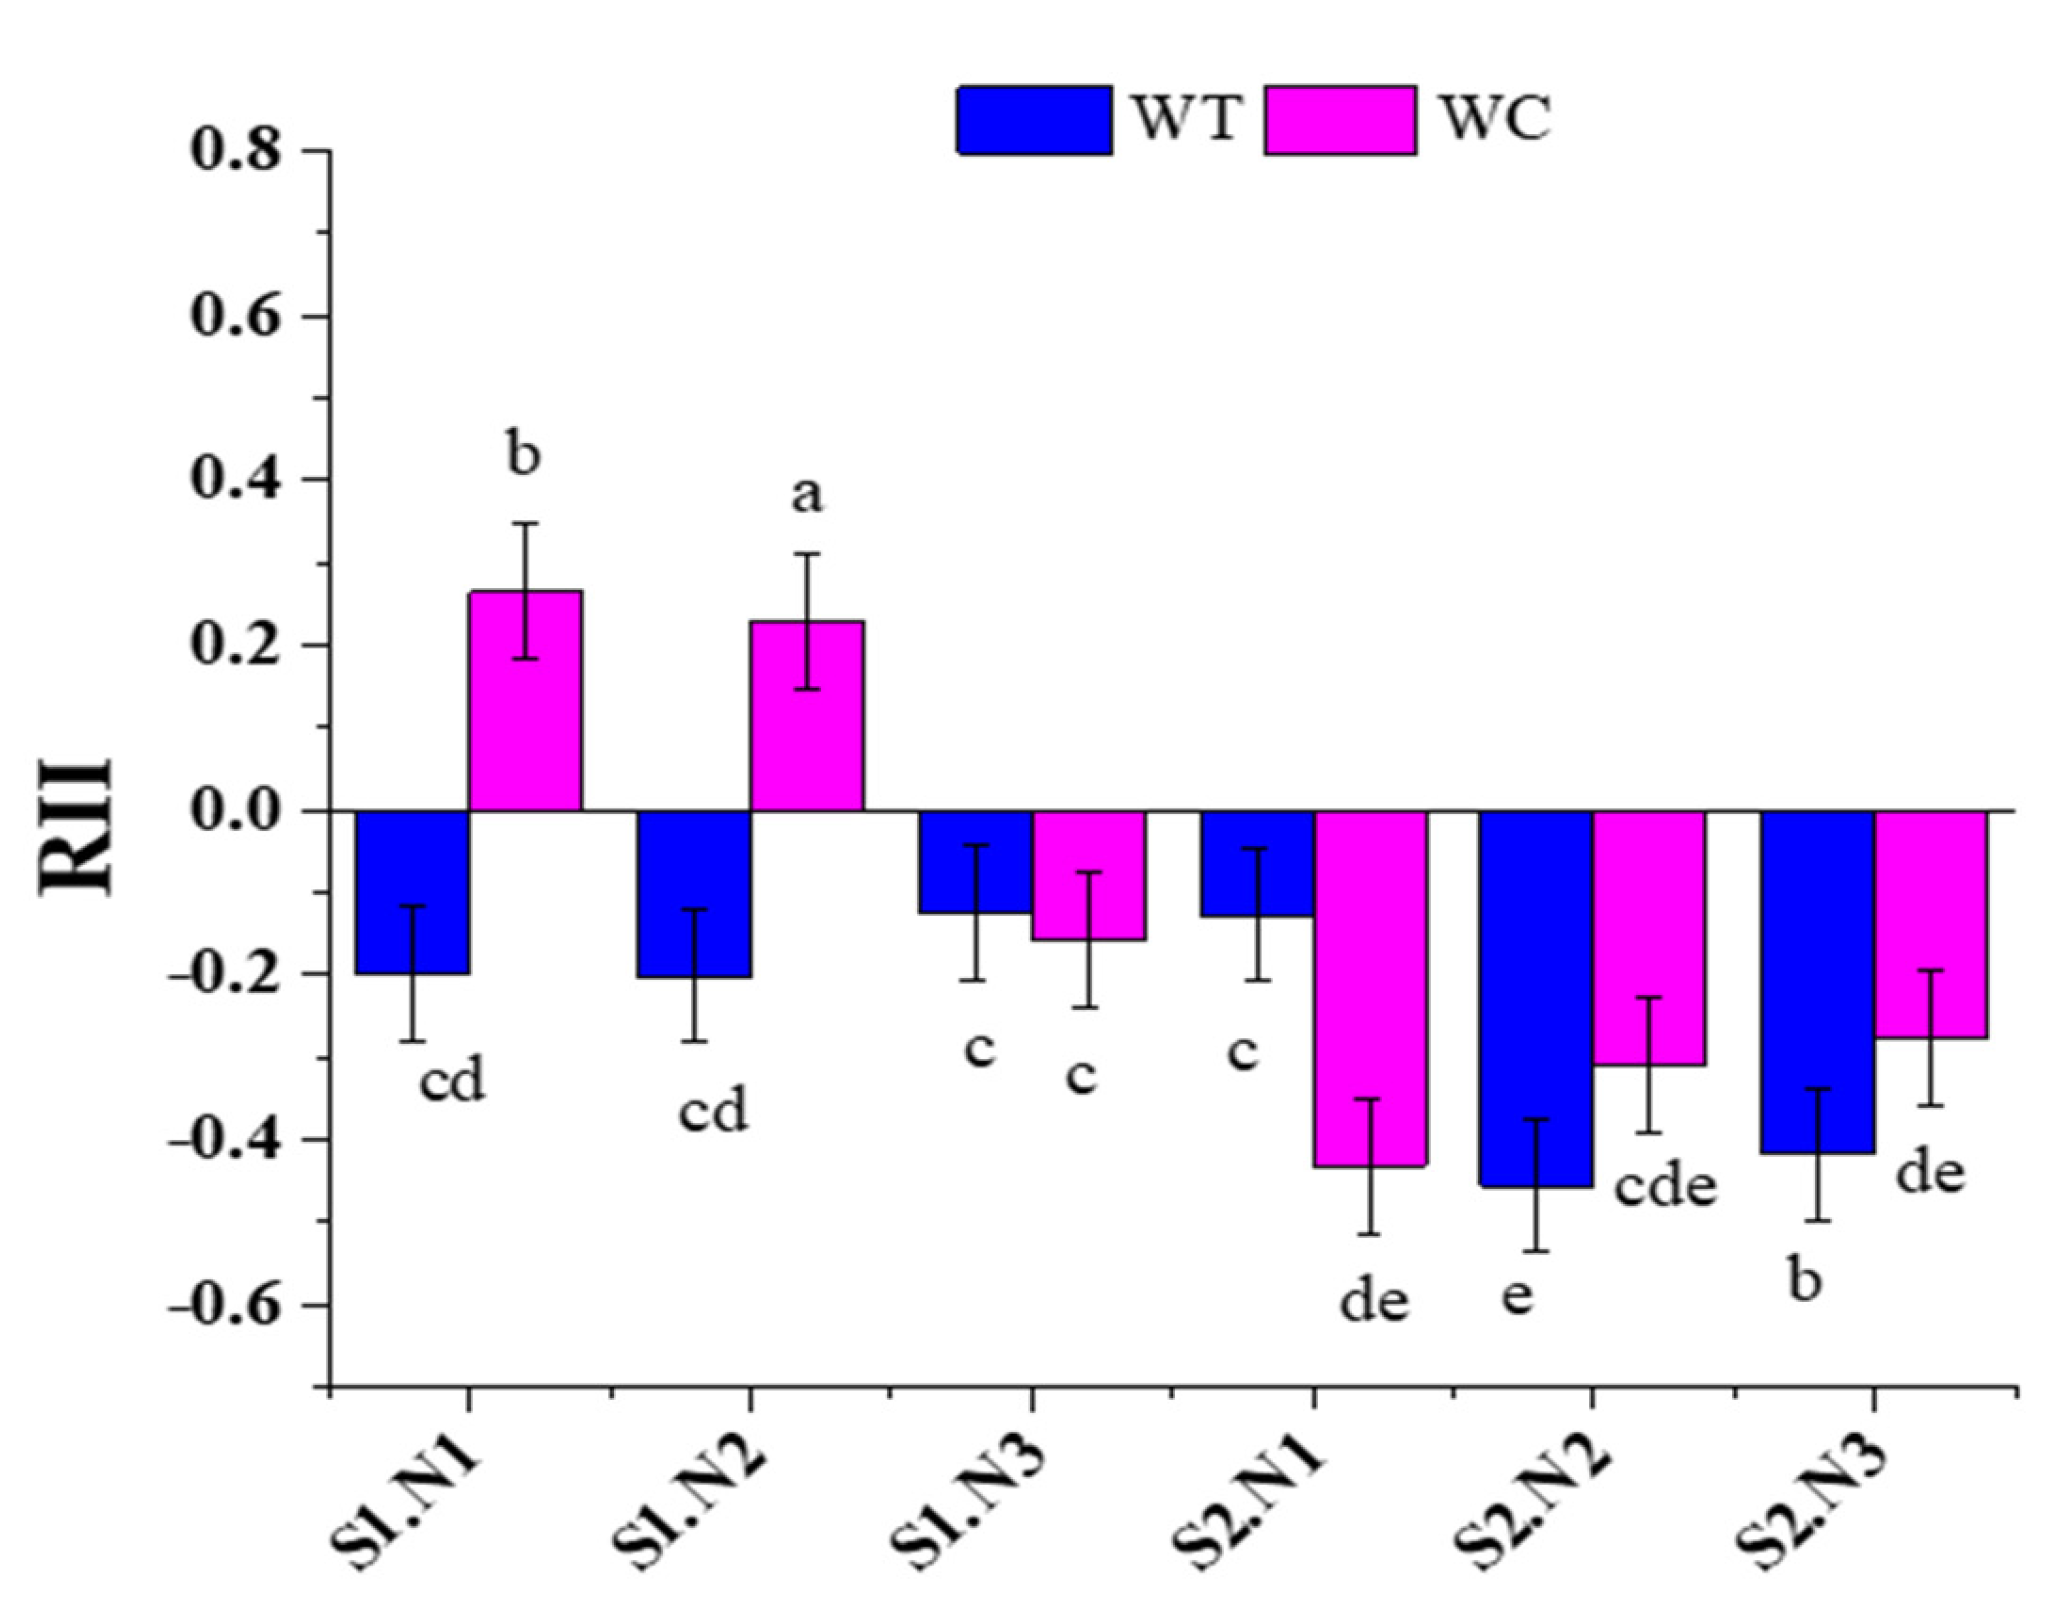
2.2. Relative Interaction Index

The relative interaction index (RII) between invasive and native competitor was measured according to Reference [44]:
RII = ( M c M i ) ( M c + M i )
where Mc is the mass of WT or WC under mixed culture and Mi is the mass of WT or WC in the one plant pots (monoculture). RII represents the interspecific interaction between invasive and native plant species. RII ranges from −1 to 1. If RII < 0, then interaction intensity has a negative impact, if RII > 0, then interaction intensity shows a positive impact on plant, but if RII = 0, then there is no impact of a competitor.

2.3. Statistical Analyses

Before analyses of the data, the normality and homogeneity of the variances of all data were checked with the help of the Shapiro–Wilk Normality test and Levene’s test. A three-way analysis of variance (ANOVA) along with submergence, nutrient and plant culture as the main factors, was performed to determine the main effects and interaction effects on plant morphological traits, total biomass accumulation and total biomass allocation. Furthermore, a post hoc Student–Newman–Keuls test, p < 0.05, was used for multiple comparison to measure significant differences between treatments. A one-way ANOVA was used to assess the interactive effect of submergence and nutrient levels on morphological traits, total biomass accumulation and total biomass allocation. All analyses were conducted in SPSS (Version 22.0, IBM, USA) and graphs were made in the software Origin pro9.

3. Results

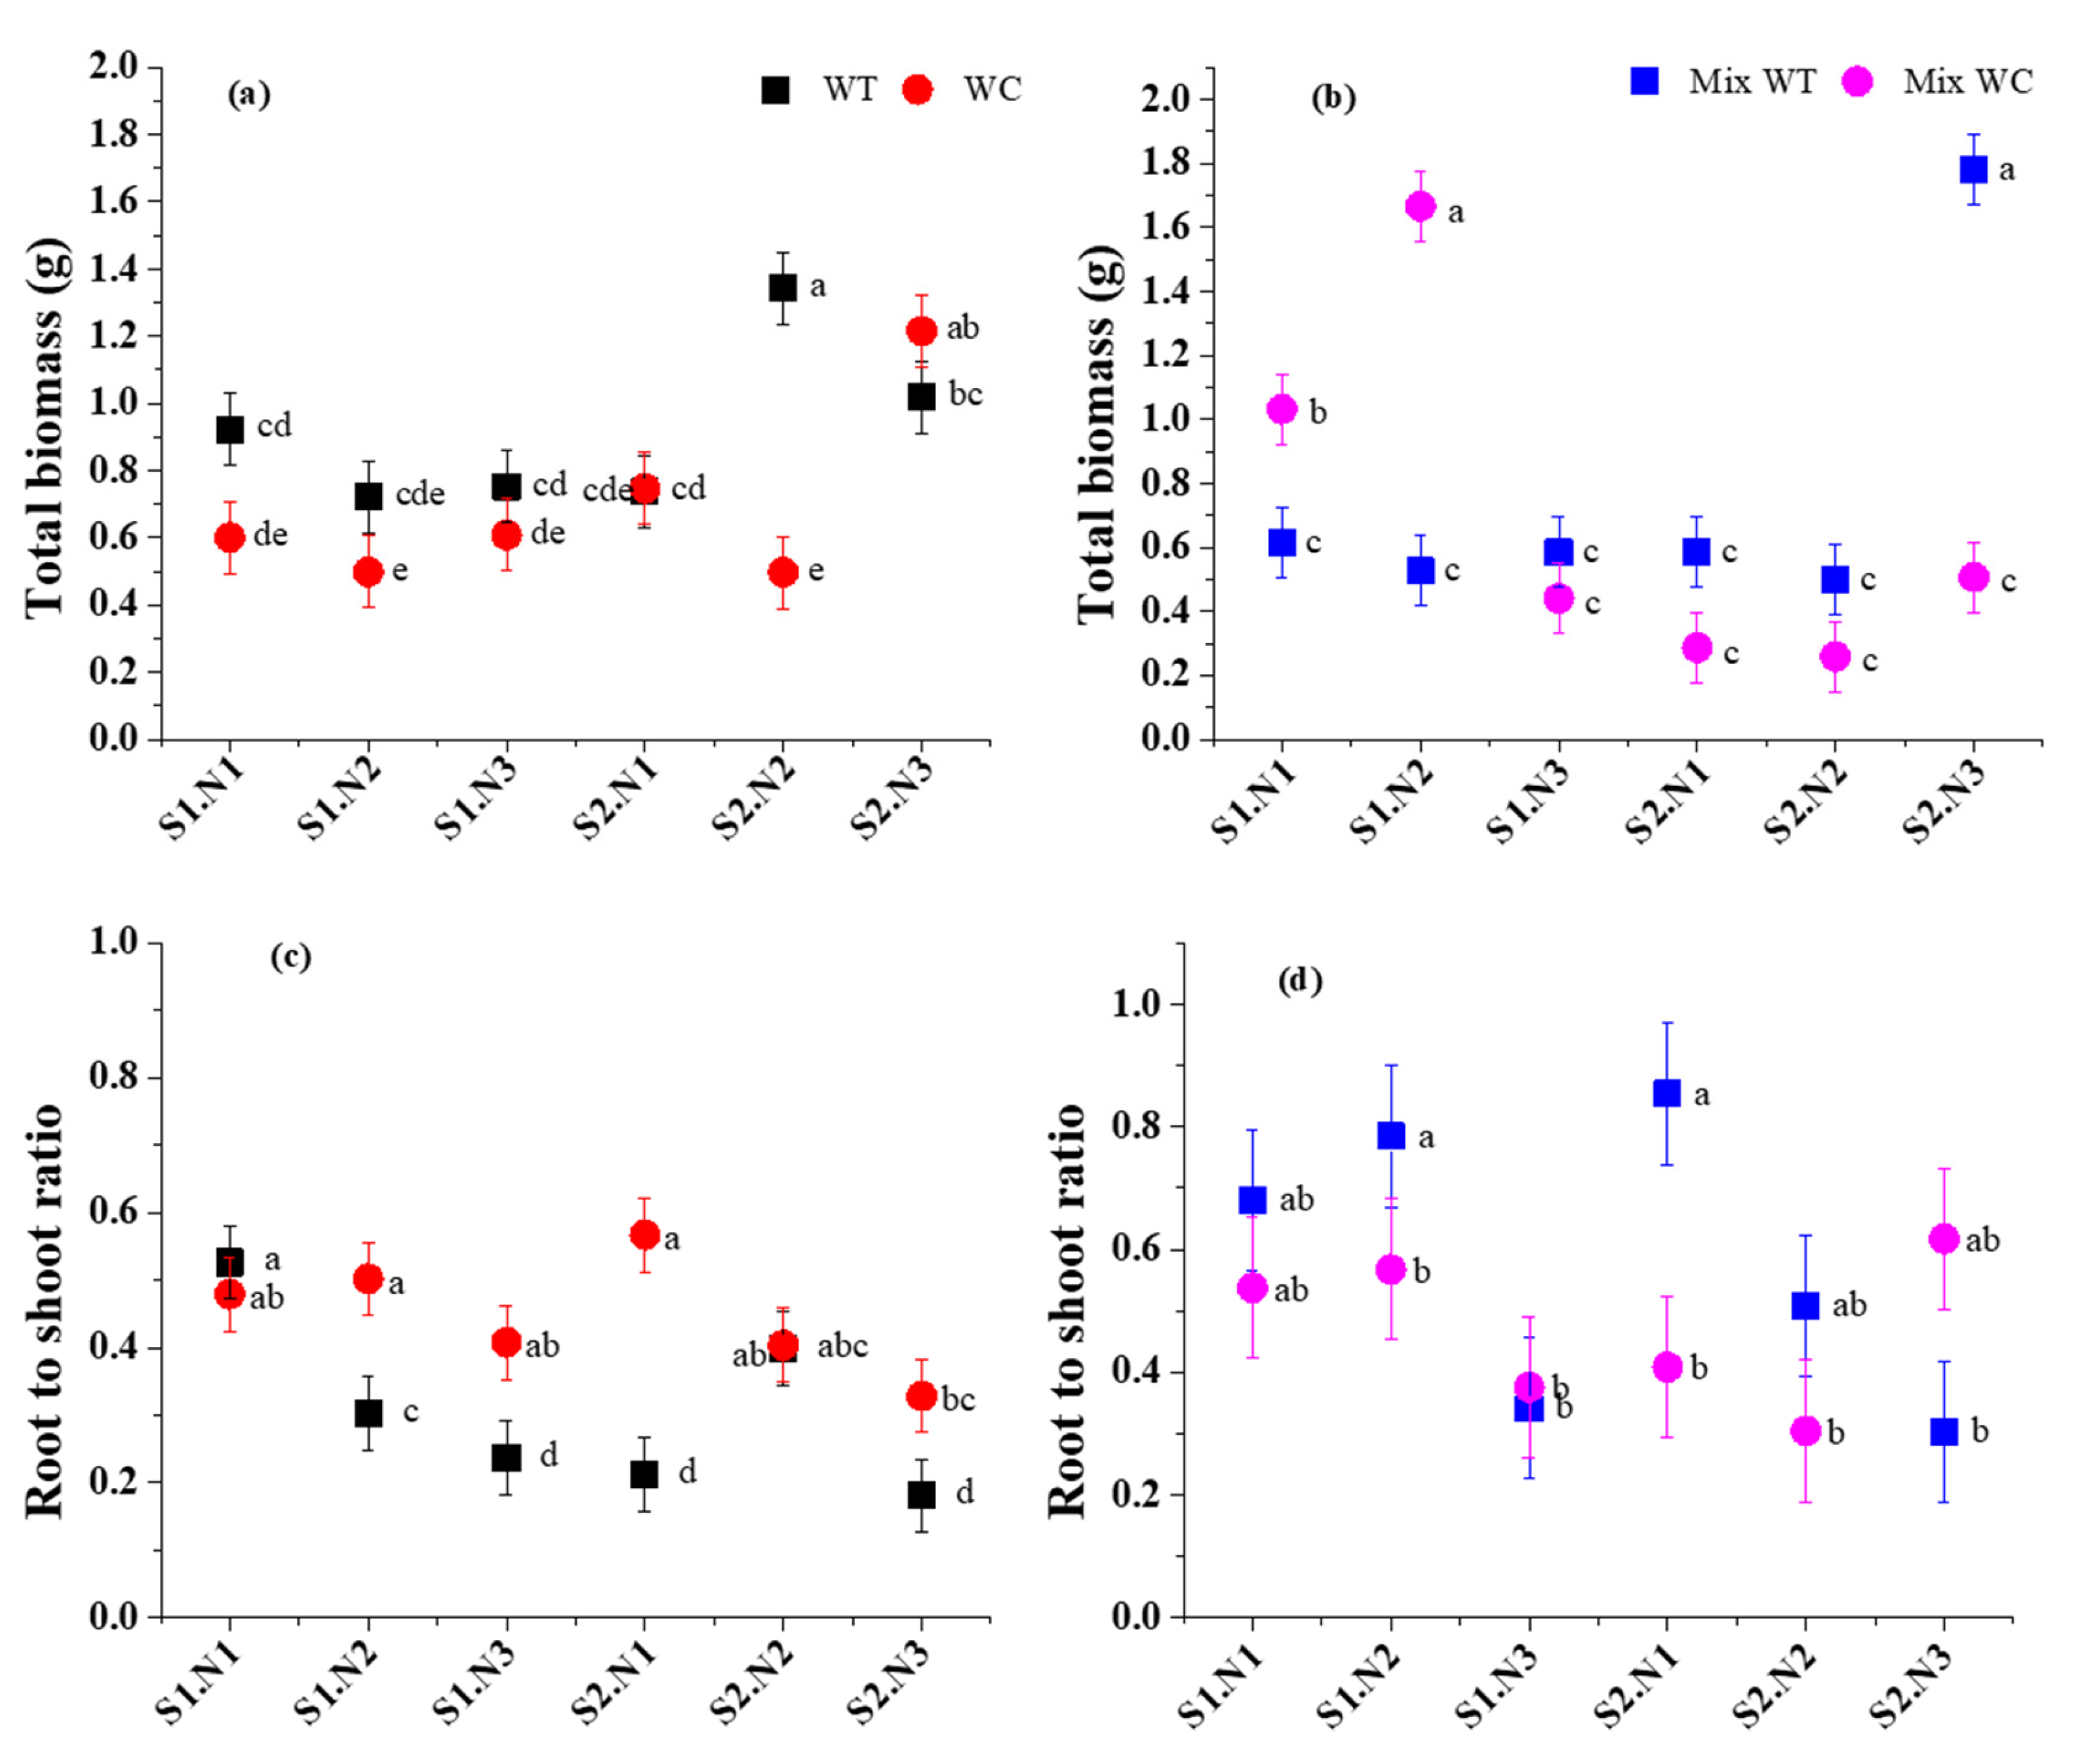
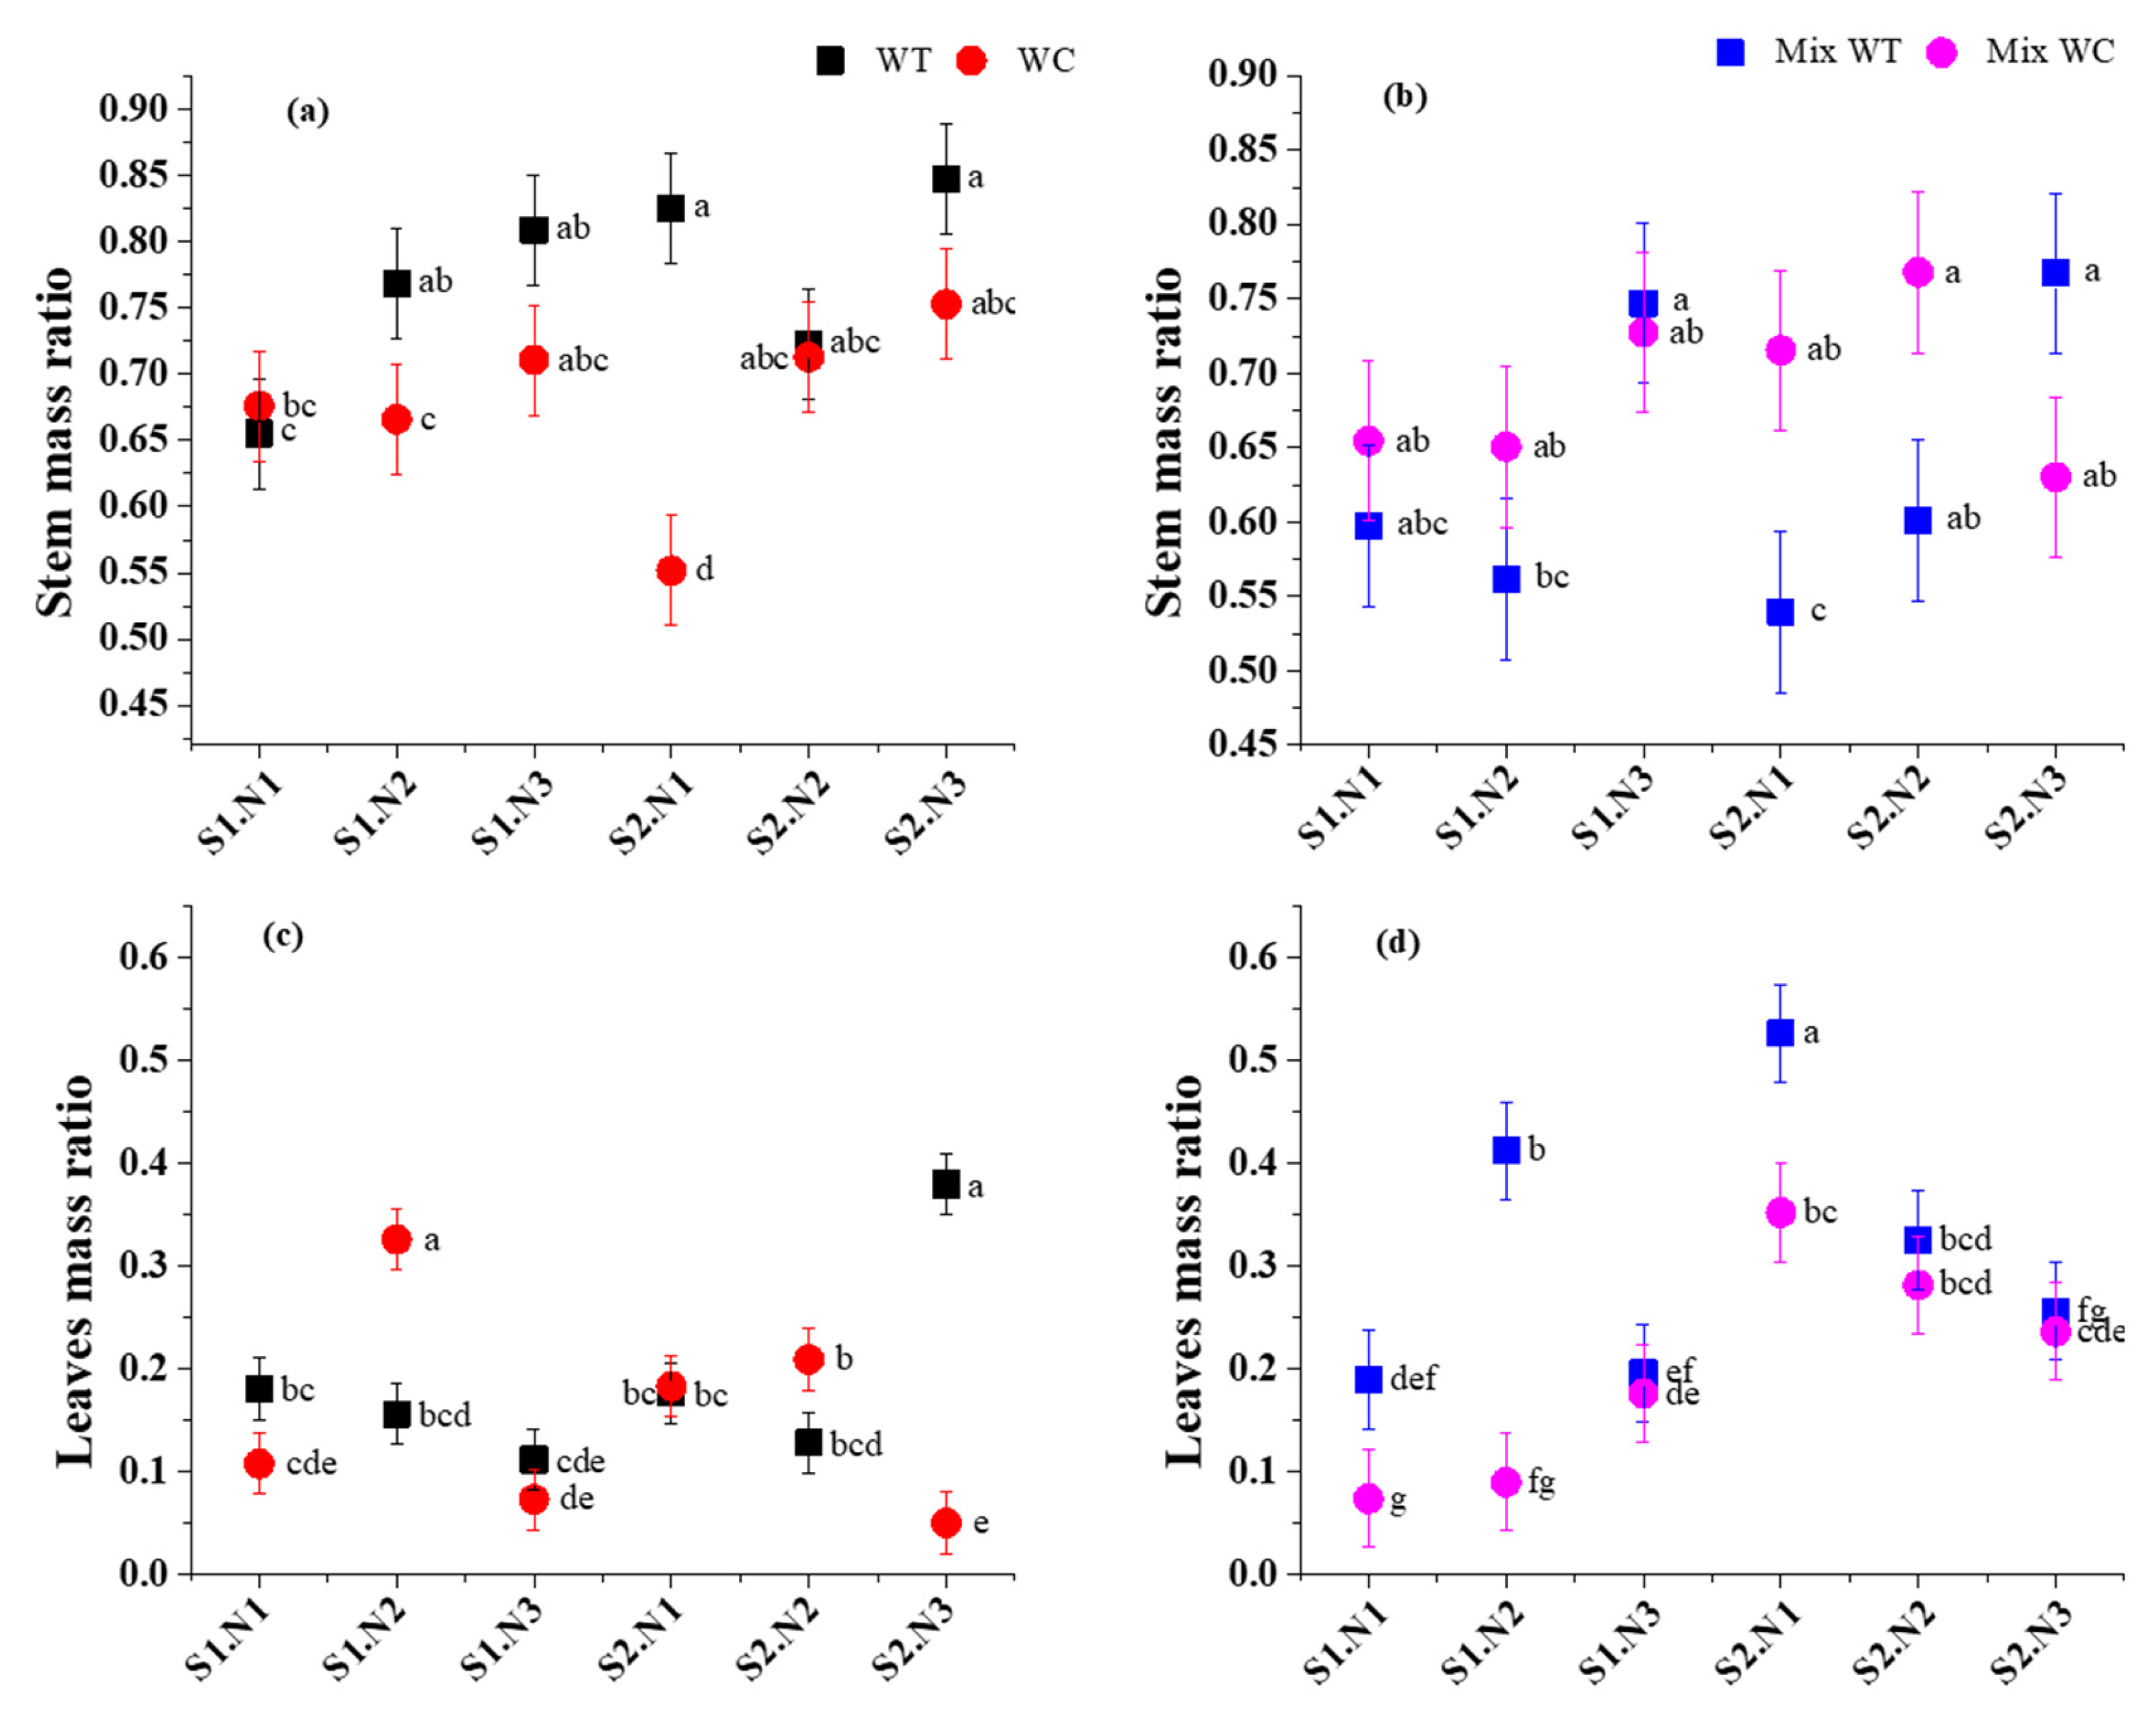
3.1. Biomass Accumulation and Allocation

Plants of both species survived under submergence and nutrient concentrations. Submergence (S), nutrient (N) and culture (C) had different effects on different traits of both plant species. S had non-significant results on total biomass (Table 1, F = 1.797, p > 0.05) but N and C and the interactions S × N × C were significant (Table 1, F = 16.347, p < 0.01). In monoculture, total biomass of WT was significantly higher than WC in all submergence and nutrient treatments (Figure 2a), but under low submergence and low nutrients (S1.N1 and S1.N2), total biomass of WC was higher than WT, while under high submergence and all nutrients levels (S2.N1, S2.N2 and S2.N3), total biomass of WT was higher than WC. This indicated that increasing submergence along with nutrients made WT more dominant (Figure 2b).
For biomass allocation, the effects of S, N and C on the root-to-shoot ratio were independent (Table 1, p < 0.05). Their interaction, S × N × C, was significant (Table 1, F = 6.120, p < 0.01) but the interaction S × N was non-significant (Table 1, p > 0.05). The root-to-shoot ratio of WC was higher than WT in monoculture in every treatment (Figure 2c), while in mixed culture, higher submergence with low nutrients (S2.N2, S2.N1) and lower submergence with higher nutrients concentration (S1.N3), the root-to-shoot ratio of WT was higher than WC (Figure 2d).
However, S and S × N had a non-significant effect on stem mass ratio (Table 1, p > 0.05) but N, C and their interaction, N × C, had significant effects on stem mass ratio (Table 1, p < 0.01). However, the combined effect of S × N × C was significant on stem mass ratio (Table 1, F = 5.003, p < 0.01). The stem mass ratio of WT was higher than WC in monoculture because of the fast growth of WT below water. In mixed culture, the stem mass ratio of WT was higher in both submergence levels along with high nutrient concentration (S1.N3, S2.N3). However, WC had a higher stem mass ratio in low submergence along with low nutrients (S1.N1) (Figure 3b), illustrating that low submergence and nutrients made WC more dominant than WT in competition.
S, N, C and their interaction, S × N × C, had significant effects on leaves mass ratio (Table 1, p < 0.01). The leaves mass ratio of WC was higher at both submergence and low nutrient concentration levels (S1.N2 and S2.N2) but lower at higher nutrient concentration along with both submergence levels (S1.N3 and S2.N3). This was because increasing nutrients and submergence reduced the leaves mass ratio of WC, but opposite results were found under the same treatment for WT in monoculture (Figure 3c). Under competition, WT had a higher leaves mass ratio in all treatments of submergence and nutrients compared to WC (Figure 3d). According to these results, mass allocation of WT was higher than WC in higher submergence and higher nutrients levels.

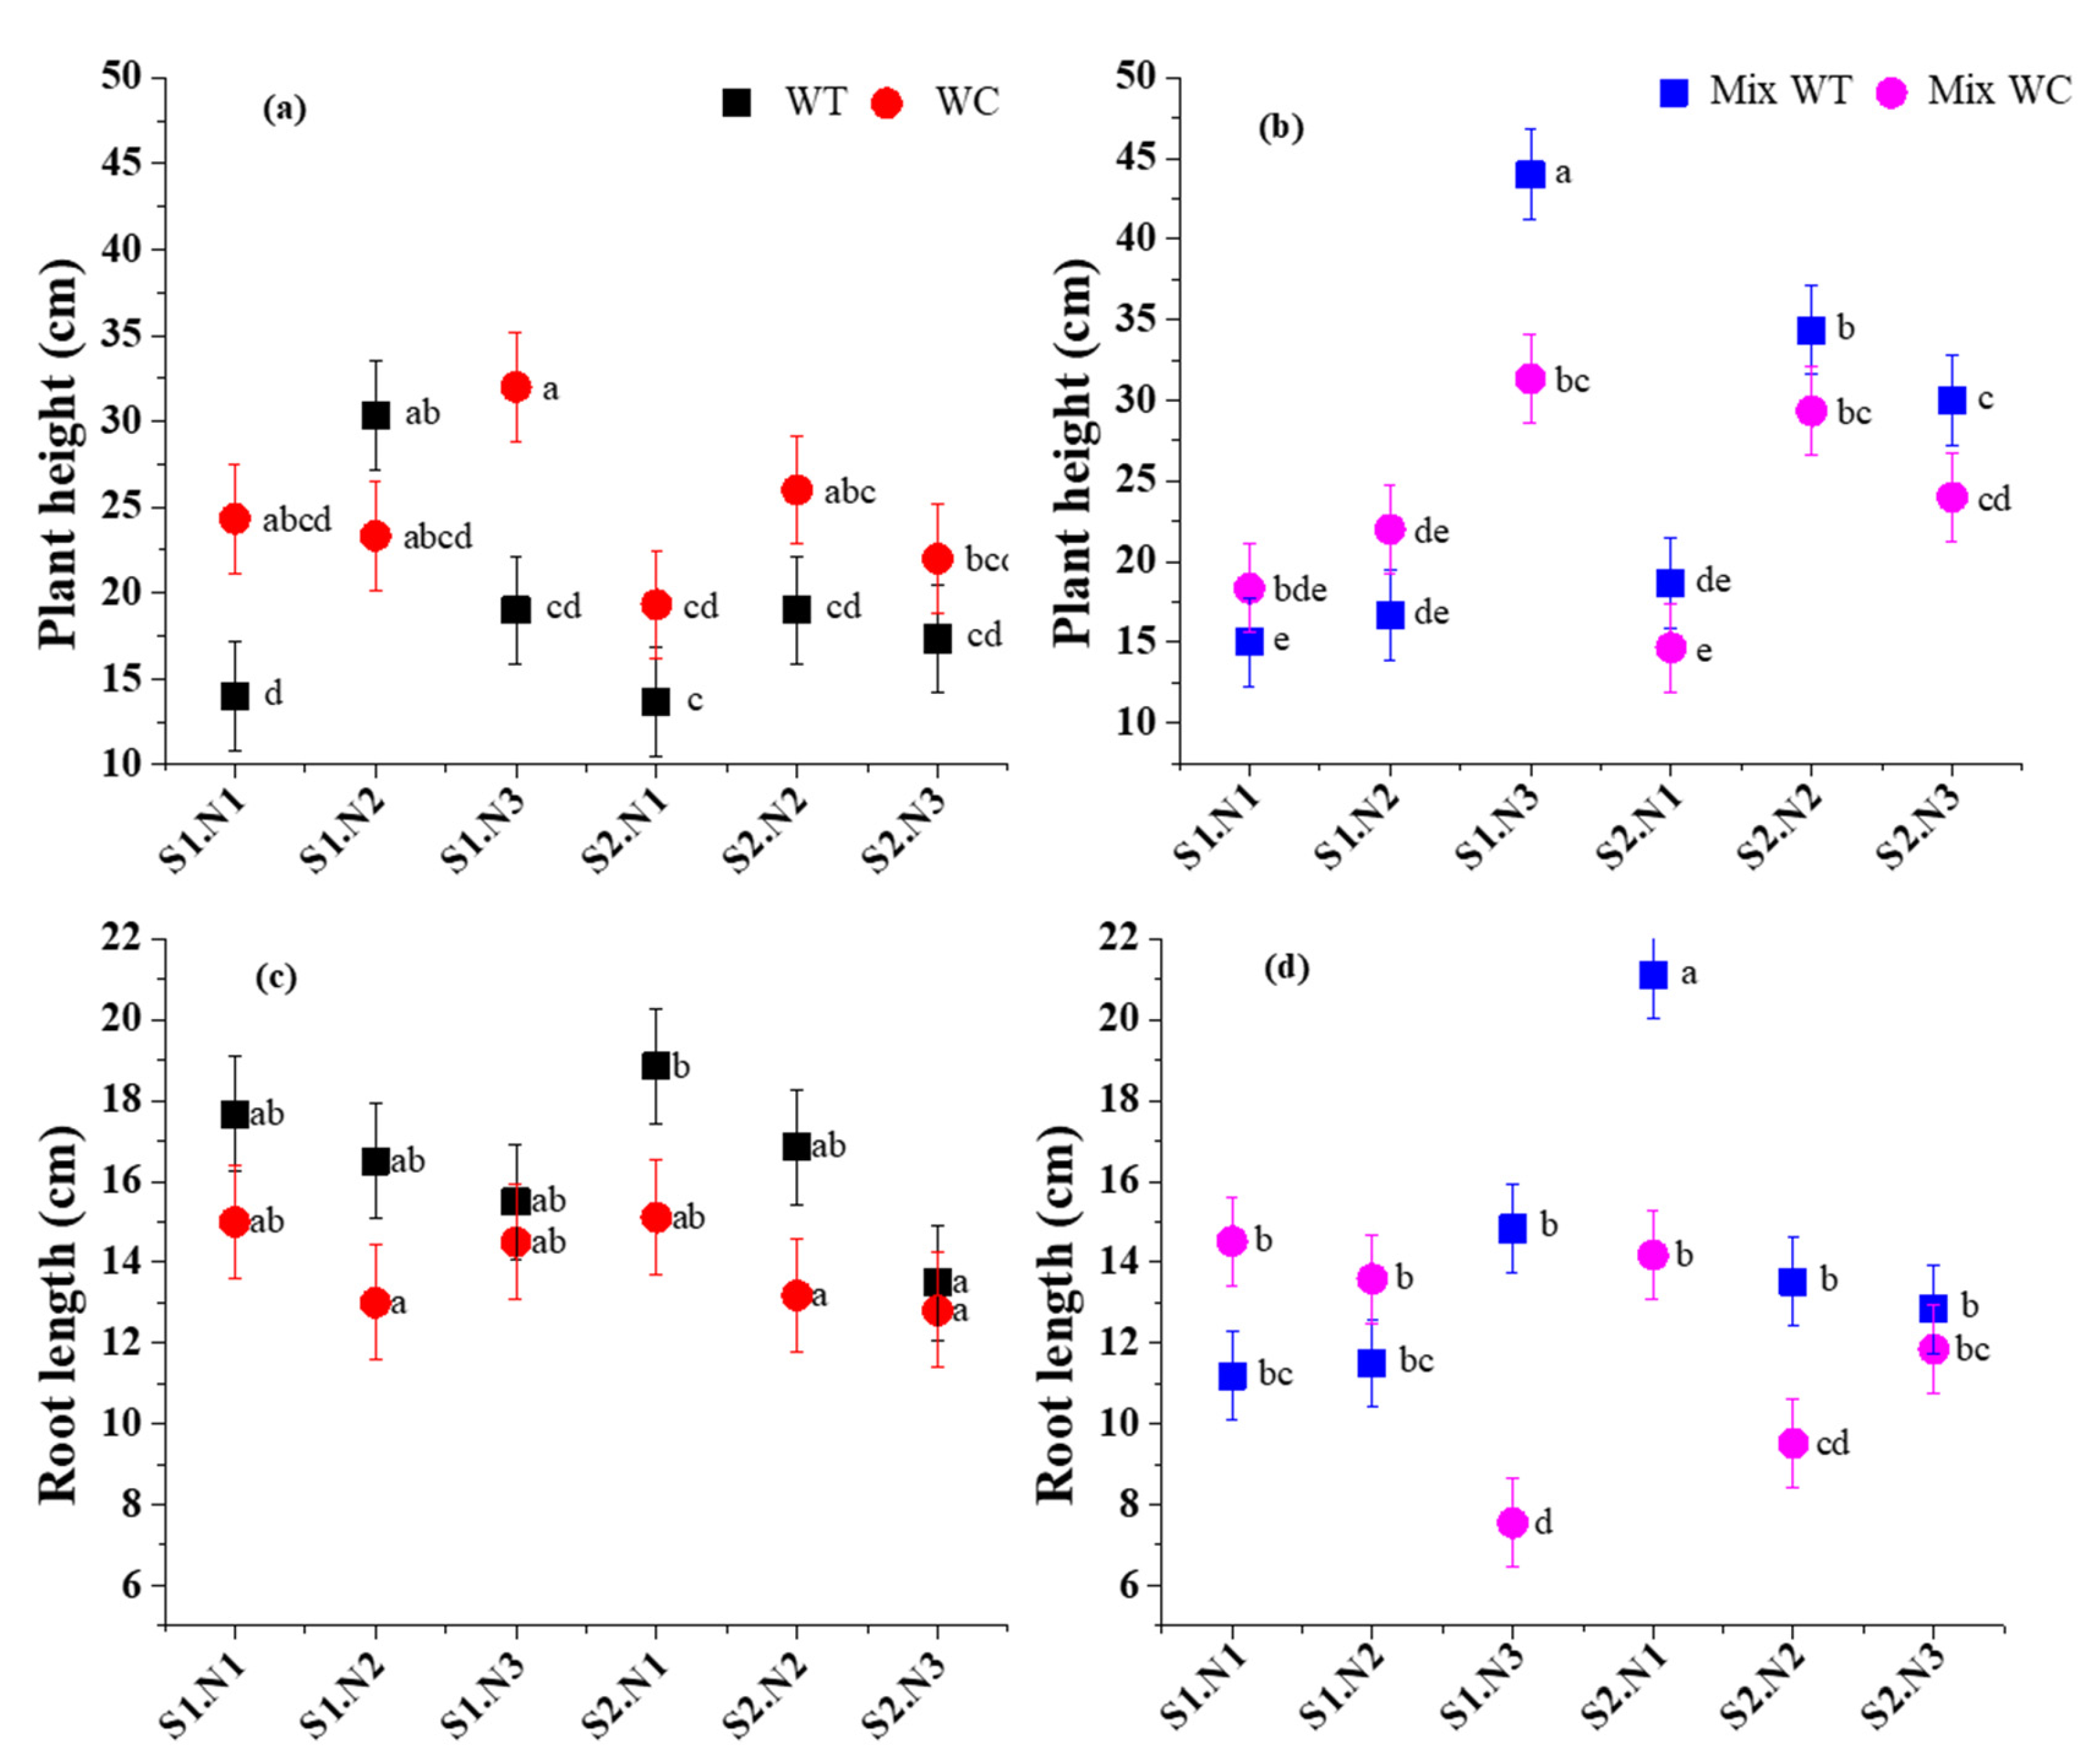
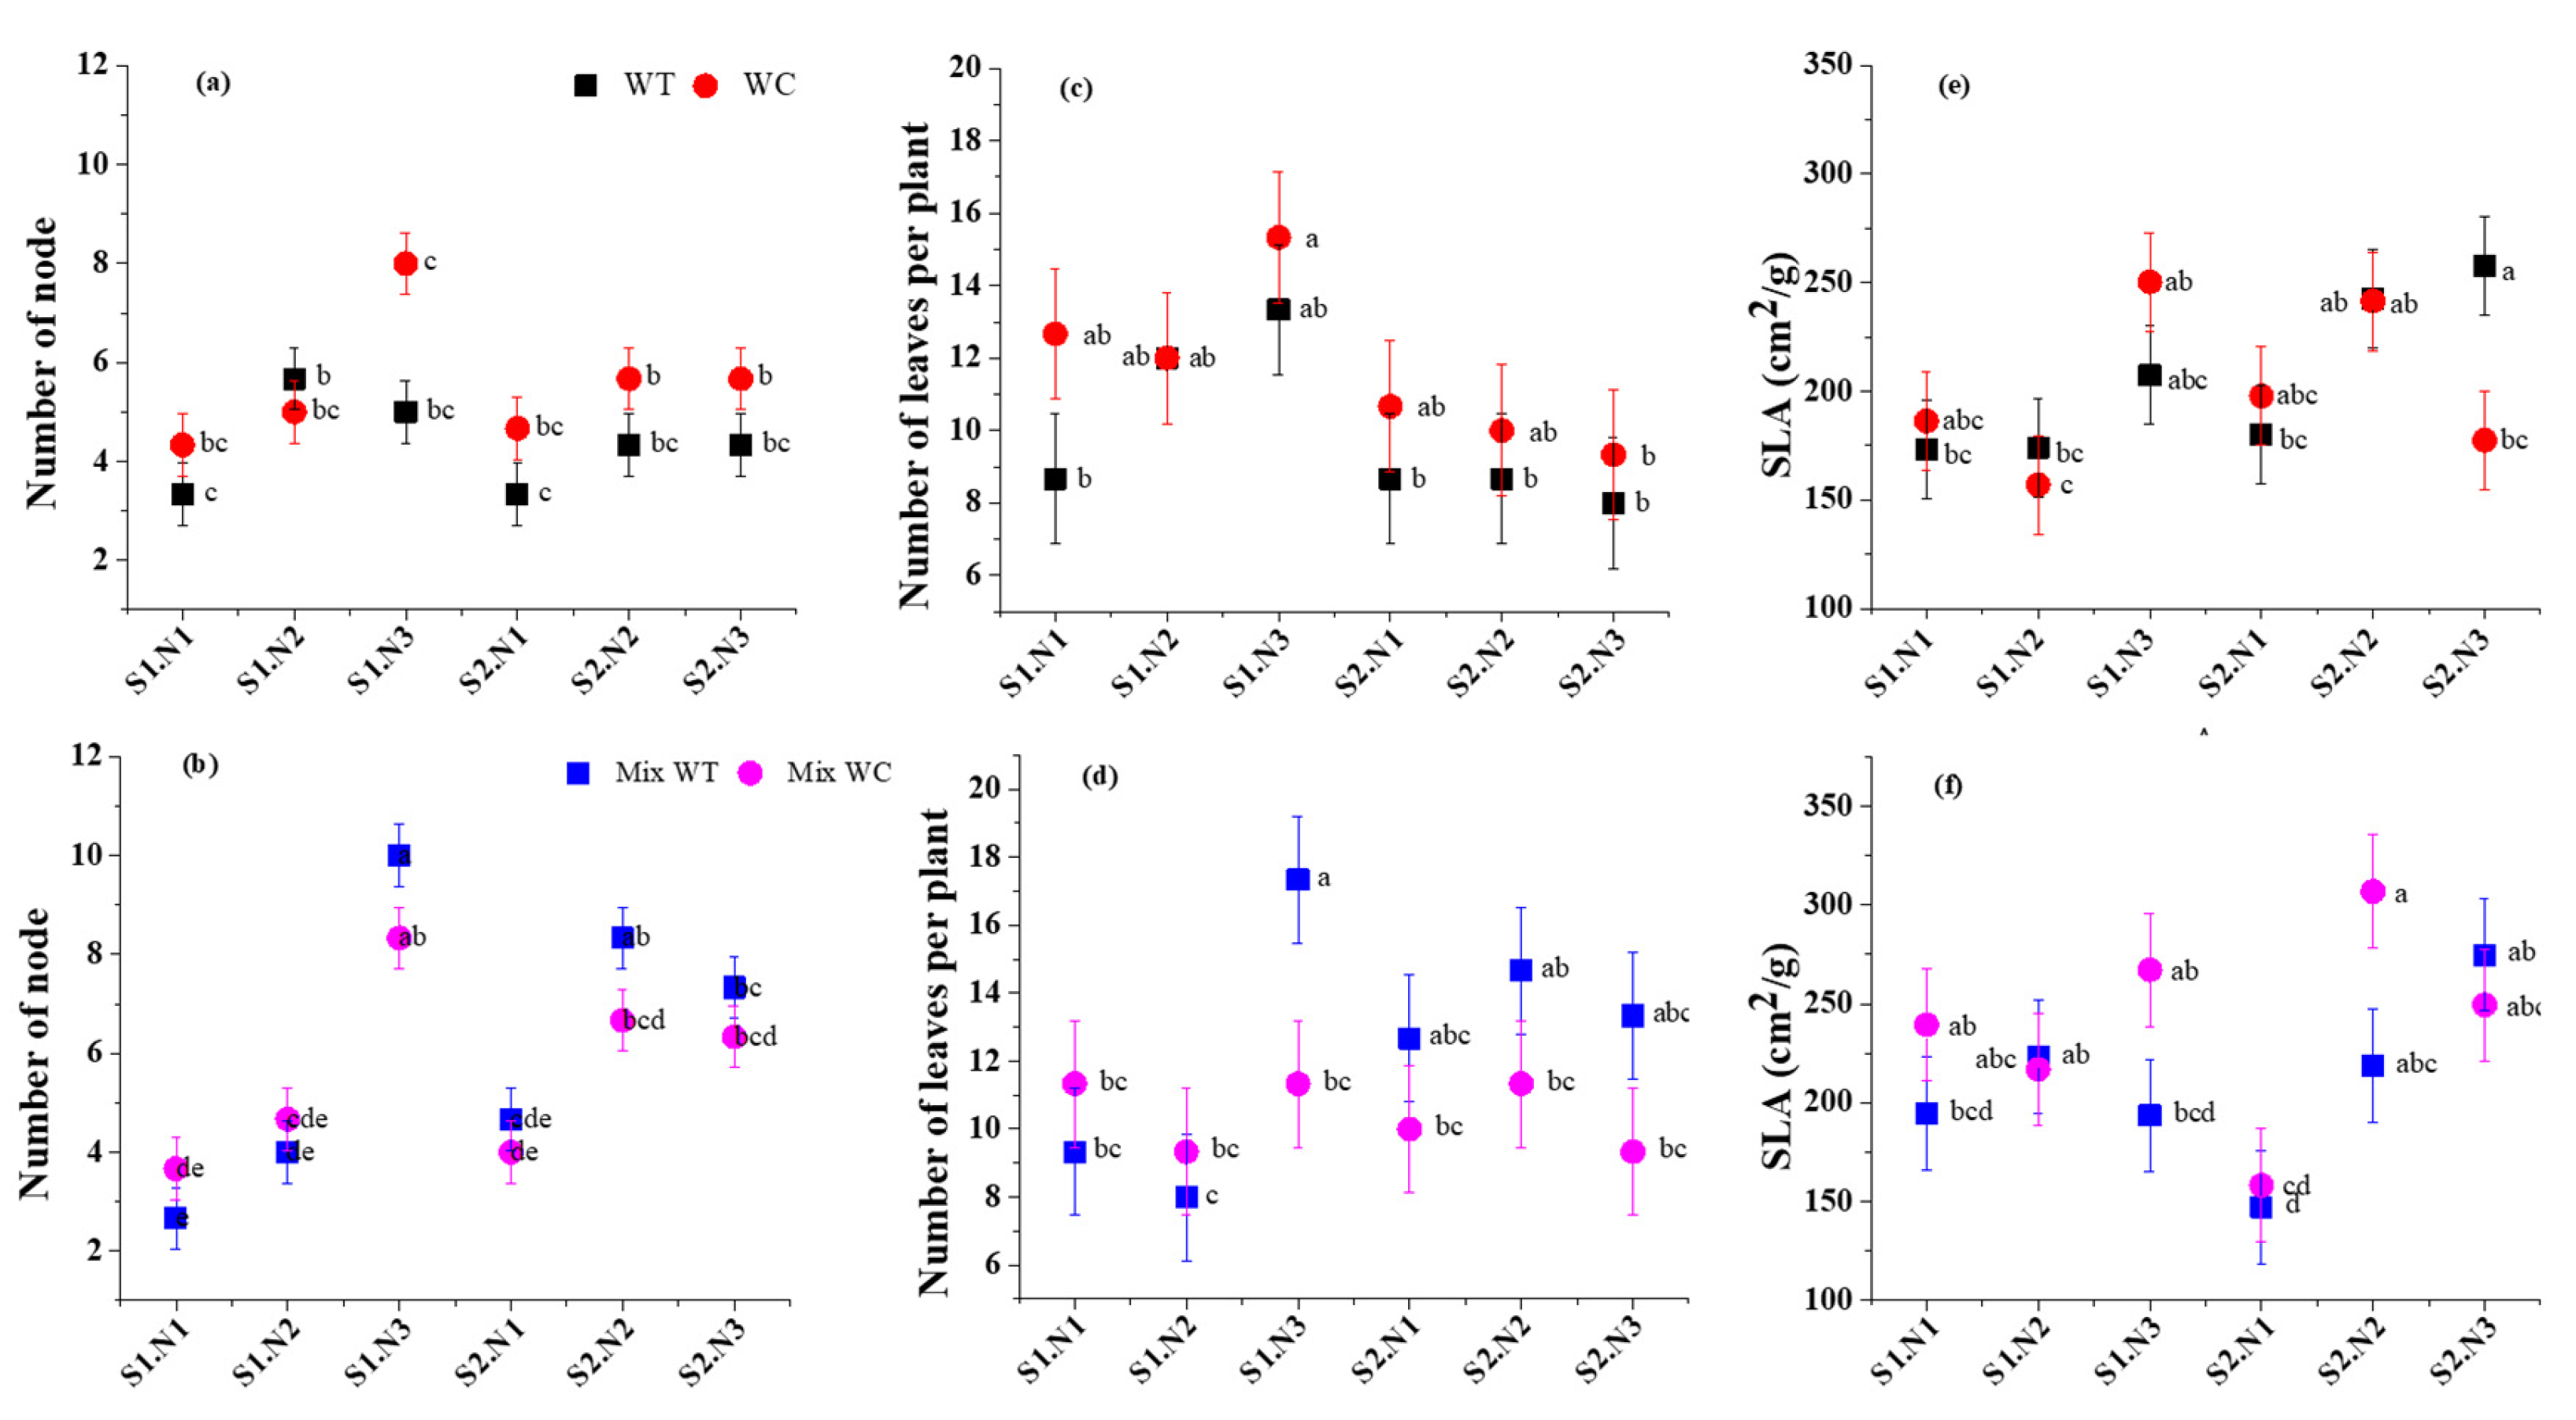
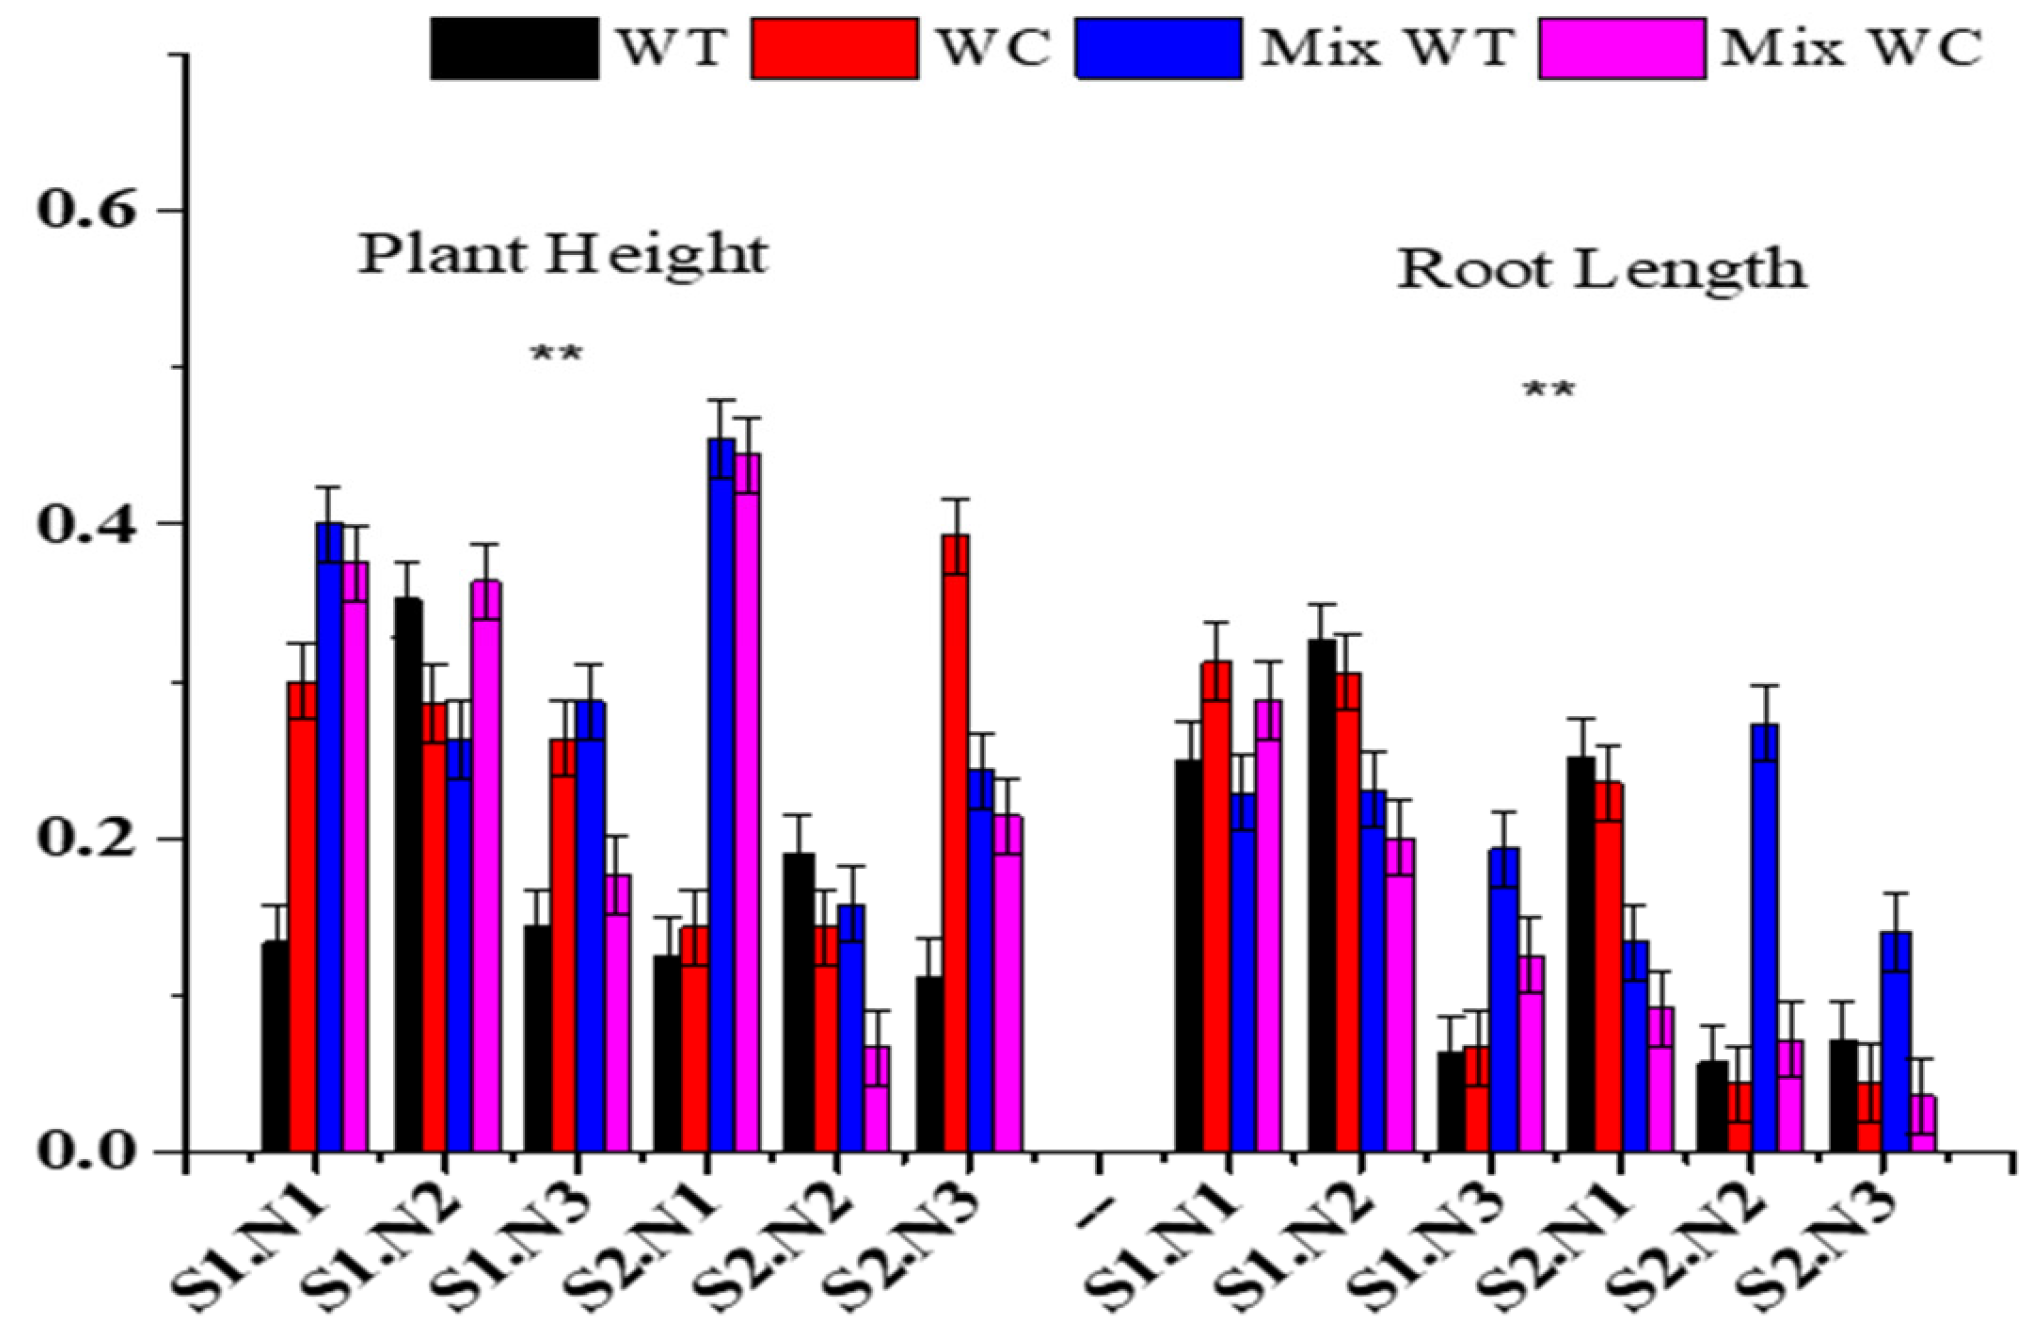
3.2. Morphological Traits

S, N, C and their interactions, S × N, S × C, N × C and S × N × C, were significant (Table 2, p < 0.05). Plant height of WC was more than WT in monoculture under high submergence and high nutrient (S1.N3). While under low submergence and low nutrients conditions (S1.N2) plant height of WT was higher than WC (Figure 4a). Plant height of WC in mixed culture was more than WT in low submergence along with low nutrients (S1.N1, S1.N2). Under low submergence with high nutrients (S1.N3) and high submergence with all nutrient concentrations (S2.N1, S2.N2 and S2.N3), WT has more height than WC because increasing submergence and high nutrients make WT more destructive than WC under competition (Figure 4b).
The root length of both species was not affected by S but was effected by N and C (Table 2, p > 0.05, p < 0.05), while their interactions, S × N and S × N × C, had a significant effect on both plant species (Table 2, p < 0.01). Root length of WC under competition was higher than WT in low submergence along with low nutrients (S1.N1 and S1.N2), while for the rest of all other levels, WT root length was taller than WC due to higher nutrients along with submergence, which facilitate WT (Figure 4d). In monoculture, root length of WT was higher, indicating more biomass allocation below-ground to make it more successful in submergence and high nutrient conditions (Figure 4c).
Submergence had no effect on the number of nodes but nutrient and culture had significant results (Table 2, p > 0.05, p < 0.01). Their interactions, S × N and S × N × C, also had significant findings for number of nodes (Table 2, F = 3.676, p < 0.01). WC had a greater number of nodes within monoculture, under high submergence and high nutrient (S1.N3). While under low submergence and low nutrients conditions (S1.N2) number of nodes of WC was not higher) (Figure 5a).
In mixed culture, WT had more number of nodes than WC in all treatment but only under both submergence and low nutrients (S1.N1, S2.N2), WC had more nodes than WT (Figure 5b).
S, N and C had independent effects on number of leaves per plant but their interaction, S × N × C, had no effect (Table 2, F = 1.619, p > 0.05). Monoculture WC had a greater number of leaves per plant compared to WT (Figure 5c). Mixed culture WT had a greater number of leaves per plant except in both submergence and low nutrients (S1.N1 and S2.N2) (Figure 5d). According to the results, submergence and nutrient richness helped both species to grow fast, but under competition, WT gets more benefit than WC.
The interactions of S × N and S × N × C had significant effects on specific leaf area (SLA) of both plant species (Table 2, p < 0.01) but independently, S has no effect on SLA (Table 2, F = 3.617, p > 0.05). SLA of both plant species enhanced with increasing submergence and amount of nutrients. For both monoculture and mixed culture, mostly, SLA of WC was higher than WT but under high submergence along with high nutrients (S2.N3), WT had a higher SLA (Figure 5e,f).

3.3. Plasticity Index

Plasticity index of plant height was significantly affected by N (F = 9.489, p < 0.01) and the interaction of S × N (F = 8.454, p < 0.01) but S (F = 0.033, p > 0.05) and C (F = 1.705, p > 0.05) had no impact, while root length plasticity index was significantly affected by S, N, C and their interaction (p < 0.01). Plasticity indices of plant height and root length of both plant species were significantly different in every treatment (Figure 6). Under monoculture, the plasticity index of plant height was higher for WC compared to WT, but for the plasticity index of root length, WT was higher than WC due to more below-ground biomass allocation. For treatments with high nutrients and both submergence levels like S1.N3, S2.N2 and S2.N3, WT showed more plastic than WC and this made WT more successful under competition in nutrient-rich and submergence conditions (Figure 6).

3.4. Relative Interaction Index

The relative competition interaction index of both species was significantly affected by S (F = 8.290, p < 0.01) and the interaction of S × N (F = 3.876, p < 0.05) but not significantly by N (F = 0.013, p > 0.05). Competition interactions were mostly negative for both of the species (Figure 7). The competition intensity of both species was significantly increased with enhancing submergence and nutrients. The competition intensity of WT was higher than WC in high submergence and high nutrients.

4. Discussion

4.1. Biomass Response under Submergence and Eutrophication

The results of this study confirmed our hypothesis, that increasing nutrient concentrations can promote the growth of both the plant species; however, this occurred only when the amount of nutrient concentrations attained high eutrophic status [27]. Submergence (S) along with low nutrients concentration (S1.N1 and S1.N2) decreased the growth of WT under mixed and mono culture compared with WC; however, its inhibitory effects were much greater than the elevation effects of enhancing nutrient concentrations along with submergence (Figure 2). Similar results were found in previous studies [23,24,30]. While it can be realized that little eutrophication and a low submergence level would not promote the growth of WT, because invasive plant species, especially clonal plants, like to grow in nutrient-rich habitats [45], that is why high amounts of eutrophication and submergence would increase the growth of WT under mono and mixed culture (Figure 2).
Biomasses of many plants was increased or maintained under submergence [46] (Table 1, Figure 2) because plants used the quiescence technique to tolerate submergence [26]. WC maintained a higher root-to-shoot ratio in all treatments under monoculture, which was the plants strategy to cope with submergence and eutrophication [36], while WT maintained a better stem mass ratio under all treatments in monoculture, because adventitious roots were a tolerance stratagem of WT to survive these conditions and also provided structural stability to maintain sexual reproduction [7,24]. Total biomass of both species was increased under both submergence and three nutrient levels’ interaction because more than 65% of plants of both species were above the water surface due to plant height elongation [47]. Submerged plants have less biomass compared to plants above the water surface, which agreed with our finding [48]. Submergence along with nutrient concentrations increased biomass allocation, plant height and compensatory growth of invasive plant species, when nutrient concentrations reached eutrophication [24,49,50]. WT showed its destructive behavior under competition, as biomass, root-to-shoot ratio and stem mass ratio of WT was higher than WC under higher levels of submergence and nutrients (S2.N3), while with low submergence along with low nutrients (S1.N1, S1.N2), WC had higher growth (Figure 2 and Figure 3). This demonstrated that WC has the ability to bear with a low shortage of oxygen that was created due to submergence and eutrophication under competition [51]. It was also indicated that low nutrient concentration does not alleviate the effect of submergence particularly on invasive plant species [30], while increasing nutrient concentrations and submergence gave more success to WT with a boost in its invasion because growth rate, photosynthetic capacity and phenotypic plasticity of invasive plant species were usually increased more intensively than those of native hydrophytes under nutrient-rich water [52,53].

4.2. Morphological Traits under Submergence and Eutrophication

Submergence (S) did not have significant effects on most of the morphological traits like root length, number of leaves per plant and SLA (Table 2, Figure 4 and Figure 5), because submergence created a stressful environment due to which both native and invasive plant species suffered [24]. However, nutrients (N) and their interactions, S × N, S × N × C, had significant effects on the morphological traits of both species. This result agrees with our hypothesis, and several researchers have found that increasing nutrient concentrations overcomes the stress of submergence and encourages plants to grow under these conditions, especially for invasive plant species [7,23,27]. Plant heights of both the species were increasing under submergence and nutrients treatments (Table 2, Figure 4a,b). Plant height increment was the plants’ response to submergence and high nutrients, to restore contact between stem, leaves and air above the water surface, which was the plants’ approach to deal with submergence and eutrophication [24,27]. If the plant fails to reconnect with air, that certainly gives rise to carbohydrate depletion [54] and finally, causes the death of the plant [55]. Therefore, plant height increment under submergence and high nutrients conditions was seen to be a favorable trait of both species under these environmental conditions. In monoculture, WC had a higher number of nodes, leaves per plant and higher SLA compared with WT, but within treatments, WC had higher morphological traits at S1.N2, representing zero submergence (water surface equal to pot height) along with high nutrients that make WC successful, but an increasing submergence level along with nutrients decreased the growth of WC (Figure 4 and Figure 5). This finding indicates that WC could bear oxygen deficiency and maintain its growth when it was growing alone but within competition, WC growth reduced because WT increased its below-ground biomass to capture the resources that cause two effects on WC, with one being oxygen deficiency and the other competition [27]. Number of nodes and leaves per plant were decreased with increasing submergence and nutrient concentrations of both species (Figure 5). It was consistent with the results that submergence and eutrophication reduced the number of nodes and number of leaves per plant [24,27]. Under interspecific competition, number of nodes and leaves per plant of WT was higher than WC at high submergence and high nutrients levels because of the allelochemicals’ effect that reduced the growth of the neighboring plant [21].
Plant height of WC was higher under monoculture because S × N gives benefit to its fast growth, but in mixed culture, WT was taller than WC (Figure 4) due to higher phenotypic plasticity and the negative effect under the competition interaction index (Figure 6 and Figure 7). High nutrients and submergence level gave the advantage to WT under competition because of higher resource acquisition ability and increased below-ground biomass along with the allelochemicals’ effect [56]. Taller plants and longer roots made WT more dominant under higher submergence and nutrient levels (S2.N2, S2.N3) because WT creates oxygen deficiency [57]. Shorter height of WC under competition did not allow for easily regaining contact with air. This situation caused photosynthesis limitation [48], and also serious carbohydrate depletion [54]. The number of nodes, leaves per plant and SLA of WT under competition were higher in high submergence and high nutrients (S2.N2 and S2.N3) (Figure 5) because of the high plasticity index [27]. However, faster growth rate, photosynthetic capacity, metabolism enzyme activity, nutrients assimilation and higher phenotypic plasticity of many invasive plant species give a benefit in nutrient-rich waters over those of native hydrophytes [53,58]. High nutrients enhance biomass accumulation, compensatory growth, SLA [49,59] and increase total biomass, shoot length and total number of leaves per plant that increase the intensity of interspecific competition of invasive plants over native plants [59] that was found in this study (Figure 7).

5. Conclusions

Our results exhibited that biomass and morphological traits of WT and WC were increased to cope with submergence and eutrophication. Under low submergence and low nutrient levels (S1.N2), WC illustrated more growth; meanwhile, compared with high submergence and high nutrients, the growth of WC was decreased. Furthermore, under low submergence and low nutrient conditions (S1.N1, S2.N2), WT was not dominant but had more growth in high submergence and high nutrient levels (S2.N2 and S2.N3). WC has better morphological traits under monoculture compared to mixed culture, while WT was prominently successful under high submergence and high nutrients (S2.N2 and S2.N3) due to high phenotypic plasticity and better competition intensity. It was concluded that both species survived under submergence and eutrophication conditions. Environmental modeling suggested that artificial disturbance and change in climate will ensure submergence and eutrophication. The findings of this research contribute to the understanding of terrestrial plant response, when subjected to a riparian zone, because the increased below-ground and above-ground biomass under submergence and eutrophication helped them to capture the resources and outcompete their native competitor.

Author Contributions

Conceptualization, A.A. and Q.J.; methodology, A.A.; software, Q.J.; validation, J.S., K.J. and D.D.; formal analysis, A.A.; investigation, A.A.; resources, J.S.; data curation, Q.J.; writing—original draft preparation, A.A.; writing—review and editing, K.J.; visualization, Q.J; supervision, J.S.; project administration, D.D.; funding acquisition, D.D. All authors have read and agreed to the published version of the manuscript.

Funding

This research was funded by the State Key Research Development Program of China, grant number “2017YFC1200100” and the National Natural Science Foundation of China “31971427, 31770446 and 31570414”.

Acknowledgments

This work was supported by the State Key Research Development Program of China (2017YFC1200100), the National Natural Science Foundation of China (31971427, 31770446 and 31570414), the Priority Academic Program Development of Jiangsu Higher Education Institutions (PAPD) and Jiangsu Collaborative Innovation Center of Technology and Material of Water Treatment.

Conflicts of Interest

The authors declare no conflict of interest

References

  1. Seebens, H.; Essl, F.; Dawson, W.; Fuentes, N.; Moser, D.; Pergl, J.; Pyšek, P.; van Kleunen, M.; Weber, E.; Winter, M. Global trade will accelerate plant invasions in emerging economies under climate change. Glob. Chang. Biol. 2015, 21, 4128–4140. [Google Scholar] [CrossRef] [PubMed] [Green Version]
  2. Van Kleunen, M.; Dawson, W.; Essl, F.; Pergl, J.; Winter, M.; Weber, E.; Kreft, H.; Weigelt, P.; Kartesz, J.; Nishino, M.; et al. Global exchange and accumulation of non-native plants. Nature 2015, 525, 100. [Google Scholar] [CrossRef] [PubMed] [Green Version]
  3. Alpert, P. The advantages and disadvantages of being introduced. Biol. Invasions 2006, 8, 1523–1534. [Google Scholar] [CrossRef]
  4. Guan, B.; Yu, J.; Cao, D.; Li, Y.; Han, G.; Mao, P. The ecological restoration of heavily degraded saline wetland in the Yellow River Delta. CLEAN Soil Air Water 2013, 41, 690–696. [Google Scholar] [CrossRef]
  5. Davis, M.A.; Grime, J.P.; Thompson, K. Fluctuating resources in plant communities: A general theory of invasibility. J. Ecol. 2000, 88, 528–534. [Google Scholar] [CrossRef] [Green Version]
  6. Blumenthal, D. Interrelated causes of plant invasion. Science 2005, 310, 243–244. [Google Scholar] [CrossRef] [Green Version]
  7. Zhao, H.; Yang, W.; Xia, L.; Qiao, Y.; Xiao, Y.; Cheng, X.; An, S. Nitrogen-enriched eutrophication promotes the invasion of Spartina Alterniflora in coastal China. CLEAN Soil Air Water 2015, 43, 244–250. [Google Scholar] [CrossRef]
  8. Vilà, M.; Espinar, J.L.; Hejda, M.; Hulme, P.E.; Jarošík, V.; Maron, J.L.; Pergl, J.; Schaffner, U.; Sun, Y.; Pyšek, P. Ecological impacts of invasive alien plants: A meta-analysis of their effects on species, communities and ecosystems. Ecol. Lett. 2011, 14, 702–708. [Google Scholar] [CrossRef]
  9. Funk, J.L.; Standish, R.J.; Stock, W.D.; Valladares, F. Plant functional traits of dominant native and invasive species in mediterranean-climate ecosystems. Ecology 2016, 97, 75–83. [Google Scholar] [CrossRef]
  10. Heberling, J.M.; Fridley, J.D. Resource-use strategies of native and invasive plants in Eastern North American forests. New Phytol. 2013, 200, 523–533. [Google Scholar] [CrossRef]
  11. Jia, J.; Dai, Z.; Li, F.; Liu, Y. How will global environmental changes affect the growth of alien plants? Front. Plant Sci. 2016, 7, 1623. [Google Scholar] [CrossRef] [Green Version]
  12. Van Kleunen, M.; Schlaepfer, D.R.; Glaettli, M.; Fischer, M. Preadapted for invasiveness: Do species traits or their plastic response to shading differ between invasive and non-invasive plant species in their native range? J. Biogeogr. 2011, 38, 1294–1304. [Google Scholar] [CrossRef] [Green Version]
  13. Gratani, L. Plant phenotypic plasticity in response to environmental factors. Adv. Bot. 2014. [Google Scholar] [CrossRef] [Green Version]
  14. Nicotra, A.B.; Atkin, O.K.; Bonser, S.P.; Davidson, A.M.; Finnegan, E.J.; Mathesius, U.; Poot, P.; Purugganan, M.D.; Richards, C.L.; Valladares, F. Plant phenotypic plasticity in a changing climate. Trends Plant Sci. 2010, 15, 684–692. [Google Scholar] [CrossRef] [PubMed]
  15. Richards, C.L.; Bossdorf, O.; Muth, N.Z.; Gurevitch, J.; Pigliucci, M. Jack of all trades, master of some? On the role of phenotypic plasticity in plant invasions. Ecol. Lett. 2006, 9, 981–993. [Google Scholar] [PubMed] [Green Version]
  16. Liu, Y.; van Kleunen, M. Responses of common and rare aliens and natives to nutrient availability and fluctuations. J. Ecol. 2017, 105, 1111–1122. [Google Scholar] [CrossRef] [Green Version]
  17. Davidson, A.M.; Jennions, M.; Nicotra, A.B. Do invasive species show higher phenotypic plasticity than native species and, if so, is it adaptive? A meta-analysis. Ecol. Lett. 2011, 14, 419–431. [Google Scholar] [CrossRef]
  18. Palacio-López, K.; Gianoli, E. Invasive plants do not display greater phenotypic plasticity than their native or non-invasive counterparts: A meta-analysis. Oikos 2011, 120, 1393–1401. [Google Scholar] [CrossRef]
  19. Liu, Y.; Oduor, A.M.O.; Zhang, Z.; Manea, A.; Tooth, I.M.; Leishman, M.R.; Xu, X.; van Kleunen, M. Do invasive alien plants benefit more from global environmental change than native plants? Glob. Chang. Biol. 2017, 23, 3363–3370. [Google Scholar] [CrossRef] [Green Version]
  20. Gołdyn, H. Changes in plant species diversity of aquatic ecosystems in the agricultural landscape in West Poland in the last 30 years. Biodivers. Conserv. 2010, 19, 61–80. [Google Scholar] [CrossRef]
  21. Parepa, M.; Fischer, M.; Bossdorf, O. Environmental variability promotes plant invasion. Nat. Commun. 2013, 4, 1604. [Google Scholar] [CrossRef] [PubMed]
  22. Evtimova, V.V.; Donohue, I. Quantifying ecological responses to amplified water level fluctuations in standing waters: An experimental approach. J. Appl. Ecol. 2014, 51, 1282–1291. [Google Scholar] [CrossRef]
  23. Chen, Y.; Zhou, Y.; Yin, T.-F.; Liu, C.-X.; Luo, F.-L. The invasive wetland plant Alternanthera philoxeroides shows a higher tolerance to waterlogging than its native congener Alternanthera sessilis. PLoS ONE 2013, 8, 81456. [Google Scholar] [CrossRef] [PubMed]
  24. Fan, S.; Yu, H.; Liu, C.; Yu, D.; Han, Y.; Wang, L. The effects of complete submergence on the morphological and biomass allocation response of the invasive plant Alternanthera philoxeroides. Hydrobiologia 2015, 746, 159–169. [Google Scholar] [CrossRef]
  25. Short, F.T.; Kosten, S.; Morgan, P.A.; Malone, S.; Moore, G.E. Impacts of climate change on submerged and emergent wetland plants. Aquat. Bot. 2016, 135, 3–17. [Google Scholar] [CrossRef]
  26. Strange, E.; Hill, J.; Coetzee, J. Evidence for a new regime shift between floating and submerged invasive plant dominance in South Africa. Hydrobiologia 2018, 817, 349–362. [Google Scholar] [CrossRef]
  27. Zhang, H.; Liu, J.; Chen, X.; Du, Y.; Wang, Y.; Wang, R. Effects of submergence and eutrophication on the morphological traits and biomass allocation of the invasive plant Alternanthera philoxeroides. J. Freshw. Ecol. 2016, 31, 341–349. [Google Scholar] [CrossRef]
  28. Colmer, T.; Voesenek, L. Flooding tolerance: Suites of plant traits in variable environments. Funct. Plant Biol. 2009, 36, 665–681. [Google Scholar] [CrossRef]
  29. Dalmolin, Â.C.; Dalmagro, H.J.; Lobo, F.D.A.; Junior, M.Z.A.; Ortíz, C.E.R.; Vourlitis, G.L. Effects of flooding and shading on growth and gas exchange of Vochysia divergens Pohl (Vochysiaceae) of invasive species in the Brazilian Pantanal. Braz. J. Plant Physiol. 2012, 24, 75–84. [Google Scholar] [CrossRef] [Green Version]
  30. Luo, F.-L.; Nagel, K.A.; Scharr, H.; Zeng, B.; Schurr, U.; Matsubara, S. Recovery dynamics of growth, photosynthesis and carbohydrate accumulation after de-submergence: A comparison between two wetland plants showing escape and quiescence strategies. Ann. Bot. 2010, 107, 49–63. [Google Scholar] [CrossRef] [Green Version]
  31. Webb, J.A.; Wallis, E.M.; Stewardson, M.J. A systematic review of published evidence linking wetland plants to water regime components. Aquat. Bot. 2012, 103, 1–14. [Google Scholar] [CrossRef]
  32. Jackson, M.; Colmer, T. Response and adaptation by plants to flooding stress. Ann. Bot. 2005, 96, 501–505. [Google Scholar] [CrossRef]
  33. Schindler, D.W. Recent advances in the understanding and management of eutrophication. Limnol. Oceanogr. 2006, 51, 356–363. [Google Scholar] [CrossRef] [Green Version]
  34. O’Hare, M.T.; Baattrup-Pedersen, A.; Baumgarte, I.; Freeman, A.; Gunn, I.D.M.; Lázár, A.N.; Sinclair, R.; Wade, A.J.; Bowes, M.J. Responses of aquatic plants to eutrophication in rivers: A revised conceptual model. Front. Plant Sci. 2018, 9, 451. [Google Scholar] [CrossRef] [PubMed]
  35. Smith, V.H.; Tilman, G.D.; Nekola, J.C. Eutrophication: Impacts of excess nutrient inputs on freshwater, marine, and terrestrial ecosystems. Environ. Pollut. 1999, 100, 179–196. [Google Scholar] [CrossRef]
  36. Mäemets, H.; Palmik, K.; Haldna, M.; Sudnitsyna, D.; Melnik, M. Eutrophication and macrophyte species richness in the large shallow North-European Lake Peipsi. Aquat. Bot. 2010, 92, 273–280. [Google Scholar] [CrossRef]
  37. Song, L.; Chow, W.S.; Sun, L.; Li, C.; Peng, C. Acclimation of photosystem II to high temperature in two Wedelia species from different geographical origins: Implications for biological invasions upon global warming. J. Exp. Bot. 2010, 61, 4087–4096. [Google Scholar] [CrossRef]
  38. Talukdar, T.; Talukdar, D. Response of antioxidative enzymes to arsenic-induced phytotoxicity in leaves of a medicinal daisy, Wedelia chinensis Merrill. J. Nat. Sci. Biol. Med. 2013, 4, 383. [Google Scholar] [CrossRef] [Green Version]
  39. Dai, Z.-C.; Fu, W.; Qi, S.-S.; Zhai, D.-L.; Chen, S.-C.; Wan, L.-Y.; Huang, P.; Du, D.-L. Different responses of an invasive clonal plant Wedelia trilobata and its native congener to gibberellin: Implications for biological invasion. J. Chem. Ecol. 2016, 42, 85–94. [Google Scholar] [CrossRef]
  40. Talukdar, T.; Mukherjee, S.K. Comparative study of cypselas in three common species of Asteraceae. Pleione 2008, 2, 147–149. [Google Scholar]
  41. Chen, Y.; Liu, R.; Sun, C.; Zhang, P.; Feng, C.; Shen, Z. Spatial and temporal variations in nitrogen and phosphorous nutrients in the Yangtze River Estuary. Mar. Pollut. Bull. 2012, 64, 2083–2089. [Google Scholar] [CrossRef] [PubMed]
  42. Funk, J.L. Differences in plasticity between invasive and native plants from a low resource environment. J. Ecol. 2008, 96, 1162–1173. [Google Scholar] [CrossRef]
  43. Lamarque, L.J.; Porte, A.J.; Eymeric, C.; Lasnier, J.-B.; Lortie, C.J.; Delzon, S. A test for pre-adapted phenotypic plasticity in the invasive tree Acer negundo L. PLoS ONE 2013, 8, 74239. [Google Scholar] [CrossRef] [PubMed] [Green Version]
  44. Armas, C.; Ordiales, R.; Pugnaire, F.I. Measuring plant interactions: A new comparative index. Ecology 2004, 85, 2682–2686. [Google Scholar] [CrossRef] [Green Version]
  45. Wilson, J.R.; Yeates, A.; Schooler, S.; Julien, M.H. Rapid response to shoot removal by the invasive wetland plant, alligator weed (Alternanthera philoxeroides). Environ. Exp. Bot. 2007, 60, 20–25. [Google Scholar] [CrossRef]
  46. Mommer, L.; Visser, E.J. Underwater photosynthesis in flooded terrestrial plants: A matter of leaf plasticity. Ann. Bot. 2005, 96, 581–589. [Google Scholar] [CrossRef]
  47. Wang, T.; Hu, J.; Gao, Y.; Yu, D.; Liu, C. Disturbance, trait similarities, and trait advantages facilitate the invasion success of Alternanthera Philoxeroides (Mart) Griseb. CLEAN Soil Air Water 2017, 45, 1600378. [Google Scholar] [CrossRef]
  48. Pierik, R.V.; van Aken, J.; Voesenek, L. Is elongation-induced leaf emergence beneficial for submerged Rumex species? Ann. Bot. 2008, 103, 353–357. [Google Scholar] [CrossRef] [Green Version]
  49. Ding, W.; Zhang, H.; Zhang, F.; Wang, L.; Cui, S. Morphology of the invasive amphiphyte Alternanthera philoxeroides under different water levels and nitrogen concentrations. Acta Biol. Crac. Bot. 2014, 56, 136–147. [Google Scholar] [CrossRef]
  50. Zuo, S.; Ma, Y.; Shinobu, I. Differences in ecological and allelopathic traits among Alternanthera philoxeroides populations. Weed Biol. Manag. 2012, 12, 123–130. [Google Scholar] [CrossRef]
  51. Sauter, M. Root responses to flooding. Curr. Opin. Plant Biol. 2013, 16, 282–286. [Google Scholar] [CrossRef] [PubMed]
  52. Riis, T.; Lambertini, C.; Olesen, B.; Clayton, J.S.; Brix, H.; Sorrell, B.K. Invasion strategies in clonal aquatic plants: Are phenotypic differences caused by phenotypic plasticity or local adaptation? Ann. Bot. 2010, 106, 813–822. [Google Scholar] [CrossRef]
  53. Yu, H.; Wang, L.; Liu, C.; Fan, S. Coverage of native plants is key factor influencing the invasibility of freshwater ecosystems by exotic plants in China. Front. Plant Sci. 2018, 9, 250. [Google Scholar] [CrossRef] [PubMed] [Green Version]
  54. Kawano, N.; Ito, O.; Sakagami, J.-I. Morphological and physiological responses of rice seedlings to complete submergence (flash flooding). Ann. Bot. 2008, 103, 161–169. [Google Scholar] [CrossRef] [PubMed]
  55. Bailey-Serres, J.; Voesenek, L. Flooding stress: Acclimations and genetic diversity. Annu. Rev. Plant Biol. 2008, 59, 313–339. [Google Scholar] [CrossRef] [PubMed] [Green Version]
  56. Liu, G.; Yang, Y.-B.; Zhu, Z.-H. Elevated nitrogen allows the weak invasive plant Galinsoga quadriradiata to become more vigorous with respect to inter-specific competition. Sci. Rep. 2018, 8, 3136. [Google Scholar] [CrossRef] [PubMed] [Green Version]
  57. Liu, D.; Wang, R.; Gordon, D.R.; Sun, X.; Chen, L.; Wang, Y. Predicting plant invasions following China’s water diversion project. Environ. Sci. Technol. 2017, 51, 1450–1457. [Google Scholar] [CrossRef]
  58. You, W.; Yu, D.; Xie, D.; Yu, L.; Xiong, W.; Han, C. Responses of the invasive aquatic plant water hyacinth to altered nutrient levels under experimental warming in China. Aquat. Bot. 2014, 119, 51–56. [Google Scholar] [CrossRef]
  59. Wu, H.; Ding, J. Global change sharpens the double-edged sword effect of aquatic alien plants in China and beyond. Front. Plant Sci. 2019, 10, 787. [Google Scholar] [CrossRef] [Green Version]
Figure 1. Diagram illustrating experiment treatments and culture methods.
Water 12 00934 g001
Figure 2. Total biomass and root-to-shoot ratio of Wedelia trilobata (WT) and Wedelia chinensis (WC) under mono and mixed culture with six replicates, (a) total biomass of both species under monoculture, (b) total biomass of both species under mixed culture, (c) root-to-shoot ratio of both species under monoculture, (d) root to shoot ratio of both species under mixed culture. Different letters indicate the significant difference between different treatments of submergence and nutrient concentrations according to ANOVA and Student–Newman–Keuls, p < 0.05.
Water 12 00934 g002
Figure 3. Stem mass ratio and leaves mass ratio of Wedelia trilobata and Wedelia chinensis under mono and mixed culture with six replicates. (a) stem mass ratio under monoculture of both species, (b) stem mass ratio under mixed culture of both species, (c) leaves mass ratio under monoculture of both species, (d) leaves mass ratio under mixed culture of both species. Different letters indicate the significant difference between different treatments of submergence and nutrient concentrations according to ANOVA and Student–Newman–Keuls, p < 0.05.
Water 12 00934 g003
Figure 4. Plant height and root length of Wedelia trilobata and Wedelia chinensis under mono and mixed culture with six replicates, (a) plant height of both species under monoculture, (b) plant height of both species under mixed culture, (c) root length of both species under monoculture, (d) root length of both species under mixed culture. Different letters indicate the significant difference between different treatments of submergence and nutrient concentrations according to ANOVA and Student–Newman–Keuls, p < 0.05.
Water 12 00934 g004
Figure 5. Number of node, number of leaves per plant and specific leaf area (SLA) of Wedelia trilobata and Wedelia chinensis under mono and mixed culture with six replicates, (a) number of nodes of both species under monoculture, (b) number of nodes of both species under mixed culture, (c) number of leaves per plant of both species under monoculture, (d) number of leaves per plant of both species under mixed culture, (e) SLA of both species under monoculture, (f) SLA of both species under mixed culture. Different letters indicate the significant difference between different treatments of submergence and nutrient concentrations according to ANOVA and Student–Newman–Keuls, p < 0.05.
Water 12 00934 g005
Figure 6. Plasticity index of plant height and root length of Wedelia trilobata and Wedelia chinensis under mono and mixed culture with six replicates. Submergence and nutrient treatments were significantly different according to ANOVA, ** p < 0.05.
Water 12 00934 g006
Figure 7. Relative interaction index of Wedelia trilobata and Wedelia chinensis under competition. Different letters indicate the significant difference between different treatments of submergence and nutrient concentrations according to ANOVA and Student–Newman–Keuls, p < 0.05.
Water 12 00934 g007
Table 1. Analysis of variance (ANOVA) results of biomass accumulation and allocation under submergence and nutrient concentrations.
SourcesTotal BiomassRoot-to-Shoot RatioStem Mass RatioLeaf Mass Ratio
FpFpFpFp
S1.7970.1864.403<0.051.5850.21438.525<0.01
N10.303<0.0117.383<0.0117.051<0.0116.281<0.01
C10.830<0.0118.101<0.0116.588<0.0123.454<0.01
S * N61.212<0.012.9010.0650.6830.51021.778<0.01
S * C62.137<0.010.2520.8591.1100.35411.904<0.01
N * C24.333<0.015.347<0.014.288<0.0121.006<0.01
S * N * C16.347<0.016.120<0.015.003<0.0116.088<0.01
Significance level: p < 0.05, p < 0.01. Note: S represented submergence, N represented nutrient, C represented culture.
Table 2. ANOVA results of morphological traits.
SourcesPlant HeightRoot LengthNumber of NodesNumber of LeavesSpecific Leaf Area
FpFPFpFpFp
S4.590<0.053.2910.0760.0530.8184.900<0.053.6170.063
N52.098<0.0126.067<0.0153.560<0.013.878<0.0516.504<0.01
C14.013<0.0126.582<0.0110.329<0.015.196<0.015.450<0.01
S * N17.396<0.017.899<0.0117.613<0.019.233<0.0111.578<0.01
S * C3.491<0.055.923<0.013.076<0.055.463<0.011.6940.181
N * C9.070<0.012.490<0.054.209<0.011.6850.1451.0930.380
S * N * C8.875<0.019.458<0.013.676<0.011.6190.1635.693<0.01
Significance level: p < 0.05, p < 0.01. Note: S represented submergence, N represented nutrient, C represented culture.

