New Approaches to Monitor Inequalities in Access to Water and Sanitation: The SDGs in Latin America and the Caribbean


1
School of Engineering, Federal University of Minas Gerais (UFMG), Belo Horizonte-MG 31270-901, Brazil
2
Centre for Development and Regional Planning—Cedeplar, Faculty of Economics—Face, Federal University of Minas Gerais (UFMG), Belo Horizonte-MG 31270-90, Brazil
3
René Rachou Institute (IRR), Fiocruz—Belo Horizonte-MG 30190-009, Brazil
*
Author to whom correspondence should be addressed.
Water 2020, 12(4), 931; https://doi.org/10.3390/w12040931
Submission received: 1 March 2020
/
Revised: 22 March 2020
/
Accepted: 23 March 2020
/
Published: 25 March 2020
(This article belongs to the Special Issue Human Rights to Water and Sanitation)
Abstract
:In the 2030 Agenda for Sustainable Development, Targets 6.1 and 6.2 show, in their formulation, some alignment with the normative content of the human rights to water and sanitation (HRWS). However, the principle of equality and non-discrimination, which applies to all human rights, was not clearly incorporated into the indicators adopted to assess and monitor these targets. This paper contributes to bridging this gap by proposing two methodological strategies to address inequalities in analyses of access to water and sanitation services. The first consists in adjusting the indicators of access to these services according to inequality. The second proposes an assessment of intersecting forms of inequality. An application of these methods in Latin America and the Caribbean highlights significant regional heterogeneity and elevated inequality in access to services in the countries of this region. The methods demonstrate their potential in contributing to assessment and monitoring of the SDGs, but outdated or lacking data are obstacles to more in-depth analyses.
1. Introduction
Article 2 of the Universal Declaration of Human Rights establishes that everyone is entitled to rights without distinction of any kind, which includes the human rights to water and sanitation (HRWS). Both the International Covenant on Civil and Political Rights and the International Covenant on Economic, Social, and Cultural Rights reinforce the importance of the principle of equality and non-discrimination. These were the origins of prohibited grounds of discrimination, which include individual characteristics such as race, color, sex, age, language, religion, political or other opinions, national or social origin, property, birth, physical or mental disability, health status (including HIV/AIDS), sexual orientation and civil, political, social or other status [1].
Inequality in access to water supply and sanitation services (WASH services) has already been the subject of several studies and discussions [2,3,4]. However, when access to water and sanitation was explicitly recognized as universal human rights by the UN in 2010, this issue was put on the center of the debates in the sector [5,6,7,8]. The HRWS were incorporated into the 2030 Agenda for Sustainable Development, particularly in the SDG 6: “Ensure availability and sustainable management of water and sanitation for all”. Contrary to the Millennium Development Goals (MDG), which did not explicitly address this matter, there is a strong alignment with the language of human rights in the formulation of Targets 6.1 and 6.2 of the Sustainable Development Goals (SDGs) [9,10]. Notably, the concepts of quality/safety, equality and affordability were included in these targets. Despite this progress, the indicators proposed to assess and monitor these targets (6.1.1 and 6.2.1) summarize all these attributes in the expression “safely managed services”, which opened the door to different ways of applying the concept. More specifically, the omission of the aspects of equality and affordability in global monitoring represents a shortcoming in the institutionalization of the agreed commitments [9,11,12].
Since the establishment of these frameworks, monitoring inequality in access to water supply and sanitation (WASH) services has become very challenging [13,14]. The “Task Force on Monitoring Inequalities for the 2030 Sustainable Development Agenda” was created to take on this challenge. This group, which was made up of specialists in the monitoring diverse human rights issues, released a report [15] containing a series of explicit recommendations, using the HRWS and the 2030 Agenda for Sustainable Development as references. Among them were the need for disaggregated analyses, new data visualization tools to show different types of inequalities, and the use of spatial information, all of which this paper seeks to explore.
In 2017, the Joint Monitoring Programme for Water Supply, Sanitation and Hygiene (JMP, by WHO/UNICEF) published a report on the situation of access to water supply, sanitation, and hygiene within the SDG framework, thus establishing the baseline for worldwide assessment and monitoring of Targets 6.1 and 6.2 [11]. Although the document addresses some dimensions of inequality—such as differences in access to these services in urban and rural areas, in different regions and by income level—it does not effectively incorporate inequalities into the indicators used to assess countries’ progress [16]. In 2019, the JMP published a report [17] focusing on three dimensions of inequalities: geographical location, socio-economic groups, and individual characteristics. Still, despite presenting diverse data and graphical depictions, the document does not incorporate inequalities into Indicators 6.1.1 and 6.2.1 in a way that reflects the language of Targets 6.1 and 6.2.
On top of the challenge of explicitly incorporating inequality into the assessment and monitoring indicators, interrelationships between diverse characteristics associated with inequality must also be considered. As a general rule, disaggregated analyses consider the effect of different discrimination and inequality-related criteria separately. Some studies focus on specific aspects, such as race [18] or geographical location [19]. But even the most recent reports of the JMP [11,17] and the WWAP [20], which consider several criteria, do not take into account the intersectionality of disadvantageous characteristics affecting access to WASH services. This can lead to an underestimation of the degree of deprivation of services in certain population groups that are particularly susceptible to situations of vulnerability. For example, Aleixo and colleagues [21] showed that multiple inequalities affecting access to water can exist even within a community that lacks a water supply system. Based on the application of 232 household questionnaires in Cristais (Ceará, Northeast Brazil), the authors concluded that the conditions of access to water in terms of quantity and physical and economic accessibility were not uniform and that these inequalities were linked to various forms of vulnerability in the community. Butts and Gasteyer [22], in turn, although focusing on race inequalities, used multivariate regression analysis to investigate the relationship between income, urbanicity, race, and the cost of water and sanitation services. Although the literature recognizes the importance of intersecting forms of discrimination [20], with a few exceptions, little efforts have been made to quantify its effects.
In the past two decades, access to WASH services advanced in Latin America and the Caribbean, the study area of this paper. Coverage of “safely managed” water services rose from 56% of the population in 2000 to 74% in 2017. For “safely managed” sanitation services, this figure rose from 12% to 31% in the same period [11]. However, significant inequalities between urban and rural populations, ethnicities, geographical regions, education and wealth levels, among others [17,23], remain hidden in the aggregated data.
This paper aims to contribute to the theoretical–methodological challenge of incorporating inequality in the assessment and monitoring of the SDG targets, particularly the SDG 6, related to WASH services. The following section presents the two developed methods: Section 2.1 addresses the calculation of access indexes adjusted by inequality, and Section 2.2 addresses the assessment of intersecting forms of inequality. The subsequent section presents the results of the applications of these methods in the Latin American and Caribbean regions. In Section 4, the results are discussed as well as limitations and potentialities of the proposed methodology. Finally, the paper concludes with considerations of its contributions and recommendations for further development of these analyses.
2. Methods
Two methods to address the issue of inequality in access to WASH services are presented in this section. The first consists of a proposal of adjustment of the levels of access to services based on the degree of inequalities. This approach, a novelty in the WASH sector, was inspired by the Human Opportunity Index (HOI) methodology [24], created to measure inequality in opportunities to access basic services. The second method consists in analyzing intersecting forms of inequality in certain population groups by disaggregating data on access to water supply and sanitation services. To verify the degree of convergence between these approaches, linear regressions were calculated considering the countries with available data for the application of both methods.
2.1. Access Adjusted for Inequality
This method’s rationale consists of penalizing the level of countries’ access to the two services, based on the level of inequality between the access of different population sub-groups. The greater the inequalities, the greater the decrease in the access index. Two indexes were created: Inequality-Adjusted Index of Access to Water (IAIW) and Inequality-Adjusted Index of Access to Sanitation (IAIS), computed with the following equations:
The variable “A” corresponds to the crude (non-adjusted) access and “D” to the inequality factor regarding access between different groups of the population. In the case of no inequality, the variable D equals zero and the crude access value remains unchanged. On the contrary, in extreme situations of access being totally limited to certain groups, D would equal 1 and the adjusted access would be null. Thus, the part of the equation (1 − D) acts as a diminishing factor in situations of access with inequalities. The inequality factor is calculated with the following equation:
In this equation, i means each individual, N the sample of individuals in a given country, and the access to services estimated through the dimensions of inequality. is estimated by means of logistic regression [24] in which the binary response variables are piped water within the household (against no piped water) and access to sanitation via connection to a public sewerage network or a septic tank (against absent or other types of facilities). The explanatory variables cover different dimensions of inequality and were chosen based on bibliographical research concerning the most relevant factors for inequality in access to WASH services [3,17,23] and data availability for Latin American and Caribbean countries. It is worth mentioning that the selection of explanatory variables was not preceded by a collinearity analysis, allowing the logistic model to choose the statistically relevant variables. In addition, although the individual influence of each explanatory variable was not explored, this is a possibility and a valid recommendation for future research.
Table 1 presents the variables included in the estimation of , their nomenclature, and the adopted classification. It is important to point out that data availability was a concern since data on the explanatory variables were not available for all countries.
The source of the data was the harmonized census database made available by the IPUMS-International project [25], which has the aim to collect and distribute census data from several countries (including the majority of Latin America and Caribbean countries), harmonize variables, and disseminate the harmonized data free of charge. This database was selected for two reasons: (i) census data constitutes the most detailed description of these countries and allows variables for water and sanitation to be treated at the household level and classified by different socio-economic variables; (ii) the IPUMS-International project harmonizes and ensures compatibility between census variables, allowing comparisons between countries. However, a few limitations deserve consideration. Firstly, the response variables used are related to the existence of facilities and not of services; the criterion considered in the indicators of Targets 6.1 and 6.2 of the SDG 6. This means that the response variable for water supply, for instance, reflects the existence of infrastructure and not necessarily if water is available when needed or free from contamination. Secondly, variation in census dates compromise comparability. Finally, the data available for some countries are outdated. Despite such problems, these issues did not prevent the methods proposed in this paper from being applied and tested.
2.2. Intersecting Forms of Inequality
People in vulnerable situations are frequently discriminated against in different ways [20], which increases their chances of being deprived of water supply and sanitation services or facilities. For example, inequalities linked to color or race can be exacerbated when combined (or “intersecting”) with other forms of discrimination or disadvantages of a different nature. This being the case, it is worth exploring how certain population segments with particular susceptibility to situations of vulnerability are at a disadvantage in comparison to others, considering intersecting forms of inequality. To carry out this analysis, access to piped water and to sewerage or septic tanks were compared for two contrasting population profiles in different countries: one less susceptible to vulnerability (the white urban population residing in households headed by persons having completed higher education) and another more susceptible (the black rural population residing in households headed by persons with less than primary education completed). In doing so, census microdata from the IPUMS-International project was used. These analyses were only possible for some countries since few had all the data needed to disaggregate the variables regarding access to facilities (by residence in urban or rural households, color or race, and head of household’s level of education).
2.3. Comparative Analysis of Both Methods
Since both methods were calculated using the same database and aimed to contribute to assessing inequality, an analysis of the association between the two sets of results by country was performed. In this regard, the correlation between the inequality factor and the intersectional analysis was calculated via simple linear regression for both water supply and sanitation services.
3. Results
3.1. Access Indexes Adjusted for Inequality
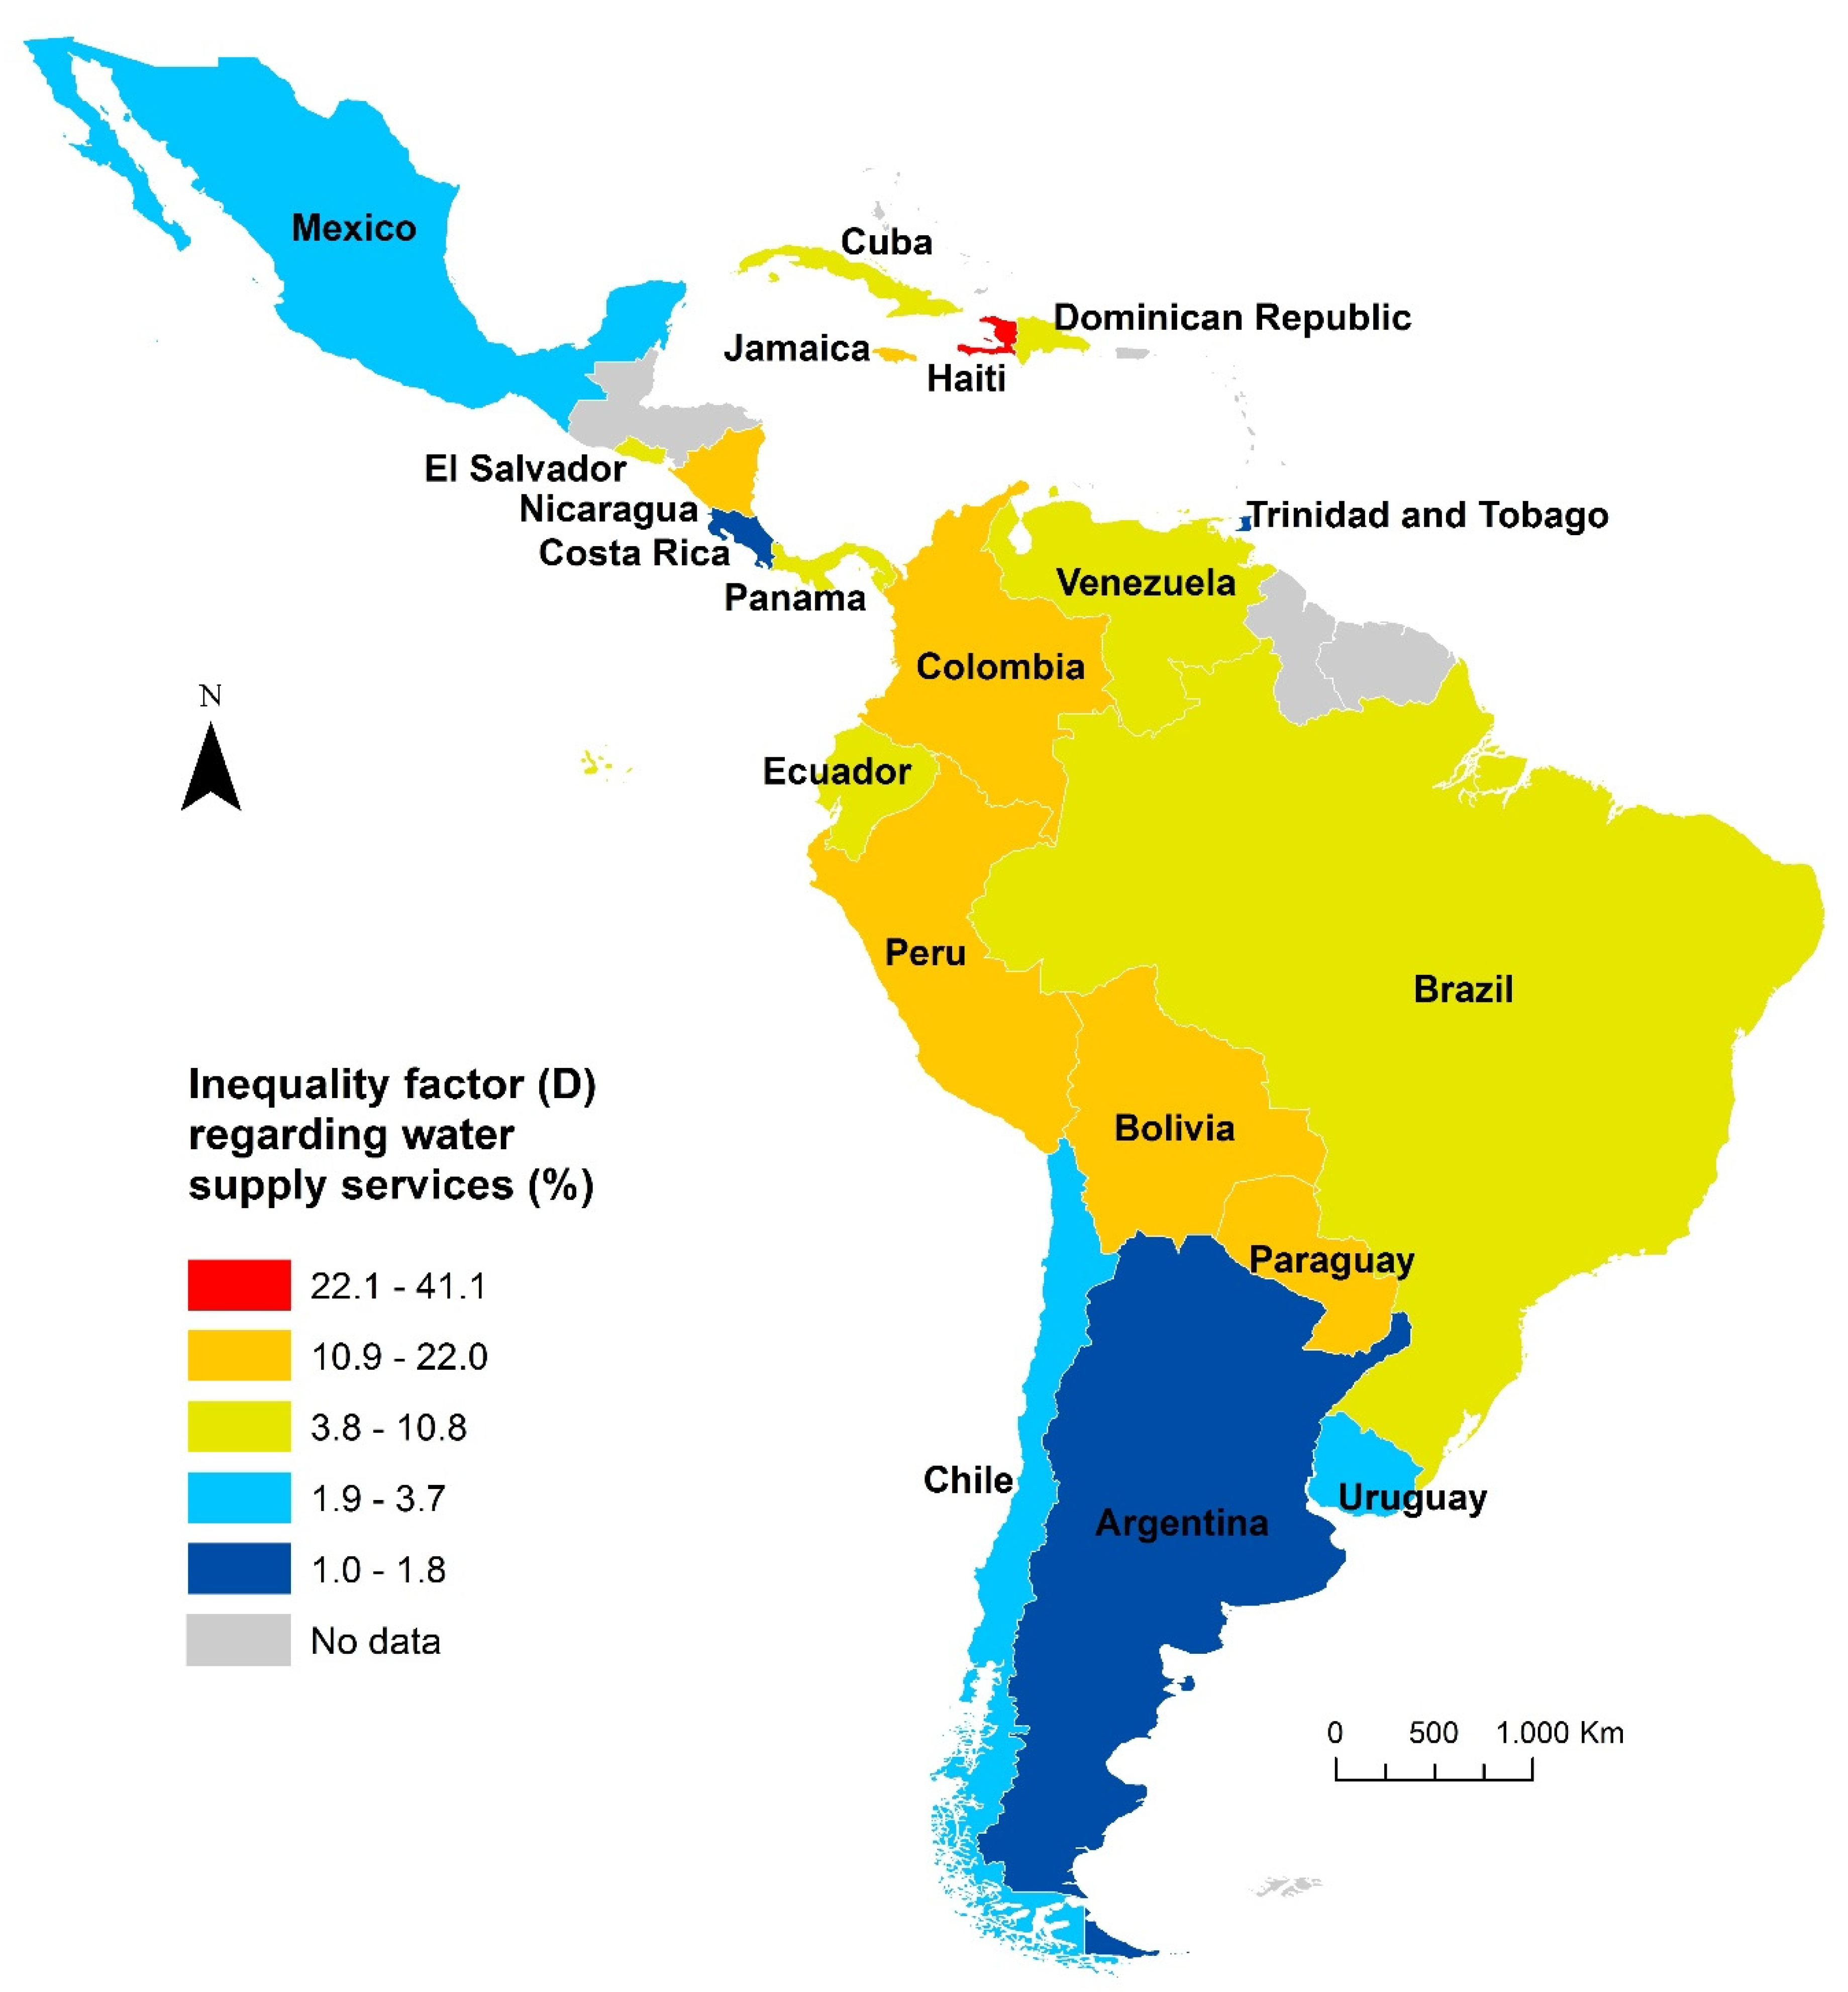
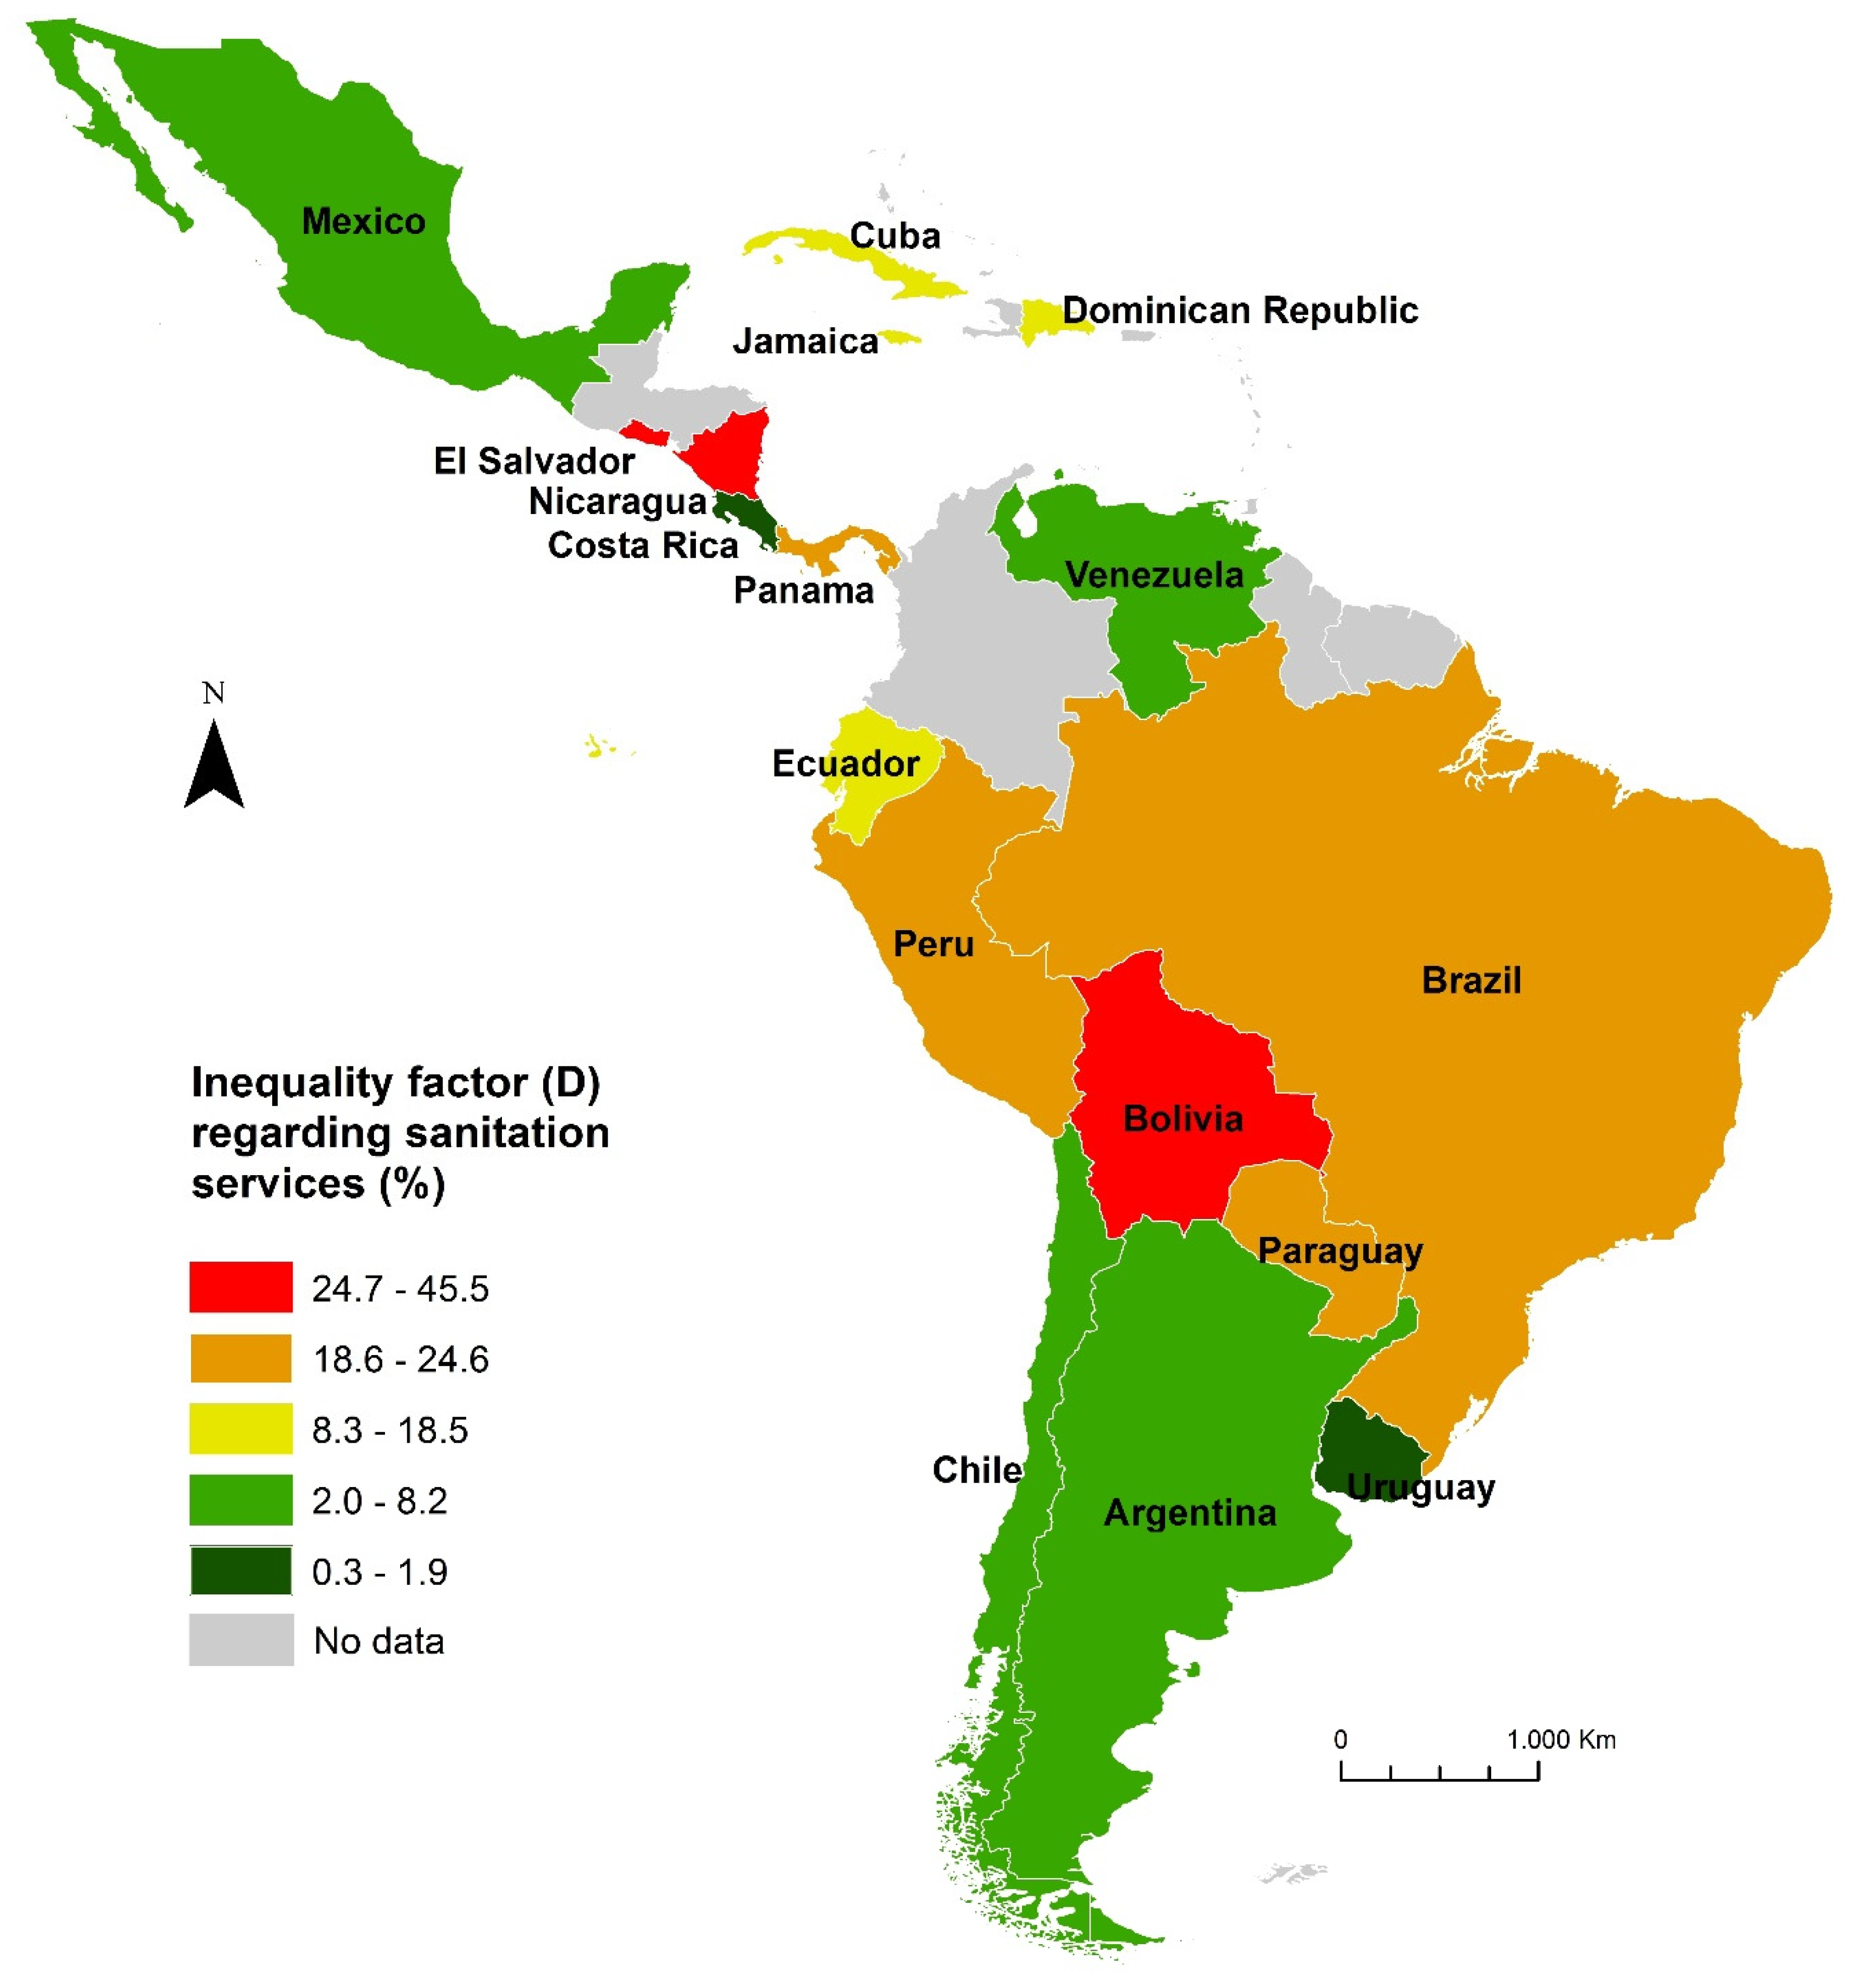
The first step to creating the access index adjusted for inequality was the calculation of the inequality factors (D) for access to services in Latin American and Caribbean countries. Its values are shown in the maps of Figure 1 and Figure 2, regarding water supply and sanitation services, respectively.
It was possible to calculate the inequality factor for access to water supply services for 20 countries. The results indicate great regional heterogeneity. Values varied from 1.0% in Argentina, where there was hardly any difference in access between the selected subgroups, to 41.0% in Haiti, where access was largely possible only for certain population segments. In reference to sanitation services, it was possible to calculate the inequality factor for 16 countries. Once more, a significant variance was observed with values ranging from 0.3% for Uruguay to 45.5% for Nicaragua. The inequality factor was greater regarding sanitation services as compared to water supply services for all countries, except for Uruguay.
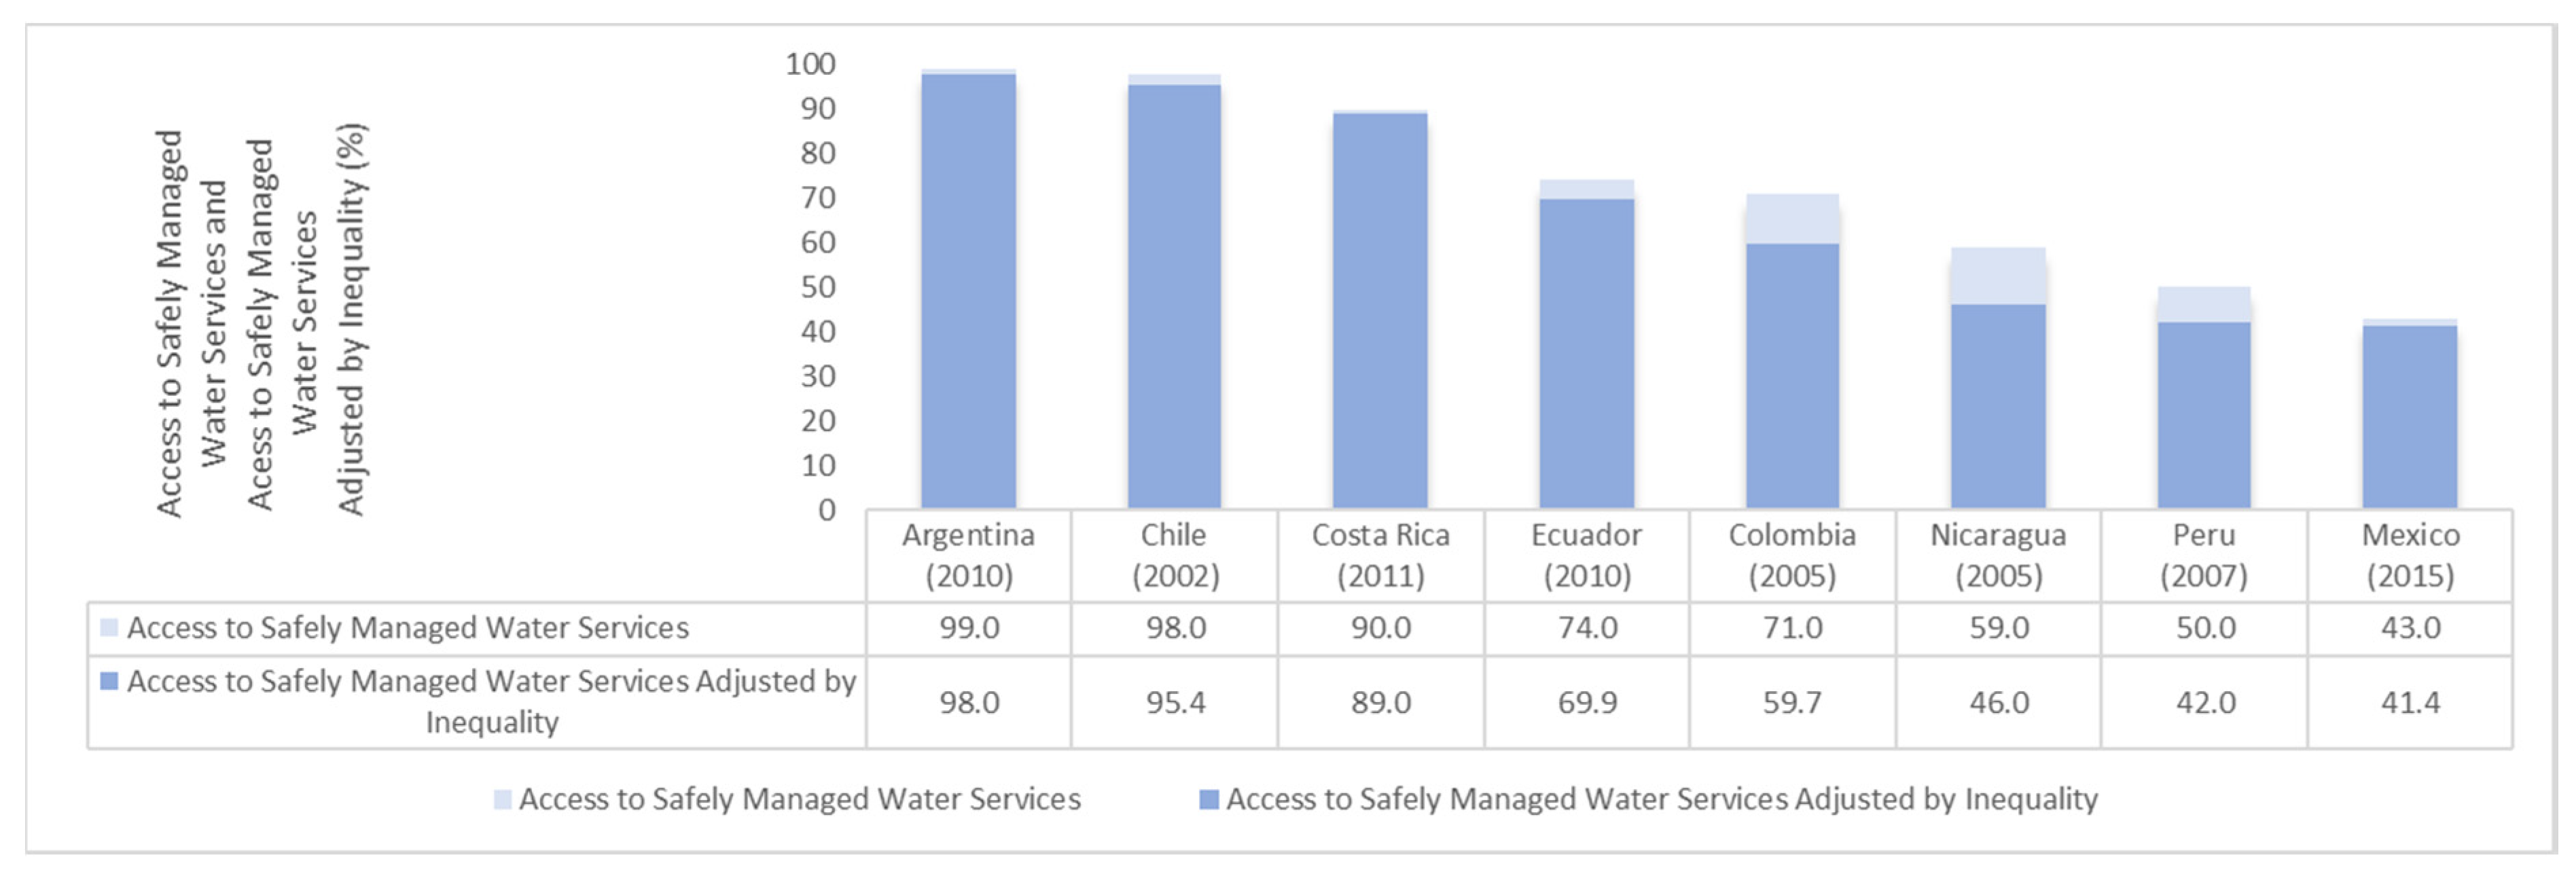
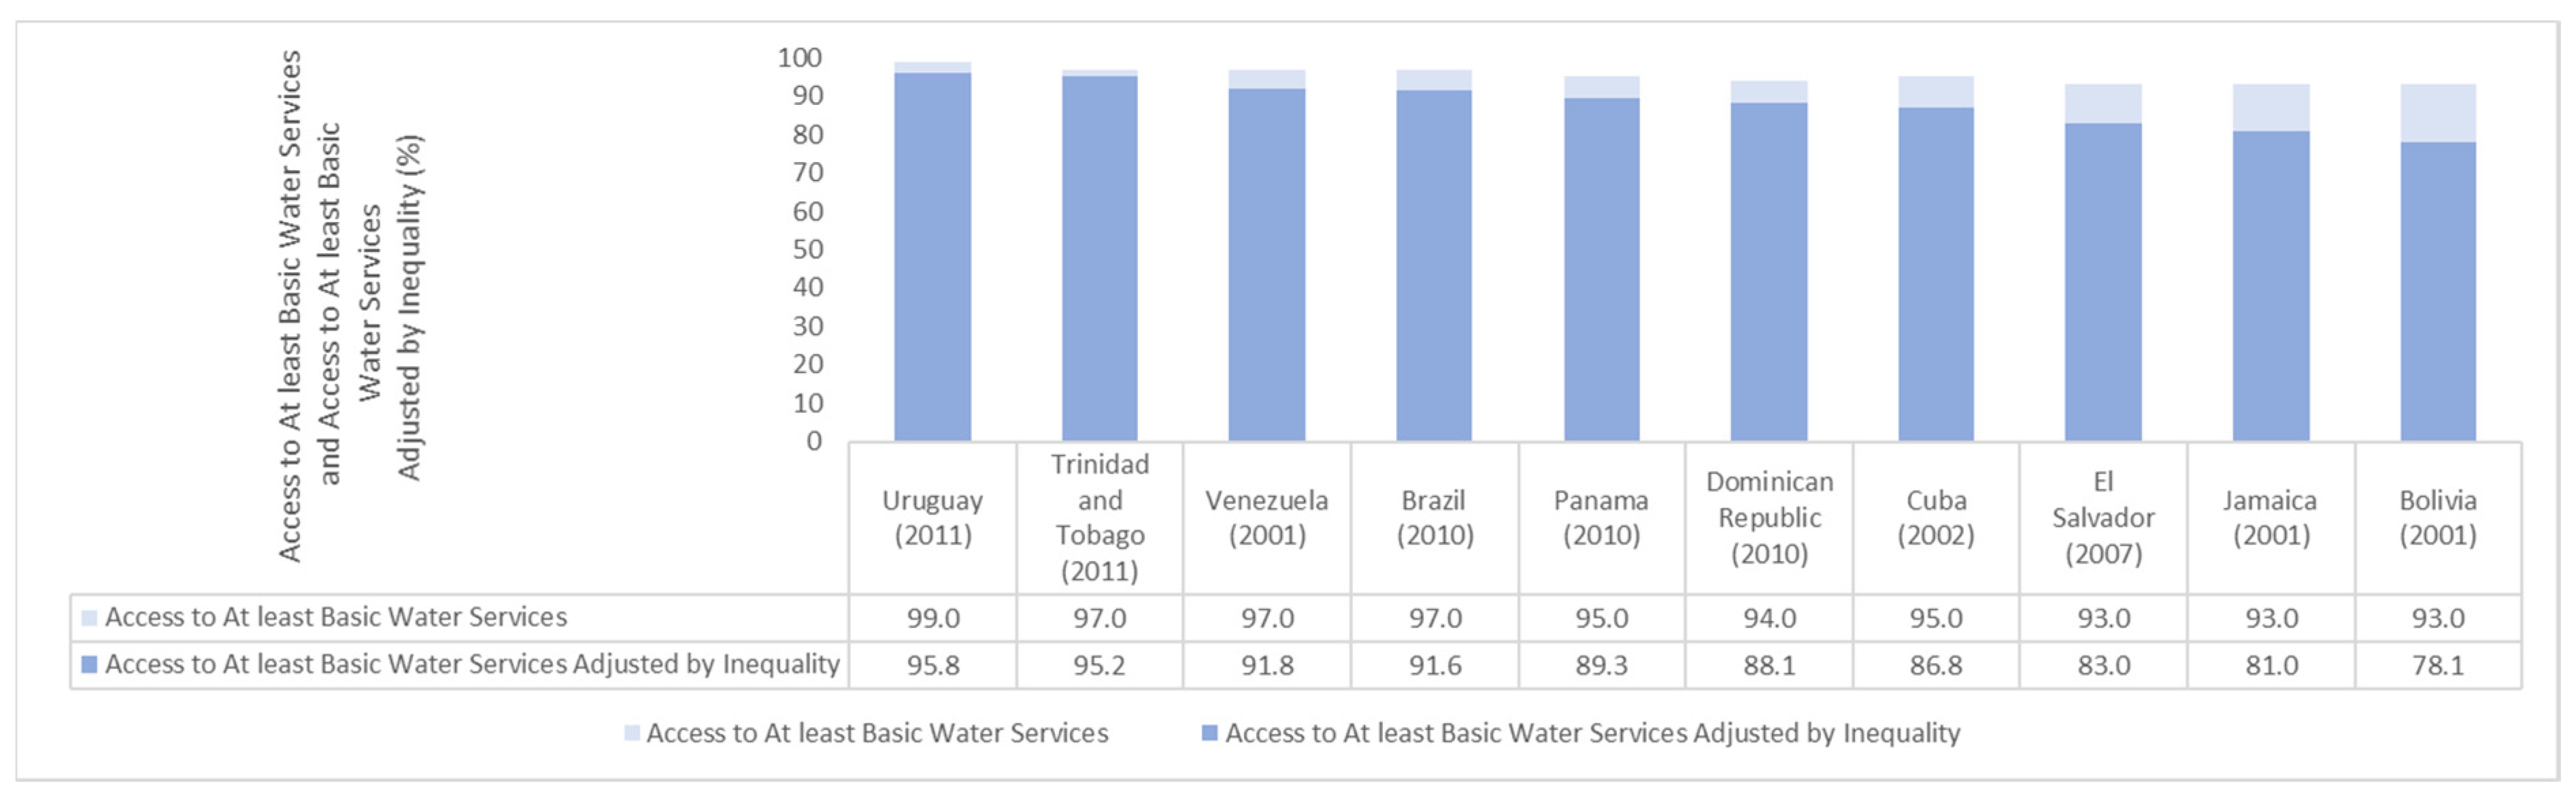
Access indexes adjusted for inequality were calculated by combining the data on access to services with the inequality factors. Whenever possible, the calculations were performed for the highest classification of the JMP’s services ladders (i.e., “safely managed services”). When there was not enough data, the category “at least basic” services (also used by the JMP) was used instead [10]. Figure 3 and Figure 4 shows the adjusted (IAIW) and non-adjusted access rates for water services:
Among the eight countries with sufficient data to classify “safely managed” water services, Argentina, Chile, and Costa Rica had the highest proportion of access and the lowest inequality factors. Mexico had the lowest service coverage at this level, but with a close adjusted index, with a difference of only 1.6 percentage points (p.p.). Colombia, Peru, and Nicaragua showed higher inequality factors; the latter had the highest difference between adjusted and non-adjusted access (13 p.p.). For ten countries, it was only possible to calculate the adjusted access index for “at least basic” water services. All of those countries had access rates higher than 90%. However, owing to inequalities, access rates in some countries (e.g., El Salvador, Jamaica, and Bolivia) were significantly adjusted with differences equal to or greater than 10 p.p.
Figure 5 and Figure 6 depict the adjusted (IAIS) and non-adjusted access rates for sanitation services.
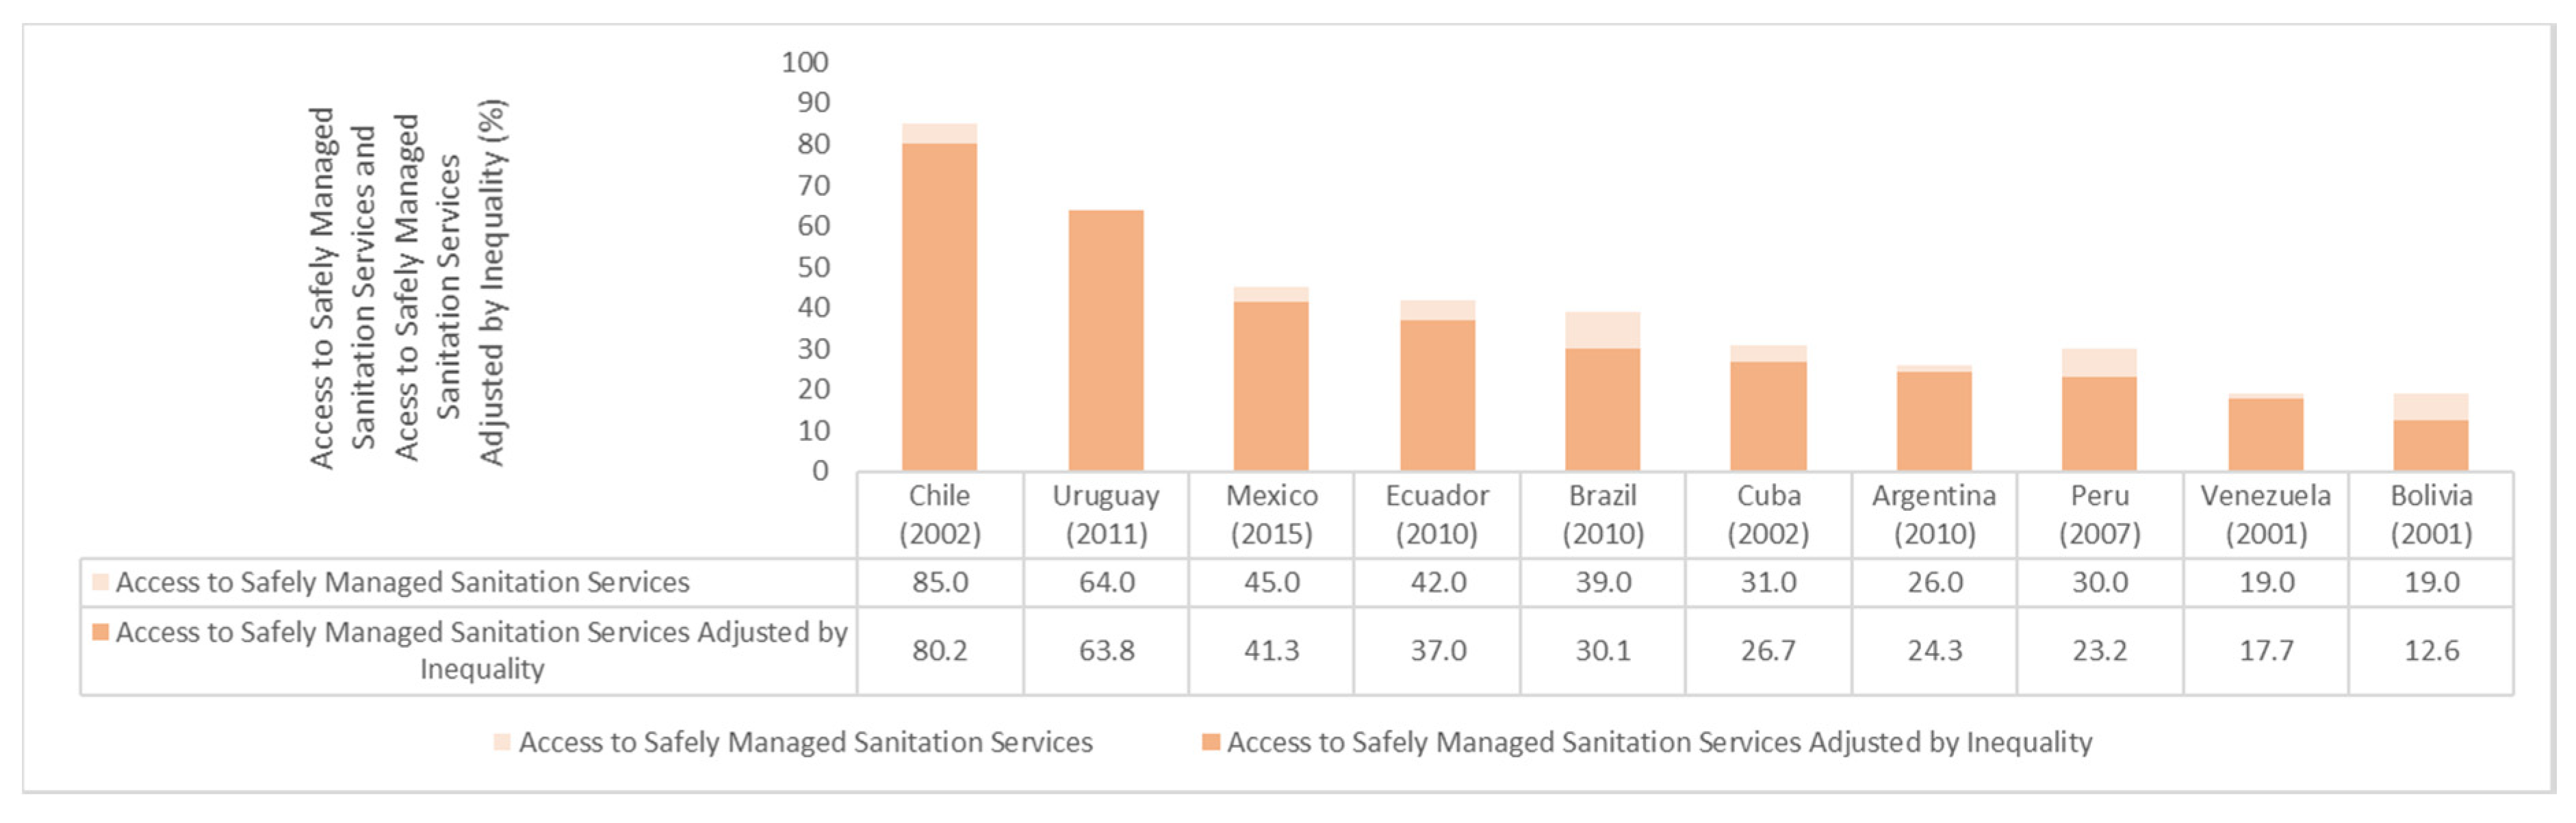
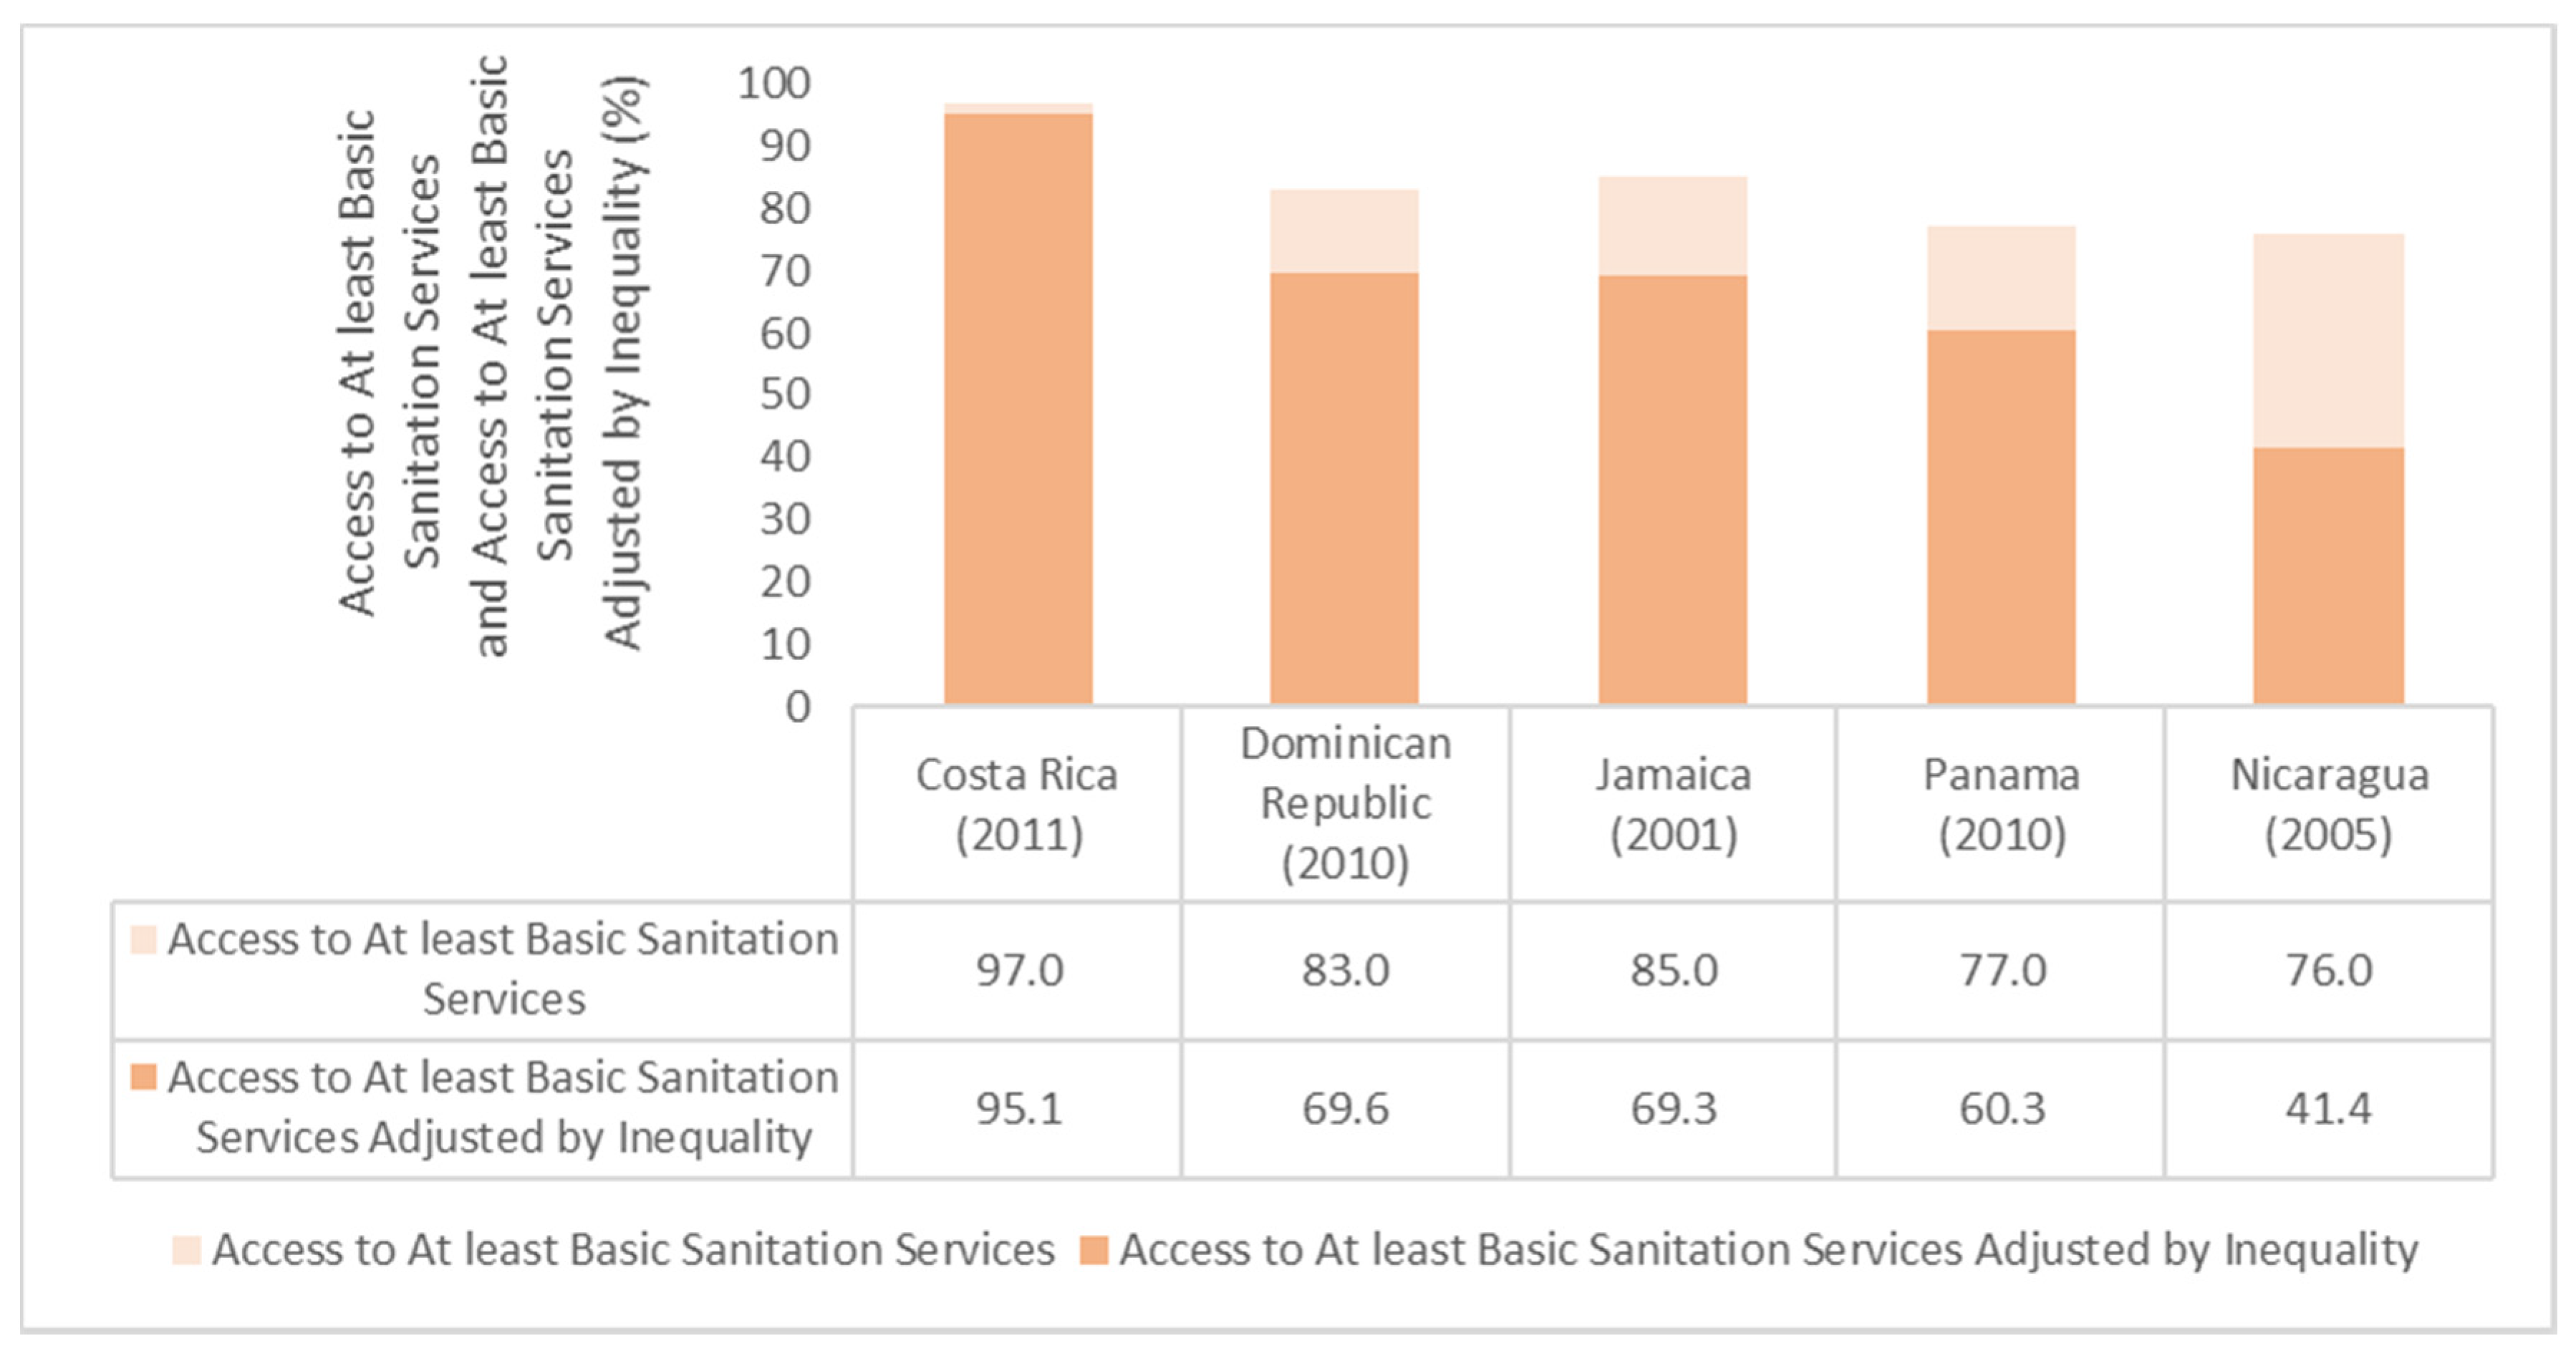
It was possible to calculate adjusted access to “safely managed” sanitation services at a national level for ten countries. Chile had the highest level of access but exhibited a higher inequality factor than Uruguay’s, the country with the most equitable access. Among the countries with the lowest access rates to services of this level, Argentina and Venezuela had the lowest inequality factors. Bolivia, Peru, and Brazil, beyond low levels of access, showed very high levels of inequality; Brazil’s adjustment was the highest (9 p.p.). In reference to access to “at least basic” sanitation services, the adjusted index was calculated for five countries. Apart from Costa Rica, which was only slightly penalized for inequality, the remaining countries were subject to substantial adjustments, varying from 13.4 p.p. in the Dominican Republic to 34.6 p.p. in Nicaragua.
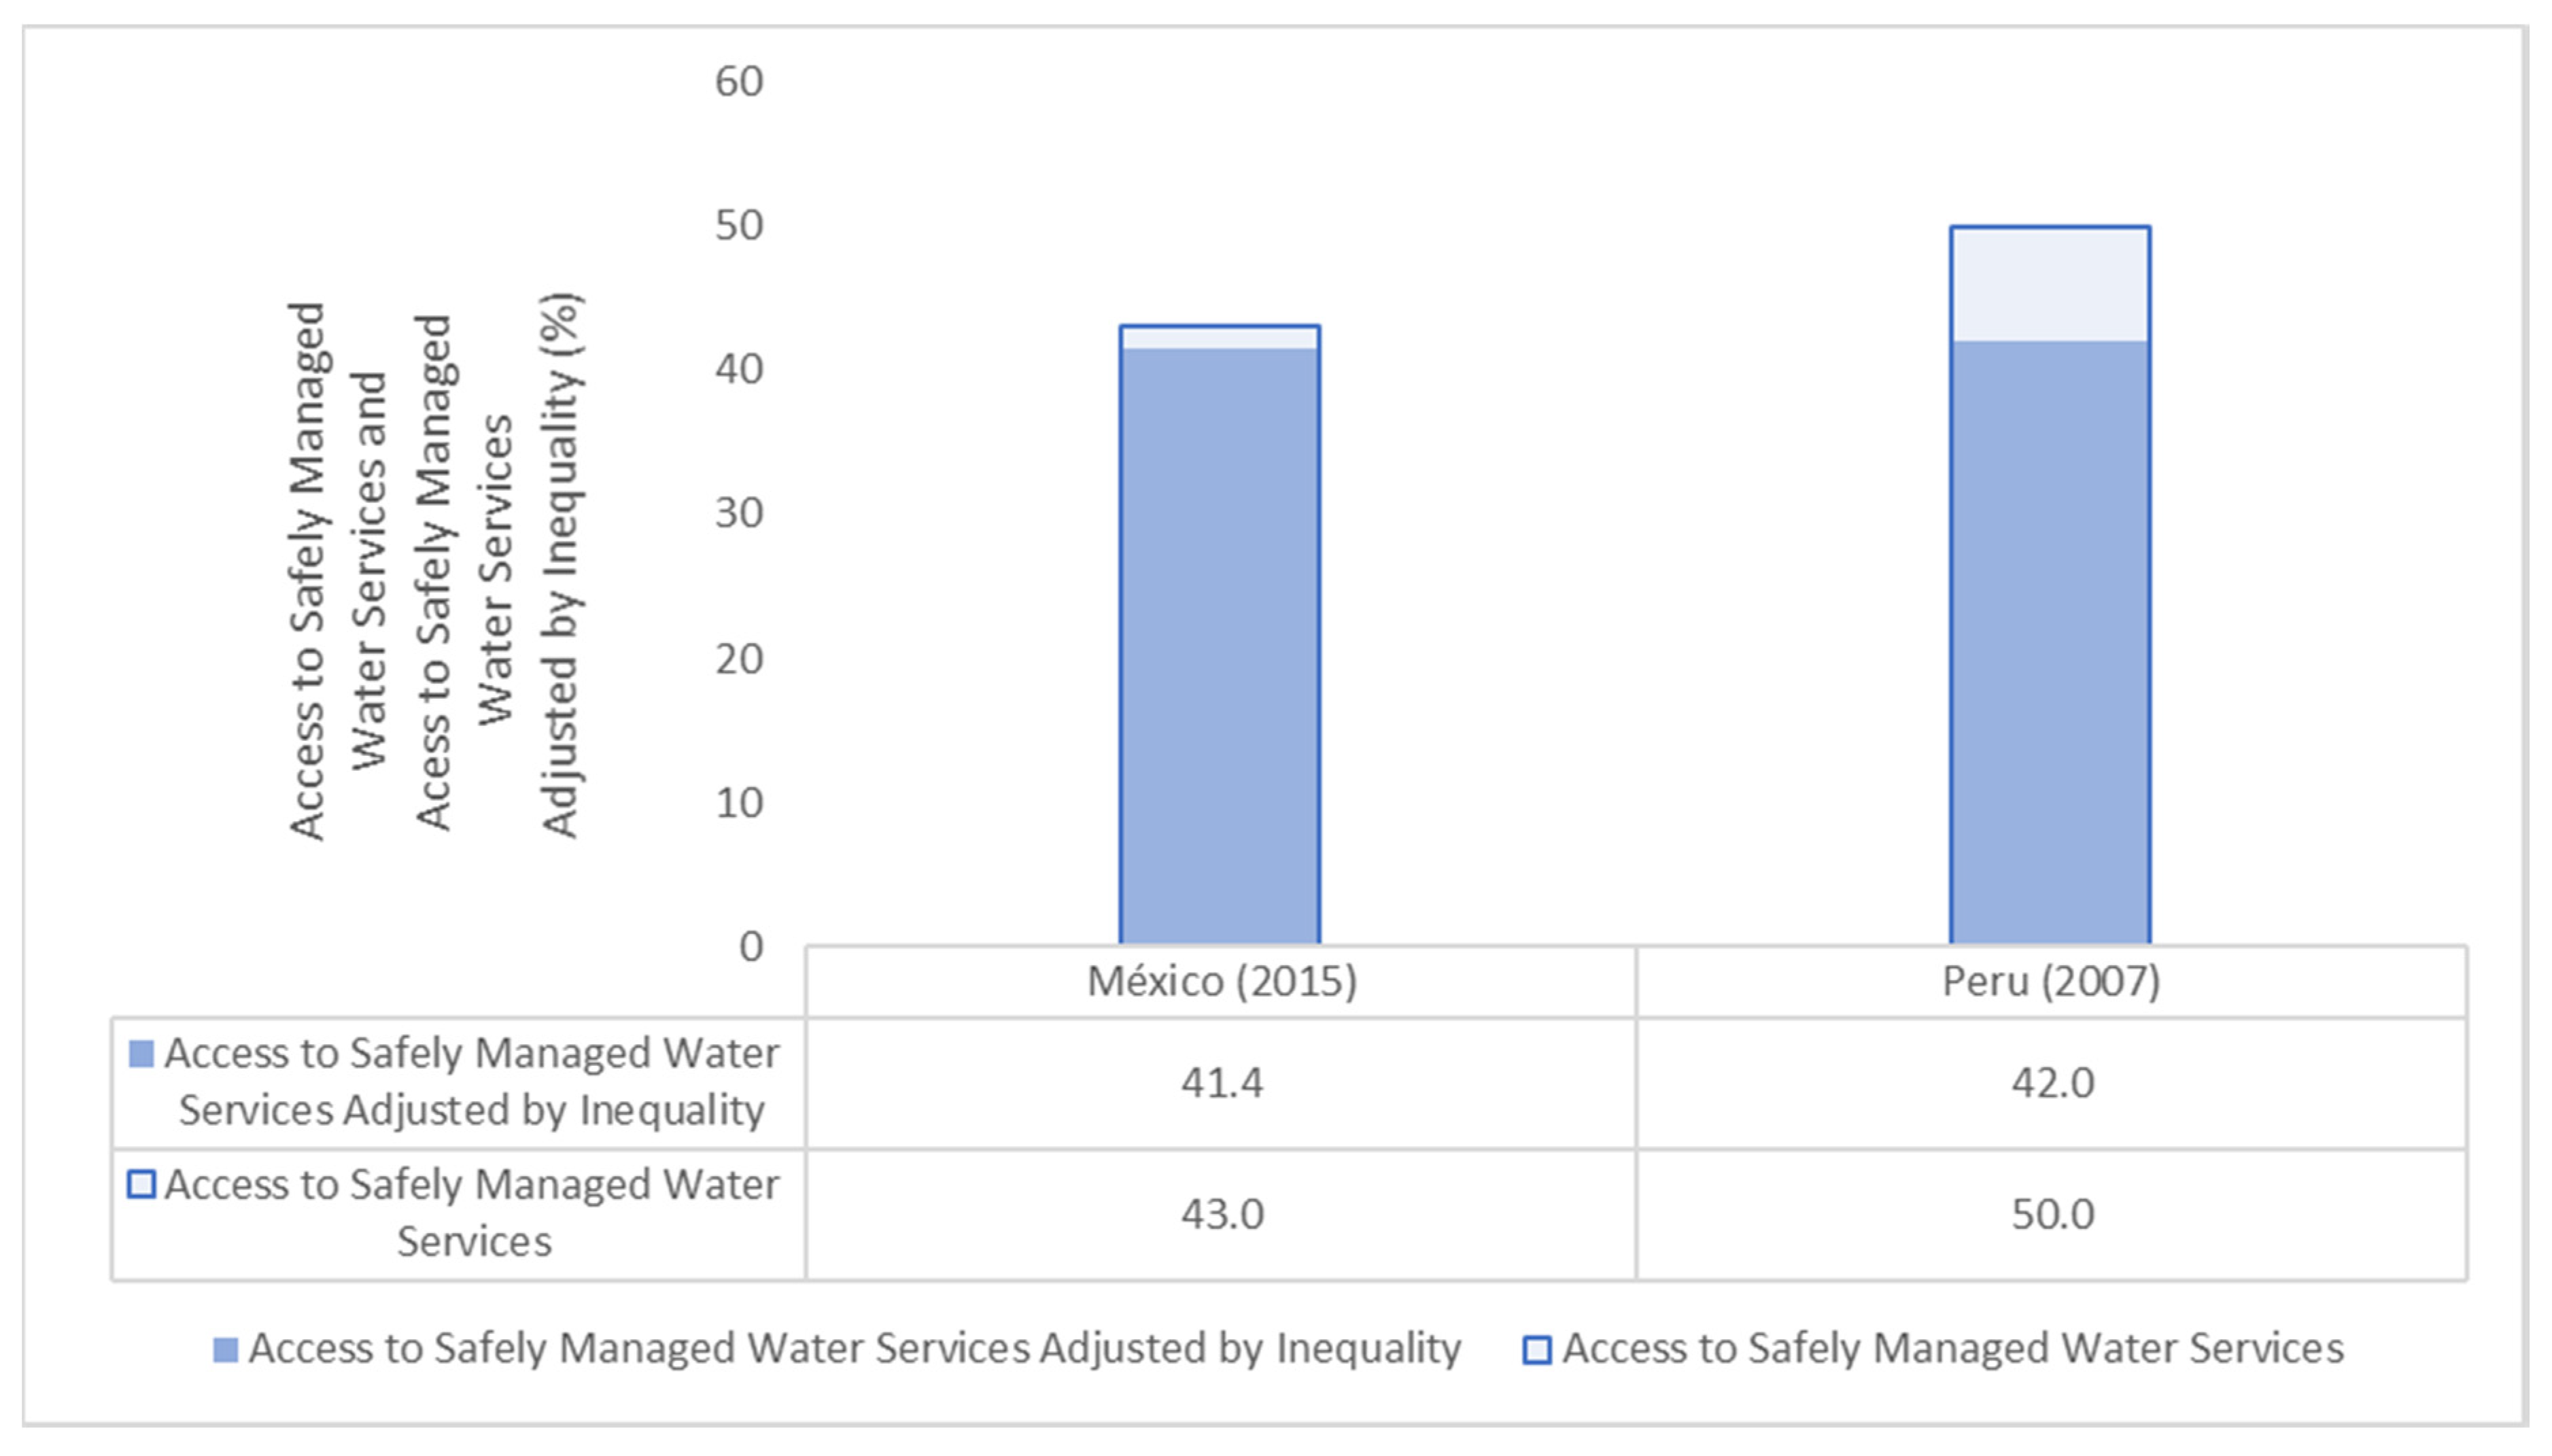
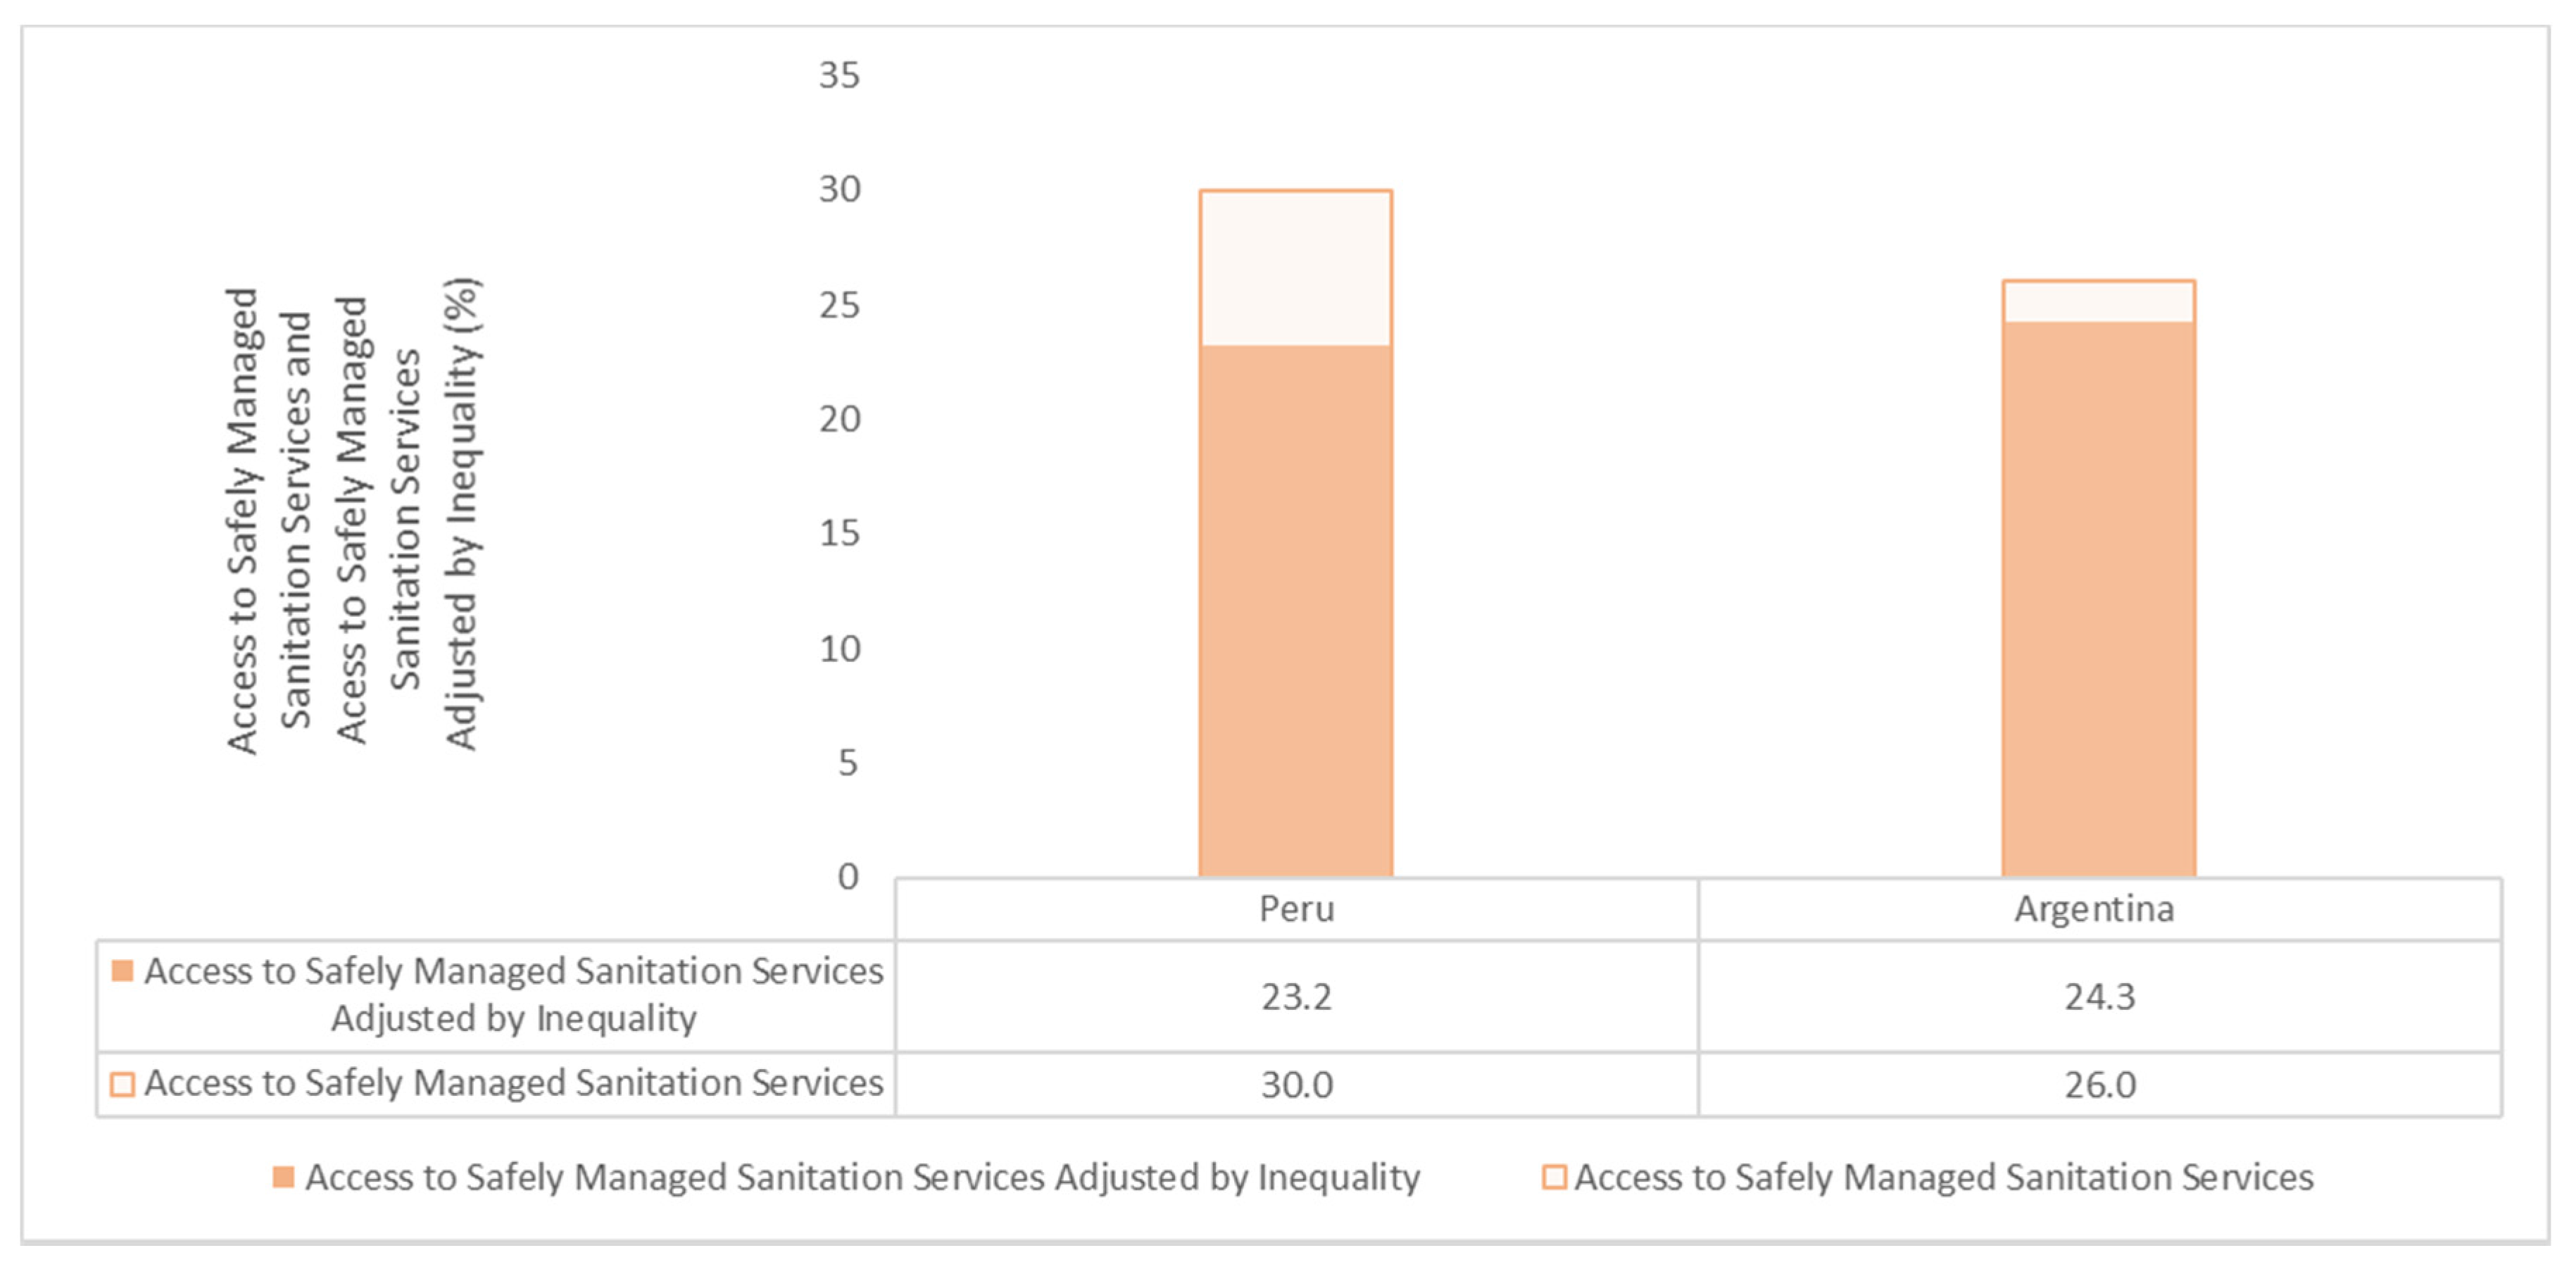
In order to show the analytical potential of adjusting access levels by inequality, Figure 7 and Figure 8 compare the adjusted and non-adjusted rates of access to “safely managed” water supply and sanitation services, respectively, between pairs of countries.
In comparing rates of access to “safely managed” water supply services in Mexico and Peru, a difference of 7 p.p. is observed between both countries. While in Peru, 50% of the population has access to this level of services, only 43% do in Mexico. However, when these rates are adjusted for inequality, their access levels become practically the same, revealing an accentuated level of inequality in Peru. In comparing rates of access to “safely managed” sanitation services in Argentina and Peru, penalization for inequality inverted the access levels between these countries. Before the adjustment, the indicator in Peru was four percentage points higher than that of Argentina but, after applying the inequality factor, Argentina showed a higher level of adjusted access than Peru.
3.2. Intersecting Forms of Inequality
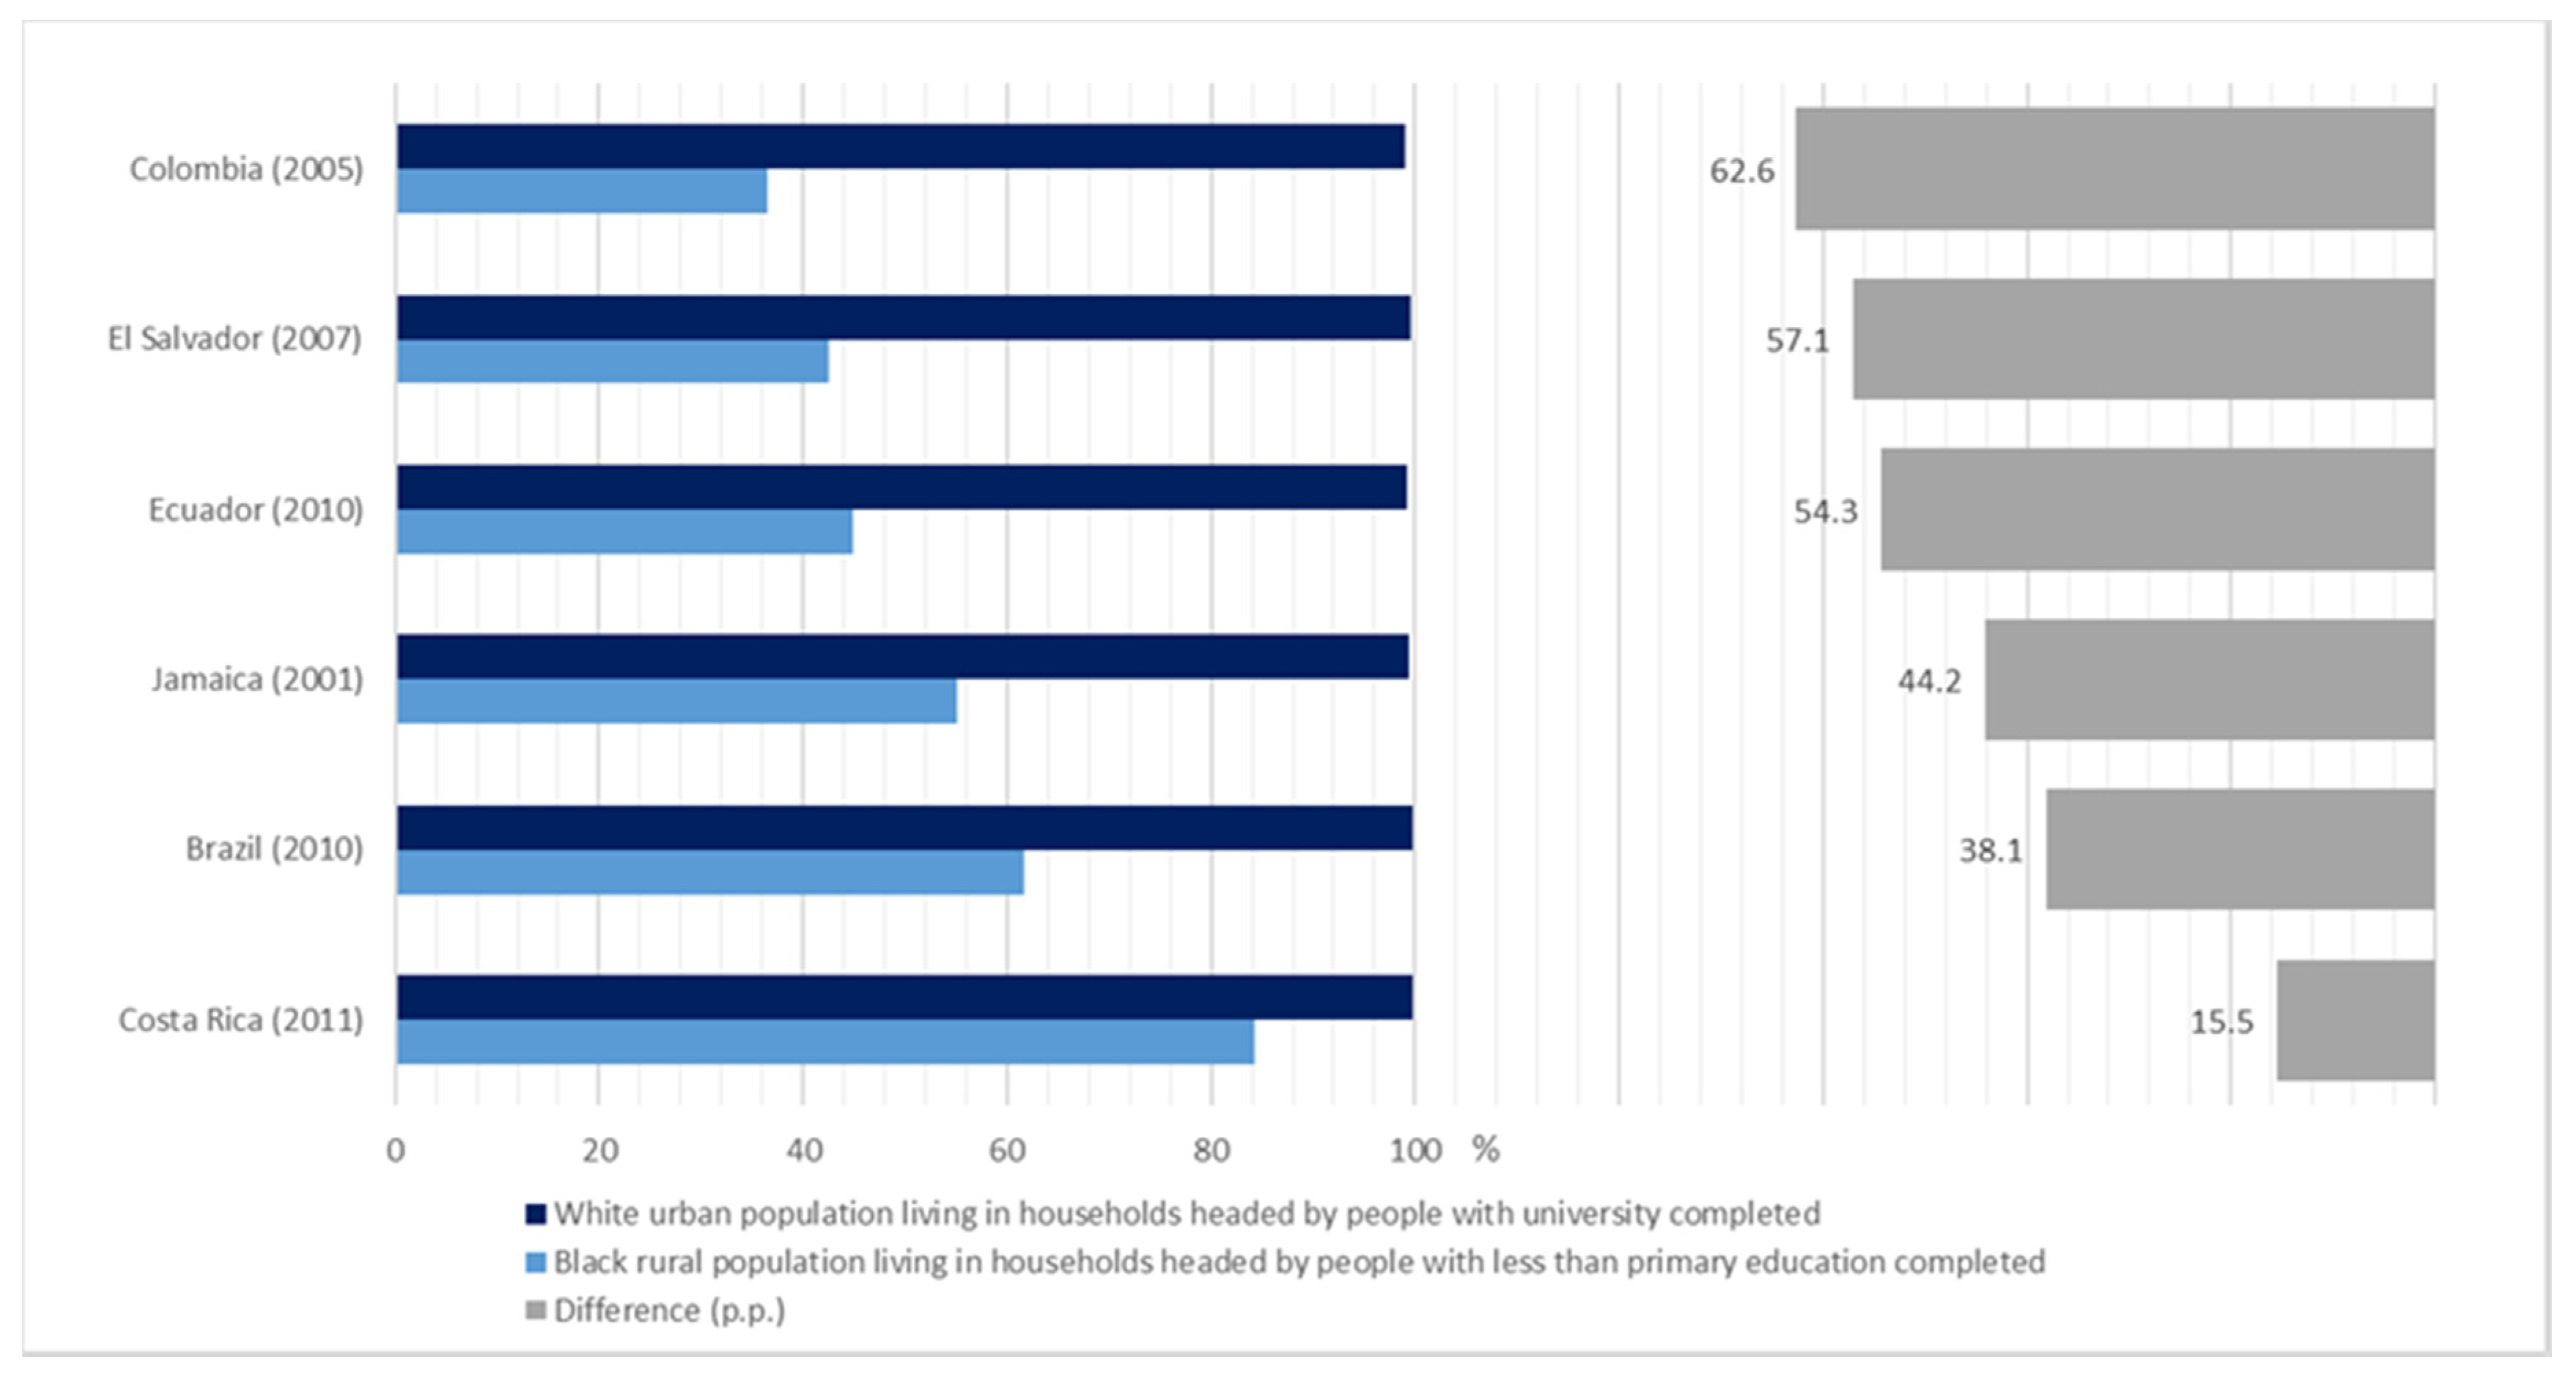
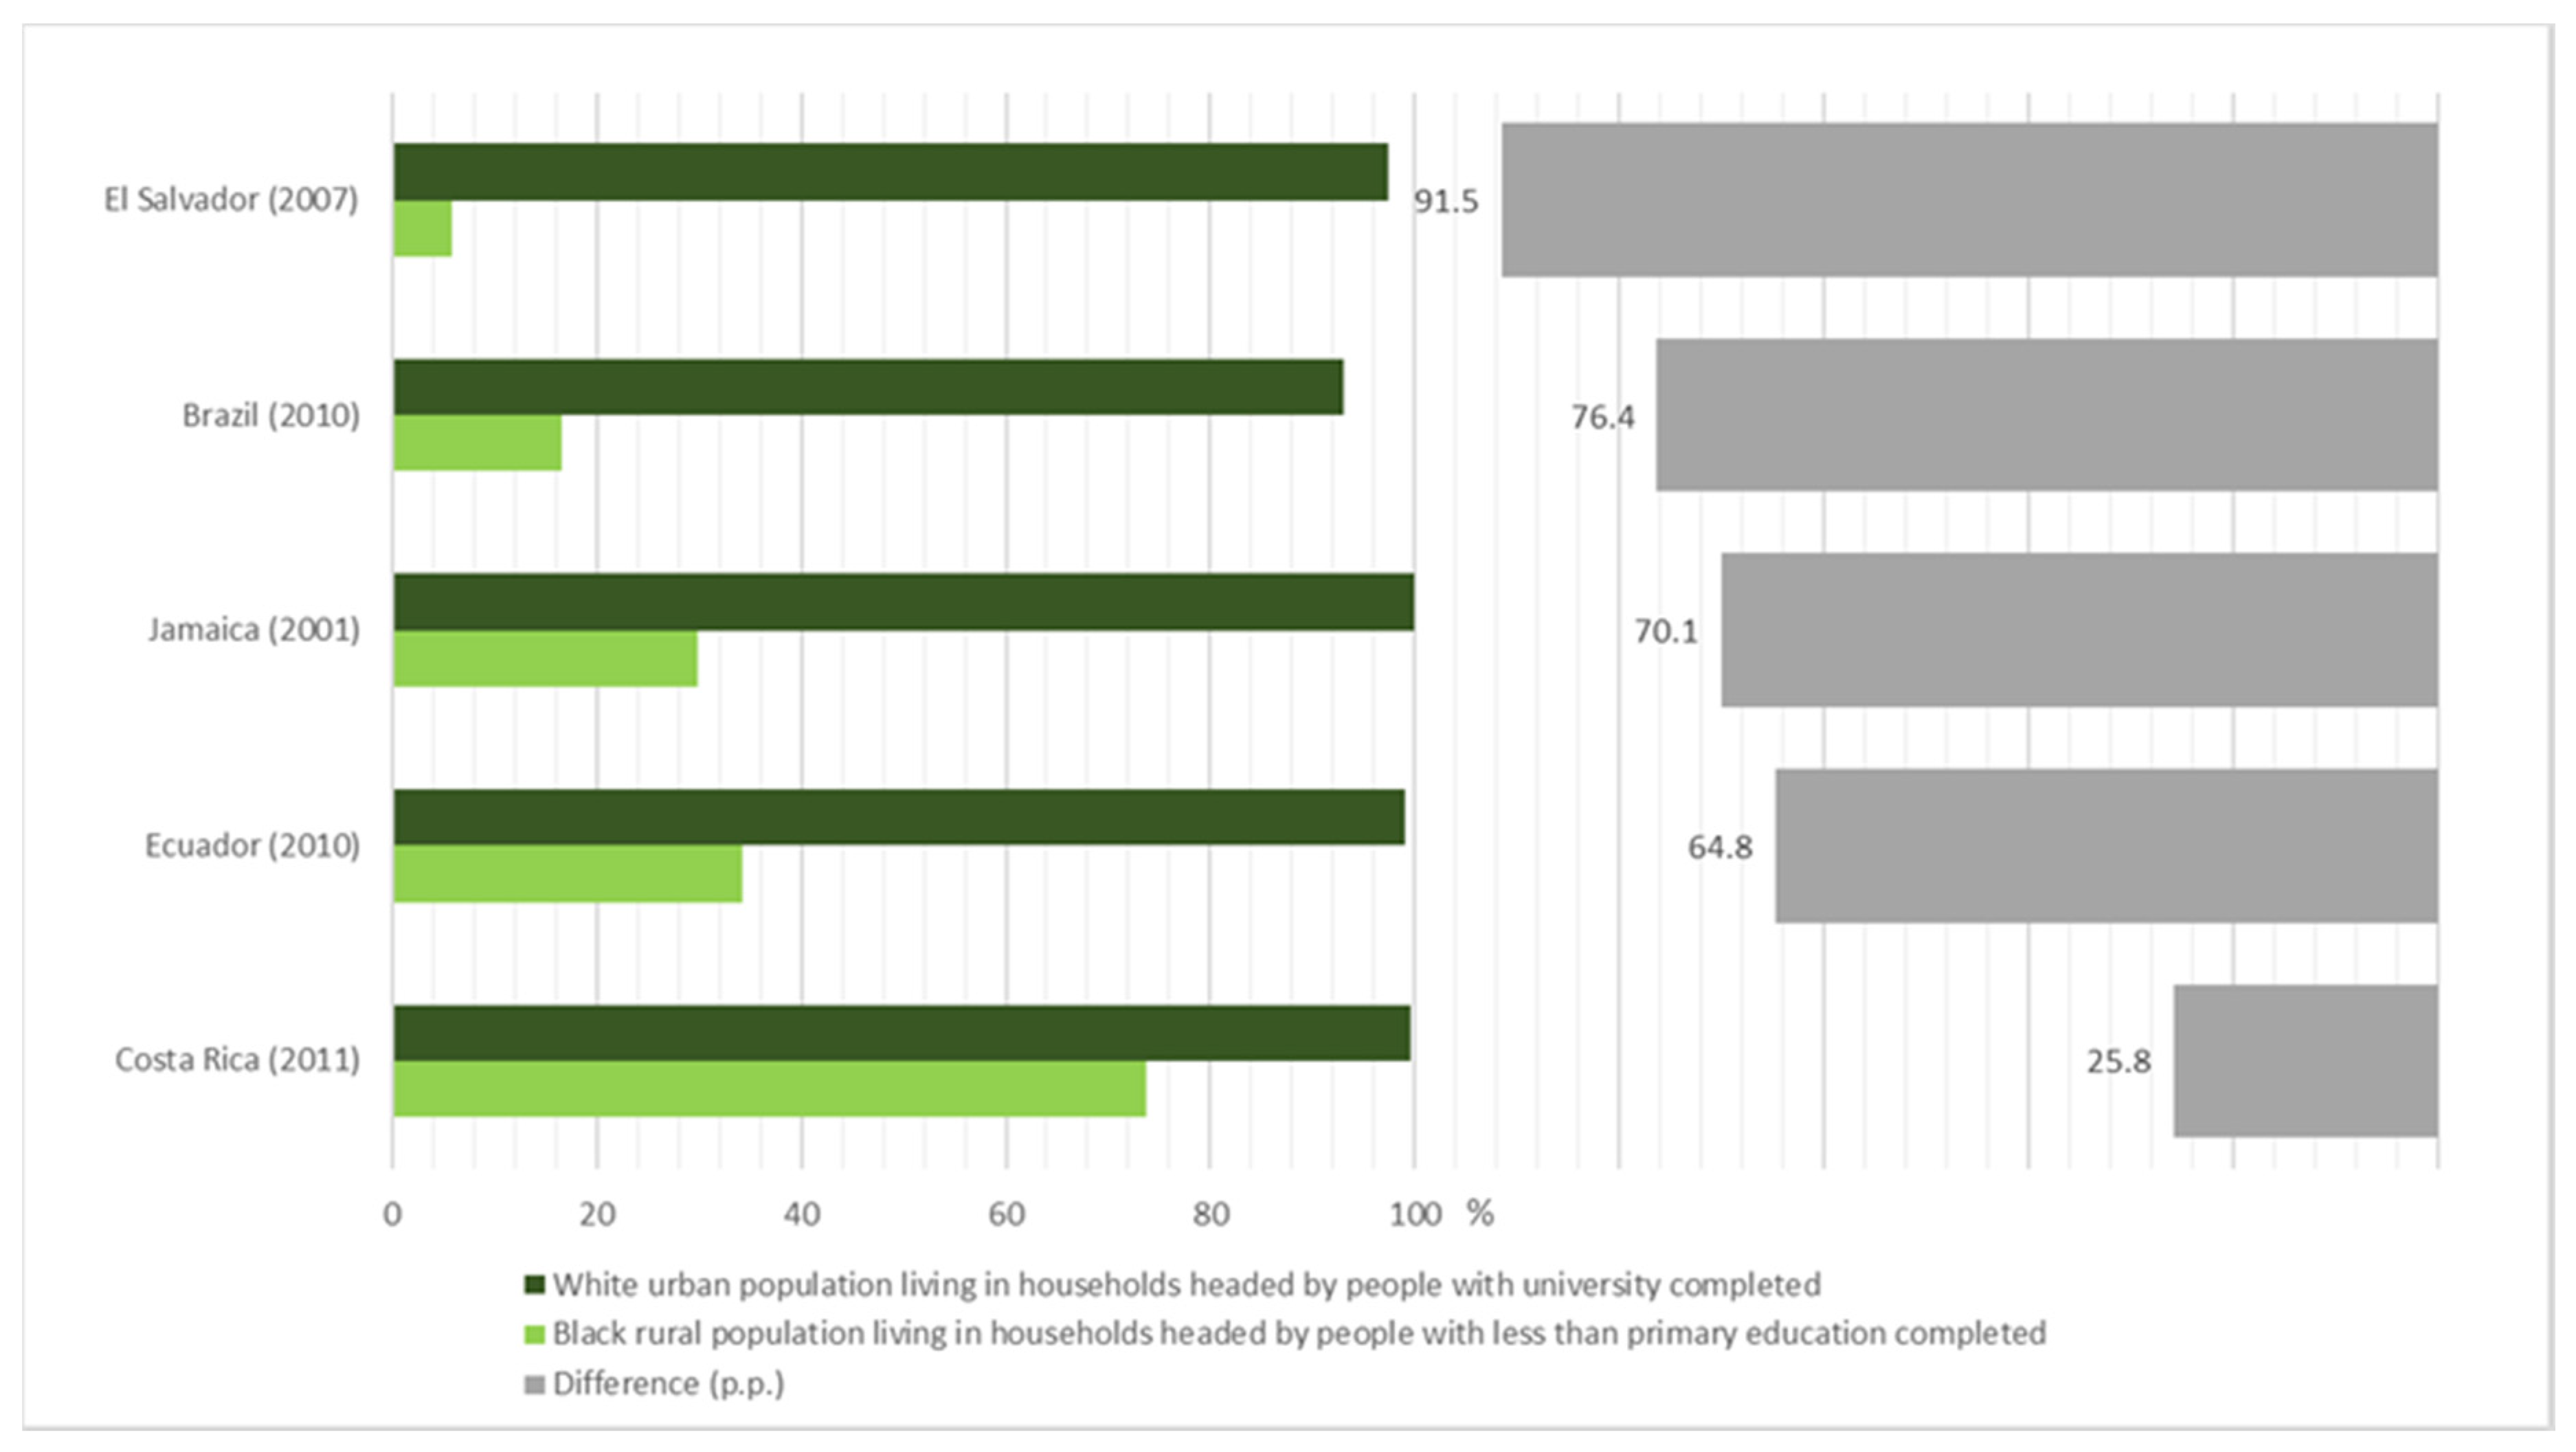
Figure 9 and Figure 10 show access to piped water and to sewerage or septic tanks for two specific population segments: the white urban population living in households headed by persons with higher education completed and the black rural population living in households headed by persons with less than primary education completed. Such profiles are antagonistic as regards susceptibility to socio-economic and environmental vulnerabilities, the former being less susceptible to deprivation of basic services (e.g., water and sanitation) and the latter being more susceptible.
In reference to piped water, of all the countries considered, the less vulnerable subgroup had a practically universal access level, higher than 99%. On the other hand, the access of the more vulnerable subgroup varied from 36.4% to 84.3% (Figure 9). The greatest inequality between both groups was observed in Colombia, where this difference was greater than 60 p.p. El Salvador had the second highest difference at 57, followed by Ecuador with 54. Costa Rica showed the lowest level of inequality, although the gap between both groups was still 15 p.p.
In reference to access via sewerage or septic tanks—which tends to be lower than access to piped water—Figure 10 shows even more accentuated differences between both groups. Apart from Costa Rica, in all the analyzed countries, the difference was greater than 64 p.p. In El Salvador, there was an abysmal difference of 91% between the more vulnerable and the less vulnerable group.
3.3. Comparative Analysis of Both Methods
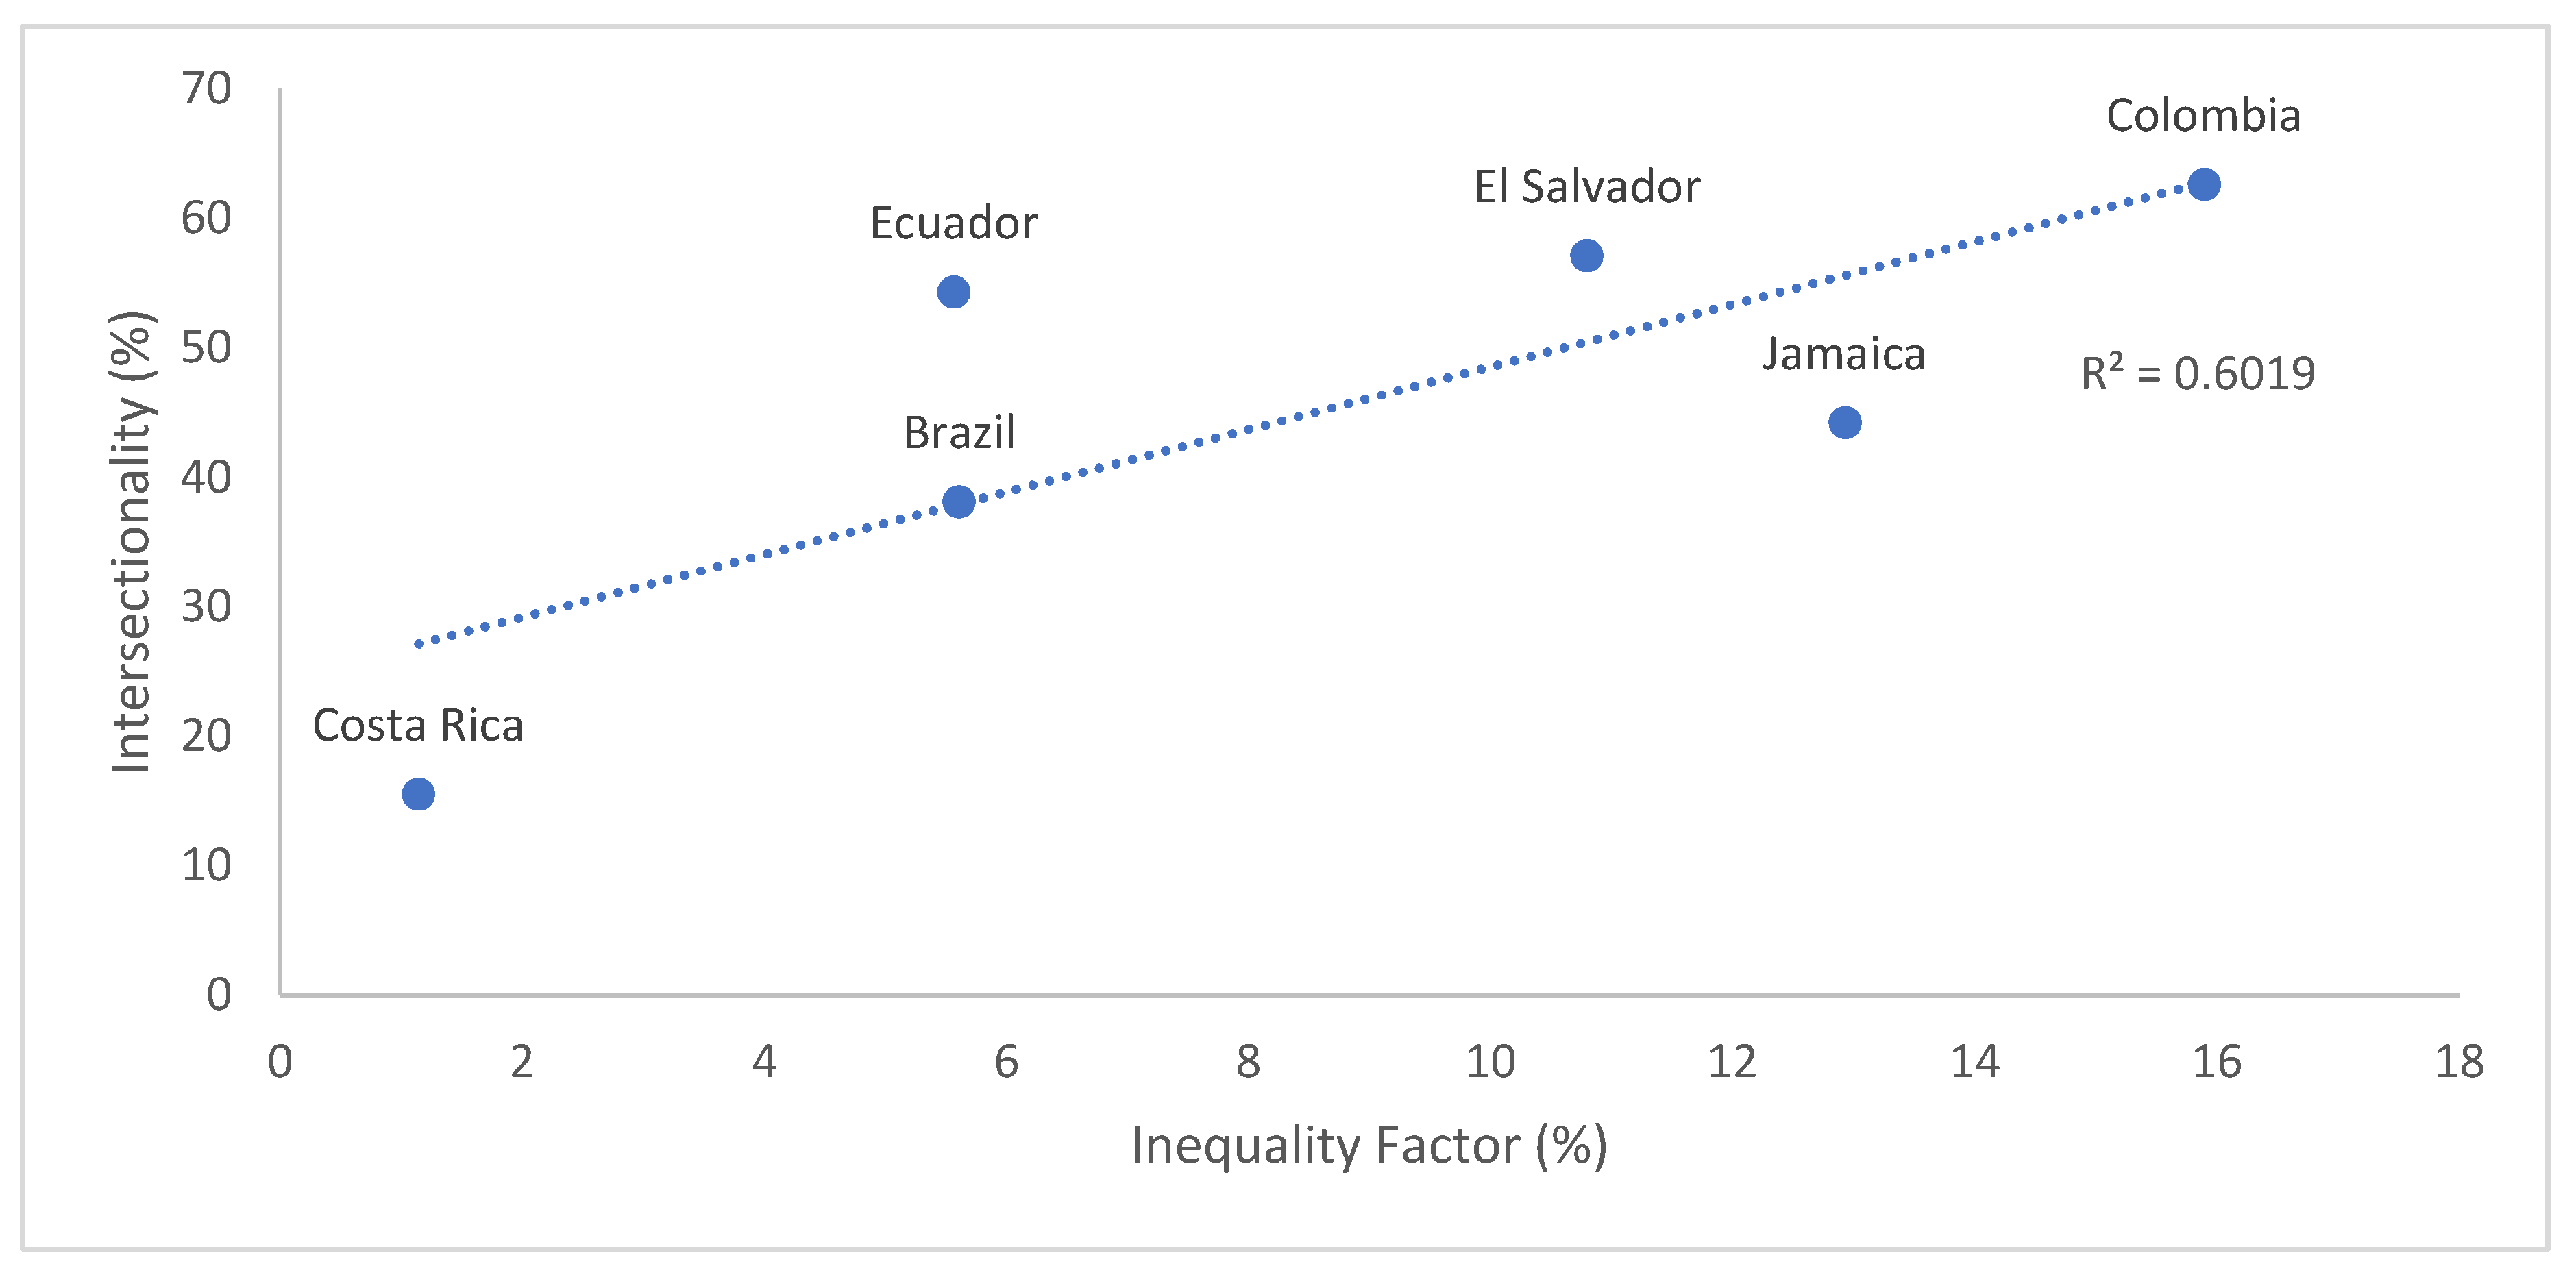
Figure 11 presents a linear regression of the values produced by the different methods of analysis of access to water services. The difference between the population subgroups of the intersectional analysis of inequality is depicted in the vertical axis, and the inequality factors are represented in the horizontal axis.
The result shows that the linear regression explains 60% of the observed variation in the “Intersectionality” variable (response variable). Although significant, some gaps can be appreciated. For example, although Ecuador and Brazil have the same inequality factor, the intersectional analysis reveals a higher level of access in Ecuador than in Brazil. This suggests that the most extreme forms of inequality are experienced by the more vulnerable population subgroup analyzed in Ecuador, despite this country having a similar average level of inequality to Brazil’s when considering the multiple criteria used to create the inequality factor. In El Salvador, the inequality observed through the intersectional analysis was greater than that of Jamaica, but this relationship is inverted with regard to their inequality factors. Following the same reasoning, this data suggests that differences between the subgroups selected for the intersectional analysis were less pronounced in Jamaica. On the other hand, considering all the criteria used to construct the inequality factor, the data points to a greater general level of inequality in Jamaica than in El Salvador.
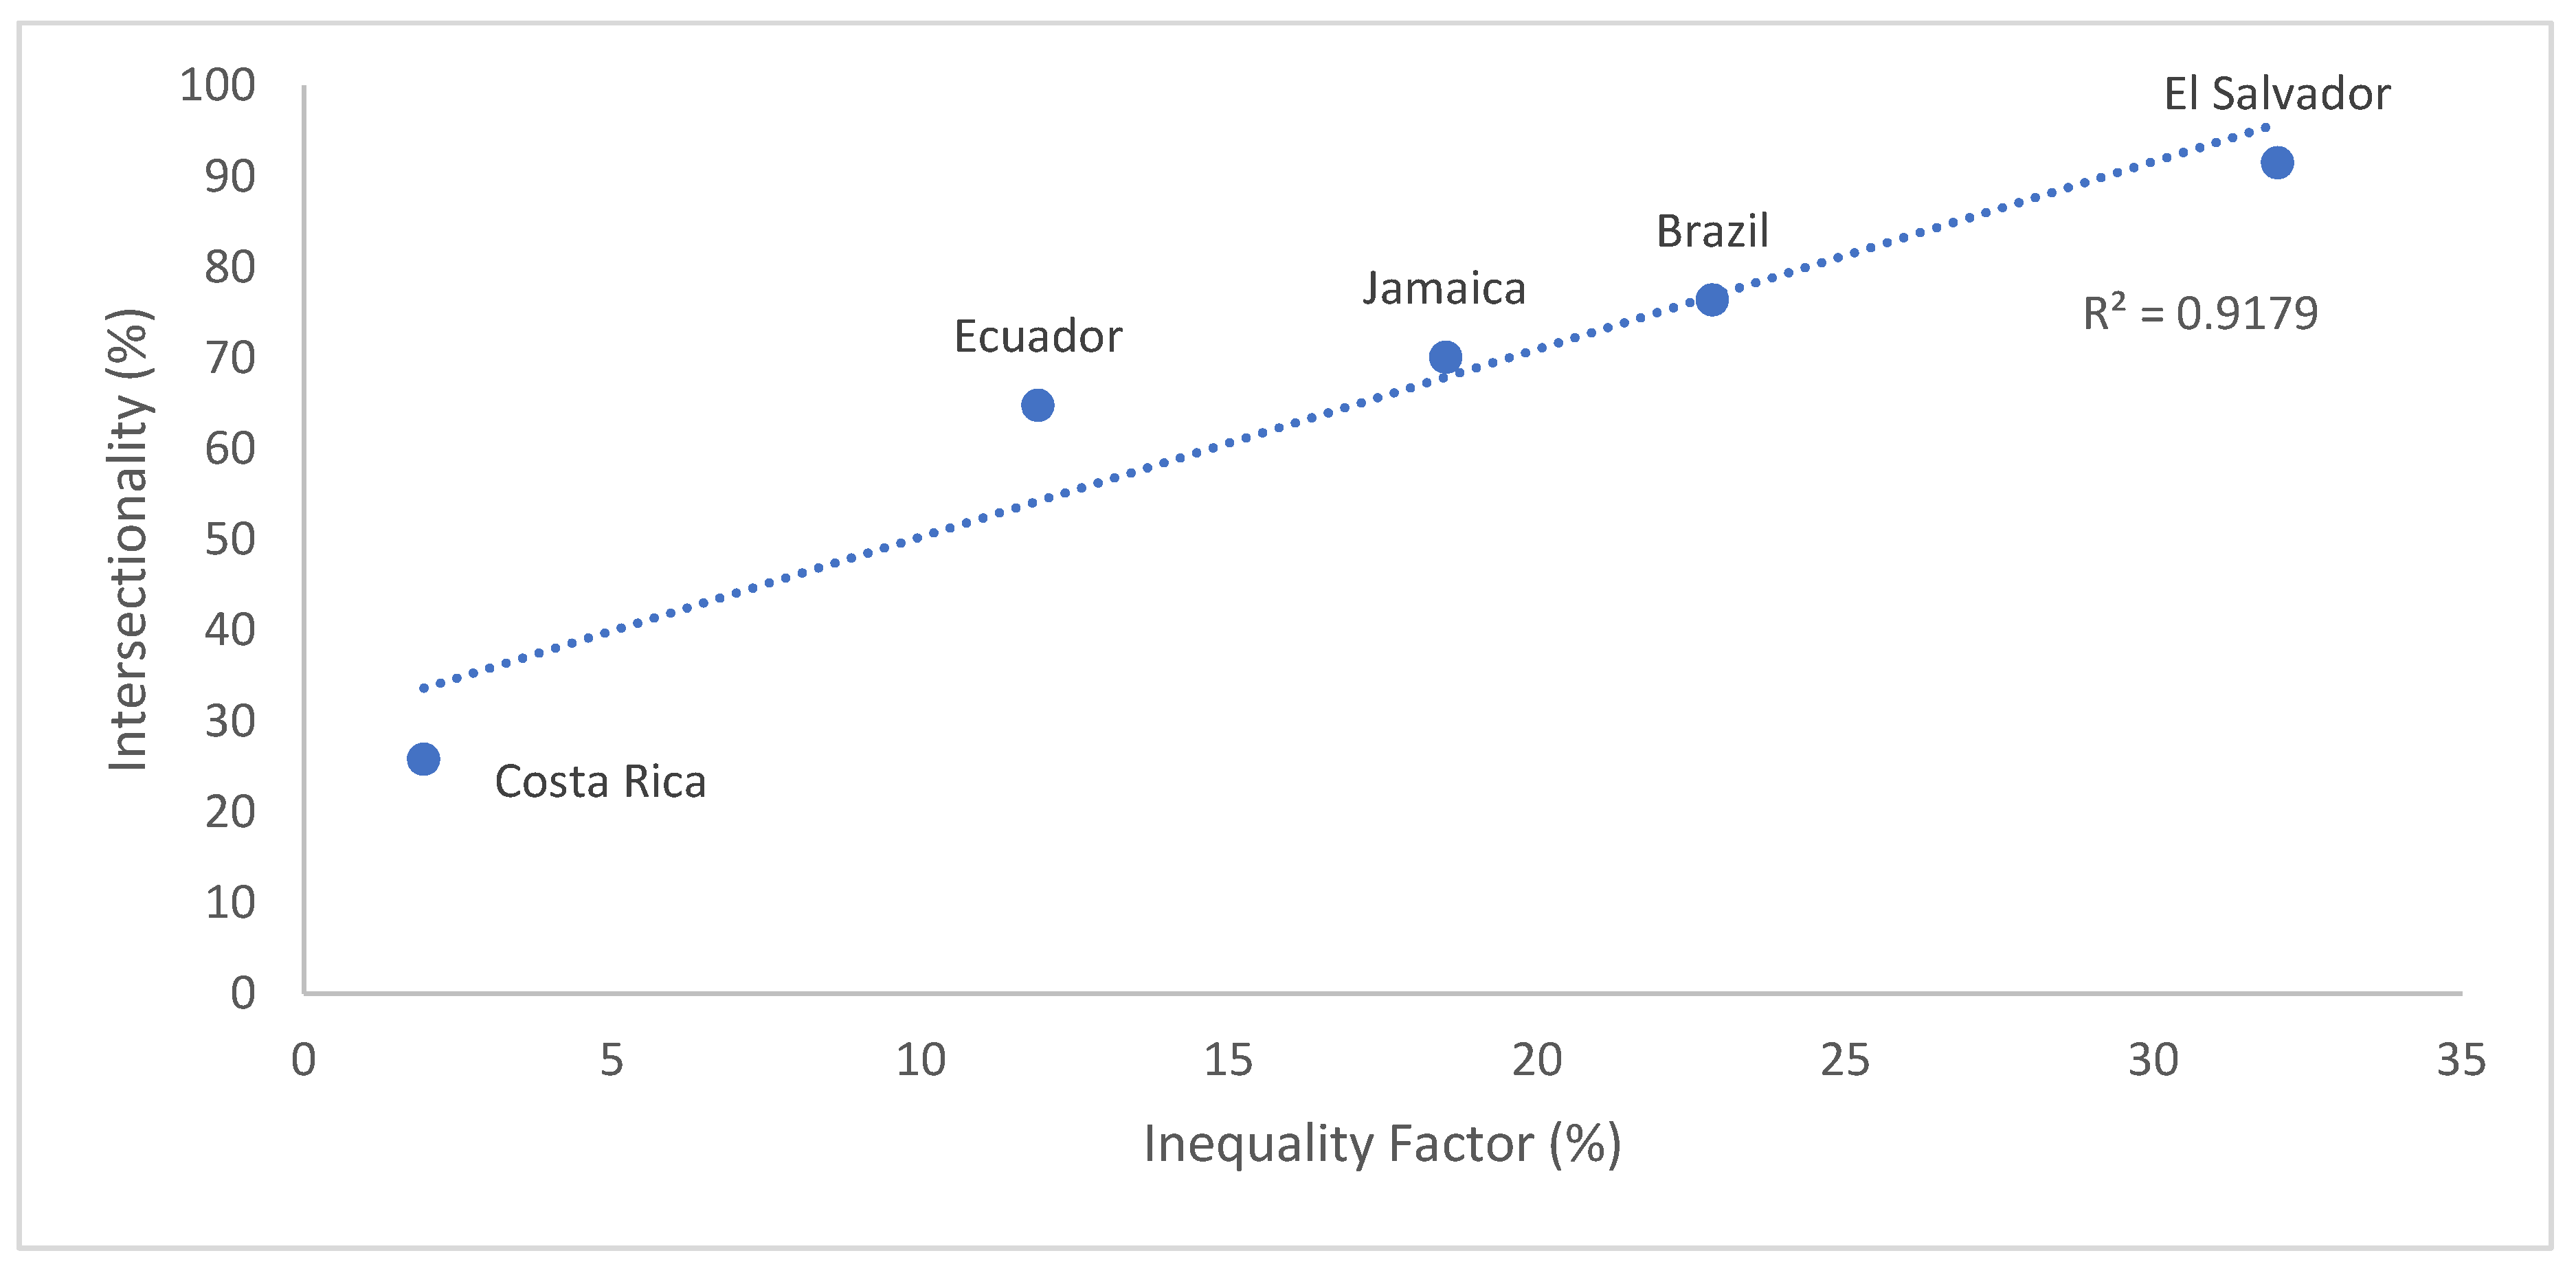
Like the previous figure, Figure 12 presents a graphic depiction of the values produced by the two methods of analysis of access to sanitation services, with the difference between the population subgroups of the intersectional analysis of inequality depicted in the vertical axis and inequality factors in the horizontal axis. In this case, 92% of the observed variation of the “Intersectionality” variable can be explained by the inequality factor, a very significant value.
4. Discussion
The methods developed and applied in this paper show the potential to contribute to bridging some of the gaps highlighted by the “Task Force on Monitoring Inequalities for the 2030 Sustainable Development Agenda” [15]. The methodology of calculating access adjusted for inequality has the merit of explicitly incorporating this dimension into monitoring efforts focusing on access to WASH services. Indeed, while inequality is a fundamental aspect of Targets 6.1 and 6.2, it is omitted from Indicators 6.1.1 and 6.2.1 [13,14,16,17]. Besides their conceptual robustness, the adjusted indexes are easy to calculate and understand. They allow comparisons between countries, can be graphically depicted, and can be used at different scales. Mapping inequality factors (part of the calculation of adjusted indexes) offers the possibility of creating synthetic visual representations of diverse types of inequalities, in addition to meeting the demand to use spatial information when monitoring inequalities. In its turn, the intersectional analysis of inequality evidence how different characteristics can overlap and intensify disparities in access to services. The integrated analysis of different inequality-inducing attributes can complement and enrich analyses of data disaggregated by specific characteristics, thus satisfying another of the monitoring demands pointed out by the Task Force.
Both methods presented herein have the common objective of shedding light on the inequality hidden within aggregate data on access [6,13,14], but, given their distinct approaches, a comparative analysis was performed. In theory, the methodology focusing on intersecting forms of inequality shows the highest levels of inequalities than the methodology for indexes adjusted for inequality. In the former, inequality criteria overlap in the same subgroups that represent only a segment of the population (composed of one subgroup particularly susceptible to situations of vulnerability and a particularly privileged subgroup in what regards access to WASH services). Conversely, the methodology for access adjusted by inequality factor encompasses countries’ total populations, considering various inequality criteria together or in parallel. In other words, different “layers” of inequality may or may not overlap in the same individuals and groups. One of the main distinctions between both methodologies is that, beyond the simple divide between urban and rural areas, adjusted indexes take subnational spatial inequalities into account. This means that great regional heterogeneity (as observed in Brazil, for example) can intensify the inequality reflected in the adjusted indexes in relation to the intersectional analysis methodology. However, it is worth noting that the regional sub-divisions used were the most spatially aggregated levels adopted in the corresponding countries (e.g., provinces or states), which is to say, there is no direct relationship between territories’ area and regional inequality levels.
Although related, there is no redundancy in using both methods, as they complement one another. While indexes adjusted for inequality are useful to obtain a broad overview of national inequalities regarding access to WASH services, they can mask extreme differences between specific population segments. The exclusive use of the methodology focusing on intersecting forms of inequality can induce overestimations of inequalities based on a reduced sample of a population, besides overlooking regional inequalities at a subnational level.
The main limitation in applying these methods has to do with the lack of quality and availability of updated information needed to perform the necessary calculations, a recurring problem for assessment and monitoring efforts [11]. Normally, census researchers focus on access to facilities alone, not on the quality of water supply and sanitation services. This makes analyses on important matters related to inequality impossible, such as quality and availability.
5. Conclusions
This paper presents two complementary methods to evaluate and monitor inequalities in access to water supply and sanitation services. While access indexes adjusted for inequality allow this dimension to be incorporated into access indicators, the integrated analysis of intersecting forms of inequality allows the assessment of the overlapping effects of disadvantageous characteristics affecting certain population segments. Both methods show potential improvements in relation to the current methodology adopted in global monitoring of SDGs 6.1 and 6.2. They can have an outcome in informing public policies of water and sanitation, as they allow comparisons between countries, identifying equalities gaps in service provision and formulation of policies focused on certain groups. The methods can also be used at subnational scales, representing an improvement in monitoring strategies.
Applying both methods does hinge on the availability and quality of data, one of the great barriers to adequately monitoring inequality in access to WASH services. Nevertheless, the goal of this paper is to present and test both methods by using the data available for the countries of Latin America and the Caribbean.
It must be highlighted how crucially important it is for census and other household surveys to start to incorporate the new criteria proposed by the JMP to classify service levels for the proper monitoring of the SDG 6. Rather than focusing only on the existence of facilities, the quality of WASH services must also be captured. Furthermore, census data must allow associations with other demographic and socioeconomic variables to enable the assessment of the compliance with the Human Rights to Water and Sanitation (HRWS). The recognition of the normative content of the HRWS in the SDGs and respective targets must be incorporated in the related indicators to enable adequate monitoring of inequalities in the access to WASH services. In turn, this would support the formulation of public policies and the institutionalization of the commitments made in the 2030 Agenda for Sustainable Development.
Author Contributions
Conceptualization, V.C.Q., R.C.d.C., and L.H.; methodology, V.C.Q. and R.C.d.C.; formal analysis, V.C.Q., R.C.d.C., and L.H.; writing—original draft preparation, V.C.Q. and R.C.; writing—review and editing, R.C.d.C. and L.H.; supervision, L.H.; project administration, L.H.; funding acquisition, L.H. All authors have read and agreed to the published version of the manuscript.
Funding
This research was funded by Pan American Health Organization (PAHO).
Acknowledgments
Teófilo Monteiro, Coordinator of the Regional Technical Team on Water and Sanitation (ETRAS) of the PAHO, Engineer. Rosa Maria Alcayhuamán and Economist. Hildegardi Venero, and secretary of Cecília Barrios—ETRAS-OPAS.
Conflicts of Interest
The authors declare no conflict of interest.
References
- United Nation. General Comment No. 15: The Right to Water (Arts. 11 and 12 of the Covenant); UN: New York, NY, USA, 2002. [Google Scholar]
- WHO/UNICEF. Global Water Supply and Sanitation Assessment 2000 Report; UNICEF: New York, NY, USA, 2000; p. 88. [Google Scholar]
- Rezende, S.; Wajnman, S.; Carvalho, J.A.M.; Heller, L. Integrando oferta e demanda de serviços de saneamento: Análise hierárquica do panorama urbano brasileiro no ano 2000. Eng. Sanit. Ambient. 2007, 12, 90–101. [Google Scholar] [CrossRef] [Green Version]
- Cumming, O.; Slaymaker, T. Equality in Water and Sanitation Services; Routledge: Abingdon upon Thames, UK, 2018; p. 320. Available online: https://www.routledge.com/Equality-in-Water-and-Sanitation-Services-1st-Edition/Cumming-Slaymaker/p/book/9781138203518 (accessed on 25 March 2020).
- Luh, J.; Baum, R.; Bartram, J. Equity in water and sanitation: Developing an index to measure progressiverealization of the human right. Int. J. Hyg. Environ. Health 2013, 216, 662–671. [Google Scholar] [CrossRef] [PubMed]
- Pullan, R.; Freeman, M.C.; Gething, P.W.; Brooker, S.J. Geographical inequalities in use of improved drinking water supply and sanitation across sub-Saharan Africa: Mapping and spatial analysis of cross-sectional survey data. PLoS Med. 2014, 11, e1001626. [Google Scholar] [CrossRef] [PubMed] [Green Version]
- Nahas, M.I.P.; Moura, A.S.A.; Carvalho, R.C.; Heller, L. Desigualdade e discriminação no acesso à água e ao esgotamento sanitário na Região Metropolitana de Belo Horizonte, Minas Gerais, Brasil. Cad. Saúde Pública 2019, 35, e0010–e0818. [Google Scholar] [CrossRef] [PubMed] [Green Version]
- He, W.-J.; Lai, Y.; Lai, Y.-S.; Karmacharya, B.M.; Dai, B.-F.; Hao, Y.-T.; Xu, D.R. Geographical heterogeneity and inequality of acess to improved drinking water supply and sanitation in Nepal. Int. J. Equity Health 2019, 17, 1–14. [Google Scholar]
- Winkler, I. Glass half-full or glass half-empty? A human rights assessment of the wash targets in the SDGs. Soc. Altern. 2018, 37, 25–33. [Google Scholar]
- Giné-Garriga, R.; Flores-Baquero, O.; Jiménez-Fdez De Palencia, A.; Pérez-Foguet, A. Monitoring sanitation and hygiene in the 2030 Agenda Sustainable Development: A review through the lens of human rights. Sci. Total Environ. 2017, 580, 1108–1119. [Google Scholar] [CrossRef] [PubMed]
- WHO/UNICEF JMP. Progress of Drinking Water, Sanitation and Hygiene. Update and SDG Baselines; WHO/UNICEF/JMP: New York, NY, USA, 2017; p. 110. [Google Scholar]
- OHCHR. Mandate of the Special Rapporteur on the Human Rights to Safe Drinking Water and Sanitation Open Letter from the United Nations Special Rappourter on the Human Rights to Safe Drinking Water and Sanitation, Mr. Léo Heller, to the WHO-UNICEF Joint Monitoring Programme for WASH; United Nation Human Rights: Geneva, Switzerland, 2017. [Google Scholar]
- Roche, R.; Bain, R.; Cumming, O. A long way to go—Estimates of combined water, sanitation and hygiene coverage for 25 sub-Saharan African countries. PLoS ONE 2017, 12, e0171783. [Google Scholar]
- Adams, E.A.; Smiley, S.L. Urban-rural water access inequalities in Malawi: Implications for monitoring the sustainable development goals. Nat. Resour. Forum 2017, 42, 217–226. [Google Scholar] [CrossRef]
- WHO/UNICEF/JMP. Task Force on Monitoring Inequalities for the 2030 Sustainable Development Agenda Meeting Report; WHO/UNICEF/JMP: New York, NY, USA, 2015. [Google Scholar]
- Cumming, O.; Slaymaker, T. Monitoring inequalities in WASH services levels. In Equality in Water and Sanitation Services; Routledge: Abingdon upon Thames, UK, 2018. [Google Scholar]
- WHO/UNICEF/JMP. Progress on Household Drinking Water, Sanitation and Hygiene 2000–2017. Special Focus on Inequalities; United Nations Children’s Fund (UNICEF) and World Health Organization (WHO): New York, NY, USA, 2019. [Google Scholar]
- Gasteyer, S.; Lai, J.; Tucker, B.; Carrera, J.; Moss, J. Basics Inequality: Race and access to complete plumbing facilities in the United States. Du Bois Rev. Soc. Sci. Res. Race 2016, 13, 305–325. [Google Scholar] [CrossRef] [Green Version]
- Wang, C.; Pan, J.; Yaya, S.; Yadav, R.B.; Yao, D. Geographic inequalities in accessing improved water and sanitation facilities in Nepal. Int. J. Environ. Res. Public Health 2019, 16, 1269. [Google Scholar] [CrossRef] [PubMed] [Green Version]
- WWAP (UNESCO World Water Assessment Programme). The United Nations World Water Development Report 2019: Leaving No One Behind; UNESCO: Paris, France, 2019. [Google Scholar]
- Aleixo, B.R.; Pena, Z.; Heller, L. Human right in perspective: Inequalities in access to water in a rural community of the Brazilian Northeast. Ambient. Soc. 2016, 19, 63–84. [Google Scholar] [CrossRef] [Green Version]
- Butts, R.; Gasteyer, S. Environmental reviews & case studies: More cost per drop: Water rates, structural inequality, and race in the United States—The case of Michigan. Environ. Pract. 2011, 13, 386–395. [Google Scholar]
- WHO/UNICEF JMP. Inequalities in Sanitation and Drinking Water in Latin America and the Caribbean. A Regional Perspective Based on Data from the WHO/UNICEF Joint Monitoring Programme (JMP) for Using Recent National Household Surveys and Censuses; WHO/UNICEF JMP: New York, NY, USA, 2016; p. 11. [Google Scholar]
- Barros, R.P.; Ferreira, F.H.G.; Vega, J.R.M.; Chandovi, J.S. Measuring Inequality of Opportunities in Latin America and the Caribbean; Palgrave Macmillan and the World Bank: Washington, DC, USA, 2009; p. 222. [Google Scholar]
- MPC. Minnesota Population Center. Integrated Public Use Microdata Series; International: Version 7.0 [dataset]; IPUMS: Minneapolis, MN, USA, 2018. [Google Scholar]
Figure 1.
Inequality factor for water supply services. (Note: For better visualization of the values, D is expressed in the map as a percentage. 0% equals perfect equality in access to services, and 100% means maximum inequality). Source: Own elaboration based on census microdata from the IPUMS-International Project [25].

Figure 2.
Inequality factor for sanitation services. (Note: For better visualization of the values, D is expressed in the map as a percentage. 0% equals perfect equality in access to services, and 100% means maximum inequality). Source: Own elaboration based on census microdata from the IPUMS-International Project [25].

Figure 3.
Access to safely managed water services and access to safely managed water services adjusted by inequality. Source: Own elaboration based on census microdata from the IPUMS-International Project [25].
Figure 3.
Access to safely managed water services and access to safely managed water services adjusted by inequality. Source: Own elaboration based on census microdata from the IPUMS-International Project [25].

Figure 4.
Access to at least basic water services and access to at least basic water services adjusted by inequality. Source: Own elaboration based on census microdata from the IPUMS-International Project [25].
Figure 4.
Access to at least basic water services and access to at least basic water services adjusted by inequality. Source: Own elaboration based on census microdata from the IPUMS-International Project [25].

Figure 5.
Access to safely managed sanitation services and access to safely managed sanitation services adjusted for inequality. Source: Own elaboration based on census microdata from the IPUMS-International Project [25].
Figure 5.
Access to safely managed sanitation services and access to safely managed sanitation services adjusted for inequality. Source: Own elaboration based on census microdata from the IPUMS-International Project [25].

Figure 6.
Access to at least basic sanitation services and access to at least basic sanitation services adjusted for inequality. Source: Own elaboration based on census microdata from the IPUMS-International Project [25].
Figure 6.
Access to at least basic sanitation services and access to at least basic sanitation services adjusted for inequality. Source: Own elaboration based on census microdata from the IPUMS-International Project [25].

Figure 7.
Mexico and Peru—access to safely managed water services and access to safely managed water services adjusted by inequality. Source: Own elaboration based on census microdata from the IPUMS-International Project [25].
Figure 7.
Mexico and Peru—access to safely managed water services and access to safely managed water services adjusted by inequality. Source: Own elaboration based on census microdata from the IPUMS-International Project [25].

Figure 8.
Peru and Argentina—access to safely managed sanitation services and access to safely managed sanitation services adjusted by inequality. Source: Own elaboration based on census microdata from the IPUMS-International Project [25].
Figure 8.
Peru and Argentina—access to safely managed sanitation services and access to safely managed sanitation services adjusted by inequality. Source: Own elaboration based on census microdata from the IPUMS-International Project [25].

Figure 9.
Access to piped water by the white urban population living in households headed by persons with higher education completed in comparison with the black rural population living in households headed by people with less than primary education completed. Source: Based on census microdata from the IPUMS-International Project [25].

Figure 10.
Access to sewerage or septic tanks by the white urban population living in households headed by persons with higher education completed in comparison with the black rural population living in households headed by persons with less than primary education completed. Source: Based on census microdata from the IPUMS-International Project [25].

Figure 11.
Relationship between analyses of access to water services by intersecting forms of inequality and by inequality factors. Source: Based on census microdata from the IPUMS-International Project [25].
Figure 11.
Relationship between analyses of access to water services by intersecting forms of inequality and by inequality factors. Source: Based on census microdata from the IPUMS-International Project [25].

Figure 12.
Relationship between analyses of access to sanitation services by intersecting forms of inequality and by inequality factors. Source: Based on census microdata from the IPUMS-International Project [25].
Figure 12.
Relationship between analyses of access to sanitation services by intersecting forms of inequality and by inequality factors. Source: Based on census microdata from the IPUMS-International Project [25].


Table 1.
Variables and nomenclatures used for calculation.
| Type of Variable | Variables | IPUMS Nomenclature | Description | Category Used |
|---|---|---|---|---|
| Response variable | Water supply | WATSUP | Indicates whether the household has access to a collective network with piping in the household | Access |
| No Access | ||||
| Sanitation | SEWAGE | Indicates whether the household has access to a sewerage system or septic tank | Access | |
| No Access | ||||
| Explanatory variables | Urban-rural status | URBAN | Indicates whether the household is located in a place designated as urban or as rural | Urban |
| Rural | ||||
| Subnational geographic level | GEOLEV1 | Indicates the major administrative unit in which the household is registered | Depending on each country | |
| Race or color | RACE | Identifies the racial group with which a person identified himself or herself or to which an enumerator assigned them. Although race is a social construction and the definition of what "white" and "non-white" means varies across cultures, this variable can be used as a proxy of race and can shed some light on the inequalities based on race within each country (the use of dichotomous categories avoids potential problems of more nuanced analysis of race inequalities). | White | |
| Non-white | ||||
| Member of an indigenous group | INDIG | Indicates whether the person belonged to an indigenous group | Indigenous | |
| Non-indigenous | ||||
| Literacy | LIT | Indicates whether the respondent could read and write in any language. A person is typically considered literate if he or she can both read and write. All other persons are illiterate, including those who can either read or write but cannot do both. | Literate | |
| Illiterate | ||||
| Educational Attainment of Household Head Status | EDATTAIN (Educational attainment, international recode) | Indicates the level of schooling completed (degree or another milestone) by the head of the household in which the person lived. The educational attainment of the household head classification does not necessarily reflect any particular country’s definition of the various levels of schooling in terms of terminology or the number of years of schooling. It is an attempt to merge into a single, roughly comparable variable, samples that provide degrees, those that provide actual years of schooling, and those that have some of both. | Primary incomplete | |
| Primary complete | ||||
| Secondary complete | ||||
| Higher education complete |
© 2020 by the authors. Licensee MDPI, Basel, Switzerland. This article is an open access article distributed under the terms and conditions of the Creative Commons Attribution (CC BY) license (http://creativecommons.org/licenses/by/4.0/).
Share and Cite
MDPI and ACS Style
Queiroz, V.C.; Carvalho, R.C.d.; Heller, L. New Approaches to Monitor Inequalities in Access to Water and Sanitation: The SDGs in Latin America and the Caribbean. Water 2020, 12, 931. https://doi.org/10.3390/w12040931
AMA Style
Queiroz VC, Carvalho RCd, Heller L. New Approaches to Monitor Inequalities in Access to Water and Sanitation: The SDGs in Latin America and the Caribbean. Water. 2020; 12(4):931. https://doi.org/10.3390/w12040931
Chicago/Turabian StyleQueiroz, Vitor Carvalho, Rodrigo Coelho de Carvalho, and Léo Heller. 2020. "New Approaches to Monitor Inequalities in Access to Water and Sanitation: The SDGs in Latin America and the Caribbean" Water 12, no. 4: 931. https://doi.org/10.3390/w12040931
Note that from the first issue of 2016, this journal uses article numbers instead of page numbers. See further details here.