Seasonal Precipitation Variability and Gully Erosion in Southeastern USA


Department of Geosciences, East Tennessee State University, Johnson City, TN 37614, USA
*
Author to whom correspondence should be addressed.
Water 2020, 12(4), 925; https://doi.org/10.3390/w12040925
Submission received: 11 February 2020
/
Revised: 17 March 2020
/
Accepted: 20 March 2020
/
Published: 25 March 2020
(This article belongs to the Special Issue Modeling of Soil Erosion and Sediment Transport)
Abstract
:This study examines the relationship between gully erosion in channels, sidewalls, and interfluves, and precipitation parameters (duration, total accumulation, average intensity, and maximum intensity) annually and seasonally to determine seasonal drivers for precipitation-related erosion. Ordinary Least Square regression models of erosion using precipitation and antecedent precipitation at weekly lags of up to twelve weeks were developed for three erosion variables for each of three geomorphic areas: channels, interfluves, and sidewalls (nine models in total). Erosion was most pronounced in winter months, followed by spring, indicating the influence of high-intensity precipitation from frontal systems and repeated freeze-thaw cycles in winter; erosion in summer was driven by high-intensity precipitation from convectional storms. Annually, duration was the most important driver for erosion, however, during winter and summer months, precipitation intensity was dominant. Seasonal models retained average and maximum precipitation as drivers for erosion in winter months (dominated by frontal systems), and retained maximum precipitation intensity as a driver for erosion in summer months (dominated by convectional storms). In channels, precipitation duration was the dominant driver for erosion due to runoff-related erosion, while in sidewalls and interfluves intensity parameters were equally important as duration, likely related to rain splash erosion. These results show that the character of precipitation, which varies seasonally, is an important driver for gully erosion and that studies of precipitation-driven erosion should consider partitioning data by season to identify these drivers.
1. Introduction
Gully erosion is a global problem, particularly in the southeastern United States, where erodible soils, high relief, and climatic and meteorological factors encourage soil erosion. Gully erosion is one of the most dangerous forms of soil degradation, which is caused by natural and anthropogenic activities. Gullies are composed of several continuous or discontinuous channels and rills with varying slopes, which may later develop into deep trenches, inhibiting effective remediation by tillage. Gully erosion can initiate from anthropogenic factors like farming or grazing on susceptible soils, increased runoff from land-use changes due to logging or construction, and poor vegetative cover from wildfire or high soil salinity. Additionally, natural drivers for soil erosion are meteorological variables, topography, and soil type and texture [1,2].
Changes in land use can increase soil erosion. Vast regions of the United States experienced soil erosion when forested lands were converted to croplands in the late 19th century and the early 20th century [3]. Estimates of the volume of soil erosion in the United States caused by both sheet and rill erosion combined is 6.7 Mg/ha/y in cultivated cropland, 0.90 Mg/ha/y on federal lands, and 1.55 Mg/ha/y in pasture lands [3]. Considerable land area in the southeastern US was converted from forest to agriculture to support cotton farming in the 1800s and pasture for animal grazing [4,5]. Land cover change due to logging and conversion of forest to crop and pasture was linked to nineteenth-century European settlement in the southern Blue Ridge Mountains and Appalachian hillslopes [6,7,8,9]. Harvesting on the steep Appalachian hillslopes has been identified as one potential cause of soil erosion [10]. After recognizing the problem as early as 1933, soil conservation programs were implemented in the United States. As part of present soil conservation efforts, afforestation on the reclaimed land has partially halted erosion, but severe erosional areas from the past cotton farming era are still prominent [4]. Some researchers have described a multi-stage formation of severe soil erosion [11,12], i.e., a process for gully development in the Appalachian Piedmont: (i) rills and gullies are initiated along existing paths, tracks, ditches, or animal burrows, where runoff is concentrated due to reduced infiltration; (ii) head scarp erosion begins as runoff gains energy and is concentrated in steeply sloped land; (iii) gully downcutting eventually stabilizes when weathered bedrock and the shallow groundwater zone are encountered; (iv) erosion continues laterally along channel sidewalls and headwalls by slumping and under caving, inhibiting effective control by tillage. Hence, reclamation can be expensive.
Sidewalls (or midslopes), gully channels (or valleys), and interfluves (or gully divides) are major topographical factors that influence soil erosion [7,8,13]. Soil erosion increases with slope steepness, which is more relevant to gully sidewall erosion and less relevant to interfluves. Gully channels are dynamic and can serve as intermittent sediment sinks and sources, transporting sediment to the gully outlet [14].
In addition to land cover change and topographic variation, water-induced soil erosion from severe precipitation events erodes fertile soil, mainly in areas with poor agricultural management, land degradation from mining, road construction, or wild fires [2]. Unique climatic conditions in the humid subtropical climate (Köppen Cfa) of the southeastern United States are a major contributing factor in gully erosion [15]. Cold periods in the south are short and winters are mild, inhibiting deeper ground freezing. The thin surface layer (5–10 cm) of frost-heaved soil becomes loose after a few freeze-thaw cycles, and can erode easily from subsequent heavy rain or snow-melt runoff [13]. During warm periods, intensive rainfall that falls on steep, sparsely vegetated slopes contributes to erosion. General precipitation trends in the Appalachian hillslopes indicate that high-intensity events occur more during summer months, while higher accumulation low-intensity storms are more prevalent in winter months. Seasonal variability in precipitation characteristics impacts erosion, but the extent and nature of this relationship are not well understood in this region.
A short-term study of hillslope erosion in the Appalachians found that duration and accumulation of precipitation were more important than storm intensity as drivers for gully erosion [13]. The same study also found antecedent precipitation is a stronger predictor of erosion and discrete precipitation events alone may not result in measurable erosion. Antecedent precipitation along with successive precipitation events can saturate the soil, reduce shear strength, and cause erosion. To examine inter-annual variability and longer-term effects from antecedent precipitation, as well as the influence of seasonal events on soil erosion, a more extensive time series of precipitation and corresponding erosion data is necessary [16], however, it will be important to retain a high temporal resolution in the data to assess seasonal scale patterns.
In this context, the Appalachian hillslopes in the southern US are representative of a region of historic and modern land degradation from unique meteorological conditions, variable topography, and land use/land cover change. Therefore, the objective of the present study is to examine the effect of meteorological parameters, specifically precipitation, on soil erosion through long term high-resolution monitoring. This paper summarizes six years of comprehensive weekly monitoring of precipitation events and soil erosion in an Appalachian hillslope paying particular attention to seasonal effect. An understanding of the seasonal pattern of soil erosion with respect to precipitation-related drivers of erosion will improve the potential to achieve conservation measures.
2. Materials and Methods
The study site was a system of branching gullies located on a hillslope at the East Tennessee State University Valleybrook research facility in northeast Tennessee, USA (+36°25′36.77″, −82°32′10.63″) at an elevation of 530 m (Figure 1). The site was within the Appalachian Valley and Ridge physiographic province and consisted of northeast-southwest trending parallel limestone valleys (Maynardville Formation) and sandstone or shale ridges (Nolichucky Formation) [17]. The 1.5 ha study area was located on a grass and shrub hillslope surrounded by forest (on the ridges) and pasture (in the valleys). Soils were highly erodible fine-grained silt and clay Ultisols (Collegedale-Etowah complex (CeD3)) with an average erodibility factor (RUSLE K-factor) of 0.28, indicating susceptibility to raindrop impact and transport by surface runoff [18]. The region has a humid subtropical climate (Köppen Cfa) with year-round precipitation of 1070 mm (42 in) annually and an average annual temperature range from 1.1 °C (34 °F) in January to 23.3 °C (74 °F) in July. The National Oceanic and Atmospheric Administration describe Tennessee’s winter precipitation as dominated by the polar front and summer precipitation that results from convectional systems. September and October are the driest months.
A detailed description of the site setup can be found in [13,19] and is summarized as following. Steel erosion pins were installed in transects throughout the 100 m × 100 m gullied zone. Each transect spanned interfluves, sidewalls, and the gully channel to assess erosion in these three morphological settings. In total, 105 erosion pins were installed, 34 (1 m × 5 mm) pins in channels, and the remaining (0.5 m × 5 mm) pins in interfluves (29 pins) and sidewalls (42 pins). From 23 May 2012 to 22 August 2018, pin length was recorded approximately weekly for each pin using a folding ruler. Pin attrition occurred periodically over the study period, such that some pins were eroded, damaged, or dislodged by animals. Therefore, in May 2015, 43 new pins were installed and 3 damaged pins were replaced, bringing the total number of pins to 105. The nature of the site surface limited access during and immediately after rain events, and over the six-year period, pin length was recorded 294 times. The difference between the exposed lengths of each pin was calculated between one measurement period and the next, and this dataset of pin change was compared to precipitation data to identify important drivers for erosion in each morphological setting.
For each setting, we created three erosion variables: (1) average of the absolute value of change (Avg|Ch|); (2) average of only positive changes in pin lengths (deposition) from one measurement period to the next (AvgDep), and; (3) average of only negative changes in pin lengths (erosion) from one measurement period to the next (AvgErosion). In prior research, a fourth variable, average change, was generated, however, because of a balance of erosion and deposition, especially in channels, the average change remained near zero and was not a useful parameter to capture weekly and longer-term erosion on-site [13,14,19,20,21]. Therefore, in this study, we have retained the three variables described above.
A Davis Vantage Pro wireless weather station (KTNJONES12, data available at https://www.wunderground.com/dashboard/pws/KTNJONES12) was located 350 m from the research site, and recorded precipitation, pressure, temperature, and wind data at five-minute intervals. Occasional data gaps were filled with data from a neighboring station 1.6 km away (KTNJONES7, data available at https://www.wunderground.com/dashboard/pws/KTNJONES7), with only 21 of 2282 study days missing weather data. See [19] for a detailed list of weather data gaps and coverage.
From these data, four precipitation parameters were generated for each measurement period: (1) Duration (total minutes of rainfall); (2) Total Accumulation (total precipitation in mm); (3) Average Intensity in mm/min (Total Accumulation/Duration), and; (4) Maximum Intensity in mm/min (the greatest station-reported rain rate during the measurement period). The rain rate is a smoothed function of rain accumulation over time that is calculated using the ratio of the tipping bucket depth-adjusted volume to the time between tips. As rainfall tapers off, the rate drops but does not reach zero immediately upon cessation of precipitation. Instead, it smooths the rate to more accurately represent how precipitation naturally tapers over an area at the end of a rain storm [22].
Prior research has shown that antecedent precipitation may be an important factor in erosion, and therefore a series of antecedent precipitation parameters were generated for the prior eleven measurement periods, for each of Duration, Total Accumulation (TotAcc), Average Intensity (AvgInt), and Maximum Intensity (MaxInt). These antecedent lagged variables were named Duration-1, Duration-2 ... Duration-11, TotAcc-1, TotAcc-2 … and so-on, a total of 48 precipitation parameters, which we refer to as lagged precipitation parameters.
The relationship between erosion variables and all precipitation parameters was assessed with Spearman correlation coefficients. Ordinary Least Squares (OLS) regression models were created for the nine erosion variables using the set of current and lagged precipitation parameters. Further, because seasonal variability in erosion was observed in prior studies [13,19], the data were partitioned by season: winter (December, January, February); spring (March, April, May); summer (June, July, August); and autumn (September, October, November). OLS regression models were generated for the erosion variables using the precipitation parameters for each of the seasonal datasets.
3. Results
3.1. Precipitation
Precipitation accumulation for each measurement period had an annual mean of 22.2 mm, with the highest seasonal mean accumulation in winter (26.3 mm) and spring (24.3 mm), and the lowest in autumn (15.3 mm) (Table 1). Likewise, the duration of precipitation had an annual mean of 278.7 min, but the longest seasonal mean duration was received in winter (424.7 min), and the shortest in autumn (192.5 min). Both average and maximum precipitation intensity were higher in summer months (0.1 mm/min and 108.1 mm/min, respectively) compared to the annual values of these parameters (0.08 and 71.5 mm/min, respectively).
The study area experienced year-round precipitation, however, most of the accumulation was in winter (frontal systems) and summer (convectional storms) (Figure 2). September and October were the driest months, most notably in 2012, 2013, and 2016. The most intense rains occurred in summer months, for example, see high values for Average Intensity (AvgInt) in the summer of 2012, 2014, 2016, 2017, 2018, and to a lesser degree 2013 and 2015. One may also notice that when Total Accumulation (TotAccum) was high and Duration was low, Maximum Intensity (MaxInt) was also high because it follows that higher intensity rainfall occurred when high rainfall totals were received in a short time-period.
3.2. Erosion
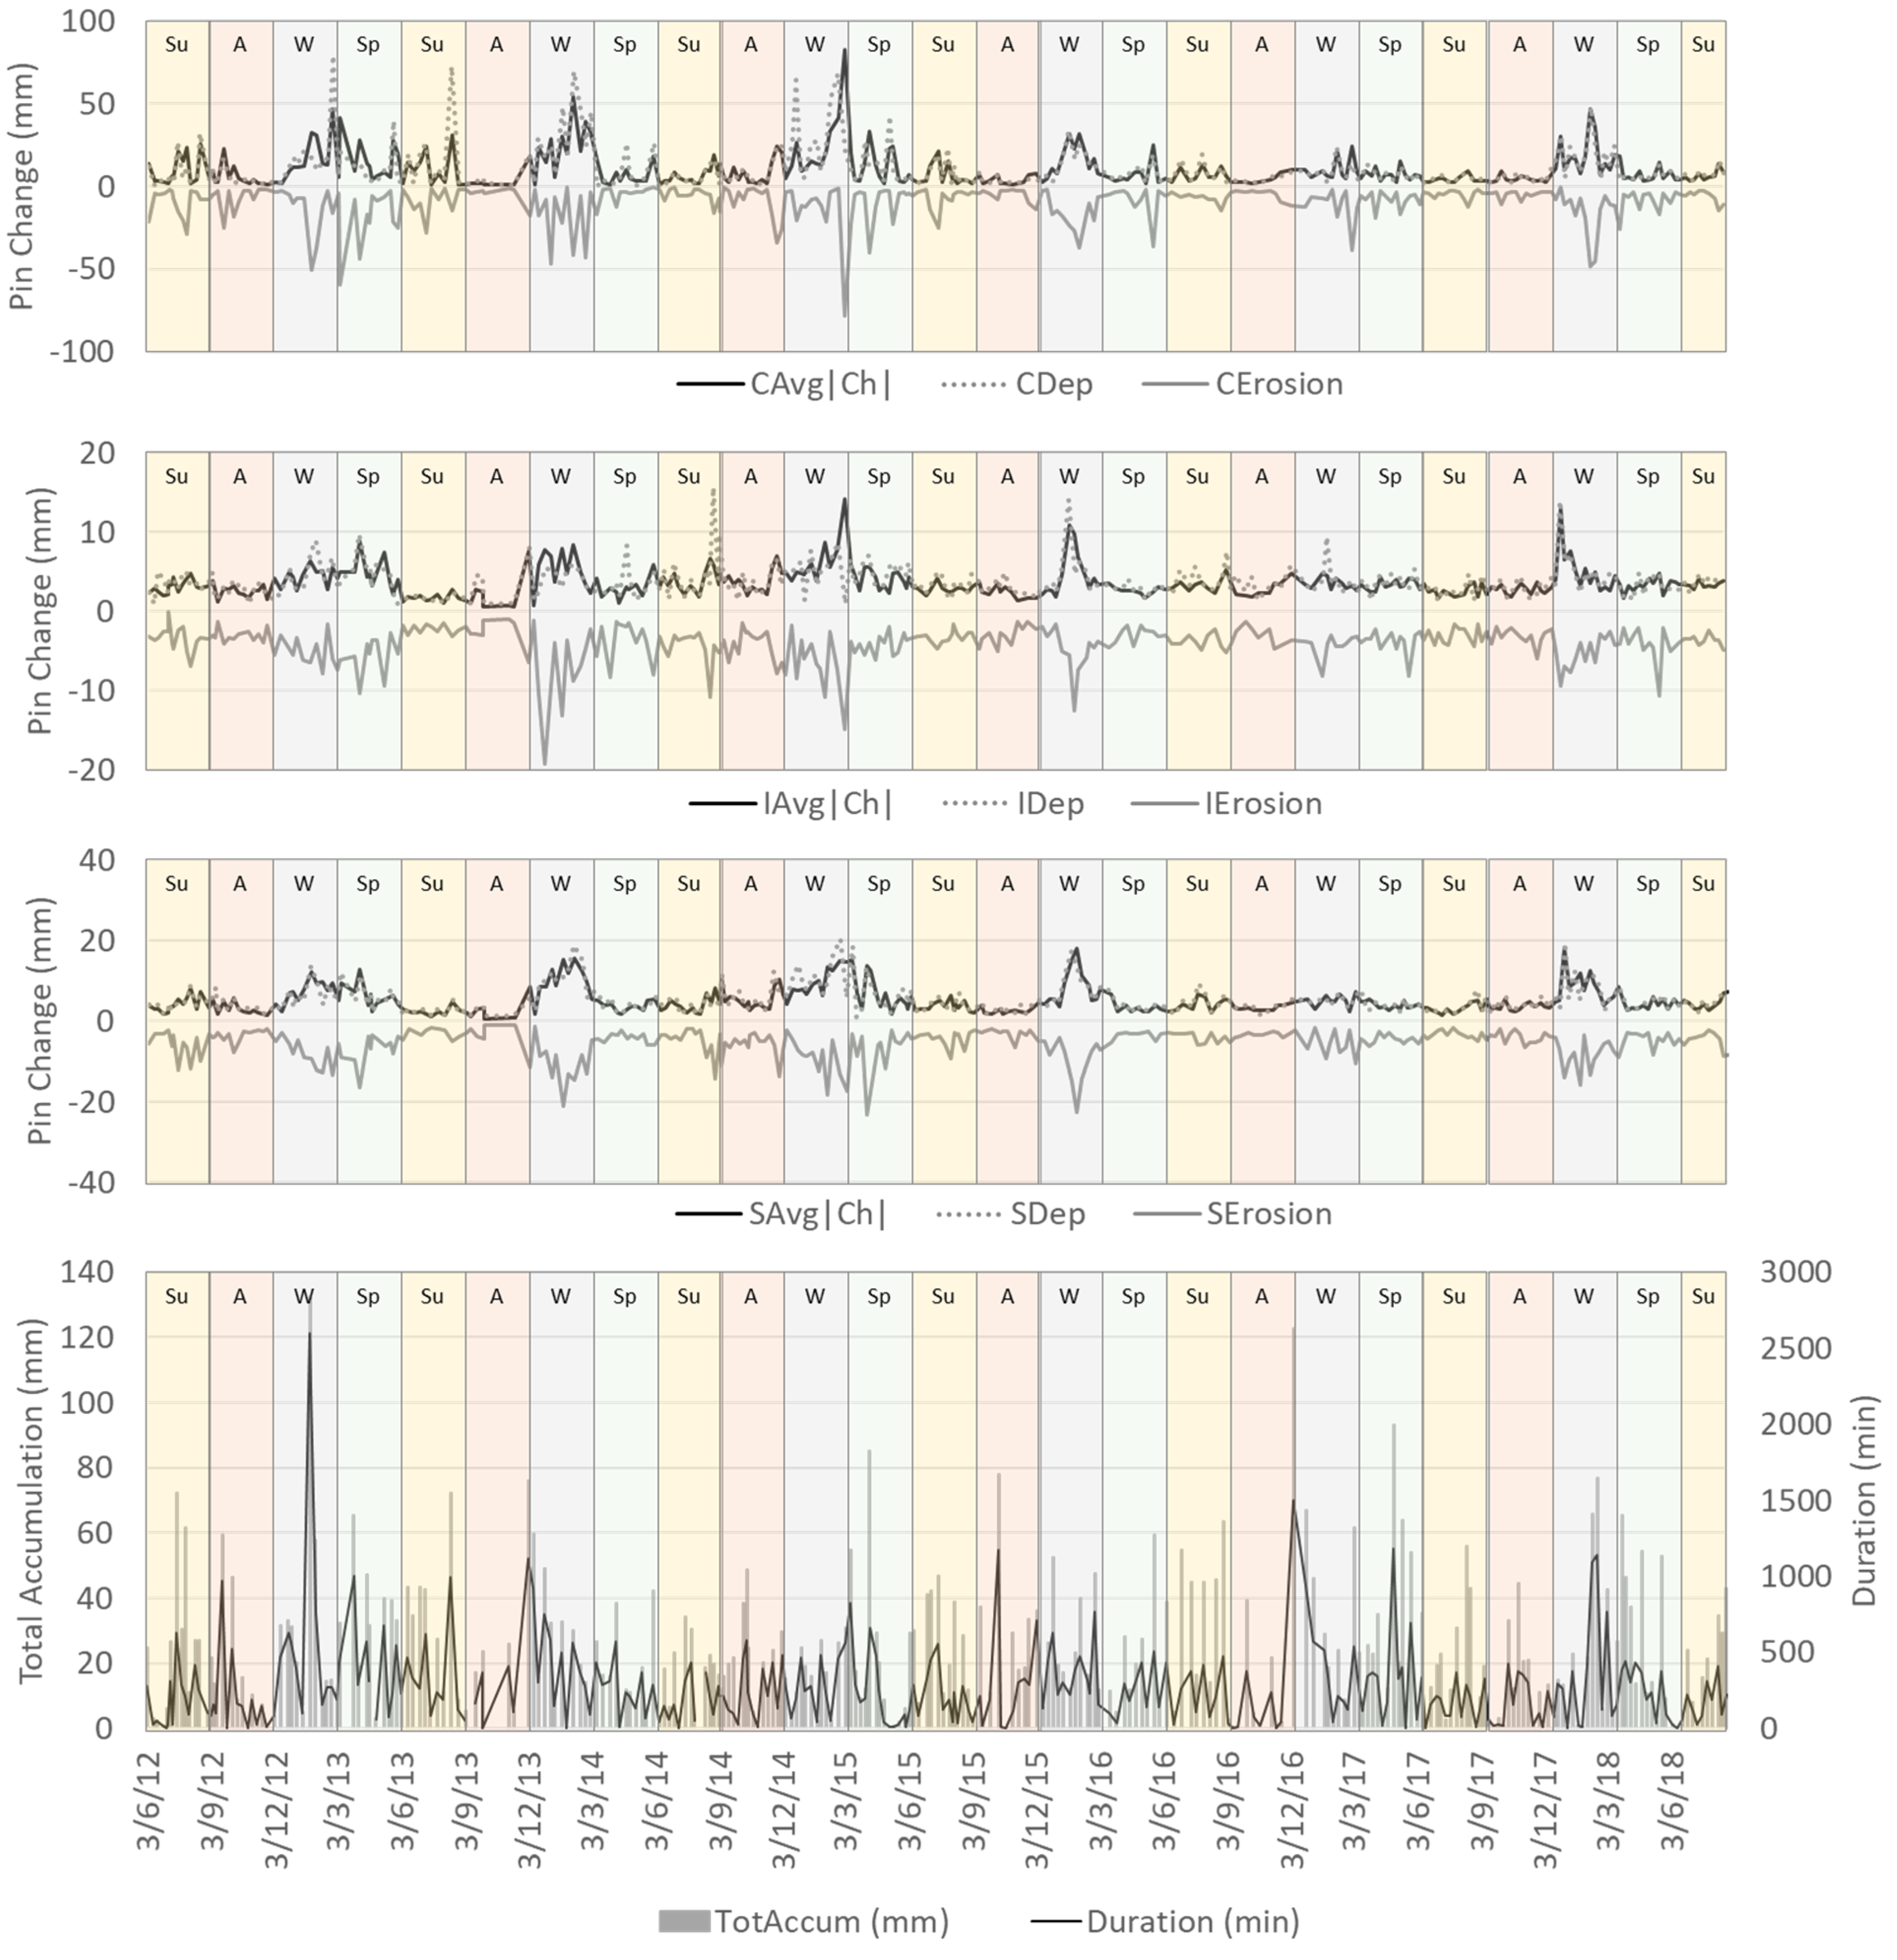
Mean erosion by measurement period (assessed using the average absolute change variables CAvg|Ch|, IAvg|Ch|, and SAvg|Ch|, where C, I, and S, refer to channels, interfluves, and sidewalls, respectively) was greater in winter and spring than the overall mean for all three geomorphic areas (Table 2). Notably, in winter months, CAvg|Ch| was 16.8 mm compared to 9.9 mm overall and SAvg|Ch| was 8.0 mm compared to 5.0 mm overall. Seasonal effects on interfluves were less pronounced, with IAvg|Ch| in winter at 4.8 mm compared to the overall mean of 3.5 mm. As with precipitation parameters, autumn was the season with the lowest mean erosion by measurement period for all geomorphic areas at 4.8 mm for channels, 3.5 mm for sidewalls, and 2.8 mm for interfluves.
Seasonally, erosion variables show the most variability during winter months (Figure 3). Winter of 2016–2017 experienced less erosion than other years for all geomorphic areas, however, the study area received high rainfall accumulation during two weekly measurement periods.
3.3. Statistical Modeling
Erosion variables were significantly correlated with total accumulation and duration parameters for all variables except interfluve erosion (IErosion) (Table 3). Concordant with prior studies, erosion in channels was most strongly correlated with total accumulation (r = 0.467, r = 0.352, and r = −0.469 for CAvg|Ch|, CDep, and CErosion, respectively) and duration (r = 0.470, r = 0.367, and r = −0.447 for CAvg|Ch|, CDep, and CErosion, respectively). Note that all correlation coefficients for erosion variables (CErosion, IErosion, and SErosion) are negative because these variables are values below zero.
Spearman’s correlation between the four precipitation parameters was compared to assess the potential for multicollinearity in statistical models, and total accumulation shows a very strong positive correlation with duration (r = 0.903) and a moderately strong positive correlation with average intensity (r = 0.591) and maximum intensity (r = 0.657). Likewise, average and maximum intensity were strongly and positively correlated (r = 0.794).
Before modeling erosion by season, OLS regression models were developed for the annual dataset (all measurement periods) using the four precipitation parameters from the current period, plus lagged variables for up to 11 prior periods (weeks). Table 4 summarizes output from models for each erosion variable in columns, with the variable name and R2 value at the head of the column, and retained parameters marked by *. Retained parameters (independent variables) were those with statistically significant coefficients in each OLS model output. Nine models are represented in Table 4, one for each erosion variable. Model coefficients are not presented (only significance) here because the purpose of the modeling was to identify the precipitation parameters that were universally important, which was completed through frequency analyses. All model linear equations are, however, presented in Table A1 in Appendix A. Duration and total accumulation were the most important variables for channel erosion, while average intensity was important for erosion in interfluves and sidewalls. Also notable is the influence of antecedent precipitation at lags of up to 11 weeks for some variables.
Seasonal OLS regression models clearly indicate the importance of precipitation intensity, which was, in prior studies, not retained in annual models of erosion (Table 5). Note that seasonal models for IAvg|Ch| were omitted from Table 5 because only one viable model was generated, and its coefficient of determination was extremely low (R2 = 0.064).
Interestingly, in summer and winter, average and maximum intensity were important explanatory parameters both during the current period, but also in prior periods. Precipitation intensity was not often retained in models of erosion during spring and autumn. It is also important to note that viable OLS regression models were generated for all erosion variables for summer and winter, with coefficients of determination ranging from R2 = 0.245 to R2 = 0.49 (except for IErosion in summer at R2 = 0.131 and SDep in winter at R2 = 0.087), suggesting that precipitation is an important driver for erosion in these months, no matter the metric used. Moreover, these results show that the character of the precipitation is an important driver for erosion; antecedent precipitation has an influence on erosion in the following weeks and months and it varies with season.
4. Discussion
4.1. Erosion Variability
Variability exists in erosion statistics between the three geomorphic areas, such that channels had the highest variability and interfluves the lowest (Table 2), with sidewalls having intermediate variability. In particular, for both the overall annual dataset and for each seasonal partition, the mean and standard deviation were of similar magnitudes. Similar behavior was observed in a previous study in the same study area [13] and a study of gully erosion in the Karoo region of Africa [23]. Channels were dynamic and acted as both source and sink for sediment loads. Slugs of sediments gathered intermittently in the channel areas and were transported with channel flow following precipitation. Soil erosion was dominant in the gully sidewalls, however, the variability was moderate compared to channel erosion data, implying that sidewalls were less responsive with regard to erosion. In contrast, in the interfluve, the lesser amount of erosion and variability reflected the limited sediment yield, which may be due to the presence of vegetation that retarded erosion and lower gradient. Additionally, differences in soil cover thickness, soil types, moisture content, slope aspect and angle within the different geomorphic settings may explain the range of variability, however, that is beyond the scope of this paper and will be studied in the future.
4.2. Erosion-Precipitation Relationships
Seasonally, a comparison of erosion variables and precipitation parameters shows the same trend. Ordering seasonal precipitation parameters (Duration and TotAcc) and erosion variables from greatest to least, winter was greatest, followed by spring, summer and lastly, autumn. We see in Table 2 that winter months were the most dynamic, with the greatest mean erosion and the largest standard deviation of all seasons, and this pattern was consistent across channels, interfluves, and sidewalls for all erosion variables. This may be explained by the character of the winter precipitation: greater total accumulation and duration during these months associated with frontal precipitation events. Prior research has also demonstrated that freeze-thaw events are significant drivers of erosion in winter months at this site [14,19]. A similar pattern existed for spring, likely influenced by precipitation accumulation and duration as well as antecedent winter freeze-thaw activity [19]. Next, summer erosion and precipitation (Duration and TotAcc) ranked third, but interestingly, summer experienced the highest precipitation intensity of all seasons (both for AvgInt and MaxInt) (Table 1). This reflected the dominance of convectional precipitation events in summer. Autumn experienced the minimum erosion and precipitation accumulation and duration, but greater maximum precipitation intensity than the annual average. This suggests that autumn precipitation events were short duration, high-intensity events that did not produce much precipitation depth and had little erosive power.
During winter 2016–2017, precipitation variables were near normal levels for the winter season, however, erosion for all geomorphic areas was very low (Figure 3). We examined temperature during this time period to determine whether the reduced freeze-thaw activity may have played a part, but, while winter 2016–2017 had less intense freeze-thaw activity than other winters during the study period, freeze-thaw events occurred. The timing of the greatest precipitation accumulation and duration was late autumn/early winter, and because these events were coincident, they indicate a period of low-intensity precipitation that may have encouraged more infiltration and less runoff, leading potentially to less erosion during this period. Lower hydrostatic pressure in unsaturated soils increases cohesion [24] which may be a significant factor associated with reduced erosion in late autumn and early winter of that year.
Average Intensity and Maximum Intensity of precipitation were very different, with approximately three orders of magnitude between the generally low average precipitation intensities and maximum intensity for the full dataset and each seasonal partition (Table 1). Future research at this site should assess the soil’s infiltration capacity and explore different metrics that may better capture the relation between precipitation intensity and erosion. For example, measuring the rainfall duration when the rain rate exceeds the soil’s infiltration capacity would generate a metric of the length of time during which there was a high probability of runoff generation.
4.3. Precipitation as a Driver for Erosion
Prior research at this site using 14 months of data found that Duration and TotAcc were the drivers for erosion, most strongly in channels. With six years of data, the present study confirmed the earlier result when erosion and precipitation data were lumped without regard for season. OLS regression models of annual erosion for the nine erosion variables, using the set of lagged precipitation parameters as independent variables, and overwhelmingly retained Duration parameters most frequently (24 times) (Table 6). This means that overall nine OLS models of erosion outlined in Table 4, Duration and lagged Duration independent variables had significant coefficients 24 times. Despite the high correlation between TotAcc and erosion variables (Table 3), TotAcc was retained less frequently in the models (7 times) due to the high correlation between Duration and TotAcc (r = 0.903, p = 0.001) (Table 3), indicating multicollinearity. Lagged intensity parameters were likewise retained fewer times; AvgInt parameters were retained 14 times, while MaxInt parameters were retained only 5 times. Therefore, using lumped annual data, Duration was the most important predictor of erosion, indicating that over the long term, prolonged precipitation is key.
When erosion data were partitioned by geomorphic areas (Table 6), channel models overwhelmingly retained Duration most often. In contrast, sidewall and interfluve models retained Duration and AvgInt at approximately the same frequency (retained in 6 and 5 interfluve models and 8 sidewall models, respectively). This shows the importance of precipitation intensity as a driver for erosion in these two geomorphic areas. This may occur because interfluves and sidewalls may be more exposed to rain splash erosion, which is associated with higher intensity precipitation. Channels are not as steeply sloped as sidewalls and gully channel erosion is associated with the flow within the channel, which occurs after long-duration events that result in saturation-related runoff.
When erosion data were partitioned by season, the influence of precipitation intensity became apparent, especially during summer and to a lesser degree winter. This may be observed in Table 6, where MaxInt lagged parameters were retained 12 and 6 times in summer and winter erosion models, respectively, but only 0 and 3 times in spring and autumn models, respectively. This indicates that, while over the long term, Duration was the most important driver, during certain individual seasons intensity became important. This emphasizes the importance of the mechanics of convectional storms (summer) and frontal storms (winter) as an additional factor in seasonal erosion patterns. These patterns are also apparent when model results are partitioned by both season and geomorphic area (Table 6).
Partitioning the data by season, therefore, produces additional knowledge that was not previously captured. We conclude that different drivers may be more effective agents of erosion in different seasons and, therefore, we recommend that studies of precipitation driven erosion should, wherever possible, partition data by season.
5. Conclusions
This study examined the effect of precipitation parameters on soil erosion through six years of high-resolution weekly monitoring in an Appalachian hillslope paying particular attention to seasonal effect. The long-term data provided an understanding of the seasonal pattern of soil erosion in a humid sub-tropical environment, which was not noticeable in other studies in the region using an annual dataset.
Different gully morphologies responded differently to long-term erosion. Channels were most active, showed a wide range of variability, and responded most dynamically, whereas the interfluves were least disturbed by erosion. Sidewalls were prone to erosion but were not as dynamic as channels. To explore the reason behind varied gully erosion patterns in the different geomorphic settings, further studies are recommended to evaluate how erosion fluctuates with soil cover thickness, soil types, moisture contents, slope aspect, and slope angle.
Precipitation duration was the most important factor in initiating and continuing erosion year-round, yet seasonality played a significant role in the severity of gully erosion. Erosion was most pronounced in winter months, followed by spring, indicating the influence of high-intensity precipitation from frontal systems and repeated freeze-thaw cycles. Erosion in summer was driven by high-intensity precipitation from convectional storms. Soils in the study area were least prone to erosion during the moderate months of autumn. In channels, precipitation duration was the dominant driver for erosion due to runoff-related erosion, while in sidewalls and interfluves, intensity parameters were equally important as duration, likely related to rain splash erosion. This research shows that soil erosion is seasonally variable and an understanding of the seasonal pattern of soil erosion with respect to precipitation-related drivers improves the potential to achieve strategic conservation measures.
Author Contributions
Conceptualization, I.L. and A.N.; methodology, I.L. and A.N.; data collection, I.L. and A.N.; formal analysis, I.L. and A.N.; funding acquisition, I.L. and A.N.; data curation, I.L.; writing—original draft preparation, I.L. and A.N.; writing—review and editing, I.L. and A.N. All authors have read and agreed to the published version of the manuscript.
Funding
This research received funding support from East Tennessee State University’s Honors College Federal Work Study program for collection of field data.
Acknowledgments
The authors gratefully acknowledge the assistance in data collection provided by Tim Spiegel, Nicholas Barnes, Tim Land, Jamie Kincheloe, Nicholas McConnell, and Jennifer Grant. The authors are grateful for the valuable contribution of the anonymous reviewers.
Conflicts of Interest
The authors declare no conflict of interest.
Appendix A
OLS Regression models of erosion are presented in Table A1. While model equations are useful for prediction when determination coefficients are high, even when they are relatively low, useful information can be revealed with respect to the importance of independent variables. Standardized coefficients can likewise provide information about the relative importance of independent variables within each model. For channels, Duration and TotAcc during the current and prior measurement periods were retained most often, and these variables had the highest standardized coefficients compared to the intensity parameters (AvgInt and MaxInt) (standardized coefficients are not shown in the table). For interfluves, AvgInt and MaxInt were also retained in the models, and for the IDep and IErosion models, standardized coefficients for all retained variables were of similar magnitudes. For sidewalls, a similar pattern was generally noted, with retention of the intensity variables. For the SErosion model, Duration and TotAcc parameters had the largest standardized coefficients.

Table A1.
Regression equations for erosion variables (dependent variables) using lagged precipitation parameters (independent variables). Lagged variable names are appended with “LagN”, where N indicates the number of measurement periods of antecedent lag. Duration_Lag1 indicates precipitation duration in prior measurement period (Lag of 1 period).
| Dependent Variable | R2 | Equation |
|---|---|---|
| CAvg|Ch| | 0.297 | = 3.177 + 0.013 × Duration + 0.016 × Duration_Lag4 + 0.019 × Duration_Lag6 + 0.004 × Duration_Lag8 − 0.146 × TotAcc_Lag4 − 0.193 × TotAcc_Lag6 |
| CDep | 0.191 | = 8.078 + 0.008 × Duration + 0.026 × Duration_Lag4 − 0.236 × TotAcc_Lag4 − 34.139 × AvgInt_Lag11 + 0.013 × MaxInt_Lag9 + 0.010 × MaxInt_Lag10 |
| Cerosion | 0.354 | = −0.315 − 0.017 × Duration − 0.004 × Duration_Lag1 − 0.020 × Duration_Lag6 − 0.005 × Duration_Lag8 + 0.173 × TotAcc_Lag6 |
| IAvg|Ch| | 0.119 | = 3.502 + 0.001 × Duration + 0.003 × Duration_Lag8 − 5.070 × AvgInt_Lag4 + 0.452 × AvgInt_Lag8 − 0.035 × TotAcc_Lag8 |
| IDep | 0.093 | = 3.800 + 0.001 × Duration + 0.001 × Duration_Lag4 − 6.238 × AvgInt_Lag8 − 0.002 × MaxInt_Lag4 |
| IErosion | 0.120 | = −4.426 − 0.001 × Duration − 0.001 × Duration_Lag8 + 5.831 × AvgInt_Lag4 + AvgInt_Lag5 − 0.002*MaxInt_Lag10 |
| SAvg|Ch| | 0.174 | = 7.115 + 0.002 × Duration + 0.002 × Duration_Lag4 − 10.517 × AvgInt_Lag2 − 9.828 × AvgInt_Lag4 − 8.345 × AvgInt_Lag7 − 9.446 × AvgInt_Lag8 |
| SDep | 0.137 | = 5.996 + 0.003 × Duration = 0.002 × Duration_Lag5 − 11.568 × AvgInt_Lag2 − 12.272 × AvgInt_Lag8 |
| SErosion | 0.205 | = −5.623 − 0.006 × Duration_Lag1 − 0.002 × Duration_Lag3 − 0.005 × Duration_Lag4 − 0.002 × Duration_Lag6 + 0.062 × TotAcc_Lag1 + 0.052 × TotAcc_Lag4 + 7.750 × AvgInt_Lag2 + 11.889 × AvgInt_Lag9 − 0.002 × MaxInt_Lag11 |
References
- Ionita, I.; Fullen, M.A.; Zgłobicki, W.; Poesen, J. Gully erosion as a natural and human-induced hazard. Nat. Hazards 2015, 79, 1–5. [Google Scholar] [CrossRef] [Green Version]
- Poesen, J.; Nachtergaele, J.; Verstraeten, G.; Valentin, C. Gully erosion and environmental change: Importance and research needs. Catena 2003, 50, 91–133. [Google Scholar] [CrossRef]
- United States Department of Agriculture Natural Resources. Conservation Service 2012 National Resources Inventory Summary Report; Natural Resources Conservation Service: Washington, DC, USA, 2015.
- Bussell, P.; Galang, M.A.; Markewitz, D.; Morris, L.A. Land use change and gully erosion in the Piedmont region of South Carolina. J. Soil Water Conserv. 2007, 62, 122. [Google Scholar]
- Trimble, S.W. Man-Induced Soil Erosion on the Southern Piedmont, 1700–1970; Soil and Water Conservation Society: Ankeny, IA, USA, 2008. [Google Scholar]
- Reusser, L.; Bierman, P.; Rood, D. Quantifying human impacts on rates of erosion and sediment transport at a landscape scale. Geology 2015, 43, 171–174. [Google Scholar] [CrossRef]
- Royall, D.; Kennedy, L. Historical erosion and sedimentation in two small watersheds of the southern Blue Ridge Mountains, North Carolina, USA. Catena 2016, 143, 174–186. [Google Scholar] [CrossRef] [Green Version]
- Leigh, D.S.; Webb, P.A. Holocene erosion, sedimentation, and stratigraphy at Raven Fork, Southern Blue Ridge Mountains, USA. Geomorphology 2006, 78, 161–177. [Google Scholar] [CrossRef]
- Price, K.; Leigh, D.S. Morphological and sedimentological responses of streams to human impact in the southern Blue Ridge Mountains, USA. Geomorphology 2006, 78, 142–160. [Google Scholar] [CrossRef] [Green Version]
- Wang, J.; Edwards, P.J.; Hamons, G.W.; Goff, W.A. Assessing RUSLE and Hill-slope Soil Movement Modeling in the Central Appalachians; Transactions of the ASABE Annual International Meeting: Pittsburgh, PA, USA, 2010. [Google Scholar]
- Ireland, H.A.; Sharpe, C.F.S.; Eargle, D.H. Principles of gully erosion in the Piedmont of South Carolina No. 633; US Department of Agriculture: Washington, DC, USA, 1939.
- Morgan, R.P.C. Soil Erosion and Conservation; Blackwell Publishing: Oxford, UK, 2005. [Google Scholar]
- Luffman, I.; Nandi, A.; Spiegel, T. Gully morphology, hillslope erosion, and precipitation characteristics in the Appalachian Valley and Ridge province, southeastern USA. Catena 2015, 133, 221–232. [Google Scholar] [CrossRef]
- Barnes, N.; Luffman, I.; Nandi, A. Gully erosion and freeze-thaw processes in clay-rich soils, northeast Tennessee, USA. GeoResJ 2016, 9, 67–76. [Google Scholar] [CrossRef]
- Sevon, W.; Potter, N.; Crowl, G. Appalachian peneplains: An historical review. Earth Sci. Hist. 1983, 2, 156–164. [Google Scholar]
- Stroosnijder, L. Measurement of erosion: Is it possible? Catena 2005, 64, 162–173. [Google Scholar] [CrossRef]
- Moore, H.L. Drainage problems in carbonate terrain of East Tennessee. In Proceedings of the 27th Annual Highway Geology Symposium, Orlando, FL, USA, 19–21 May 1976; pp. 112–131. [Google Scholar]
- Soil Survey Staff, Natural Resources Conservation Service, United States Department of Agriculture, Web Soil Survey. Available online: https://websoilsurvey.sc.egov.usda.gov/ (accessed on 14 March 2020).
- Luffman, I.; Nandi, A. Freeze-thaw induced gully erosion: A long-term high-resolution analysis. Agronomy 2019, 9, 549. [Google Scholar] [CrossRef] [Green Version]
- Couper, P.; Stott, T.I.M.; Maddock, I.A.N. Insights into river bank erosion processes derived from analysis of negative erosion-pin recordings: Observations from three recent UK studies. J. Br. Geomorphol. Res. Group 2002, 79, 59–79. [Google Scholar] [CrossRef]
- Kearney, S.; Fonte, S.; Garcia, E.; Smukler, S. Improving the utility of erosion pins: Absolute value of pin height change as an indicator of relative erosion. Catena 2018, 163, 427–432. [Google Scholar] [CrossRef]
- National Oceanic and Atmospheric Administration Surface Weather Observations and Reports; National Climatic Data Center: Asheville, NC, USA, 1998.
- Keay-Bright, J.; Boardman, J. Evidence from field-based studies of rates of soil erosion on degraded land in the central Karoo, South Africa. Geomorphology 2009, 103, 455–465. [Google Scholar] [CrossRef] [Green Version]
- Winterwerp, J.C.; Van Kesteren, W.G.M.; Van Prooijen, B.; Jacobs, W. A conceptual framework for shear flow-induced erosion of soft cohesive sediment beds. J. Geophys. Res. Space Phys. 2012, 117. [Google Scholar] [CrossRef] [Green Version]
Figure 1.
The study area was located in northeast Tennessee, USA on an actively eroding hillslope.

Figure 2.
Time series of precipitation parameters. AvgInt and MaxInt refer to average and maximum precipitation intensity, respectively. TotAccum is the total depth of precipitation received during each weekly measurement period, and Duration is the total minutes during which precipitation was measured, for each measurement period. Columns delineate seasons (Su = summer, A = autumn, W = winter, and Sp = spring).

Figure 3.
Comparison of erosion variables by geomorphic area. The top three graphs show erosion in channels (C, top), interfluves (I, middle), and sidewalls (S, lower), bottom graph shows precipitation. Columns mark seasons (Su = summer, A = autumn, W = winter, and Sp = spring).
Figure 3.
Comparison of erosion variables by geomorphic area. The top three graphs show erosion in channels (C, top), interfluves (I, middle), and sidewalls (S, lower), bottom graph shows precipitation. Columns mark seasons (Su = summer, A = autumn, W = winter, and Sp = spring).

Table 1.
Descriptive statistics of precipitation parameters by measurement period.
| Parameter | Season | Mean | Median | Standard Deviation | Min. | Max. | Skewness | Kurtosis |
|---|---|---|---|---|---|---|---|---|
| Total Accumulation (mm) | All | 22.2 | 17.0 | 21.1 | 0.0 | 132.6 | 1.6 | 4.0 |
| Spring | 24.3 | 17.5 | 21.7 | 0.25 | 93.2 | 1.1 | 0.8 | |
| Summer | 22.7 | 19.6 | 18.6 | 0.0 | 72.1 | 0.7 | −0.2 | |
| Autumn | 15.3 | 11.2 | 16.2 | 0.0 | 78.0 | 1.5 | 2.8 | |
| Winter | 26.3 | 19.1 | 25.9 | 0.25 | 132.6 | 2.1 | 5.7 | |
| Duration (min) | All | 278.7 | 220.0 | 285.6 | 0 | 2600 | 3.0 | 16.5 |
| Spring | 299.4 | 265.0 | 243.4 | 5 | 1185 | 1.3 | 2.0 | |
| Summer | 209.9 | 190.0 | 178.3 | 0 | 995 | 1.5 | 3.6 | |
| Autumn | 192.5 | 130.0 | 218.2 | 0 | 1175 | 2.3 | 7.1 | |
| Winter | 424.7 | 305.0 | 409.1 | 5 | 2600 | 2.8 | 11.6 | |
| Average Intensity (mm/min) | All | 0.1 | 0.06 | 0.05 | 0 | 0.3 | 1.9 | 4.5 |
| Spring | 0.1 | 0.07 | 0.04 | 0.03 | 0.2 | 1.5 | 1.5 | |
| Summer | 0.1 | 0.1 | 0.06 | 0 | 0.3 | 1.1 | 1.4 | |
| Autumn | 0.1 | 0.06 | 0.05 | 0 | 0.3 | 1.9 | 4.8 | |
| Winter | 0.1 | 0.05 | 0.01 | 0.05 | 0.1 | 2.2 | 5.6 | |
| Maximum Intensity (mm/min) | All | 71.5 | 15.5 | 220.2 | 0 | 2090.2 | 6.4 | 45.2 |
| Spring | 49.1 | 16.3 | 120.9 | 0 | 975.4 | 6.7 | 50.7 | |
| Summer | 108.1 | 48.5 | 276.8 | 0 | 2090.2 | 5.7 | 35.8 | |
| Autumn | 88.1 | 13.0 | 288.0 | 0 | 1625.6 | 5.0 | 24.6 | |
| Winter | 34.6 | 6.6 | 121.3 | 0 | 975.4 | 7.3 | 56.9 |
Table 2.
Descriptive statistics for erosion variables by measurement period. All values measured in millimeters. C, channel I, interfluve; S, sidewall.
Table 2.
Descriptive statistics for erosion variables by measurement period. All values measured in millimeters. C, channel I, interfluve; S, sidewall.
| Variable | Season | Mean | Median | Standard Deviation | Min. | Max. | Skewness | Kurtosis |
|---|---|---|---|---|---|---|---|---|
| CAvg|Ch| | All | 9.9 | 5.9 | 10.3 | 0.9 | 82.4 | 2.6 | 10.2 |
| Spring | 11.1 | 6.9 | 12.2 | 1.4 | 82.4 | 3.4 | 16.1 | |
| Summer | 7.4 | 4.8 | 6.3 | 0.9 | 31.2 | 1.8 | 2.9 | |
| Autumn | 4.8 | 3.2 | 4.6 | 0.9 | 24.4 | 2.6 | 7.7 | |
| Winter | 16.8 | 12.8 | 12.2 | 1.4 | 53.9 | 1.1 | 0.7 | |
| CDep | All | 10.6 | 6.2 | 12.2 | 1.0 | 79.4 | 2.9 | 10.5 |
| Spring | 10.0 | 7.0 | 9.2 | 1.0 | 45.2 | 2.2 | 5.2 | |
| Summer | 8.4 | 5.3 | 9.7 | 1.0 | 72.3 | 4.1 | 23.4 | |
| Autumn | 4.8 | 3.5 | 4.2 | 1.0 | 25.8 | 2.7 | 9.5 | |
| Winter | 19.3 | 16.2 | 17.3 | 2.0 | 79.4 | 1.8 | 3.0 | |
| CErosion | All | −9.4 | −5.2 | 10.7 | −78.2 | 0 | −2.7 | 9.5 |
| Spring | −11.4 | −5.6 | 13.9 | −78.2 | −1.4 | −2.7 | 8.7 | |
| Summer | −7.1 | −5.0 | 5.9 | −28.6 | −1.0 | −2.0 | 3.9 | |
| Autumn | −5.4 | −3.4 | 5.7 | −34.0 | −1.0 | −3.0 | 10.9 | |
| Winter | −14.2 | −10.6 | 12.8 | −50.3 | 0 | −1.4 | 1.4 | |
| IAvg|Ch| | All | 3.5 | 3.2 | 1.8 | 0.6 | 14.1 | 2.2 | 8.1 |
| Spring | 3.6 | 3.2 | 1.8 | 1.1 | 14.1 | 3.3 | 16.1 | |
| Summer | 3.0 | 2.9 | 1.0 | 1.0 | 6.7 | 0.8 | 1.9 | |
| Autumn | 2.8 | 2.6 | 1.1 | 0.6 | 6.9 | 0.9 | 2.4 | |
| Winter | 4.8 | 4.7 | 2.3 | 0.8 | 13.1 | 1.2 | 2.1 | |
| IDep | All | 3.7 | 3.4 | 2.0 | 1.0 | 15.7 | 2.2 | 8.9 |
| Spring | 3.8 | 3.5 | 1.6 | 1.0 | 9.6 | 1.0 | 1.6 | |
| Summer | 3.3 | 3.1 | 1.8 | 1.0 | 15.7 | 3.9 | 25.2 | |
| Autumn | 3.2 | 2.8 | 1.6 | 1.0 | 9.7 | 1.6 | 4.1 | |
| Winter | 4.7 | 4.3 | 2.5 | 1.4 | 14.1 | 1.8 | 4.4 | |
| IErosion | All | −4.1 | −3.6 | 2.3 | −19.3 | 0 | −2.3 | 9.0 |
| Spring | −4.2 | −3.8 | 2.4 | −14.9 | −1.3 | −2.1 | 6.3 | |
| Summer | −3.4 | −3.3 | 1.4 | −10.8 | 0 | −2.0 | 10.3 | |
| Autumn | −3.2 | −3.0 | 1.4 | −7.8 | −1.0 | −0.8 | 1.0 | |
| Winter | −5.6 | −4.9 | 3.1 | −19.3 | −1.2 | −1.7 | 5.0 | |
| SAvg|Ch| | All | 5.0 | 4.1 | 3.2 | 0.6 | 18.2 | 1.7 | 3.0 |
| Spring | 5.0 | 4.3 | 2.9 | 1.7 | 15.2 | 1.9 | 3.9 | |
| Summer | 3.8 | 3.4 | 1.6 | 1.2 | 8.1 | 0.8 | 0.2 | |
| Autumn | 3.5 | 3.0 | 1.9 | 0.6 | 10.9 | 1.9 | 5.1 | |
| Winter | 8.0 | 7.6 | 3.8 | 1.6 | 18.2 | 0.8 | 0.1 | |
| SDep | All | 5.2 | 4.2 | 3.3 | 1.0 | 20.2 | 1.8 | 4.2 |
| Spring | 5.1 | 4.5 | 2.9 | 1.0 | 18.5 | 2.1 | 6.4 | |
| Summer | 3.9 | 3.6 | 1.8 | 1.3 | 9.3 | 0.8 | 0.2 | |
| Autumn | 3.9 | 3.4 | 2.2 | 1.1 | 12.3 | 1.7 | 4.0 | |
| Winter | 8.1 | 6.9 | 4.3 | 2.3 | 20.2 | 1.0 | 0.5 | |
| SErosion | All | −5.6 | −4.5 | 3.7 | −23.3 | −1.0 | −2.0 | 4.6 |
| Spring | −5.7 | −4.6 | 3.8 | −23.3 | −2.2 | −2.6 | 7.6 | |
| Summer | −4.5 | −3.7 | 2.5 | −14.4 | −1.5 | −1.9 | 4.1 | |
| Autumn | −4.0 | −3.6 | 2.1 | −13.7 | −1.0 | −2.2 | 7.2 | |
| Winter | −8.4 | −7.7 | 4.6 | −22.7 | −1.3 | −0.9 | 0.9 |
Table 3.
Spearman’s correlation coefficients for erosion variables and precipitation parameters. C, channel; I, interfluve; S, sidewall. Only significant correlations are shown (* significant at α = 0.05, ** significant at α = 0.01).
Table 3.
Spearman’s correlation coefficients for erosion variables and precipitation parameters. C, channel; I, interfluve; S, sidewall. Only significant correlations are shown (* significant at α = 0.05, ** significant at α = 0.01).
| Variable Name | Total Accumulation (mm) | Duration (min) | Avg. Intensity (mm/min) | Max. Intensity (mm/min) |
|---|---|---|---|---|
| CAvg|Ch| | 0.467 ** | 0.470 ** | 0.116 * | 0.184 ** |
| CDep | 0.352 ** | 0.367 ** | - | 0.132 * |
| CErosion | −0.469 ** | −0.447 ** | −0.155 ** | −0.230 ** |
| IAvg|Ch| | 0.130 * | 0.178 ** | - | - |
| IDep | 0.138 * | 0.146 * | - | - |
| IErosion | - | −0.156 ** | - | - |
| SAvg|Ch| | 0.238 ** | 0.279 ** | - | - |
| SDep | 0.240 ** | 0.265 ** | - | - |
| SErosion | −0.199 ** | −0.248 ** | - | - |
| Total Accumulation (mm) | 1.000 | 0.903 ** | 0.591 ** | 0.657 ** |
| Duration (min) | 1.000 | 0.278 ** | 0.461 ** | |
| Average Intensity (mm/min) | 1.000 | 0.794 ** | ||
| Maximum Intensity (mm/min) | 1.000 |
Table 4.
Precipitation parameters retained (indicated by *) in Ordinary Least Squares regression models of erosion variables (dependent variables) using lagged precipitation parameters (independent variables). C, channel; I, interfluve; S, sidewall. Each column represents a different model.
Table 4.
Precipitation parameters retained (indicated by *) in Ordinary Least Squares regression models of erosion variables (dependent variables) using lagged precipitation parameters (independent variables). C, channel; I, interfluve; S, sidewall. Each column represents a different model.
| Parameters Retained | CAvg|Ch| | CDep | CErosion | IAvg|Ch| | IDep | IErosion | SAvg|Ch| | SDep | SErosion | |
|---|---|---|---|---|---|---|---|---|---|---|
| R2 | 0.297 | 0.191 | 0.354 | 0.119 | 0.093 | 0.120 | 0.174 | 0.137 | 0.205 | |
| Duration (min) | Current | * | * | * | * | * | * | * | * | |
| Lag1 | * | * | ||||||||
| Lag3 | * | |||||||||
| Lag4 | * | * | * | * | * | |||||
| Lag5 | * | |||||||||
| Lag6 | * | * | * | |||||||
| Lag8 | * | * | * | * | ||||||
| TotAcc (mm) | Current | |||||||||
| Lag1 | * | |||||||||
| Lag4 | * | * | * | |||||||
| Lag6 | * | * | ||||||||
| Lag8 | * | |||||||||
| AvgInt (mm/min) | Lag2 | * | * | * | ||||||
| Lag4 | * | * | * | |||||||
| Lag5 | * | |||||||||
| Lag7 | * | |||||||||
| Lag8 | * | * | * | * | ||||||
| Lag9 | * | |||||||||
| Lag11 | * | |||||||||
| MaxInt (mm/min) | Lag4 | * | ||||||||
| Lag9 | * | |||||||||
| Lag10 | * | * | ||||||||
| Lag11 | * |
Table 5.
Parameters retained (indicated by *) in seasonal Ordinary Least Squares regression models of erosion variables (dependent variables) using lagged precipitation parameters (independent variables) Duration (min), Total Accumulation (TotAcc (mm)), and Average and Maximum Intensity (AvgInt and MaxInt, respectively (mm/min)). C, channel; I, interfluve; S, sidewall. Each column represents a separate model.
| Spring | Parameters Retained | CAvg|Ch| | CDep | CErosion | IDep | IErosion | SAvg|Ch| | SDep | SErosion | |
| R2 | 0.078 | No Model | 0.429 | No Model | 0.045 | 0.113 | No Model | 0.144 | ||
| Duration | Current | * | ||||||||
| Lag3 | * | |||||||||
| Lag6 | * | |||||||||
| Lag7 | * | |||||||||
| Lag8 | * | * | * | |||||||
| TotAcc | Current | * | * | |||||||
| Lag2 | * | |||||||||
| Lag8 | * | |||||||||
| AvgInt | Lag1 | * | * | * | ||||||
| Summer | Parameters Retained | CAvg|Ch| | CDep | CErosion | IDep | IErosion | SAvg|Ch| | SDep | SErosion | |
| R2 | 0.49 | 0.389 | 0.344 | 0.257 | 0.131 | 0.373 | 0.372 | 0.32 | ||
| Duration | Current | * | * | |||||||
| Lag2 | * | |||||||||
| Lag7 | * | |||||||||
| Lag11 | * | * | * | |||||||
| TotAcc | Current | * | * | |||||||
| Lag6 | * | |||||||||
| Lag8 | * | |||||||||
| AvgInt | Current | * | * | * | ||||||
| Lag5 | * | |||||||||
| MaxInt | Lag1 | * | * | * | ||||||
| Lag2 | * | |||||||||
| Lag4 | * | |||||||||
| Lag8 | * | * | ||||||||
| Lag10 | * | |||||||||
| Lag11 | * | * | * | * | ||||||
| Autumn | Parameters Retained | CAvg|Ch| | CDep | CErosion | IDep | IErosion | SAvg|Ch| | SDep | SErosion | |
| R2 | 0.364 | 0.19 | 0.258 | 0.125 | no model | 0.07 | 0.093 | 0.147 | ||
| Duration | Current | * | * | * | ||||||
| Lag3 | * | |||||||||
| Lag7 | * | |||||||||
| TotAcc | Lag9 | * | ||||||||
| AvgInt | Lag10 | * | * | * | * | |||||
| MaxInt | Current | * | ||||||||
| Lag2 | * | * | ||||||||
| Winter | Parameters Retained | CAvg|Ch| | CDep | CErosion | IDep | IErosion | SAvg|Ch| | SDep | SErosion | |
| R2 | 0.374 | 0.324 | 0.472 | 0.273 | 0.251 | 0.245 | 0.087 | 0.347 | ||
| Duration | Current | * | * | |||||||
| Lag4 | * | |||||||||
| Lag6 | * | |||||||||
| TotAcc | Lag4 | * | * | |||||||
| Lag6 | * | |||||||||
| AvgInt | Lag1 | * | * | |||||||
| Lag4 | * | |||||||||
| Lag9 | * | |||||||||
| Lag10 | * | |||||||||
| Lag11 | * | * | ||||||||
| MaxInt | Current | * | * | * | ||||||
| Lag1 | * | |||||||||
| Lag7 | * | * | ||||||||
| Lag9 | * | * | * | * | ||||||
| Lag10 | * | * | ||||||||
| Lag11 | * |
Table 6.
Retention frequency of lagged precipitation parameters (Duration, Total Accumulation (TotAcc), and Average and Maximum Intensity (AvgInt and MaxInt, respectively) in OLS regression models of erosion annually and seasonally for the full study area and for each geomorphic area: Channels, Interfluves, and Sidewalls.
| Geomorphic Area | Parameter | All Seasons | Spring | Summer | Autumn | Winter |
|---|---|---|---|---|---|---|
| Study area | Duration | 24 | 7 | 7 | 5 | 4 |
| TotAcc | 7 | 4 | 4 | 1 | 3 | |
| AvgInt | 14 | 3 | 4 | 4 | 7 | |
| MaxInt | 5 | 0 | 12 | 3 | 6 | |
| Channels | Duration | 10 | 3 | 4 | 4 | 4 |
| TotAcc | 4 | 4 | 1 | 0 | 2 | |
| AvgInt | 1 | 1 | 1 | 2 | 0 | |
| MaxInt | 2 | 0 | 2 | 2 | 6 | |
| Interfluves | Duration | 6 | 1 | 0 | 0 | 0 |
| TotAcc | 1 | 0 | 2 | 0 | 1 | |
| AvgInt | 5 | 0 | 1 | 1 | 3 | |
| MaxInt | 2 | 0 | 3 | 0 | 2 | |
| Sidewalls | Duration | 8 | 3 | 3 | 1 | 0 |
| TotAcc | 2 | 0 | 1 | 1 | 0 | |
| AvgInt | 8 | 2 | 2 | 1 | 4 | |
| MaxInt | 1 | 0 | 7 | 1 | 5 |
© 2020 by the authors. Licensee MDPI, Basel, Switzerland. This article is an open access article distributed under the terms and conditions of the Creative Commons Attribution (CC BY) license (http://creativecommons.org/licenses/by/4.0/).
Share and Cite
MDPI and ACS Style
Luffman, I.; Nandi, A. Seasonal Precipitation Variability and Gully Erosion in Southeastern USA. Water 2020, 12, 925. https://doi.org/10.3390/w12040925
AMA Style
Luffman I, Nandi A. Seasonal Precipitation Variability and Gully Erosion in Southeastern USA. Water. 2020; 12(4):925. https://doi.org/10.3390/w12040925
Chicago/Turabian StyleLuffman, Ingrid, and Arpita Nandi. 2020. "Seasonal Precipitation Variability and Gully Erosion in Southeastern USA" Water 12, no. 4: 925. https://doi.org/10.3390/w12040925
Note that from the first issue of 2016, this journal uses article numbers instead of page numbers. See further details here.