Stabilization of Chromium (VI) in the Presence of Iron (II): Method Development and Validation

German Environment Agency (UBA), Schichauweg 58, 12307 Berlin, Germany
*
Author to whom correspondence should be addressed.
Water 2020, 12(4), 924; https://doi.org/10.3390/w12040924
Submission received: 11 February 2020
/
Revised: 18 March 2020
/
Accepted: 21 March 2020
/
Published: 25 March 2020
(This article belongs to the Section Water Quality and Contamination)
Abstract
:The presence of Cr (VI) in drinking water is mainly caused by leaching of chromium-containing aquifer material into groundwater. In contrast to Cr (III), it has been classified as highly toxic. For this reason, the WHO recommends the implementation of separate guideline values, instead of the so far used limit value of total chromium. The separate evaluation of Cr (VI) in raw water and during removal processes requires the Cr (VI) concentration to remain stable after sampling. In the presence of Fe (II), a stabilization of the samples is necessary to inhibit further reduction of Cr (VI) by Fe (II). In this study, two methods of Cr (VI) stabilization in Fe-(II)-containing water samples are investigated: Fe (II) oxidation by oxygen at high pH values in the presence of buffers and Fe (II) complexation by chelating agents. When adding hydrogen carbonate buffer, Cr (VI) recovery reached 100% at pH values of 10 to 12 in the presence of up to 3 mg L–1 Fe (II). Using hydrogen phosphate buffer, Cr (VI) recovery reached 100% only at pH 12 but for a Fe (II) concentration up to 6 mg L–1. Ammonium buffer was found to be less suitable for Cr (VI) stabilization. The addition of EDTA and citrate resulted in low recovery of Cr (VI), whereas citrate was found to accelerate the Cr (VI) reduction.
1. Introduction
Chromium is a transition metal and the twenty-first most abundant element in the earth’s crust [1]. Due to its high corrosion resistance, it is often used in alloys, mainly for the production of stainless steel [2]. Further industrial applications include leather-tanning and pigmentation [3]. The dominant naturally occurring form of chromium is the trivalent state (Cr (III)), while hexavalent chromium (Cr (VI)) compounds are only found in small quantities [1]. Anthropogenic sources, such as effluent discharges of chromium-working industries, make up the largest part of Cr (VI) occurrence in the environment [3].
Due to its high solubility and mobility, Cr (VI) can be found in surface waters while Cr (III) is relatively insoluble at pH 6–9 [4]. Cr (III) can be naturally oxidized to Cr (VI) by atmospheric oxygen in the presence of manganese oxides functioning as redox mediators [5]. Under reducing conditions in the groundwater, Cr (VI) can be reduced to Cr (III) by Fe (II) ions, Fe (II)-bearing minerals, sulfides or organic matter [6]. The oxidation state and complexation of chromium is determined by the redox potential, the pH, and the total chromium concentration of the medium [7]. Cr (III) occurs at wide ranges of both the pH (5 to 14) and the redox potential (–0.4 to 0.8 V), resulting in the species Cr(OH)2+, Cr(OH)2+, Cr(OH)3, and Cr(OH)4– [3,7]. Under oxidizing conditions, the hexavalent soluble species hydrogen chromate, chromate, and dichromate are formed depending on the pH and chromium concentration [3].
While Cr (III) is an essential nutrient for humans that is, e.g., responsible for reducing blood glucose levels [8], Cr (VI) is highly toxic, mutagenic, and carcinogenic [9]. The major sources of chromium exposure for humans are food and drinking water and, in the case of chrome-production workers, the inhalation of chromium-polluted air [3]. In 2013, the German Environment Agency (Umweltbundesamt – UBA) commissioned a report to assess the toxicity of Cr (VI). The report concluded that Cr (VI) has to be classified as genotoxic and derived an exposure risk relationship for humans in drinking water of 0.3 µg L–1, according to the World Health Organization (WHO) guidelines for genotoxic contaminants [10]. To date, in the European Union, a limit value of chromium in drinking water only exists for the concentration of total chromium (sum of Cr (III) and Cr (VI)) which is set at 50 µg L–1 (Council directive 98/83/EC) [11]. Likewise, the United States Environmental Protection Agency set a limit value only for total chromium at 100 µg L–1 (United States Environmental Protection Agency, 40 CFR 141) [12]. In Switzerland, a limit value for the concentration of Cr (VI) in drinking water was adopted in 2014, with a value of 20 µg L–1 (Federal Department of Home Affairs, Switzerland, TBDV, 2. Abschnitt, Art. 3) [13]. The WHO recommends the implementation of separate guideline values for Cr (III) and Cr (VI), but concedes difficulties in the analysis for Cr (VI) only [14].
Different treatment methods for the removal of chromium from contaminated groundwater sites and for drinking water production are employed. For instance, permeable reactive barriers containing zero-valent iron are used for in situ remediation of groundwater contaminated with Cr (VI) [15,16]. Sharma et al. [7] give an overview of the methods and their limitations and classify them into five groups: a combination of coagulation, precipitation, and filtration; adsorption; ion exchange; membrane technology; biological removal. Reduction–coagulation–filtration (RCF) with Fe (II) was found to be the most effective process, followed by adsorption-based methods [7]. In the RCF process, Cr (VI) is reduced by added Fe (II) forming Cr (III), which co-precipitates with Fe (III) hydroxides and can be subsequently removed by filtration [7]. Several studies have shown that Cr (VI) reduction by Fe (II) is not limited to anaerobic conditions but also takes place in the presence of oxygen in a wide pH range [17,18,19,20]. Despite the competing reaction of Fe (II) with oxygen, Fe (II) reduces Cr (VI) very rapidly to Cr (III) [17,21,22]. Thus, Cr (VI) samples taken for the evaluation of raw water and of treatment processes, such as RCF, are not expected to be stable as long as Fe (II) is present, resulting in an underestimation of Cr (VI) at the time of measurement. As a result, the concentration of the toxicologically more relevant Cr (VI) can easily be underestimated and the effectiveness at different stages of a treatment process is difficult to be evaluated.
The aim of this study was the development of a method to stabilize Cr (VI) in the presence of Fe (II). The objective was to achieve a fast elimination of Fe (II) during sampling by its oxidation with oxygen. By raising the pH value, the kinetics of the Fe (II) oxidation by oxygen are improved and oxygen becomes the preferred oxidizing agent compared to Cr (VI) [18]. Hydrogen phosphate, hydrogen carbonate, and ammonium buffer were investigated for their capability of maintaining a high pH value and stabilizing the Cr (VI) concentration. In addition, stabilization by the chelating agents ethylenediaminetetraacetic acid (EDTA) and citrate was investigated.
2. Materials and Methods
2.1. Chemicals and Stock Solutions
Sodium chromate, iron (II) sulfate heptahydrate, potassium phosphate dibasic, sodium bicarbonate, and ammonium sulfate were purchased from Merck (Darmstadt, Germany). Ammonium hydroxide solution (25%) was purchased from AppliChem (Darmstadt, Germany) and 1,5-Diphenylcarbazid (DPC) from VWR International (Radnor, USA). Trisodium citrate (dihydrate) was purchased from Carl Roth (Karlsruhe, Germany) and EDTA (Titriplex® III solution) from Merck. All chemicals used were of analytical grade.
Cr (VI) solution (1 g L–1) was prepared by dissolving 3.18 g sodium chromate in 1 L of ultrapure water. Fe (II) solution (1 g L–1) was prepared by dissolving 4.98 g iron (II) sulfate heptahydrate in 1 L of ultrapure water acidified by 10 µL sulfuric acid (Merck). Hydrogen phosphate buffer (17.42 g potassium phosphate dibasic diluted to 200 mL), hydrogen carbonate buffer (8.4 g sodium bicarbonate diluted to 200 mL), and ammonium buffer (33.2 g ammonium sulfate and 53.68 mL ammonium hydroxide solution diluted to 1 L) were prepared as 0.5 M solutions. Citrate and EDTA solutions were prepared with a concentration of 0.1 M.
2.2. Stabilization by Inorganic Buffer Systems
Experiments were conducted with a total sample volume of 50 mL in centrifuge tubes (polypropylene). If not stated otherwise, process water of the waterworks of the UBA in Berlin-Marienfelde (Germany) (Supplementary Materials Table S1) was used for all tests, and tests were not conducted in replicates. Buffer solutions were added with concentrations from 5 to 30 mM with pH values adjusted to 10.0, 11.0, and 12.0 by adding sodium hydroxide. Cr (VI) solution (5 and 50 µg L–1) and Fe (II) solution (1, 3 and 6 mg L–1) were subsequently added. The samples were filtrated (0.45 µm) and 9.1 mL of the filtrate were acidified by 0.8 mL acid mixture (5% sulfuric and 5% phosphoric acid).
Similar experiments were conducted as long-term tests in triplicates over a period of ten weeks with regular sampling. The total sample volume was 250 mL. Bottles were shaken on a horizontal shaker (110 min–1).
For the analysis of the crystal structure of the precipitates, tests with a total volume of 1000 mL and higher Fe (II) concentrations (6, 50 and 100 mg L–1) were conducted to ensure the formation of a sufficient amount of precipitation products. The tests were conducted in process water and in deionized water with 30 mM hydrogen phosphate buffer or hydrogen carbonate buffer and 50 µg L–1 Cr (VI). After a sedimentation period of 7 d, the supernatant was removed. The solids were frozen for about one week and subsequently freeze-dried.
2.3. Stabilization by Chelating Agents
Stabilization by chelating agents was tested using EDTA and citrate solution. The chelating agents were added with 10- and 100-fold excess to the Fe (II) concentration (1, 3 and 6 mg L–1). Additionally, controls without Fe (II) were set up to investigate the reactivity of Cr (VI) with the chelating agents.
2.4. Analyses
Cr (VI) and Fe (II) were photometrically measured using a Perkin Elmer Lamda 35 UV-VIS spectrometer (Waltham, USA). For Cr (VI), a 50 mm flow-through cuvette, and for Fe (II), a 10 mm flow-through cuvette was used. Cr (VI) was analyzed by its color reaction with DPC (DIN EN ISO 18412). Cr (VI) oxidizes DPC under the formation of a red-violet chromium-DPC complex. 0.1 mL DPC solution (10 g L–1 in acetone) were added to the filtrated and acidified sample (9.9 mL). After a reaction time of 15 min, absorption was measured at 540 nm. Cr (VI) was calibrated from 5 to 70 µg L–1. Fe (II) was determined using the Spectroquant iron test kit from Merck (Darmstadt, Germany), where Fe (II) ions react with a triazine derivative to a red-violet complex which was measured at 510 nm. Fe (II) was calibrated from 0.5 to 6 mg L–1.
For initial Cr (VI) concentrations of 5 µg L–1, Cr (VI) was quantified by IC-VIS using an ion exchange system (930 Compact IC Flex Oven/SeS/PP/Deg, Metrohm, Herisau, Swizerland) with an anion-exchange column (Metrosep A SUPP 5, 4 × 100 mm, Metrohm), a precolumn (Metrosep A SUPP 5 Guard, 4 × 5 mm, Metrohm) and post-column derivatization with DPC reagent. The eluent contained 12.8 mM Na2CO3 and 4 mM NaHCO3 and the flow rate was 0.7 mL min–1. The injection volume was 1 mL and the column temperature was 45 °C. DPC reagent contained 484 mg DPC L–1 (1000 mL containing 100 mL methanol, 27.7 mL sulfuric acid, and pure water) and had a flow rate of 0.2 mL min–1. Cr (VI) was detected by VIS absorption at 538 nm. Samples were diluted 1:10. The calibration interval was 0.05–1.0 µg L–1 with a limit of quantification of 0.04 µg L–1.
X-ray diffraction analysis (XRD) of the precipitation products was obtained by using a Bruker 2D Phaser X-ray diffractometer (Karlsruhe, Germany) with Cu-Kα radiation. Data were collected over a range of 5–80° 2θ with a Lynxeye detector (4° wide) with a step size of 0.02° and a step count of 0.5 s. Data were analyzed using HighScore Plus (Malvern Panalytical, Almelo, Netherlands).
2.5. Correlation Analysis
An influence of the buffer concentration on the stabilization of Cr (VI) was assessed using the Spearman’s rank correlation coefficient. The Spearman’s rank correlation assesses monotonic relationships between two variables by ranking them [23]. A Spearman’s rank correlation coefficient of +1 or −1 indicates a perfect monotone function. The Spearman’s rank correlation coefficient ρ can be calculated by the following equation [23]:
with rx and ry standing for the ranks of the two variables.
3. Results and Discussion
For the evaluation of Cr (VI) concentrations in reduced groundwater with high Fe (II) concentrations, during technical elimination by redox-assisted coagulation, or for determining the reaction kinetics of Cr (VI) reduction by Fe (II), the stabilization of Cr (VI) in the presence of Fe (II) is of great importance, since Fe (II) is known to reduce Cr (VI) very rapidly to Cr (III) [17,21,22]. Thus, a continuing reduction of Cr (VI) by Fe (II) in the sample has to be prevented to obtain reliable Cr (VI) concentrations. For this purpose, a stabilization of Cr (VI) by inorganic buffer systems and by chelating agents was investigated by comparing the percentage ratio of stabilized Cr (VI) to the initial Cr (VI) concentration, in the following referred to as the recovery of Cr (VI).
3.1. Stabilization by Inorganic Buffer Systems
3.1.1. Influencing Parameters
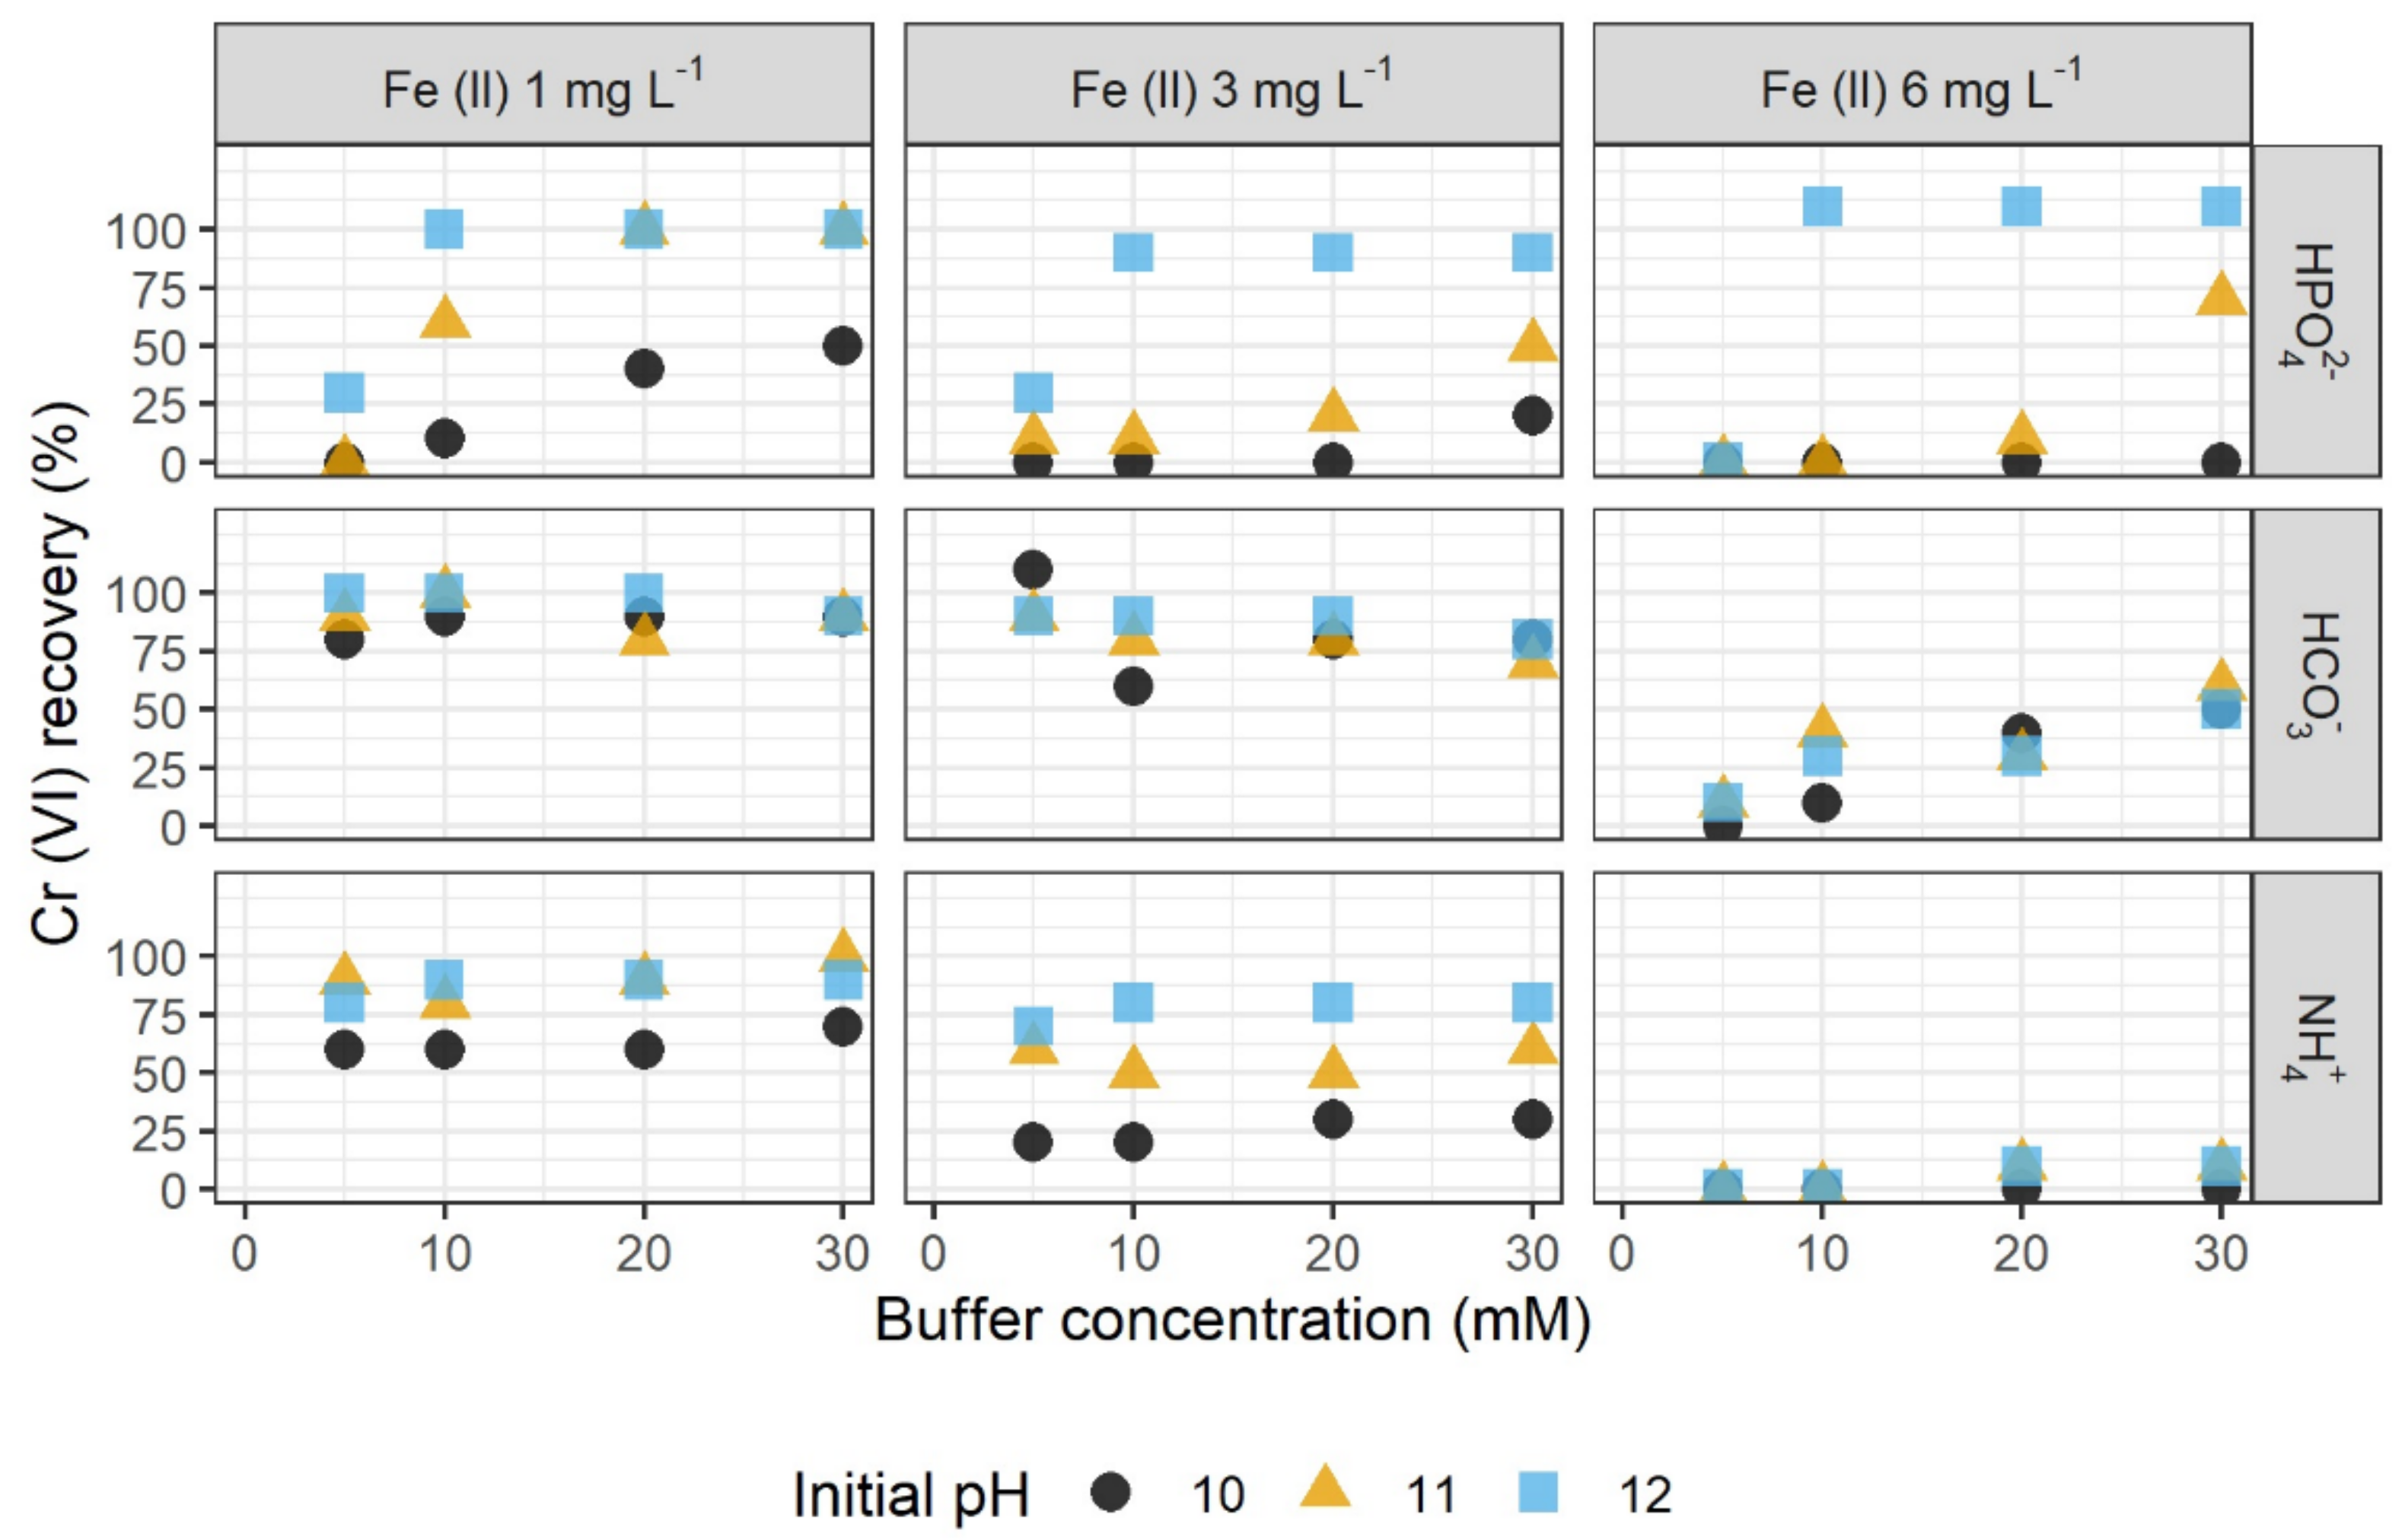
The recovery of Cr (VI) in the presence of different Fe (II) concentrations was tested in three buffer systems with varying pH and buffer concentrations. Highest recovery with 80% to 100% was observed using hydrogen carbonate buffer and a low Fe (II) concentration of 1 mg L–1. The initial pH which was set to 10, 11, and 12 did not result in noticeable differences of the Cr (VI) recovery in the hydrogen carbonate buffer system when using 1 mg L–1 Fe (II). In contrast, when using hydrogen phosphate and ammonium buffer, a distinct influence of the pH was observed, with increasing pH values showing higher recovery. For instance, Cr (VI) recovery reached up to 100% at pH 12, and only 50% at pH 10 in the hydrogen phosphate buffer system. Overall, the ammonium buffer resulted in the lowest recovery.
The tested buffer concentrations varied between 5 and 30 mM. An influence of the buffer concentration on the recovery of Cr (VI) was demonstrated for the tests with hydrogen phosphate, where increasing buffer concentrations correlated with higher recovery (Spearman’s rank correlation coefficients between 0.8 and 1.0, except for the test with 6 mg L–1 Fe (II) at pH 10 with ρ = 0.5) (Supplementary Materials Table S2). In contrast, the tests with hydrogen carbonate and ammonium buffer did not show a clear influence of the buffer concentration on the recovery of Cr (VI).
In all three buffer systems, the recovery of Cr (VI) was shown to be very sensitive to increasing Fe (II) concentrations (Figure 1). At the maximum tested Fe (II) concentration of 6 mg L–1, distinctly lower Cr (VI) concentrations were determined compared to those in the presence of lower Fe (II) concentrations. Using the ammonium buffer, the maximum Cr (VI) recovery amounted to ~20%. While for Fe (II) concentrations of 1 and 3 mg L–1, the highest Cr (VI) recoveries were achieved in the hydrogen carbonate buffer system, the hydrogen phosphate buffer system resulted in higher recoveries for a Fe (II) concentration of 6 mg L–1 and at pH 12. Furthermore, a higher influence of the pH was observed with increasing Fe (II) concentrations.
The initial pH, which was adjusted by sodium hydroxide, could not be kept constant during the reaction. For this reason, the pH value after the reaction (in the following referred to as “final pH”) has to be considered as well. The final pH strongly depended on the buffer concentration (Figure 2). Initial pH and final pH were similar when using higher buffer concentrations, especially for hydrogen phosphate. The highest final pH values were reached in the presence of 1 mg L–1 Fe (II). For the ammonium buffer system, the lowest final pH values were reached ranging from 9.0 to 10.5. In the hydrogen carbonate buffer system with a concentration of 20 and 30 mM and a Fe (II) concentration of 1 mg L–1, the final pH values were equal to the initial pH. In all other cases, the final pH values were lower than the initial pH.
The reduction of Cr (VI) was shown to be strongly pH-dependent. Cr (VI) is in competition with oxygen as an oxidizing agent for Fe (II). With decreasing pH, the reaction of Cr (VI) and Fe (II) is favored over that of oxygen and Fe (II) [22]. Eary and Rai [18] have previously shown that the optimum conditions for Cr (VI) removal by reduction with Fe (II) in oxygenated water are at pH < 10.0. Thus, it can be concluded that a high pH is necessary to stabilize Cr (VI) in a Fe-(II)-containing sample. In the experiments presented here, a final pH ≥ 10.0 was necessary to reach a Cr (VI) recovery of 90% to 100%. Although the buffers were added in excess concentrations compared to the H+ release of the Fe (II) oxidation, the pH was not stable and generally lower than the initially adjusted value due to dilution.
The concentration of Fe (II) was shown to have a large impact on the Cr (VI) recovery, even for a constant pH. An increase in the Fe (II) concentration enhances the reaction of Cr (VI) and Fe (II) due to the higher availability of reducing agent. Thus, the pH value is not sufficient for the prediction of the Cr (VI) recovery. At a Fe (II) concentration of 6 mg L–1 (the maximum permissible Fe (II) concentration usable according to § 11, chapter 3 of the German Drinking Water Ordinance (TrinkwV) [24]), only the hydrogen phosphate buffer at pH 12 was shown to be suitable for keeping Cr (VI) stable. The high stabilization capability of the hydrogen phosphate buffer is likely due to the phosphate ion, which has been shown to accelerate the oxygenation of Fe (II) remarkably [25]. For lower Fe (II) concentrations (1 mg L–1 or 3 mg L–1), high recoveries of Cr (VI) were reached for both the hydrogen phosphate and the hydrogen carbonate buffer system. However, the final pH values for an initial pH of 10 and 11 were higher in the hydrogen carbonate system than in the hydrogen phosphate system due to the high buffer capacity of hydrogen carbonate in this pH range (pKa,1 = 10.3), resulting in better recovery of Cr (VI). The ammonium buffer system proved to be the most sensitive system regarding increasing Fe (II) concentrations. Starting from a pH value of 9.3 (pKa), a degassing of the resulting ammonia, and thus, a decrease in the effective buffer concentration, is conceivable since the tests were performed in an open system.
3.1.2. XRD Analysis of Precipitation Products
The lower influence of the Fe (II) concentration on the Cr (VI) recovery in the hydrogen phosphate and in the hydrogen carbonate buffer system compared to that in the ammonium buffer system could also be due to a precipitation of iron with phosphate and carbonate to vivianite (Fe2+3[PO4]2·8H2O) and siderite (Fe2+[CO3]), respectively:
In order to investigate this possibility, XRD was used for the analysis of the precipitation products. In the hydrogen phosphate system, tests in pure water showed a yellow-brown coloration of the water without turbidity, indicating a complex formation of Fe (III) and phosphate. In contrast, a flocculation was observed in process water with a Fe (II) concentration of 100 mg L–1. The solid phase showed an amorphous peak, most likely iron hydroxide (Supplementary Materials Figure S1). The formation of vivianite could not be confirmed.
In the hydrogen carbonate system, a flocculation occurred in both process and pure water for a Fe (II) concentration of 6 or 100 mg L–1. However, the XRD analysis of the solids only revealed the formation of calcite, trona, nahcolite, and quartz and not of iron crystals (Table 1, Supplementary Materials Figures S2–S5).
The XRD analysis showed that the formation of siderite (Equation 3) was in competition with the formation of calcite (CaCO3) and nahcolite (NaHCO3). The smaller the solubility product constant (Ksp), the more preferred the precipitation of the compound at the same ion concentrations. In the following, the solubility product constants of the respective compounds at 25 °C are given:
FeCO3: Ksp = 3.13 ⋅ 10–11 [26]
CaCO3: Ksp = 3.36 ⋅ 10–9 [26]
NaHCO3: Ksp = 2.82 ⋅ 10–1 [27]
Based on the solubility product constants and the concentrations of iron, calcium, and sodium cations (Supplementary Materials Table S1) being in the same order of magnitude, a precipitation of siderite would have been expected but did not occur. These results are consistent with the observations of Eary and Rai [18] where the precipitates contained no iron as well. Thus, a precipitation of iron does not represent a sink of Fe (II) in the tests presented here.
3.1.3. Long-Term Tests
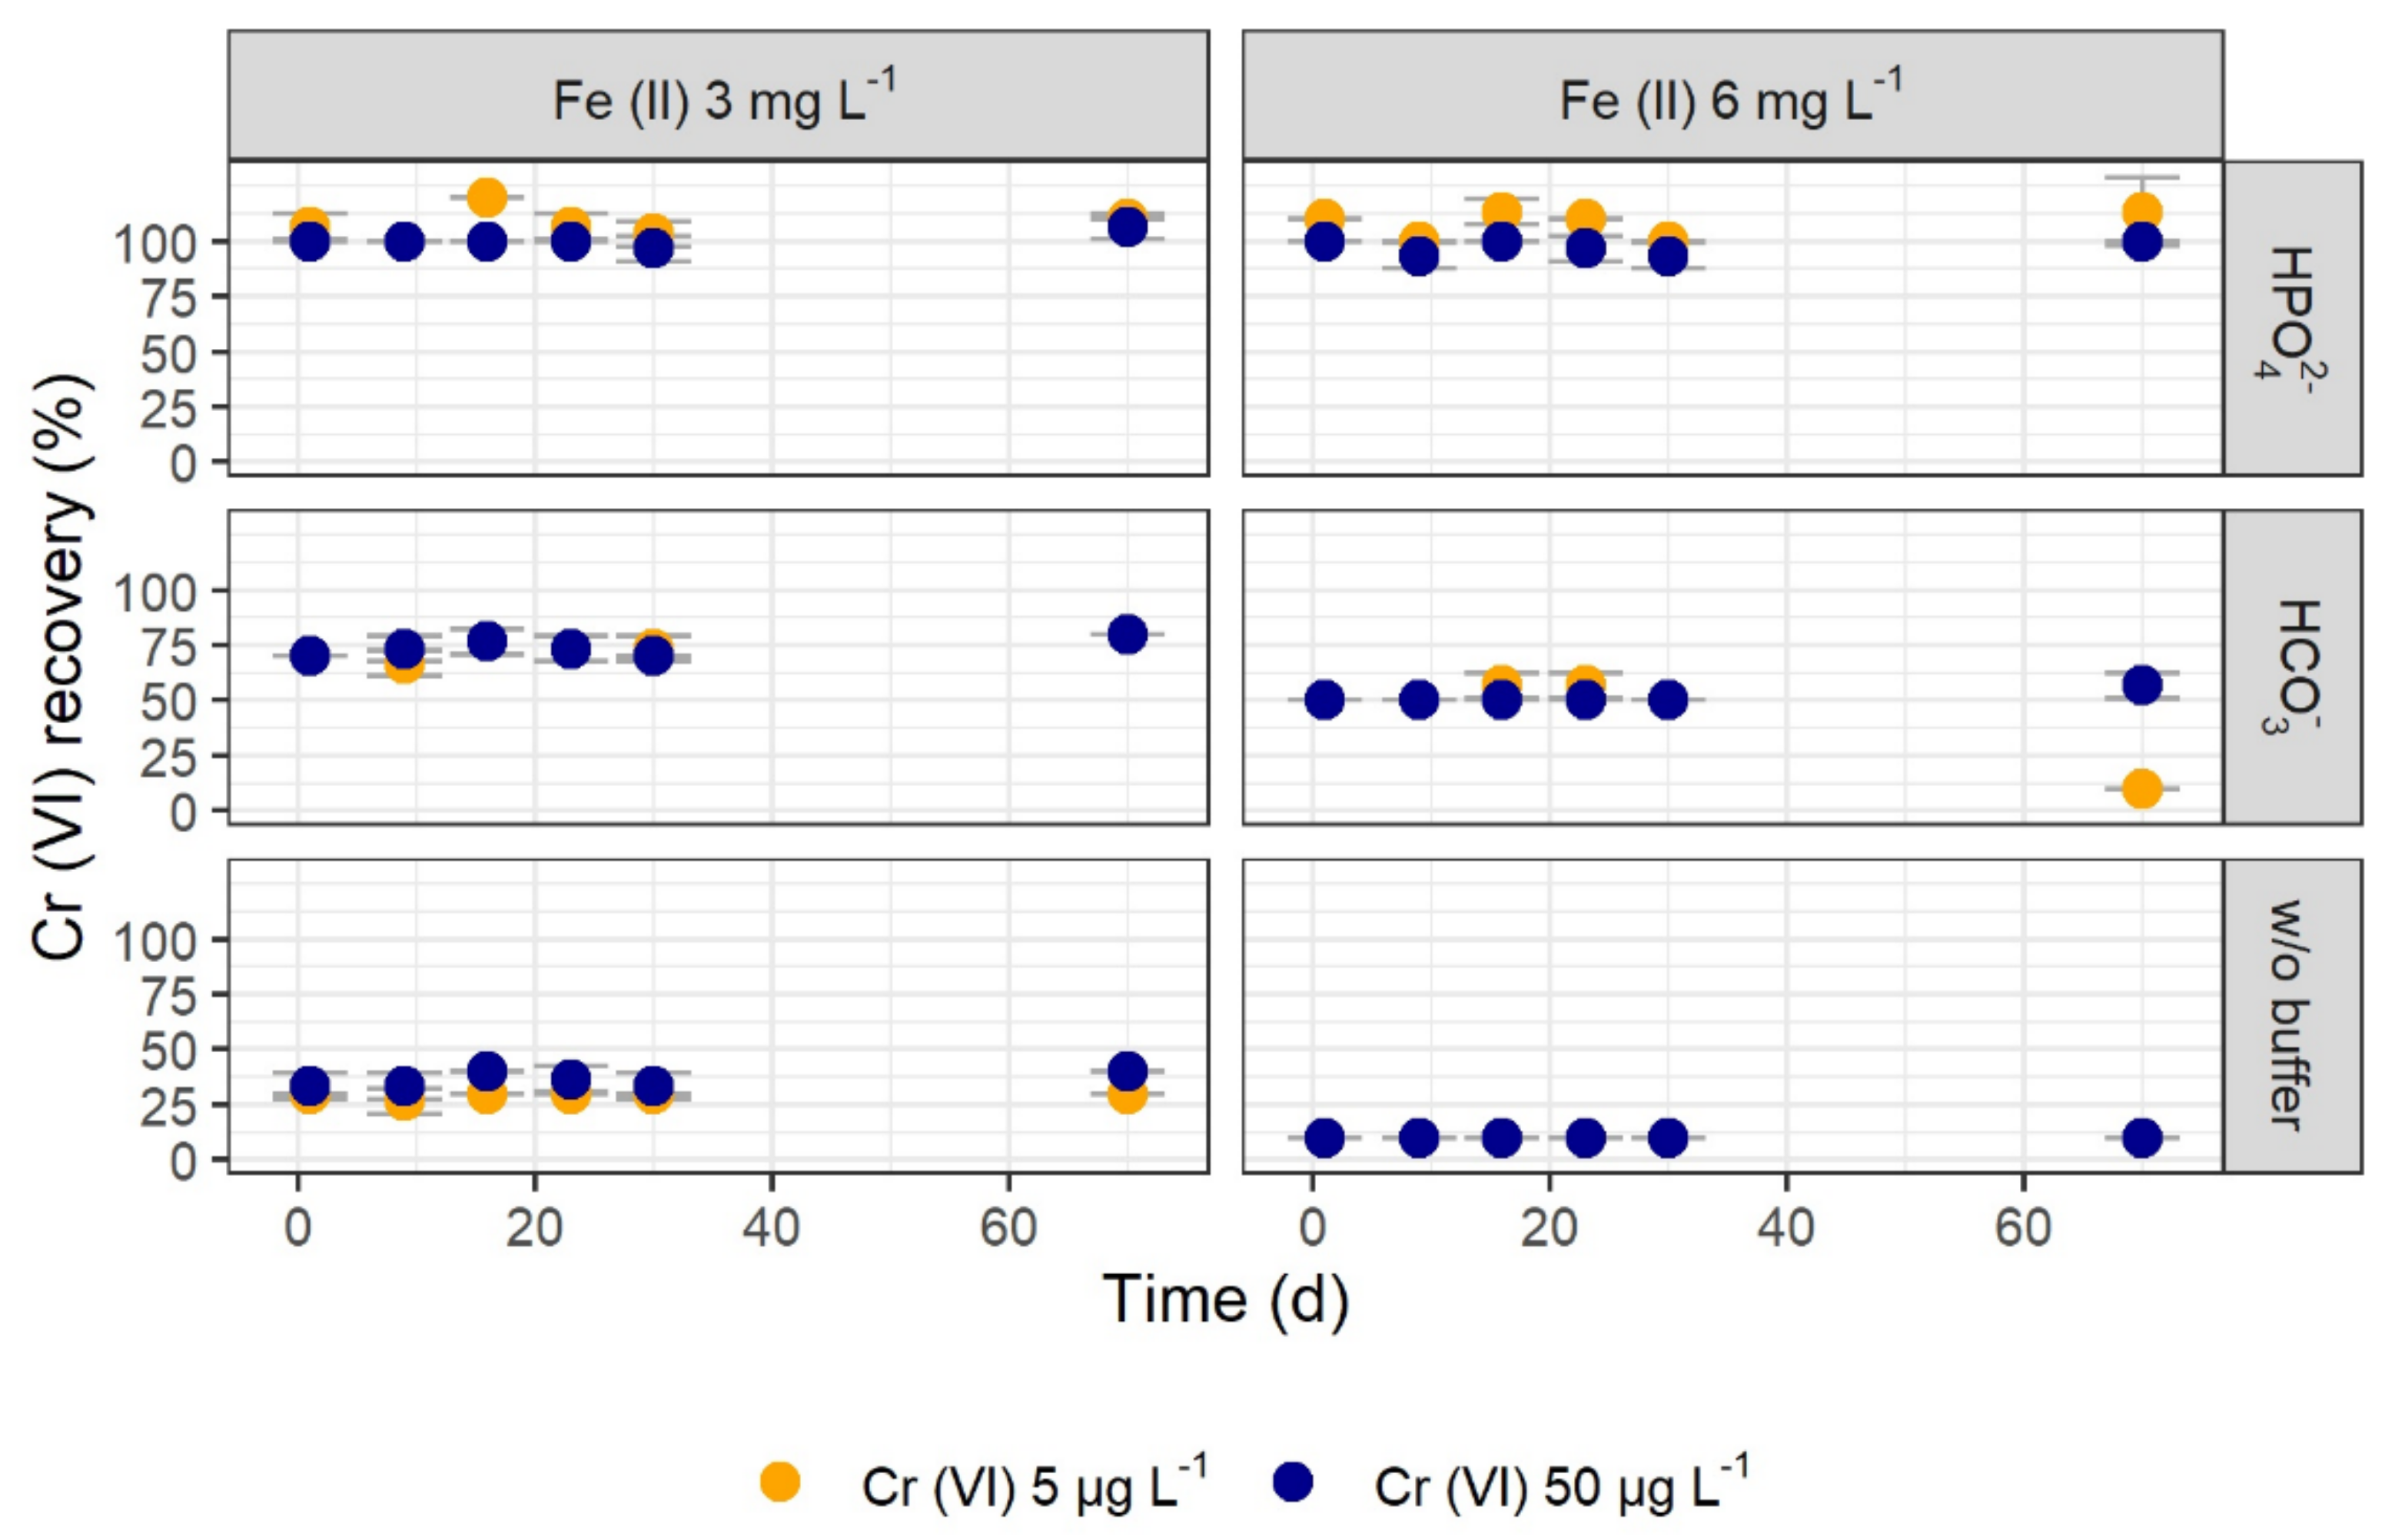
The hydrogen phosphate and the hydrogen carbonate buffer systems were further tested for their capability of stabilizing Cr (VI) over a period of ten weeks. Both buffer systems and a control test without buffer showed constant recoveries for Cr (VI) over time (Figure 3). Depending on the buffer and the Fe (II) concentration, different recoveries were determined with results similar to those of the previous tests. Regardless of the Fe (II) concentration, Cr (VI) showed complete recovery in the hydrogen phosphate buffer system over ten weeks. For an initial Cr (VI) concentration of 5 µg L–1 instead of 50 µg L–1, similar recoveries were reached. Thus, the previous results of Cr (VI) stabilization are also applicable for lower Cr (VI) concentrations found in the environment.
3.2. Stabilization by Chelating Agents
It was further investigated whether organic chelating agents are able to complex Fe (II) and thereby shield it from the reaction with Cr (VI). The chelating agents citrate and EDTA were added with a 10- and 100-fold excess concentration compared to the Fe (II) concentration.
The reactivity of Cr (VI) with citrate and EDTA without Fe (II) was tested. While the recovery of Cr (VI) in the presence of EDTA (1.8, 5.4 and 10.7 mM) was around 100%, it was 86% in the presence of 1.8 and 5.4 mM citrate, and 81% using 10.7 mM citrate (results not shown). Thus, it seems likely that citrate has a reductive effect on Cr (VI). In the presence of Fe (II), the addition of both chelating agents resulted in Cr (VI) recovery below 25%, independent of the concentration of the chelating agent (Figure 4).
Although citrate appeared to react with Cr (VI) in the initial tests, the recoveries reached with citrate were higher than those reached with EDTA. Thus, it can be assumed that despite a complexation of Fe (II), Fe (II) can still function as reducing agent for Cr (VI). Buerge et al. [22] have shown that citrate is able to accelerate the Cr (VI) reduction by Fe (II). Based on these results, it can be concluded that the organic chelating agents citrate and EDTA are not suitable for the stabilization of Cr (VI) in Fe-(II)-containing samples.
4. Conclusions
For a separate determination of Cr (III) and Cr (VI) in drinking water, as recommended by the WHO, analytical methods, as well as stable Cr (VI) concentrations in the samples for a sufficient period of time, are essential. Here, the presence of Fe (II) in the samples constitutes a problem, since Cr (VI) is reduced to Cr (III), resulting in lower Cr (VI) concentrations which do not reflect the actual concentration. A stabilization of Cr (VI) in Fe-(II)-containing water enables a Cr (VI) measurement of reduced groundwater, an accurate identification of Cr-(VI)-contaminated groundwater sites, as well as an evaluation of technical Cr (VI) elimination by redox-assisted coagulation with Fe (II).
In this study, the stabilization of Cr (VI) in the presence of Fe (II) by the addition of different inorganic buffers and the adjustment to an alkaline pH was investigated. In further tests, citrate and EDTA were examined for a possible complexation of Fe (II) and inhibition of the reaction with Cr (VI). Hydrogen phosphate was shown to be a suitable buffer to ensure a Cr (VI) recovery of 100% at pH 12. Using hydrogen carbonate, the Cr (VI) concentration remained stable at pH values from 10 to 12 but only in the presence of maximum 3 mg L–1 Fe (II). Both buffer systems showed constant recovery for Cr (VI) over a period of ten weeks. A stabilization of Cr (VI) by the chelating agents citrate and EDTA resulted in very low recovery and is thus not a suitable stabilization method.
In conclusion, it was found that the addition of 20–30 mM hydrogen phosphate buffer and the adjustment to pH 12 is a very reliable and easily applicable method to stabilize Cr (VI) samples in the presence of up to 6 mg L–1 Fe (II).
Supplementary Materials
The following are available online at https://www.mdpi.com/2073-4441/12/4/924/s1, Table S1: Analytical data of the process water. Table S2: Correlation between buffer concentration and Cr (VI) recovery. Figures S1–S5: XRD spectra of the precipitates.
Author Contributions
Conceptualization, D.M.; methodology, D.M; validation, D.M., C.P. and F.E.-A.; formal analysis, C.P.; investigation, C.P.; writing—original draft preparation, F.E.-A. and D.M.; writing—review and editing, F.E.-A. and D.M.; visualization, C.P. and F.E.-A.; supervision, D.M. and F.E.-A.; project administration, D.M.; funding acquisition, D.M. All authors have read and agreed to the published version of the manuscript.
Funding
This research was funded by the Federal Ministry of Health (Germany), grant number chapter 1501, title 544 01. The APC was funded by the German Environment Agency.
Acknowledgments
Silke Pabst (UBA) is gratefully acknowledged for her analytical assistance. We also thank Prof. Martin Jekel (TU Berlin), Lukas Massa (TU Berlin) and Dr. Aki Sebastian Ruhl (UBA) for helpful discussions.
Conflicts of Interest
The authors declare no conflict of interest. The funders had no role in the design of the study; in the collection, analyses, or interpretation of data; in the writing of the manuscript, or in the decision to publish the results.
References
- Barnhart, J. Occurrences, uses, and properties of chromium. Regul. Toxicol. Pharmacol. 1997, 26, S3–S7. [Google Scholar] [CrossRef] [PubMed]
- Johnson, J.; Schewel, L.; Graedel, T.E. The contemporary anthropogenic chromium cycle. Environ. Sci. Technol. 2006, 40, 7060–7069. [Google Scholar] [CrossRef] [PubMed]
- Coetzee, J.J.; Bansal, N.; Chirwa, E.M.N. Chromium in environment, its toxic effect from chromite-mining and ferrochrome industries, and its possible bioremediation. Expo. Health 2018, 12, 51–62. [Google Scholar] [CrossRef] [Green Version]
- Costa, M.; Klein, C.B. Toxicity and carcinogenicity of chromium compounds in humans. Crit. Rev. Toxicol. 2006, 36, 155–163. [Google Scholar] [CrossRef] [PubMed]
- Bartlett, R.J.. Chromium cycling in soils and water: links, gaps, and methods. Environ. Health Perspect. 1991, 92, 17–24. [Google Scholar] [CrossRef] [PubMed]
- Loyaux-Lawniczak, S.; Lecomte, P.; Ehrhardt, J.-J. Behavior of hexavalent chromium in a polluted groundwater: redox processes and immobilization in soils. Environ. Sci. Technol. 2001, 35, 1350–1357. [Google Scholar] [CrossRef] [PubMed]
- Sharma, S.K.; Petrusevski, B.; Amy, G. Chromium removal from water: A review. J. Water Supply Res. Technol.-Aqua 2008, 57, 541–553. [Google Scholar] [CrossRef]
- Anderson, R.A. Chromium as an essential nutrient for humans. Regul. Toxicol. Pharmacol. 1997, 26, S35–S41. [Google Scholar] [CrossRef] [PubMed] [Green Version]
- Costa, M. Toxicity and carcinogenicity of Cr(VI) in animal models and humans. Crit. Rev. Toxicol. 1997, 27, 431–442. [Google Scholar] [CrossRef] [PubMed]
- Roller, M. Potentielle Schädlichkeit von Chrom im Trinkwasser—Bericht zum Sondervorhaben des Umweltbundesamtes. FKZ 363 01 399, 2012. [Google Scholar]
- Council of the European Union. Council Directive 98/83/EC of 3 November 1998 on the Quality of Water Intended for Human Consumption. Available online: https://eur-lex.europa.eu/legal-content/en/ALL/?uri=CELEX%3A31998L0083 (accessed on 24 March 2020).
- US EPA 40 CFR 141—National Primary Drinking Water Regulations. Available online: https://www.epa.gov/ground-water-and-drinking-water/national-primary-drinking-water-regulations (accessed on 28 February 2020).
- Federal Department of Home Affairs, Switzerland. Verordnung des EDI vom 16. Dezember 2016 über Trinkwasser sowie Wasser in öffentlich zugänglichen Bädern und Duschanlagen (TBDV). Available online: https://www.admin.ch/opc/de/classified-compilation/20143396/index.html (accessed on 24 March 2020).
- World Health Organization (WHO). Guidelines for Drinking-water Quality; 2017; ISBN 978-92-4-154995-0. Available online: https://www.who.int/water_sanitation_health/publications/drinking-water-quality-guidelines-4-including-1st-addendum/en/ (accessed on 24 March 2020).
- Rivero-Huguet, M.; Marshall, W.D. Influence of various organic molecules on the reduction of hexavalent chromium mediated by zero-valent iron. Chemosphere 2009, 76, 1240–1248. [Google Scholar] [CrossRef] [PubMed]
- Melitas, N.; Chuffe-Moscoso, O.; Farrell, J. Kinetics of soluble chromium removal from contaminated water by zerovalent iron media: corrosion inhibition and passive oxide effects. Environ. Sci. Technol. 2001, 35, 3948–3953. [Google Scholar] [CrossRef] [PubMed]
- Lee, G.; Hering, J.G. Removal of chromium(VI) from drinking water by redox-assisted coagulation with iron(II). J. Water Supply Res. Technol.-Aqua 2003, 52, 319–332. [Google Scholar] [CrossRef]
- Eary, L.E.; Rai, D. Chromate removal from aqueous wastes by reduction with ferrous ion. Environ. Sci. Technol. 1988, 22, 972–977. [Google Scholar] [CrossRef] [PubMed]
- Pettine, M.; D’Ottone, L.; Campanella, L.; Millero, F.J.; Passino, R. The reduction of chromium (VI) by iron (II) in aqueous solutions. Geochim. Cosmochim. Acta 1998, 62, 1509–1519. [Google Scholar] [CrossRef]
- Schlautman, M.A.; Han, I. Effects of pH and dissolved oxygen on the reduction of hexavalent chromium by dissolved ferrous iron in poorly buffered aqueous systems. Water Res. 2001, 35, 1534–1546. [Google Scholar] [CrossRef]
- Fendorf, S.E.; Li, G. Kinetics of chromate reduction by ferrous iron. Environ. Sci. Technol. 1996, 30, 1614–1617. [Google Scholar] [CrossRef]
- Buerge, I.J.; Hug, S.J. Kinetics and pH dependence of chromium(VI) reduction by iron(II). Environ. Sci. Technol. 1997, 31, 1426–1432. [Google Scholar] [CrossRef]
- Christmann, E.P.; Badgett, J.L. Interpreting Assessment Data: Statistical Techniques You Can Use; NSTA Press: Arlington, VA, USA, 2009; ISBN 978-1-933531-36-6. [Google Scholar]
- Federal Ministry of Health (Germany). German Ordinance on the Quality of Water intended for Human Consumption. Available online: https://www.google.com/url?sa=t&rct=j&q=&esrc=s&source=web&cd=3&cad=rja&uact=8&ved=2ahUKEwj1gpqh77PoAhUCzKQKHSJmDaIQFjACegQIBRAB&url=https%3A%2F%2Fwww.bundesgesundheitsministerium.de%2Ffileadmin%2FDateien%2F3_Downloads%2FE%2FEnglische_Dateien%2FDrinking_Water_Ordinance.pdf&usg=AOvVaw0-5xASQNS_p00R09JELUNd (accessed on 24 March 2020).
- Tamura, H.; Goto, K.; Nagayama, M. Effect of anions on the oxygenation of ferrous ion in neutral solutions. J. Inorg. Nucl. Chem. 1976, 38, 113–117. [Google Scholar] [CrossRef]
- Lide, D.R. CRC Handbook of Chemistry and Physics, 87th ed.; Taylor & Francis: Boca Raton, FL, USA, 2006; ISBN 978-0-8493-0487-3. [Google Scholar]
- Kalka, H. Solubility product constants Ksp at 25 °C. Available online: https://www.aqion.de/site/16 (accessed on 18 March 2020).
Figure 1.
Recovery of 50 µg L–1 Cr (VI) in dependence of the buffer concentration of hydrogen phosphate (HPO42–), hydrogen carbonate (HCO3–), and ammonium buffer (NH4+), in the presence of different Fe (II) concentrations and with different initial pH values.
Figure 1.
Recovery of 50 µg L–1 Cr (VI) in dependence of the buffer concentration of hydrogen phosphate (HPO42–), hydrogen carbonate (HCO3–), and ammonium buffer (NH4+), in the presence of different Fe (II) concentrations and with different initial pH values.

Figure 2.
Final pH values in dependence of the buffer concentration of hydrogen phosphate (HPO42–), hydrogen carbonate (HCO3–), and ammonium buffer (NH4+), with different initial pH values in the presence of 50 µg L–1 Cr (VI) and different Fe (II) concentrations.
Figure 2.
Final pH values in dependence of the buffer concentration of hydrogen phosphate (HPO42–), hydrogen carbonate (HCO3–), and ammonium buffer (NH4+), with different initial pH values in the presence of 50 µg L–1 Cr (VI) and different Fe (II) concentrations.

Figure 3.
Recovery of 5 and 50 µg L–1 Cr (VI) over time using 20 mM hydrogen phosphate (HPO42–), 20 mM hydrogen carbonate (HCO3–), and no buffer in the presence of different Fe (II) concentrations at initial pH values of 12.7 (HPO42–), 12.3 (HCO3–), and 12.9 (without buffer). Some symbols overlap due to similar values for 5 and 50 µg L–1 Cr (VI). Shown are mean values with SD as error bars (n = 3).

Figure 4.
Recovery of 50 µg L–1 Cr (VI) in dependence of the Fe (II) concentration in the presence of citrate and EDTA (10-fold and 100-fold concentration of Fe (II)).
Figure 4.
Recovery of 50 µg L–1 Cr (VI) in dependence of the Fe (II) concentration in the presence of citrate and EDTA (10-fold and 100-fold concentration of Fe (II)).


Table 1.
XRD analysis of the precipitates of a Cr (VI) (50 µg L–1) and Fe (II) system.
| Buffer System | Fe (II) (mg L– 1) | Water | Identified Compounds |
|---|---|---|---|
| HPO42– | 100 | process | amorphous peak, iron hydroxide |
| HCO3– | 100 | pure | trona, nahcolite |
| 50 | pure | trona, nahcolite | |
| 100 | process | calcite, nahcolite | |
| 6 | process | calcite, trona, nahcolite, quartz |
© 2020 by the authors. Licensee MDPI, Basel, Switzerland. This article is an open access article distributed under the terms and conditions of the Creative Commons Attribution (CC BY) license (http://creativecommons.org/licenses/by/4.0/).
Share and Cite
MDPI and ACS Style
Mahringer, D.; Polenz, C.; El-Athman, F. Stabilization of Chromium (VI) in the Presence of Iron (II): Method Development and Validation. Water 2020, 12, 924. https://doi.org/10.3390/w12040924
AMA Style
Mahringer D, Polenz C, El-Athman F. Stabilization of Chromium (VI) in the Presence of Iron (II): Method Development and Validation. Water. 2020; 12(4):924. https://doi.org/10.3390/w12040924
Chicago/Turabian StyleMahringer, Daniel, Chantal Polenz, and Fatima El-Athman. 2020. "Stabilization of Chromium (VI) in the Presence of Iron (II): Method Development and Validation" Water 12, no. 4: 924. https://doi.org/10.3390/w12040924
Note that from the first issue of 2016, this journal uses article numbers instead of page numbers. See further details here.