Article

What Is the Minimum Volume of Sample to Find Small Microplastics: Laboratory Experiments and Sampling of Aveiro Lagoon and Vouga River, Portugal

Centre for Environmental and Marine Studies (CESAM) & Department of Chemistry, University of Aveiro, 3810-193 Aveiro, Portugal
*
Author to whom correspondence should be addressed.
Water 2020, 12(4), 1219; https://doi.org/10.3390/w12041219
Submission received: 26 March 2020 / Revised: 16 April 2020 / Accepted: 20 April 2020 / Published: 24 April 2020
(This article belongs to the Special Issue Microplastics in Aquatic Environments and Wastewater Treatment )

Abstract

:
Small microplastics (<1 mm) comprise a great fraction of microplastics (<5 mm) found in the environment and are often overlooked due to the constrains of transporting and filtering large volumes of water in grab samplings. The objective of this work was to determine the minimum volume for reliable quantification of small microplastics in the environment. Different volumes (0.1, 0.25, 0.5, 1, 2.5 L) of laboratory spikes (fresh and saltwater) and environmental samples were filtered. Sampling volumes of 0.5 L or 1 L are a good compromise between drawbacks, such as effort, time, organic and mineral matter, potential contamination, and reliability of results, evaluated by interquartile range, accuracy, coefficient of variation, and recovery rates. Moreover, the observation of Nile Red-stained environmental samples under 470 nm produced six-times higher concentrations than samples under 254 nm, namely, 18 microplastics L−1 and 3 microplastics L−1 for the Aveiro Lagoon and 1 microplastics L−1 and 0 microplastics L−1 for the Vouga River, Portugal. This work also raises concerns about the underreporting of environmental concentrations of microplastics.

1. Introduction

Microplastics are defined as plastics <5 mm originating from fragmentation processes (secondary microplastics) or intended production under microscopic sizes (primary microplastics) [1]. Microplastics have been found in all environmental matrices, from freshwater [2], saltwater [3], and sediment [4] to soil [5] and air [6]. Concerns about microplastics include ecotoxicological effects and human ingestion of contaminated organisms [7], the release of hazardous leachates or adsorbed chemicals [8], formation of biofilms and effects on gut microbiota [9], and changes in habitat properties [10]. The worldwide distribution and irreversible contamination classify microplastics as a potential threat to planetary boundaries [11].
The invisible plastic debris <1 mm, known as small microplastics, are often overlooked and not sampled, which is also due to the extensive use of manta trawls of 300-µm mesh size [12,13]. Even though the use of small volumes of water to detect microplastics is often believed to produce unreliable results [14], the higher sensitivity of laboratory filtrations may prove otherwise. For instance, Barrows et al. [15] obtained concentrations of microplastics three orders of magnitude higher when collecting 1 L of water in glass jars than using neuston nets (5.9 vs. 0.005 microplastics L−1) due to differences in pore size (0.45 µm vs. 335 µm) under similar sample processing and identification in the stereomicroscope. Dris et al. [16] obtained values 30-times lower when using a manta trawl (330 µm) compared to the ones obtained with a plankton net (80 µm), sampling the same depth and under similar processing and identification in the stereomicroscope.
When comparing directly the filtration of different volumes through the same mesh size (100 µm), Vermaire et al. [17] observed that estimations of microplastic concentrations based on the manta trawl were lower than on shore sampling due to differences in river area (middle vs. edge) and methodology, even though manta trawl sampled larger volumes of water (100 L vs. 100,000 L). The higher number of microplastics found when using smaller mesh sizes is also a result of higher abundance of smaller sizes. For instance, particles <0.3 mm comprise 92% of microplastics found in the South China Sea [18]. Thus, the volume of water sampled may be reduced when working with small microplastics due to their higher abundance. Moreover, fluorescence under certain wavelengths resulting from Nile Red staining may facilitate the identification of smaller microplastics in environmental samples [19].
Currently, results from different works on microplastics cannot be compared due to differences in methodology and the lack of standardized sampling protocols, including differences in mesh size. The volume of water sampled is often not reported or, when reported, highly variable (e.g., 10–2000 L), influencing the estimation of environmental concentrations [20]. The minimum volume of sampled water to obtain reliable results in grab samplings must be determined in order to contribute to the uniformization of methods and creation of a standard protocol. Thus, the objective of this work was to identify the minimum volume of water required to correctly quantify small microplastics, also taking in consideration feasibility in transport, filtration time, and abundance of organic and mineral matter. Moreover, environmental concentrations were also determined and the use of different excitation wavelengths for Nile Red-stained microplastics were assessed.

2. Materials and Methods

2.1. Testing Sampling Volume in the Laboratory

In the first laboratory test, different volumes of spiked samples were filtered in order to understand the estimated concentration. Concentrations used should consider current environmental concentrations of microplastics. These may vary based on locations, as well as sampling methods (e.g., pore size) [20]. Indeed, microplastics <300 µm, often lost when using nets, comprise the highest number of particles [18]. Concentrations of microplastics can be as high as 9.2 microplastics L−1 in the Pacific Coast of Canada [21], 102 microplastics L−1 in a Swedish harbor [22] or 118 microplastics L−1 in returnable plastic bottles [23]. In the Three Gorges Reservoir in China, surface water concentrations vary between 1.5–12.6 microplastics L−1 [24]. Concentrations tested should be based on low concentrations, which are prone to larger estimation errors and can be reliably reproduced in laboratory by counting microplastics to spike water with known concentrations. Thus, we decided to use 2 microplastics L−1 and concentrations five- and ten-times higher (10 microplastics L−1 and 20 microplastics L−1 respectively).
Glass bottles containing ultrapure water or saltwater, produced by dissolving NaCl (Labkem, Spain) in ultrapure water to achieve a concentration of 30 g L−1 (filtered through a 0.45 µm GN-6 grid filter, Gelman Sciences, Ann Arbor, MI, USA), were spiked with polyethylene (PE) in sizes 1–2 mm, obtained by grounding and sieving pellets (Sigma-Aldrich, St. Louis, MO, USA). Samples of 0.1 L, 0.25 L, 0.5 L, 1 L, and 2.5 L in four replicates were retrieved from glass bottles after vigorous shaking (to guarantee even distribution of particles) and filtered through a 0.9-mm mesh. Then, the retrieved microplastics were counted. Samples obtained never exceeded half of the volume prepared in the glass bottle. To allow shaking, the largest glass bottle used was 1 L, meaning that largest sampled volumes (1 L and 2.5 L) were obtained by repeatedly extracting 0.5 L from 1-L glass bottles until reaching the intended volume.

2.2. Sampling the Aveiro Lagoon and Vouga River

In the second test, environmental samples were collected and filtered in different volumes to evaluate if the behavior was similar to the one observed in previous laboratory tests. These samples likely consisted of a mixture of polymers of different characteristics, providing more realistic estimations. Environmental samples were collected in 5-L glass bottles capped with aluminum foil, previously washed with NaOH (0.1 M), HNO3 (4 M), distilled water, ultrapure water, and water from the collection site. Seawater samples were collected in Costa Nova, Aveiro, Portugal (40.619441, −8.748160) during the rainy season (13 February 2019). Freshwater samples were collected in the Vouga River, Aveiro, Portugal (40.694891, −8.601964), during the dry season (21 May 2019). Samples were analyzed as soon as possible with a multiparametric probe (HI98194 Multiparameter, HANNA Instruments) in the laboratory (Table S1, S.I.).
Samples were divided in subsamples of 0.1 L, 0.25 L, 0.5 L, 1 L, 2.5 L, and 5 L in four replicates, which were filtered through 1.2-µm glass fiber filters (Prat DUMAS, Couze-et-Saint-Front, France). These samples were treated with 10 mL of 30% hydrogen peroxide (H2O2, Labkem, Barcelona, Spain) with 10 mL of 0.05 M iron catalyst (Fe(II), LabKem, Barcelona, Spain) [25,26] for 15 min over the counter (Figure S1, S.I.), thoroughly washed with distilled water, stained with 0.01 mg mL−1 of Nile Red prepared in ethanol (Sigma Aldrich, St. Louis, MO, USA) for 5 min [27,28], and washed again with distilled water. After drying over the counter stored in glass Petri dishes, filters were counted under 470 nm (FOCUS LED, SPEX Forensic, Piscataway, NJ, USA; Standard ProMaster® Orange Filter) and 254 nm (VL-6.LC Vilber, Eberhardzell, Germany) and then photographed using a camera (Canon 550D, EF-S 18-55 mm, Oita, Japan) and digital stereoscope (Leica DMS300, Wetzlar, Germany). The observation under 254 nm considered total yellow to red particles, in which yellow particles may be confounded with fluorescent white fibers, and only red particles, which are higher in certainty. The staining efficacy of Nile Red under these conditions in various virgin and weathered polymers has previously been tested [27]. Cross-contamination was avoided by wearing cotton lab coats, previously washing all material with distilled water, avoiding plastic materials, capping containers with aluminum foil, and photographing environmental samples in a laminar flow hood in a clean room. Data was processed in Excel 2019, which was used in the calculation of medians, average, interquartile range (IQR), accuracy, coefficient of variation (CV), and recovery rate (Figure S2, S.I.). Concentrations (microplastics L−1, MP L−1) and number of particles were expressed in boxplots.

3. Results and Discussion

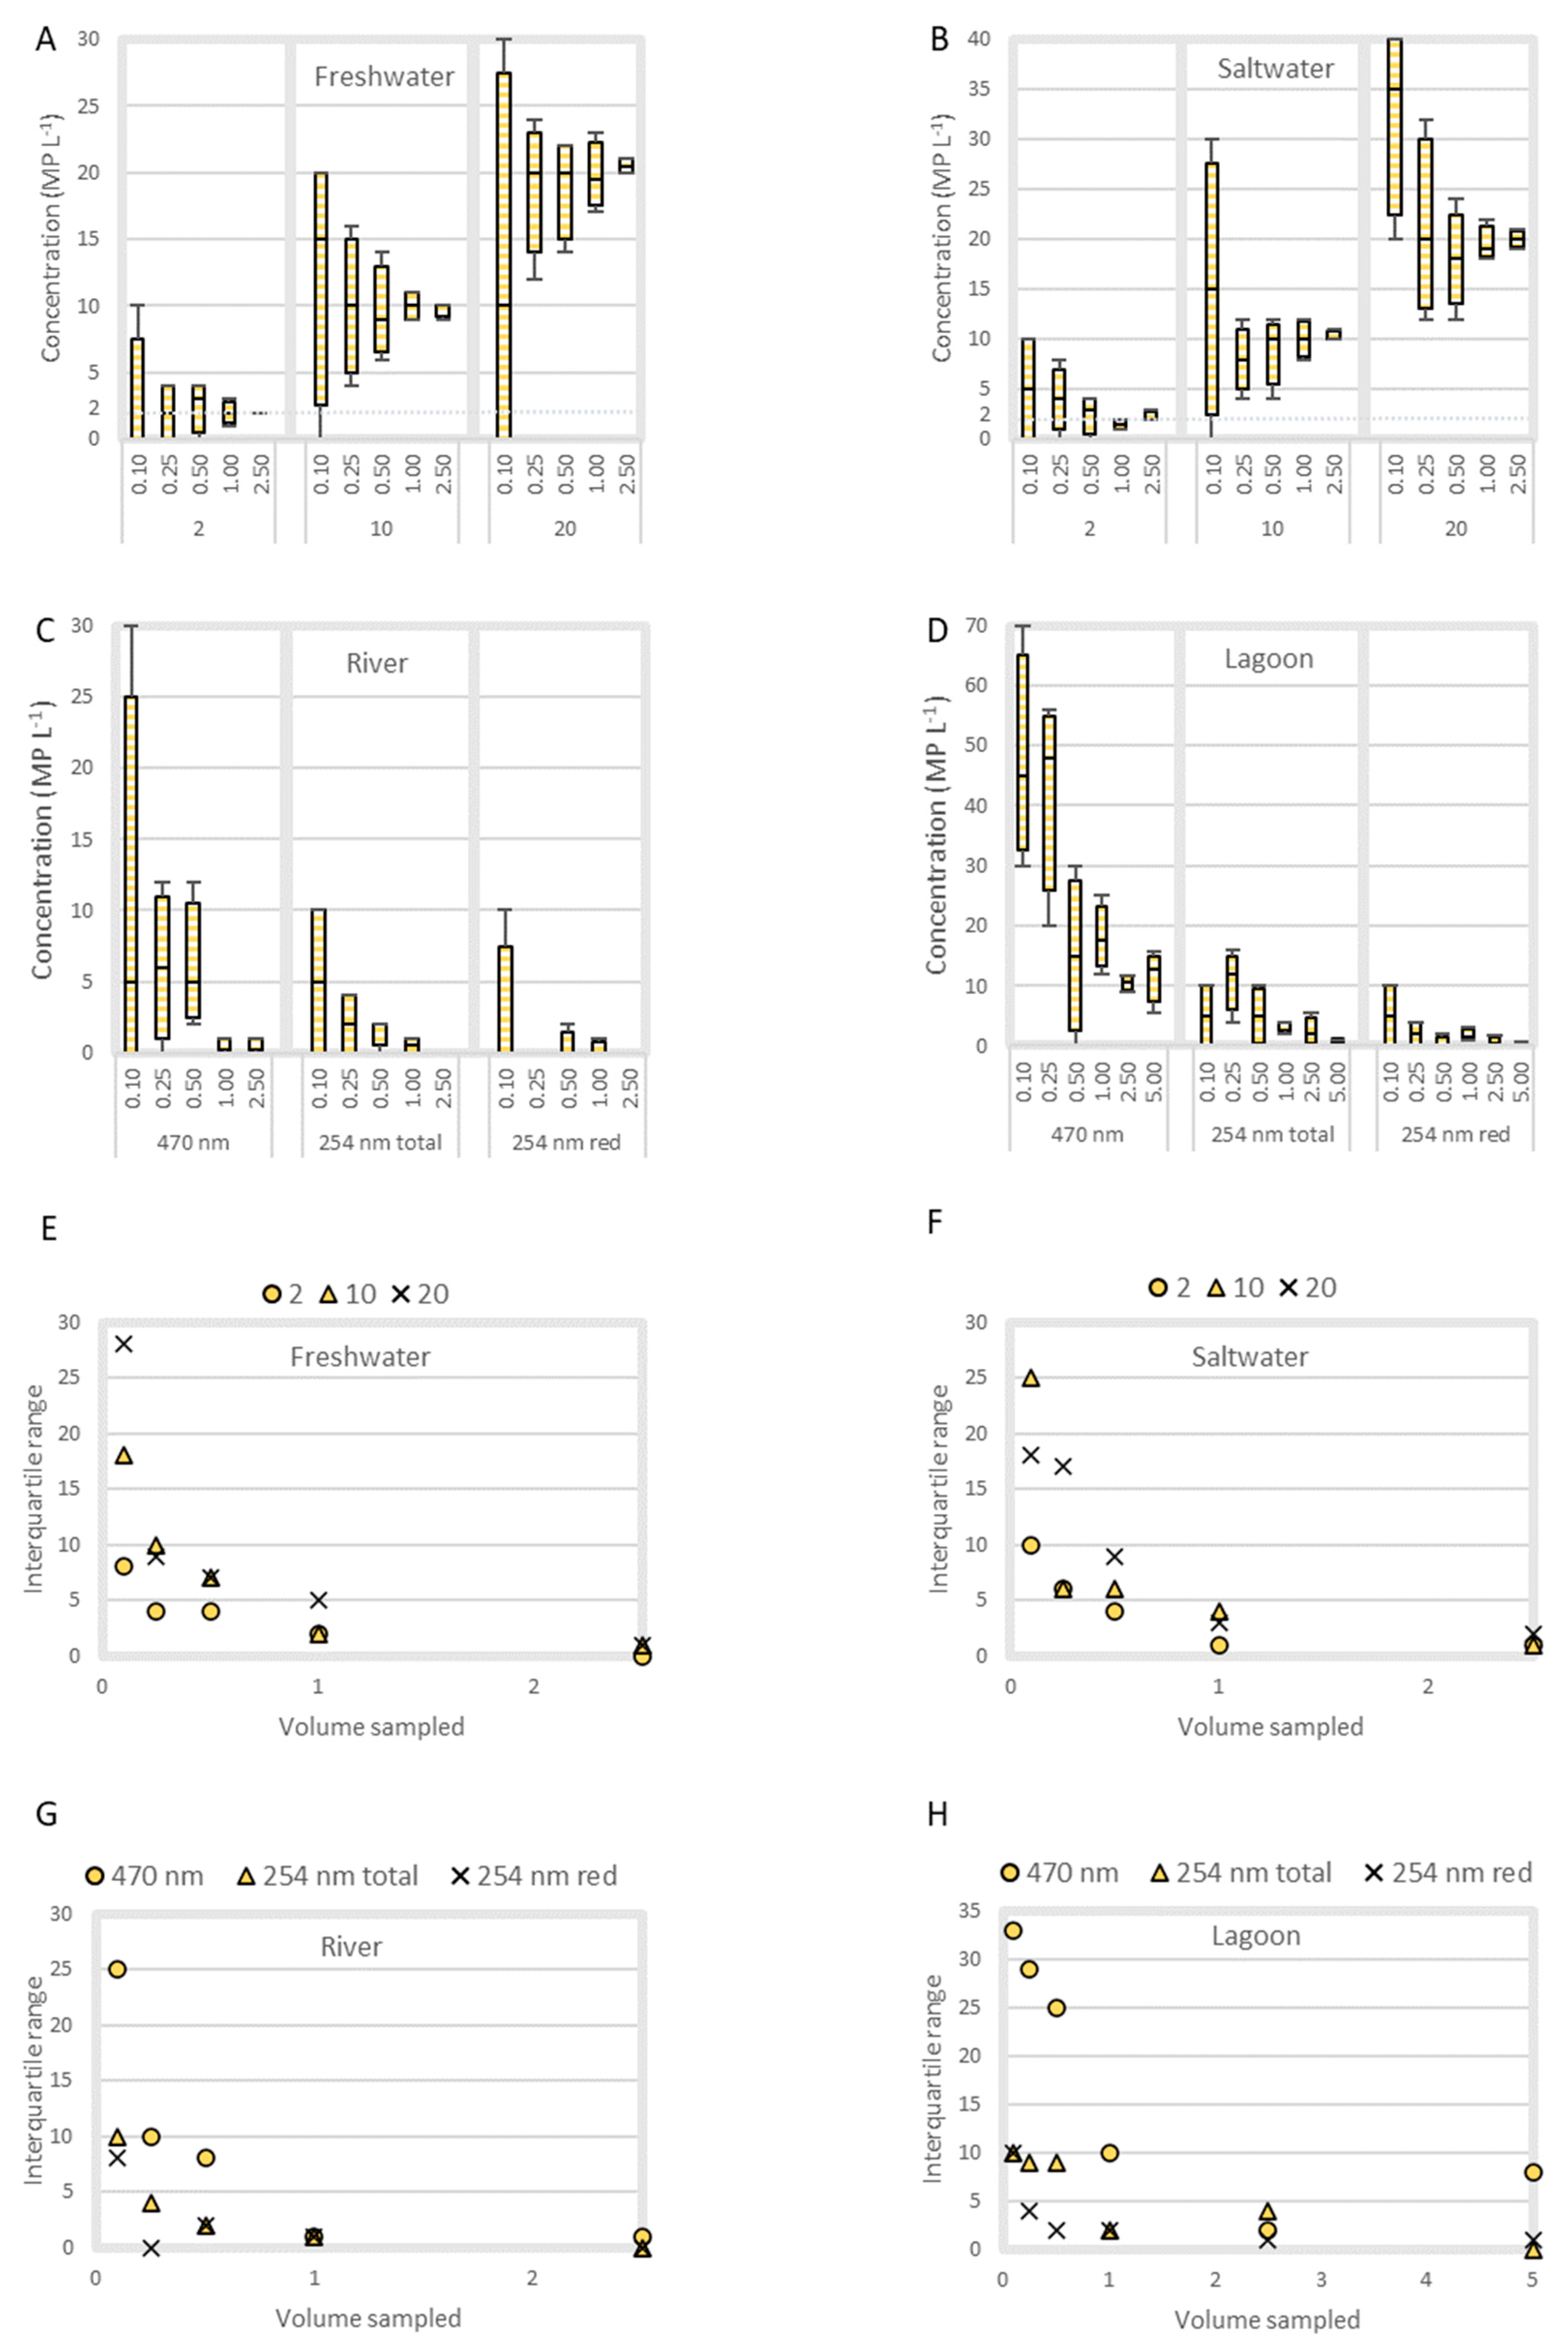
3.1. Interquartile Range, Accuracy, Coefficent of Variation, and Recovery Rate

Laboratory spikes and environmental samples both showed a decrease in IQR with the increase in volume filtered, as expected (Figure 1A–H). In laboratory spikes, the higher density of saltwater produced more variable results due to the marked floatation of the low density microplastics used (PE 0.918 g mL−1). Moreover, it was observed that higher concentrations of microplastics led to the aggregation even after careful mixing, whereas smaller concentrations led to more imprecise measurements (Tables S2–S4, S.I.).
When looking at accuracy, most treatments ≥1 L presented values <5% with the exception of 2-MP L−1 spikes in saltwater due to the increased floatation and error of small concentrations, as previously mentioned. In the case of filtering ≥0.5 L, the accuracy values were generally <10% with the exception of the concentration 2 microplastics L−1, where 50% was observed for both fresh and saltwater. The coefficient of variation decreased with increasing volume filtered, as expected. Generally, ≥1 L presented CV <20%, except for the concentration of 2 microplastics L−1. Recovery rates were within 10% variation for volumes ≥0.5 L, except for the concentration of 2 microplastics L−1 in saltwater. Regarding IQR, these tended to decrease with increasing volume filtered, as expected. For both laboratory spikes and environmental samples, IQR values tended to stabilize when filtering volumes ≥1 L (Figure 1E–H).
Results from environmental samples agree with the laboratory spike results, with a decrease in IQR with increasing volumes filtered (Figure 1C,D). However, no real value could be estimated for these environmental samples due to the lack of a golden standard. It is worth noting that changes in sampled volumes could lead to differences in estimated concentrations due to changes in average and median values. Higher concentrations were observed, especially when filtering low volumes in lagoon water, possibly due to the floatation of low-density plastic particles in higher-density brackish water, as observed in laboratory spikes using saltwater.

3.2. Feasibility of Sampling Volumes for Grab Samples

Besides variations in medians and accuracy, the sampling effort and feasibility must be considered. Larger sampling volumes will provide more precise estimations of real values for that zone, but this comes at a cost of increased time and effort that will result in a lower number of potential sampled zones in the area. As microplastics are heterogeneously distributed in the environment, sampling a higher number of zones is necessary to correctly determine the environmental concentration in an area.
In pump sampling, the volume of 1 m3 [29] and 8 m3 [30] of water has been considered adequate. The problems of pump sampling include: (a) Potential contamination from plastics in pumps and pipes; (b) feasibility in transporting and powering the equipment; and (c) the use of larger pore sizes (>60 µm), which is easier to filter as larger pore sizes retain less organic debris and leave out an abundant faction of smaller microplastics that may compensate for reduced volumes. This effect was clearly illustrated by Covernton et al. [31], who found 8.5-times higher concentrations of microplastics when filtering 1-L grab samples through 8-µm filters than when using buckets to pass 10 L over 63-µm meshes. Similarly, Green et al. [32] reported that grab sampling of 1 L of seawater produced concentrations three to four orders of magnitude higher than using nets (i.e., bongo, manta, plankton nets). Whereas the use of Nile Red can allow the detection of microplastics >2 µm when coupled with microscopy [28], the current study was able to detect environmental concentrations >1 microplastics L−1 considering an approximate limit of 50 µm. Moreover, volumes used in pump sampling cannot be applied to grab sampling either due to difficulties in sample transport or the presence of higher amounts of residual organic matter that may greatly delay filtration.
As presented in the previous section, grab sample volumes >0.5 L or >1 L may produce adequate accuracy, IQR, coefficient of variation and recovery rates. Therefore, the choice of sampling volume may also take into account the feasibility of collecting and processing. In the sampling of the Aveiro lagoon and Vouga River, volumes ≤0.5 L were filtered in a 1.2-µm glass fiber filter in less than 15 min. For the Aveiro Lagoon, where less dissolved solids (PPT 21.7) were observed, filtration was relatively feasible, reaching 3 h for filtering 5 L. For the Vouga River, rich in dissolved solids (PPT 145.0), filtration of 1 L took 1–2 h, 2.5 L between 5–7 h, and 5 L was not attempted. Higher volumes are also more difficult to transport to the laboratory and the prolonged filtration time increases the possibility of contamination and of human error. Furthermore, samples resulting from higher volumes are lower in quality due to the abundance of organic and mineral matter, which may conceal microplastics. Whereas organic matter can be removed, mineral matter will still be present afterward. Thus, a compromise would be the filtration of 0.5 L or 1 L of water in grab sampling.

3.3. Microplastics in Aveiro Lagoon and Vouga River

Considering the overall concentrations obtained in every volume, the Aveiro Lagoon presented median concentrations of 18 MP L−1, 3 MP L−1, and 0 MP L−1 when evaluated by 470 nm, 254 nm total particles, and 254 nm red particles, respectively. The Vouga River presented overall median concentrations of 1 MP L−1, 0 MP L−1, and 0 MP L−1, respectively. The higher concentration observed in the Aveiro Lagoon could be justified by the presence of small harbors and touristic activities, whereas the sampled area of the Vouga River was in a secluded countryside with less potential sources of microplastics. These concentrations are higher than the greatest concentrations found in Portugal so far, such as 0.036 MP m−3 in seawater using neuston nets [3], 1,265 MP m−3 for the Antuã River using a 55-µm net [2], and 0.24 MP m−3 for the Douro River using 500-µm nets [33]. The results of the current study are more in line with results of other grab samplings of 1 L, such as 1–10 MP L−1 near shellfish farms in the coast of Canada [31] and 1–9 MP L−1 in the coast of the UK and its South Atlantic islands [32] (Table 1). Besides considerations on small sizes and volumes, the lack of proper identification methods may lead to underestimations. In the present study, Nile Red was used to identify microplastics that would likely be disregarded by visual identification (Figure 2). Moreover, these results raise concerns over the present underestimation of environmental concentrations of microplastics caused by methodological limitations.

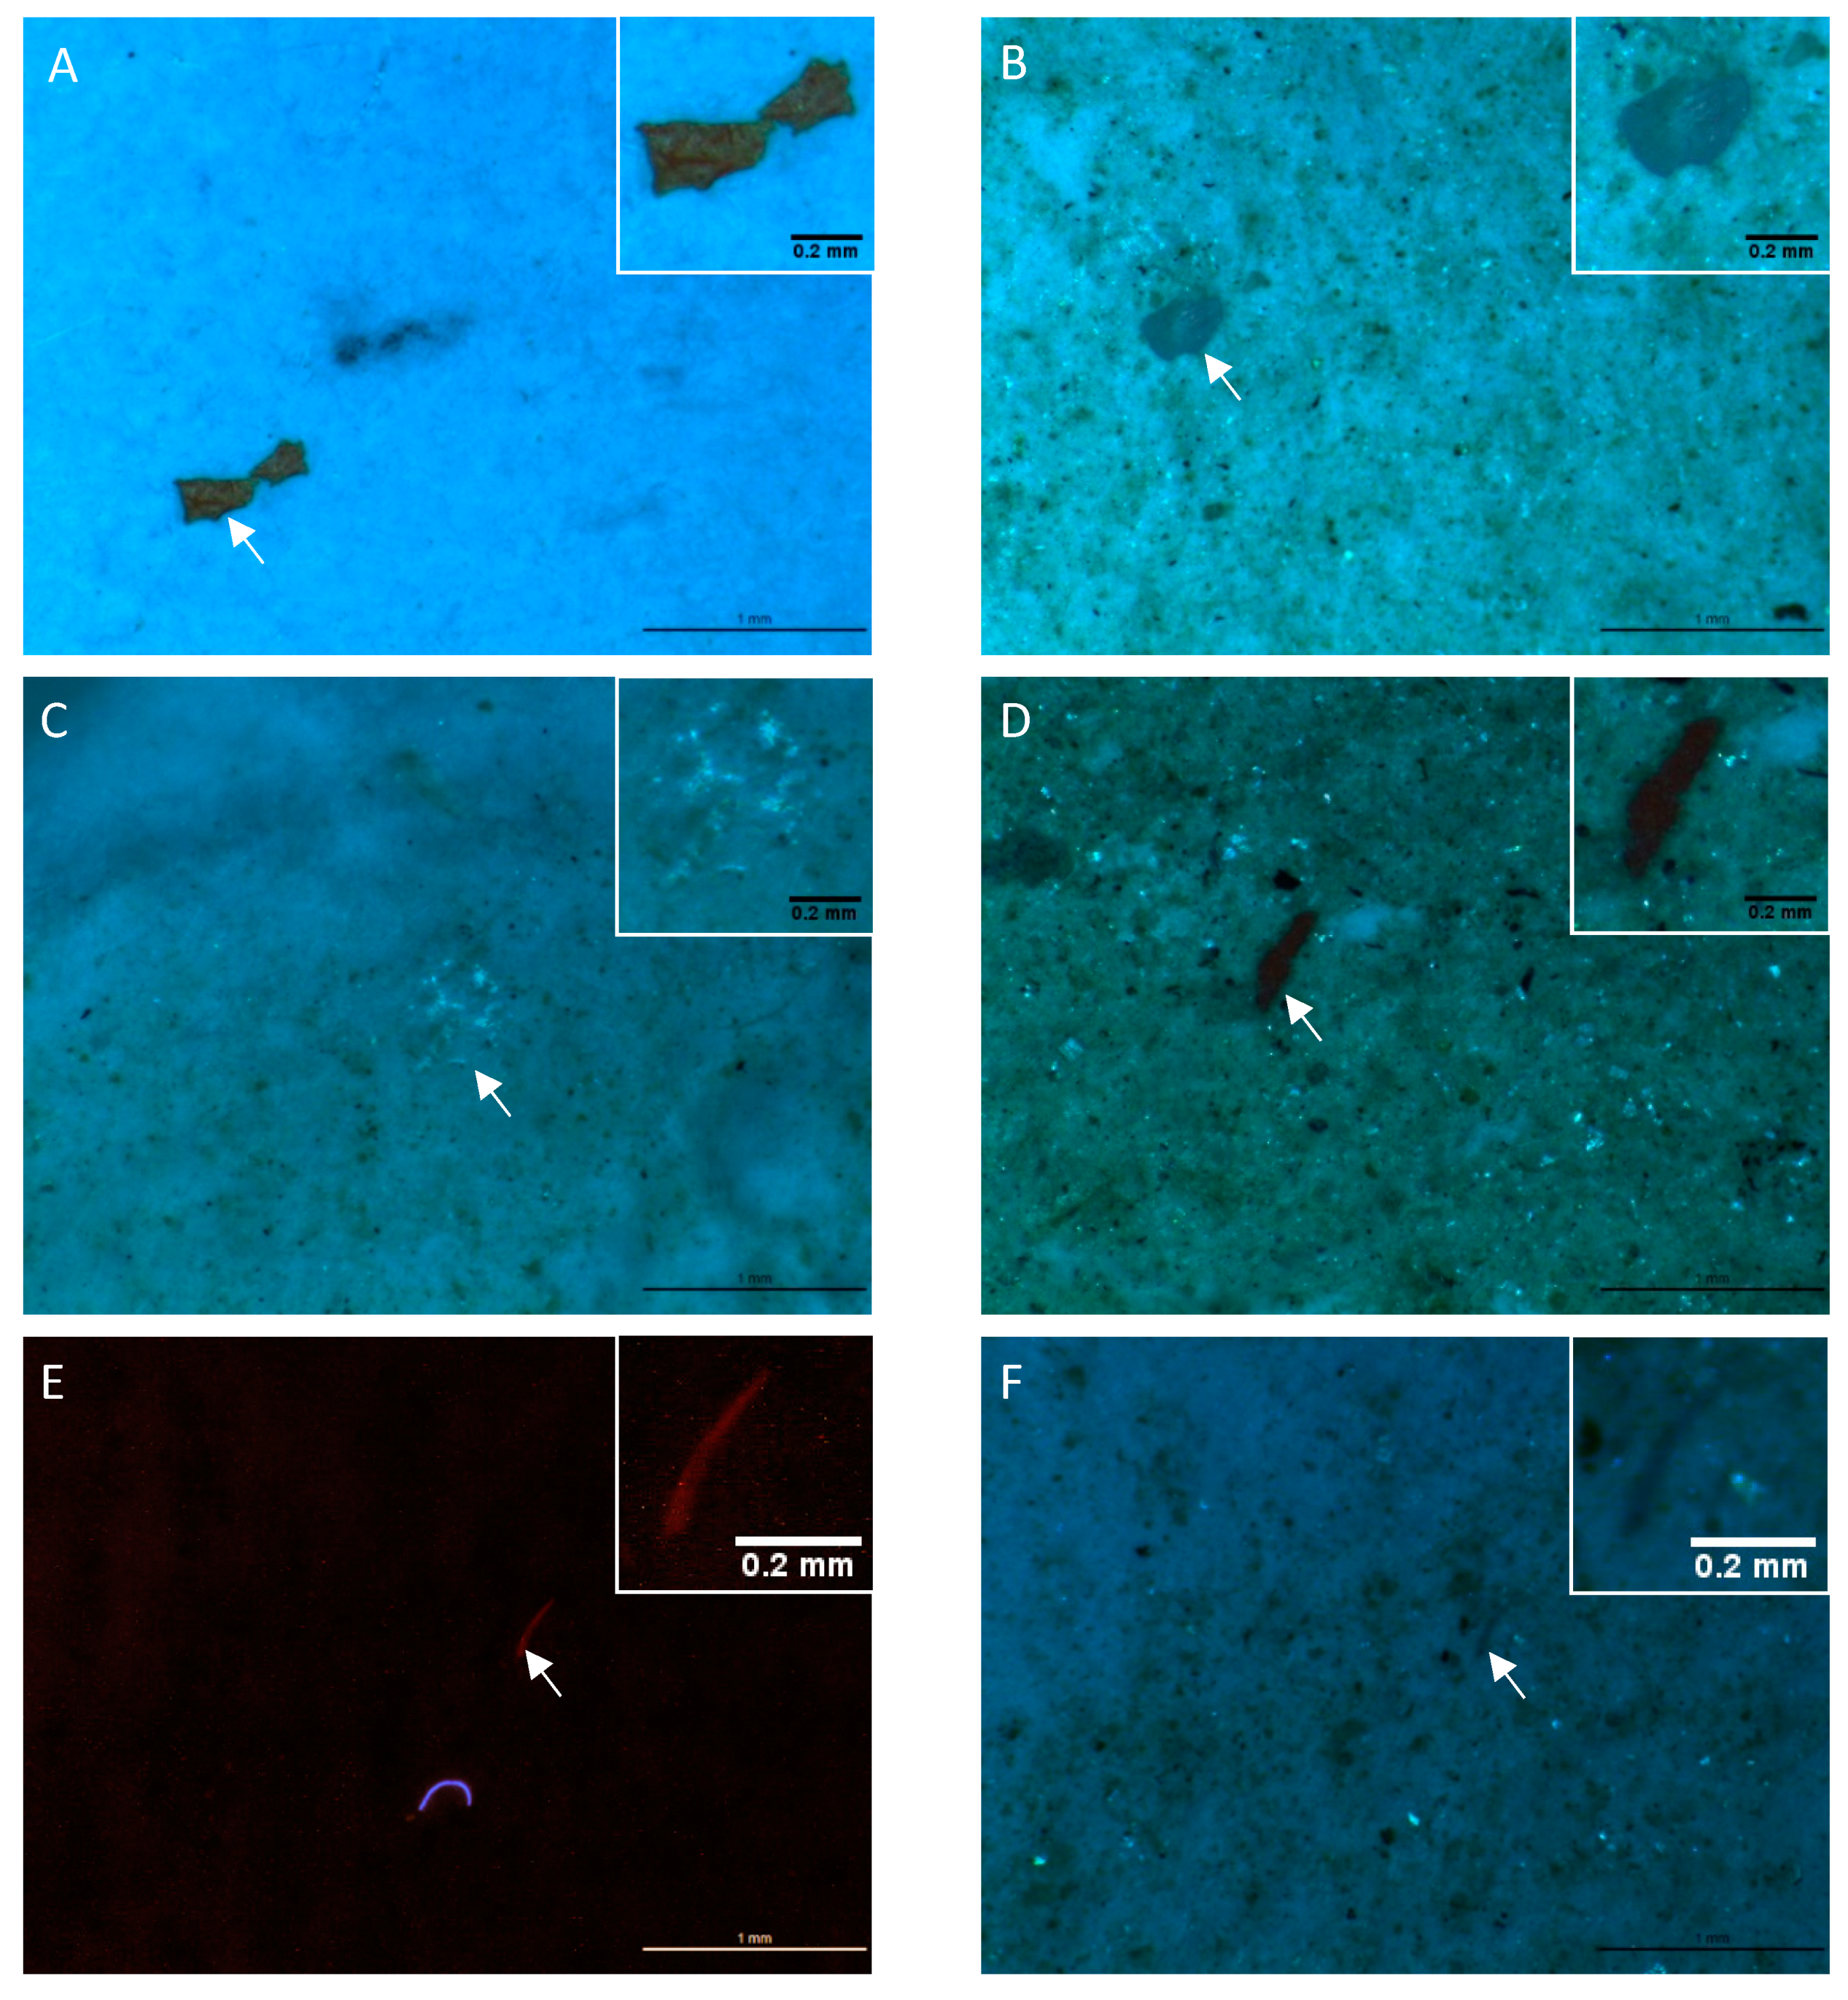
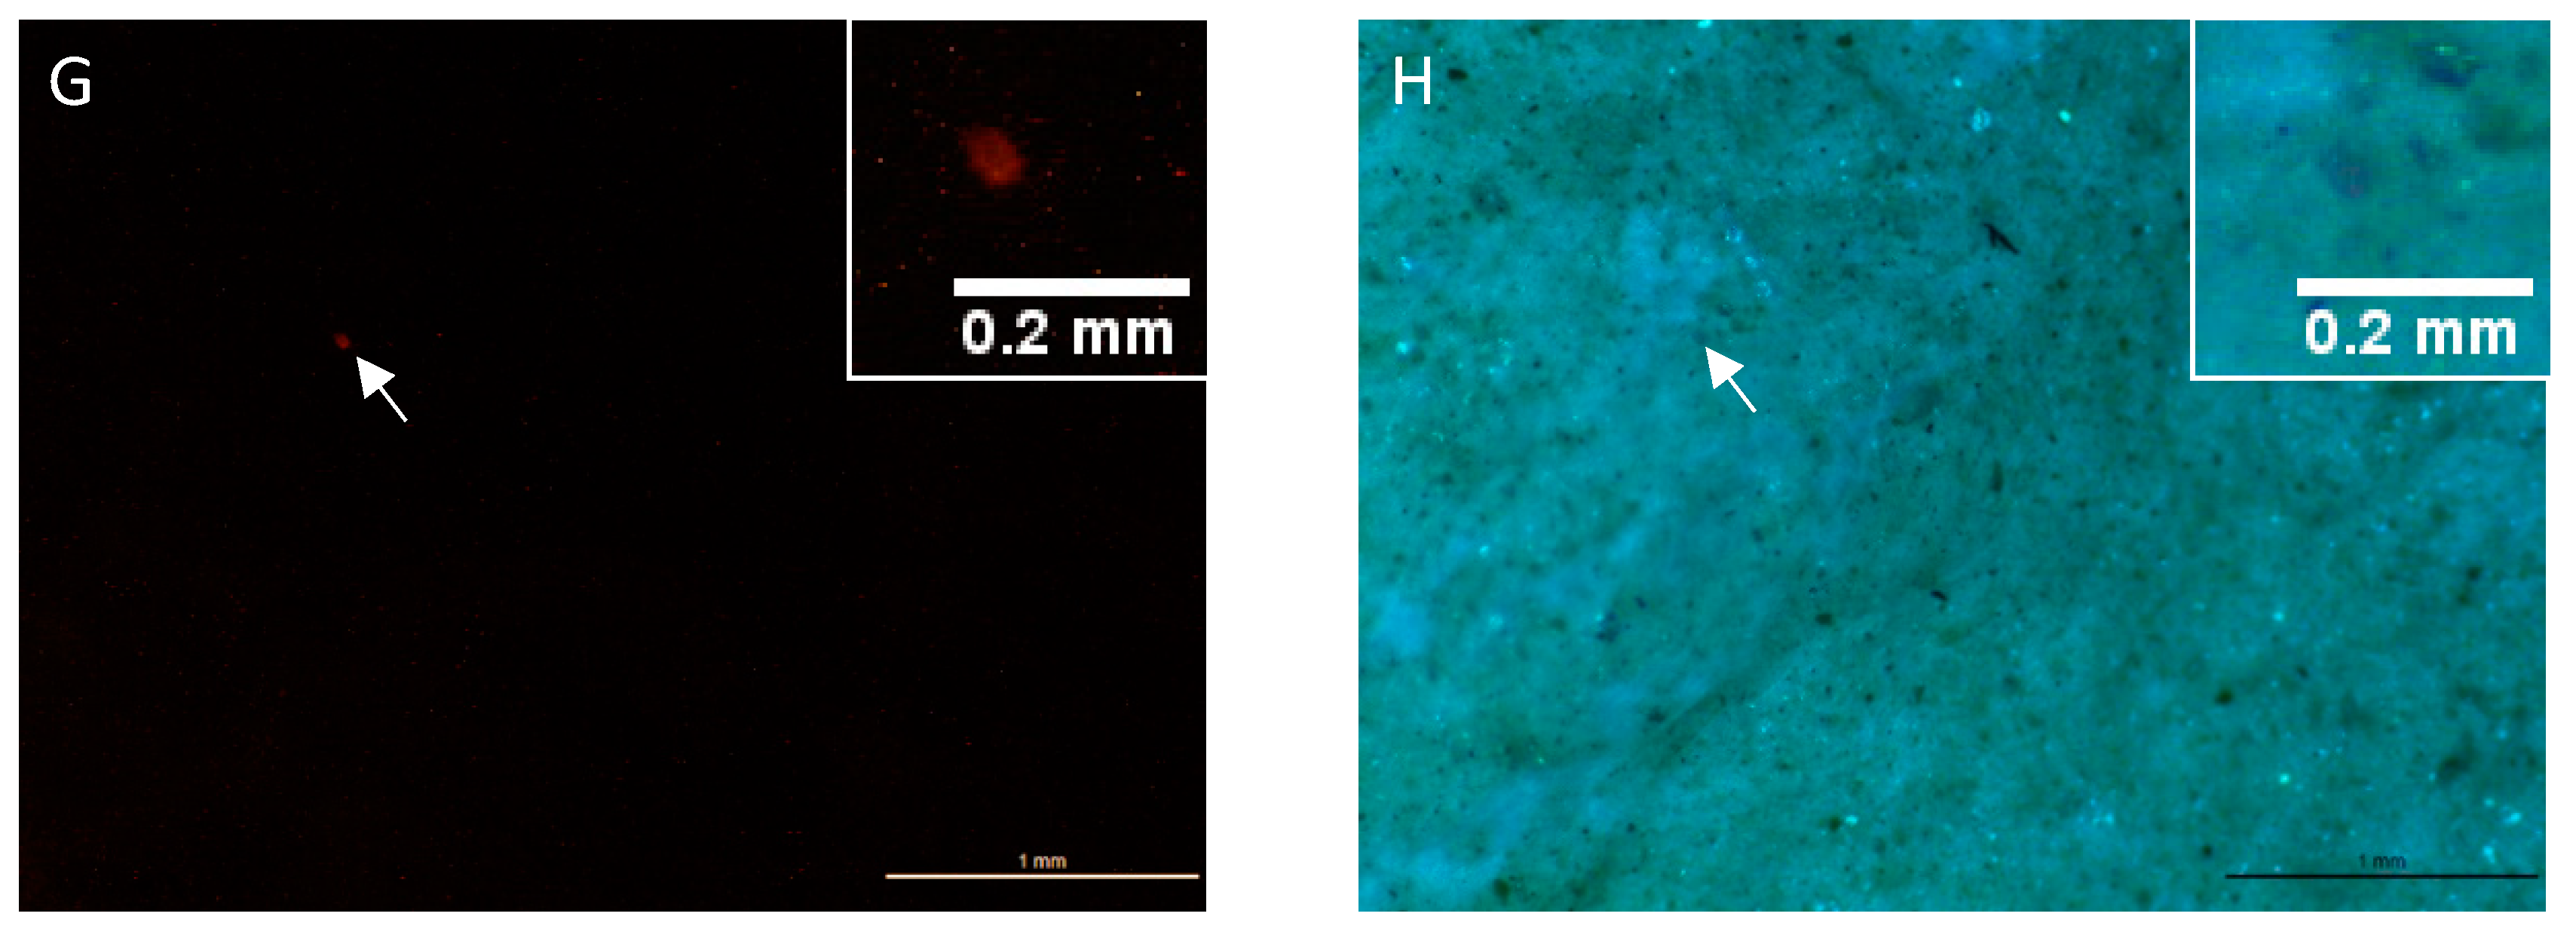
3.4. Comparing the Use of 254 nm and 470 nm in the Identification of Nile Red-Stained Microplastics

The use of different excitation wavelengths caused differences in fluorescence from Nile Red-stained particles in environmental samples of the Aveiro Lagoon and Vouga River. As expected, observation under 470 nm produced a higher number of fluorescent particles than under 254 nm. This is reflected in the concentrations inferred from counting fluorescent particles (Figure 1), where 254 nm produced concentration six-times lower than 470 nm for the Aveiro Lagoon. This value is even smaller when counting only red fluorescent particles under 254 nm, which are more easily distinguished from blue fluorescent fibers than yellow fluorescent particles. The 254 nm wavelength is more conservative and does not cause the fluorescence of organic matter but excludes some plastics from the analysis, such as weathered PE, whereas 470 nm is more inclusive, but may lead to overestimations due to the fluorescence of organic matter, requiring an organic matter removal step [27]. Nonetheless, the use of 254 nm may be advantageous when the removal of organic matter cannot be performed or is not efficient, since it does not cause yellow to red fluorescent from the most common organic materials found in environmental samples (e.g., algae, wood) [27]. In the present work, the removal of organic matter was successfully achieved using hydrogen peroxide with an iron catalyst, supported by Figure S1, S.I. and Prata et al. [27], allowing the use of the 470 nm excitation wavelength and proper quantification of microplastics.
Observation under 254 nm also emphasized fiber contamination, possibly originating from the white cotton lab coat [27]. Conversely, these fibers could have originated from the environmental sample, but the identification of fibers was out of the scope of this work and would require stricter contamination control measures. Under 254 nm, Nile Red-stained plastics emitted fluorescent in yellow to red wavelengths, while white fiber contamination presented white-bluish fluorescence (Figure 2E). The fluorescence from fibers under UV light likely resulted from the use of brightening agents in textiles [34]. Due to the presence of these contaminating fibers and the difficulty in distinguishing white-blue from strong yellow fluorescence, two results were registered from 254 nm: The total number of yellow to red fluorescence particles (with some uncertainty) and the number of red particles (with certainty). The variation in emission wavelengths resulting in colors from yellow to red is dependent on the polarity of the surface of microplastics due to the solvatochromic nature of Nile Red [35]. Indeed, this characteristic has been proposed as a way to characterize polymers into polar and hydrophobic [35]. However, this is not recommended because fluorescence may be dependent on excitation wavelengths, and weathering and biofouling may change emission colors.
These results indicate that the use of 470 nm excitation wavelength is preferred for reliable quantification of microplastics when preceded by proper organic matter removal before staining. The selective removal of staining dye from organic matter cannot be achieved without also losing fluorescence from plastics [28], thus highlighting the need for full organic matter removal. Nonetheless, 254 nm still provides an alternative when dealing with organic matter resistant to removal procedures. Nile Red provides an easy and reliable method of quantification of microplastics. In previous tests, all polymer types presented fluorescence after Nile Red staining under 470 nm [27], and Nile Red fluorescent particles have been confirmed as of synthetic origin by spectroscopy [19,29]. Nile Red offers a quick and easy method to identify microplastics without access to expensive materials and equipment, allowing proper quantification without bias, which should still be coupled with spectroscopic methods to characterize polymer type. Furthermore, Nile Red reduces bias by providing an objective measure for identification, reducing the erroneous quantification of nonplastics (false positives) and, most importantly, allowing the quantification of plastics that otherwise would be neglected (false negatives). This is especially important when considering small microplastics (<1 mm), where visual identification is challenging, which can increase bias. Finally, the combination of a standard sampling volume in grab samplings (0.5 L to 1 L) with an objective identification method, such as Nile Red, allows the production of unbiased, reliable, and comparable results across laboratories.

4. Conclusions

Concentrations of plastic in the Aveiro Lagoon and Vouga River were, respectively, 18 MP L−1 and 1 MP L−1 under 470 nm. These concentrations are higher than currently reported for Portugal, most likely due to the methods of sampling and identification used. Whereas grab sampling allows identification of smaller microplastics due to the use of smaller pore sizes (here, 1.2 µm), the proper use of Nile Red allows identification of microplastics that would otherwise be disregarded. Therefore, this work raises concerns regarding the underestimation of microplastics in the environment resulting from various methodologies used, which also hinders interstudy comparisons. One example of such variation is simply the use of different wavelengths to observe Nile Red-stained particles, where six times more particles were identified under 470 nm than under 254 nm. Moreover, the use of grab sampling requires standardizing the volume of water sampled. From the results of laboratory tests and sampling, the volumes of 0.5 L or 1 L for replicates seems to be a good compromise between effort, presence of organic and mineral matter, and the approximation to the real concentration for small microplastics. The use of low volumes and easy identification protocols allowed us to intensify the temporal and geographic sampling of microplastics with the use of easily available materials (e.g., glass bottles). Staining with Nile Red provides a reliable identification technique and can be complementary to the characterization of a percentage of particles by spectroscopic analysis. Future studies may also advise on how to conduct grab sampling for proper quantification of heterogeneously distributed microplastics in aquatic environments.

Supplementary Materials

The following are available online at https://www.mdpi.com/2073-4441/12/4/1219/s1, Figure S1: Organic matter removal, Figure S2: Formulas, Figures S3 and S4: Particles numbers retrieved per volume sampled, Table S1: Characteristics of the water collected, Tables S2, S3 and S4: Average, median, interquartile range, coefficient of variation, accuracy and recovery rates.

Author Contributions

J.C.P.: Conceptualization, Data curation, Formal analysis, Investigation, Methodology, Project administration, Visualization, Writing-original draft, Writing-review & editing. M.J.M.: Investigation. J.P.d.C.: Conceptualization, Methodology, Resources, Funding acquisition, Writing-review & editing. A.C.D.: Conceptualization, Methodology, Resources, Supervision, Project administration, Funding acquisition, Writing-review & editing. T.R.-S.: Conceptualization, Methodology, Resources, Supervision, Project administration, Funding acquisition, Writing-review & editing. All authors have read and agreed to the published version of the manuscript.

Funding

Thanks are due to FCT/MCTES for the financial support (UIDP/50017/2020+UIDB/50017/2020), through national funds. This work was also supported by national funds through FCT/MEC under project PTDC/BTA-GES/28770/2017. This work was also funded by Portuguese Science Foundation (FCT) through scholarship PD/BD/135581/2018 under POCH funds, co-financed by the European Social Fund and Portuguese National Funds from MEC. This work also received funding from national funds (OE), through FCT, in the scope of the framework contract foreseen in the numbers 4, 5 and 6 of the article 23, of the Decree-Law 57/2016, of August 29, changed by Law 57/2017, of July 19.

Conflicts of Interest

The authors declare no conflict of interest.

References

  1. Frias, J.P.G.; Nash, R. Microplastics: Finding a consensus on the definition. Mar. Pollut. Bull. 2019, 138, 145–147. [Google Scholar] [CrossRef] [PubMed]
  2. Rodrigues, M.O.; Abrantes, N.; Gonçalves, F.J.M.; Nogueira, H.; Marques, J.C.; Gonçalves, A.M.M. Spatial and temporal distribution of microplastics in water and sediments of a freshwater system (Antuã River, Portugal). Sci. Total Environ. 2018, 633, 1549–1559. [Google Scholar] [CrossRef] [PubMed]
  3. Frias, J.P.G.L.; Otero, V.; Sobral, P. Evidence of microplastics in samples of zooplankton from Portuguese coastal waters. Mar. Environ. Res. 2014, 95, 89–95. [Google Scholar] [CrossRef] [PubMed]
  4. Have, M.; Lorenz, C.; Primpke, S.; Gerdts, G. Different stories told by small and large microplastics in sediment—First report of microplastic concentrations in an urban recipient in Norway. Mar. Pollut. Bull. 2019, 141, 501–513. [Google Scholar] [CrossRef]
  5. Corradini, F.; Meza, P.; Eguiluz, R.; Casado, F.; Huerta-Lwanga, E.; Geissen, V. Evidence of microplastic accumulation in agricultural soils from sewage sludge disposal. Sci. Total Environ. 2019, 671, 411–420. [Google Scholar] [CrossRef]
  6. Vianello, A.; Jensen, R.L.; Liu, L.; Vollertsen, J. Simulating human exposure to indoor airborne microplastics using a Breathing Thermal Manikin. Sci. Rep. 2019, 9, 8670. [Google Scholar] [CrossRef]
  7. Wang, W.; Gao, H.; Jin, S.; Li, R.; Na, G. The ecotoxicological effects of microplastics on aquatic food web, from primary producers to human: A review. Ecotoxicol. Environ. Saf. 2019, 173, 110–117. [Google Scholar] [CrossRef]
  8. Rodrigues, J.P.; Duarte, A.C.; Santos-Echeandía, J.; Rocha-Santos, T. Significance of interactions between microplastics and POPs in the marine environment. A critical overview. Trends Anal. Chem. 2019, 111, 252–260. [Google Scholar] [CrossRef]
  9. Lu, L.; Luo, T.; Zhao, Y.; Cai, C.; Fu, Z.; Jin, Y. Interaction between microplastics and microorganisms as well as gut microbiota: A consideration on environmental animal and human health. Sci. Total Environ. 2019, 667, 94–100. [Google Scholar] [CrossRef]
  10. Carson, H.S.; Colbert, S.L.; Kaylor, M.J.; McDermid, K.H. Small plastic debris changes water movement and heat transfer through beach sediments. Mar. Pollut. Bull. 2011, 62, 1708–1713. [Google Scholar] [CrossRef]
  11. Villarrubia-Gómez, P.; Cornell, S.E.; Fabres, J. Marine plastic pollution as a planetary boundary threat—The drifting piece in the sustainability puzzle. Mar. Policy 2018, 96, 213–220. [Google Scholar] [CrossRef]
  12. Dekiff, J.H.; Remy, D.; Klasmeier, J.; Fries, E. Occurrence and spatial distribution of microplastics in sediments from Norderney. Environ. Pollut. 2014, 186, 248–256. [Google Scholar] [CrossRef] [PubMed]
  13. Subgroup, M.T. Guidance on Monitoring of Marine Litter in European Seas; Mercier, Luxembourg, 2013. Available online: https://mcc.jrc.ec.europa.eu/documents/201702074014.pdf (accessed on 1 January 2020).
  14. Lenz, R.; Labrenz, M. Small microplastics sampling in water: Development of an encapsulated filtration device. Water 2018, 10, 1055. [Google Scholar] [CrossRef] [Green Version]
  15. Abigail, B.; Courtney, N.; Michelle, B.; Susan, S. Grab vs. neuston tow net: A microplastic sampling performance comparison and possible advances in the field. Anal. Methods 2017, 9, 1446–1453. [Google Scholar]
  16. Dris, R.; Gasperi, J.; Rocher, V.; Saad, M.; Renault, N.; Tassin, B. Microplastic contamination in an urban area: A case study in Greater Paris. Environ. Chem. 2015, 12, 592–599. [Google Scholar] [CrossRef]
  17. Vermaire, J.C.; Pomeroy, C.; Herczegh, S.M.; Haggart, O.; Murphey, M. Microplastic abundance and distribution in the open water and sediment of the Ottawa River, Canada, and its tributaries. Facets 2017, 2, 301–314. [Google Scholar] [CrossRef] [Green Version]
  18. Cai, M.; He, H.; Liu, M.; Li, S.; Tang, G.; Wang, W.; Huang, P.; Wei, G.; Lin, Y.; Chen, B.; et al. Lost but can’t be neglected: Huge quantities of small microplastics hide in the South China Sea. Sci. Total Environ. 2018, 633, 1206–1216. [Google Scholar] [CrossRef]
  19. Erni-Cassola, G.; Gibson, M.I.; Thompson, R.C.; Christie-Oleza, J.A. Lost, but found with nile red: A novel method for detecting and quantifying small microplastics (1 mm to 20 μm) in environmental samples. Environ. Sci. Technol. 2017, 51, 13641–13648. [Google Scholar] [CrossRef] [Green Version]
  20. Prata, J.C.; da Costa, J.P.; Duarte, A.C.; Rocha-Santos, T. Methods for sampling and detection of microplastics in water and sediment: A critical review. TrAC Trends Anal. Chem. 2019, 110, 150–159. [Google Scholar] [CrossRef]
  21. Desforges, J.-P.W.; Galbraith, M.; Dangerfield, N.; Ross, P.S. Widespread distribution of microplastics in subsurface seawater in the NE Pacific Ocean. Mar. Pollut. Bull. 2014, 79, 94–99. [Google Scholar] [CrossRef] [PubMed]
  22. Norén, F. Small Plastic Particles in Coastal Swedish Waters; Billdal, Sweden, 2008. Available online: http://www.n-research.se/pdf/Small%20plastic%20particles%20in%20Swedish%20West%20Coast%20Waters.pdf (accessed on 1 January 2020).
  23. Darena, S.; Christophe, G.; Hans-Ulrich, H.; Peter, F. Analysis of microplastics in water by micro-Raman spectroscopy: Release of plastic particles from different packaging into mineral water. Water Res. 2018, 129, 154–162. [Google Scholar]
  24. Di, M.; Wang, J. Microplastics in surface waters and sediments of the Three Gorges Reservoir, China. Sci. Total Environ. 2018, 616–617, 1620–1627. [Google Scholar] [CrossRef]
  25. Masura, J.; Baker, J.; Foster, G.; Arthur, C. Laboratory Methods for the Analysis of Microplastics in the Marine Environment: Recommendations for Quantifying Synthetic Particles in Waters and Sediments; Silver Spring, MD, USA, 2015. Available online: https://marinedebris.noaa.gov/sites/default/files/publications-files/noaa_microplastics_methods_manual.pdf (accessed on 1 January 2020).
  26. Prata, J.C.; da Costa, J.P.; Girão, A.V.; Lopes, I.; Duarte, A.C.; Rocha-Santos, T. Identifying a quick and efficient method of removing organic matter without damaging microplastic samples. Sci. Total Environ. 2019, 686, 131–139. [Google Scholar] [CrossRef] [PubMed]
  27. Prata, J.C.; Reis, V.; Matos, J.T.V.; da Costa, J.P.; Duarte, A.C.; Rocha-Santos, T. A new approach for routine quantification of microplastics using Nile Red and automated software (MP-VAT). Sci. Total Environ. 2019, 690, 1277–1283. [Google Scholar] [CrossRef] [PubMed]
  28. Prata, J.C.; Alves, J.R.; da Costa, J.P.; Duarte, A.C.; Rocha-Santos, T. Major factors influencing the quantification of Nile Red stained microplastics and improved automatic quantification (MP-VAT 2.0). Sci. Total Environ. 2020, 719, 137498. [Google Scholar] [CrossRef] [PubMed]
  29. Tamminga, M.; Stoewer, S.-C.; Fischer, E.K. On the representativeness of pump water samples versus manta sampling in microplastic analysis. Environ. Pollut. 2019, 254, 112970. [Google Scholar] [CrossRef]
  30. Liu, K.; Zhang, F.; Song, Z.; Zong, C.; Wei, N.; Li, D. A novel method enabling the accurate quantification of microplastics in the water column of deep ocean. Mar. Pollut. Bull. 2019, 146, 462–465. [Google Scholar] [CrossRef]
  31. Covernton, G.A.; Pearce, C.M.; Gurney-Smith, H.; Chastain, S.G.; Ross, P.S.; Dower, J.F.; Dudas, S.E. Size and shape matter: A preliminary analysis of microplastic sampling technique in seawater studies with implications for ecological risk assessment. Sci. Total Environ. 2019, 667, 124–132. [Google Scholar] [CrossRef]
  32. Green, D.S.; Kregting, L.; Boots, B.; Blockley, D.J.; Brickle, P.; da Costa, M.; Crowley, Q. A comparison of sampling methods for seawater microplastics and a first report of the microplastic litter in coastal waters of Ascension and Falkland Islands. Mar. Pollut. Bull. 2018, 137, 695–701. [Google Scholar] [CrossRef] [Green Version]
  33. Rodrigues, S.M.; Almeida, C.M.R.; Silva, D.; Cunha, J.; Antunes, C.; Freitas, V.; Ramos, S. Microplastic contamination in an urban estuary: Abundance and distribution of microplastics and fish larvae in the Douro estuary. Sci. Total Environ. 2019, 659, 1071–1081. [Google Scholar] [CrossRef]
  34. Christie, R.M. Pigments, dyes and fluorescent brightening agents for plastics: An overview. Polym. Int. 1994, 34, 351–361. [Google Scholar] [CrossRef]
  35. Maes, T.; Jessop, R.; Wellner, N.; Haupt, K.; Mayes, A.G. A rapid-screening approach to detect and quantify microplastics based on fluorescent tagging with Nile Red. Sci. Rep. 2017, 7, 44501. [Google Scholar] [CrossRef] [PubMed] [Green Version]
Figure 1. Boxplots of concentrations obtained in fresh (A) and saltwater (B) in laboratory tests, from spikes of 2 MP L−1, 10 MP L−1, and 20 MP L−1, and concentrations obtained in environmental sampling of the Vouga River (C) and Aveiro Lagoon (D), quantified after Nile Red staining under the wavelengths of 470 nm, 254 nm all particles, 254 nm red particles. Interquartile range of fresh (E) and saltwater (F), by spike concentration (2 MP L−1, 10 MP L−1, 20 MP L−1), and of environmental samplings of the Vouga River (G) and Aveiro Lagoon (H) by quantification method.
Water 12 01219 g001
Figure 2. Particles (↖), previously identified by fluorescence under 254 nm after Nile Red staining, under visible light and photographed by digital stereomicroscope (AD) and their corresponding details (top right corner of each picture). Particles observed under 254 nm (E,G); Visualization improved by maxing out Color Balance for red and yellow on Adobe Photoshop CS4) and under visible light (F,H), correspondingly. A white-blue fluorescent fiber likely originated from the cotton lab coat (E).
Water 12 01219 g002aWater 12 01219 g002b
Table 1. Concentration of microplastics (MP m−3) in several locations using different methods for sampling, identification, and minimum size (µm).
LocationConcentrationSamplingIdentificationSizeReference
Vouga River, Portugal1,000GrabNile Red50Current study
Aveiro Lagoon, Portugal18,000GrabNile Red50Current study
Antuã River, Portugal<1,265NetVisual55[2]
Douro River, Portugal<0.24NetVisual500[33]
Portuguese Coast<0.036NetVisual>180[3]
British Columbia, Canada<10,330GrabVisual8[31]
Continental and South Atlantic Islands, UK<9,000GrabVisual0.45[32]

