Field-Based Analysis of Runoff Generation Processes in Humid Lowlands of the Taihu Basin, China


1
College of Hydrology and Water Resources, Hohai University, Nanjing 210098, China
2
Skate Key Laboratory of Hydrology-Water Resources and Hydraulic Engineering, Hohai University, Nanjing 210098, China
*
Author to whom correspondence should be addressed.
Water 2020, 12(4), 1216; https://doi.org/10.3390/w12041216
Submission received: 6 March 2020
/
Revised: 18 April 2020
/
Accepted: 20 April 2020
/
Published: 24 April 2020
(This article belongs to the Special Issue Soil Sciences and Water Table)
Abstract
:In the flat lowland agricultural areas of subtropical climate zones, the runoff process has a great influence on the regional water quantity and quality. In this study, field data about rainfall, evapotranspiration, soil moisture, groundwater table, and surface water dynamics were collected in two different experimental sites in the Taihu Basin, China. Results showed that densely distributed ditches contributed to shallow groundwater depths and persistent near-saturation soil. A correlation analysis was conducted to improve the understandings of runoff generation in humid lowland areas of the Taihu Basin. It was found that a Dunne overland flow was the dominant mechanism responsible for the rapid runoff generation. The total rainfall and runoff expressed a good linear relationship with an R2 of 0.95 in the Hongqiwei test site. The initial groundwater depth was considered as the indicator of the antecedent soil moisture estimation for the close relationship. The depression storage was suggested in a range from 4.72 to 8.03 mm for an estimation based on the water balance analysis for each rainfall event, which proves that the depression storage should not be neglected when calculating the runoff generation process in humid lowlands.
1. Introduction
About 30% of the Taihu Basin, a typically humid lowland region in China, are lowland polders [1] which can be characterized by a flat terrain, shallow water table, and extensive river networks [2]. These water-rich areas have dense populations [3,4] and intensive agricultural activities [5,6] which are also vulnerable to flooding and are easily polluted [7,8,9]. Therefore, there is a clear and urgent need to focus on hydrological behavior in humid lowland areas which aims to provide a solid scientific basis for regional risk assessment and water resources management [10,11].
Runoff generation is the key component of the terrestrial hydrological cycle [12], which is important for the prediction of water quantities and water quality of specific areas [13]. Typical runoff generation mechanisms include Hortonian overland flow [14], which occurs when rainfall exceeds the infiltration rate of the unsaturated soil, Dunne overland flow [15], which occurs when the soil is saturated, and subsurface flow [16]. In addition to basic influencing factors such as antecedent conditions [17,18] and rainfall characteristics [19,20], strong interactions between groundwater and surface water are important for the water cycle in lowland areas [21]. It was highlighted that ephemeral water storage in depressions [22,23] contributes to higher variability in low-gradient terrain than upland watersheds [24,25]. Besides, human activities such as artificial drainage building, land development, and agricultural practices significantly changed the hydrological conditions in the flat plain [26,27]. Runoff generation processes were especially difficult to generalize for the lowlands [28] and showed great variabilities for the combined effects of soil antecedent conditions, rainfall characteristics, human activities, and the interactions between groundwater and surface water [29,30]. Studies were conducted in typical lowland areas of the Netherlands [31], the United States [32], Germany [33], and other places [34,35,36] to contribute to our understanding of runoff generation mechanisms. However, the amounts and dynamics of runoff generation in flat lowland agricultural areas in the Taihu Basin of China are still poorly understood and research on specific runoff influencing factors are prerequisites for informing better management practices for water resources conservation.
Field experiments provide direct insights into processes and are critical to developing suitable runoff generation calculation methods [37,38]. Water balancing based on measurements is a commonly used method [39] for estimating the unmeasured hydrologic variables. However, this method can only be used under the condition of one unmeasured term, which means the method is more suitable for relatively hydrologically isolated regions. Based on the advances in measurement technologies collecting different sets of data [40], van den Eertwegh et al. [41] attempted to determine the balances of water and nutrients for a catchment in the Netherlands, and the water balance was calculated to quantify the water budgets of different land-use types in an irrigation district [42]. Based on an analysis of the monthly soil water balance, the frequency and variability of the hydrological response were evaluated at the annual and seasonal time-scale in a Mediterranean catchment [43]. This method is considered as a powerful tool to analyze regional hydrology [44] within a specific time-scale.
This study aims to explore the runoff generation process in humid lowland areas in the Taihu Basin, China. Field experiments were conducted in two typical lowland plots located in Jintan, Changzhou, Jiangsu Province, China. Based on the analysis of water balance during rainfall events, the amount of depression storage was evaluated for its role in runoff responses in the area. A Pearson correlation analysis was performed to figure out the rainfall–runoff relationship and the linkage between the runoff generation and the influencing factors.
2. Materials and Methods
2.1. Study Area
The Taihu Basin is located in eastern China, which is a lake basin with a total area of 3.69 × 10⁴ km2. It is known as one of the most densely populated and economically developed regions in this country. By the end of 2010, this area, which covered no more than 0.4% of the country’s land, created 10.8% of the national GDP, with the average population density and the per capita GDP about fifty times and 2.5 times the national average, respectively [45]. It is also one of the most urbanized areas in China, with an average urbanization rate of 74.7% in 2010.
The overall topography of this basin is dish-shaped. Taihu Lake, which is the third largest freshwater lake in China, is located in the center depression area of this basin. The landforms are mainly of two types: hills and plains. The vast plains in the central and eastern regions account for about 80% of the total area, with criss-crossed river networks and numerous lakes. It has a subtropical monsoon climate, and natural vegetation is mainly distributed in the hilly and mountainous areas in the western parts of this basin. Affected by climatic conditions, the vegetation’s species composition and type gradually became more complicated from north to south, and evergreen tree species gradually increased [46].
The two experimental fields are located in Jintan, Changzhou, Jiangsu Province, China. The region has a subtropical monsoon climate with a mean yearly temperature of 15 ℃. Mean precipitation and mean evaporation are about 1070 mm/year and 1283.1 mm/year, respectively. The average elevation is 5.2 m above sea level. The rocks are made up of 30 m Quaternary deposits [47], mainly characterized by marls and calcareous mudstones. The field experiments are conducted in two hydrologically isolated test sites which are both typical flat lowlands surrounded by ditches in the Taihu Basin.
2.1.1. Hongqiwei Field Experiment
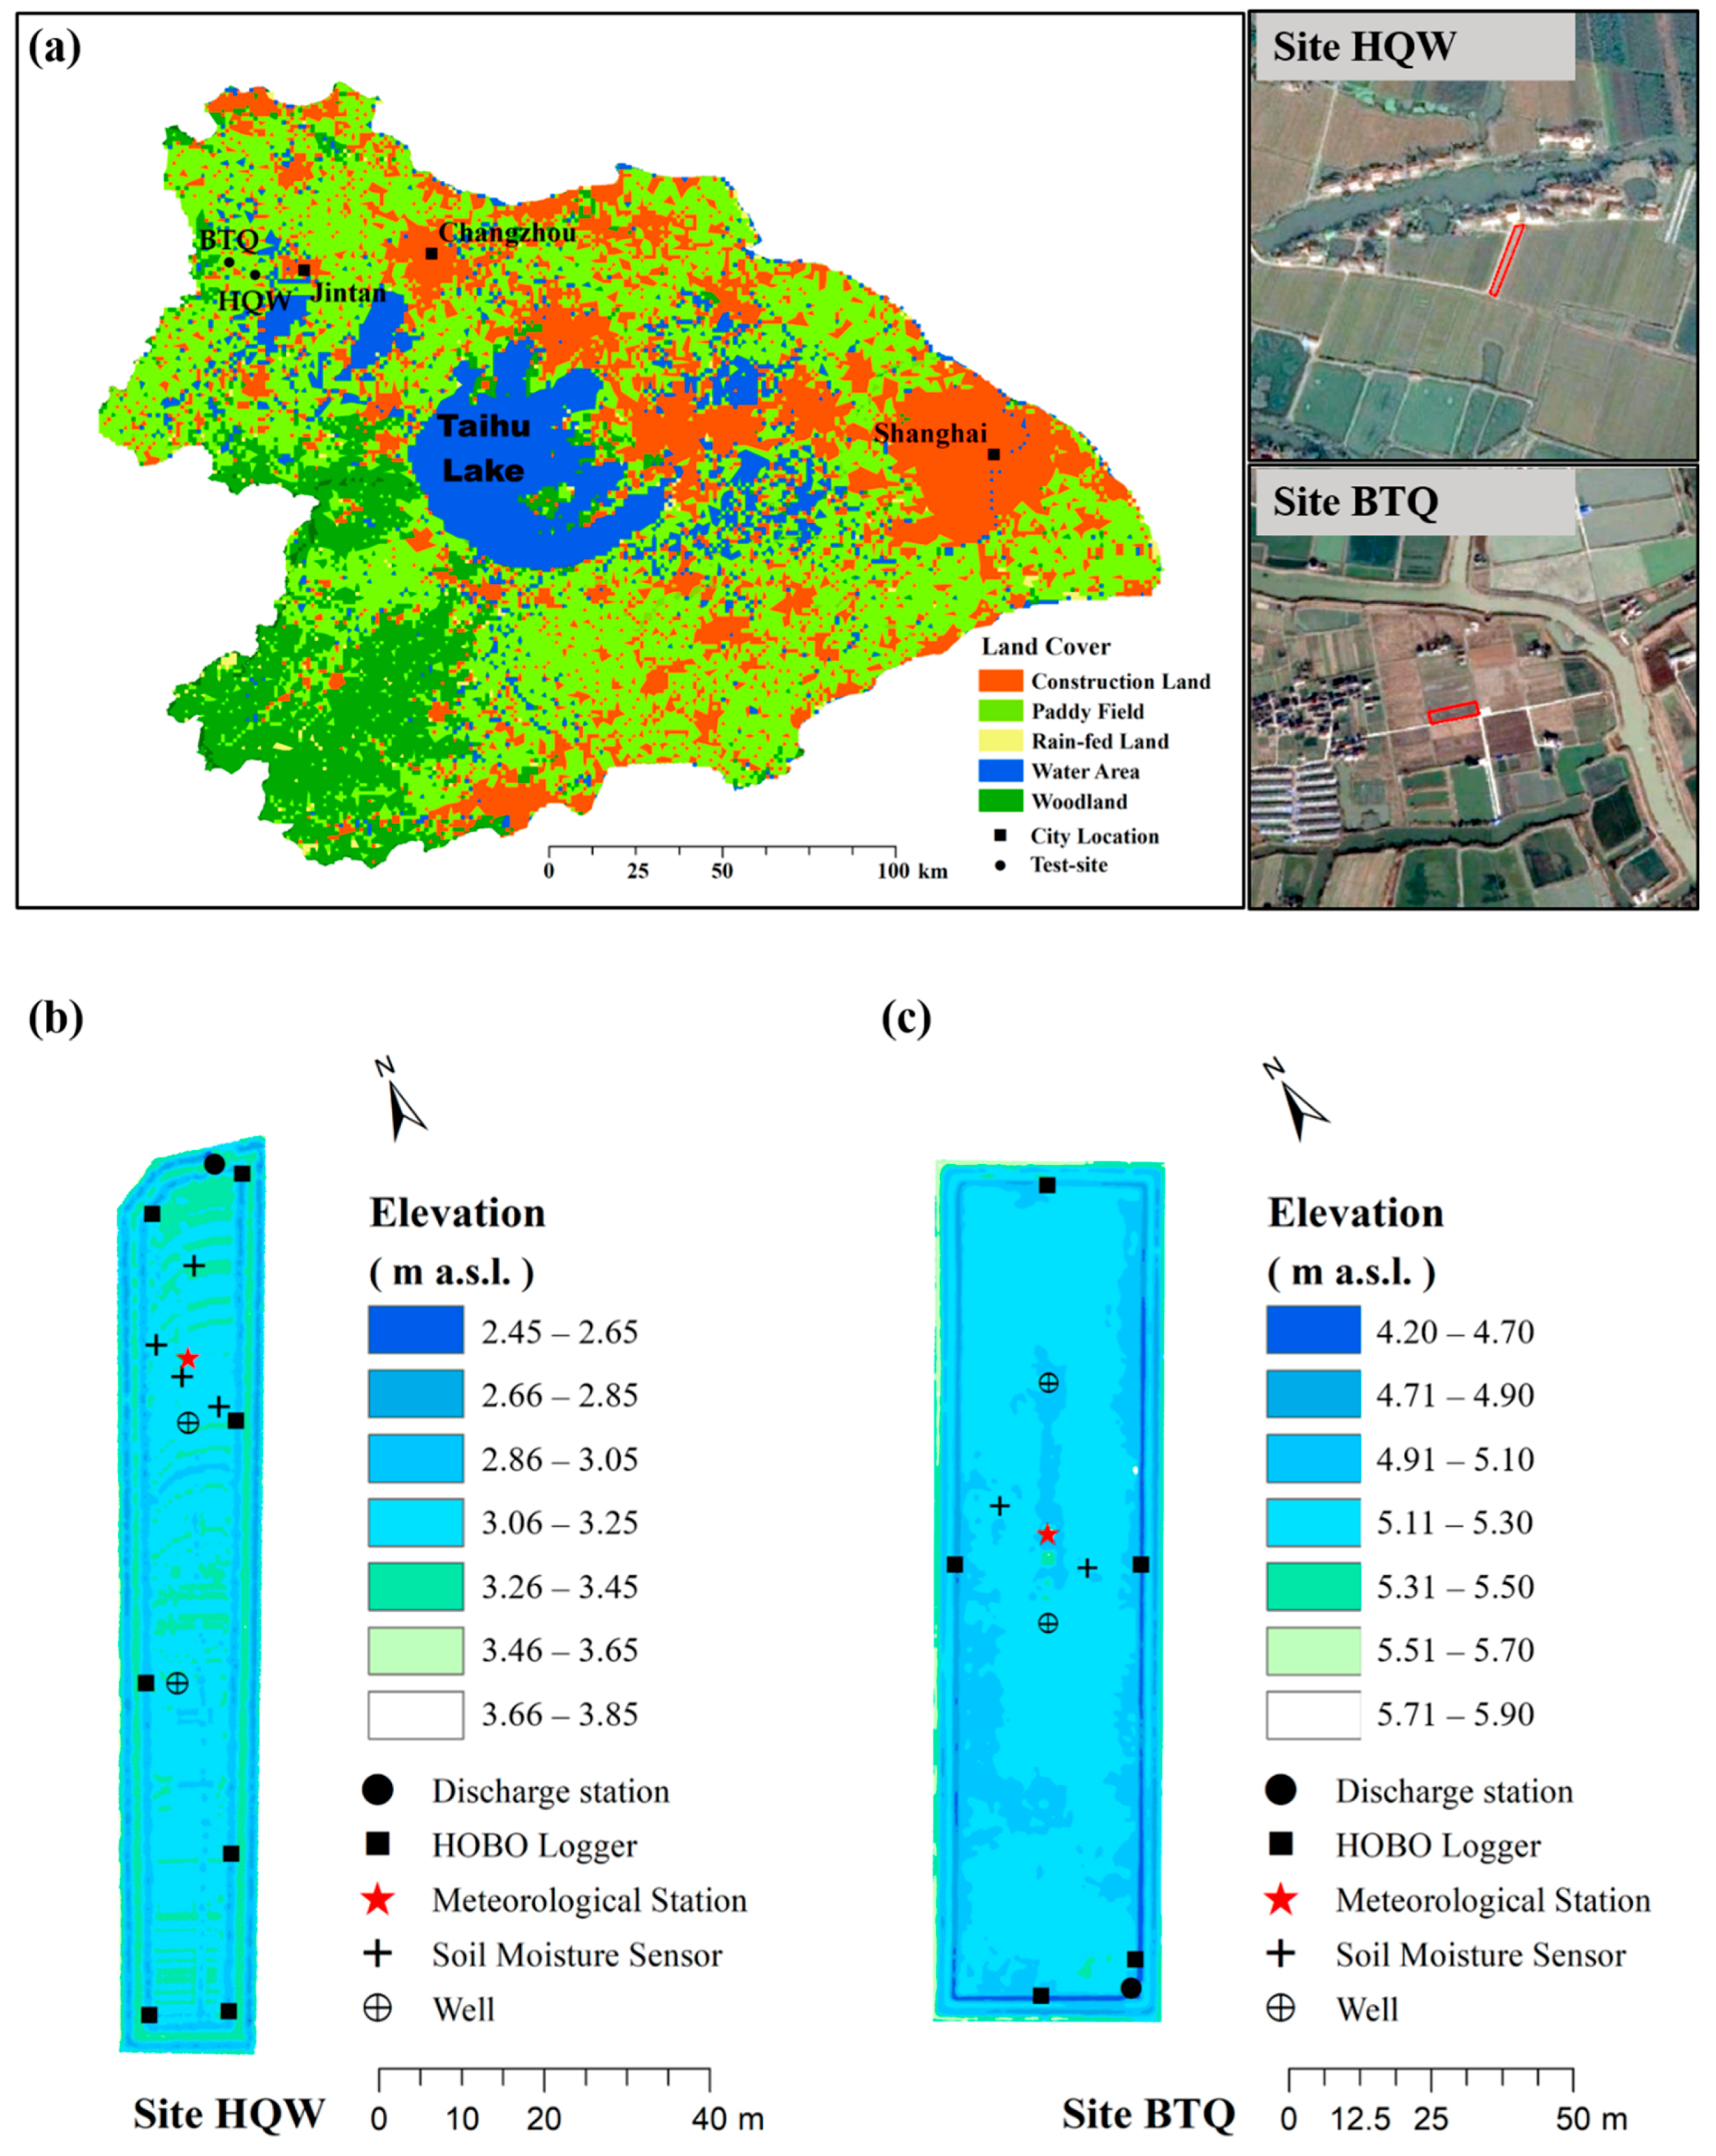
The Hongqiwei field (HQW) is located in Zhulin, Changzhou, Jiangsu, China (31.725° N, 119.471° E) with a flat area of 1008 m2 (Figure 1a). The surface elevation ranges from 2.4 to 3.8 m (Figure 1b) and the nearest river is approximately 20 m away. Ditches surrounding the field are 0.5–0.6 m deep.
The field has been used for agriculture production for centuries. Edamame (green soybean) is the main vegetation that grows from July to September each year. The soil has a texture of silty clay loam, based on the USDA classification [48] (Table 1), with the average bulk density of 1.36 g/cm3. The average saturated hydraulic conductivity, volumetric saturated water content, and organic matter are 46.63 mm/hr, 45.0%, and 14.78 g/kg, respectively. The high standard deviation of the saturated hydraulic conductivity indicated heterogeneity in the horizon of the 1-meter-deep soil. Detailed information for the laboratory analysis of the collected soil samples at different depths can be found in the previous study [47].
2.1.2. Baitaqiao Field Experiment
The Baitaqiao (BTQ) field is located in Zhiqian, Changzhou, Jiangsu, China (31.760° N, 119.457° E) with a flat area of 1710 m2. The surface elevation ranges from 4.2 to 5.8 m (Figure 1c) and the nearest river is about 170 m away. Ditches surrounding the field are 0.4 m deep. It is worth noticing that the ditch to the west of the site is 1 m deep and is used as the main channel of irrigation and drainage for the region. The ditch links to the nearest river through a water pump.
To prevent soil erosion from regional environmental change, the field was planted with natural grass instead of edamame. The same analytical method was applied, as in the HQW site, in the laboratory experiment for the soil samples. The field has similar basic soil properties with the HQW site. The soil at the 1 m depth also has the same texture of silty clay loam (Table 1), with the average bulk density, average saturated hydraulic conductivity, volumetric saturated water content, and organic matter of 1.52 g/cm3, 30.22 mm/hr, 47.0%, and 18.38 g/kg, respectively.
2.2. Data Collection
Both two sites were surrounded by waterproof barriers that form relatively hydrologically isolated areas. For each site, there are two drainage ditches built inside and outside of the impermeable materials, which are installed in the ridges (Figure 1b,c). They are designed for the runoff collection of both sides to avoid surface water exchanges between the outside and inside of the ridge.
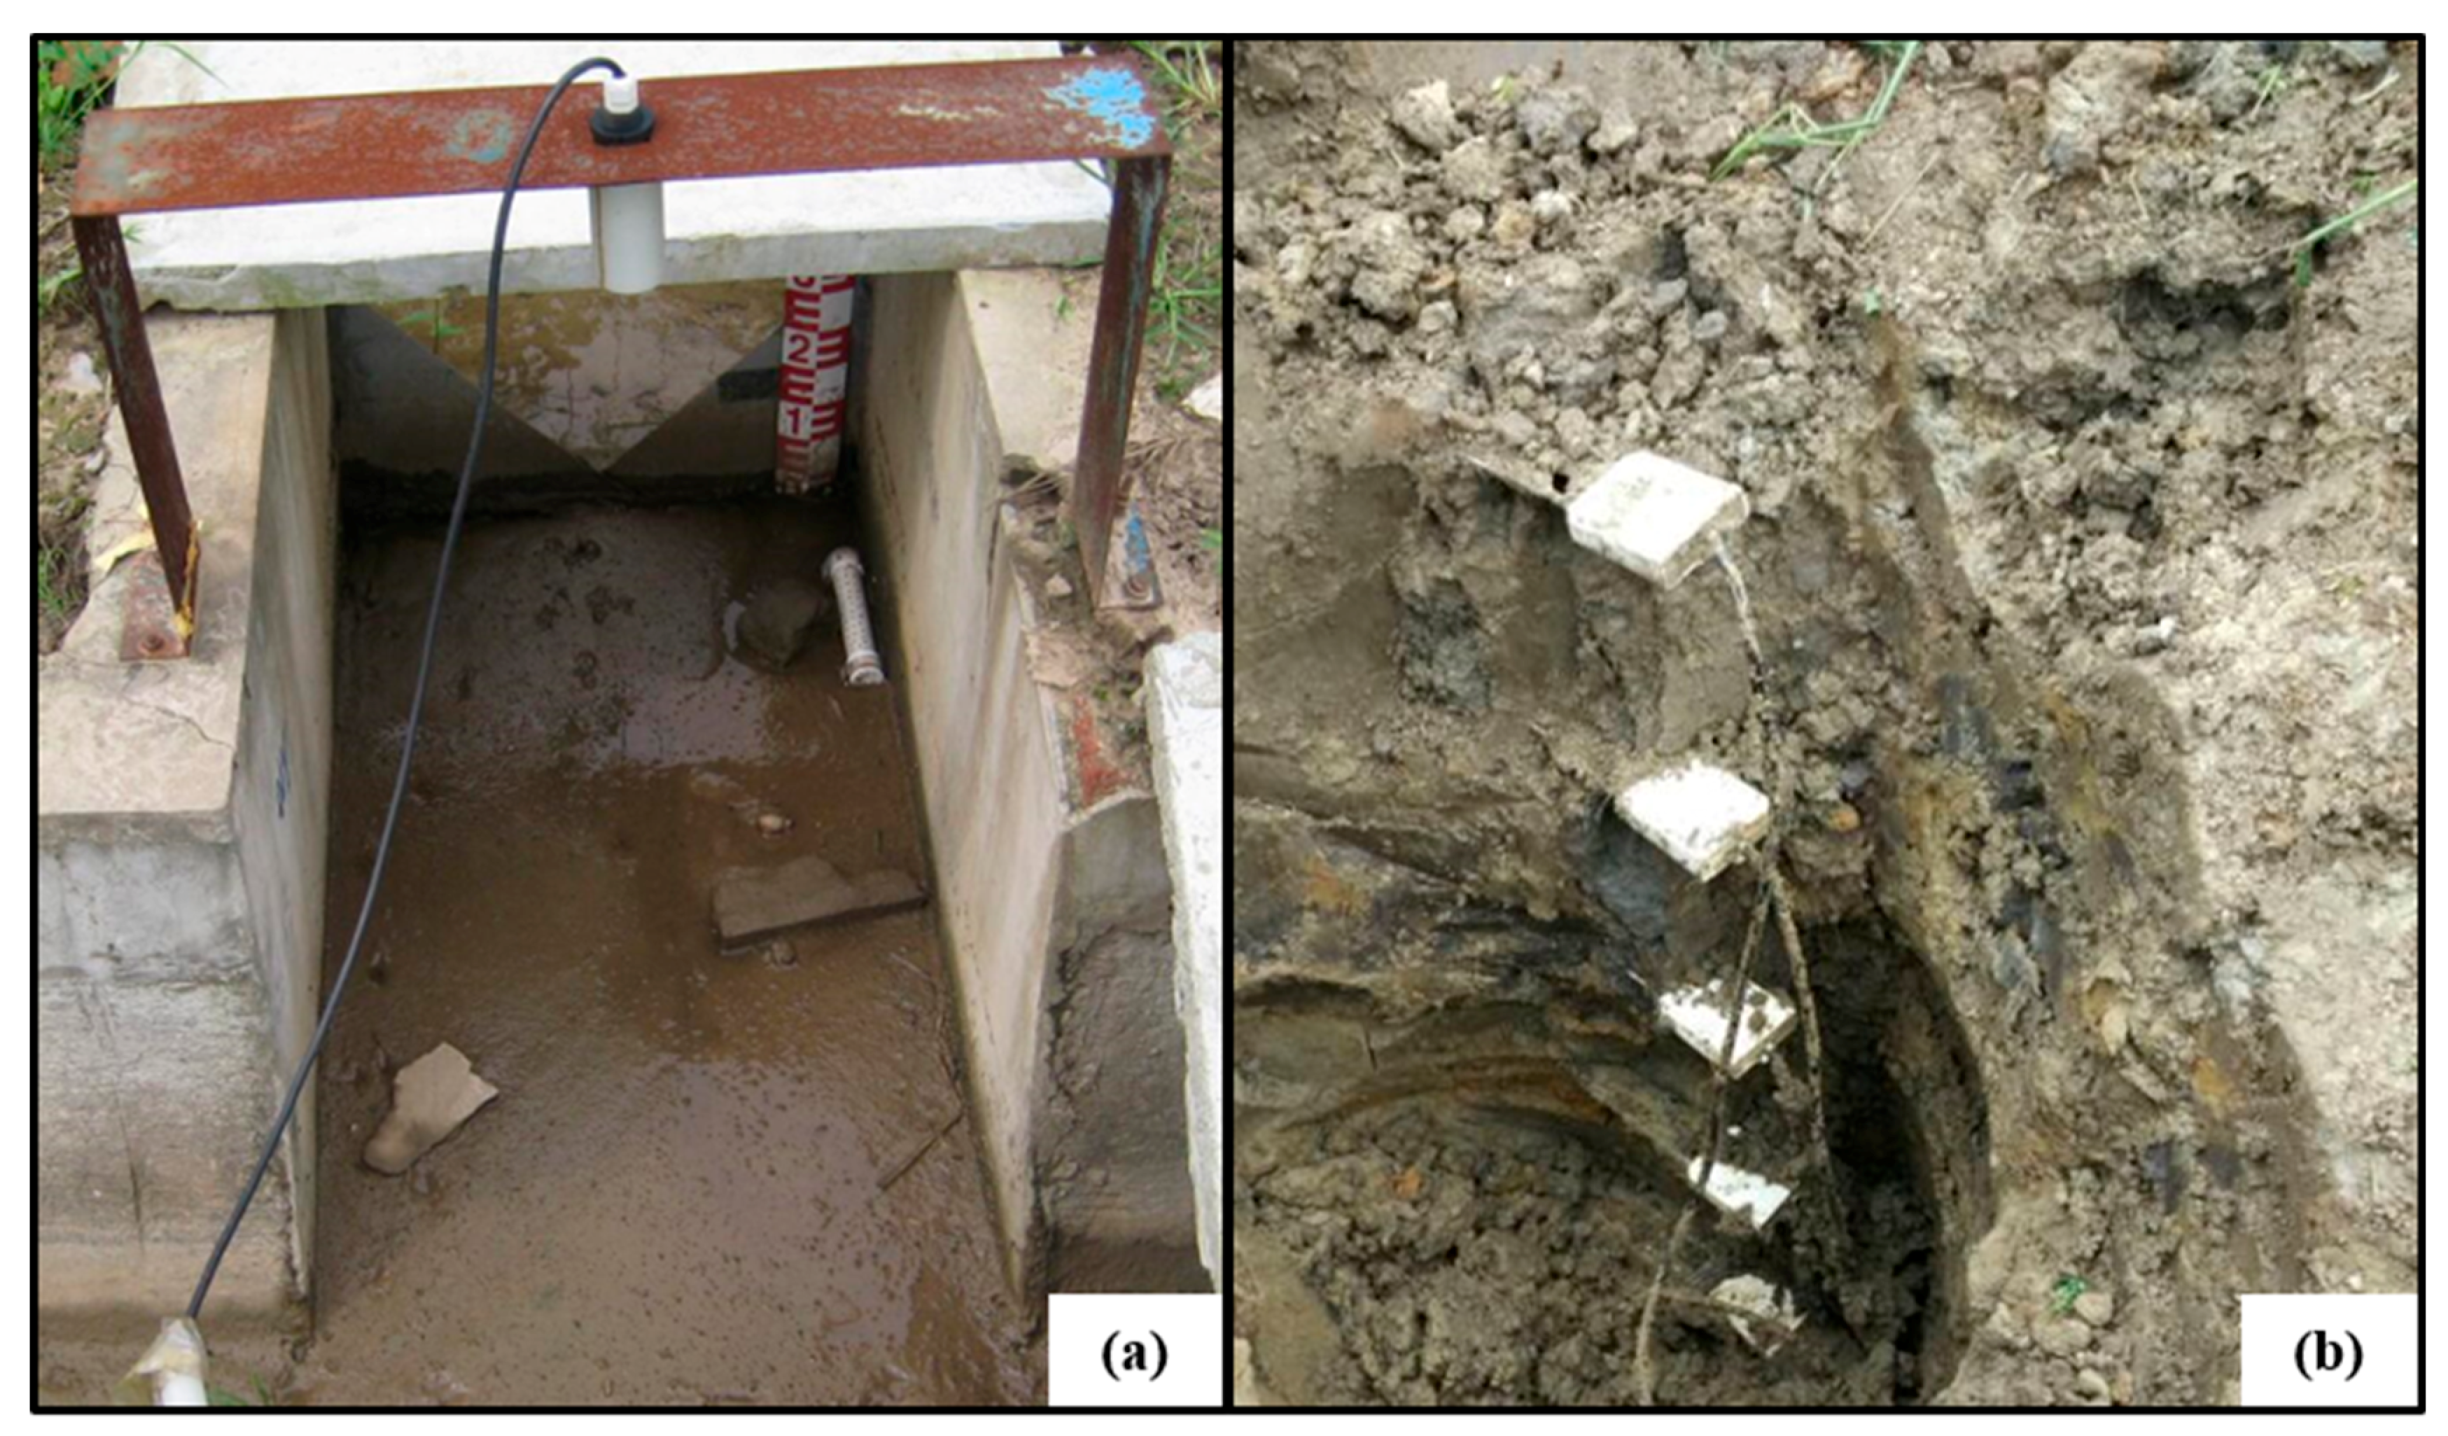
In the HQW site, a short concrete channel was built to connect the inside ditches and a nearby stream. It was used to measure the outflow of the field with a discharge station installed at the outlet that consists of a V-notch weir (Figure 2a). The water depths in different locations in the ditches were measured with pressure transducers (HOBO Water Level Datalogger, Onset) every 10 min, including in front of the weir. In the BTQ site, the inside ditches are drained out through the outlet leading to the irrigation channel to the western part of the field. Similarly, the runoff is measured via a V-notch weir and water depth logger. The level–discharge relationship for the V-notch weir was established, validated, and calibrated in the laboratory.
The groundwater regime was monitored by observation wells using the laser technique. The method is based on a laser distance meter, a non-contact measurement taken by sending out a pulse of laser light to a defined target and then measuring the amount of time it takes for the reflection to return. There are both two observation wells in the HQW and BTQ sites, respectively (Figure 1b,c). The data were recorded every 10 min.
Four soil profile locations (Figure 1b) were selected in the HQW field for the measurement of soil moisture. At each location, time domain reflectometry (TDR) probes [49] (Campbell CS616, Campbell Scientific) were inserted horizontally at the depths of 10, 20, 40, 60 and 80 cm below the ground surface (Figure 2b). In the BTQ field, TDR probes were installed in two locations at the same depths as in the HQW site. The soil volumetric water content was measured in two sites with a time interval of 10 min.
The meteorological data were available from the automatic weather station (Campbell Scientific, Inc., Logan, UT, USA) for each site (Figure 1b,c). The station measured rainfall, evaporation, air temperature, and wind direction and velocity at 2 m above the ground surface at the same interval for 10 min. From January 2014 to January 2017, the meteorological data and dynamics of the surface runoff, soil water, and groundwater were collected in the HQW site. Unfortunately, the monitoring work in HQW was stopped for highway construction in this region from 2017. Then, we built a new site in BTQ to continue the field experiment. Similar data were obtained from the BTQ site from April 2018 through to July 2019.
2.3. Data Assessment
2.3.1. Rainfall Event Definition
Hydrological and meteorological data were processed from 1 January 2016 to 31 December 2016 in HQW and from 1 July 2018 to 30 June 2019 in BTQ, in order to study the seasonal event rainfall and runoff dynamics as well as the soil water and groundwater regimes. After a detailed examination of the available two-year data, rainfall events were selected based on the total rainfall values greater than 5 mm and a time gap of no less than 24 h between rain events. These criteria were used to identify detectible single peaked events and minimize the influence of prior storms on runoff processes. A runoff event was defined as a phenomenon when surface runoff was observed at the outlet during the rainfall event.
A total of 29 and 23 rainfall events were selected and confirmed from HQW and BTQ, respectively. A total of 29 runoff events were identified, in which 17 events were obtained from HQW and 12 from BTQ. Compared with the 29 events in Amatya et al.’s study [50], 23 events in Slattery et al.’s study [20], and 30 events in Han et al.’s study [51], the 29 events in this study could be persuasive for exploring the linkage between the runoff and the potential influencing factors in lowlands.
2.3.2. Water Balance Analysis for Events
Depression storage is known as an important factor influencing the runoff process in low-topographic gradient areas [24]. It refers to the amount of rainfall that is temporarily stored on surface depressions [52]. The water balance analysis during the individual events was used to calculate the depression storage due to the direct measurement difficulties under field conditions [53].
For the water balance of the field, the upper boundary is set at the land surface and the lower boundary above the first impermeable layer [42]. With the exception of depression storage, all the water balance components are known. Thus, the water balance equation during a specified period can be expressed as
where D (mm) is the depression storage depth, P (mm) is the precipitation depth, E (mm) is the evapotranspiration depth, R (mm) is the relative drainage depth through the outlet, I (mm) is the cumulative infiltration depth, and ∆V (mm) is the water exchange between the test sites and their surrounding areas. ∆V equals zero in this condition when there is no lateral flow exchange for the hydrologically isolated sites. The field cumulative infiltration depth (I) in this study was calculated using Equation (2)
where ∆θ (m3/m3) is the increment of the soil water content in each layer of the unsaturated zone, and ∆zi (mm) is the vertical distance between the moisture sensors i and i + 1.
D = P − E − R − I − ∆V
2.3.3. Correlation Analysis
Several variables extracted from the hyetograph and hydrograph were derived for each event and placed into two groups (Table 2): (1) pre-event conditions and (2) event conditions, which were further classified into the precipitation and derived variables, and the hydrological variables.
For the pre-event conditions, the initial groundwater depth (H0) below the land surface was recorded to identify the location of the groundwater surface before the rainfall events. The antecedent soil moisture conditions were estimated by the soil water storage capacity (SWSC), which is defined as the depth (volume per unit area) of water needed to raise a shallow water table to the land surfaces. The profile soil water storage capacity was estimated using the trapezoidal rule of integration with the depth [54]
where SWSC (mm) is the soil water storage capacity, d (m) is the depth from the land surface to the water table, θi and θS,i (m3/m3) are respectively the recorded water content by the sensor and the saturated water content at elevation i, and ∆z (m) is the elevation distance between the moisture sensors i and i + 1.
For the event conditions, rainfall characteristics contain the total rainfall depth (P), duration (T), peak rainfall intensity (Pmax), and average rainfall intensity (Pmean). The hydrological variables include the total quickflow runoff (R), peak discharge (Qmax), runoff coefficient (ɑ), cumulative infiltration (I), increment of the groundwater level (∆H), and depression storage (D) for the individual rainfall events. The total runoff volume was presented in depth which was calculated as a sum of the incremental outlet flow in 10 min intervals divided by the total field area. The runoff coefficient refers to the proportion of the associated rainfall that is converted into runoff which is calculated by the ratio of the runoff depth to the total rainfall depth [55]. These variables were calculated for all events and analyzed with the Pearson correlation coefficients [56,57], which are used to summarize the relationships between all of the potential influencing factors and measured hydrological variables.
3. Results and Discussion
3.1. Hydroclimatic Conditions during the Study Period
The daily rainfall, evaporation, groundwater level, and soil moisture are presented in Figure 3. The data were collected from 1 January 2016 to 31 December 2016 in HQW and from 1 July 2018 to 30 June 2019 in BTQ, which gave a general overview of two sites.
The total annual rainfall was 1853.4 mm in HQW in 2016, which is significantly higher than the average annual rainfall depth. It might be the combined reaction of both interannual variation and climate change. Different from the situation in 2016, the total rainfall was recorded as 1148.9 mm during the studying period in BTQ, which is consistent with the average annual rainfall depth. The total rainfall during the wet season (March to November) in 2016 accounted for 93.4% of the annual rainfall depth, while the rainfall depth in the winter during 2018–2019 was two times as high as that in 2016. It was found that the total rainfall in the winter between 2018 and 2019 was higher than the maximum value in the records during 1955 and 2012 [58] in the Taihu Basin, which may have similar reasons for their occurrences with the higher value of the total annual rainfall in 2016. The maximum daily rainfall in 2016 appeared in September, reaching 150 mm a day, while the annual maximum daily rainfall reached 100 mm a day in August of 2018. Both extreme rainfall events were caused by a typhoon in the summer. Generally, the rainfall events during 2018–2019 were considerably evenly distributed and dominated by a high frequency of low rainfall intensity at less than 20 mm/day.
The total evaporation was recorded as 1301.3 mm in 2016 and 1063.4 mm during 2018–2019. The slight difference can be considered as a normal interannual change. The annual maximum daily evaporation was 13.8 mm on 22 July 2016 and 8.3 mm on 18 July 2018, respectively, which were both due to the contributions of extreme solar radiation. The temporal patterns of evaporation showed similar significant seasonal variabilities for both the HQW and BTQ sites, which can be related to the seasonal variety of solar radiation.
The shallow groundwater levels fluctuated from 0.08 to 1.2 m below the ground surface in the HQW site throughout the year, and a comparable range from 0.08 to 1.0 m was recorded in the BTQ site. Both maximum depths were no more than 1.2 m, which was due to the irrigation through the manmade channels to enable agriculture production. Both water table dynamics showed quick responses to each significant precipitation event with a rise and subsequent recession. The groundwater was very close to the ground surface from June to November in HQW for the combined effects of rainfall and irrigation. However, similar conditions in BTQ were observed between October and March, due to grass planting treatments, low evaporation, and a twice as high total rainfall volume as that in 2016. The different seasonal distributions of rainfall and irrigation practices contributed to the difference in the seasonal groundwater dynamics. The average groundwater depth was 0.57 m in HQW and 0.45 m in BTQ. It’s worth noting that the average groundwater and drainage depth (marked by the dotted line in Figure 3) were on the same elevation for each site. That is, there was a certain relationship between the groundwater dynamics and ditch bottom elevation in the study area.
The volumetric soil water content (VWC) had a maximum value of 0.584 and a minimum value of 0.304 at 10 cm depth in HQW, with an average value of 0.417. In BTQ, the VWC was in the range of 0.377–0.602, with a higher average value of 0.497. The inconsistency between the maximum monitored values and laboratory results in Table 1 reflect the heterogeneity in the soil structures for both sites. The minimum values for the two locations were higher than 50% of their saturated soil water contents, indicating the high status of field wetness maintained by the adequate recharge from the shallow groundwater. The topsoil water dynamics were also sensitive to rainfall, with an increase of water content and continuous evaporation with a decrease after rainfall events. The trend of soil water content below the land surface generally resembled that of groundwater, which may infer the strong interaction between shallow water and soil water in this area. The dynamics of the soil water content differed from that of the shallow water tables in the summer of 2016 due to the greater influence of evaporation on the topsoil. It must be noted that there were two relatively dry periods for the soils within a 10 cm depth in HQW, of which one was from February to April and the other one was from August to September 2016. They were caused by the continuous dry weather conditions during that period. While in BTQ, such a dry status was found appearing from April to June in 2019, that had a shorter duration compared with that in HQW.
All these things make it clear that the hydroclimatic conditions had comparable temporal patterns in the two periods at different locations, which were representative of the hydrological environments in the lowland areas of the Taihu Basin. The shared results based on the different spatio-temporal data can lead to relatively reliable judgments of the hydrological responses in this area.
3.2. Overview of Rainfall-Runoff Events
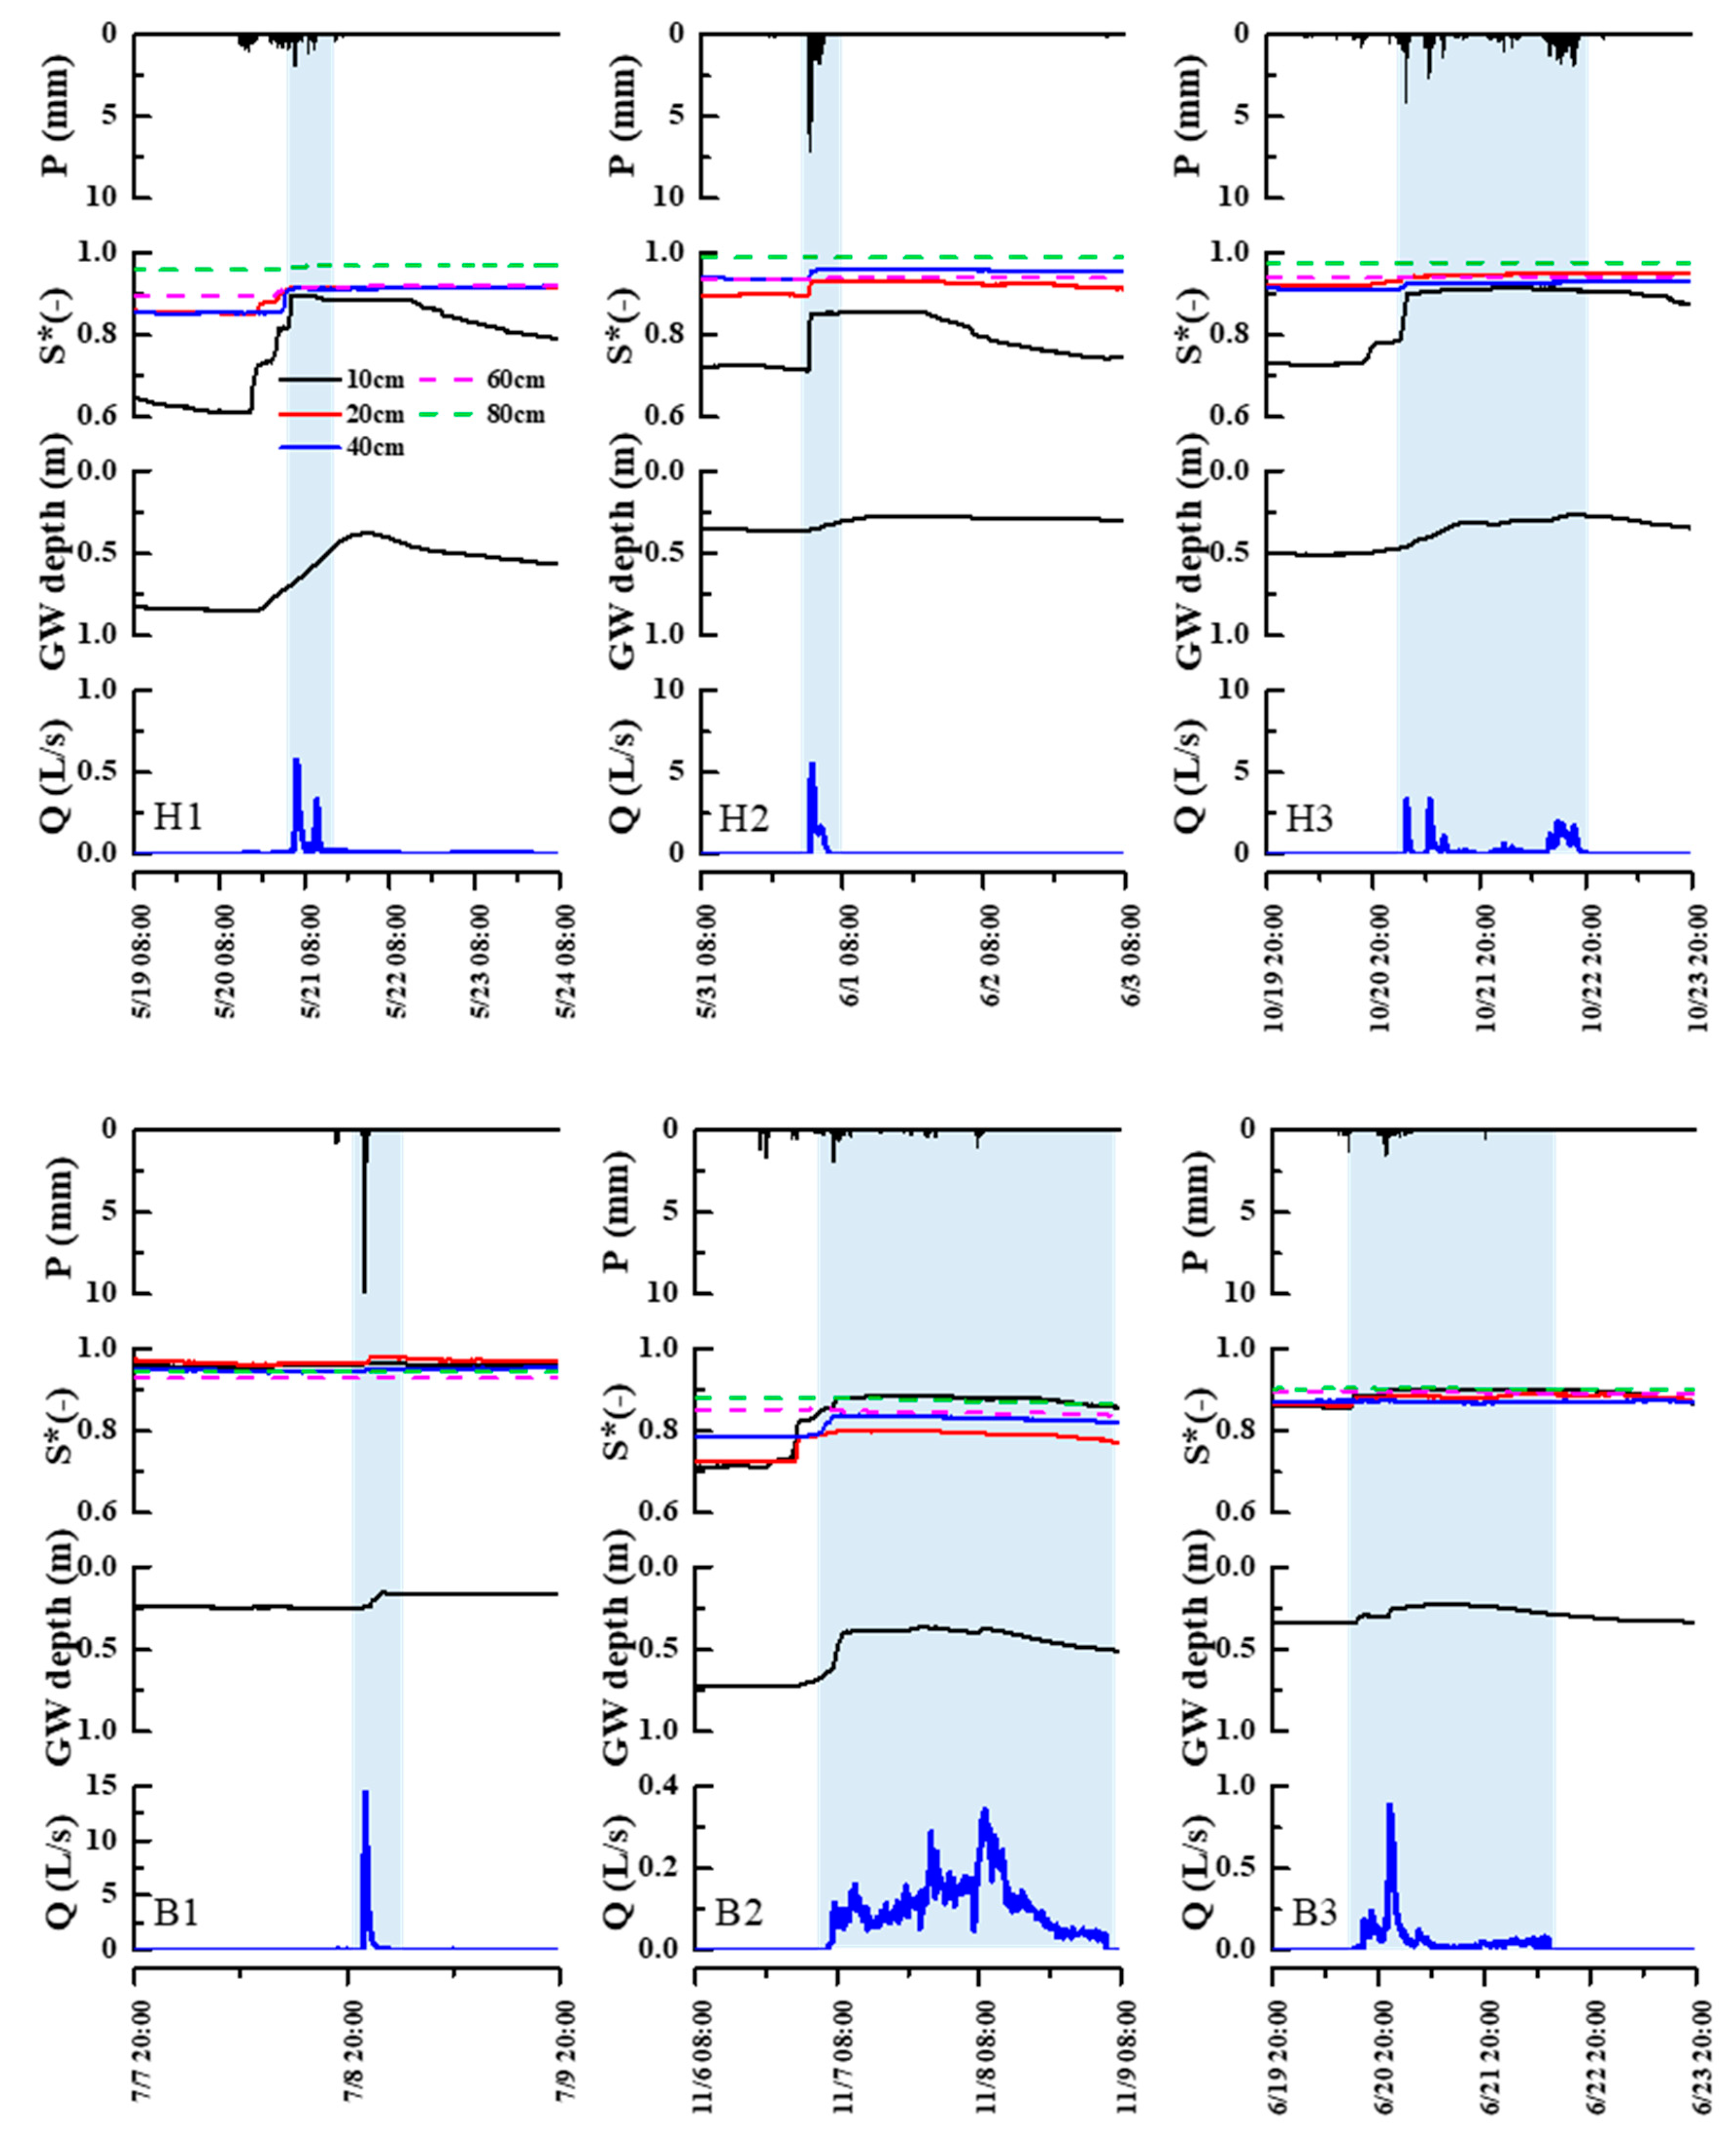
To investigate the hydrological behaviors of such fields at the event scale, six representative rainfall events were selected to analyze the rainfall and hydrological factors in rainfall–runoff events. Three of them were from 17 events in HQW, named H1, H2, and H3, respectively. The others, named B1, B2, and B3, were selected out of 12 events in BTQ. The rainfall and runoff characteristics of six events are summarized in Table 3. The selected events had high variations in the rainfall, runoff, and antecedent conditions, which shows general information on the runoff processes related to the soil water and groundwater dynamics.
The soil moistures at 10, 20, 40, 60, and 80 cm deep are plotted in Figure 4 as the relative saturation, i.e., a fraction of the total porosity. In the events H1, H2, H3, and B2, the soil moistures showed similar fast responses of a steep rise to the precipitation, especially at 10 cm deep, and the soil water content increased stage by stage with the rainfall impulse, then gradually decreased after the rainfall stopped. The phenomena of these sharp rises might due to the fast infiltration within 10 min, while the soil water data were measured only at 10-min intervals. With the increase in the soil layer, the increment of the soil moisture decreased and a longer response time was needed. However, in events B1 and B3, the topsoil was close to saturation due to the latest rainfall events two days ago. That’s why there were negligible increases during the next storm events. When the depth of the soil layer exceeded 60 cm, the soil moisture status had no significant change during all events, which implied the deeper soil layers kept saturation throughout the period.
Shallow groundwater also had a rapid reaction following the changes in the soil water dynamics to precipitation, but were generally in the form of relative gentle curves, which was due to the reduction in the rainfall impulse through the vertical infiltration processes. For the case of event B1, the sharp rise in the groundwater table was mainly caused by a high rainfall intensity of 22 mm/hr in the condition that the SWSC was 21.4 mm, which indicated the highest moisture status before precipitation in the six events. The groundwater level increased slightly in event H2 under a similar rainfall intensity of 28.4 mm/hr, but for a soil water saturation accounting for a higher proportion of infiltration due to the lower antecedent moisture status in this case. Hence, the variation in the groundwater response showed a strong interaction between the groundwater and soil water in this area. That is, the shallow water table dynamics were affected by the rainfall and antecedent soil moisture conditions together.
The soil water content at 10 cm deep reached relative saturation which was initiated by the surface runoff, which proves the existence of a Dunne overland flow. According to the hydrographs in the different runoff events (Figure 4), the runoff processes showed great differences in all events. The total volume of runoff varied with a factor of ten between the different locations, whereas the peak discharge differed by a factor of fifty during the events, although in the same location. The duration of events varied from 3 to 66 h, and the runoff coefficient varied from 0.11 to 0.73.
3.3. Rainfall–Runoff Relationships
The rainfall–runoff relationships were analyzed based on the precipitation, soil water, groundwater, and runoff data measured for the 29 events. Except for those arising from the runoff and water budget, the variables can be classified based on the runoff generation mechanisms: (a) precipitation intensity variables related to the infiltration excess runoff and (b) antecedent conditions and total precipitation related to the saturation excess runoff. The hydrological variables can be grouped as parameters related to the runoff data (peak discharge, total runoff, and runoff coefficient), and parameters related to the water balance of events (infiltration, the water table rises and depression storage). The Pearson correlation coefficients matrix is presented in Table 4.
3.3.1. Saturation Excess Runoff
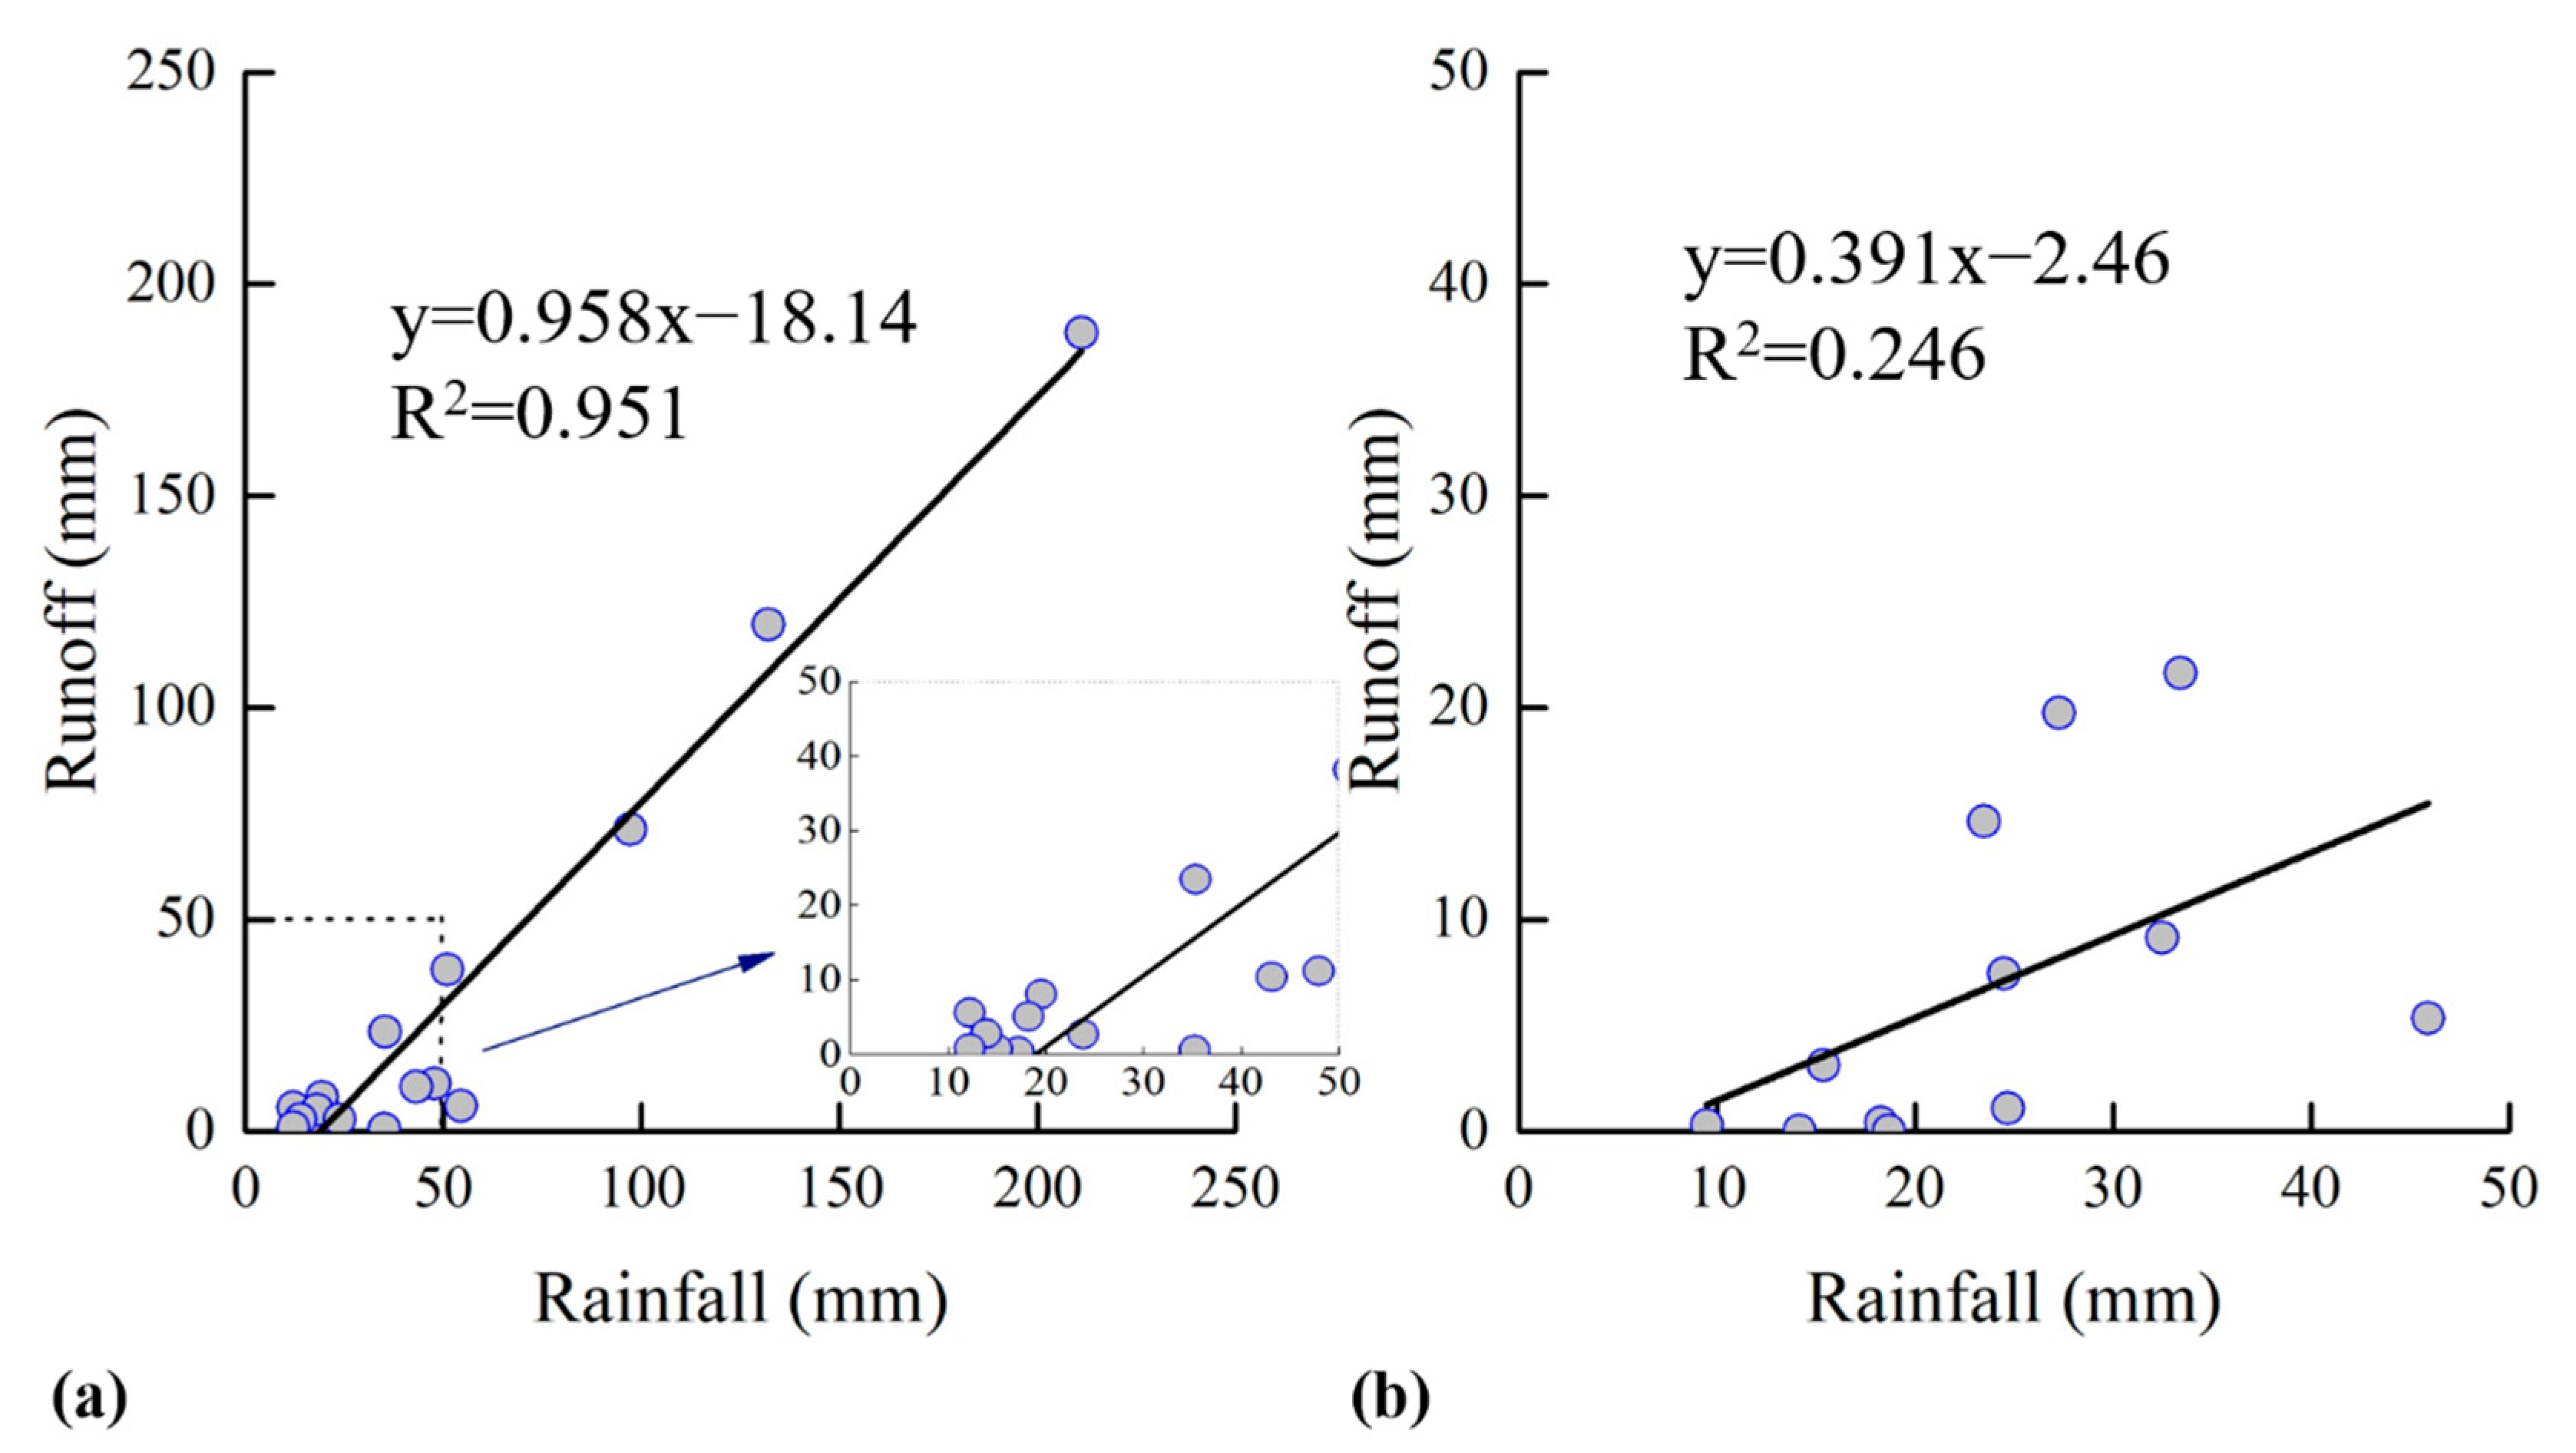
A significant relationship was found between the total runoff and total rainfall (p < 0.01) in HQW, which was presented by a linear function (Figure 5a). The fitting line with a determination coefficient (R2) reaching 0.95 was obtained from the different events in HQW, indicating the predominant role of saturation excess runoff in this area. The slope was close to 1, indicating the high ratio of the rainfall converting into runoff, which means this area was characterized by soil prone to saturation. On the one hand, it was found that the shallow groundwater made general antecedent wet conditions before runoff, according to the phenomena of topsoil from Figure 4. On the other hand, the porosity of the compact soil is smaller than that of the loose soil, so the amount of water for infiltration in this area is generally lower than those areas with relative loose soils under the same antecedent soil moisture condition, which is another reason for the slope close to 1. The interception of −18.14 mm could be considered as the threshold of rainfall depth that can trigger runoff processes. Also, the relationship between the runoff coefficient and total rainfall (Table 4a) means higher rainfall amounts result in a higher proportion of rainwater converted into the runoff, which supported the occurrence of a Dunne overland flow from another perspective. Besides, the total runoff was found to be positively correlated with the rainfall duration, although the correlation was clearly weakened when compared with the total rainfall.
There was no such strong correlation between the total precipitation and total runoff depth in BTQ, and the linear function for the fitting in Figure 5b had an R2 less than 0.3. This was because the rainfall events in the study period of BTQ were mainly light and moderate rain types. A total rainfall of more than 50 mm was recorded for two events, but we failed to collect their complete runoff processes due to the power outages of the automatic water pump caused by stormy weather. When the total rainfall was less than 50 mm, there were considerable uncertainties in the effects of the antecedent soil moisture, surface depression and vegetation interception. The runoff depth under the same total rainfall exhibited high variability in the different events, which resulted in the high nonlinearity in the relationship between the total rainfall and runoff. From the partially enlarged view in Figure 5a, the distribution of data points with total rainfall less than 50 mm in HQW also had similar characteristics of high nonlinearity, which is consistent with the result in a drained agricultural peat catchment in Malaysia [59].
Considering that HQW and BTQ are close to each other, the two sites have similar climate and topographical conditions as well as similar soil properties. Based on the analysis about the soil moisture dynamics in the typical events of BTQ which were presented in Figure 4, it is reasonable to infer that the saturation excess runoff is the main contribution to runoff processes in BTQ. This argument can be confirmed and verified under heavy rainfall conditions in further studies.
3.3.2. Infiltration Excess Runoff
The results from the Pearson analysis (Table 4) showed that total runoff and runoff coefficients were proved to link with the maximum rainfall intensity at the 0.05 level. It is clear that a higher maximum rainfall intensity can generally make a higher proportion of rainfall into a rapid flow with a higher runoff depth in this area. An infiltration excess runoff may also exist by inferring.
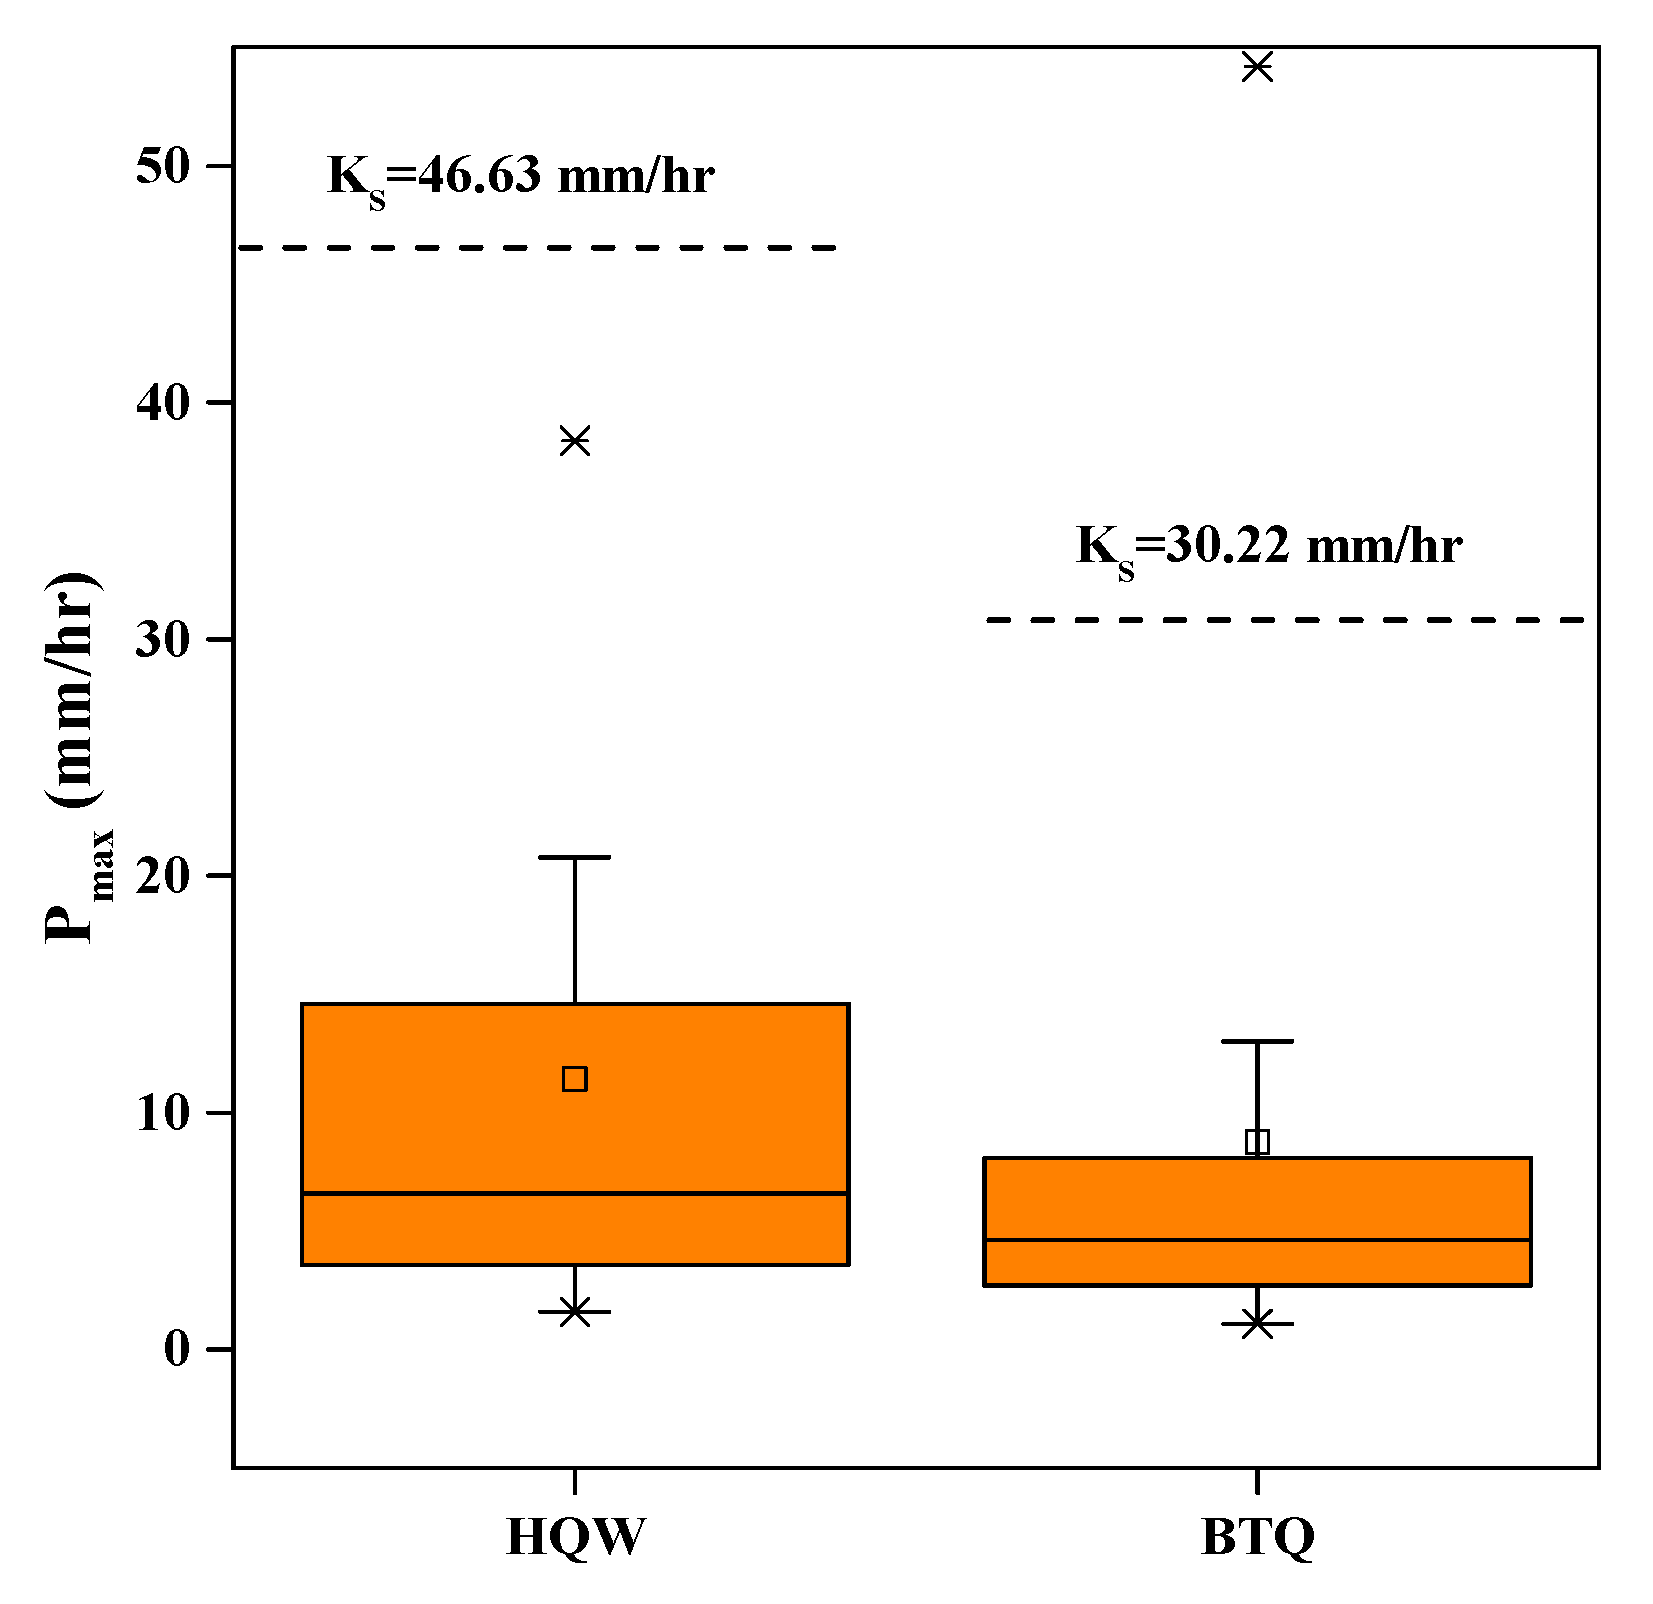
The data from the 29 rainfall events in HQW and 20 events in BTQ were summarized to gain an overview of the maximum rainfall intensities in Figure 6. The results showed the prevalence of low-intensity rainfall events in this area. The saturated hydraulic conductivities (KS) in the two sites were also marked to determine the infiltration excess process since KS is the bottom limit of the infiltration capacity. Except for very few points of extreme rainfall exceeding the limit, most peak rainfall intensities in the events were smaller than the threshold that can initiate an infiltration excess runoff. Even in extreme rainfall events, the Hortonian overland flow appears when the soil is not saturated. It may first cause surface ponding due to the low relief of this area, which is hard to drain out. Infiltration excess runoff is a rare process that is limited to extreme rainfall events in lowlands in the Taihu Basin.
3.4. Antecedent Conditions–Runoff Relationships
The runoff coefficient was negatively related to antecedent conditions such as the initial groundwater depth (Table 4). It shows that the runoff volume in the total rainfall is influenced by the antecedent soil moisture, which is the mechanism of the Dunne overland flow. The shallower location of the groundwater table and smaller soil water storage will result in a lower infiltration from rainwater which was proved by the correlations between the cumulative infiltration and pre-event groundwater table. In other words, more runoff will be produced in storm events with the same magnitude.
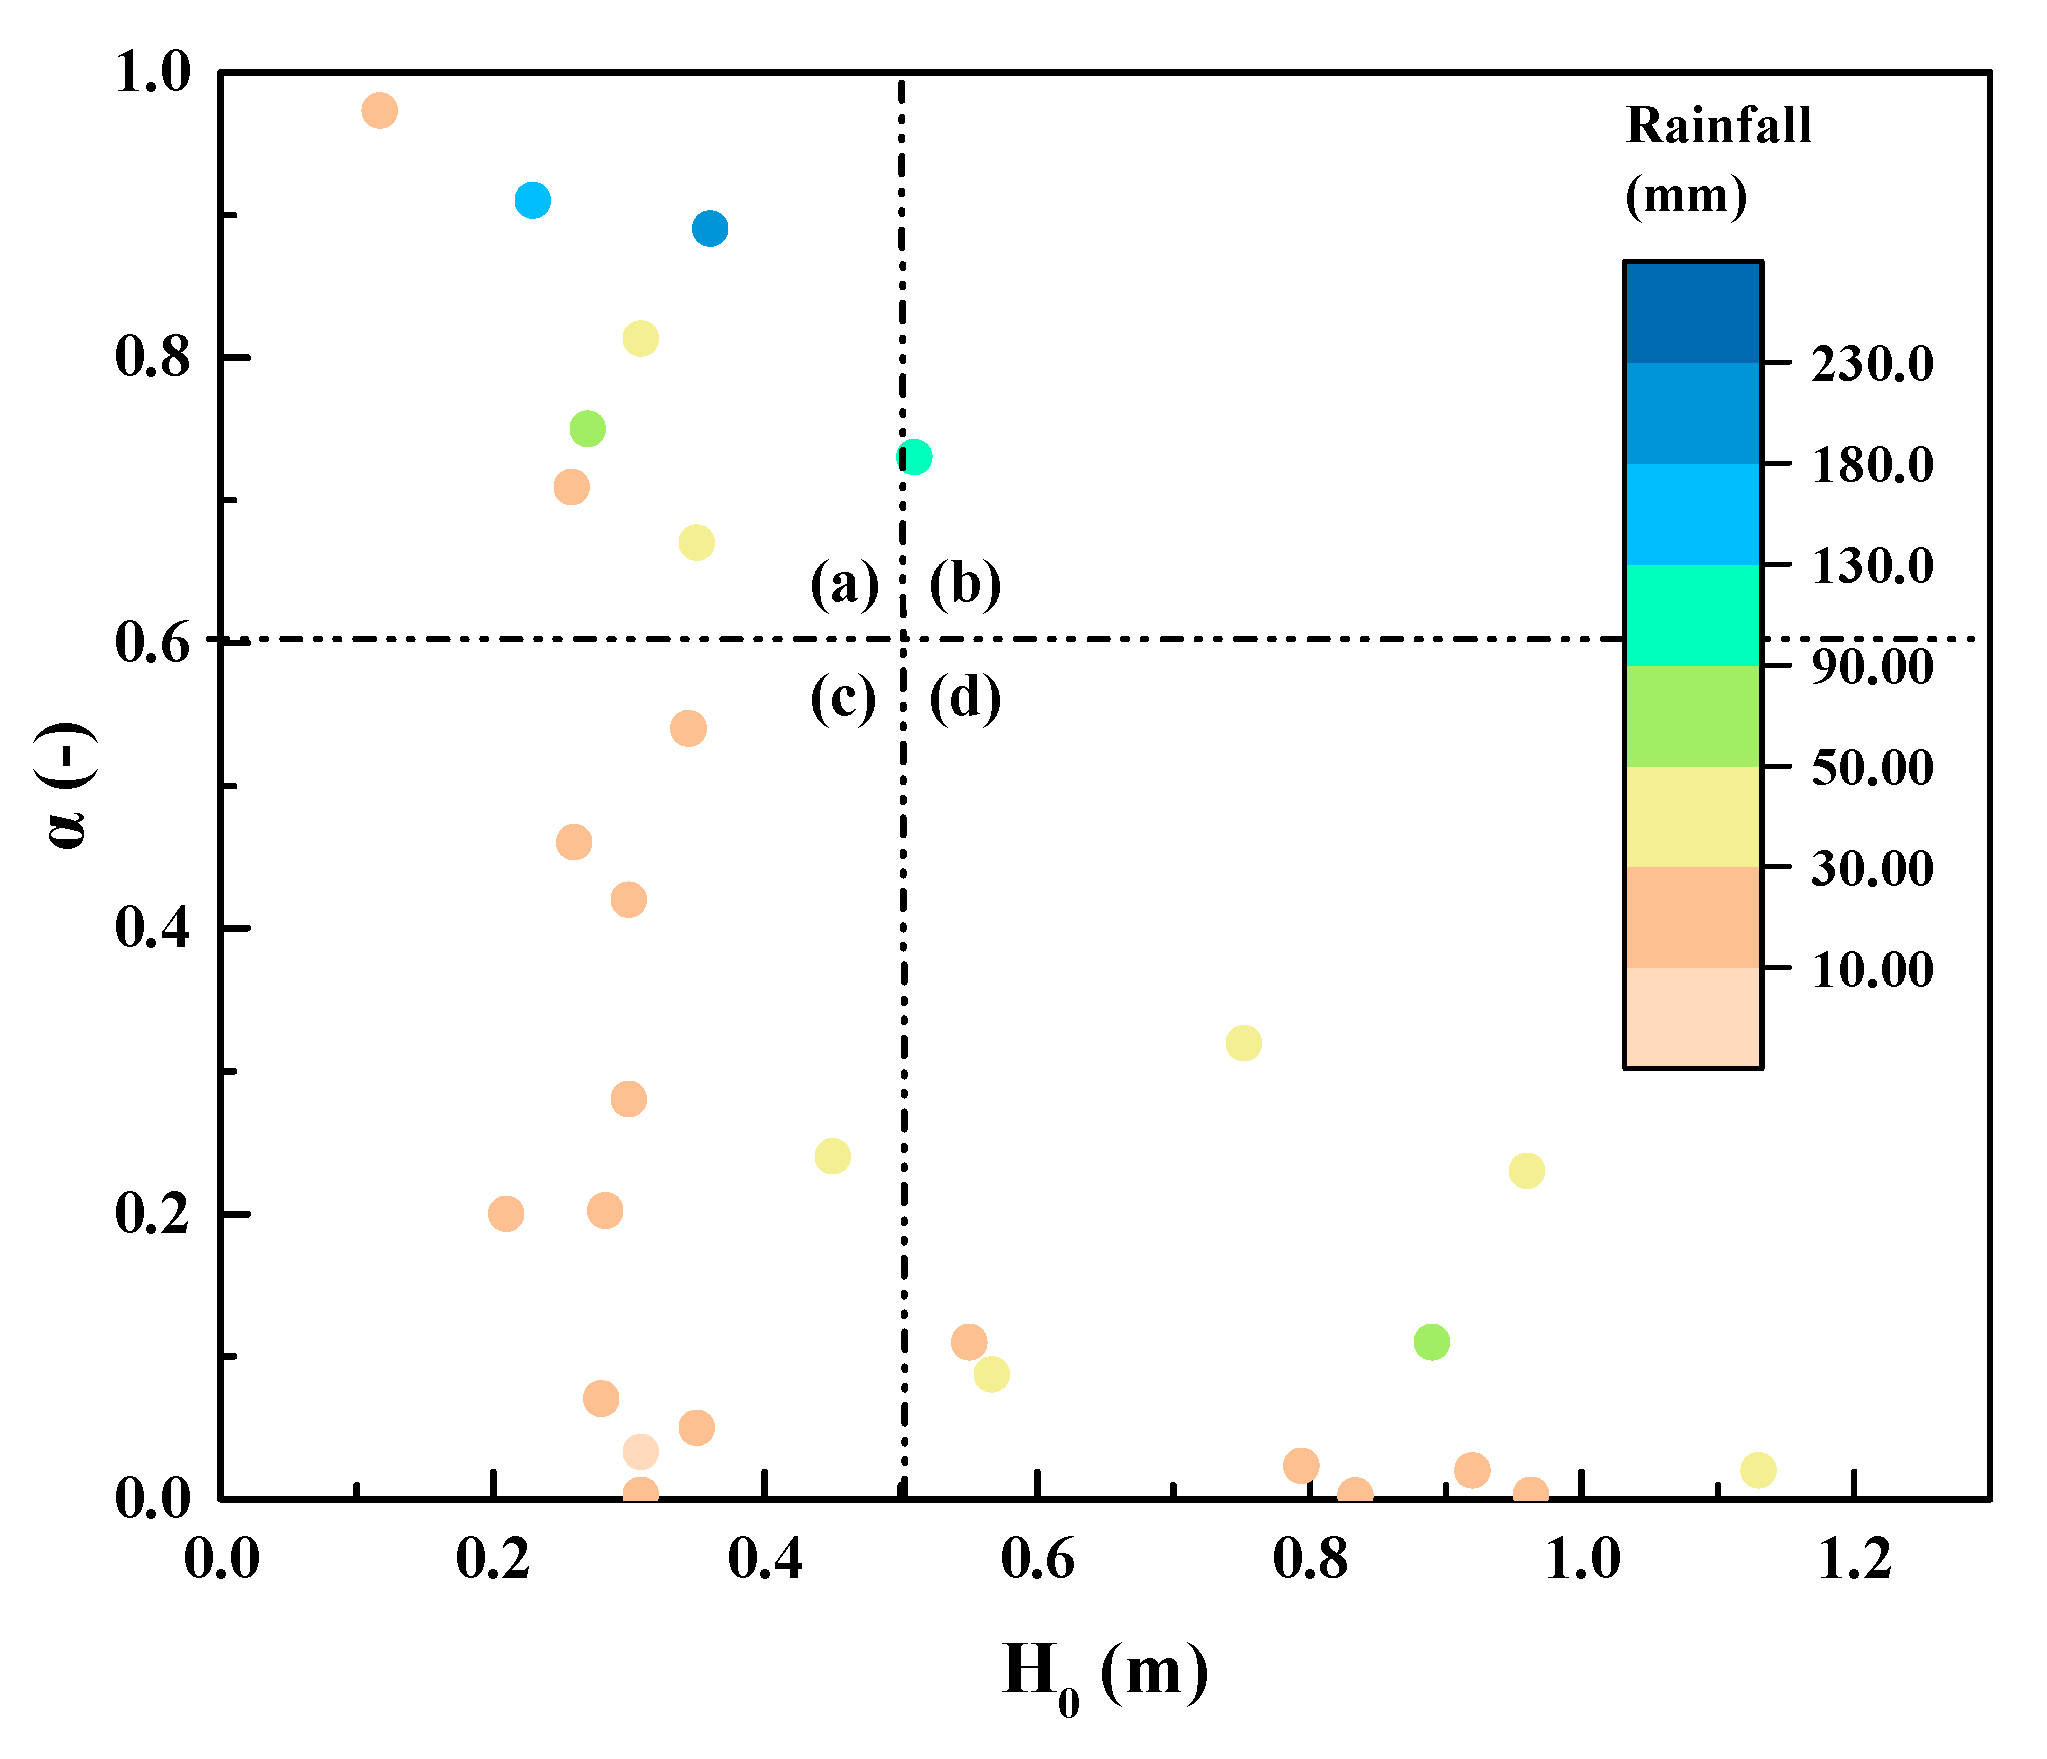
The relationship between the initial groundwater depth and runoff coefficient was plotted in Figure 7 under different rainfall magnitudes. There were no events with a runoff coefficient higher than 0.5 when the initial groundwater depth was deeper than 0.5 m. Those points of the initial groundwater depth within 0.5 m, which is in the left of the dotted straight line, showed high variations in runoff coefficients. These cases in the upper left part (Figure 7a) show that shallower water table conditions meet extreme rainfall events, which would result in great rapid flows and make this area vulnerable to flashfloods [60].
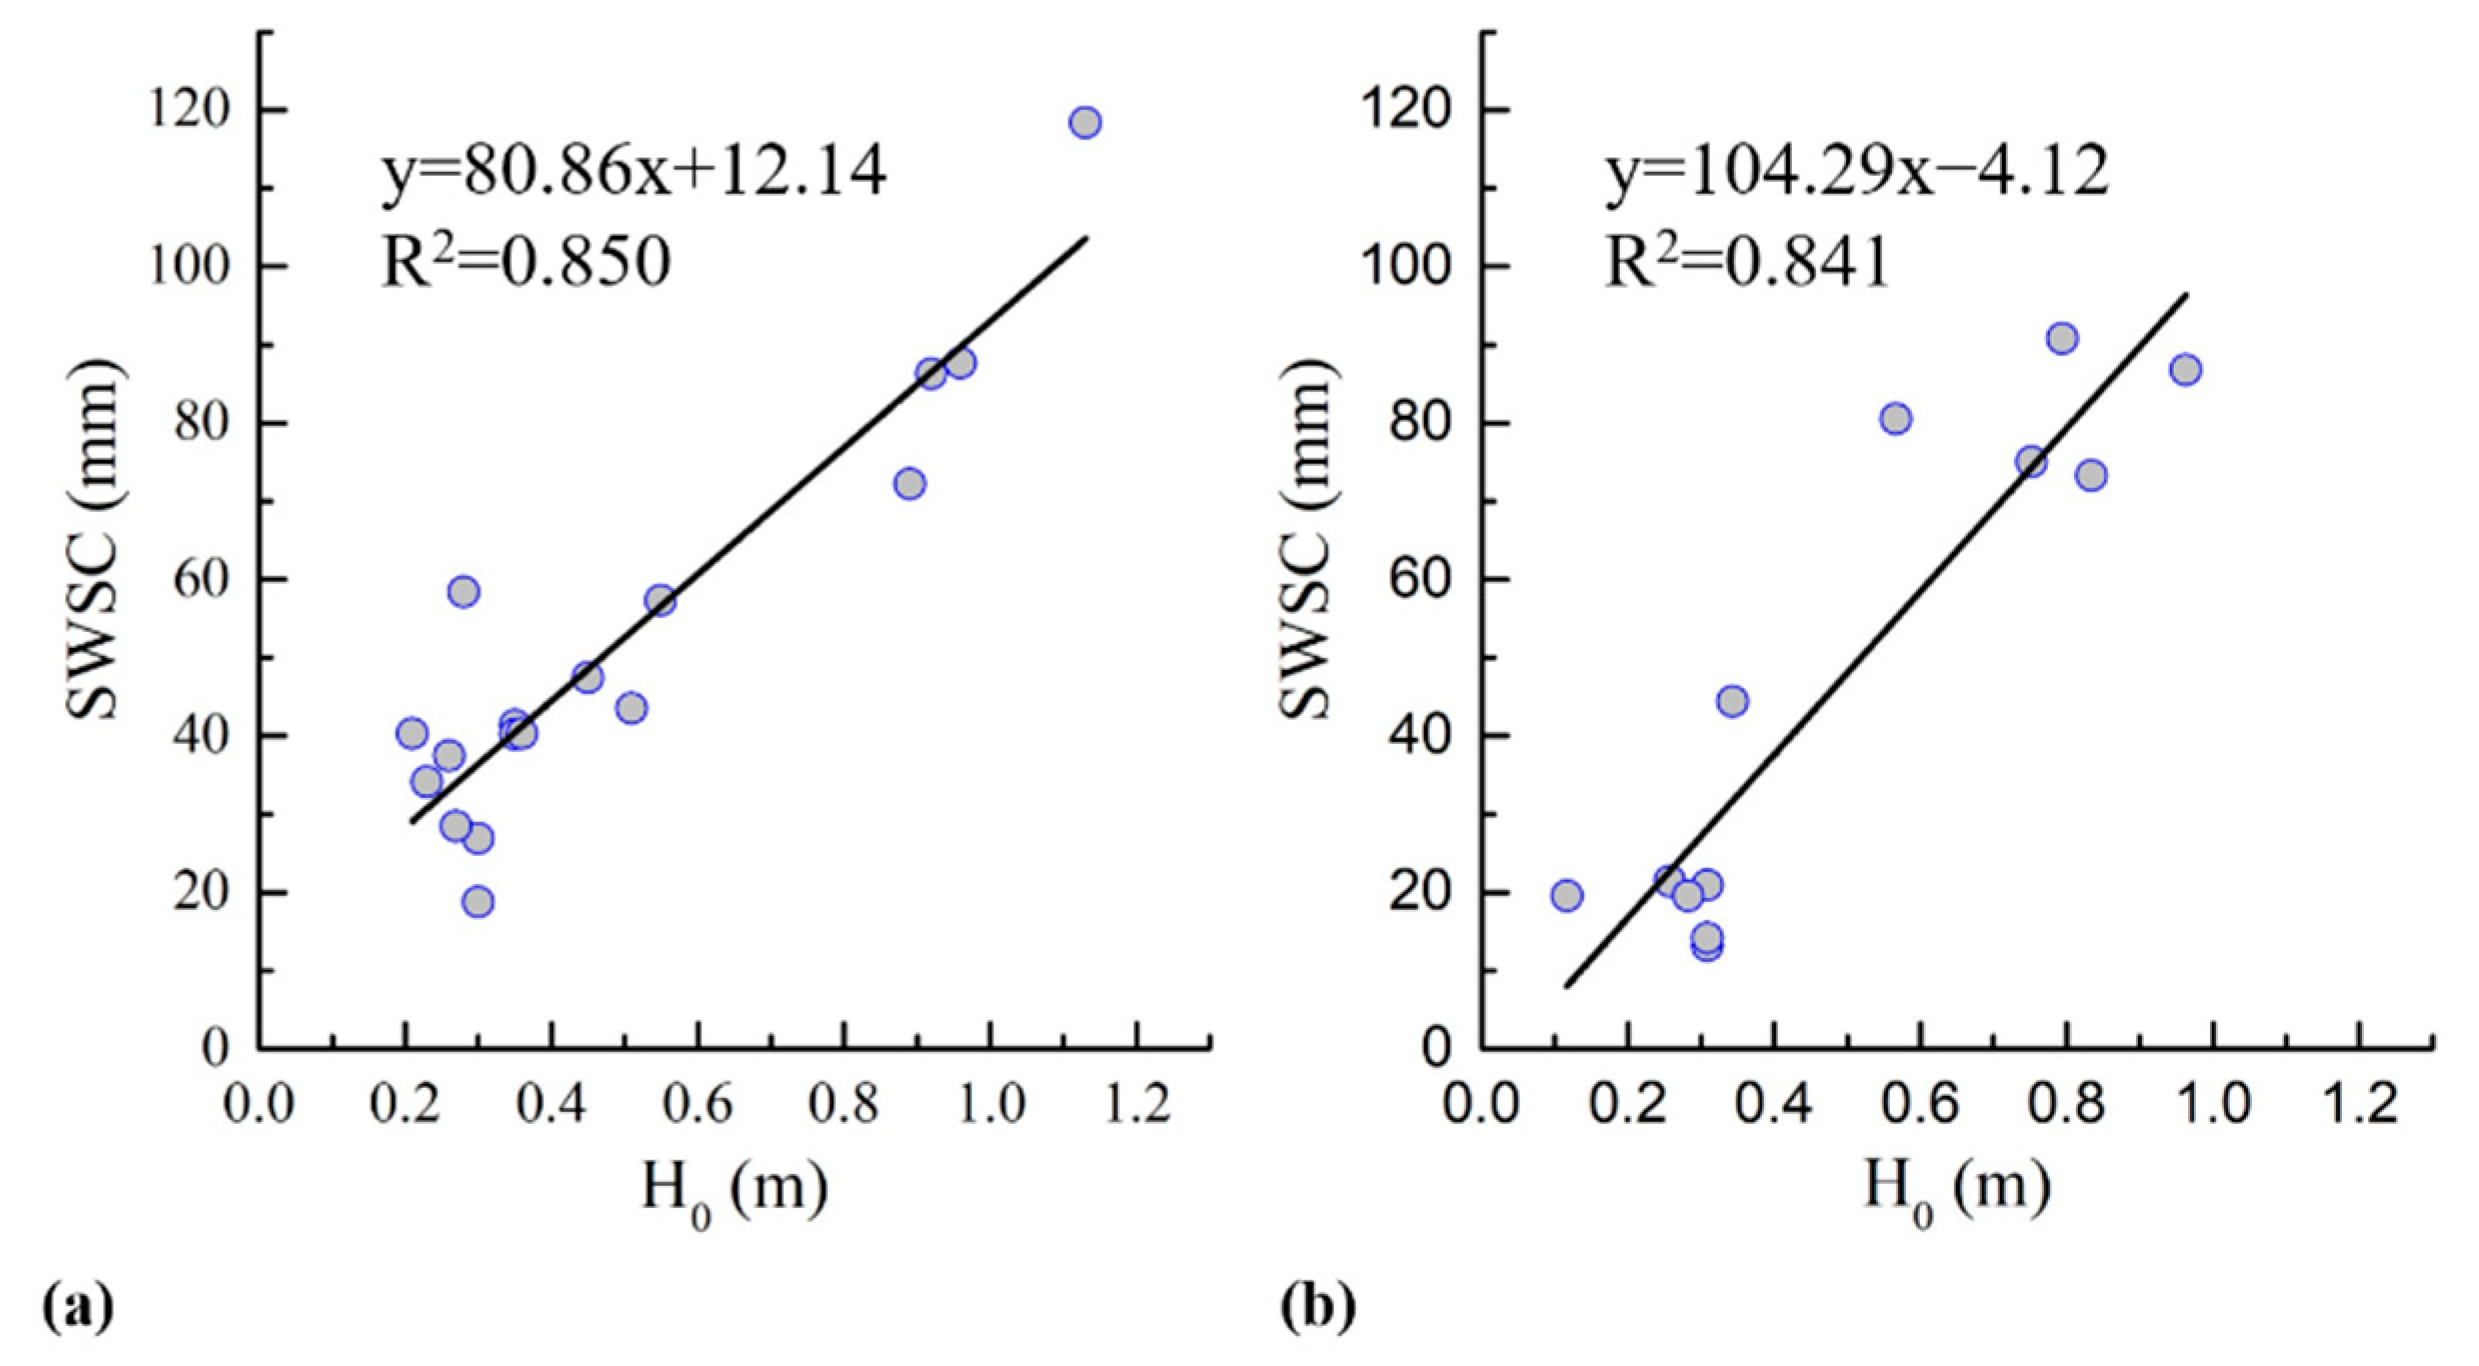
The value of the soil water storage capacity was considered as the realistic antecedent soil moisture condition, which is usually obtained from a proxy by other data like the antecedent precipitation index [61] for the difficulties of direct measurements in large scales. Good linear relationships are presented in Figure 8 between the SWSC and initial groundwater depth in HQW and BTQ, with the R2 reaching 0.85 and 0.84, respectively, which reflected the strong interactions between the shallow groundwater and soil water. This conclusion can also be obtained from a significant correlation between the two event conditions that are the increments of groundwater and cumulative infiltration. The discrepancy between the slope of the linear functions from the two locations may be the effects caused by the differences in the soils’ basic properties such as the particle composition and bulk density. The reciprocal of the slope from the two fitting functions may provide us a proxy of specific yield (Sy) for this soil type. Specific yield, known as one of the basic soil properties, is defined as the volume of water released per unit of the surface area of the soil column extending from the water table to the ground surface per unit decline in the water table level. This simple function can be used to estimate the SWSC when the groundwater table is available. It can also help us find meaningful indicators for the pre-event estimation of infiltration.
3.5. Depression Storage-Runoff Relationships
The depression storage from the water balance calculation of the 29 runoff events seemed to have no strong relationships with all of the variables listed in Table 4, which presented the uncertainty in the qualitative description about the relations with its potential controlling factors. The summarized depression storage values are listed in Table 5 for the two sites. The amounts of water stored in the depressions ranged from 0.29 to 18.86 mm in HQW, and from 0.19 to 12.13 mm in BTQ. The mean value was 6.20 mm, with a standard deviation of 4.75 mm for HQW, and the mean value was 6.63 mm for BTQ, with a standard deviation of 3.91 mm. The data distribution was similar for the different locations, and the slight difference in the average values may due to the different vegetation covered. It may be identified as a common loss to runoff with uncertainty in this area and can contribute to the interception of rainfall–runoff relations to some extent. The depression storage was studied by using a numerical model in the Netherlands [31]; however, this data cannot be used for validation. Therefore, considering the complexity in both the affecting factors and the influence on runoff, the depression storage was suggested roughly in the range of 4.72 to 8.03 mm at the confidence level of 0.95, calculated by a t-test based on the data we collected.
4. Discussion
The runoff generation processes in the lowland agricultural areas of the Taihu Basin were explored based on field studies and data analysis carried out in the study. Such lowland areas were characterized by frequent low-intensity rainfall events. The shallow groundwater dynamics were influenced by human activities such as drainage systems and agricultural production. In addition, the strong interaction between the shallow groundwater and soil water was significant. The soil prone to saturation, which was contributed to by the shallow groundwater depth, led to the prevailing saturation excess runoff. The threshold for initiating a Dunne overland flow was determined by the interception value of the linear rainfall–runoff relationships in Figure 5a. On the other hand, the infiltration excess runoff was found to be limited to extreme rainfall events by the comparison between the maximum rainfall intensities and the saturated hydraulic conductivities (Figure 6). The initial groundwater depth below the ground surface was suggested as a good indicator of antecedent conditions. The shallower groundwater table before the rainfall means that there are higher antecedent soil moisture conditions, which can derive a higher runoff coefficient. The linear relationship between the initial groundwater table and soil water storage capacity can be used to estimate the wetness situation in this area (Figure 8). The depression storage, which is common in low gradient areas during the rainfall period, was highly variable according to the correlation analysis and statistical summary from the runoff events.
The existence of both a Hortonian overland flow and Dunne overland flow demonstrated the multiple runoff generation mechanisms in lowlands, and the influence of multiple processes on the runoff response to rainfall events was also determined. This illustrates the necessity to consider a mixture of runoff mechanisms for the runoff processes studies rather than focusing on individual mechanisms [62]. The initial groundwater depth below the ground surface was suggested for the antecedent conditions estimation, which was developed on the qualitative conclusion that the groundwater table depth is an important parameter that influences the runoff formation in catchments [51]. The rough value range of the depression storage was also mentioned, which was meaningful together with the initial groundwater depth for the parameter selection and value range in the numerical simulation.
Some field experiments have been done for hydrology research at the field scale [51]. The method used in this paper, which combined field experiments and the water balance at the event scale, effectively identified the rationality and accuracy of the monitoring data and provided a good basis for quantitative research on the runoff mechanism. Besides, water balance helps to form more comprehensive understandings of the runoff process and possible factors influencing this process, so a targeted correlation analysis could be conducted. This method of combining this field experiment with water balance was proved to be practical and meaningful in similar research.
Based on the above analysis, it can be concluded that the runoff in the Taihu Lake area is dominated by a saturation excess runoff. The precipitation, groundwater depth and the low-relief in the plain area are important factors affecting the runoff in this area, which helps to better understand the runoff production in humid lowland regions with similar characteristics. It was worth noticing that all the above conclusions were derived from the data on the field scale. In fact, these results were found consistent with the previous research results on the basin scale in similar regions [31,59,62]. These results could provide a basis for future research on the effects of spatial scale on the runoff mechanisms in such humid lowland areas.
5. Conclusions
Field measurements were conducted in two typical lowland agricultural plots located in Jintan, Changzhou, China. The continuously monitored data with ten-minute intervals contained the rainfall, evapotranspiration, soil moisture, groundwater table, and surface water dynamics. Based on the analysis of water balance and the Pearson correlation during the different rainfall–runoff events, the main conclusions are summarized below:
- The prevalence of small intensity rainfall events and soils prone to saturation promoted the predominant role of the saturation excess runoff in the runoff responses, while the infiltration excess runoff was limited in extreme storm events, indicating that multiple runoff processes existed in the area. The strong linear relationship between the total rainfall and runoff confirmed this point of view.
- A good linear positive correlation was found between the initial groundwater depth and the soil water storage capacity before the rainfall events, which reflected the strong interactions between the shallow groundwater and soil water in this area.
- The depression storage value calculated by the water balance was suggested in a rough proxy, which was meaningful for the value range of this parameter in the numerical simulation.
The study, based on plot studies, was practicable as other researchers had discussed that the mechanisms found at the plot scale could make sense when upscaled to the catchment scale [39]. Furthermore, the results and conclusion were only based on the water balance. The isotope tracers which are a powerful tool to uncover the inner relationship between the runoff and related field characteristics should be capable of proving our results and should be considered in further studies.
Author Contributions
The fieldwork was conducted by Y.Z., C.W. (Chuanhai Wang), G.C., C.W. (Chun Wang), X.L. and Y.L.; this paper was written by Y.Z.; C.W. (Chuanhai Wang) and G.C. reviewed and improved the manuscript with comments; the data compilation and statistical analyses were completed by all authors. All authors have read and agreed to the published version of the manuscript.
Funding
This research has been financially supported by the National Key Research and Development Program of China (2018YFC1508200), Project 41901020 supported by NSFC, and the Fundamental Research Funds for the Central Universities (B200202030).
Conflicts of Interest
The authors declare no conflict of interest.
References
- Hua, L.; Zhai, L.; Liu, J.; Liu, H.; Zhang, F.; Fan, X. Effect of irrigation-drainage unit on phosphorus interception in paddy field system. J. Environ. Manage. 2019, 235, 319–327. [Google Scholar] [CrossRef]
- Brauer, C.C.; Teuling, A.J.; Torfs, P.J.J.F.; Uijlenhoet, R. The Wageningen Lowland Runoff Simulator (WALRUS): a lumped rainfall–runoff model for catchments with shallow groundwater. Geosci. Model Dev. 2014, 7, 2313–2332. [Google Scholar] [CrossRef] [Green Version]
- Yan, R.; Li, L.; Gao, J. Framework for quantifying rural NPS pollution of a humid lowland catchment in Taihu Basin, Eastern China. Sci. Total Environ. 2019, 688, 983–993. [Google Scholar] [CrossRef] [PubMed]
- Neumann, B.; Vafeidis, A.T.; Zimmermann, J.; Nicholls, R.J. Future coastal population growth and exposure to sea-level rise and coastal flooding-A global assessment. PLoS ONE 2015, 10, e0118571. [Google Scholar] [CrossRef] [PubMed]
- Yu, L.; Rozemeijer, J.; van Breukelen, B.M.; Ouboter, M.; van der Vlugt, C.; Broers, H.P. Groundwater impacts on surface water quality and nutrient loads in lowland polder catchments: monitoring the greater Amsterdam area. Hydrol. Earth Syst. Sci. 2018, 22, 487–508. [Google Scholar] [CrossRef] [Green Version]
- Smith, A.; Tetzlaff, D.; Gelbrecht, J.; Kleine, L.; Soulsby, C. Riparian wetland rehabilitation and beaver re-colonization impacts on hydrological processes and water quality in a lowland agricultural catchment. Sci. Total Environ. 2020, 699, 134302. [Google Scholar] [CrossRef]
- Colombani, N.; Mastrocicco, M.; Castaldelli, G.; Aravena, R. Contrasting biogeochemical processes revealed by stable isotopes of H2O, N, C and S in shallow aquifers underlying agricultural lowlands. Sci. Total Environ. 2019, 691, 1282–1296. [Google Scholar] [CrossRef]
- Wheater, H.S.; Peach, D. Developing interdisciplinary science for integrated catchment management: the UK lowland catchment research (LOCAR) programme. Int. J. Water Resour. Dev. 2004, 20, 369–385. [Google Scholar] [CrossRef] [Green Version]
- Xiang, J.; Xu, Y.; Yuan, J.; Wang, Q.; Wang, J.; Deng, X. Multifractal Analysis of River Networks in an Urban Catchment on the Taihu Plain, China. Water 2019, 11, 2283. [Google Scholar] [CrossRef] [Green Version]
- Uhlenbrook, S. Catchment hydrology—a science in which all processes are preferential. Hydrol. Process. 2006, 20, 3581–3585. [Google Scholar] [CrossRef]
- Yan, R.; Gao, J.; Huang, J. Modelling the hydrological processes of a Chinese lowland polder and identifying the key factors using an improved PHPS model. J. Hydrol. 2019, 578, 124083. [Google Scholar] [CrossRef]
- Kuchment, L.S. The Hydrological Cycle and Human Impact on it. In Water Resources Management; Hoekstra, A.Y., Savenije, H.H.G., Eds.; Eolss Publishers: Oxford, UK, 2004. [Google Scholar]
- Uhlenbrook, S.; Didszun, J.; Wenninger, J. Source areas and mixing of runoff components at the hillslope scale—a multi-technical approach. Hydrol. Sci. J. 2008, 53, 741–753. [Google Scholar] [CrossRef] [Green Version]
- Horton, R.E. The Rôle of infiltration in the hydrologic cycle. Eos, Trans. Am. Geophys. Union 1933, 14, 446–460. [Google Scholar] [CrossRef]
- Dunne, T.; Black, R.D. An Experimental Investigation of Runoff Production in Permeable Soils. Water Resour. Res. 1970, 6, 478–490. [Google Scholar] [CrossRef]
- Hewlett, J.D.; Hibbert, A.R. Factors Affecting the Response of Small Watersheds to Precipitation in Humid Areas; International Symposium on Forest Hydrology: Pergamon, Oxford, 1967. [Google Scholar]
- Guinn Garrett, C.; Vulava, V.M.; Callahan, T.J.; Jones, M.L. Groundwater-surface water interactions in a lowland watershed: source contribution to stream flow. Hydrol. Process. 2012, 26, 3195–3206. [Google Scholar] [CrossRef]
- Song, S.; Wang, W. Impacts of Antecedent Soil Moisture on the Rainfall-Runoff Transformation Process Based on High-Resolution Observations in Soil. Water 2019, 11, 296. [Google Scholar] [CrossRef] [Green Version]
- Bracken, L.J.; Croke, J. The concept of hydrological connectivity and its contribution to understanding runoff-dominated geomorphic systems. Hydrol. Process. 2007, 21, 1749–1763. [Google Scholar] [CrossRef]
- Slattery, M.C.; Gares, P.A.; Phillips, J.D. Multiple modes of storm runoff generation in a North Carolina coastal plain watershed. Hydrol. Process. 2006, 20, 2953–2969. [Google Scholar] [CrossRef]
- Andersen, H.E. Hydrology and nitrogen balance of a seasonally inundated Danish floodplain wetland. Hydrol. Process. 2004, 18, 415–434. [Google Scholar] [CrossRef]
- Haidu, I.; Ivan, K. Ponds delineation in various urban landforms. Case study for cluj-napoca, Romania. Environ. Eng. Manag. J. 2016, 15, 1379–1386. [Google Scholar] [CrossRef]
- Rossi, M.J.; Ares, J.O. Water fluxes between inter-patches and vegetated mounds in flat semiarid landscapes. J. Hydrol. 2017, 546, 219–229. [Google Scholar] [CrossRef]
- Brauer, C.C.; Teuling, A.J.; Overeem, A.; van der Velde, Y.; Hazenberg, P.; Warmerdam, P.M.M.; Uijlenhoet, R. Anatomy of extraordinary rainfall and flash flood in a Dutch lowland catchment. Hydrol. Earth Syst. Sci. 2011, 15, 1991–2005. [Google Scholar] [CrossRef] [Green Version]
- Sun, G.; Boggs, J.; McNulty, S.G.; Amatya, D.M.; Trettin, C.C.; Dai, Z. Hydrologic processes of forested headwater watersheds across a physiographic gradient in the southeastern United States. In Proceedings of the 2008 South Carolina Water Resources Conference, Charleston, SC, USA, 14–15 October 2008; Miscellaneous Publication: Asheville, NC, USA, 2008. [Google Scholar]
- Vansteelant, J.; Trévisan, D.; Perron, L.; Dorioz, J.; Roybin, D. Frequency of runoff in the cropped area of the French basin of Lac Leman. Agronomie 1997, 17, 65–82. [Google Scholar] [CrossRef]
- Warsta, L.; Karvonen, T.; Koivusalo, H.; Paasonen-Kivekäs, M.; Taskinen, A. Simulation of water balance in a clayey, subsurface drained agricultural field with three-dimensional FLUSH model. J. Hydrol. 2013, 476, 395–409. [Google Scholar] [CrossRef]
- Sweet, W.V.; Geratz, J.W. Bankfull hydraulic geometry relationships and recurrence intervals for North Carolina’s coastal plain. J. Am. Water Resour. Assoc. 2003, 39, 861–871. [Google Scholar] [CrossRef]
- Zimmer, M.A.; McGlynn, B.L. Ephemeral and intermittent runoff generation processes in a low relief, highly weathered catchment. Water Resour. Res. 2017, 53, 7055–7077. [Google Scholar] [CrossRef]
- Tarasova, L.; Basso, S.; Zink, M.; Merz, R. Exploring Controls on Rainfall-Runoff Events: 1. Time Series-Based Event Separation and Temporal Dynamics of Event Runoff Response in Germany. Water Resour. Res. 2018, 54, 7711–7732. [Google Scholar] [CrossRef]
- Appels, W.M.; Bogaart, P.W.; van der Zee, S.E.A.T.M. Surface runoff in flat terrain: How field topography and runoff generating processes control hydrological connectivity. J. Hydrol. 2016, 534, 493–504. [Google Scholar] [CrossRef]
- Pyzoha, J.E.; Callahan, T.J.; Sun, G.; Trettin, C.C.; Miwa, M. A conceptual hydrologic model for a forested Carolina bay depressional wetland on the Coastal Plain of South Carolina, USA. Hydrol. Process. 2008, 22, 2689–2698. [Google Scholar] [CrossRef]
- Krause, S.; Bronstert, A. The impact of groundwater–surface water interactions on the water balance of a mesoscale lowland river catchment in northeastern Germany. Hydrol. Process. 2007, 21, 169–184. [Google Scholar] [CrossRef]
- Woodward, S.J.R.; Stenger, R.; Bidwell, V.J. Dynamic analysis of stream flow and water chemistry to infer subsurface water and nitrate fluxes in a lowland dairying catchment. J. Hydrol. 2013, 505, 299–311. [Google Scholar] [CrossRef]
- Naughton, O.; Johnston, P.M.; McCormack, T.; Gill, L.W. Groundwater flood risk mapping and management: examples from a lowland karst catchment in Ireland. J. Flood Risk Manag. 2017, 10, 53–64. [Google Scholar] [CrossRef] [Green Version]
- Sofia, G.; Ragazzi, F.; Giandon, P.; Dalla Fontana, G.; Tarolli, P. On the linkage between runoff generation, land drainage, soil properties, and temporal patterns of precipitation in agricultural floodplains. Adv. Water Resour. 2019, 124, 120–138. [Google Scholar] [CrossRef]
- Kirchner, J.W. Getting the right answers for the right reasons: Linking measurements, analyses, and models to advance the science of hydrology. Water Resour. Res. 2006, 42, 1–5. [Google Scholar] [CrossRef]
- Blume, T.; van Meerveld, I.; Weiler, M. The role of experimental work in hydrological sciences – insights from a community survey. Hydrol. Sci. J. 2016, 62, 334–337. [Google Scholar] [CrossRef] [Green Version]
- van der Velde, Y.; Rozemeijer, J.C.; de Rooij, G.H.; van Geer, F.C.; Broers, H.P. Field-Scale Measurements for Separation of Catchment Discharge into Flow Route Contributions. Vadose Zone J. 2010, 9, 25–35. [Google Scholar] [CrossRef]
- Lana-Renault, N.; Latron, J.; Regüés, D. Streamflow response and water-table dynamics in a sub-Mediterranean research catchment (Central Pyrenees). J. Hydrol. 2007, 347, 497–507. [Google Scholar] [CrossRef]
- van den Eertwegh, G.A.P.H.; Nieber, J.L.; de Louw, P.G.B.; van Hardeveld, H.A.; Bakkum, R. Impacts of drainage activities for clay soils on hydrology and solute loads to surface water. Irrig. Drain. 2006, 55, 235–245. [Google Scholar] [CrossRef]
- Ren, D.; Xu, X.; Huang, Q.; Huo, Z.; Xiong, Y.; Huang, G. Analyzing the Role of Shallow Groundwater Systems in the Water Use of Different Land-Use Types in Arid Irrigated Regions. Water 2018, 10, 634. [Google Scholar] [CrossRef] [Green Version]
- Estrany, J.; Garcia, C.; Batalla, R.J. Hydrological response of a small mediterranean agricultural catchment. J. Hydrol. 2010, 380, 180–190. [Google Scholar] [CrossRef]
- Sutcliffe, J.V. Water Balance. In Hydrology: A Question of Balance; Sutcliffe, J.V., Ed.; IAHS: Wallingford, UK, 2004; pp. 91–128. [Google Scholar]
- Qingfang, H.; Leizhi, W.; Yintang, W.; Lingjie, L.; Yong, L.; Tingting, C. Vegetation coverage dynamics and its response to urbanization in the Taihu Lake Basin during 1998~2010. In Proceedings of the 2019 International Conference on Civil and Hydraulic Engineering, Nanjing, China; IOP, 2019. Available online: https://iopscience.iop.org/article/10.1088/1755-1315/304/2/022023 (accessed on 23 April 2020).
- Ying, P.; Jie, L.; Guang-chen, T.; Peng, T.; Jin-chi, Z.; Zhe-yan, G. Spatio-Temporal Variations of Vegetation Coverage in Taihu Lake Basin From 2004 to 2014. J. Ecol. Rural Environ. 2018, 34, 37–45. [Google Scholar]
- Hua, W.; Wang, C.; Chen, G.; Yang, H.; Zhai, Y. Measurement and Simulation of Soil Water Contents in an Experimental Field in Delta Plain. Water 2017, 9, 947. [Google Scholar] [CrossRef] [Green Version]
- Staff, S.S.D. Soil Survey Manual; U.S. Department of Agriculture: Government Printing Office: Washington, DC, USA, 2017; pp. 120–126.
- Topp, G.C.; Davis, J.L.; Annan, A.P. Electromagnetic determination of soil water content: Measurements in coaxial transmission lines. Water Resour. Res. 1980, 16, 574–582. [Google Scholar] [CrossRef] [Green Version]
- Amatya, D.; Gregory, J.; Skaggs, R. Effects of controlled drainage on storm event hydrology in a loblolly pine plantation. J. Am. Water Resour. Assoc. 2000, 36, 175–190. [Google Scholar] [CrossRef]
- Han, S.; Xu, D.; Wang, S. Runoff formation from experimental plot, field, to small catchment scales in agricultural North Huaihe River Plain, China. Hydrol. Earth Syst. Sci. 2012, 16, 3115–3125. [Google Scholar] [CrossRef] [Green Version]
- Zhao, L.; Hou, R.; Wu, F.; Keesstra, S. Effect of soil surface roughness on infiltration water, ponding and runoff on tilled soils under rainfall simulation experiments. Soil Tillage Res. 2018, 179, 47–53. [Google Scholar] [CrossRef]
- Rossi, M.J.; Ares, J.O. Overland flow from plant patches: Coupled effects of preferential infiltration, surface roughness and depression storage at the semiarid Patagonian Monte. J. Hydrol. 2016, 533, 603–614. [Google Scholar] [CrossRef]
- Nachabe, M.; Masek, C.; Obeysekera, J. Observations and Modeling of Profile Soil Water Storage above a Shallow Water Table. Soil Sci. Soc. Am. J. 2004, 68, 719–724. [Google Scholar] [CrossRef]
- La Torre Torres, I.B.; Amatya, D.M.; Sun, G.; Callahan, T.J. Seasonal rainfall-runoff relationships in a lowland forested watershed in the southeastern USA. Hydrol. Process. 2011, 25, 2032–2045. [Google Scholar] [CrossRef]
- Soler, M.; Regüés, D.; Latron, J.; Gallart, F. Flood and sediment transport response to hydrometeorological events of diverse magnitude in the Vallcebre basin, Eastern Pyrenees. In Sediment Dynamics and the Hydromorphology of Fluvial Systems; IAHS: Allingford, UK, 2006; Volume 306, pp. 56–63. [Google Scholar]
- Chen, B.; Krajewski, W.F.; Helmers, M.J.; Zhang, Z. Spatial Variability and Temporal Persistence of Event Runoff Coefficients for Cropland Hillslopes. Water Resour. Res. 2019, 55, 1583–1597. [Google Scholar] [CrossRef]
- Zhang, Y.; Yang, N.; Xu, J.; Yin, Y. Long-Term Study of the Relationship between Precipitation and Aquatic Vegetation Succession in East Taihu Lake, China. Scientifica 2017, 2017, 6345138. [Google Scholar] [CrossRef]
- Katimon, A.; Shahid, S.; Khairi Abd Wahab, A.; Ali, M.H. Hydrological behaviour of a drained agricultural peat catchment in the tropics. 1: Rainfall, runoff and water table relationships. Hydrol. Sci. J. 2013, 58, 1297–1309. [Google Scholar] [CrossRef]
- Garg, S.; Mishra, V. Role of Extreme Precipitation and Initial Hydrologic Conditions on Floods in Godavari River Basin, India. Water Resour. Res. 2019, 55, 9191–9210. [Google Scholar] [CrossRef]
- Zhao, S.; Hu, H.; Harman, C.J.; Tian, F.; Tie, Q. Understanding of Storm Runoff Generation in a Weathered, Fractured Granitoid Headwater Catchment in Northern China. Water 2019, 11, 123. [Google Scholar] [CrossRef] [Green Version]
- Saffarpour, S.; Western, A.W.; Adams, R.; McDonnell, J.J. Multiple runoff processes and multiple thresholds control agricultural runoff generation. Hydrol. Earth Syst. Sci. 2016, 20, 4525–4545. [Google Scholar] [CrossRef] [Green Version]
Figure 1.
Test site layout: (a) sites of the study in the Taihu Basin; (b) surface elevation and instrumentation in the Hongqiwei (HQW) site; (c) surface elevation and instrumentation in the Baitaqiao (BTQ) site.
Figure 1.
Test site layout: (a) sites of the study in the Taihu Basin; (b) surface elevation and instrumentation in the Hongqiwei (HQW) site; (c) surface elevation and instrumentation in the Baitaqiao (BTQ) site.

Figure 2.
Measuring instruments: (a) the V-notch weir at the outlet; (b) the soil water profile measuring sensors.
Figure 2.
Measuring instruments: (a) the V-notch weir at the outlet; (b) the soil water profile measuring sensors.

Figure 3.
Daily rainfall depth (P), evaporation (E), groundwater depth (GW depth), and volumetric soil water content (VWC) at the 10 cm depth below the ground surface: (a) in the HQW site from 1 January 2016 to 31 December 2016, (b) in the BTQ site from 1 July 2018 to 30 June 2019.
Figure 3.
Daily rainfall depth (P), evaporation (E), groundwater depth (GW depth), and volumetric soil water content (VWC) at the 10 cm depth below the ground surface: (a) in the HQW site from 1 January 2016 to 31 December 2016, (b) in the BTQ site from 1 July 2018 to 30 June 2019.

Figure 4.
Time series of rainfall (P), relative saturation at 10, 20, 40, 60, and 80 cm below the soil surface (S*), groundwater depth (GW depth), and discharge (Q) at the outlet for events H1–H3 in the HQW site and B1–B3 in the BTQ site with a time interval of 10 min.
Figure 4.
Time series of rainfall (P), relative saturation at 10, 20, 40, 60, and 80 cm below the soil surface (S*), groundwater depth (GW depth), and discharge (Q) at the outlet for events H1–H3 in the HQW site and B1–B3 in the BTQ site with a time interval of 10 min.

Figure 5.
Linear corrections between rainfall–runoff depth of different events: (a) in the HQW site, (b) in the BTQ site.
Figure 5.
Linear corrections between rainfall–runoff depth of different events: (a) in the HQW site, (b) in the BTQ site.

Figure 6.
Boxplots of peak rainfall intensity with the saturated hydraulic conductivities of HQW and BTQ marked in dotted lines.
Figure 6.
Boxplots of peak rainfall intensity with the saturated hydraulic conductivities of HQW and BTQ marked in dotted lines.

Figure 7.
Runoff coefficient (ɑ) versus the initial groundwater depth (H0) with different rainfall depths.
Figure 7.
Runoff coefficient (ɑ) versus the initial groundwater depth (H0) with different rainfall depths.

Figure 8.
The linear relationship between the initial groundwater depth (H0) and the soil water storage capacity, SWSC: (a) in the HQW site, (b) in the BTQ site.
Figure 8.
The linear relationship between the initial groundwater depth (H0) and the soil water storage capacity, SWSC: (a) in the HQW site, (b) in the BTQ site.


Table 1.
Basic soil properties of two sites.
| Parameters | Site HQW | Site BTQ | |
|---|---|---|---|
| Clay | (%) | 32.60 (4.60) 1 | 30.42 (3.60) |
| Silt | (%) | 59.27 (3.72) | 60.20 (4.33) |
| Sand | (%) | 8.13 (3.16) | 9.38 (2.04) |
| Average bulk density (ρb) | (g/cm3) | 1.36 (0.14) | 1.52 (0.13) |
| Saturated water content (θs) | (m3/m3) | 0.45 (0.083) | 0.47 (0.10) |
| Saturated hydraulic conductivity (Ks) | (mm/hr) | 46.63 (31.33) | 30.22 (10.79) |
| Organic matter (OM) | (g/kg) | 14.78 (5.61) | 18.38 (10.07) |
Note: 1–the first number is for mean value and the number inside brackets is for standard deviation.
Table 2.
Pre-event and event variables description.
| Pre-Event Conditions: Antecedent Soil Moisture Indices | |
| H0 | The initial groundwater depth (m) |
| SWSC | The soil water storage capacity (mm) |
| Event conditions: Precipitation and derived variables | |
| ∑P | Total rainfall (mm) |
| T | Rainfall duration (hr) |
| Pmax | Maximum rainfall intensity (mm/hr) |
| Pmean | Average rainfall intensity (mm/hr) |
| Event conditions: Hydrological variables | |
| R | Quickflow runoff (mm) |
| ɑ | Runoff coefficient, equals to R/P |
| Qmax | Peak discharge (L/s) |
| D | Depression storage (mm) |
| ∆H | Increment of groundwater table (mm) |
| I | Cumulative infiltration (mm) |
Table 3.
Summary of rainfall and runoff characteristics for the six selected rainfall events.
| Event | Start Date | ΣP | T | Pmean | Pmax | R | ɑ | SWSC |
|---|---|---|---|---|---|---|---|---|
| mm | hr | mm/hr | mm/hr | mm | mm | |||
| H1 | 20-05-2016 | 54.5 | 31.2 | 1.8 | 6.6 | 5.99 | 0.11 | 72.2 |
| H2 | 31-05-2016 | 35.3 | 3.2 | 11.2 | 28.4 | 23.5 | 0.67 | 41.4 |
| H3 | 19-10-2016 | 97.3 | 65.5 | 12.6 | 1.5 | 71.3 | 0.73 | 43.5 |
| B1 | 08-07-2018 | 23.5 | 3.83 | 6.13 | 22 | 14.64 | 0.62 | 21.4 |
| B2 | 06-11-2018 | 32.5 | 39.83 | 0.82 | 4.9 | 9.12 | 0.28 | 75 |
| B3 | 19-06-2019 | 24.5 | 39.5 | 0.62 | 9.6 | 7.43 | 0.30 | 44.4 |
Note: − ΣP is the total rainfall, T is the rainfall duration, Pmean is the average rainfall intensity, Pmax is the maximum rainfall intensity, R is the total runoff, ɑ is the runoff coefficient, and SWSC is the soil water storage capacity.
Table 4.
Pearson rank correlation matrix of the selected parameters in (a) HQW site and (b) BTQ site. Coefficients in red are significant at the 0.05 level, and values in bold are significant at the 0.01 level.
Table 4.
Pearson rank correlation matrix of the selected parameters in (a) HQW site and (b) BTQ site. Coefficients in red are significant at the 0.05 level, and values in bold are significant at the 0.01 level.
| (a) | ΣP | T | Pmax | Pmean | R | α | Qmax | D | ∆H | I | H0 | SWSC |
|---|---|---|---|---|---|---|---|---|---|---|---|---|
| ΣP | 1 | 0.748 | 0.599 | 0.248 | 0.975 | 0.720 | 0.252 | 0.469 | 0.248 | 0.042 | −0.081 | −0.131 |
| T | 1 | 0.254 | −0.171 | 0.655 | 0.465 | 0.141 | 0.652 | 0.445 | 0.302 | 0.184 | 0.073 | |
| Pmax | 1 | 0.683 | 0.634 | 0.741 | 0.287 | 0.115 | −0.063 | −0.142 | −0.162 | −0.159 | ||
| Pmean | 1 | 0.288 | 0.478 | 0.161 | −0.127 | −0.060 | −0.105 | −0.180 | −0.177 | |||
| R | 1 | 0.797 | 0.196 | 0.343 | 0.051 | −0.167 | −0.255 | −0.276 | ||||
| α | 1 | 0.214 | 0.098 | −0.101 | −0.361 | −0.496 | −0.568 | |||||
| Qmax | 1 | 0.016 | 0.518 | 0.347 | 0.259 | 0.204 | ||||||
| D | 1 | 0.435 | 0.270 | 0.122 | 0.057 | |||||||
| ∆H | 1 | 0.861 | 0.630 | 0.447 | ||||||||
| I | 1 | 0.878 | 0.764 | |||||||||
| H0 | 1 | 0.922 | ||||||||||
| SWSC | 1 | |||||||||||
| (b) | ΣP | T | Pmax | Pmean | R | α | Qmax | D | ∆H | I | H0 | SWSC |
| ΣP | 1 | 0.321 | 0.225 | −0.119 | 0.496 | 0.332 | 0.365 | −0.281 | 0.535 | 0.593 | 0.129 | 0.342 |
| T | 1 | −0.624 | −0.638 | −0.037 | 0.031 | 0.006 | 0.184 | 0.465 | 0.178 | 0.046 | 0.177 | |
| Pmax | 1 | 0.526 | 0.693 | 0.641 | 0.641 | −0.554 | −0.150 | −0.234 | −0.247 | −0.238 | ||
| Pmean | 1 | −0.041 | −0.074 | 0.020 | 0.188 | −0.002 | −0.103 | 0.189 | 0.233 | |||
| R | 1 | 0.957 | 0.936 | −0.604 | −0.069 | −0.322 | −0.530 | −0.454 | ||||
| α | 1 | 0.934 | −0.591 | −0.173 | −0.469 | −0.625 | −0.525 | |||||
| Qmax | 1 | −0.551 | 0.026 | −0.405 | −0.462 | −0.414 | ||||||
| D | 1 | −0.008 | −0.071 | 0.060 | 0.114 | |||||||
| ∆H | 1 | 0.629 | 0.675 | 0.703 | ||||||||
| I | 1 | 0.705 | 0.784 | |||||||||
| H0 | 1 | 0.918 | ||||||||||
| SWSC | 1 |
Note:–ΣP is the total rainfall, T is the rainfall duration, Pmax is the maximum rainfall intensity, Pmean is the average rainfall intensity, R is the total runoff, α is the runoff coefficient, Qmax is the peak discharge, D is the depression storage, ∆H is the increment of the groundwater table, I is the cumulative infiltration, H0 is the initial groundwater depth, and SWSC is the soil water storage capacity.
Table 5.
Summary of depression storage in individual events in HQW and BTQ.
| Parameter | HQW | BTQ |
|---|---|---|
| Maximum (mm) | 18.86 | 12.13 |
| Minimum (mm) | 0.29 | 0.19 |
| Mean (mm) | 6.20 | 6.63 |
| SD (mm) | 4.75 | 3.91 |
© 2020 by the authors. Licensee MDPI, Basel, Switzerland. This article is an open access article distributed under the terms and conditions of the Creative Commons Attribution (CC BY) license (http://creativecommons.org/licenses/by/4.0/).
Share and Cite
MDPI and ACS Style
Zhai, Y.; Wang, C.; Chen, G.; Wang, C.; Li, X.; Liu, Y. Field-Based Analysis of Runoff Generation Processes in Humid Lowlands of the Taihu Basin, China. Water 2020, 12, 1216. https://doi.org/10.3390/w12041216
AMA Style
Zhai Y, Wang C, Chen G, Wang C, Li X, Liu Y. Field-Based Analysis of Runoff Generation Processes in Humid Lowlands of the Taihu Basin, China. Water. 2020; 12(4):1216. https://doi.org/10.3390/w12041216
Chicago/Turabian StyleZhai, Yue, Chuanhai Wang, Gang Chen, Chun Wang, Xiaoning Li, and Yating Liu. 2020. "Field-Based Analysis of Runoff Generation Processes in Humid Lowlands of the Taihu Basin, China" Water 12, no. 4: 1216. https://doi.org/10.3390/w12041216
Note that from the first issue of 2016, this journal uses article numbers instead of page numbers. See further details here.