Probability Distribution and Characterization of Daily Precipitation Related to Tropical Cyclones over the Korean Peninsula


Department of Civil and Environmental Engineering, Kongju National University, Cheon-an 31080, Korea
*
Author to whom correspondence should be addressed.
Water 2020, 12(4), 1214; https://doi.org/10.3390/w12041214
Submission received: 12 March 2020
/
Revised: 17 April 2020
/
Accepted: 21 April 2020
/
Published: 24 April 2020
(This article belongs to the Section Hydrology)
Abstract
:Rainfall events are known to be driven by various synoptic disturbances or dominant processes in the atmosphere. In spite of the diverse atmospheric contributions, the assumption of homogeneity is commonly adopted when a hydrological frequency analysis is conducted. This study examines how the dominant processes, particularly the landfalling tropical cyclones (TCs) and non-TC events, have various effects to the characteristics of rainfall in South Korea. With rainfall data from the fifty-nine weather stations spread across the country, the multiple contributions of the TC and non-TC rainfall to the relative amount of rainfall, duration, intensity and maximum rainfall, on a seasonal and monthly scale, are first explored in this study. For the second objective, suitable probability distributions for the TC and non-TC time series are identified potentially for a synthetic analysis. Our results indicate that TCs cause a heterogeneous spatial distribution in the rainfall characteristics over the gauge networks particularly in the southern and eastern coastal areas. Some gauges in these areas attribute a significant portion of their amount and annual maximum rainfall to landfalling TCs. The results also show that the Pearson Type III distribution best represents the non-TC wet-day series, while the TC wet-day series can be represented by various distributions including the Weibull and Gamma distributions. From the analysis, we present how the characteristics of TCs differ from non-TCs with the emphasis on the need to consider their individual effects when conducting synthetic analyses.
1. Introduction
Awareness of the characteristics of precipitation such as amount, frequency and variability is vital in water resources planning and management [1]. Effectively recognizing the mentioned characteristics normally requires sufficiently long-term series of precipitation data [2]. However, obtaining historical or long-term data series is often found to be challenging since precipitation records are sometimes limited or unavailable at various sites. To address this difficulty, a probability distribution that is well-fitted to the daily or monthly precipitation data is often employed in the field of hydrology, specifically for hydrological frequency analysis (e.g., [3,4,5]).
Homogeneity in the hydrologic time series is primarily assumed when conducting a hydrological frequency analysis. Based on this assumption, all the available precipitation data can be fitted to a single probability distribution to estimate a certain quantile of interest (e.g., 95% percentile). However, the climate system which generates precipitation events often undergoes changes and shifts due to diverse synoptic disturbances like convection, tropical storms and rain-on-snow dynamics. These changes therefore contradict the assumption of homogeneity, making the conventional hydrological frequency analysis less precise. In connection to this, there is an emerging consensus that an improved hydrologic risk assessment using frequency analysis embodies practices that take into account the effects of synoptic disturbances or “dominant processes” in the atmosphere [6,7].
Two dominant processes contribute the most to the occurrence of precipitation in the Korean peninsula, particularly during the summer season (June to September) [8,9]. Furthermore, the annual distribution of daily rainfall in South Korea was notably identified to have two distinct peaks during the summer, which can be divided into two sub-seasons: the Changma and post-Changma seasons [10]. The first peak that occurs in July or during the Changma season is generated by local convection activities, whereas the second peak that occurs in August or post-Changma season is dominated by tropical cyclones [8,11]. Although the categorization has been widely accepted and used in the past (e.g., [12,13]), dividing the rainfall based on the months or the sub-seasons may not be ideal since some peaks in the Changma season might have been the effect of tropical cyclones (TCs). Given the literature mentioned above, the need arises to seek for a different approach to categorize the total summer precipitation based on the dominant systems that generates it. Hence, the total summer precipitation of South Korea is categorized into TC- and non-tropical cyclone (non-TC)-based rainfall for this study. It should be noted that the TC is known as a “typhoon” in the northwestern Pacific [14]; however, the term is not commonly used in other existing literature. Since both terms are synonymous, the term TC is continuously used in this study to conform with past literature and to avoid confusion.
A variety of explorations for TC and non-TC events have been conducted. Temporal changes in the patterns of summertime tropical cyclones [15] as well as the external mechanisms that affect their frequency and intensity have been examined [16,17]. Knutson et al. and Walsh et al. employed models to predict future changes in TC trends as well as the potential risks of TC-induced events [18,19]. The influence of TC circulations in the distribution of humidity and convection were also investigated [20,21,22]. Meanwhile, interdecadal changes in the East Asian Summer Monsoon (EASM) and the characteristics of convective storms, which are some of the various climatological onsets that produce non-TC events, were also closely examined [12,23,24,25,26,27].
In addition to the explorations, the contribution of TCs to the amount of summer rainfall in South Korea has also been examined [10,28,29,30]. For instance, Kim et al. focused on the rainfall from August to September, and their results showed that the landfalling TCs are the prime driver of frequent and stronger heavy rainfall events during these months [29]. Meanwhile, Chang and Kwon as well as Kim and Jain utilized the average summer precipitation data in South Korea and associated the detected increase in the frequency of heavy precipitation in the country’s eastern coastal and southern regions to the TCs that have passed the country during the season [10,30]. As seen, most of these studies focused mainly on the average of the seasonal precipitation data and/or on the months where TCs are already known to occur the most. It can therefore be inferred that an analysis dealing with multiple aspects is further required to explicitly understand the TC contribution to summer precipitation. Accordingly, a closer and more detailed inspection is conducted in this study. To be specific, with the contribution of TC and non-TC events based on the seasonal scale, this study also inspected their contribution to the monthly (June–September) amount, duration, intensity of rainfall and annual maximum rainfall.
Furthermore, to the best of the authors’ knowledge, only a handful of studies have employed the frequency analysis of precipitation data while considering multiple categories based on dominant processes despite its importance (e.g., [9,31,32,33]). Yang et al. recognized that two out of the six regions in the Pearl River Basin, China, experience considerable flood events [31]. The rainfall in the two regions was found to have different influencing factors. The coastal area was dominated by strong impacts of tropical cyclones, while the precipitation in the inland area was identified to be controlled by the regional convective system. Eventually, they showed that the Generalized Logistic (GLO), Generalized Extreme Value (GEV) and Pearson Type III (PT3) distributions fit well for the annual maximum rainfall of most of the basins in each region. Other studies used a mixed and nonstationary GEV distribution to the annual maximum TC and non-TC rainfall time series (e.g., [9,33]). As observed from the existing literature, most of the hydrological frequency analyses were conducted by only using the annual maximum values per year. However, utilizing data in such level neglects the non-maximum values that might be higher than the maximum values in other years [34]. A circumstance wherein a given year does not have any data especially in the TC time series might also occur. Other methods have been implemented in the field of hydrology to address this problem. One of these methods involves the use of the whole wet-day series (excluding zeros) of daily precipitation in finding the probability distribution that provides the best fit for the data (e.g., [2,4,35,36]). Analyzing a wet-day dataset on a daily resolution supports various climate studies including a more detailed inspection of changes in precipitation extremes [37]. For instance, Ye et al. recognized the PT3 distribution as the distribution that best describes the wet-day series in the United States after comparing it with other probability distributions like GEV, GLO, PT3, Gamma, Uniform, Weibull and Normal distributions [4]. The importance of the analysis and the lack thereof motivates the authors to adapt the above-mentioned method for the TC and non-TC wet-day time series in South Korea.
With all the above-mentioned gaps in the body of knowledge, this study therefore aims (1) to explicitly inspect the characteristics of the monthly and seasonal rainfall based on the contribution of TC and non-TC events to their amount, duration, intensity and maximum value per year and (2) to explore the optimal probability distribution best suited for the daily TC and non-TC wet-day time series. The paper is organized as follows. Section 2 introduces the study area and data used in this study. The methodologies are presented in Section 3, which include defining TC and non-TC rainfalls, determining the contribution of TC and non-TC events to the characteristics of the rainfall and employing several methods to select the optimal distribution for the TC and non-TC wet-day time series. The summary of the results is presented in Section 4, followed by a concluding discussion in Section 5.
2. Study Area and Data
South Korea lies in the middle of the Northern Hemisphere with four distinct seasons and a climate that is affected by northeastern Asia and the western Pacific Ocean [38,39]. Climatologically, the country receives heavy precipitation due to different synoptic-scale patterns, while heavy snow falls in winter due to the Siberian high [40]. Compared to the world average, the country experiences more precipitation making it a relatively wet region despite the occasional instances of water deficit during the winter season [41].
The annual precipitation in the country varies depending on its topography and geographical location. The southern part of South Korea receives an annual precipitation ranging from 1000 to 1800 mm, while the central part receives less precipitation ranging from 1000 to 1400 mm. As illustrated in Figure 1, the summer precipitation comprises nearly two-thirds of the total annual precipitation, while the winter precipitation accounts for less than 10%, indicating that the summer precipitation is indeed valuable in the regional water resources management [10]. Hence, a great deal of focus is directed to the summer precipitation.
This study utilizes the daily rainfall data collected from the fifty-nine weather stations of the Korea Meteorological Administration’s Automated Surface Observing System (ASOS) scattered across South Korea (see Figure 1). The data used in this study only cover the daily rainfall during the summer season (June to September) from 1973 to 2018 due to data availability. The TC best track data recorded during the same period is acquired from the Regional Specialized Meteorological Center (RSMC) Tokyo—Typhoon Center of the Japan Meteorological Agency (JMA). The best track data include the TC names, date of landfall, location of the TC center (latitude and longitude), central pressure and maximum sustained wind for every 6 h interval. For this study, the 6 h interval is integrated into a daily scale, and only the dates, names and center locations are utilized. It should also be noted that only the wet-day series, or those with non-zero values, are used for the study. Similar to the approach of Ye et al., the wet day-series are developed by excluding the zero and “trace” values (approximately 0.25 mm recorded precipitation depth) from the original data [4].
3. Methodologies
3.1. TC and Non-TC Rainfall Estimation
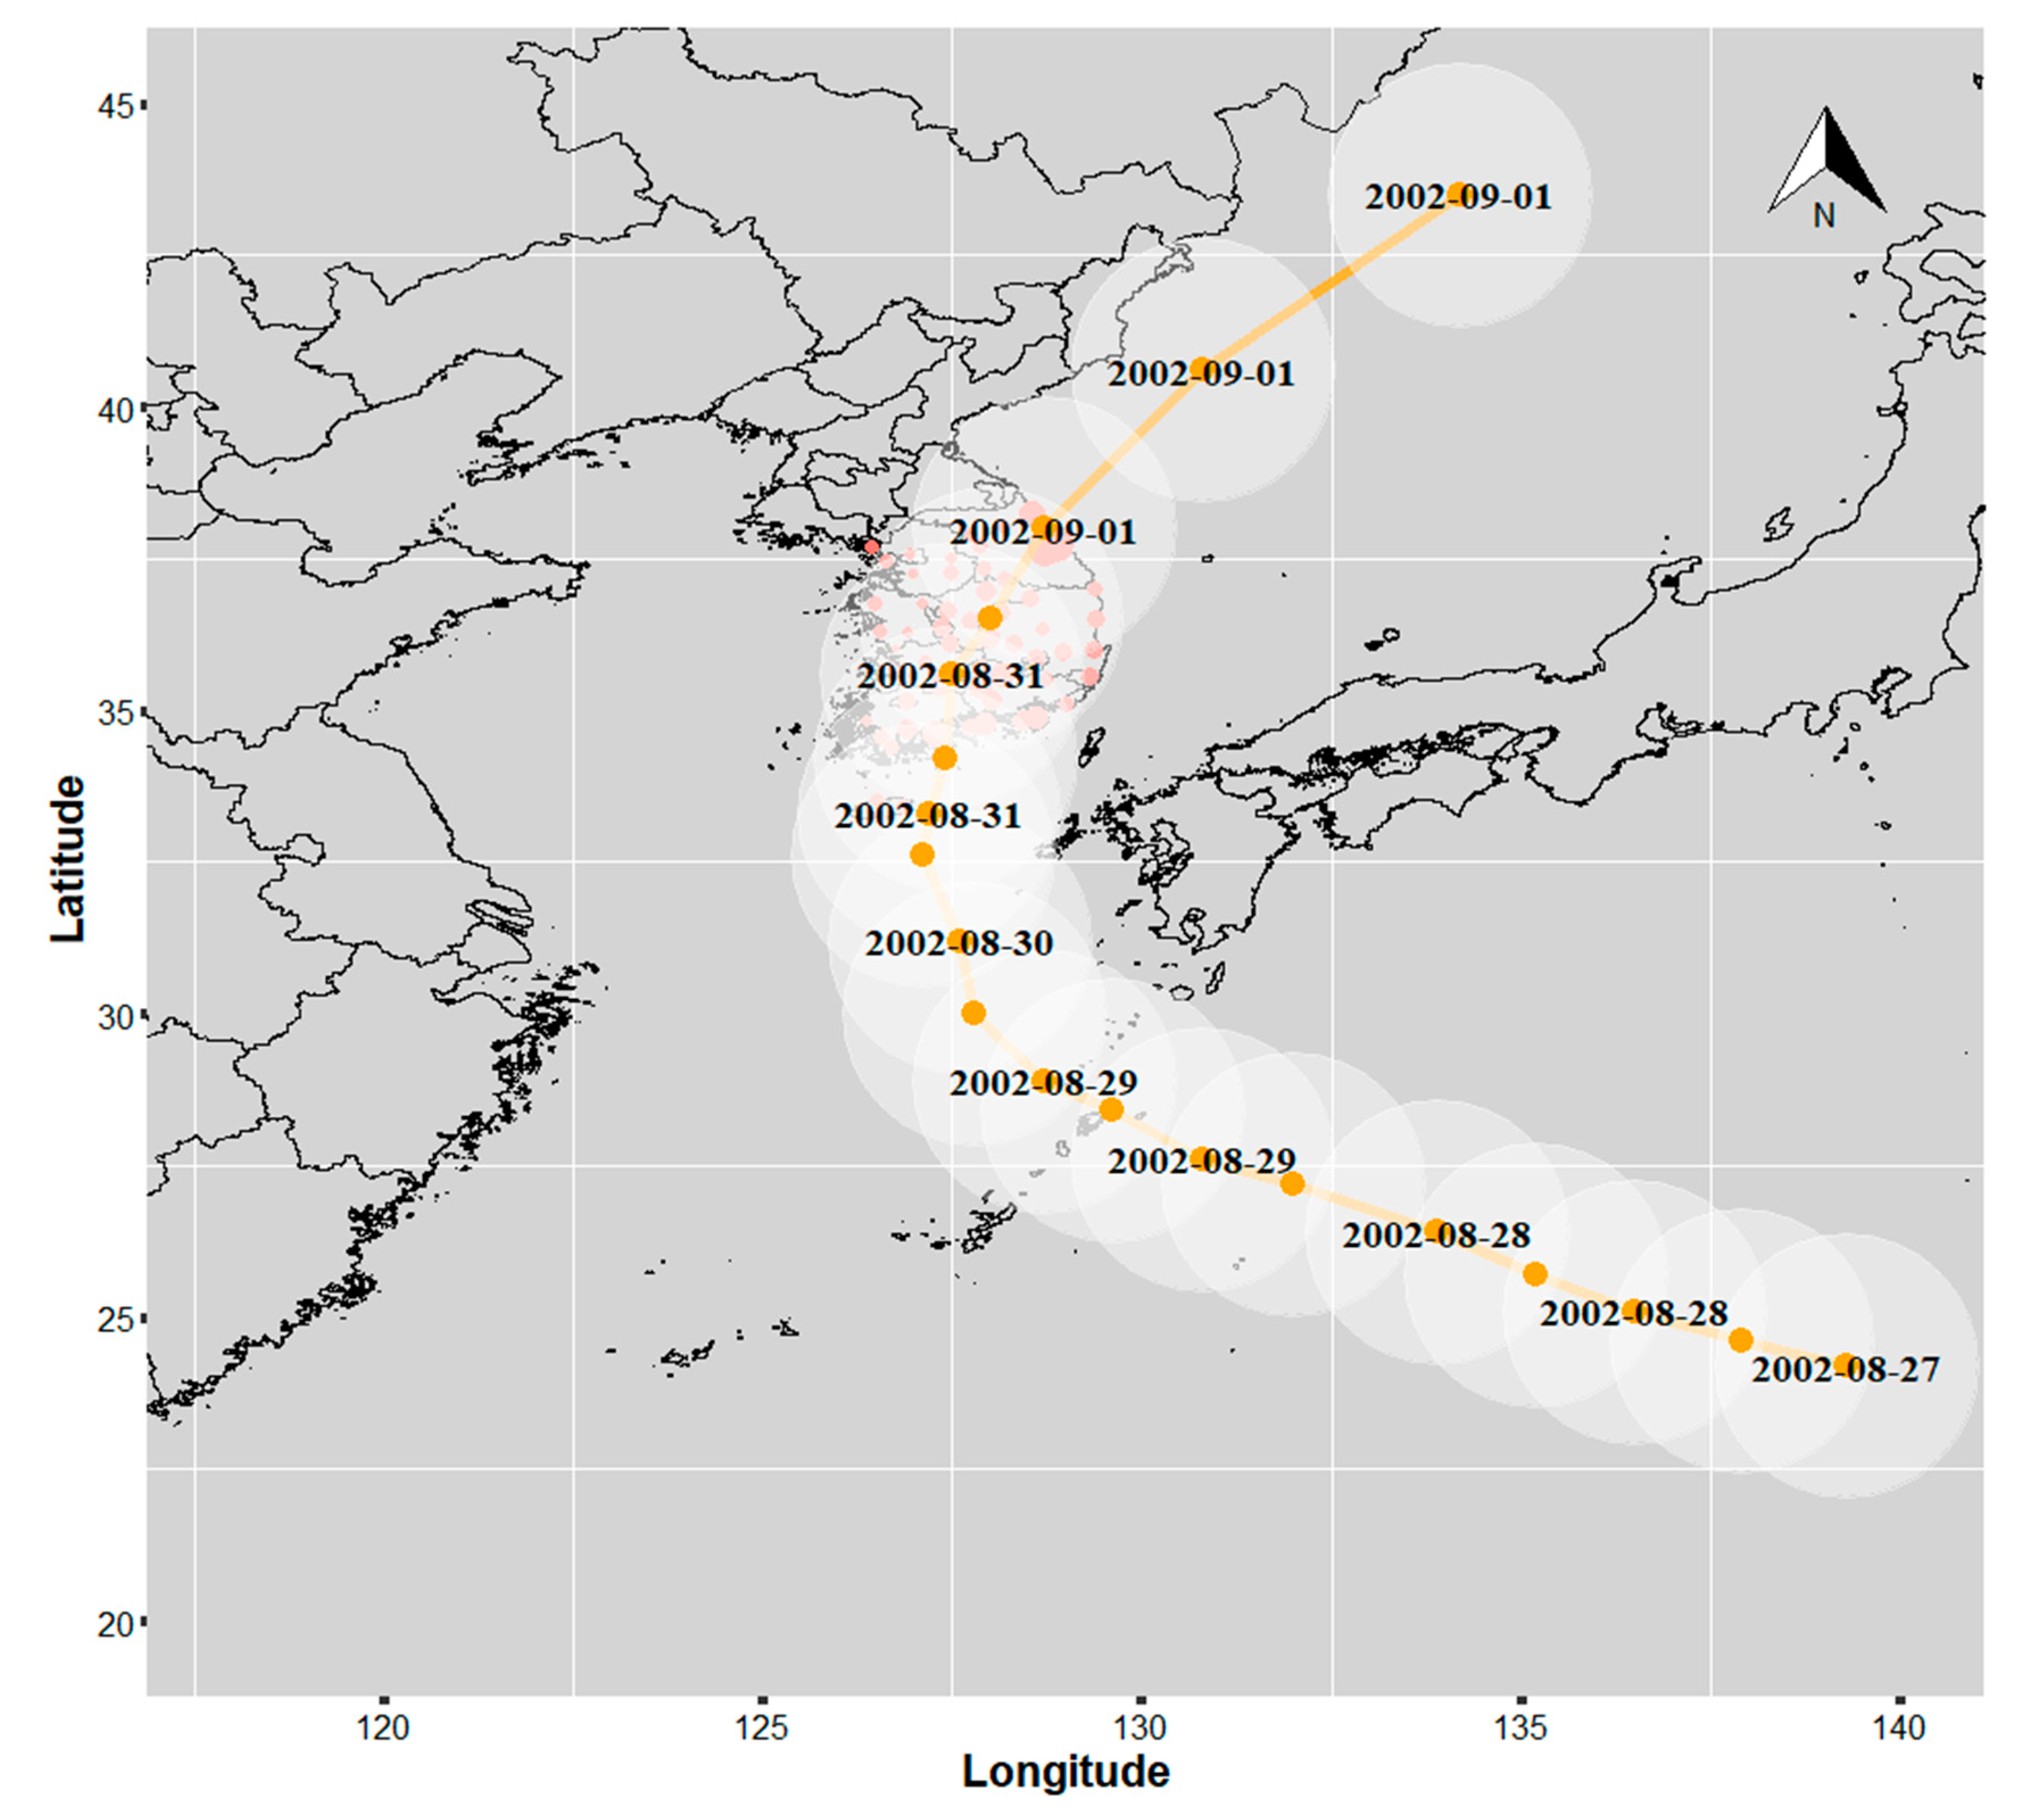
On average, South Korea experiences one to three tropical cyclones per year [29]. One of the strongest tropical cyclones that hit the country was Tropical Cyclone Rusa (Figure 2), which formed on 22 August 2002 and crossed the country from 31 August to 1 September 2002 [42]. The TC brought heavy rainfall and high winds that took hundreds of lives and caused serious damages in various areas in South Korea [43]. Damages incurred by the TC were estimated to cost as much as US$ 4.5 billion [44]. Identifying TC-induced rainfalls can be a great help in estimating future tropical cyclone impacts to prevent another disaster like that of Tropical Cyclone Rusa. Up to this day, however, no consensus has been reached on how to exactly define the TC rainfall data. Commonly, rainfall is TC-induced when it occurs during a time when a TC comes within the effective radius of a station [45]. For this study, the effective radius is determined by averaging the TC rainfall derived by using various radial distances ranging from 100 to 1000 km from the TC center to each station.
3.2. TC and Non-TC Rainfall Contributions
Conducting an in-depth analysis by considering smaller time scales can help in better understanding the effects of mechanisms on the characteristics of the rainfall [46]. For this study, the rainfall characteristics such as the amount (R), duration (D), intensity (I) and annual maximum value (M) are investigated on a seasonal (S) and monthly (i.e., June to September) scale.
Given a time series (TS) of TC and non-TC precipitation depths, the seasonal amount of rainfall in a station is computed by averaging all the recorded precipitation depths during the summer season from the years (N) of 1973–2018. To be specific, the seasonal amounts of TC and non-TC rainfall () at jth station are represented as follows:
where n indicates each year in the entire period.
Then, we further calculate the relative contributions (C) of rainfall amount using the following equations for comparative objectives:
The seasonal duration of rainfall at jth station () refers to the number of days that a rainfall event has occurred. It is computed by utilizing Equations (1) and (2) while changing the values of recorded precipitation depths into 1. Another characteristic being investigated in this study is the rainfall intensity. The seasonal rainfall intensity () is an important characteristic that helps tell whether the rain is strong enough to cause severe impact and damage. It is computed by the following equation:
Here, the abbreviations TC and non-TC are excluded for brevity.
A similar approach is taken for the monthly scale wherein all the precipitation depths and number of days recorded on the same month, regardless of the year, are utilized to compute the amount, duration and intensity of rainfall during the months of June, July, August and September.
In addition, the seasonal/monthly maximum rainfall for each station is determined by getting the maximum value of rainfall in a season/month per year. The date when the maximum rainfall was recorded is examined to determine whether it occurred during the passage of a TC in the peninsula, and the total number of each contribution is counted. Finally, the relative contributions are determined by using Equations (3) and (4). To sum up, the relative contributions of TC and non-TC are examined for the amount (R) and annual maximum value (M), whereas the absolute differences are investigated for the duration (D) and intensity (I).
3.3. Optimal Distributions for TC and Non-TC Rainfall
Several distributions including the uniform, exponential, gamma, lognormal, normal, Weibull, Gumbel, GLO, GEV, GPA and PT3 are pre-selected as alternative distributions (see Table 1) based on their usefulness in the field of hydrology (e.g., [4,35,47]). To explore the appropriate distribution, the evaluation of the goodness-of-fit using different tests is employed to the alternative distributions. The goodness-of-fit tests include several independent methods to ensure that the chosen model is scientifically sound, robust and acceptable [48]. In this study, the L-moments method, Probability Plot Correlation Coefficient (PPCC) test and Akaike’s Information Criterion (AIC) test were employed to investigate the goodness-of-fit of the distributions to the TC and non-TC wet-day series [49,50,51].
Recent developments to evaluate probability distributions in the area of hydrologic frequency analysis have emerged. One of these recent developments is the L-moments approach. Since its introduction, it has been considered as a widely accepted approach to evaluate the goodness-of-fit of alternative distributions. In this study, the daily wet-day series of the non-TC and TC rainfall are expected to exhibit a highly skewed distribution due to the large proportion of small non-zero values and high variances. L-moments approach is advantageous compared to other parameter estimators, like the conventional product moment, due to its natural unbiasedness, robustness and smaller sampling variances for data having large skewness and heavy tails [52], making it a useful tool in investigating the probability density function (pdf) of daily wet-day precipitation series.
The dimensionless ratios between L-moments, also known as L-moment ratios, comprise L-Cv , L-skewness and L-kurtosis . These ratios are analogous to the usual coefficients of variation, skewness and kurtosis, but are based on L-moments. In particular, the L-Cv () is equal to , where is the mean of the distribution or the L-location and is the L-scale. On the other hand, the L-skewness () and L-kurtosis () are defined as and , respectively. Meanwhile, L-moment ratio diagrams, L-kurtosis vs. L-skewness and L-Cv vs. L-skewness provide graphical comparisons of the characteristics of the sample data and theoretical statistical distributions [4]. Through these diagrams, the goodness-of-fit of a range of distributions can be evaluated. Table 1 shows the distributions examined using the vs. and vs. L-moment ratio diagrams.
Furthermore, the PPCC test, which is also known to be a good method to evaluate alternative distributions, is also used. It is a test which was originally developed for normal distributions but has long been applied to non-normal distributions [53]. The PPCC test is an operation that combines the probability plot and correlation coefficient. It measures the linearity of a plot by comparing the ordered observations to the predicted order statistics of an alternative distribution [54]. This study utilizes the Pearson correlation coefficient r with the ordered observations and the consequent fitted quantiles established by plotting positions unique for each alternative distribution. If the value of r is close to 1.0, then it can be inferred that the observations can be drawn from the fitted distribution.
Another method used in the study is the AIC test. The test was derived by establishing a relationship between the Kullback–Leibler Information and Fisher’s log-likelihood function. Due to its effectiveness, it has been employed by various studies several times in the past (e.g., [55,56,57]), making its theory and applications widely available in the literature. In this method, the distribution is evaluated using a likelihood-based technique and is penalized based on the number of its parameters. This means that an increase in the number of parameters will decrease the likelihood of the distribution, which will in turn increase its uncertainty. The AIC is defined as , wherein log(ML) represents the maximized loglikelihood function under the candidate distribution, and k is the number of parameters used in the candidate distribution. The most efficient model is considered as the one with the lowest AIC value.
4. Results
4.1. TC and Non-TC Rainfall Estimation
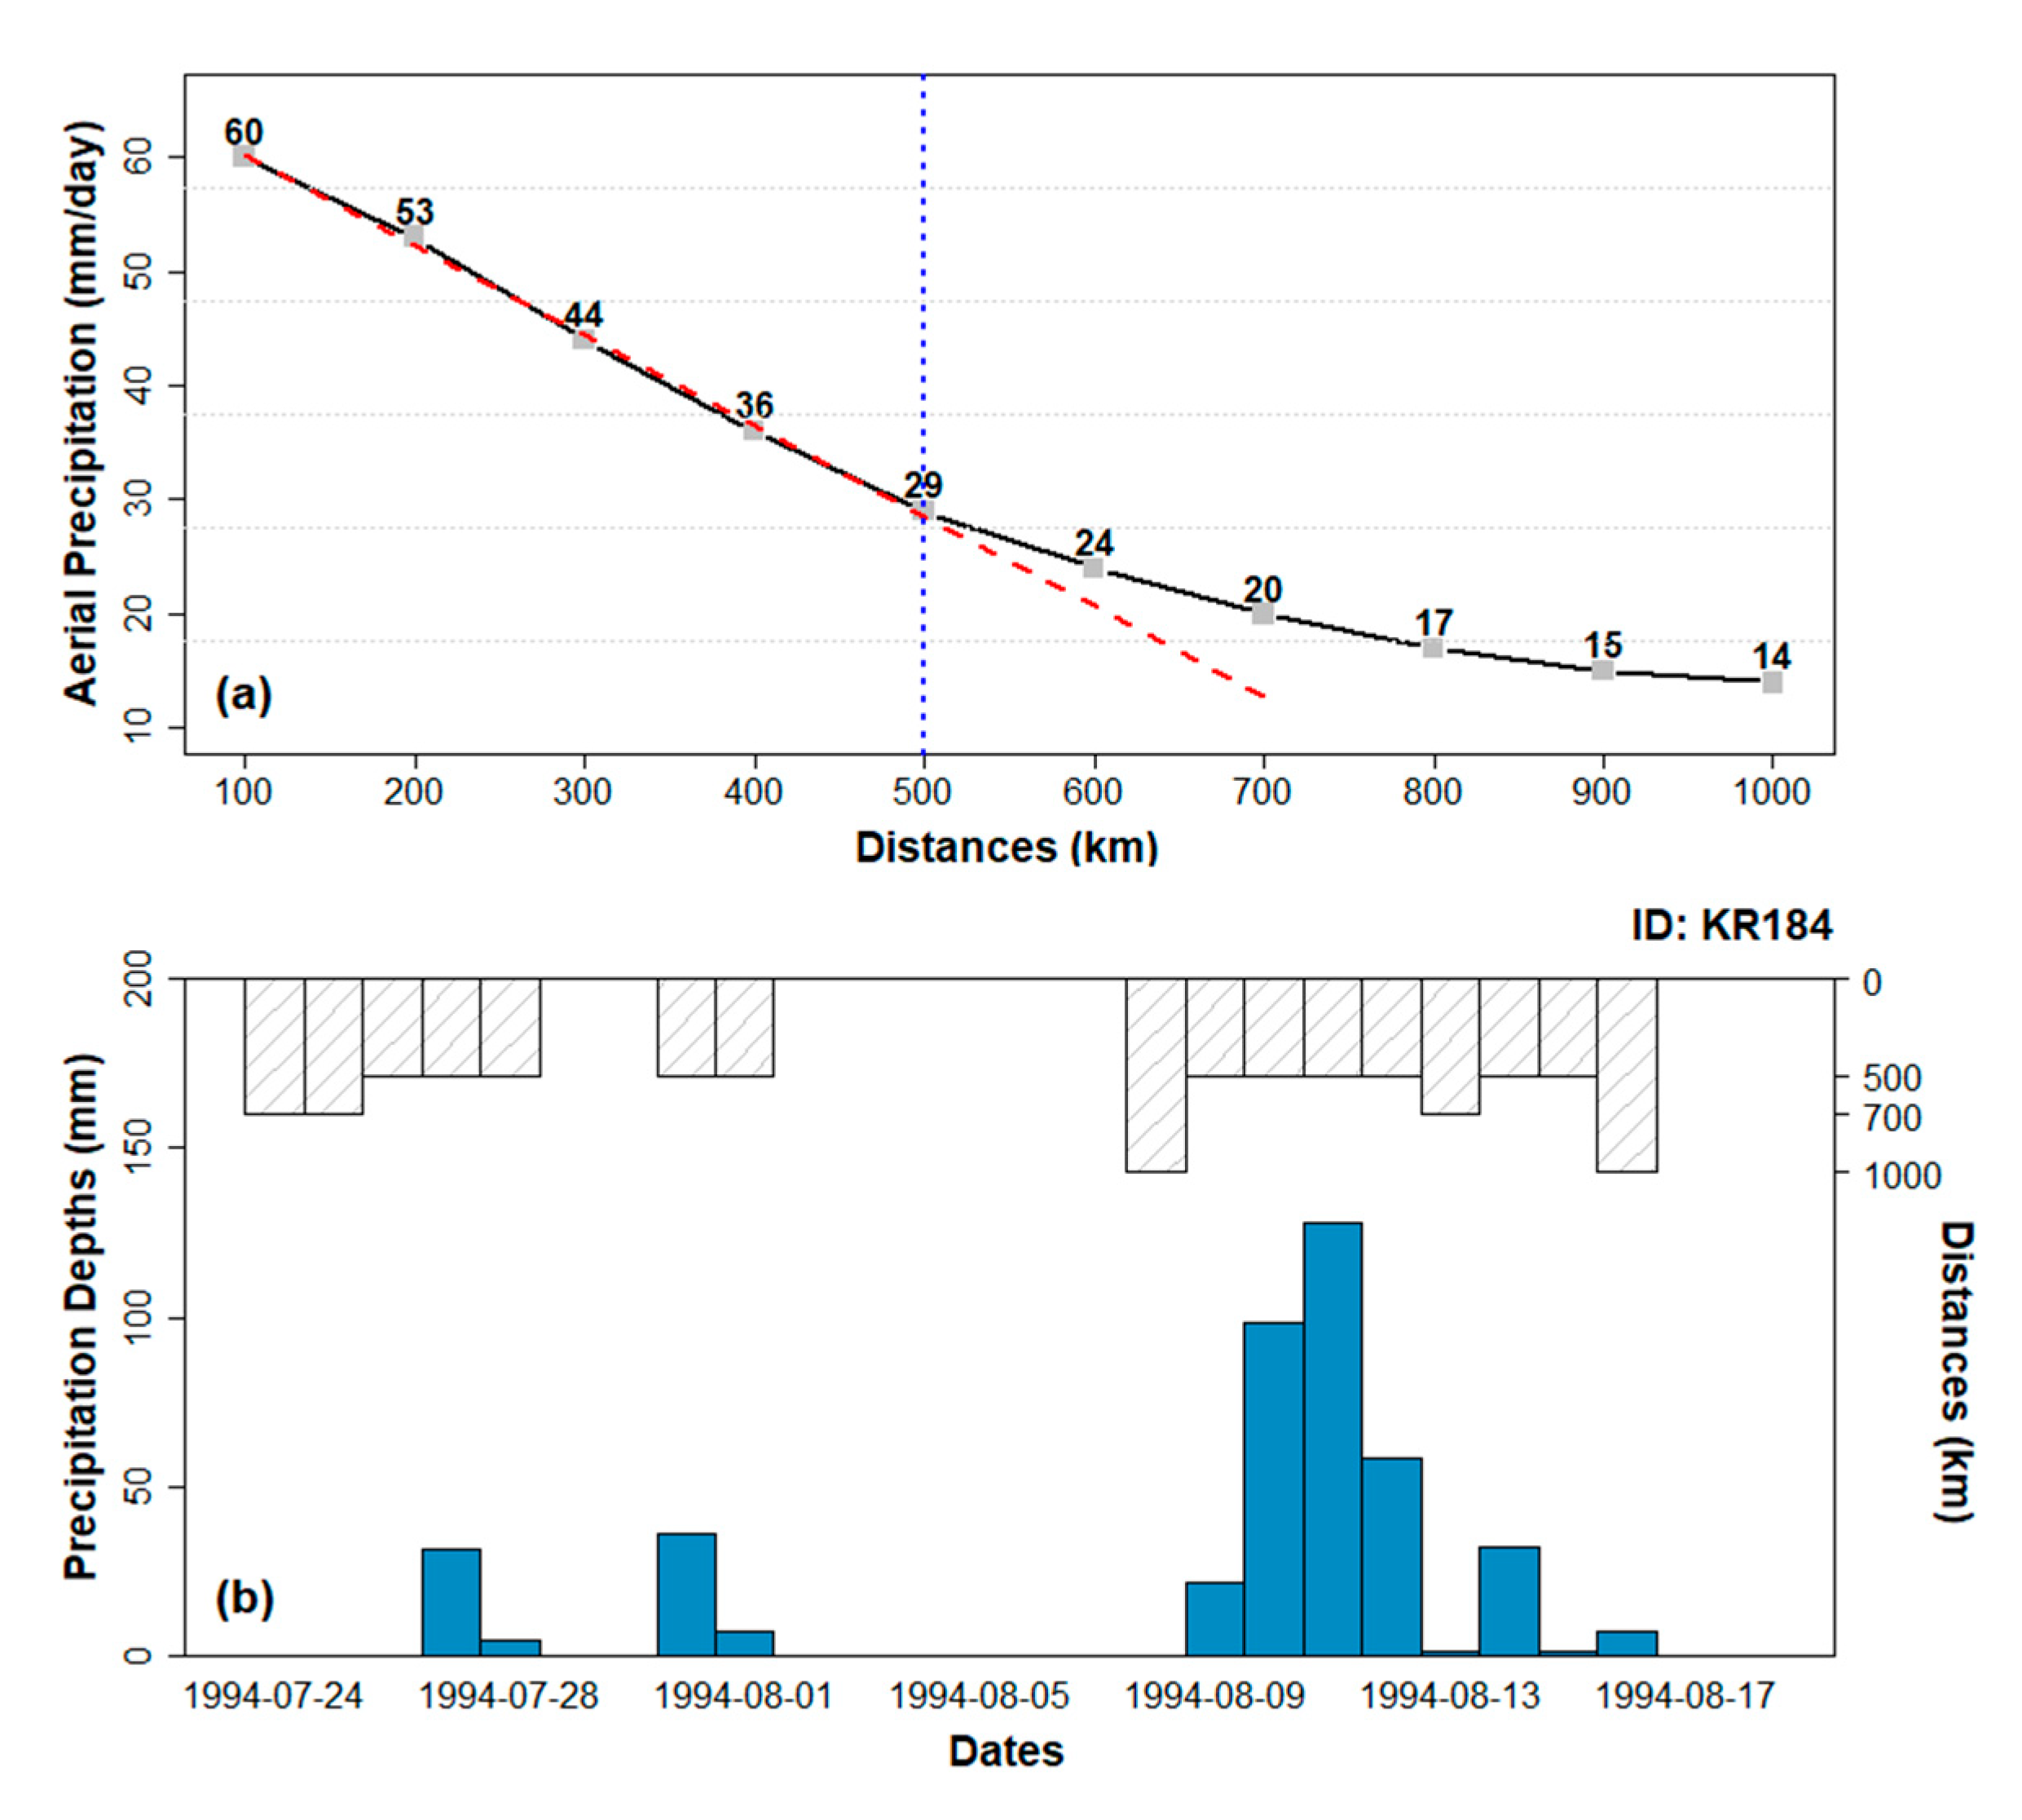
As illustrated in Section 3.1, effective radii from the TC center to each station ranging from 100 to 1000 km are utilized to determine which among the distances best defines the TC-induced rainfall (Figure 3a). As shown, the precipitation depths varied depending on the effective radius utilized, and there was a notable exponential reduction in the trend of aerial precipitation as the distance from the TC center to the stations increased. This is due to the fact that as the distance increased, days that did not have any rainfall record were also covered. The most apparent shift occurred after reaching the 500 km distance, indicating that there was a significant change in the TC influence beyond this point. Meanwhile, Figure 3b shows the precipitation event from 24 July to 18 August 1994 in one of the gauges (ID: KR184; the geographical location is presented in Figure 1). The figure shows the distance of the TC center from the station (top bar) and the corresponding depth of rainfall that it produced (bottom bar). The spread of the TC rainfall can be seen to be more emphasized at 500 km, while a huge gap between the rainfall depths recorded on distances beyond 500 km was very notable. The 700 and 1000 km distances covered some days with no precipitation record. A similar pattern was also observed in other gauge networks (not shown). TCs comprise an eye surrounded by an eyewall where most of deep convections occur [58]. Spiral rainbands which that showers and thunderstorms are located outside the eyewall. The rainbands could range up to three times bigger than the radius of the maximum wind. Based on the observed results, rainbands of the TCs that crossed South Korea were more pronounced within a 500 km radius from the TC center. Therefore, the recorded daily rainfall in South Korea was treated as a TC rainfall when TCs occurred within the radial distance of 500 km from each station. Other studies have also utilized the same radial distance in defining the TC rainfall data (e.g., [59,60]). We note that the non-TC rainfall was obtained by subtracting the identified TC rainfall from the total rainfall data.
4.2. TC and Non-TC Rainfall Contributions
Different rainfall characteristics are considered to determine the contribution of TC and non-TC rainfall to the total summer precipitation based on a seasonal and monthly scale. The relative seasonal contribution of a TC rainfall to the amount and annual maximum rainfall is illustrated in Figure 4, as well as the average duration and intensity of TC and non-TC rainfall. Note that although only the relative contribution of TC-induced rainfall is presented, the contribution of non-TC rainfall can be deduced as the complement of its result. For instance, if the relative contribution of TC rainfall is 30%, 70% (i.e., 100%–30%) indicates the relative contribution of non-TC rainfall. Figure 5 demonstrates the relative contribution of TCs to the amount of rainfall in the months of June, July, August and September, as well as the duration of TC and non-TC rainfall during the said months. Meanwhile, Figure 6 illustrates how the intensities of TC and non-TC rainfall vary per month as well as the relative contribution of TCs to the monthly annual maximum rainfall.
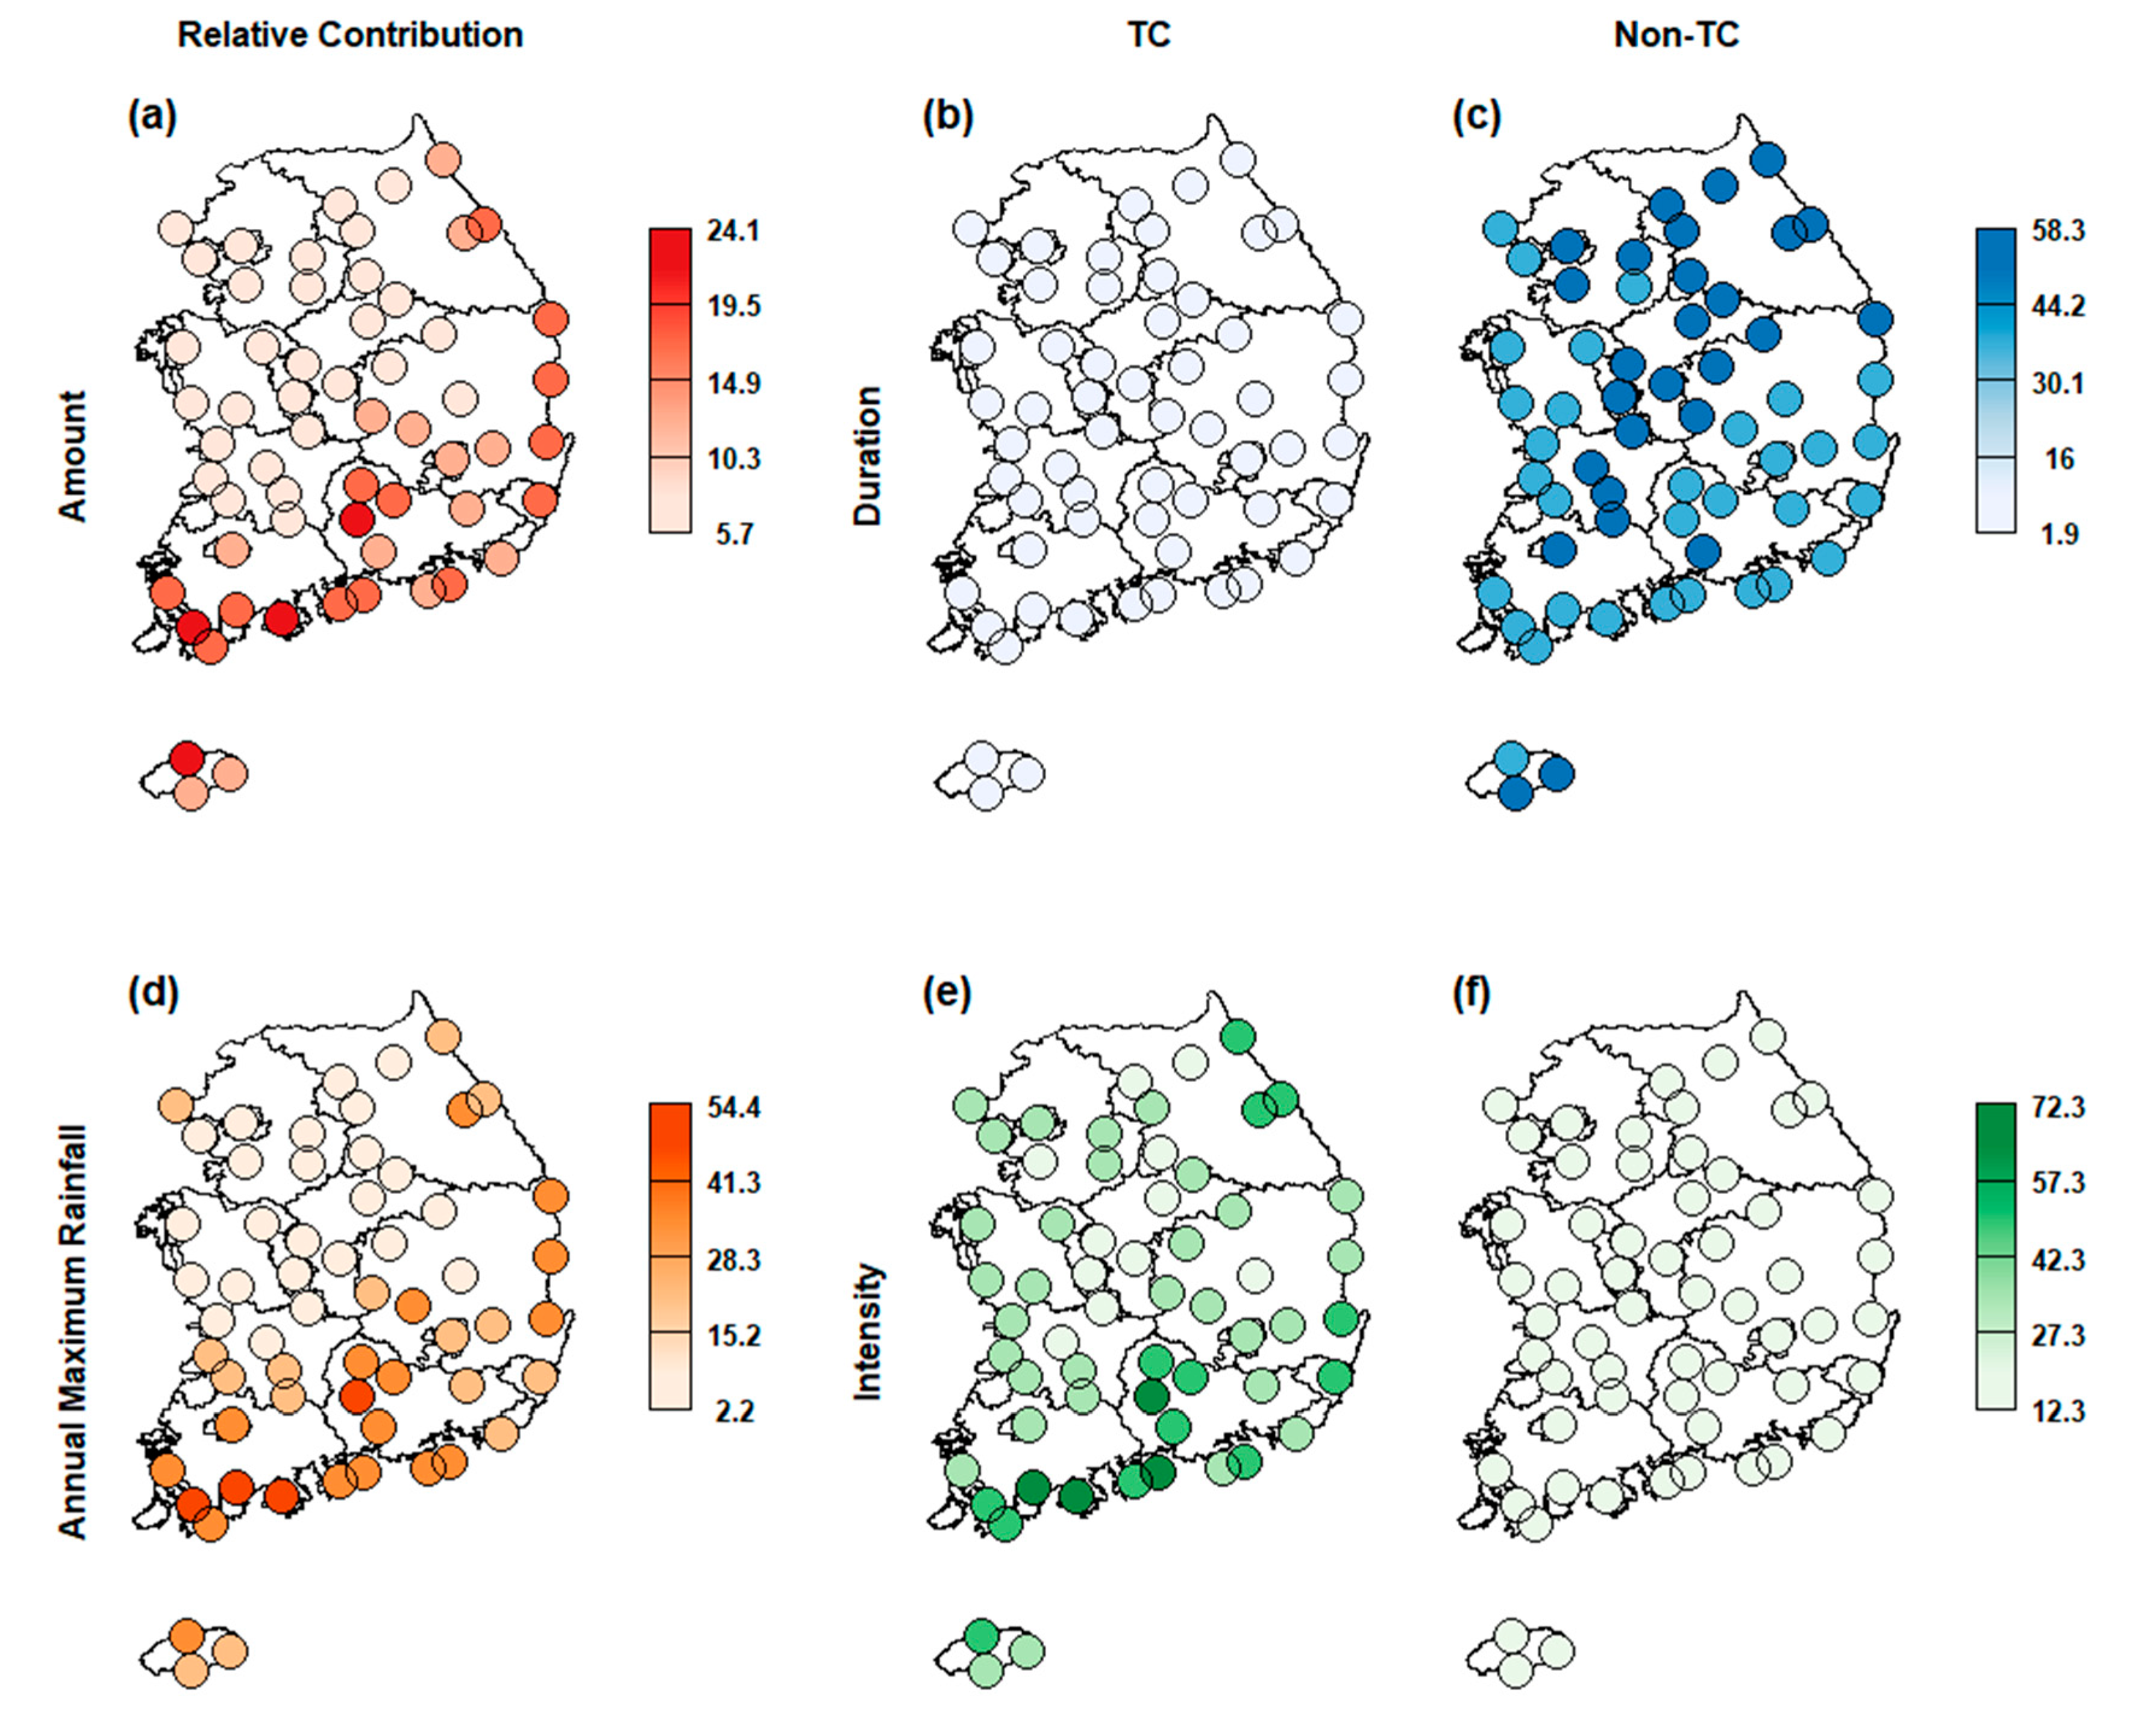
As shown in Figure 4, TC rainfall constituted up to 24% of the total summer precipitation in South Korea. Although almost uniform in the inland and northwestern areas, the distribution of the amount of rainfall in the southern and eastern coastal areas, where a bigger proportion of TC rainfall was mostly concentrated, seemed to vary in different degrees. One of the most palpable variations can be seen from the gauge stations located in Jeju Island (the island is indicated in Figure 1 as a hash). Despite their close proximities, each gauge station recorded unique precipitation depths throughout the years. This indicates that the conventional hydrological frequency analysis with the assumption of homogeneity may not be effective in some regions. The TC rainfall also caused the heterogeneous spatial distribution observed in the seasonal maximum rainfall, duration and intensity of TC and non-TC rainfall.
Examining the pattern of the seasonal rainfall duration suggests that TC rainfall occurred less frequently than non-TC rainfall, where it reached up to an average of 58 non-TC events as compared to an average of 2 to 4 TCs within a season. However, the resulting intensities showed that, although TC rainfall did not occur frequently, heavy precipitation was prevalent during the time of its occurrence, hence the development of large intensities. For the last analysis in the seasonal scale, the relative contribution of the TC rainfall to the seasonal annual maximum series was examined. Some gauges attributed more than 50% of their seasonal annual maximum rainfall to landfalling TCs. These gauges were particularly located in the southern region of the country.
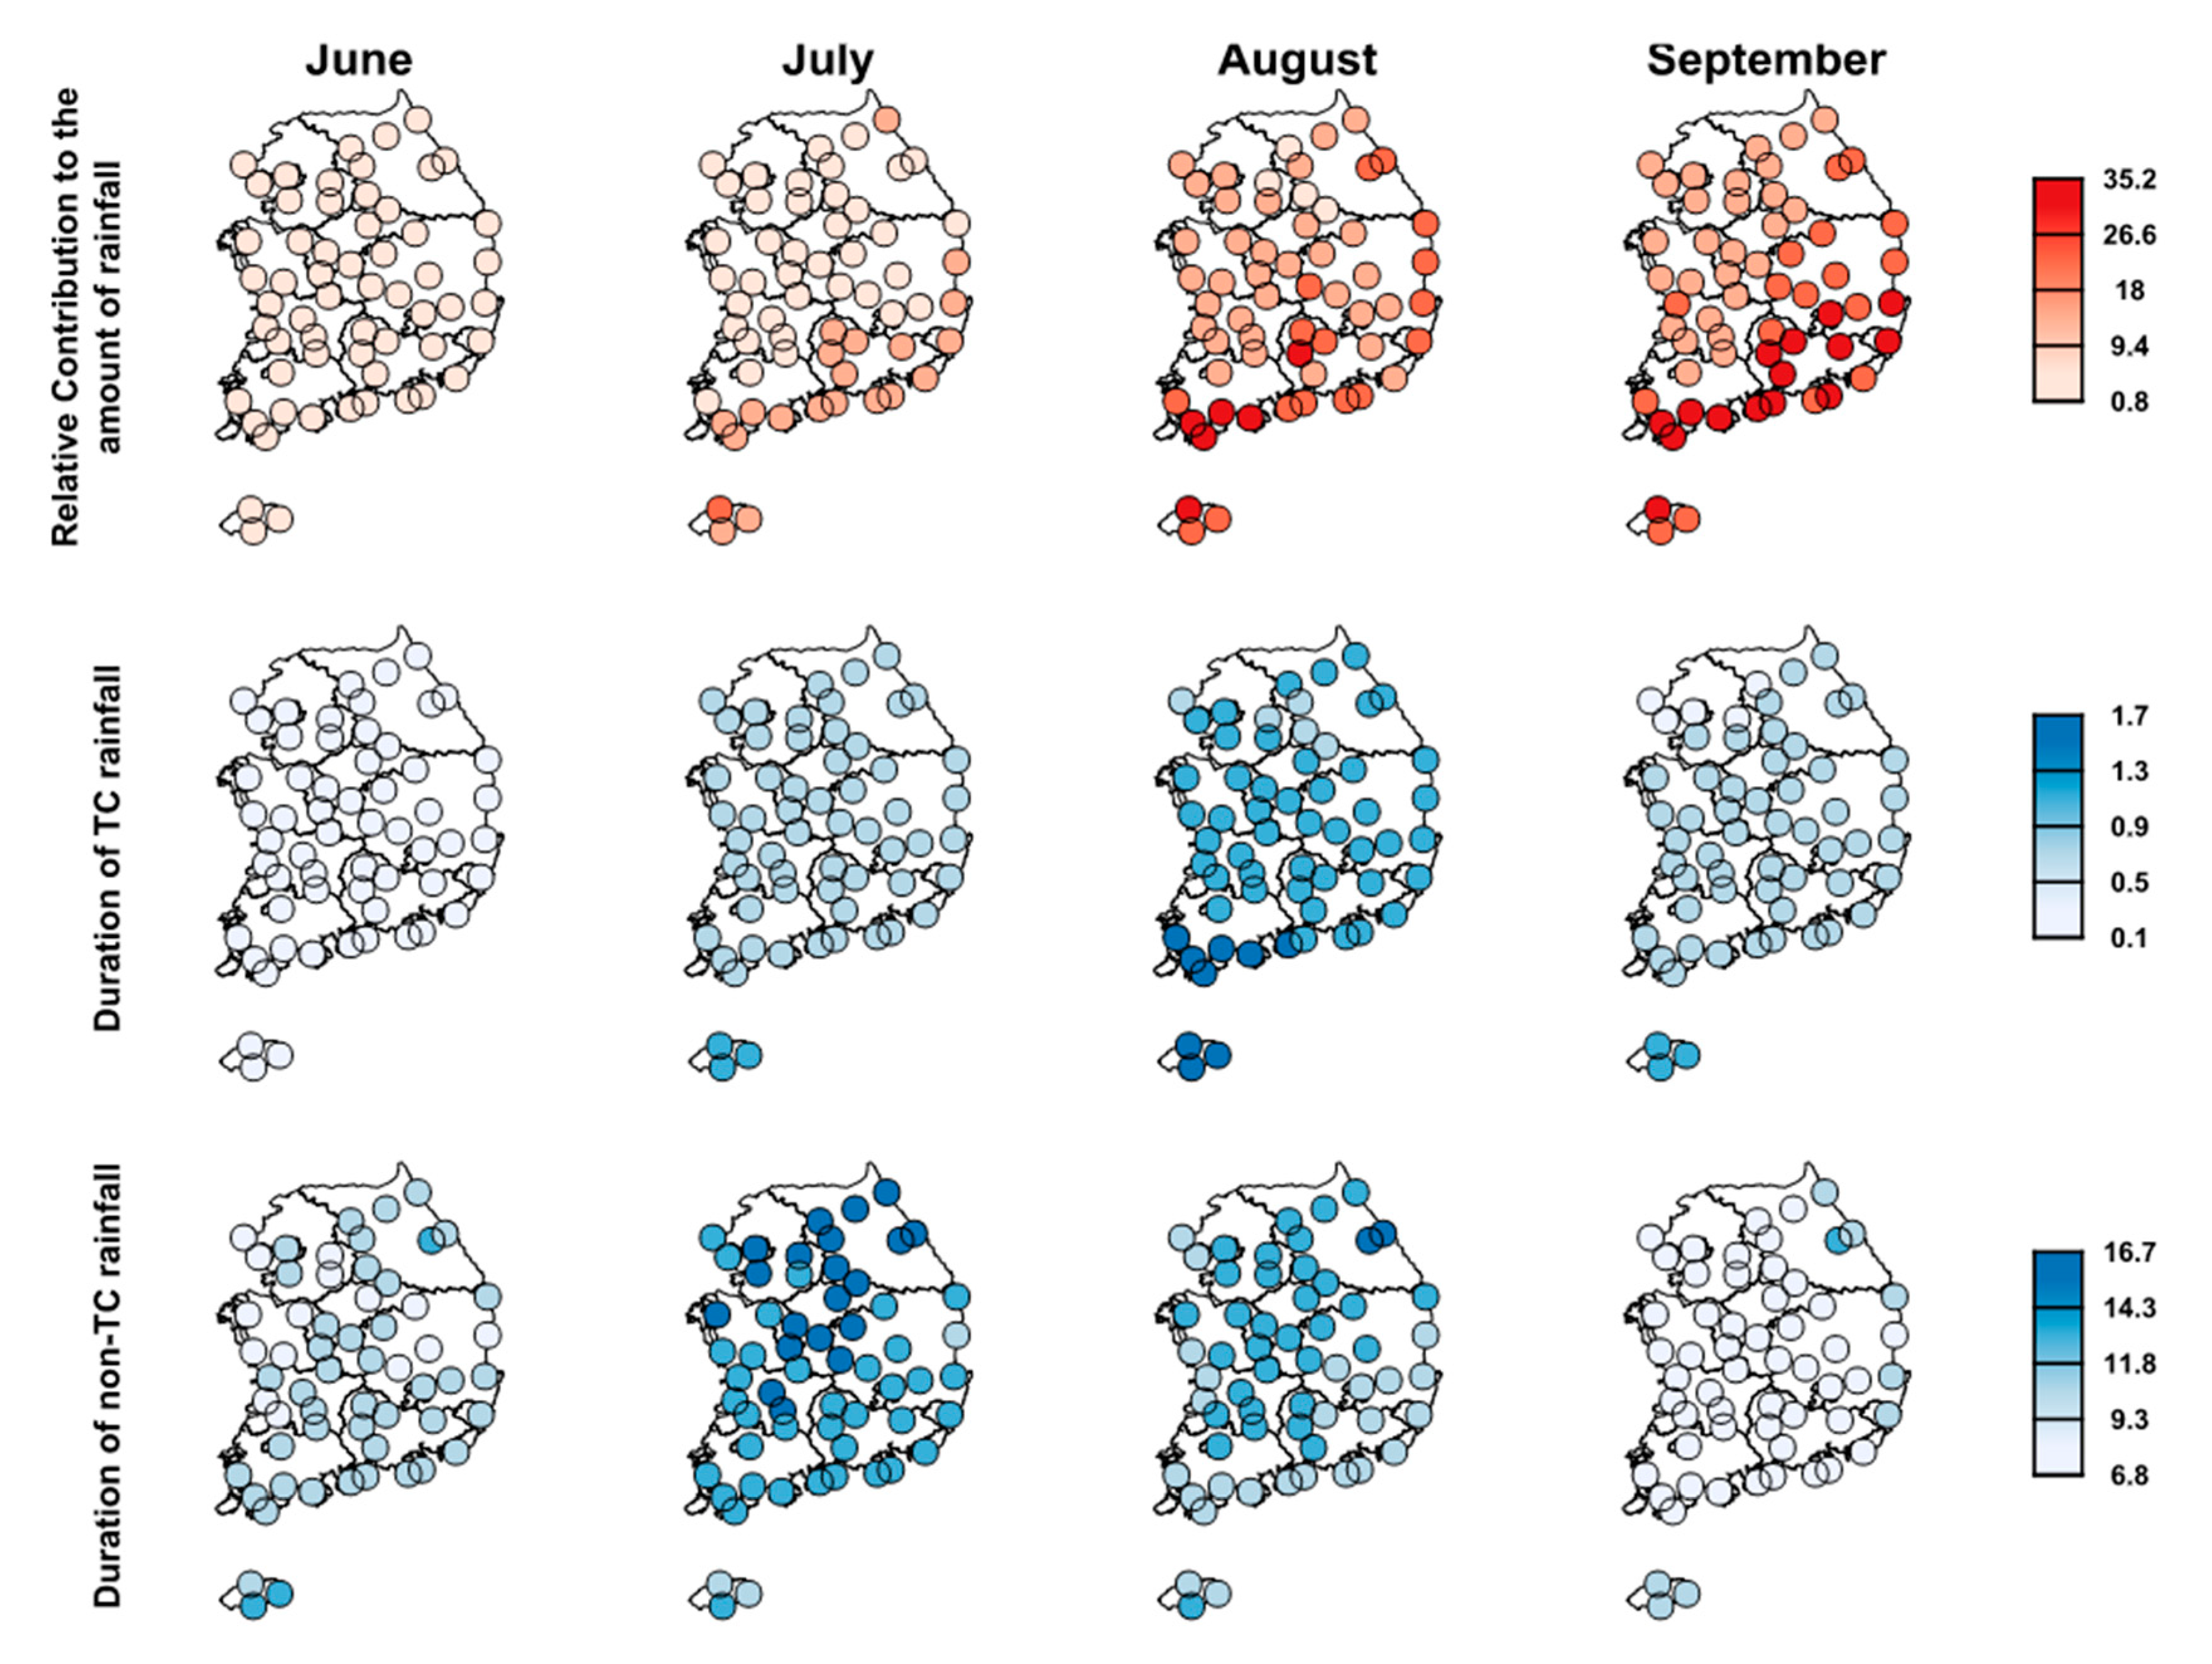
A similar analysis with the seasonal scale was conducted on a monthly scale (June to September). During the months of June and July, where most of non-TC events were known to occur, the relative contribution of TC rainfall was observed to be small compared to the months of August and September where TCs contributed up to 35.2% of rainfall to the total rainfall of some gauges located in the southern and eastern coastal areas (See Figure 5). The analysis for the durations of the two categories suggest that non-TC rainfall dominated the occurrence of rainfall during the months of June and July, wherein TCs barely occurred. Some gauges displayed an average of more than one typhoon event during the month of August, but a decline in the number started to occur in September. The huge amount of rainfall in the month of September implies that, despite having lesser duration, landfalling TCs during this month brought heavier rainfall. This is particularly important since some studies define the summer seasonal period as the months between June and August (JJA) to investigate the effect of TC (e.g., [12,61]). However, the results in this study showed that TC played a significant role more in late summer than in early summer. Without considering the TC impact on late summer, the effect of TC can be underestimated.
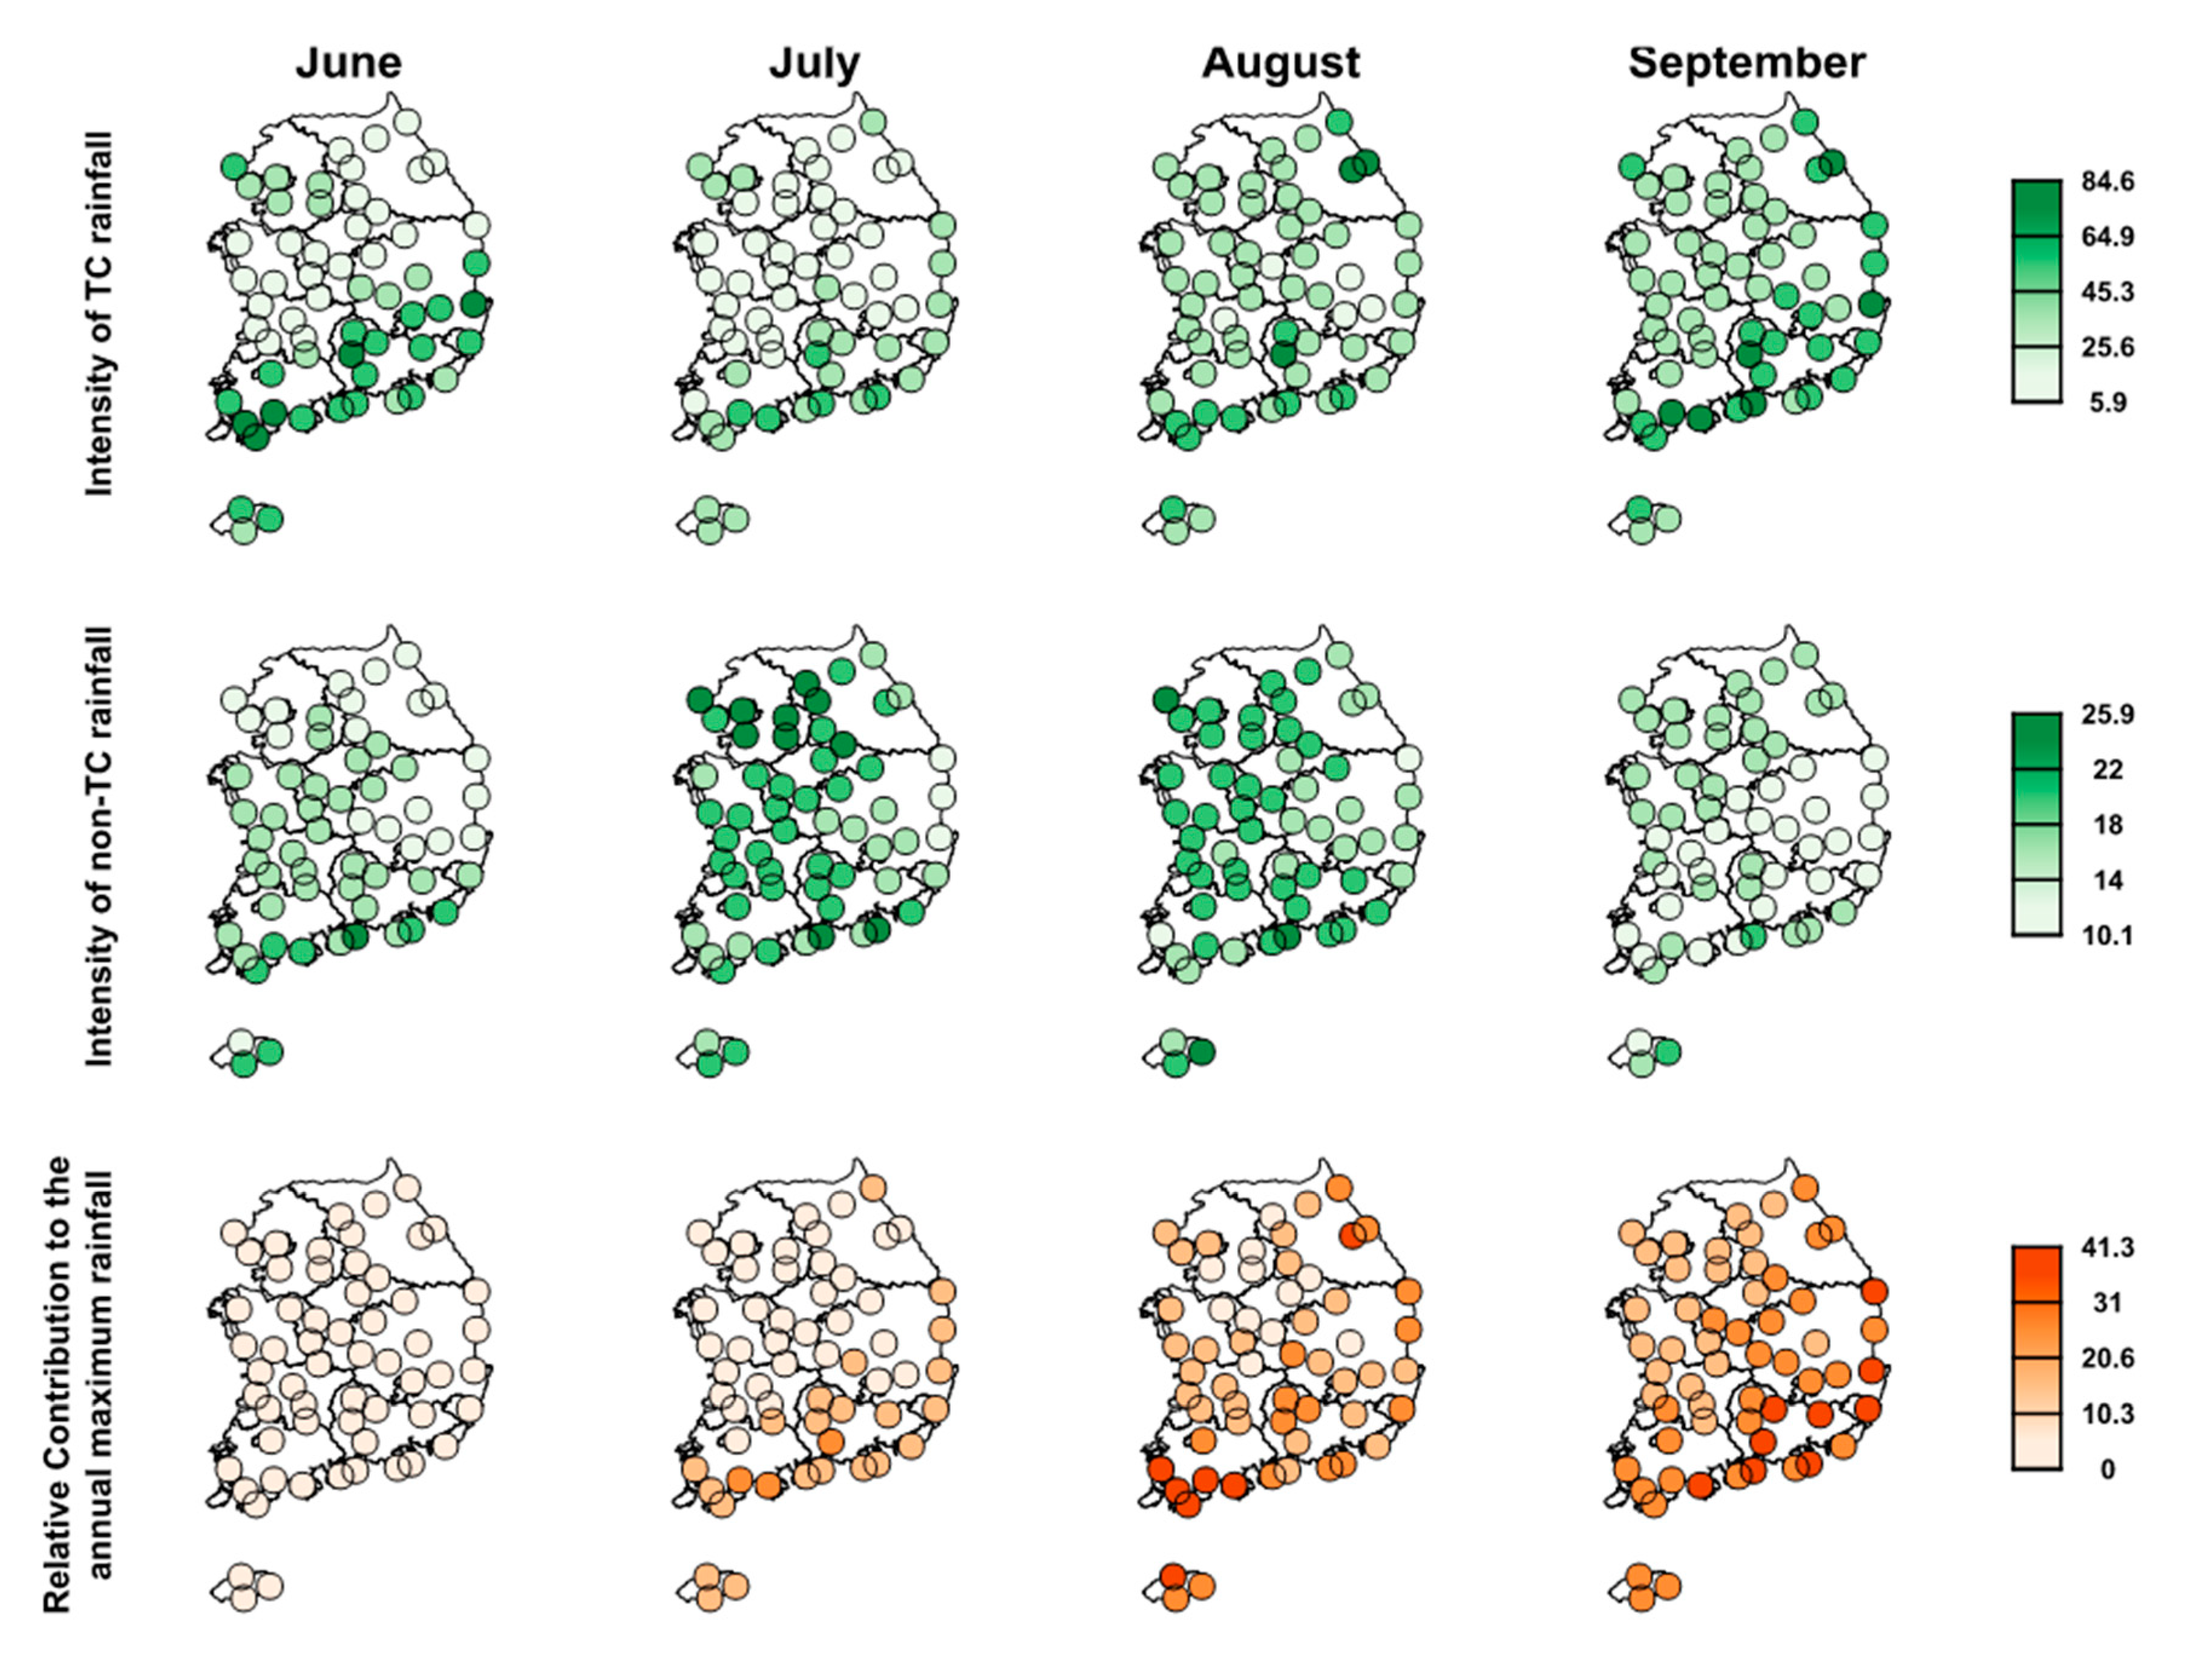
Similar to the result on the seasonal scale, the intensities of the TC rainfall were greater than the non-TC rainfall regardless of the month (see Figure 6). On the other hand, due to the prevalence of non-TC rainfall during the months of June and July, it is commonly assumed that maximum values in the time series during these months were solely non-TC induced. However, some stations received monthly maximum rainfall of up to 10% in June and 20% in July, while some stations in the months of August and September received almost half of their monthly maximum rainfall from landfalling TCs. Most of these stations were in the southern and eastern coastal areas.
Inspecting the contributions of the TC and non-TC events to the characteristics of rainfall in South Korea showed how the effects of the two dominant processes varied based on spatial and temporal factors. For instance, non-TC rainfall was more emphasized during the months of June and July due to local convection activities, while TC rainfall dominated the latter months of the summer season where they are known to occur the most [11]. Landfalling TCs were also more pronounced in the southern and eastern coastal areas partly due to their topographies. Extreme precipitation brought by landfalling TCs are magnified through the interaction of the storm circulation with the terrain of the area and mid-latitude baroclinic disturbances [32]. Park and Lee suggest that TC rainfall frequently occurs in coastal areas due to orographic lifting and low-level convergence of moisture from the ocean to the coastal and mountain areas [62]. Also, tropical cyclones are known to extract energy from warm ocean water, and moving to inland areas will make it lose its source of energy, thus losing its intensity.
4.3. Optimal Distributions for TC and Non-TC Rainfall
Three complementary approaches are employed to explore the proper probability distributions for the TC and non-TC wet-day series. The first method is the L-moments method. Figure 7 (top) displays the L-Cv vs. L-skewness L-moment diagram for the TC and non-TC wet-day series, respectively. It shows the curves which depict the theoretical relationship of the L-Cv and L-skewness of the candidate probability distributions and the points which depict the empirical relationship of the L-Cv and L-skewness of each gauge station. The degree as to which the theoretical distribution matches the empirical points dictates the goodness-of-fit of the candidate distributions. As seen, the empirical points of the non-TC rainfall were located between the region of the two-parameter GAM and WEI2 distributions, with both curves passing through some points. On the other hand, the empirical points of the TC rainfall displayed a non-uniform behavior and crossed three distributions such as EXP, GAM and WEI2.
On the other hand, the L-kurtosis vs. L-skew L-moment diagram displays the curves of the candidate distributions which have three parameters and points of distributions having two parameters. The empirical relationship between the L-kurtosis and L-skewness of each station is also plotted as a point. The empirical points of the non-TC rainfall seemed to fit well to the theoretical curve of the PT3 distribution. This aligns with the result from the L-Cv and L-skewness L-moment diagram, where the two-parameter GAM distribution passed some of the empirical points, since PT3 is just the two-parameter GAM distribution with an additional location parameter [4]. Meanwhile, the empirical points of the TC rainfall were again crossed by various curves including the GPA, PT3 and three-parameter WEI distributions. Therefore, we employed the three two-parameter distributions (EXP, GAM and WEI2) and three three-parameter distributions (GPA, PT3 and WEI3) for further analysis.
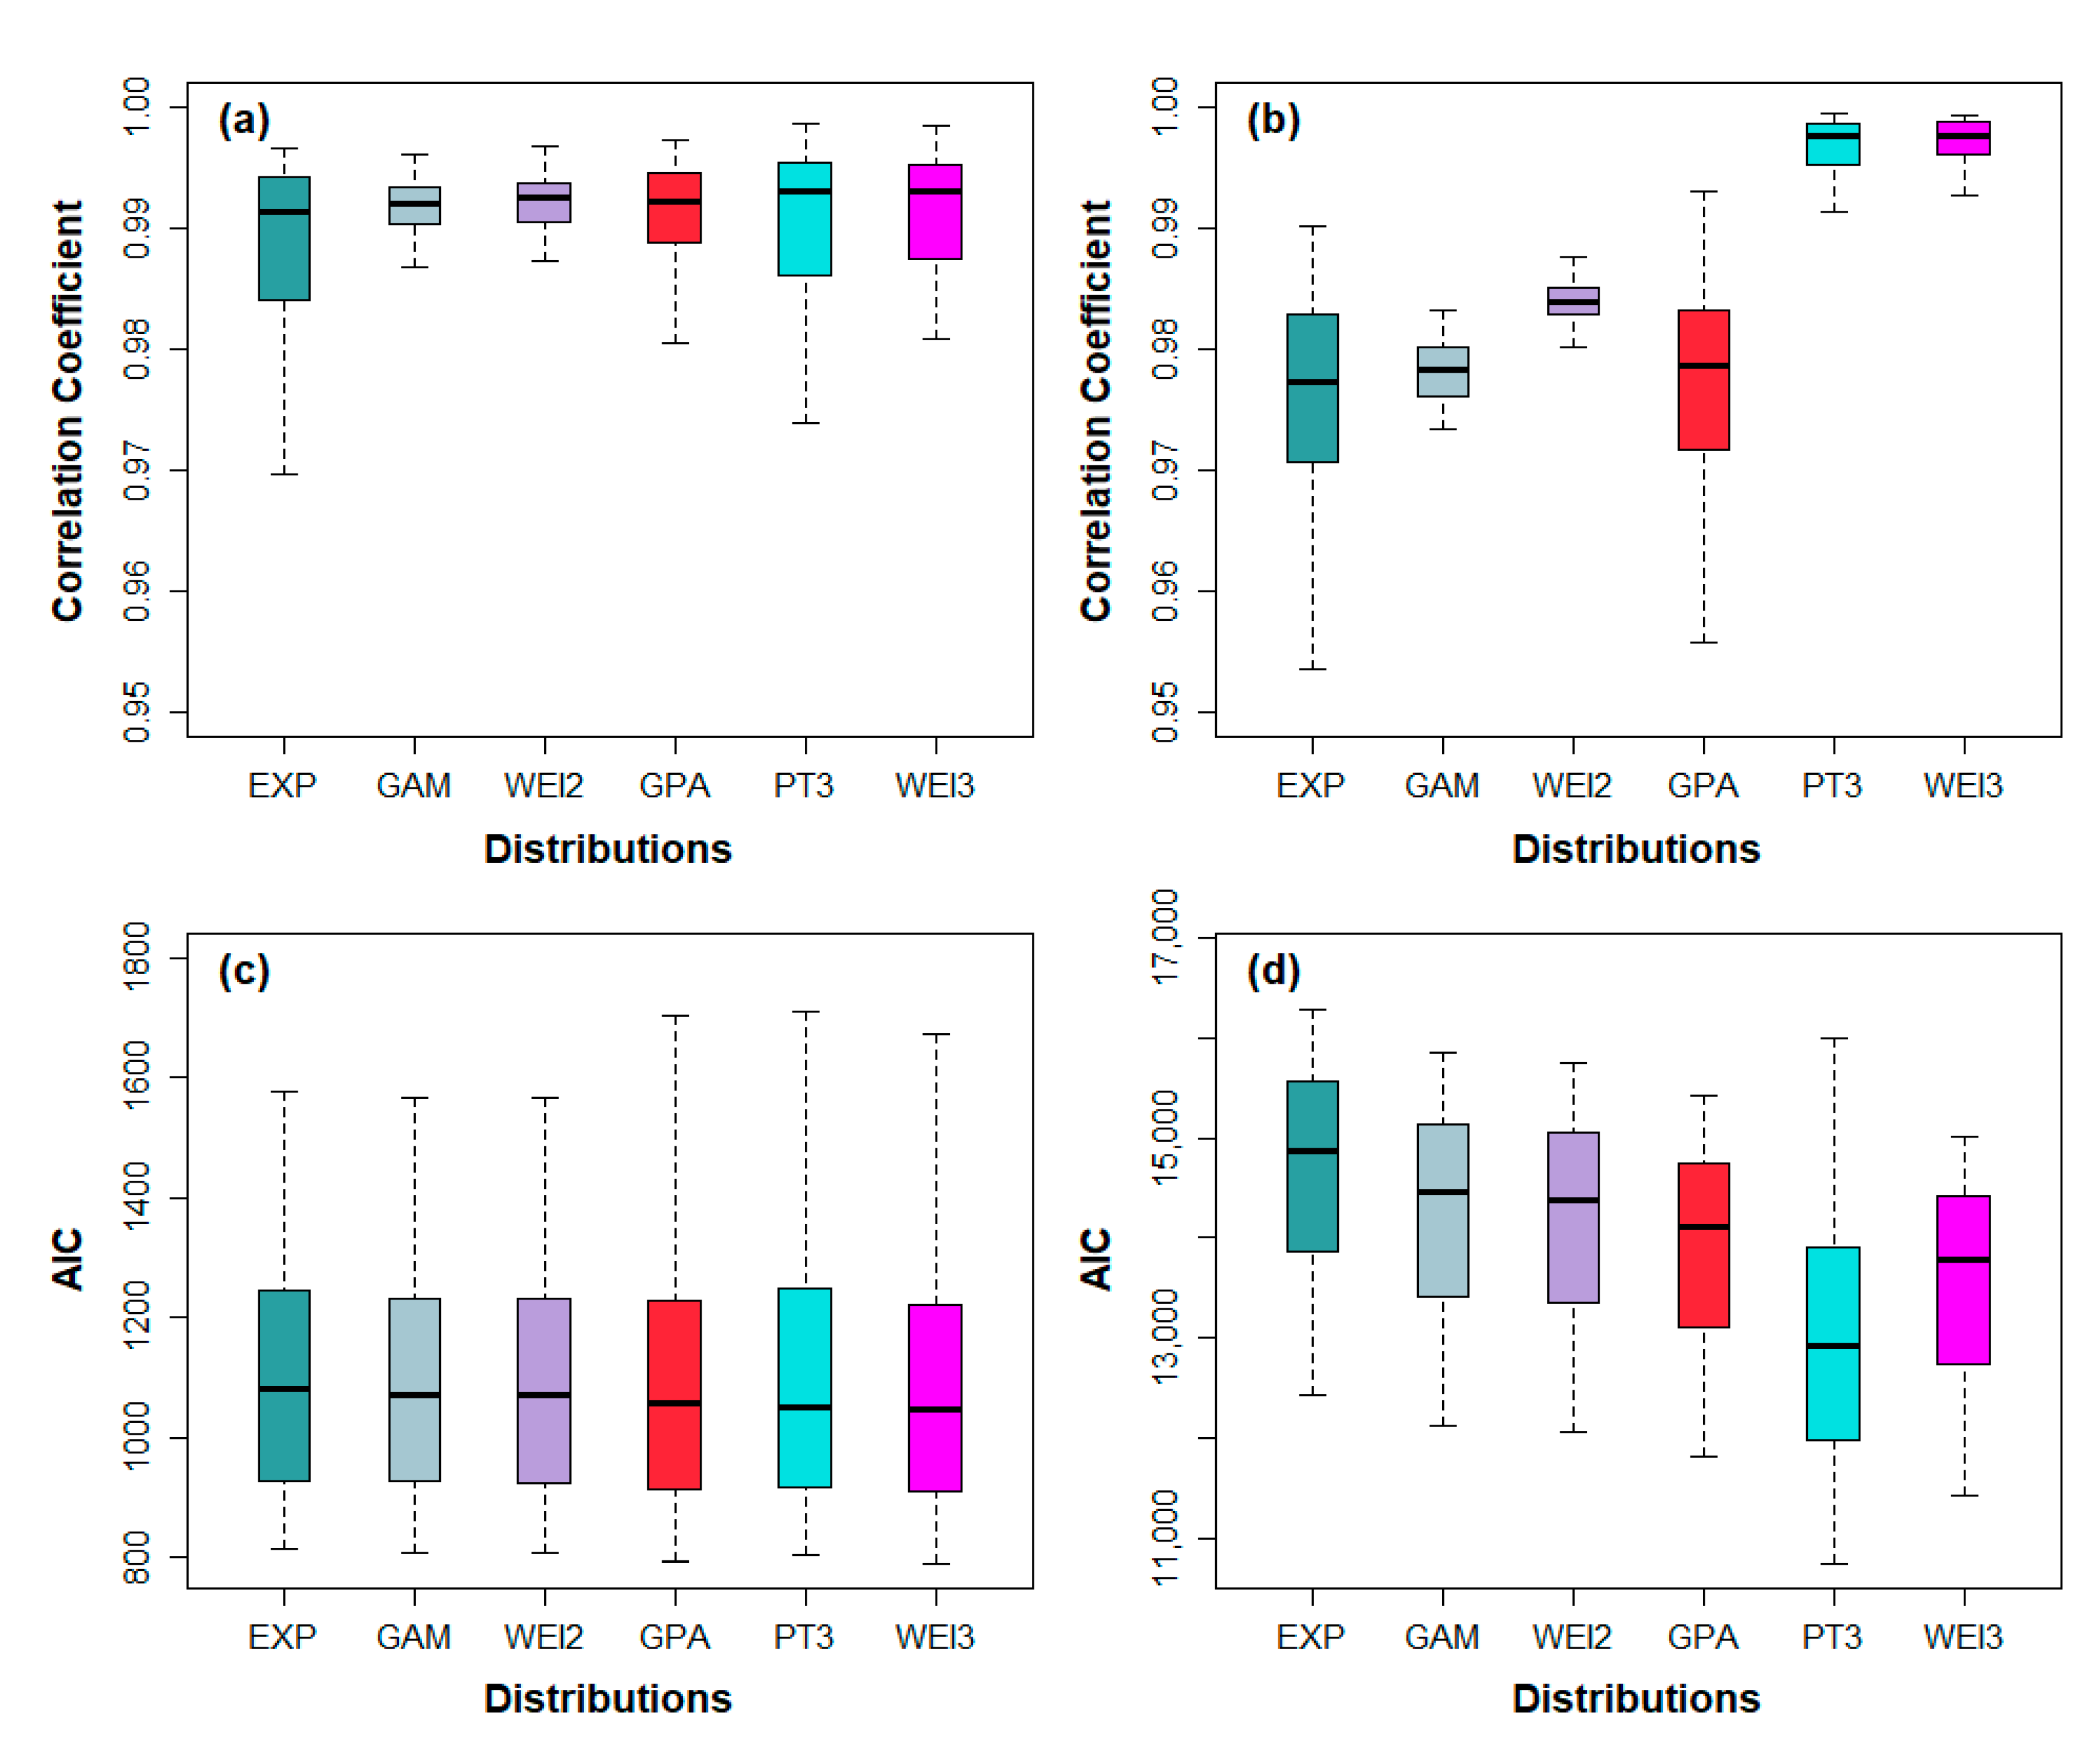
The six distributions underwent more tests, including the PPCC and AIC tests, to come up with a solid conclusion as to what distribution best represented each category. The boxplots in Figure 8a,b show that, despite having some outliers, almost all the chosen distributions applied to each station had PPCC values greater than 0.9. This indicates that the potential distributions found through the L-moment method seemed to perform well in representing all the types of wet-day series for the PPCC test. Among these distributions, the WEI2 distribution seemed to perform the best, followed by the GAM distribution. Despite performing well for the TC wet-day series when utilizing the L-moment method, the PPCC values of the PT3 and WEI3 distributions for the TC wet-day series were smaller compared to the two previously mentioned two-parameter distributions. On the other hand, the PPCC result for the wet-day series of non-TC rainfall showed a wider gap between the candidate distributions, with the WEI3 and PT3 distribution taking the lead.
The result of the AIC test is displayed as boxplots in Figure 8c,d. It is apparent that the PT3 had no competitor in having the lowest AIC values (median AIC: 12,930) for the non-TC wet-day series. Meanwhile, although the GAM and WEI2 distributions performed well in the AIC test, as well as in the other previously conducted tests for the TC wet-day series, more minimum AIC values were incurred when using the WEI3 distribution.
To sum up, after evaluating the goodness-of-fit of the candidate distributions, it is found that the PT3 distribution best represented non-TC wet-day series, while the two and three-parameter WEI distributions were more suitable for the TC wet-day series. We also note that the GAM and WEI3 distributions may be acceptable for the TC and non-TC wet-day series, respectively. As seen, the probability distribution suited for the non-TC wet-day series varied from the probability distributions that best define the TC wet-day series. This can be attributed to the temporal scale considered in the study. The daily temporal scale emphasized how the values of non-TC wet-day series differed from TC wet-day series, especially in their extreme values. Short-time increment rainfall resolutions such as daily or hourly scales have high variability, therefore producing highly skewed distributions of rainfall amounts with a bias toward high amounts for the TC wet-day series and low amounts for the non-TC wet day series [2].
5. Discussions and Conclusions
Hydrological frequency analysis is an important tool to predict extreme hydrological events in the absence of historical or long-term data series. Normally, homogeneity in the time series is assumed when conducting such analysis. This suggests that the dominant processes or synoptic disturbances in the atmosphere are uniform all throughout a year or a season. However, a closer inspection in the time series of different gauges in South Korea during the summer season proved that this assumption is not valid.
This study inspects the contribution of the TC and non-TC rainfall to the seasonal and monthly rainfall characteristics of South Korea. The TC rainfall is defined as the rainfall during a recorded tropical cyclone event that occurred within a radial distance of 500 km from the TC center to each station. The result for the seasonal scale shows that the TC rainfall played a valuable role in contributing to the seasonal amount of rainfall, especially in the southern and eastern coastal areas. The inspection of the intensity and duration of the seasonal rainfall showed that, although non-TC events occurred more frequent than TCs, the rainfall induced by landfalling TCs were stronger and heavier. Meanwhile, the results in the monthly scale showed why TCs in late summer should get more attention than TCs during the early summer. Some gauges in the months of August and September attributed as much as 35% of their monthly amount of rainfall and 40% of monthly annual maximum rainfall to landfalling TCs.
After proving the need to categorize the rainfall in South Korea into TC and non-TC rainfall, we tested several probability distributions to determine which best represented the two wet-day daily time series for hydrological frequency analysis. After applying various tests, Weibull and Gamma distributions were found to be robust and acceptable to represent the daily wet-day series of TC rainfall data. On the other hand, the Pearson Type III distribution was unquestionably the best distribution that could represent the non-TC wet day series.
While promising, this study suffers from some limitations. First, this study adopted a simple definition to determine the TC rainfall events. We did not consider the magnitude of each TC, disregarding the diverse size of tropical cyclones and their different impacts on land rainfall. One idea is that TC events can be defined using the magnitude of the central pressure as well as its distance from the rainfall gauge. Next, while multiple aspects were explored to characterize the effect of historical TC rainfall, the illustrated effect in this study is not guaranteed to be mirrored again in the near future. Previous studies have reported that anthropogenic-induced changes on hydroclimate in the northwestern Pacific will likely increase the frequency of heavy rainfall events and summer water deficits by the end of the twenty-first century [63,64]. To confirm the temporal changes, this study additionally examined the trends of rainfall induced by TC and non-TC events over the study area with a Mann–Kendall analysis [65,66], but significant changes were not detected (not shown). However, other literature that considered a different timeframe found significant changes in the pattern of rainfall in South Korea. For instance, Wi et al. divided the daily rainfall in South Korea into sub-daily records before conducting a trend analysis [67]. Their trend test showed that a substantial portion of the country, particularly in the northeast and southeast regions, experienced significant increasing change. This illustrates how the pattern of rainfall, which can be TC or non-TC induced, can immediately change in time. Hence, more explicit research in the dominant processes like tropical cyclones is needed to ensure that all the possible changes in its characteristics and patterns are considered.
As future research, our findings can be extended for future flooding risk analysis. Under climate change, many individual potential shifts are possible, including magnitude and frequency changes related to TC and non-TC rainfall events. A wide range of flooding risk analyses considering a variety of climate scenarios may enable planners to evaluate how different assumptions of future climate conditions would impact the hydrologic decision process. This can help facilitate discussion between planners and help them reach a consensus during the final decision. This exploration is currently carried out and will be presented in future work.
Author Contributions
Conceptualization, K.-H.A.; Formal analysis, A.L.A.; Investigation, A.L.A.; Methodology, A.L.A.; Supervision, K.-H.A.; Writing—original draft, A.L.A.; Writing—review & editing, K.-H.A. All authors have read and agreed to the published version of the manuscript.
Funding
This work was supported by the research grant (No. 2019-0133-01) from the Kongju National University in 2019.
Acknowledgements
We would like to express our gratitude to the anonymous authors for their suggestions and comments.
Conflicts of Interest
The authors declare no conflicts of interest.
References
- Harmel, R.; King, K.; Richardson, C.; Williams, J. Long–term precipitation analyses for the central Texas blackland prairie. Trans. ASAE 2003, 46, 1381. [Google Scholar] [CrossRef]
- Hundecha, Y.; Pahlow, M.; Schumann, A. Modeling of daily precipitation at multiple locations using a mixture of distributions to characterize the extremes. Water Resour. Res. 2009, 45. [Google Scholar] [CrossRef] [Green Version]
- De Michele, C.; Avanzi, F. Superstatistical distribution of daily precipitation extremes: A worldwide assessment. Sci. Rep. 2018, 8, 14204. [Google Scholar] [CrossRef]
- Ye, L.; Hanson, L.S.; Ding, P.; Wang, D.; Vogel, R.M. The probability distribution of daily precipitation at the point and catchment scales in the United States. Hydrol. Earth Syst. Sci. 2018, 22, 6519–6531. [Google Scholar] [CrossRef] [Green Version]
- Yue, S.; Hashino, M. Probability distribution of annual, seasonal and monthly precipitation in Japan. Hydrol. Sci. J. 2007, 52, 863–877. [Google Scholar] [CrossRef]
- Blöschl, G.; Gaál, L.; Hall, J.; Kiss, A.; Komma, J.; Nester, T.; Parajka, J.; Perdigão, R.A.; Plavcová, L.; Rogger, M.; et al. Increasing river floods: Fiction or reality? Wiley Interdiscip. Rev. Water 2015, 2, 329–344. [Google Scholar] [CrossRef]
- Merz, B.; Aerts, J.; Arnbjerg-Nielsen, K.; Baldi, M.; Becker, A.; Bichet, A.; Blöschl, G.; Bouwer, L.; Brauer, A.; Cioffi, F.; et al. Floods and climate: Emerging perspectives for flood risk assessment and management. Nat. Hazards Earth Syst. Sci. 2014, 14, 1921–1942. [Google Scholar] [CrossRef] [Green Version]
- Lee, S.-S.; Vinayachandran, P.; Ha, K.-J.; Jhun, J.-G. Shift of peak in summer monsoon rainfall over Korea and its association with El Niño–Southern Oscillation. J. Geophys. Res. Atmos. 2010, 115. [Google Scholar] [CrossRef] [Green Version]
- Son, C.; Lee, T.; Kwon, H. Integrating nonstationary behaviors of typhoon and non-typhoon extreme rainfall events in East Asia. Sci. Rep. 2017, 7, 5097. [Google Scholar] [CrossRef] [Green Version]
- Chang, H.; Kwon, W.-T. Spatial variations of summer precipitation trends in South Korea, 1973–2005. Environ. Res. Lett. 2007, 2, 045012. [Google Scholar] [CrossRef] [Green Version]
- Choi, J.-W.; Cha, Y.; Kim, H.-D. Interdecadal variation of precipitation days in August in the Korean Peninsula. Dyn. Atmos. Ocean. 2017, 77, 74–88. [Google Scholar] [CrossRef]
- Lee, J.-Y.; Kwon, M.; Yun, K.-S.; Min, S.-K.; Park, I.-H.; Ham, Y.-G.; Jin, E.K.; Kim, J.-H.; Seo, K.-H.; Kim, W.; et al. The long-term variability of Changma in the East Asian summer monsoon system: A review and revisit. Asia Pac. J. Atmos. Sci. 2017, 53, 257–272. [Google Scholar] [CrossRef]
- Seo, E.-K.; Kim, K.-M. Precipitating cloud characteristics during Changma as seen in TRMM PR observations. Adv. Meteorol. 2017, 2017. [Google Scholar] [CrossRef] [Green Version]
- Mei, W.; Xie, S.-P.; Primeau, F.; McWilliams, J.C.; Pasquero, C. Northwestern Pacific typhoon intensity controlled by changes in ocean temperatures. Sci. Adv. 2015, 1, e1500014. [Google Scholar] [CrossRef] [Green Version]
- Ho, C.-H.; Lee, J.-Y.; Ahn, M.-H.; Lee, H.-S. A sudden change in summer rainfall characteristics in Korea during the late 1970s. Int. J. Climatol. A J. R. Meteorol. Soc. 2003, 23, 117–128. [Google Scholar] [CrossRef]
- Kim, J.-S.; Li, R.C.-Y.; Zhou, W. Effects of the Pacific-Japan teleconnection pattern on tropical cyclone activity and extreme precipitation events over the Korean peninsula. J. Geophys. Res. Atmos. 2012, 117. [Google Scholar] [CrossRef] [Green Version]
- Son, C.-Y.; Kim, J.-S.; Moon, Y.-I.; Lee, J.-H. Characteristics of tropical cyclone-induced precipitation over the Korean River basins according to three evolution patterns of the Central-Pacific El Nino. Stoch. Environ. Res. Risk Assess. 2014, 28, 1147–1156. [Google Scholar] [CrossRef]
- Knutson, T.; Mcbride, J.; Chan, J.; Emanuel, K.; Holland, G.; Landsea, C.; Held, I.; Kossin, J.; Srivastava, A.; Sugi, M. Tropical Cyclones and Climate Change. Nat. Geosci. 2010, 3. [Google Scholar] [CrossRef] [Green Version]
- Walsh, K.J.; McBride, J.L.; Klotzbach, P.J.; Balachandran, S.; Camargo, S.J.; Holland, G.; Knutson, T.R.; Kossin, J.P.; Lee, T.; Sobel, A.; et al. Tropical cyclones and climate change. Wiley Interdiscip. Rev. Clim. Chang. 2016, 7, 65–89. [Google Scholar] [CrossRef]
- Corbosiero, K.L.; Dickinson, M.J.; Bosart, L.F. The contribution of eastern North Pacific tropical cyclones to the rainfall climatology of the southwest United States. Mon. Weather Rev. 2009, 137, 2415–2435. [Google Scholar] [CrossRef]
- Farfán, L.M.; Fogel, I. Influence of tropical cyclones on humidity patterns over southern Baja California, Mexico. Mon. Weather Rev. 2007, 135, 1208–1224. [Google Scholar] [CrossRef]
- Ritchie, E.A.; Wood, K.M.; Gutzler, D.S.; White, S.R. The influence of eastern Pacific tropical cyclone remnants on the southwestern United States. Mon. Weather Rev. 2011, 139, 192–210. [Google Scholar] [CrossRef]
- Lu, R.; Ye, H.; Jhun, J.-G. Weakening of interannual variability in the summer East Asian upper-tropospheric westerly jet since the mid-1990s. Adv. Atmos. Sci. 2011, 28, 1246. [Google Scholar] [CrossRef]
- Sun, Y.; Ding, Y. A projection of future changes in summer precipitation and monsoon in East Asia. Sci. China Earth Sci. 2010, 53, 284–300. [Google Scholar] [CrossRef]
- Xiang, B.; Wang, B. Mechanisms for the advanced Asian summer monsoon onset since the mid-to-late 1990s. J. Clim. 2013, 26, 1993–2009. [Google Scholar] [CrossRef]
- Chang, W.; Stein, M.L.; Wang, J.; Kotamarthi, V.R.; Moyer, E.J. Changes in spatiotemporal precipitation patterns in changing climate conditions. J. Clim. 2016, 29, 8355–8376. [Google Scholar] [CrossRef]
- Prein, A.F.; Liu, C.; Ikeda, K.; Bullock, R.; Rasmussen, R.M.; Holland, G.J.; Clark, M. Simulating North American mesoscale convective systems with a convection-permitting climate model. Clim. Dyn. 2017, 1–16. [Google Scholar] [CrossRef] [Green Version]
- Byun, K.-Y.; Lee, T.-Y. Remote effects of tropical cyclones on heavy rainfall over the Korean peninsula–statistical and composite analysis. Tellus A Dyn. Meteorol. Oceanogr. 2012, 64, 14983. [Google Scholar] [CrossRef] [Green Version]
- Kim, S.; Tachikawa, Y.; Takara, K. Recent Flood Disasters and Progress of Disaster Management System in Korea. 2007. Available online: http://hdl.handle.net/2433/73352 (accessed on 23 April 2020).
- Kim, J.-S.; Jain, S. Precipitation trends over the Korean peninsula: Typhoon-induced changes and a typology for characterizing climate-related risk. Environ. Res. Lett. 2011, 6, 034033. [Google Scholar] [CrossRef]
- Yang, T.; Shao, Q.; Hao, Z.-C.; Chen, X.; Zhang, Z.; Xu, C.-Y.; Sun, L. Regional frequency analysis and spatio-temporal pattern characterization of rainfall extremes in the Pearl River Basin, China. J. Hydrol. 2010, 380, 386–405. [Google Scholar] [CrossRef]
- Yang, X.; Qian, J. Joint occurrence probability analysis of typhoon-induced storm surges and rainstorms using trivariate Archimedean copulas. Ocean Eng. 2019, 171, 533–539. [Google Scholar] [CrossRef]
- Yoon, P.; Kim, T.-W.; Yoo, C. Rainfall frequency analysis using a mixed GEV distribution: A case study for annual maximum rainfalls in South Korea. Stoch. Environ. Res. Risk Assess. 2013, 27, 1143–1153. [Google Scholar] [CrossRef]
- Bezak, N.; Brilly, M.; Šraj, M. Comparison between the peaks-over-threshold method and the annual maximum method for flood frequency analysis. Hydrol. Sci. J. 2014, 59, 959–977. [Google Scholar] [CrossRef] [Green Version]
- Papalexiou, S.M.; Koutsoyiannis, D. Entropy based derivation of probability distributions: A case study to daily rainfall. Adv. Water Resour. 2012, 45, 51–57. [Google Scholar] [CrossRef]
- Suhaila, J.; Jemain, A.A. Fitting daily rainfall amount in Peninsular Malaysia using several types of exponential distributions. J. Appl. Sci. Res. 2007, 3, 1027–1036. [Google Scholar]
- Klein Tank, A.; Wijngaard, J.; Können, G.; Böhm, R.; Demarée, G.; Gocheva, A.; Mileta, M.; Pashiardis, S.; Hejkrlik, L.; Kern-Hansen, C.; et al. Daily dataset of 20th-century surface air temperature and precipitation series for the European Climate Assessment. Int. J. Climatol. A J. R. Meteorol. Soc. 2002, 22, 1441–1453. [Google Scholar] [CrossRef]
- Jung, H.-S.; Choi, Y.; Oh, J.-H.; Lim, G.-H. Recent trends in temperature and precipitation over South Korea. Int. J. Climatol. A J. R. Meteorol. Soc. 2002, 22, 1327–1337. [Google Scholar] [CrossRef]
- Vieux, B.E.; Park, J.-H.; Kang, B. Distributed hydrologic prediction: Sensitivity to accuracy of initial soil moisture conditions and radar rainfall input. J. Hydrol. Eng. 2009, 14, 671–689. [Google Scholar] [CrossRef]
- Ryoo, S.-B.; Kwon, W.-T.; Jhun, J.-G. Characteristics of wintertime daily and extreme minimum temperature over South Korea. Int. J. Climatol. A J. R. Meteorol. Soc. 2004, 24, 145–160. [Google Scholar] [CrossRef]
- Ahn, K.-H.; Kim, Y.-O. Incorporating climate model similarities and hydrologic error models to quantify climate change impacts on future riverine flood risk. J. Hydrol. 2019, 570, 118–131. [Google Scholar] [CrossRef]
- Xiao, Q.; Kuo, Y.-H.; Sun, J.; Lee, W.-C.; Barker, D.M.; Lim, E. An approach of radar reflectivity data assimilation and its assessment with the inland QPF of Typhoon Rusa (2002) at landfall. J. Appl. Meteorol. Climatol. 2007, 46, 14–22. [Google Scholar] [CrossRef] [Green Version]
- Lee, I.; Ha, Y.; Kim, Y.; Kwon, Y. PTSD symptoms in elementary school children after Typhoon Rusa. J. Korean Acad. Nurs. 2004, 34, 636–645. [Google Scholar] [CrossRef] [Green Version]
- Kim, C.W.; Woo, H.; Kim, W.; Lee, D.H.; Yoon, K.S. Re-channelization of stream channels affected by an extreme flood due to the 2002 Typhoon Rusa in Korea. In Critical Transitions in Water and Environmental Resources Management; American Society of Civil Engineers: New York, NY, USA, 2004; pp. 1–10. [Google Scholar] [CrossRef]
- Li, R.C.; Zhou, W.; Lee, T.C. Climatological characteristics and observed trends of tropical cyclone–induced rainfall and their influences on long-term rainfall variations in Hong Kong. Mon. Weather Rev. 2015, 143, 2192–2206. [Google Scholar] [CrossRef]
- Tennant, W.J.; Hewitson, B.C. Intra-seasonal rainfall characteristics and their importance to the seasonal prediction problem. Int. J. Climatol. A J. R. Meteorol. Soc. 2002, 22, 1033–1048. [Google Scholar] [CrossRef]
- Kumar, V. Others Statistical distribution of rainfall in Uttarakhand, India. Appl. Water Sci. 2017, 7, 4765–4776. [Google Scholar] [CrossRef]
- Waseem, M.; Mani, N.; Andiego, G.; Usman, M. A review of criteria of fit for hydrological models. Int. Res. J. Eng. Technol. 2017, 4, 1765–1772. [Google Scholar]
- Hosking, J.R. L-moments: Analysis and estimation of distributions using linear combinations of order statistics. J. R. Stat. Soc. Ser. B 1990, 52, 105–124. [Google Scholar] [CrossRef]
- Filliben, J.J. The probability plot correlation coefficient test for normality. Technometrics 1975, 17, 111–117. [Google Scholar] [CrossRef]
- Akaike, H.; Petrov, B.N.; Csaki, F. Second International Symposium on Information Theory; Akadémiai Kiadó: Budapest, Hungary, 1973. [Google Scholar]
- Asquith, W.H. Distributional Analysis with L-Moment Statistics Using the R Environment for Statistical Computing; CreateSpace: Scotts Valley, CA, USA, 2011. [Google Scholar]
- Heo, J.-H.; Kho, Y.W.; Shin, H.; Kim, S.; Kim, T. Regression equations of probability plot correlation coefficient test statistics from several probability distributions. J. Hydrol. 2008, 355, 1–15. [Google Scholar] [CrossRef]
- Lenart, A.; Missov, T.I. Goodness-of-fit tests for the Gompertz distribution. Commun. Stat. Theory Methods 2016, 45, 2920–2937. [Google Scholar] [CrossRef] [Green Version]
- Kim, H.; Kim, S.; Shin, H.; Heo, J.-H. Appropriate model selection methods for nonstationary generalized extreme value models. J. Hydrol. 2017, 547, 557–574. [Google Scholar] [CrossRef]
- Li, C.; Singh, V.P.; Mishra, A.K. A bivariate mixed distribution with a heavy-tailed component and its application to single-site daily rainfall simulation. Water Resour. Res. 2013, 49, 767–789. [Google Scholar] [CrossRef] [Green Version]
- Schoups, G.; Van de Giesen, N.; Savenije, H. Model complexity control for hydrologic prediction. Water Resour. Res. 2008, 44. [Google Scholar] [CrossRef] [Green Version]
- Li, Q.; Wang, Y. A comparison of inner and outer spiral rainbands in a numerically simulated tropical cyclone. Mon. Weather Rev. 2012, 140, 2782–2805. [Google Scholar] [CrossRef]
- Gu, X.; Zhang, Q.; Singh, V.P.; Liu, L.; Shi, P. Spatiotemporal patterns of annual and seasonal precipitation extreme distributions across China and potential impact of tropical cyclones. Int. J. Climatol. 2017, 37, 3949–3962. [Google Scholar] [CrossRef]
- Zhang, Q.; Gu, X.; Li, J.; Shi, P.; Singh, V.P. The impact of tropical cyclones on extreme precipitation over coastal and inland areas of China and its association to ENSO. J. Clim. 2018, 31, 1865–1880. [Google Scholar] [CrossRef]
- Kim, J.-S.; Kang, H.; Son, C.-Y.; Moon, Y.-I. Spatial variations in typhoon activities and precipitation trends over the Korean Peninsula. J. Hydro Environ. Res. 2015, 13, 144–151. [Google Scholar] [CrossRef]
- Park, S.K.; Lee, E. Synoptic features of orographically enhanced heavy rainfall on the east coast of Korea associated with Typhoon Rusa (2002). Geophys. Res. Lett. 2007, 34. [Google Scholar] [CrossRef] [Green Version]
- IPCC. IPCC Fifth Assessment Synthesis Report. In Intergovernmental Panel on Climate Change; IPCC: Geneva, Switzerland, 2014; Available online: https://www.ipcc.ch (accessed on 23 April 2020).
- Trenberth, K.E. Changes in precipitation with climate change. Clim. Res. 2011, 47, 123–138. [Google Scholar] [CrossRef] [Green Version]
- Kendall, M.G. Rank Correlation Method; Griffin: London, UK, 1975. [Google Scholar]
- Mann, H.B. Nonparametric tests against trend. Econom. J. Econom. Soc. 1945, 13, 245–259. Available online: https://www.jstor.org/stable/1907187 (accessed on 4 April 2020). [CrossRef]
- Wi, S.; Valdés, J.B.; Steinschneider, S.; Kim, T.-W. Non-stationary frequency analysis of extreme precipitation in South Korea using peaks-over-threshold and annual maxima. Stoch. Environ. Res. Risk Assess. 2016, 30, 583–606. [Google Scholar] [CrossRef]
Figure 1.
Map of the study area and gauge networks. In this map, the average summer precipitation amount from 1973–2018 is presented. Also, the intra-annual variations of areal precipitation are demonstrated as boxplots. Jeju Island is represented by a hash (#), while Station KR184 is represented by an asterisk (*).

Figure 2.
Example of a TC traversing South Korea. Shown is the track of Tropical Cyclone Rusa from 27 August to 1 September 2002.
Figure 2.
Example of a TC traversing South Korea. Shown is the track of Tropical Cyclone Rusa from 27 August to 1 September 2002.

Figure 3.
(a) Aerial precipitation in South Korea plotted as a function of the distance of each station from the TC center and (b) the distances (top bars) and their corresponding precipitation depths (bottom bars) recorded at Station KR184.
Figure 3.
(a) Aerial precipitation in South Korea plotted as a function of the distance of each station from the TC center and (b) the distances (top bars) and their corresponding precipitation depths (bottom bars) recorded at Station KR184.

Figure 4.
First column displays the relative contribution of TCs to the seasonal (a) amount and (d) annual maximum rainfall (percentage). The second column shows the (b) duration (days) and (e) intensity (mm/day) of TC rainfall, while the third column displays the (c) duration and (f) intensity of non-TC rainfall.

Figure 5.
The relative contribution of TCs to the amount of rainfall (percentage) and the duration of non-TC and TC rainfall (days) in the months of June, July, August and September.
Figure 5.
The relative contribution of TCs to the amount of rainfall (percentage) and the duration of non-TC and TC rainfall (days) in the months of June, July, August and September.

Figure 6.
The intensity of non-TC and TC rainfall (mm/day) and the relative contribution of TCs to the annual maximum rainfall (percentage) in the months of June, July, August and September.
Figure 6.
The intensity of non-TC and TC rainfall (mm/day) and the relative contribution of TCs to the annual maximum rainfall (percentage) in the months of June, July, August and September.

Figure 7.
L-Cv and L-skewness L-moment ratio diagram of the (a) TC and (b) non-TC wet-day series with the theoretical curves of several two-parameter distributions. L-kurtosis and L-skewness L-moment ratio diagram of (c) TC and (d) non-TC wet-day series and theoretical curves of three-parameter and points of two-parameter candidate distributions.

Figure 8.
The PPCC values of the six distributions fitted to the (a) TC and (b) non-TC wet- day series and the AIC values of the candidate distributions for the (c) TC and (d) non-TC wet-day series.
Figure 8.
The PPCC values of the six distributions fitted to the (a) TC and (b) non-TC wet- day series and the AIC values of the candidate distributions for the (c) TC and (d) non-TC wet-day series.


Table 1.
List of probability distributions utilized in this study.
| Distribution | Abbreviation | Probability Density Function (PDF) |
|---|---|---|
| Exponential | EXP | |
| Gamma | GAM | |
| Gumbel | GUM | |
| Lognormal | LN2 | |
| Uniform | UNI | |
| Normal | NOR | |
| Weibull | WEI2 | |
| Generalized extreme value type III | GEV | |
| Generalized Logistic | GLO | |
| Lognormal | LN3 | |
| Pearson Type III | PT3 | |
| Weibull | WEI3 |
α, β and γ represent the location, scale and shape parameters, respectively.
© 2020 by the authors. Licensee MDPI, Basel, Switzerland. This article is an open access article distributed under the terms and conditions of the Creative Commons Attribution (CC BY) license (http://creativecommons.org/licenses/by/4.0/).
Share and Cite
MDPI and ACS Style
Alcantara, A.L.; Ahn, K.-H. Probability Distribution and Characterization of Daily Precipitation Related to Tropical Cyclones over the Korean Peninsula. Water 2020, 12, 1214. https://doi.org/10.3390/w12041214
AMA Style
Alcantara AL, Ahn K-H. Probability Distribution and Characterization of Daily Precipitation Related to Tropical Cyclones over the Korean Peninsula. Water. 2020; 12(4):1214. https://doi.org/10.3390/w12041214
Chicago/Turabian StyleAlcantara, Angelika L., and Kuk-Hyun Ahn. 2020. "Probability Distribution and Characterization of Daily Precipitation Related to Tropical Cyclones over the Korean Peninsula" Water 12, no. 4: 1214. https://doi.org/10.3390/w12041214
Note that from the first issue of 2016, this journal uses article numbers instead of page numbers. See further details here.