Energy Consumption and Internal Distribution in Activated Sludge Wastewater Treatment Plants of Greece

Design of Environmental Processes Laboratory, School of Environmental Engineering, Technical University of Crete, 73100 Chania, Greece
*
Author to whom correspondence should be addressed.
Water 2020, 12(4), 1204; https://doi.org/10.3390/w12041204
Submission received: 3 April 2020
/
Revised: 16 April 2020
/
Accepted: 16 April 2020
/
Published: 23 April 2020
(This article belongs to the Special Issue Design, Operation and Economics of Wastewater Treatment Plant)
Abstract
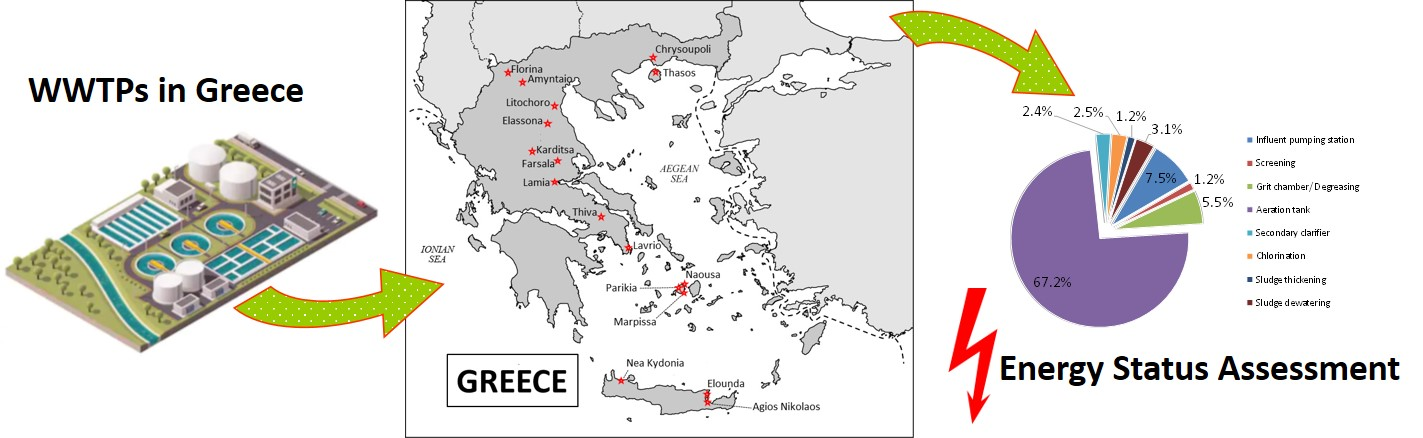
:The high-energy consumption of wastewater treatment plants (WWTPs) is a crucial issue for municipalities worldwide. Most WWTPs in Greece operate as extended aeration plants, which results in high operational costs due to high energy needs. The present study investigated the energy requirements of 17 activated sludge WWTPs in Greece, serving between 1100–56,000 inhabitants (population equivalent, PE), with average daily incoming flowrates between 300–27,300 m3/d. The daily wastewater production per inhabitant was found to lie between 0.052 m3/PE·d and 0.426 m3/PE·d, with average volume of 0.217 ± 0.114 m3/PE·d. The electric energy consumption per volume unit (EQ (kWh/m3)) was between 0.128–2.280 kWh/m3 (average 0.903 ± 0.509 kWh/m3) following a near logarithmic descending correlation with the average incoming flowrate (Qav) (EQ = −0.294lnQav + 3.1891; R2 = 0.5337). A similar relationship was found between the daily electric energy requirements for wastewater treatment per inhabitant (EPE (kWh/PE·d)) as a function of PE, which varied from 0.041–0.407 kWh/PE·d (average 0.167 ± 0.101 kWh/PE·d)) (EPE = −0.073ln(PE) + 0.8425; R2 = 0.6989). Similarly, the daily energy cost per inhabitant (E€/PE (€/PE·d)) as a function of PE and the electric energy cost per wastewater volume unit (E€/V (€/m3)) as a function of average daily flow (Qav) were found to follow near logarithmic trends (E€/PE = −0.013ln(PE) + 0.1473; R2 = 0.6388, and E€/V = −0.052lnQav + 0.5151; R2 = 0.6359), respectively), with E€/PE varying between 0.005–0.073 €/PE·d (average 0.024 ± 0.019 €/PE·d) and E€/V between 0.012–0.291 €/m3 (average 0.111 ± 0.077 €/m3). Finally, it was calculated that, in an average WWTP, the aeration process is the main energy sink, consuming about 67.2% of the total electric energy supply to the plant. The large variation of energy requirements per inlet volume unit and per inhabitant served, indicate that there is large ground for improving the performance of the WWTPs, with respect to energy consumption.

1. Introduction
Wastewater treatment is a necessity of any contemporary town, or even small settlement. The European Union, through directive 2000/60/EC, has imposed the construction of wastewater treatment plants (WWTPs) starting from the larger cities and has provided substantial financing. However, even if in most cases, both in Europe but also in other countries, the authorities provide financing for capital expenses, in most cases the operational cost is undertaken by the end users. The cost of electric energy for the operation of municipal wastewater treatment facilities may be significant. For example, such costs in the US account for about 1% of the total retail electricity sales [1], while, often, over 20% of the total electric energy consumption by the municipalities is for the operation of WWTPs [2]. Therefore, WWTPs are frequently ranked as the top individual energy consumers run by municipalities [3]. Even if all WWTPs are designed in such way as to comply with specific outflow specifications, often, their operation has not been optimized energy-wise [4]. Consequently, many WWTPs operate at a non-sustainable way, with respect to energy consumption [5].
For given wastewater characteristics and effluent quality, the per volume unit (of inlet wastewater) energy requirements of WWTPs depends on the plant size and type of remediation process [6,7]. Typically, the energy requirements for conventional activated sludge WWTPs is usually between 0.30 kWh/m3 and 0.65 kWh/m3, with the highest value being met when nitrification is applied [4]. Due to economy of scale, the higher the inlet flow rate, the lower the per volume unit energy requirements. For example, according to Tchobanoglous et al. [8], activated sludge WWTPs with inlet flowrate above 100,000 m3/d consume, on average, 0.28 kWh/m3, while the energy consumption doubles for WWTPs with inlet flowrate of 10,000 m3/d. Similar energy consumptions for activated sludge WWTPs have been quoted by Gu et al. [4] and Bodik and Kubaská [9].
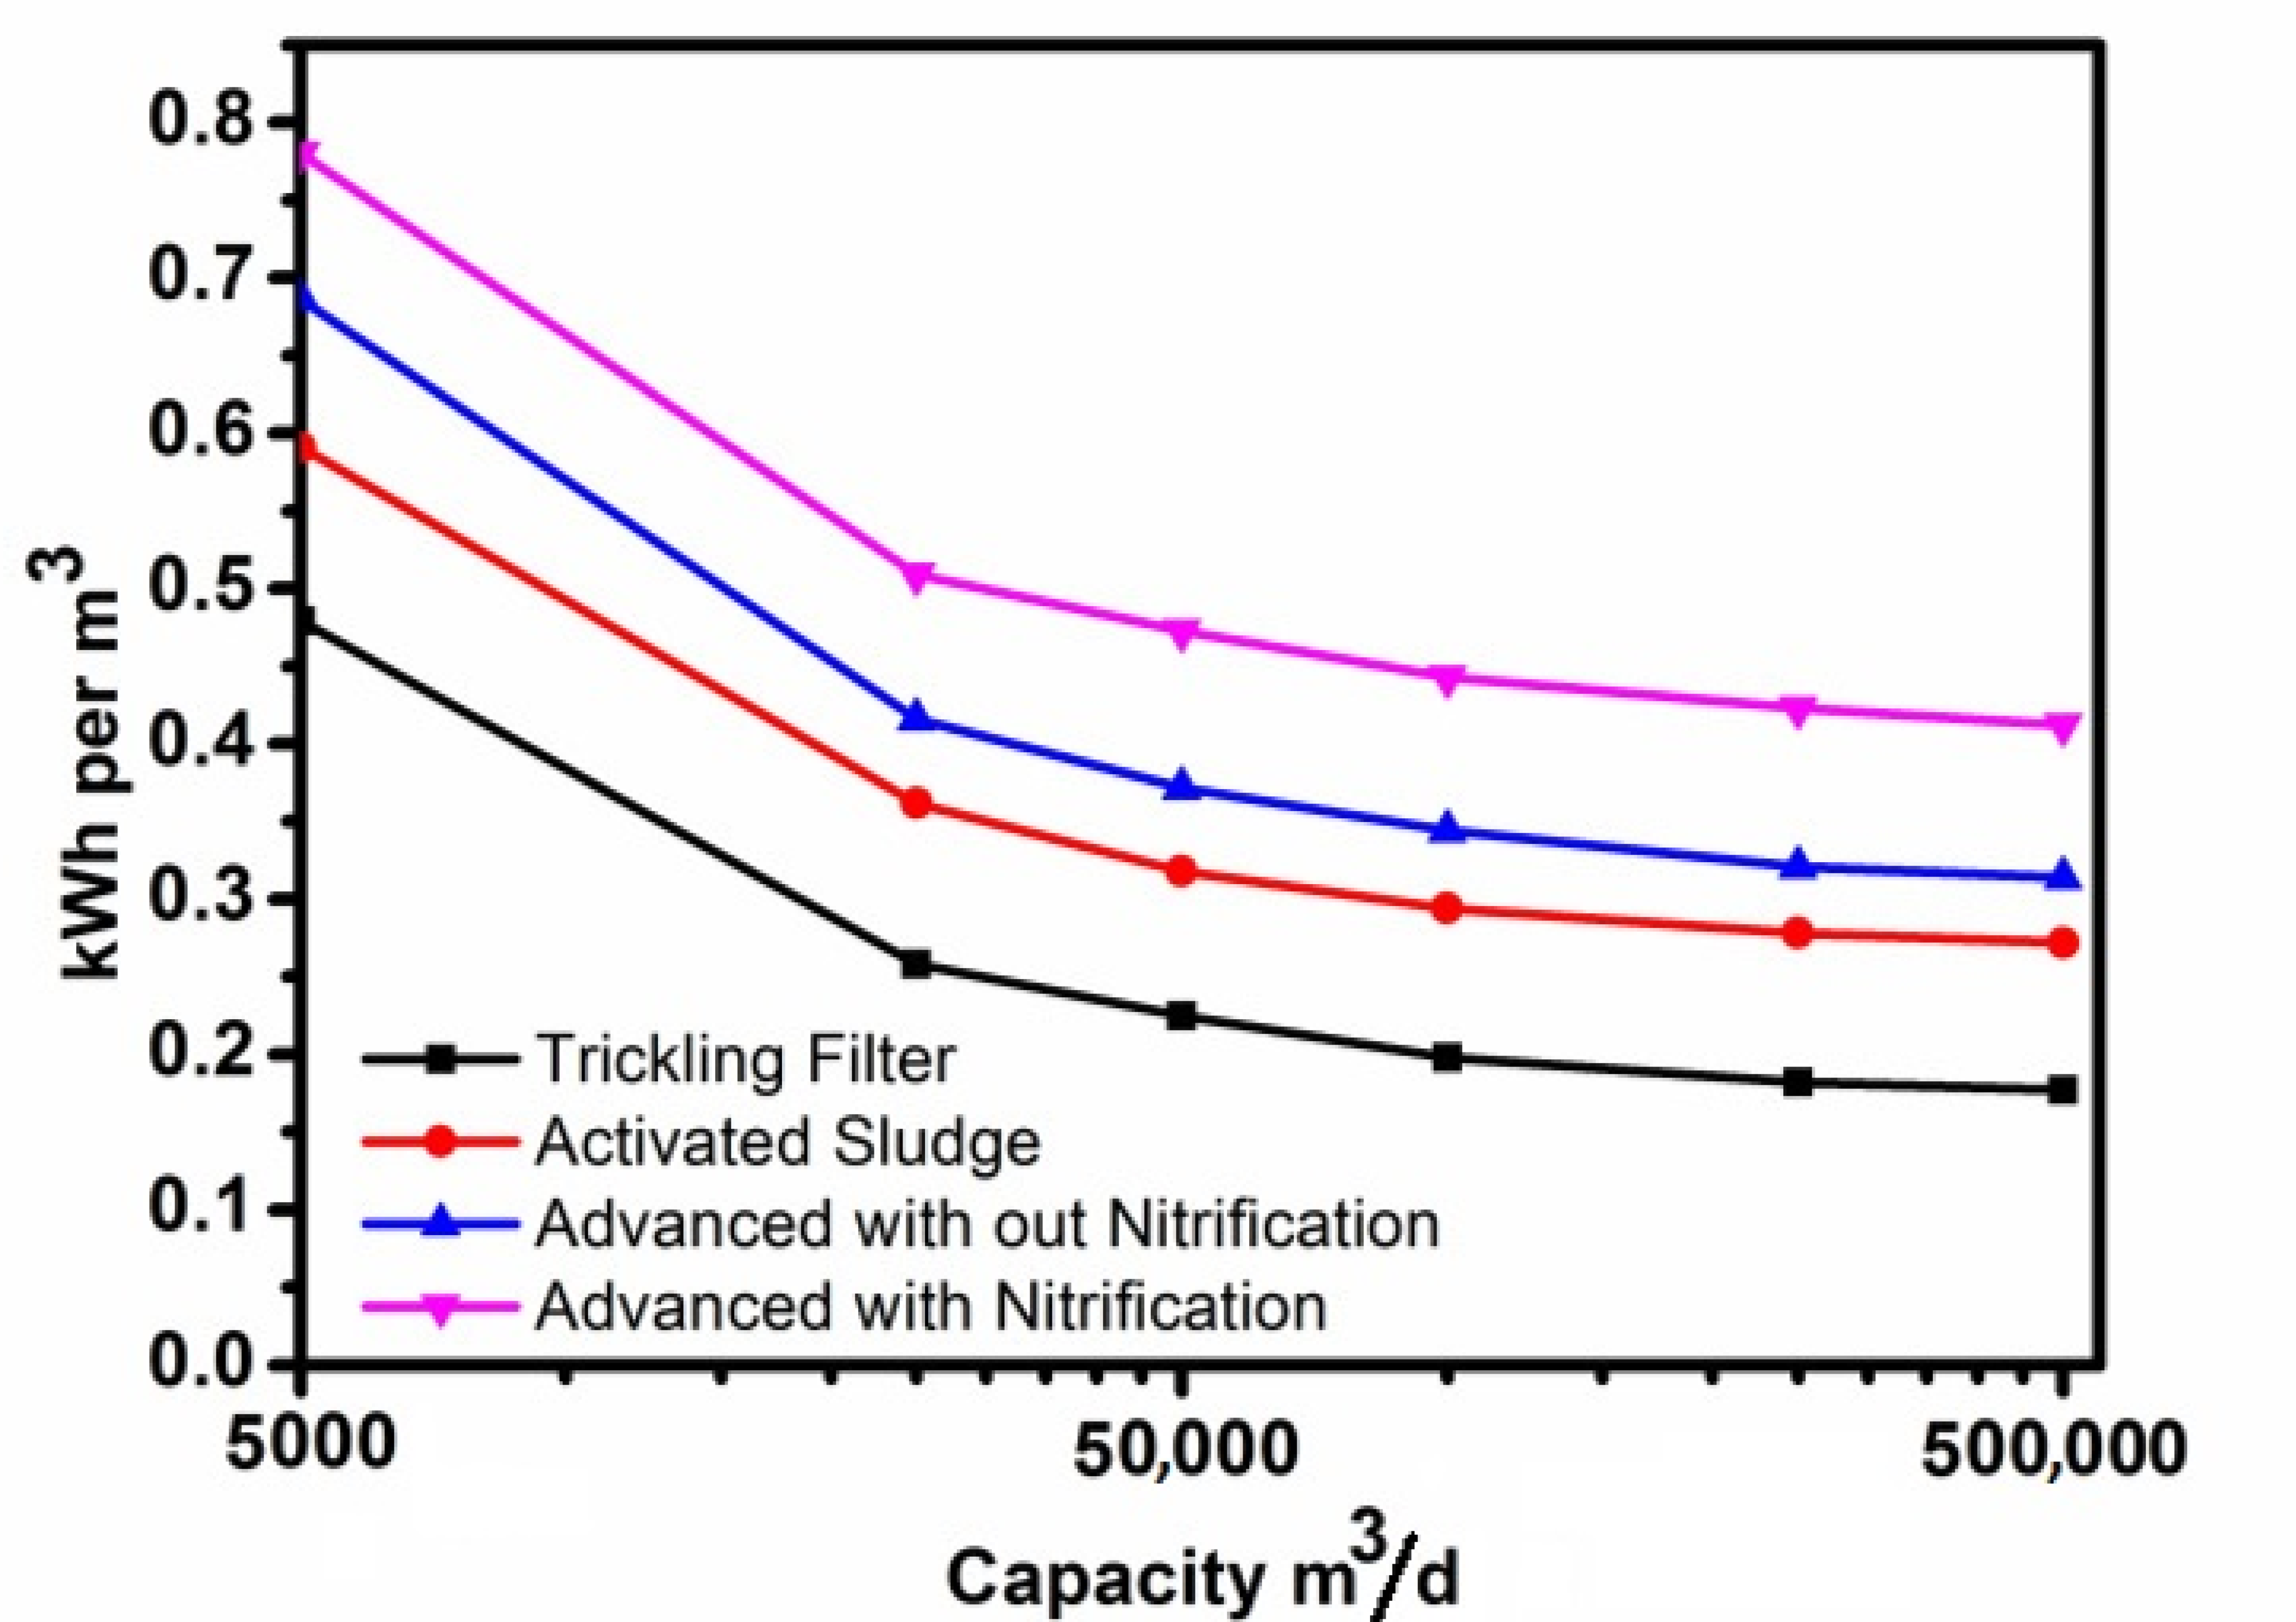
Obviously, the energy requirements for wastewater treatment are also a function of the type of the treatment process employed [4,8]. The energy requirements for wastewater treatment for several remediation processes, as a function of inlet wastewater flow are shown in Figure 1 [4]. According to Figure 1, the least energy demanding process, among those studied, is the trickling filtration process, followed by the activated sludge process, followed by advanced treatment process. Extra energy is required if nitrification is also selected. From Figure 1, it is obvious that, for any wastewater treatment process, the lower the plant capacity, the higher the per volume unit energy requirements. Recently novel wastewater treatment processes are investigated, with significantly reduced energy needs, while energy positive WWTPs have also been proposed [5].
In Greece, almost all the towns and villages with populations above 2000 inhabitants are served by WWTPs. The Greek Ministry of Environment and Energy has established a database for the notification of functional data for the major WWTPs operating in Greece [10]. However, energy consumption data are not reported in the above database. Most WWTPs in Greece employ the activated sludge process, while a few plants use the constructed wetlands process or membrane processes (MBRs). The smaller WWTPs operate as extended aeration plants without primary clarification. The construction of almost all municipal WWTPs in Greece, as in other European Union (EU) member states, has been co-financed by the EU. However, the operational expenses of the WWTPs are paid by the municipalities. It is thus important to assess the energy status of the WWTP as a first step for the implementation of an energy conservation plan.
The scope of the present study is to present the energy status of WWTPs in Greece (which are typical, as in the rest of Europe [11]) through the circulation of a structured questionnaire. Correlations between the WWTP capacity and energy requirements will be estimated, and the energy cost, in relation to the equivalent population served, will be assessed. Finally, the energy profile of an average WWTP will be estimated.
2. Methodology
The study was conducted with the circulation of a structured and extensive questionnaire consisting of 36 questions categorized into four sections. The questions were closed-ended (multiple choice and binary form “yes or no”) and open-ended, which allowed the respondent to answer at his own discretion. The general questions preceded by the more specific ones, so that the questionnaire was relevant and logical. The questionnaire aimed to collect data about the
- Layout of the WWTP;
- Average daily flow;
- Population served;
- Qualitative characteristics of the inlet and outlet wastewater;
- Treatment of biosolids;
- Energy requirements for the WWTP and for the individual sub-processes;
- Operational cost, with respect to energy.
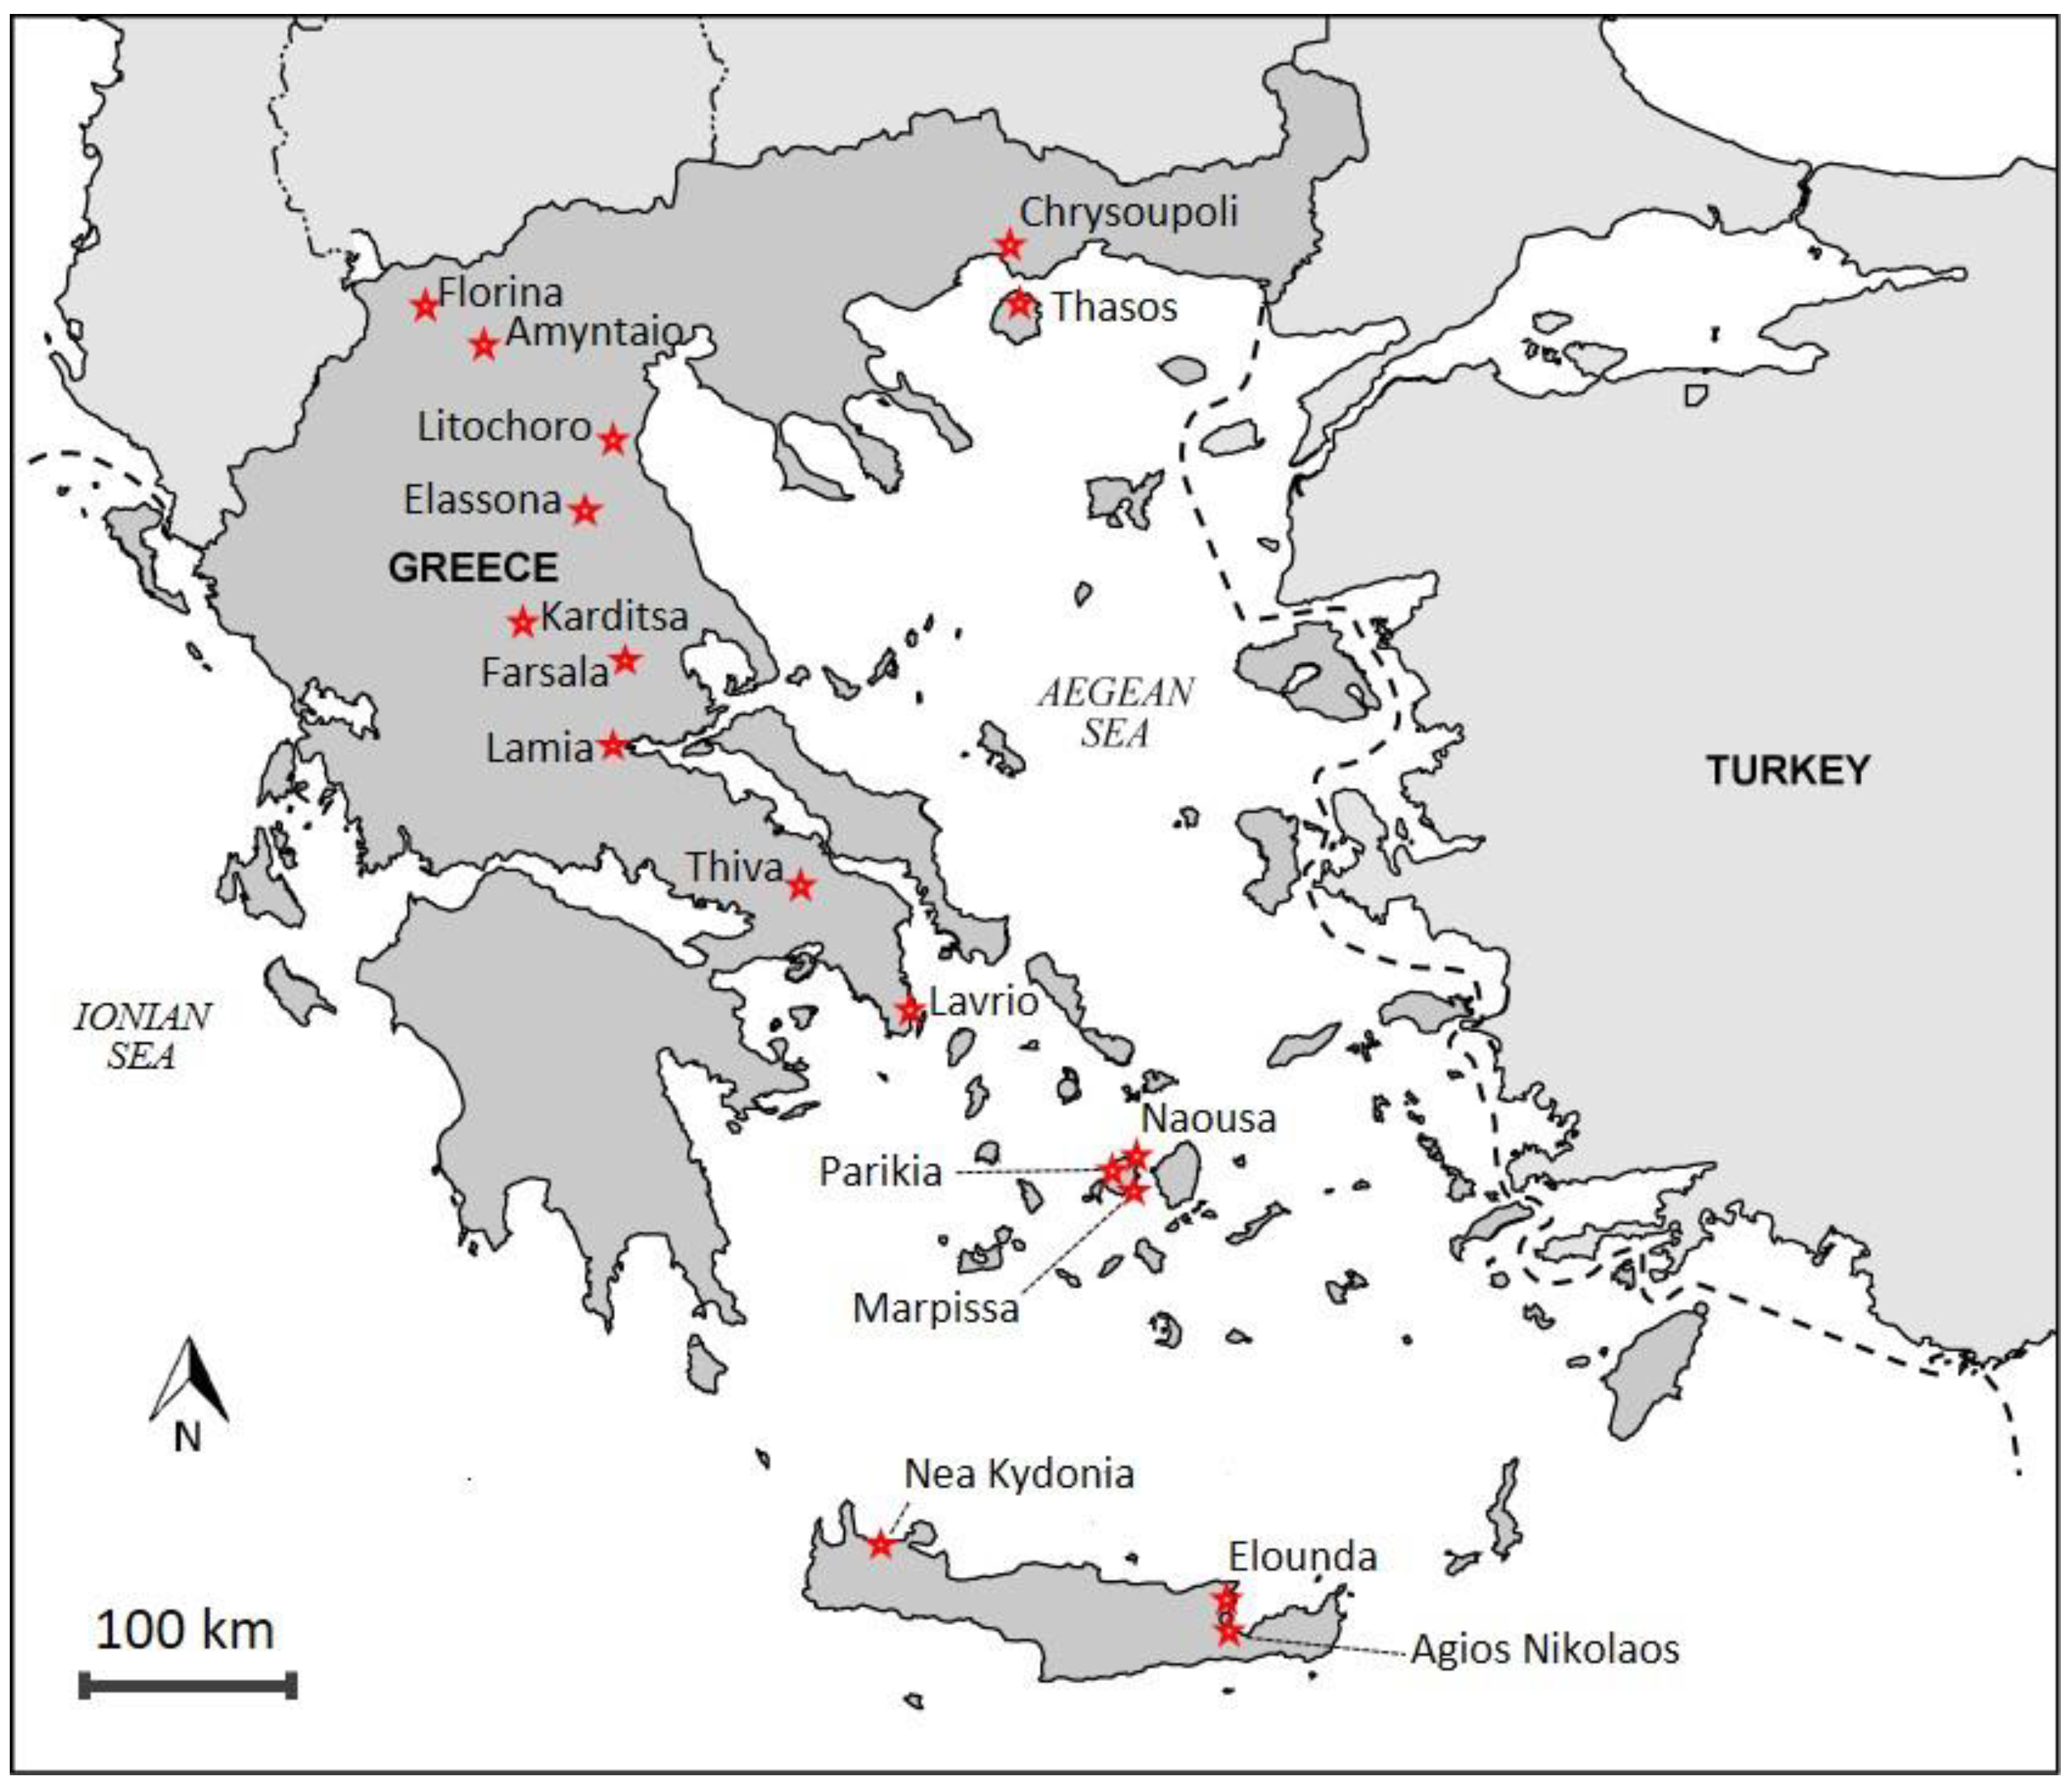
Seventeen WWTPs, distributed throughout Greece (Figure 2), with average wastewater inflow between 300 m3/d and 27,300 m3/d, were studied. The questionnaires were distributed in November 2016, and all replies were collected by May 2017.
Following the collection of the questionnaires, the data were analyzed, and the critical values, (such as wastewater production, energy consumption per capita, treatment cost per capita and per volume unit) were calculated. The wastewater and sludge treatment processes of each examined WWTP are presented in Table 1.
3. Results and Discussion
The main processes for each of the studied WWTPs are summarized in Table 1. According to Table 1, all WWTPs follow the activated sludge process with nitrogen removal. Only one WWTP is equipped with a primary sedimentation tank (Litochoro). Disinfection is with the addition of sodium hypochloride solution for all WWTPs. All WWTPs are equipped with biosolid management facilities. The aeration tank in 10 WWTPs operate as a continuous stirred tank reactor (CSTR) in three WWTPs as a plug flow reactor (PFR), while in the rest (4), the WWTPs operates as an oxidation ditch reactor (ODR). The sewerage collection system connected to all WWTPs is of the separation type. The average daily inflow, the population served (PE), the average daily energy consumption, and the energy consumption per m3, for each WWTP, are shown in Table 2.
Initially, the average daily incoming flow per inhabitant served (PE) by the WWTP (m3/PE·d), for every WWTP was calculated (Figure 3). According to Figure 3, the average daily flow varied between 0.052 m3/PE·d (Elassona) (followed closely by that of Thiva (0.059 m3/PE·d)) and 0.426 m3/PE·d (Karditsa) (followed closely by that of Amyntaio (0.404 m3/PE·d)), with an average value of 0.217 ± 0.114 m3/PE·d. The average value is close to the daily wastewater volume per capita reported by other studies. Dimopoulou [12] calculated the above rate for Greek WWTPs as 0.20 m3/PE·d. Karagozoglu and Altin [13] have calculated the per day per capita wastewater production for a town in Anatolia, Turkey, as 0.17 m3/PE·d. Tchobanoglous et al. [8] quoted wastewater production per capita for the US as between 0.20 m3/PE·d and 0.28 m3/PE·d, depending on the water conservation fixtures of the dwellings. On the other hand, Almeida et al. [14] have quoted average per capita wastewater production for England at about 0.10 m3/PE·d. Similar values have been quoted for Germany by Shoener et al. [15] (0.10 m3/PE·d) and by DESTATIS [16] (0.12 m3/PE·d), while for Saxony, Germany, an even lower value (0.084 m3/PE·d) has been reported [17]. Salvato [18] has reported significantly lower wastewater production for various developing countries around the world, with world average between 0.035–0.090 m3/PE·d (as low wastewater production per capita is a norm for developing countries). However, the relatively large standard deviation calculated by the present study indicates that the use of a typical universal daily wastewater production per capita may not be used as designing parameter for WWTPs, and a more detailed study, at local level, should be conducted.
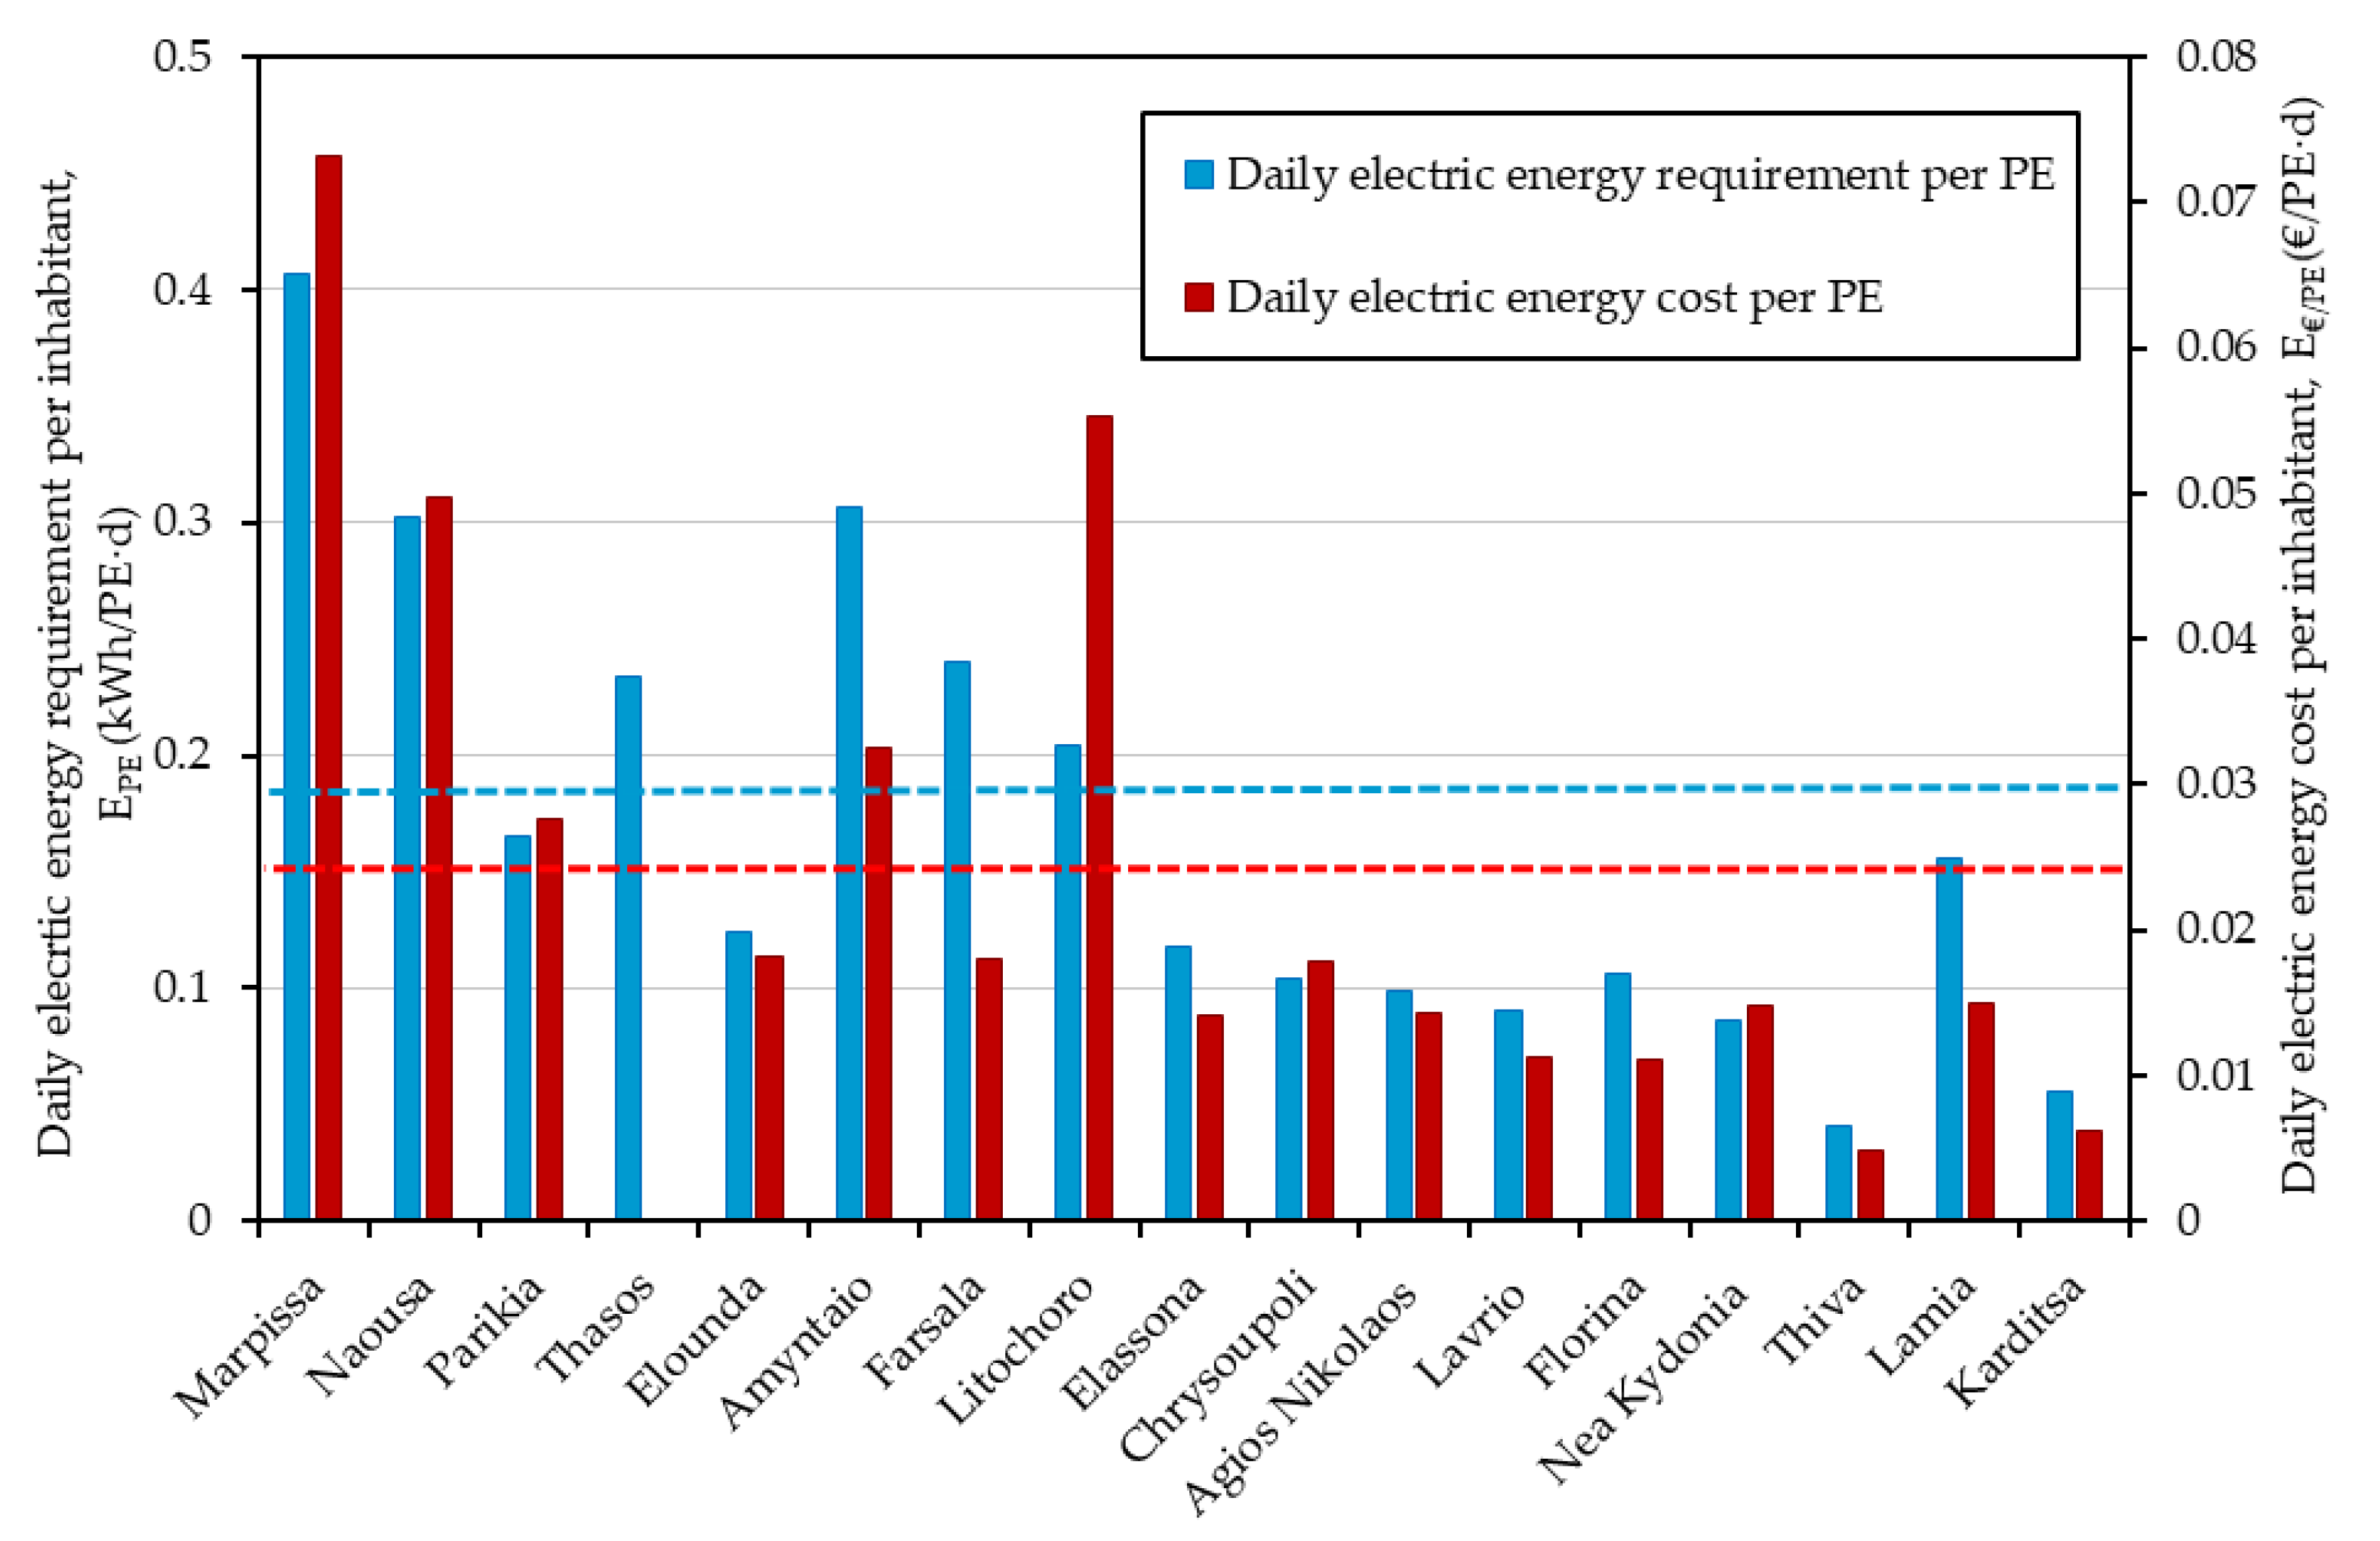
The daily electric energy requirement per inhabitant, EPE (kWh/PE·d), and the daily electric energy cost per inhabitant, E€/PE (€/PE·d), for each WWTP are presented in Figure 4. EPE varies between 0.041 kWh/PE·d (Thiva) and 0.407 kWh/PE·d (Marpissa), with average value 0.167 ± 0.101 kWh/PE·d, while E€/PE varies between 0.005 €/PE·d (Thiva) and 0.073 €/PE·d (Marpissa), with an average value of 0.024 ± 0.019 €/PE·d. It is worth mentioning that the cost of electricity is not proportional to electricity consumption, as the electricity supplier imposes an extra charge according to the pattern of electricity consumption. When electricity consumption exceeds a target value, a penalty is being charged (this is further discussed below). The above may be the reason for the high E€/PE for the WWTP of Litochoro (E€/PE is 0.055 €/PE·d), while the EPE for the same WWTP has been calculated as 0.203 kWh/PE·d. Similar behavior may be observed for other WWTPs, such as Farsala and Amyntaio.
The daily energy requirement per inhabitant, EPE (kWh/PE·d), as a function of population served (PE) by each WWTP, is presented in Figure 5. Figure 5 shows a statistically significant near logarithmic descending correlation between EPE and PE, with correlation function EPE = −0.073ln(PE) + 0.8425; R2 = 0.6989. Dimopoulou [12], who studied the energy consumption in 11 WWTPs in Greece, calculated the average EPE for WWTPs serving up to 10,000, between 10,000 and 50,000, and above 50,000 PE as 0.36, 0.13. and 0.11 kWh/PE·d, respectively. For comparison purposes, the EPE values reported by Dimopoulou [12] have been inserted into the graph of Figure 5 (as straight lines, parallel to the x-axis). The findings of Dimopoulou [12] are remarkably close to the findings of the present study. Mamais et al. [19], who studied the per capita energy consumption for WWTPs in various locations, has reported for Greek WWTPs that EPE ranges between 0.041 kWh/PE·d and 0.236 kWh/PE·d (average 0.104 kWh/PE·d), while for WWTPs in USA the relative EPE values were found to lie between 0.044 kWh/PE·d and 0.194 kWh/PE·d (average 0.079 kWh/PE·d) [20]. For European and Australian WWTPs, EPE values have been reported between 0.055 kWh/PE·d and 0.329 kWh/PE·d [19] and 0.082 to 0.329 kWh/PE·d [21], respectively.
The energy cost is a crucial issue for the WWTPs, as it is one of the biggest single operational costs, and there is always a need to mitigate it. For example, about 30% of WWTPs’ operational costs in the US is budgeted for energy consumption [8]. In general, the energy consumption of a typical WWTP accounts for 25%–40% of the total operational cost [4,22]. Furthermore, the rising trend of the kWh cost of electricity stands as a major incentive for the WWTPs, so the study of energy consumption and operational improvements are vital to reduce the energy consumption cost without deteriorating the effluent quality [23,24]. The daily electricity cost per capita is depicted in Figure 6. According to Figure 6, a statistically significant, near logarithmic descending correlation may be observed between the daily energy cost per inhabitant, E€/PE (€/PE·d) and PE served by the WWTP. The electric energy cost ranges from 0.005 €/PE·d (Thiva) to 0.073 €/PE·d (Marpissa) (average 0.024 ± 0.019 €/PE·d) with correlation function: E€/PE = −0.013ln(PE) + 0.1473; R2 = 0.6388. The relatively smaller correlation coefficient calculated for the latter correlation, compared to the one for per capita energy consumption (Figure 4), may be attributed to the irregularity inserted by the electric energy provider due to the charge according to both net energy consumption and t the pattern of energy consumption (this is further discussed below). Dimopoulou [12] calculated similar values for energy cost, for the operation of WWTPs in Greece, with E€/PE values ranging from 0.009 €/PE·d to 0.032 €/PE·d, for WWTPs serving between 1000 PE and 56,000 PE.
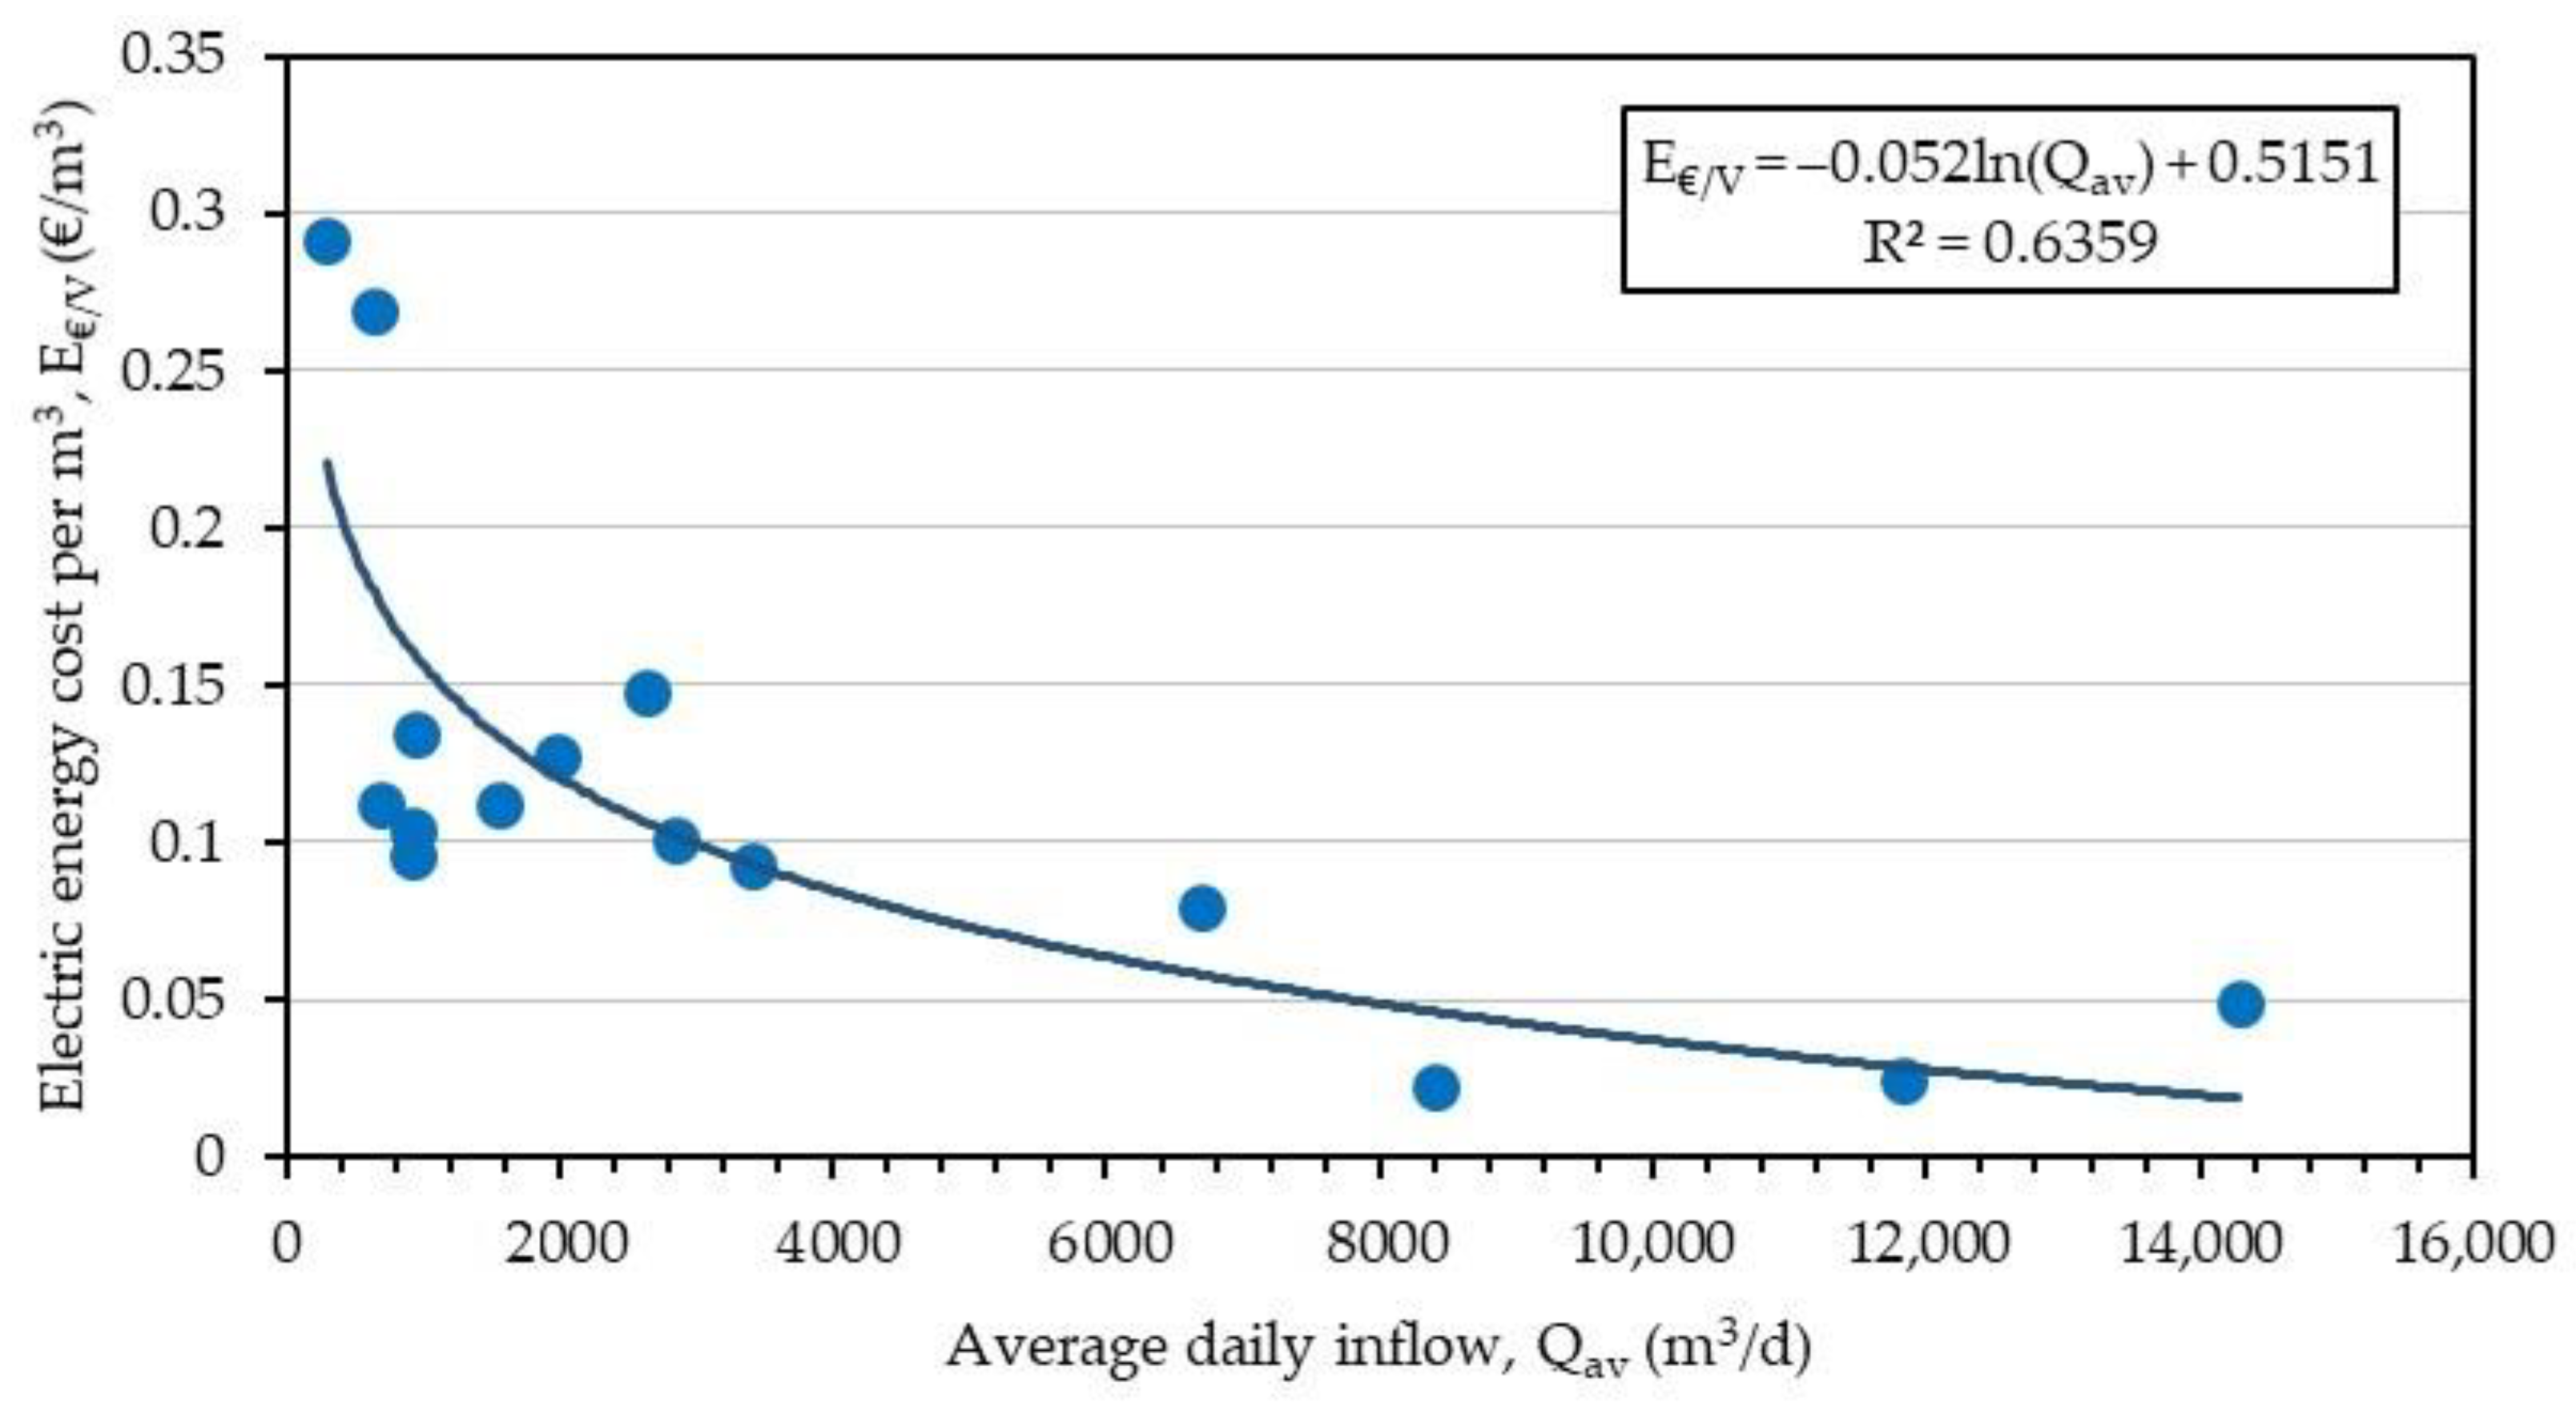
The electricity cost per wastewater volume unit (E€/V) (€/m3) exhibits significant variation, as it lies between 0.012 €/m3 (Karditsa) and 0.291 €/m3 (Marpissa), average 0.111 ± 0.077 €/m3. A statistically significant, near logarithmic correlation, between E€/V and average daily inflow (Qav) to the WWTP has been found: E€/V = −0.052lnQav + 0.5151; R2 = 0.6359 (Figure 7) (the WWTP in Karditsa has not been included in the graph of Figure 7, as it is represented on the graph by one isolated point, with Qav about double than the closer one (that of Lamia), and thus it is not reliable to extend the correction for such high daily flows, as it is based only on one point). However, the E€/V value for Karditsa is the lower one among those studied. Similar values for WWTPs in Greece, have been quoted by Dimopoulou [12], who calculated energy cost per wastewater volume between €/m3 0.013 and 0.197 €/m3. High variation to the per m3 electricity cost has been also observed in a study conducted on about 300 activated sludge WWTPs in the region of Valencia (Spain). In that study, the minimum cost was calculated as 0.025 €/m3, the maximum was found 0.818 €/m3, while the weighted average value was calculated as 0.137 €/m3, with a declining trend with the capacity of the WWTP was observed [25]. A declining trend of the per volume electric energy cost, with the population served (PE) by the WWTP has been reported by Guerrini et al. [26], who studied about 130 WWTP at the region of Tuscany (Italy); they reported average energy cost of 0.30 €/m3, for WWTPs serving less than 2000 PE, 0.08 €/m3 for WWTPs serving more than 10,000 PE, and 0.12 €/m3 for the in between WWTPs [26]. The energy consumption per m3 in USA WWTPs has been reported to lie between 0.005 €/m3 and 0.085 €/m3, with most WWTPs indicating costs between 0.014 €/m3 and 0.037 €/m3 [27].
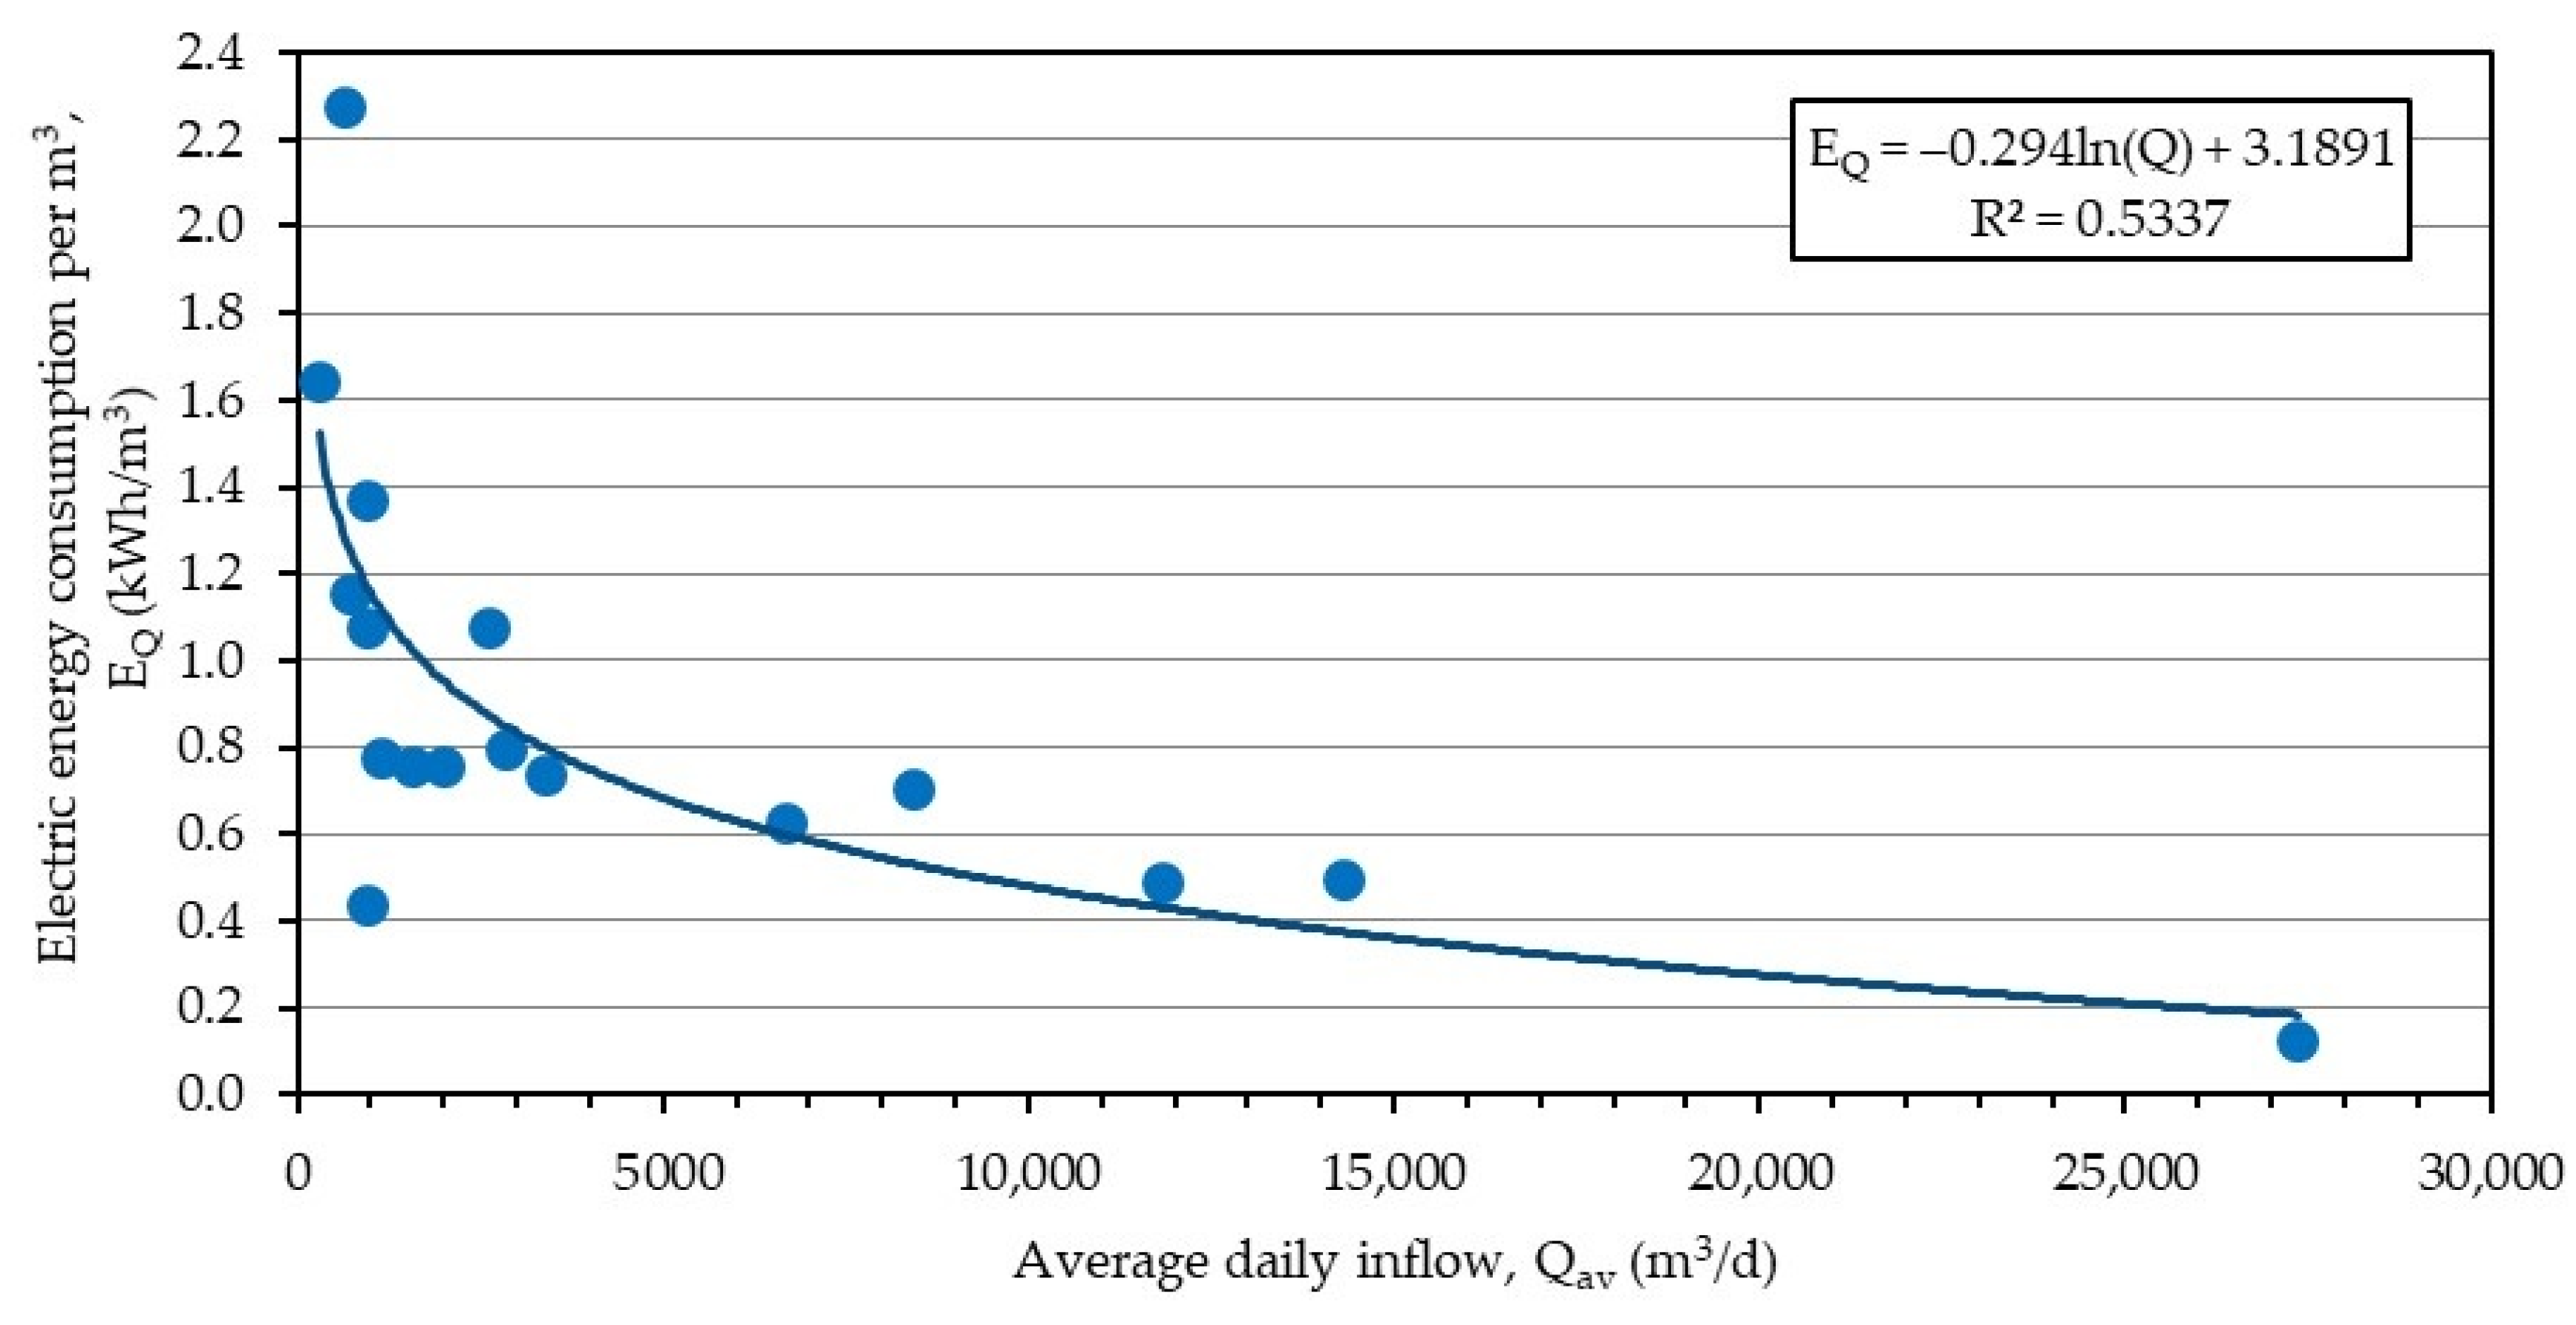
A statistically significant, near logarithmic descending correlation between the electric energy consumption per volume unit of inlet wastewater, EQ (kWh/m3), and the average daily wastewater flow, Qav (m3/d) has also been calculated, with correlation equation: EQ = −0.294lnQav + 3.1891; R2 = 0.5337. In the present study, the EQ was calculated to lie between 0.128 (Karditsa) and 2.280 kWh/m3 (Elassona), with average value 0.903 ± 0.509 kWh/m3 (Figure 8). The above values are in complete accordance with the ones reported for WWTPs in Greece, by Dimopoulou [12], which lies between 0.12 kWh/m3, and 2.19 kWh/m3, and follows similar trend with plant capacity. The increased per m3 energy consumption in smaller WWTPs has been pointed out by Bodik and Kubaská [9], who studied the energy consumption in Slovakian WWTPs and reported energy consumption of 0.48 kWh/m3 for WWTPs with average daily flows above 5000 m3/d, while for smaller ones, the relative value dropped to 0.91 kWh/m3. It has been observed that the average electricity consumption per m3 of wastewater does not present significant differences across countries, despite the fact that various wastewater treatment technologies and configurations are applied [28,29,30]. A large survey in the US [27] indicated that the energy consumption per m3 was between 0.07 kWh/m3 and 1.32 kWh/m3, with most WWTPs indicating energy consumption between 0.22 kWh/m3 and 0.66 kWh/m3, regardless of the type of treatment process. Another study conducted in the US reported the average per m3 electricity consumption as 0.52 kWh/m3, with an increasing trend during the last decade [31]. European and Asian countries, such as Germany (0.40–0.43 kWh/m3) [31], Sweden (0.42 kWh/m3) [31], China (0.31 kWh/m3) [31], Japan (0.30 kWh/m3) [32], and Korea (0.24 kWh/m3) [33], have been found to consume similar electric energy per m3 for wastewater treatment compared to the US. Panepinto et al. [22] studied the per m3 electric energy consumption in several European countries and reported that it ranges between 0.30 kWh/m3 and 0.49 kWh/m3 in Italy, while the average values for Portugal and Norway were reported as 0.73 kWh/m3 and 0.33 kWh/m3, respectively. Finally, the per m3 energy consumption of South African WWTPs has been found to vary between 0.08 kWh/m3 and 0.41 kWh/m3 [31].
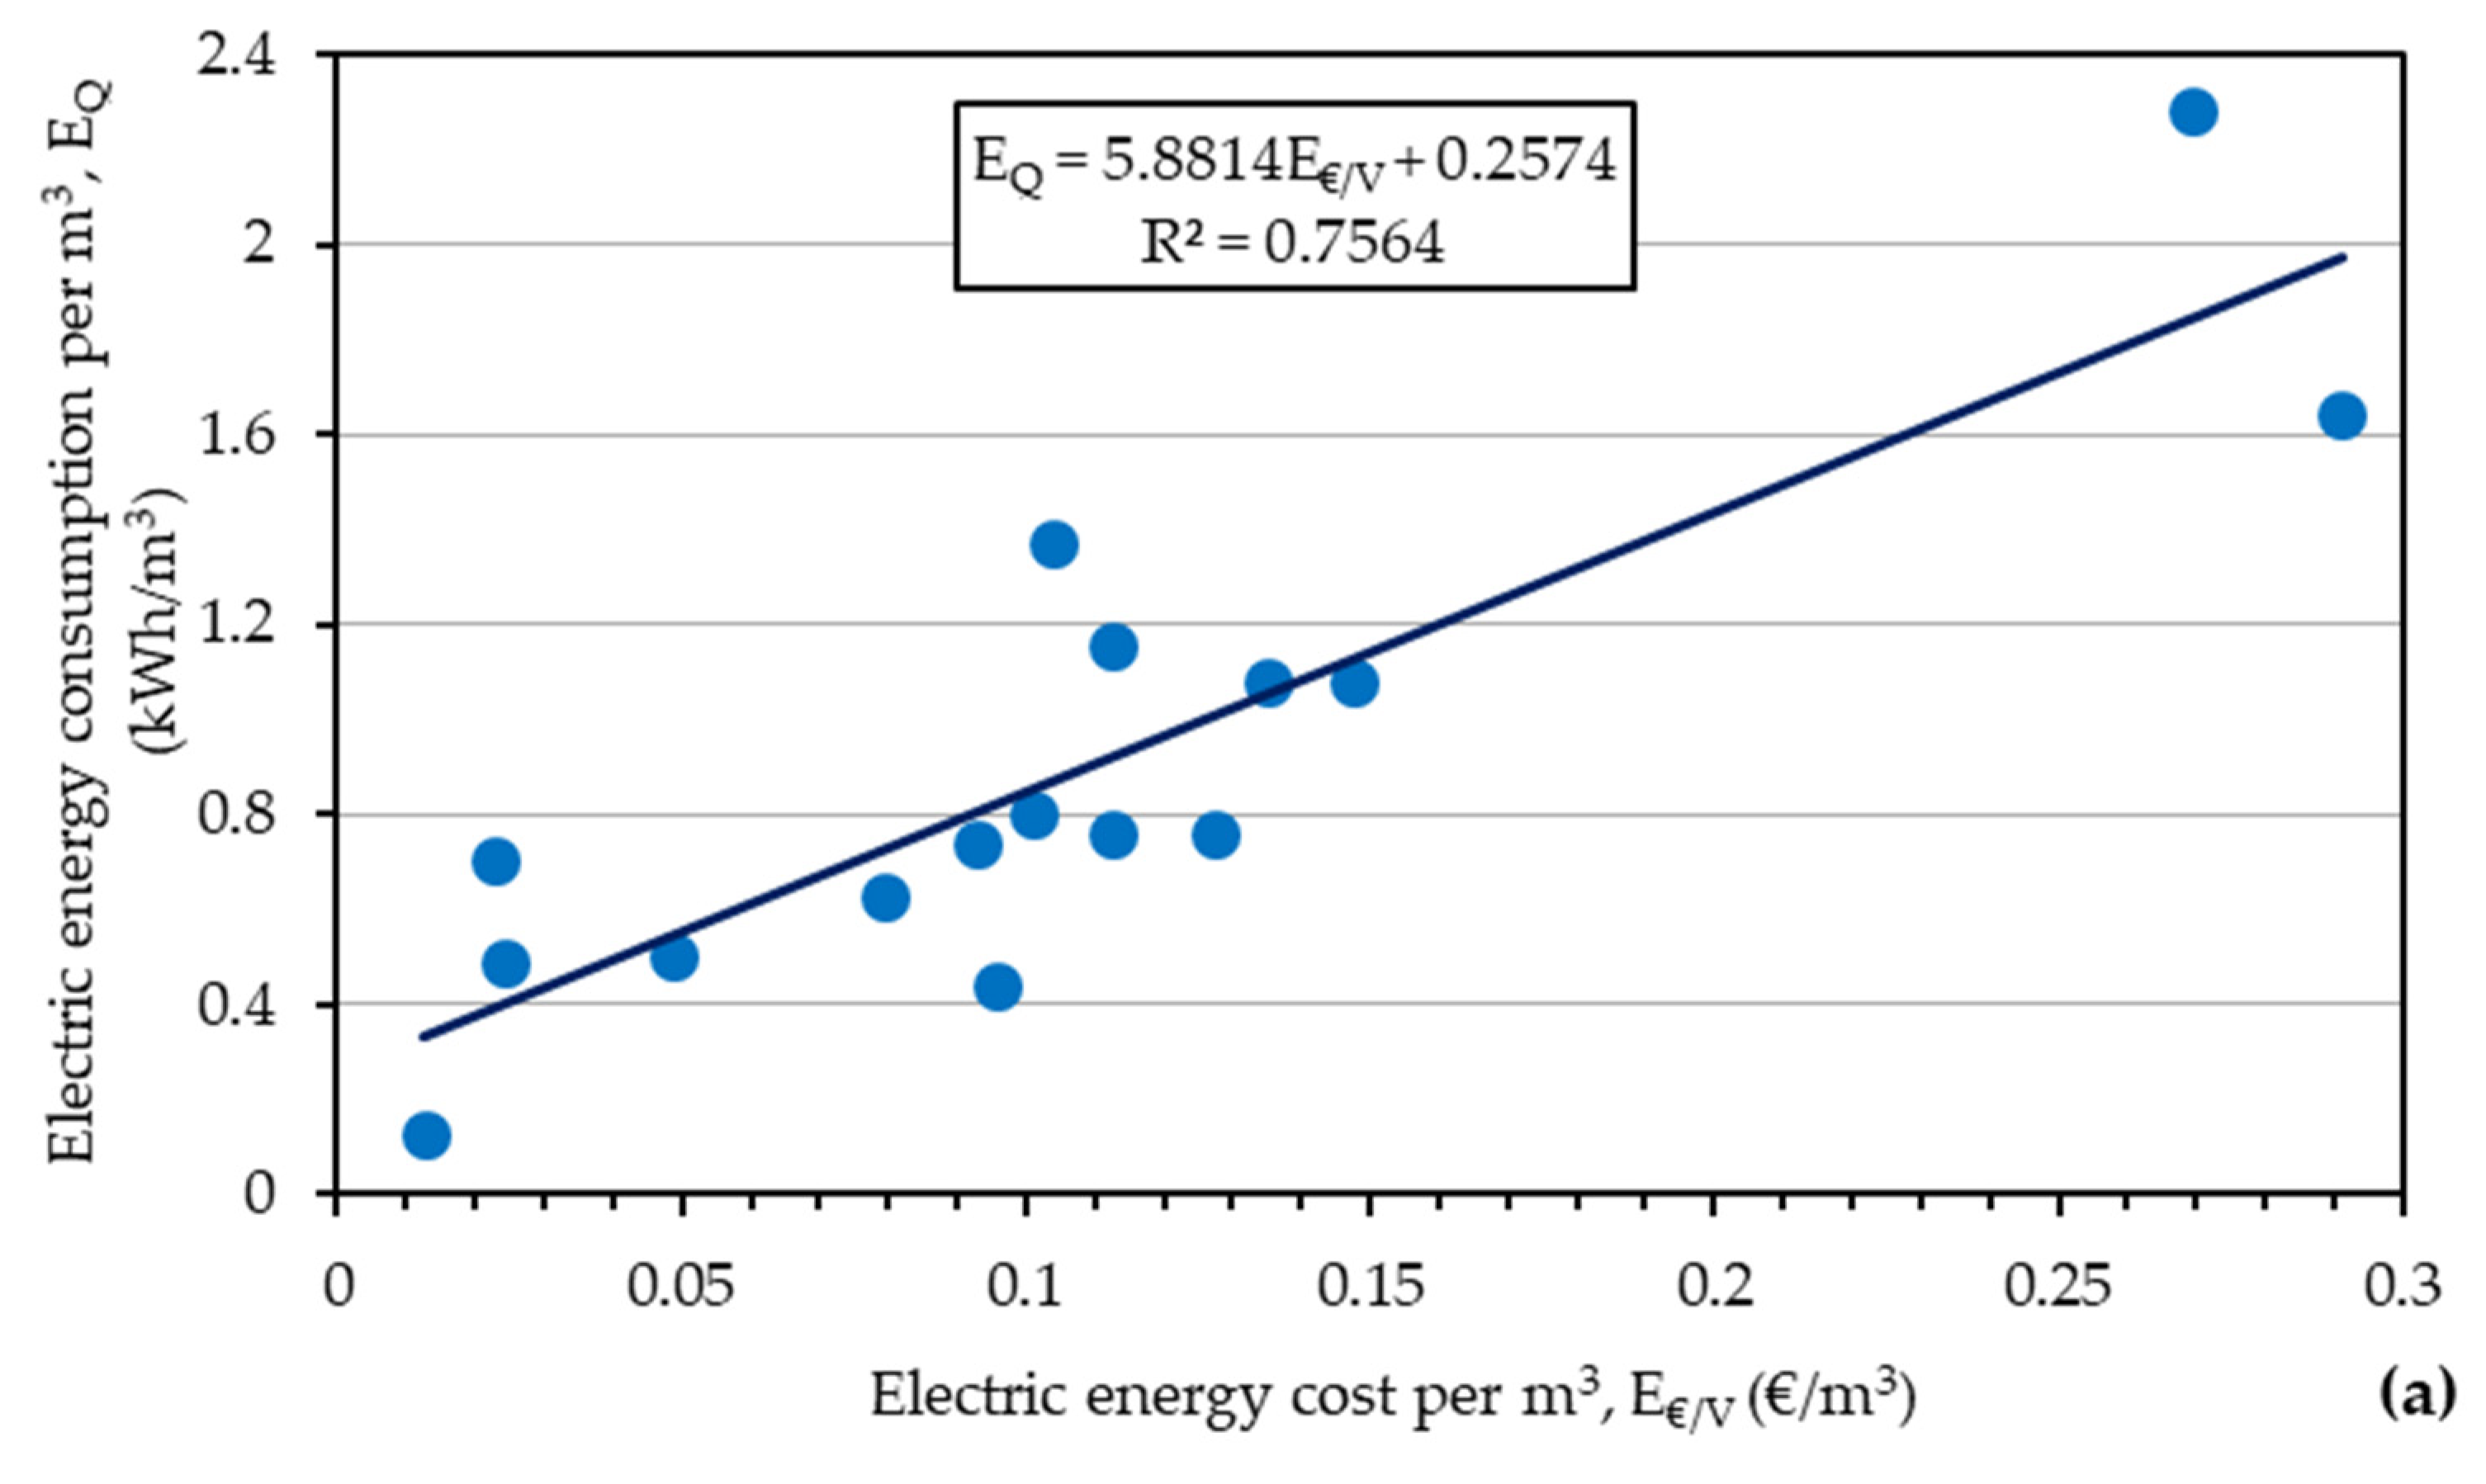
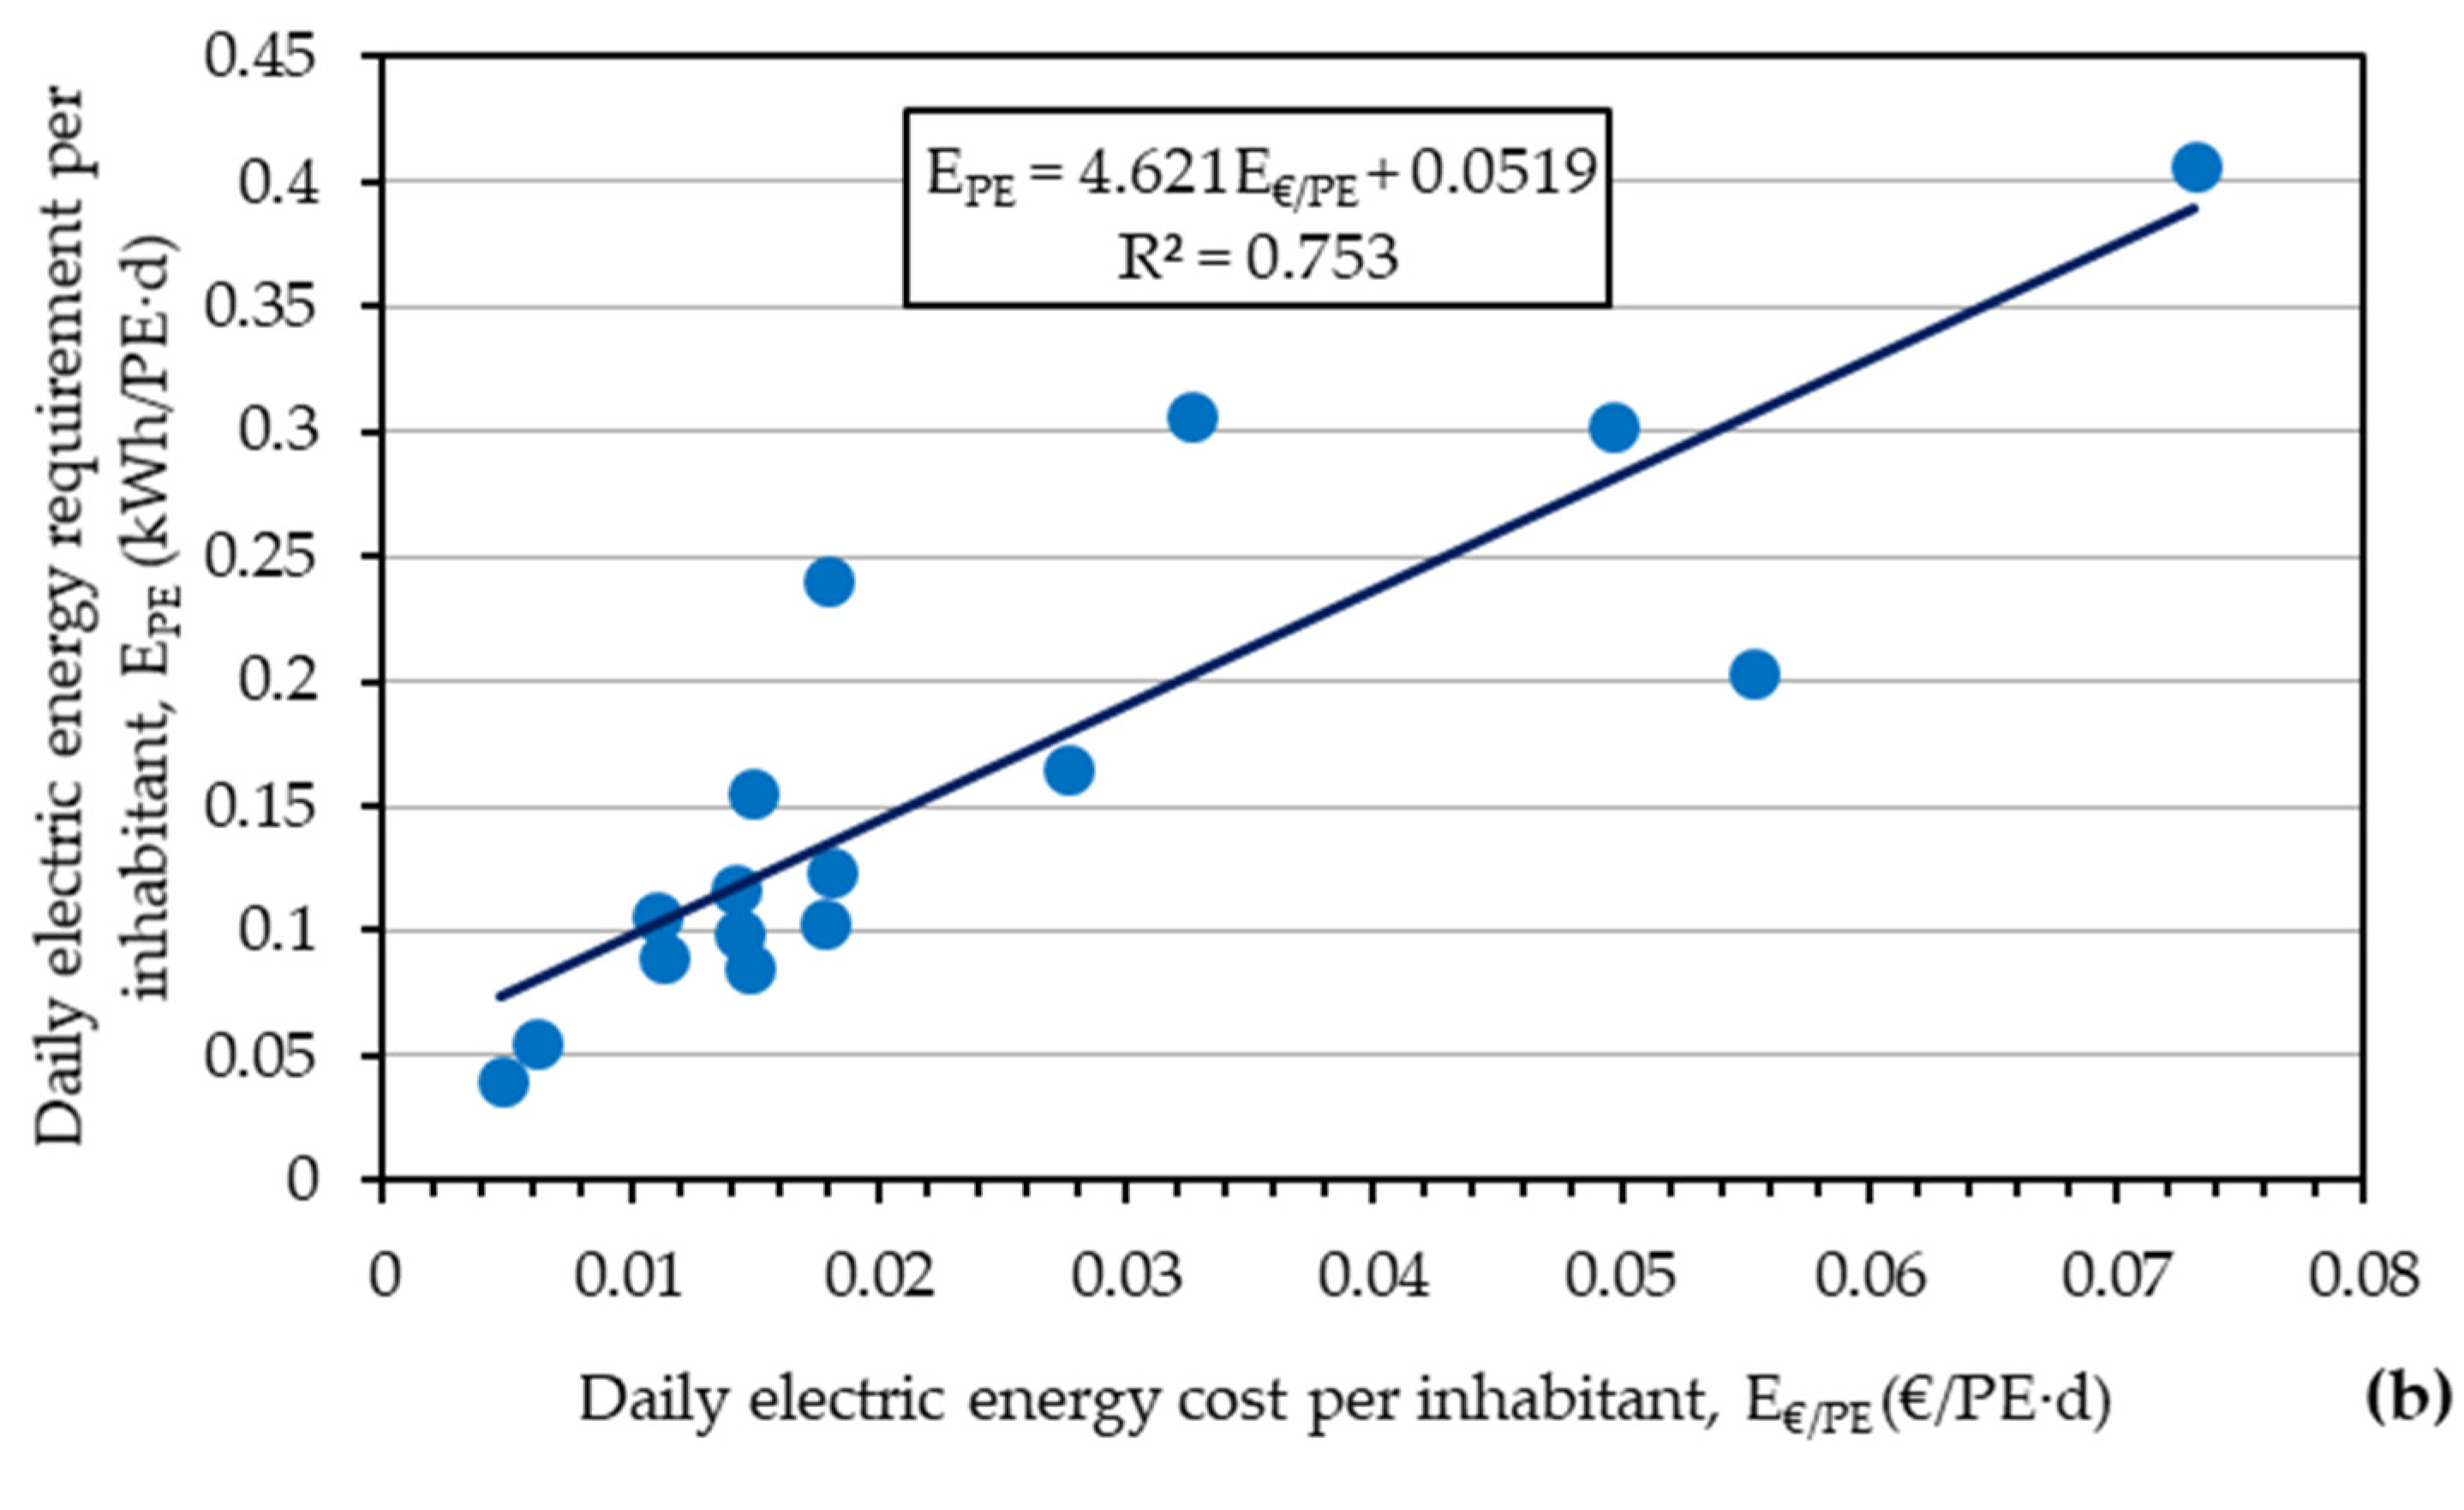
Statistical analysis indicated a relatively good linear correlation between the electric energy consumption per m3 (EQ) and electric energy cost per m3 (E€/V), with correlation coefficient R2 = 0.7564 (Figure 9a). Remarkably, a similar correlation coefficient (R2 = 0.7530) has been calculated for the linear correlation between the daily energy requirement per inhabitant (EPE) and the daily electrical cost per inhabitant (E€/PE) (Figure 9b). If the energy cost was exactly proportional to the energy consumption, the above coefficients would have been significantly closer to 1, as the energy cost per kWh is the same for all WWTPs. However, due to the reasons explained above, energy cost is affected by other factors.
The electricity required by the WWTPs investigated in the present study, as a function of the type of the biological process used, is shown in Figure 10. The WWTPs (3) employing the PFR process in average consume 1.187 ± 1.076 kWh/m3 (ranging between 0.128 and 2.279 kWh/m3), those (10) employing the CSTR process consume 0.903 ± 0.387 kWh/m3 (ranging between 0.440 and 1.646 kWh/m3), while the ones (4) employing the ODR process consume 0.687 ± 0.130 kWh/m3 (ranging between 0.501 kWh/m3 and 0.800 kWh/m3). According to Figure 10, the median values for each aeration process are 1.155, 0.770, and 0.724 kWh/m3 for PFR, CSTR, and ODR, respectively.
The electricity distribution among the various sub-processes in a WWTP is important and should be carefully studied prior to any attempt to improve the energy efficiency of a WWTP. To work out the energy fraction requirements per sub-process for wastewater treatment, it is important to establish a common baseline at which processes should be considered. For example, energy requirements for WWTP lighting and buildings supply should not be included, as this is not an integral part of the treatment process. Also, energy consumption from applications that are not common in all WWTPs, such as anaerobic digestion, should be excluded (as most small WWTPs do not have anaerobic digestion facilities). Thus, in the present study, the above energy sinks have not been considered when calculating the energy consumption fractions within a WWTP. On the other hand, sewage pumping at the headworks has been considered, even if the energy requirements for pumping at the headworks are specific, as they depend on the morphology of the area of the WWTP and on the relative location of the end point of the sewerage pipe in relation to the location of the inlet point to the WWTP.
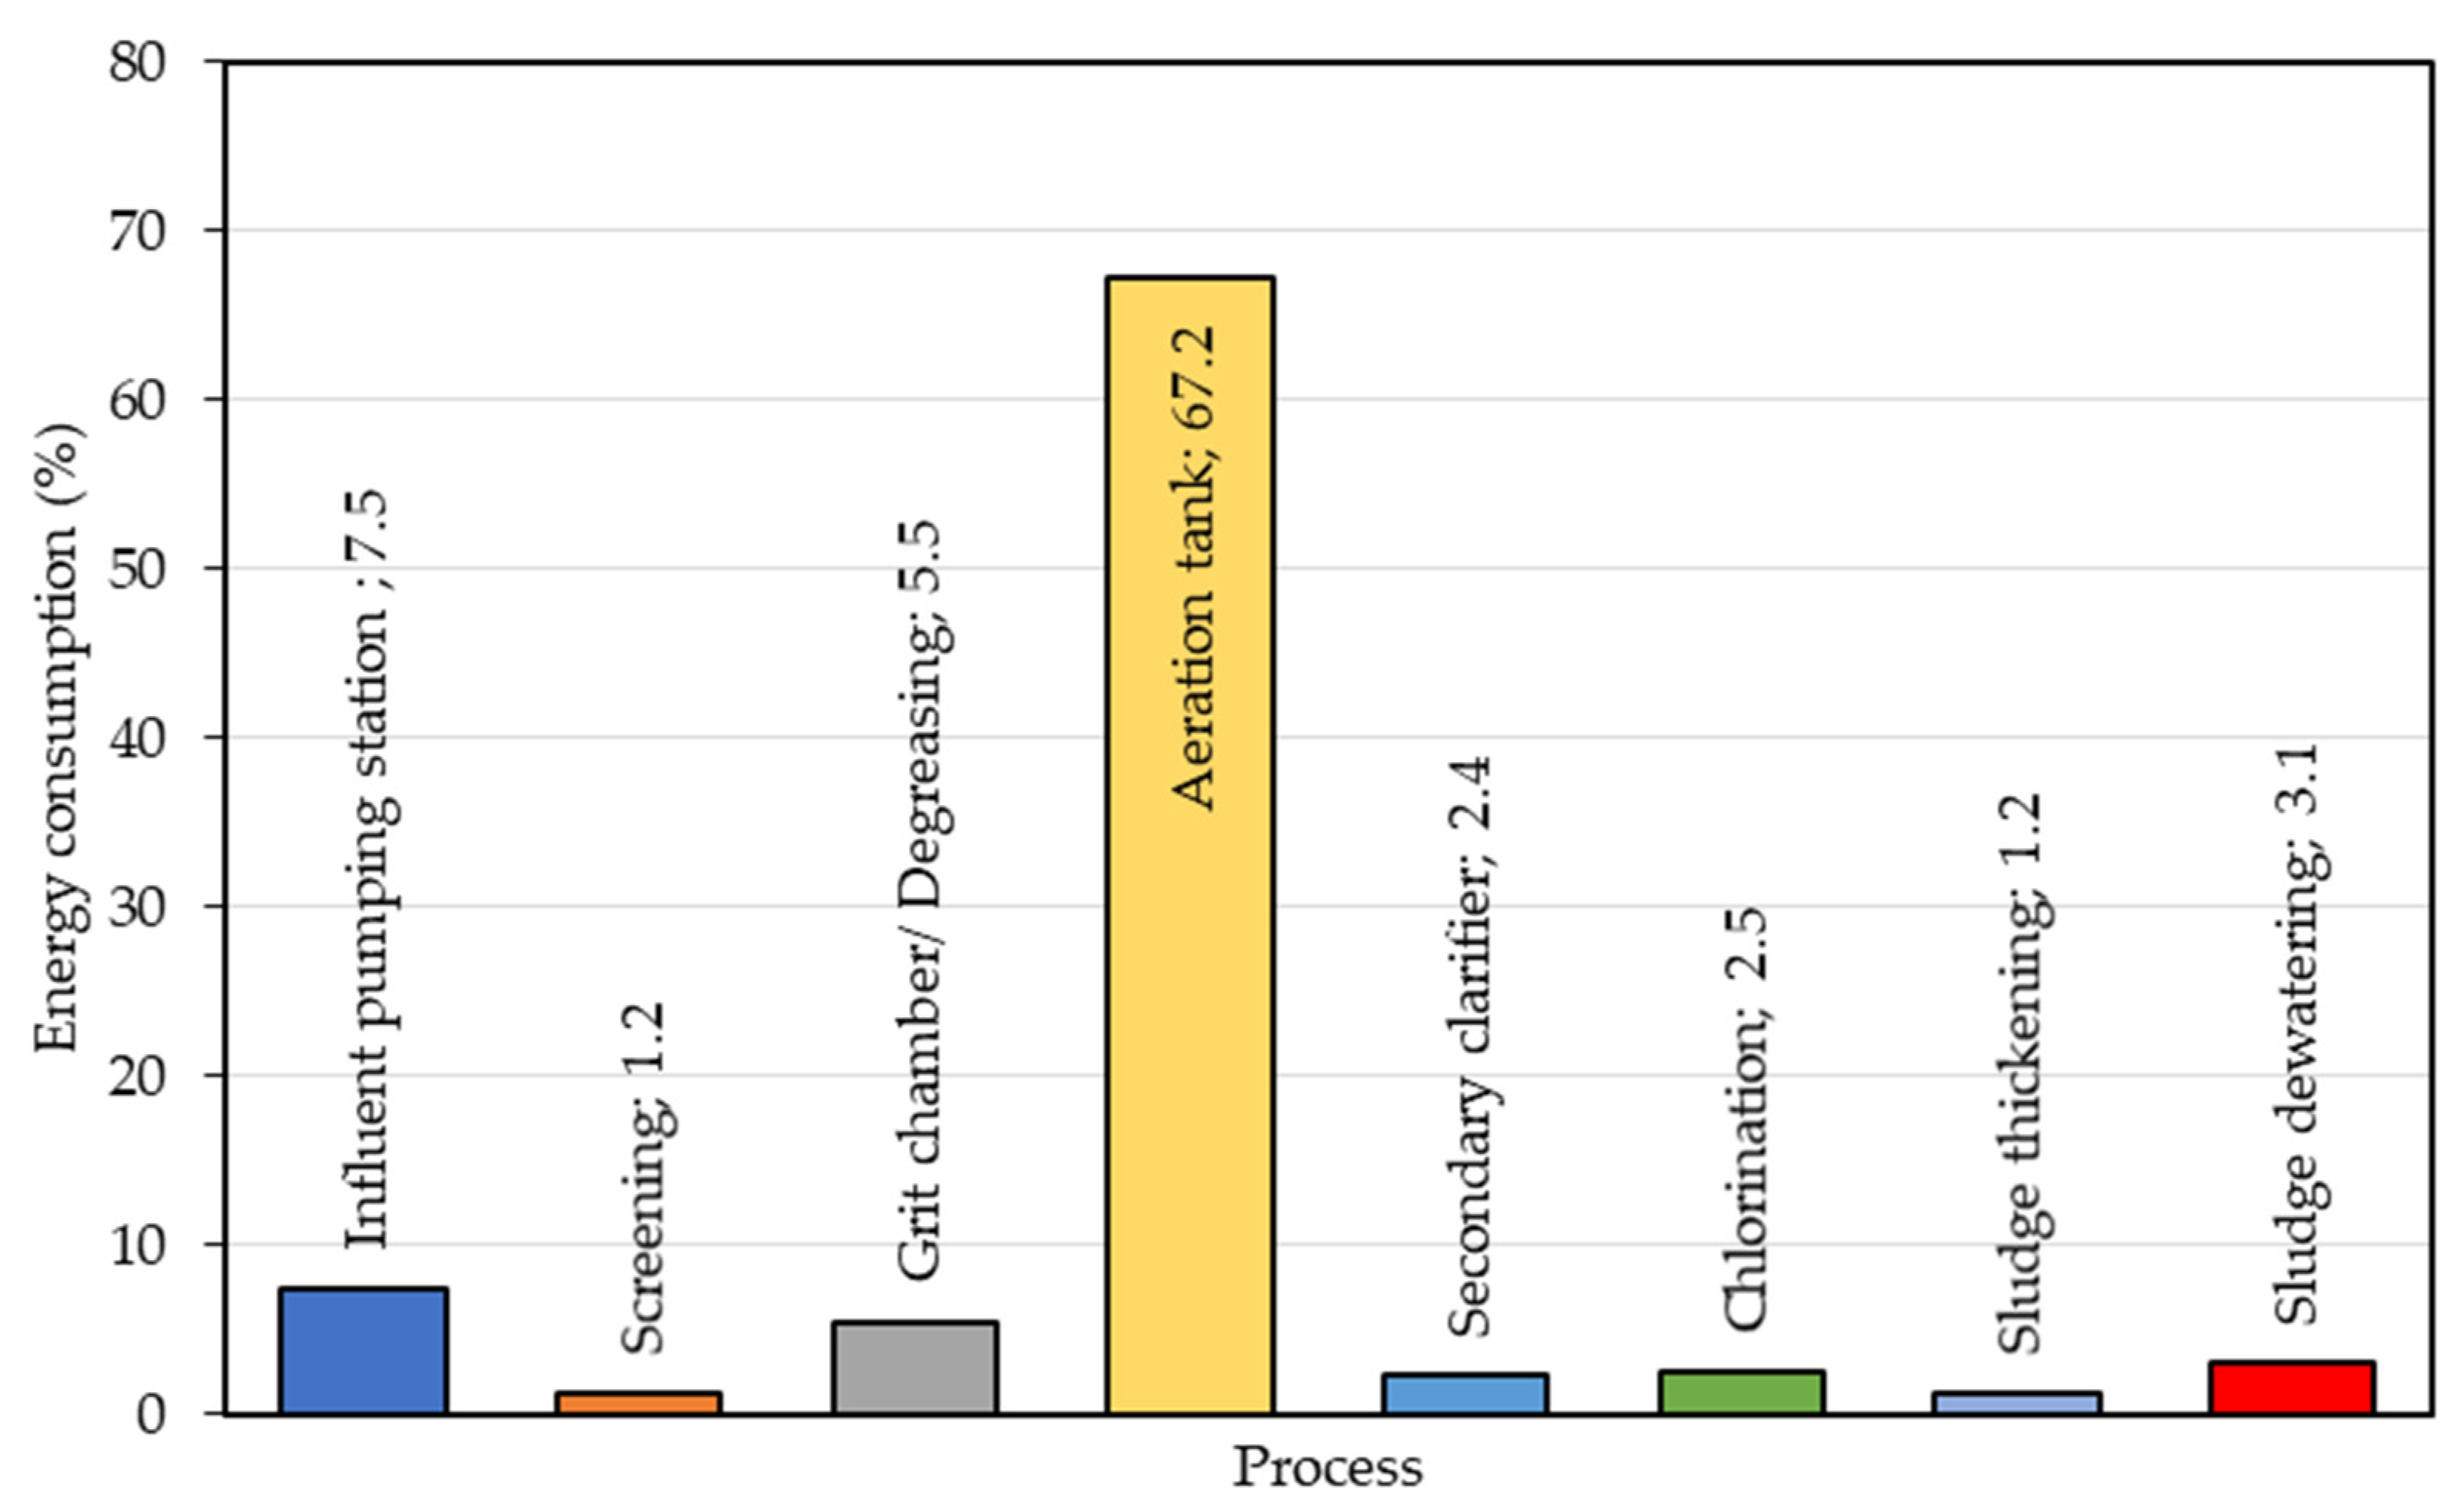
The average percentage of energy consumption per sub-process for the WWTPs studied is shown in Figure 11. As expected, the major energy sink is the aeration process, which for the studied WWTPs, on average, accounts for about 0.618 kWh/m3 (67.2%) of the total electricity consumption. The above fraction is in agreement with findings by other researchers who have reported percentage fraction for electric energy consumption for aeration of 61% [8], 60% [34], 67% [35], or even 77.9% [23]. The second in importance electric energy sink (7.5%) is due to sewage pumping at the headworks; as mentioned above, the pumping energy at the headworks is case specific, and has been reported as 5% by Tchobanoglous et al. [8], 12.0% by Gu et al. [4], 17.5% by WERF [35], and 18.9% by Daw et al. [23]. The remaining processes consume smaller amounts of energy. Secondary clarification was found to demand 2.4% of the total energy, while Tchobanoglous et al. [8] and WERF [35] have both reported 4% energy fraction for clarification process. A quite significant fraction of electric energy has been found to be consumed for grit and grease removal (5.5%) (WERF [35] has reported less than 2%, while Tchobanoglous et al. [8] reported below 0.5%). For sludge management, the dewatering process consumes the higher fraction of electric energy (3.1%), which is lower compared to the fractions reported by Tchobanoglous et al. [8] (7.7%) and WERF [35] (4.9%). The lower value calculated in the present study may be due to the fact that most of the examined WWTPs utilize belt filter presses for dewatering rather than decanters (the latter are comparatively more energy intensive processes). Finally, the energy percentage for chlorination (3.1%) is in good agreement with the one reported by Tchobanoglous et al. [8] (3.4%), while WERF [35] has reported a significantly lower percentage (0.4%).
4. Conclusions
This study investigated the energy consumption in 17 activated sludge WWTPs, in Greece, serving 1100 to 56,000 inhabitants, and with average daily incoming flowrates between 300 m3/d and 27,300 m3/d. The daily wastewater production per inhabitant was measured between 0.052 m3/PE·d and 0.426 m3/PE·d, with average volume of 0.217 ± 0.114 m3/PE·d. The energy consumption EQ per m3 of incoming wastewater was found to vary between 0.128 kWh/m3 and 2.280 kWh/m3, while the daily electric energy consumption per inhabitant served (EPE) was calculated between 0.041 and 0.407 kWh/PE·d. In both cases, a near logarithmic descending correlation was found between EQ and average daily flowrate (Qav) (EQ = −0.294lnQav + 3.1891; R2 = 0.5337), and EPE and PE (EPE = −0.073ln(PE) + 0.8425; R2 = 0.6989), respectively. Similarly, near logarithmic descending correlations were found between the per inhabitant daily energy cost (E€/PE) and the inhabitants (PE) served by the plant (E€/PE = −0.013ln(PE) + 0.1473; R2 = 0.6388) and between the electric energy cost per wastewater volume unit (E€/V) and the average daily flow (Qav) (E€/V = −0.052lnQav + 0.5151; R2 = 0.6359). E€/PE was found to vary between 0.005 €/PE·d and 0.073 €/PE·d, while E€/V was found to vary between 0.012 and 0.291 €/m3. All the above correlations are statistically significant, as they have relatively high correlation coefficient (R2 ≥ 0.53). The activated sludge processes were compared energy-wise, with respect to aeration type. The PFR process proved to be the most electricity-consuming aeration process (1.187 kWh/m3). Finally, the average energy profile of all WWTPs was worked out. The most energy intensive process was the aeration tank, consuming 67.2% of the total energy, on average.
The study indicated a large variation of energy requirements per flowrate or per inhabitant among the studied WWTPs, which indicates that there is ground for improvements to reduce the energy consumption. Therefore, it is wise that every WWTP perform a detailed energy assessment study in an effort to improve energy efficiency. Also, further research should be carried out on the development of novel and energy-efficient wastewater treatment processes.
Author Contributions
Conceptualization, P.G.; methodology, A.S., A.M., and P.G.; software, A.S. and A.M.; validation, A.S. and A.M.; formal analysis, A.M.; investigation, A.S.; resources, A.S.; data curation, A.M.; writing—original draft preparation, A.S.; writing—review and editing, A.M. and P.G.; visualization, A.M. and P.G.; supervision, P.G.; project administration, P.G.; funding acquisition, P.G. All authors have read and agreed to the published version of the manuscript.
Funding
No funding has been received.
Conflicts of Interest
The authors declare no conflict of interest.
Glossary
| CSTR | Continuous Stirred Tank Reactor |
| E€/PE | Daily electric energy cost per inhabitant (€/PE·d) |
| E€/V | Electric energy cost per wastewater volume unit (€/m3) |
| EPE | Daily electric energy requirement per inhabitant (kWh/PE·d) |
| EQ | Electric energy consumption per volume unit (kWh/m3) |
| MBR | Membrane bioreactor |
| ODR | Oxidation Ditch Reactor |
| PE | Population Equivalent |
| PFR | Plug Flow Reactor |
| Qav | Average daily inlet flow (m3/d) |
| R | Correlation coefficient |
| WWTPs | Wastewater Treatment Plants |
References
- Carns, K. Bringing Energy Efficiency to the Water & Wastewater Industry: How Do We Get There? In Proceedings of the Water Quality Event (WEFTEC05), Washington DC, USA, 29 October–2 November 2005. [Google Scholar]
- Means, E. Water and Wastewater Industry Energy Efficiency: A Research Roadmap; AWWA Research Foundation: New York, NY, USA, 2004. [Google Scholar]
- Wett, B.; Buchauer, K.; Fimml, C. Energy self-sufficiency as a feasible concept for wastewater treatment systems. In Proceedings of the IWA 4th Leading Edge Technology Conference, Singapore, 3–6 June 2007. [Google Scholar]
- Gu, Y.; Li, Y.; Li, X.; Luo, P.; Wang, H.; Wang, X.; Wu, J.; Li, F. Energy self-sufficient wastewater treatment plants: Feasibilities and challenges. Energy Procedia 2017, 105, 3741–3751. [Google Scholar] [CrossRef]
- Gikas, P. Towards energy positive wastewater treatment plants. J. Environ. Manag. 2017, 203, 621–629. [Google Scholar] [CrossRef] [PubMed]
- Guimet, V.; Kelly, R.; Doung, F.; Rosina, M.; Audic, M.; Terry, M. Green energy resource: Research and learning experiences from wastewater treatment plants. In Proceedings of the IWA World Water Congress, Montreal, QC, Canada, 19–24 September 2010. [Google Scholar]
- Plappally, K.; Lienhard, V.H. Energy requirements for water production, treatment, end use, reclamation, and disposal. Renew. Sustain. Energy Rev. 2012, 16, 4818–4848. [Google Scholar] [CrossRef]
- Tchobanoglous, G.; Burton, F.; Stensel, D. Metcalf and Eddy: Wastewater Engineering, Treatment and Reuse, 4th ed.; McGraw Hill: New York, NY, USA, 2003. [Google Scholar]
- Bodik, I.; Kubaská, M. Energy and sustainability of operation of a wastewater treatment plant. Environ. Prot. Eng. 2013, 39, 15–24. [Google Scholar] [CrossRef]
- Wastewater Treatment Plants Monitoring Database, Special Secretariat for Water, Hellenic Ministry of Environment and Energy, Government of the Hellenic Republic, Athens, Greece. Available online: http://astikalimata.ypeka.gr/Services/Pages/WtpViewApp.aspx# (accessed on 3 April 2020).
- Directorate-General for Environment. Compliance Costs of the Urban. Wastewater Treatment Directive; Document No. 70610-D-DFR; European Commission: Brussels, Belgium, 2010. [Google Scholar]
- Dimopoulou, A. Comparative Assessment on Energy Consumption and Greenhouse Gas Emissions by Wastewater Treatment Plants. Master’s Thesis, National Technical University of Athens, Athens, Greece, 2011. [Google Scholar]
- Karagozoglu, B.; Altin, A. Flow-rate and pollution characteristics of domestic wastewater. Int. J. Environ. Pollut. 2003, 19, 259–270. [Google Scholar] [CrossRef]
- Almeida, M.; Butler, D.; Friedler, E. At-source domestic wastewater quality. Urban Water J. 1999, 1, 49–55. [Google Scholar] [CrossRef]
- Shoener, B.; Bradley, I.; Cusick, R.; Guest, J. Energy positive domestic wastewater treatment: The roles of anaerobic and phototrophic technologies. Environ. Sci. Process. Impacts 2014, 16, 1204–1222. [Google Scholar] [CrossRef] [PubMed] [Green Version]
- DESTATIS. Public Water Supply and Public Wastewater Disposal 2013; German Federal Statistical Office: Wiesbaden, German, 2015. [Google Scholar]
- Voltz, T.; Grischek, T. Energy Management in the Water Sector – Comparative Case Study of Germany and the United States. Water-Energy Nexus 2018, 1, 2–16. [Google Scholar] [CrossRef]
- Salvato, J. Environmental Engineering and Sanitation, 4th ed.; Wiley Interscience Publishers: New York, NY, USA, 1992. [Google Scholar]
- Mamais, D.; Noutsopoulos, C.; Dimopoulou, A.; Stasinakis, A.; Lekkas, T. Wastewater treatment process impact on energy savings and greenhouse gas emissions. Water Sci. Technol. 2015, 71, 303–308. [Google Scholar] [CrossRef] [PubMed]
- Stillwell, A.; Hoppock, D.; Webber, M. Energy recovery from WWTPs in the United States: A case study of the energy–water nexus. Sustainability 2010, 2, 945–962. [Google Scholar] [CrossRef] [Green Version]
- Krampe, J. Energy benchmarking of South Australian WWTPs. Water Sci. Technol. 2013, 67, 2059–2066. [Google Scholar] [CrossRef] [PubMed]
- Panepinto, D.; Fiore, S.; Zappone, M.; Genon, G.; Meucci, L. Evaluation of the energy efficiency of a large wastewater treatment plant in Italy. Appl. Energy 2016, 161, 404–411. [Google Scholar] [CrossRef]
- Daw, J.; Hallett, K.; DeWolfe, J.; Venner, I. Energy Efficiency Strategies for Municipal Wastewater Treatment Facilities; Technical Report; National Renewable Energy Laboratory: Golden, CO, USA, 2012. [Google Scholar]
- Longo, S.; d’Antoni, B.; Bongards, M.; Chaparro, A.; Cronrath, A.; Fatone, F.; Lema, J.; Mauricio-Iglesias, M.; Soares, A.; Hospido, A. Monitoring and diagnosis of energy consumption in wastewater treatment plants. A state of the art and proposals for improvement. Appl. Energy 2016, 179, 1251–1268. [Google Scholar] [CrossRef]
- Castellet-Viciano, L.; Hernández-Chover, V.; Hernández-Sancho, F. Modelling the energy costs of the wastewater treatment process: The influence of the aging factor. Sci. Total Environ. 2018, 625, 363–372. [Google Scholar] [CrossRef] [PubMed]
- Guerrini, A.; Romano, G.; Indipendenza, A. Energy Efficiency Drivers in Wastewater Treatment Plants: A Double Bootstrap DEA Analysis. Sustainability 2017, 9, 1126. [Google Scholar] [CrossRef] [Green Version]
- AWWA. Energy Index Development for Benchmarking Water and Wastewater Utilities; Carlson, S.W., Walberger, A., Eds.; American Water Works Association (AWWA) Research Foundation: Denver, CO, USA, 2007. [Google Scholar]
- Cao, Y. Mass Flow and Energy Efficiency of Municipal Wastewater Treatment Plants; IWA Publishing: London, UK, 2011. [Google Scholar]
- Olsson, G. Water-Energy Nexus. In Encyclopedia of Sustainability Science and Technology; Meyers, R.A., Ed.; Springer: New York, NY, USA, 2012; pp. 11932–11946. [Google Scholar]
- Hernández-Sancho, F.; Molinos-Senante, M.; Sala-Garrido, R. Energy efficiency in Spanish wastewater treatment plants: A non-radial DEA approach. Sci. Total Environ. 2011, 409, 2693–2699. [Google Scholar] [CrossRef] [PubMed]
- Wang, H.; Yang, Y.; Keller, A.; Li, X.; Feng, S.; Dong, Y.; Fengting, L. Comparative analysis of energy intensity and carbon emissions in wastewater treatment in USA, Germany, China and South Africa. Appl. Energy 2016, 184, 873–881. [Google Scholar] [CrossRef] [Green Version]
- Yang, L.; Zeng, S.; Chen, J.; He, M.; Yang, W. Operational energy performance assessment system of municipal wastewater treatment plants. Water Sci. Technol. 2010, 62, 1361–1370. [Google Scholar] [CrossRef] [PubMed]
- Chae, K.-J.; Kang, J. Estimating the energy independence of a municipal wastewater treatment plant incorporating green energy resources. Energy Convers. Manag. 2013, 75, 664–672. [Google Scholar] [CrossRef]
- Energy Solutions. Energy Efficiency and GHG Reduction in Wastewater Facilities; EPA: Washington, DC, USA, 2009. [Google Scholar]
- WERF. Energy Efficiency in Wastewater Treatment in North. America: A Compendium of Best Practices and Case Studies of Novel Approaches; Water Environment Research Foundation: Alexandria, VA, USA, 2010. [Google Scholar]
Figure 1.
Energy consumption of various types of wastewater treatment plants (WWTPs) as a function of plant capacity (adapted from Gu et al. [4]).
Figure 1.
Energy consumption of various types of wastewater treatment plants (WWTPs) as a function of plant capacity (adapted from Gu et al. [4]).

Figure 2.
Locations of the WWTPs that participated in the study.

Figure 3.
Average daily incoming flow per inhabitant (m3/PE·d) (blue bars), with average value (dashed blue line) and standard deviation (dashed red lines) for the 17 examined WWTPs.
Figure 3.
Average daily incoming flow per inhabitant (m3/PE·d) (blue bars), with average value (dashed blue line) and standard deviation (dashed red lines) for the 17 examined WWTPs.

Figure 4.
Blue bars and dashed line: daily electric energy requirements per inhabitant, EPE (kWh/PE·d) and average value, respectively; red bars and dashed line: daily electric energy cost per inhabitant, E€/PE (€/PE·d), and average value, respectively (Thasos WWTP is not included due to lack of data).

Figure 5.
Blue points: daily electric energy requirement per inhabitant, EPE (kWh/PE·d) for the 17 examined WWTPs; blue line: trend line EPE = −0.073ln(PE) + 0.8425 with R2 = 0.6989; red, green, and purple lines: average EPE for WWTPs serving up to 10,000, 10,000 to 50,000, and above 50,000 PE, respectively, reported by Dimopoulou [12].

Figure 6.
Blue points: daily electricity cost per inhabitant, E€/PE (€/PE·d) for the 16 examined WWTPs (the WWTP in Thasos is not included due to lack of data); blue line: trend line E€/PE = −0.013ln(PE) + 0.1473 with R2 = 0.6388.
Figure 6.
Blue points: daily electricity cost per inhabitant, E€/PE (€/PE·d) for the 16 examined WWTPs (the WWTP in Thasos is not included due to lack of data); blue line: trend line E€/PE = −0.013ln(PE) + 0.1473 with R2 = 0.6388.

Figure 7.
Blue points: electric energy cost E€/V (€/m3) per unit volume of treated wastewater, as a function of average daily wastewater flow, Qav (m3/d), for the 16 examined WWTPs (the WWTP in Karditsa has been exempted); blue line: trend line E€/V = −0.052ln(Qav) + 0.5151 with R2 = 0.6359.
Figure 7.
Blue points: electric energy cost E€/V (€/m3) per unit volume of treated wastewater, as a function of average daily wastewater flow, Qav (m3/d), for the 16 examined WWTPs (the WWTP in Karditsa has been exempted); blue line: trend line E€/V = −0.052ln(Qav) + 0.5151 with R2 = 0.6359.

Figure 8.
Blue points: electricity consumption, EQ (kWh/m3) per unit volume of treated wastewater as a function of average daily wastewater flow, Qav (m3/d), for the 17 examined WWTPs; blue line: trend line EQ = −0.294ln(Qav) + 3.1891 with R2 = 0.5337.
Figure 8.
Blue points: electricity consumption, EQ (kWh/m3) per unit volume of treated wastewater as a function of average daily wastewater flow, Qav (m3/d), for the 17 examined WWTPs; blue line: trend line EQ = −0.294ln(Qav) + 3.1891 with R2 = 0.5337.

Figure 9.
Linear correlation between (a) the electric energy consumption per m3 (EQ) and electricity cost per m3 (E€/V) and (b) the daily energy requirement per inhabitant (EPE) and the daily electrical cost per inhabitant (E€/PE).
Figure 9.
Linear correlation between (a) the electric energy consumption per m3 (EQ) and electricity cost per m3 (E€/V) and (b) the daily energy requirement per inhabitant (EPE) and the daily electrical cost per inhabitant (E€/PE).


Figure 10.
Electric energy consumption per volume unit of treated wastewater, EQ (kWh/m3) for the 17 WWTPs, with error bars and median, classified as a function of the type of the aeration process: continuous stirred tank reactor (CSTR) (blue box); plug flow reactor (PFR) (red box); oxidation ditch reactor (ODR) (green box).

Figure 11.
Energy distribution in the main processes of conventional activated sludge systems (influent pumping station; screening; grit chamber/degreasing; aeration tank; secondary clarifier; chlorination; sludge thickening; sludge dewatering).
Figure 11.
Energy distribution in the main processes of conventional activated sludge systems (influent pumping station; screening; grit chamber/degreasing; aeration tank; secondary clarifier; chlorination; sludge thickening; sludge dewatering).


Table 1.
Sub-processes for every WWTP participated to the study.
| Process | Influent Pump Station | Screening | Grit Chamber | Degreasing | Equalization Tank | Primary Sedimentation | Aeration Tank | Type of Oxidation Process | Nitrification & Denitrification | Phosphorus Removal | Secondary Sedimentation | Disinfection Tank | Water Reuse | Sludge Thickening | Sludge Dewatering | |
|---|---|---|---|---|---|---|---|---|---|---|---|---|---|---|---|---|
| WWTP | ||||||||||||||||
| 1 | Marpissa | X | X | X | X | CSTR 1 | X | X | X | X | ||||||
| 2 | Naousa | X | X | X | X | CSTR | X | X | X | X | X | |||||
| 3 | Parikia | X | X | X | X | CSTR | X | X | X | X | X | |||||
| 4 | Thasos | X | X | X | X | X | CSTR | X | X | X | X | X | ||||
| 5 | Elounda | X | X | X | PFR 2 | X | X | X | X | X | ||||||
| 6 | Amyntaio | X | X | X | X | X | CSTR | X | X | X | X | X | X | |||
| 7 | Farsala | X | X | X | X | X | CSTR | X | X | X | X | X | X | |||
| 8 | Litochoro | X | X | X | X | X | CSTR | X | X | X | X | X | X | |||
| 9 | Elassona | X | X | X | X | X | PFR | X | X | X | X | X | X | |||
| 10 | Chrysoupoli | X | X | X | X | CSTR | X | X | X | X | X | X | ||||
| 11 | Agios Nikolaos | X | X | X | X | X | ODR 3 | X | X | X | X | X | ||||
| 12 | Lavrio | X | X | X | X | X | X | ODR | X | X | X | X | X | |||
| 13 | Florina | X | X | X | X | X | CSTR | X | X | X | X | X | X | |||
| 14 | Nea Kydonia | X | X | X | X | CSTR | X | X | X | X | X | X | ||||
| 15 | Thiva | X | X | X | X | ODR | X | X | X | X | X | X | X | |||
| 16 | Lamia | X | X | X | X | X | ODR | X | X | X | X | X | ||||
| 17 | Karditsa | X | X | X | X | PFR | X | X | X | X | X | X |
1 CSTR: continuous stirred tank reactor; 2 PFR: plug flow reactor; 3 ODR: oxidation ditch reactor.
Table 2.
Average daily inflow, population served, average daily energy consumption and energy consumption per m3 for the studied WWTPs.
Table 2.
Average daily inflow, population served, average daily energy consumption and energy consumption per m3 for the studied WWTPs.
| WWTP | Average Daily Inlet Flow, Qav (m3/d) | Population Served (PE) | Average Daily Energy Consumption (kWh/d) | Energy Consumption per m3, EQ (kWh/m3) | |
|---|---|---|---|---|---|
| 1 | Marpissa | 290 | 1157 | 471 | 1.65 |
| 2 | Naousa | 940 | 2555 | 774 | 1.08 |
| 3 | Parikia | 927 | 3215 | 529 | 0.44 |
| 4 | Thasos | 1150 | 4000 | 933 | 0.78 |
| 5 | Elounda | 700 | 4350 | 539 | 1.16 |
| 6 | Amyntaio | 1550 | 5350 | 1637 | 0.76 |
| 7 | Farsala | 935 | 5400 | 1298 | 1.37 |
| 8 | Litochoro | 2625 | 7000 | 1426 | 1.08 |
| 9 | Elassona | 644 | 12,225 | 1436 | 2.28 |
| 10 | Chrysoupoli | 1987 | 14,220 | 1473 | 0.76 |
| 11 | Agios Nikolaos | 3400 | 22,000 | 2179 | 0.74 |
| 12 | Lavrio | 2850 | 25,500 | 2301 | 0.80 |
| 13 | Florina | 11,830 | 26,000 | 2751 | 0.49 |
| 14 | Nea Kydonia | 6687 | 35,934 | 4123 | 0.63 |
| 15 | Thiva | 8410 | 40,000 | 1634 | 0.71 |
| 16 | Lamia | 14,285 | 46,550 | 7243 | 0.50 |
| 17 | Karditsa | 27,350 | 56,050 | 3102 | 0.13 |
© 2020 by the authors. Licensee MDPI, Basel, Switzerland. This article is an open access article distributed under the terms and conditions of the Creative Commons Attribution (CC BY) license (http://creativecommons.org/licenses/by/4.0/).
Share and Cite
MDPI and ACS Style
Siatou, A.; Manali, A.; Gikas, P. Energy Consumption and Internal Distribution in Activated Sludge Wastewater Treatment Plants of Greece. Water 2020, 12, 1204. https://doi.org/10.3390/w12041204
AMA Style
Siatou A, Manali A, Gikas P. Energy Consumption and Internal Distribution in Activated Sludge Wastewater Treatment Plants of Greece. Water. 2020; 12(4):1204. https://doi.org/10.3390/w12041204
Chicago/Turabian StyleSiatou, Alexandra, Anthoula Manali, and Petros Gikas. 2020. "Energy Consumption and Internal Distribution in Activated Sludge Wastewater Treatment Plants of Greece" Water 12, no. 4: 1204. https://doi.org/10.3390/w12041204
Note that from the first issue of 2016, this journal uses article numbers instead of page numbers. See further details here.