Impacts of Climate Change and Land Use/Cover Change on Streamflow in Beichuan River Basin in Qinghai Province, China
by
 ,
,
Zhe Liu
1,2, 
Lan Cuo
1,2,3,*,
Qijiang Li
4,
Xisheng Liu
4,
Xuelian Ma
5,
Liqiao Liang
1,3 and
Jin Ding
1,2 1
Key Laboratory of Tibetan Environment Changes and Land Surface Processes, Institute of Tibetan Plateau Research, Chinese Academy of Sciences, Beijing 100101, China
2
University of Chinese Academy of Sciences, Beijing 100049, China
3
Center for Excellence in Tibetan Plateau Earth Sciences, Beijing 100101, China
4
Qinghai Bureau of Hydrology and Water Resources Survey, Xining 810001, China
5
Qinghai Meterological Bureau, Xining 810001, China
*
Author to whom correspondence should be addressed.
Water 2020, 12(4), 1198; https://doi.org/10.3390/w12041198
Submission received: 2 March 2020
/
Revised: 15 April 2020
/
Accepted: 21 April 2020
/
Published: 23 April 2020
(This article belongs to the Special Issue Hydrological Impacts of Climate Change and Land Use)
Abstract
:Climate change (CC) and land use/cover change (LUCC) are the main drivers of streamflow change. In this study, the effects of CC and LUCC on streamflow regime as well as their spatial variability were examined by using the Distributed Hydrology Soil Vegetation Model (DHSVM) for the Beichuan River Basin in the northeast Tibetan Plateau. The results showed that CC increased annual and maximum streamflow in the upstream but decreased them in the downstream. CC also enhanced minimum streamflow in the whole river basin and advanced the occurrence of daily minimum streamflow. Temperature change exerted greater influence on streamflow regime than wind speed change did in most situations, but the impact of wind speed on streamflow reflected the characteristics of accumulative effects, which may require more attention in future, especially in large river basins. As for LUCC, cropland expansion and reservoir operation were the primary reasons for streamflow reduction. Cropland expansion contributed more to annual mean streamflow change, whereas reservoir operation greatly altered monthly streamflow pattern and extreme streamflow. Reservoir regulation also postponed the timing of minimum streamflow and extended durations of average, high, and low streamflow. Spatially, CC and LUCC played predominant roles in the upstream and the downstream, respectively.
1. Introduction
Streamflow is one of the key components of hydrologic cycle, an important water resource for maintaining sustainable social and economic development and an ecosystem with diverse life forms [1,2]. However, with the increase of atmospheric concentration of radiatively active gases [3], such as carbon dioxide, and continuous development of human society, global natural water balance has been affected [4]. The former, that is, climate change (CC), affects the hydrologic cycle, such as in precipitation and evaporation [5]. The latter primarily refers to land use/cover change (LUCC) caused by human activities, such as deforestation, urbanization, cropland expansion, and reservoir operation, which affect landscape morphological and physiological properties by altering albedo, leaf area index (LAI), surface roughness, soil infiltration rate, and interruption of stream channels, among others [6,7].
Hydrological response to CC and LUCC at global or large basin scales help us to understand the general condition of the impacts [7,8,9]. However, significant spatiotemporal variations of CC and LUCC in different regions indicate that regional or local responses deviate from the general conditions. Further, understanding regional or local hydrological responses is especially relevant to everyday people’s life, as the knowledge can be directly used in water resources management [10,11,12,13,14,15,16]. Regional or localized knowledge is especially important for the Tibetan Plateau, which hosts the numerous small- and meso-scale headwaters of large rivers in Asia, including the Yellow, the Yangtze, the Mekong, the Indus, the Salween, and the Tarim, [17,18,19,20].
Quite a few studies on CC and LUCC impacts on hydrology have substantially sprung up in the last 50 years [7]. The earliest review articles examined the LUCC effects on the basis of paired catchment studies [21,22,23], but the approach was only suitable for small catchments (<10 km2) that have uniform vegetation cover and the same climate, contributing little to water resource management, which usually covers varied land cover types and climate conditions [7]. Recent studies employed statistical methods [24,25,26] and hydrological models [10,17,20,27,28] to assess the impacts from both CC and LUCC. Statistical methods are simple and effective [29], but reveal few physical mechanisms. Moreover, this method is generally applied to describe interannual and interdecadal hydrological processes due to the foundation of equations based on annual or multi-year average [30]. Physically-based hydrological models, especially distributed hydrological models, can describe spatial variability in land and climate by using spatially distributed soil and vegetation parameters and climate variables, and can account for physical mechanisms of CC and LUCC impacts on hydrological processes [6,31]. This study utilized a distributed physically based model to investigate the impacts of CC and LUCC on streamflow regime.
Existing literature paid more attention to precipitation and temperature factors when evaluating impacts of CC on streamflow [10,32,33]. However, climate is much more than precipitation and temperature. McVicar et al. [34] analyzed 148 studies related to near-surface terrestrial wind speed on a global scale and found the average trend was −0.014 m s−1 year −1), and highlighted the leading role that wind speed change played in evaporation change in certain regions. On the basis of water balance, wind speed can affect streamflow through changing evaporation. However, to our knowledge, impacts of wind speed change on streamflow remain unknown.
Streamflow regime, magnitude, frequency, variability, timing, and duration can be used to characterize the complex pattern of a river flow [35]. Although some researchers have evaluated streamflow regime change under CC and LUCC, most of them ignored their spatial variability from upstream to downstream in a river basin and only focused on the basin outlets [36,37,38].
In order to provide more regional perspectives of hydrological responses to CC and LUCC, and to fill the knowledge gaps in wind speed effects on streamflow regime and the spatial heterogeneous impacts of CC and LUCC on streamflow regime, this study aimed to (1) analyze the characteristics of CC and LUCC in a meso-scale watershed on the Tibetan Plateau during 1966–2016, and (2) reveal the spatially heterogeneous combined and respective impacts of CC and LUCC, including wind speed change on streamflow regime in the basin.
2. Methods
2.1. Study Area
The Beichuan River Basin (BRB, 100.8–102 °E, 36.8–37.5 °N), located in the northeastern Tibetan Plateau in western China, was chosen to examine the impacts of CC and LUCC on streamflow regime. BRB is a diverse river basin that has had little human intervention because of low population density in the area (km−2, from communication with local herdmen), and a national nature reserve (780.73 km2) to protect the ecosystem and water resources exists in the upper stream (Figure 1, red line outlined), whereas a large area of cropland spreads in the middle reach, and a large reservoir (Heiquan reservoir with 1.82 × 10⁸ m3 water storage capacity) that has operated since 2001 exists in the lower reach. The diversity makes BRB a perfect study area for quantifying the heterogeneous effects of various factors on streamflow.
The area of the BRB is about 2800 km2, with the outlet at the Qiaotou station (Figure 1). The elevation ranges from 2400 to 4800 m and drops off from the northwest to the southeast. Its climate is dominated by East Asian monsoon as well as plateau monsoon [39]. The BRB mean annual air temperature is around 2.8 °C, and the total annual precipitation is approximately 508 mm. Beichuan river originates from the south slope of Daban Mountain of the Qilian Mountain Range (Figure 1). It is a major branch of the Huangshui River, one large tributary of the Yellow River. Baoku River and Heilin River are the two tributaries of the Beichuan River. The BRB supplies 70% of the fresh water consumption (about 1.35 × 10⁸ m3 domestic and industrial use) to Xining City, the capital city of Qinghai Province, with a population of more than 2 million people, being the largest city on the Tibetan Plateau. There are about 10,000 people living in the BRB who herd cattle and grow wheat, canola, and potatoes. The basin also provides irrigation water to the downstream agriculture field, a main crop production region for the Qinghai Province.
2.2. Model
The Distributed Hydrology Soil Vegetation Model (DHSVM) [40,41] was used in this study. The DHSVM is a fully distributed, physically-based hydrologic model, and has been identified as one of the most suitable models for hydrologic study in complex mountainous terrain among 30 hydrological models [42]. It is typically applied at high resolutions varying from 25 to 200 m at a sub-daily time scale for watersheds of up to 10,000 km2. The DHSVM has been widely applied in both tropical [43,44,45] and temperate catchments [10,46] in many research fields, including forest–snow interactions [47], climate change [48], landscape change [27,49], human activities [27], urbanization [10,44], stream temperature [50], water quality simulations [51], and sediment transportation [52].
Using a grid, the model explicitly accounts for spatial variations of topography, meteorological elements, soil, and vegetation in a basin, and describes physical processes in energy and water balances. Built on digital elevation model (DEM)-derived grid, each cell with specified resolution has explicit elevation, soil and vegetation types, soil depth, and meteorological variables interpolated from nearby stations. All energy and water balance variables are calculated for each cell. Stream channels are also distributed on the grid on the basis of their actual existence and are connected on the basis of the elevation. Water and energy balances are computed using physical laws, for instance, potential evapotranspiration is calculated by the Penman–Monteith equation for both overstory and understory vegetation. Surface runoff and sub-surface flow are modeled cell-by-cell and first accumulated to the streams, being then routed downstream using the linear reservoir method on the basis of elevation. Vertical unsaturated moisture movement through the soil layers is calculated by using Darcy’s law. Canopy snow interception and release is modeled using a one-layer mass–energy balance model, whereas snow accumulation and melt below the canopy are simulated using a two-layer mass–energy balance model [40]. Given rugged terrain and complicated physical processes in the study area, we hereby chose the DHSVM so that high spatial resolution could be fully implemented. Figure S1 shows conceptual representation and flow chart of the DHSVM.
The spatial resolution of the DHSVM in BRB was 100 m. This 100 m resolution was used because the original land use/cover data we obtained was in 100 m resolution, and 100 m resolution can sufficiently reflect terrain in this area. The 100 m resolution also balanced the physical representation of the basin and the efficiency of the performance of the computer. Stream network and soil depth were generated on the basis of the DEM for the BRB. The model was run at 3 hour time step, and the simulation results were aggregated to daily and monthly so that calibration and validation could be performed at daily and monthly steps, as there was only observed daily streamflow available. According to Cuo et al. [46], sensitive parameters of the DHSVM are lateral saturated hydraulic conductivity, exponential decrease in lateral hydraulic conductivity with depth, porosity, LAI, vegetation height, and vapor pressure deficit, which were calibrated in this study. The model warming-up period was 1965, and the analysis was conducted from 1 January 1966 to 31 December 2016 after model calibration and validation.
Model performance was evaluated using Nash–Sutcliffe efficiency (), the ratio of root mean square error and standard deviation of the observation (RSR), and relative error (). is a normalized statistic that compares the residual variance to observed data variance and is regarded as the best objective function to reflect the overall fit between simulation and observation (see Equation (1)) [53,54]. RSR is normalized root mean square error (RMSE; Equation (2)), and it considers both an error index statistic and a scaling factor, making it applicable to multifarious constituents [53]. describes the difference in the means between simulation and observation (Equation (3)).
where is the number of data points, is the observed streamflow (m3 s−1) at time step i, is the simulated streamflow (m3 s−1) at time step i, and and are the means of observed and simulated values (m3 s−1), respectively. The model can be judged as “satisfactory” if 0.50 0.65, 0.60 < RSR 0.70, and 15% | < 25%; “good” if 0.65 0.75, 0.50 < RSR 0.60, and 10% | < 15%; and “very good” if 0.75 1.00, 0.00 < RSR 0.50, and | < 10% for a monthly time step [53].
2.3. Data
There are four hydrological stations and one meteorological station in the BRB (Figure 1). Datong (DT) had daily temperature maxima and minima, precipitation, and wind speed operated by Qinghai Meteorological Bureau. Daily streamflow and precipitation were collected from four hydrological stations: Niuchang (NC) above Heiquan dam, Xiamen (XM) on Baoku River, Heilin (HL) on Heilin River, and Qiaotou (QT) on Beichuan River, all managed by the Qinghai Bureau of Hydrology and Water Resources Survey. The station operation periods were different (Table 1). XM was removed in 2001 when Heiquan reservoir was put into use, and NC was built in 2002.
In light of the reality that no meteorological observations were available in the altitude higher than 2459 m in the BRB, we installed an automatic weather station (AWS) in September 2013, situated at 3463 m to measure meteorological elements at hourly time steps. Due to the short periods, the meteorological data observed at AWS could not be used as model forcing. Instead, we used daily mean temperature at this station and DT to compute temperature lapse rate in the BRB for the overlapping period in 2014 and 2017, obtaining −0.81 °C/100 m as the BRB temperature lapse rate, which was then used to interpolate maximum and minimum temperature across the basin. The average of daily maximum and minimum temperature was used as daily mean temperature. We assumed that every station had the same daily wind speed as DT. The missing precipitation was filled by applying the linear relationship for monthly precipitation between the two stations in the overlapping period.
The method of Nijssen et al. [55] was adopted to calculate relative humidity, downward shortwave, and longwave radiation on the basis of daily precipitation and temperature. An iterative algorithm between dewpoint temperature and radiation was used to calculate both variables involving factors of temperature range, minimum temperature, and annual precipitation [56,57]. The estimated dewpoint temperature was used to calculate actual vapor pressure, and with saturation vapor pressure, relative humidity was calculated. Spline interpolation was used to disaggregate daily to hourly temperature and relative humidity. Daily precipitation was evenly distributed to hourly time steps. Daily wind speed was regarded as the same as hourly interval wind. Hourly downward shortwave and longwave radiation were calculated from disaggregated hourly temperature and humidity by taking various factors into consideration, such as location, local time, transmissivity, emissivity, and cloudiness. Hourly forcings were then aggregated or averaged to obtain three-hourly forcing to drive the model. These station data were gridded to 100 m spatial resolution using the Cressman interpolation approach, which calculated weighted average values from multiple stations on the basis of the distance as a radius from the stations.
The DEM was extracted from Shuttle Radar Topographic Mission (SRTM) data (http://srtm.csi.cgiar.org/srtmdata/). The BRB soil class map was downloaded from Harmonized World Soil Database (HWSD) (http://webarchive.iiasa.ac.at/Research/LUC/External-World-soildatabase/HWSD_Data/), which showed that loam and sandy loam were the main soil types occupying nearly 90% of the basin, being consistent to our laboratory measurement of field-collected soil samples. Land use/cover data for three periods: 1980, 2000, and 2015, were derived from Resource and Environment Data Cloud Platform (http://www.resdc.cn/Default.aspx). Maps of 1980 and 2015 were the earliest and latest available for the BRB, respectively, and the 2000 map was the year before the reservoir operation. Because 1980 and 1990 maps were very similar, we did not use the 1990 map. As there were no existing land cover products before 1980, we created land cover of 1960 on the basis of the land cover map of 1980. According to the older generation who have lived in this area since the 1950s, cropland appeared in the late 1960s. We then constructed land cover for 1960 with assumptions that (1) cropland area in 1980 transformed into grassland, as it was the dominant land cover type of the whole basin, and (2) other land cover types were not changed during 1960–1980.
2.4. Statistical Analysis
Investigating long-term trends of hydroclimatic variables improve the understanding of hydroclimatic conditions and changes [58]. In this study, Sen’s slope estimator, Mann–Kendall (MK) test [59,60], and moving t-test technique were employed to examine the trends and change-points in various hydroclimatic variables in the BRB. Details of these techniques are provided in the Supplementary Materials section.
3. Results
3.1. Observation
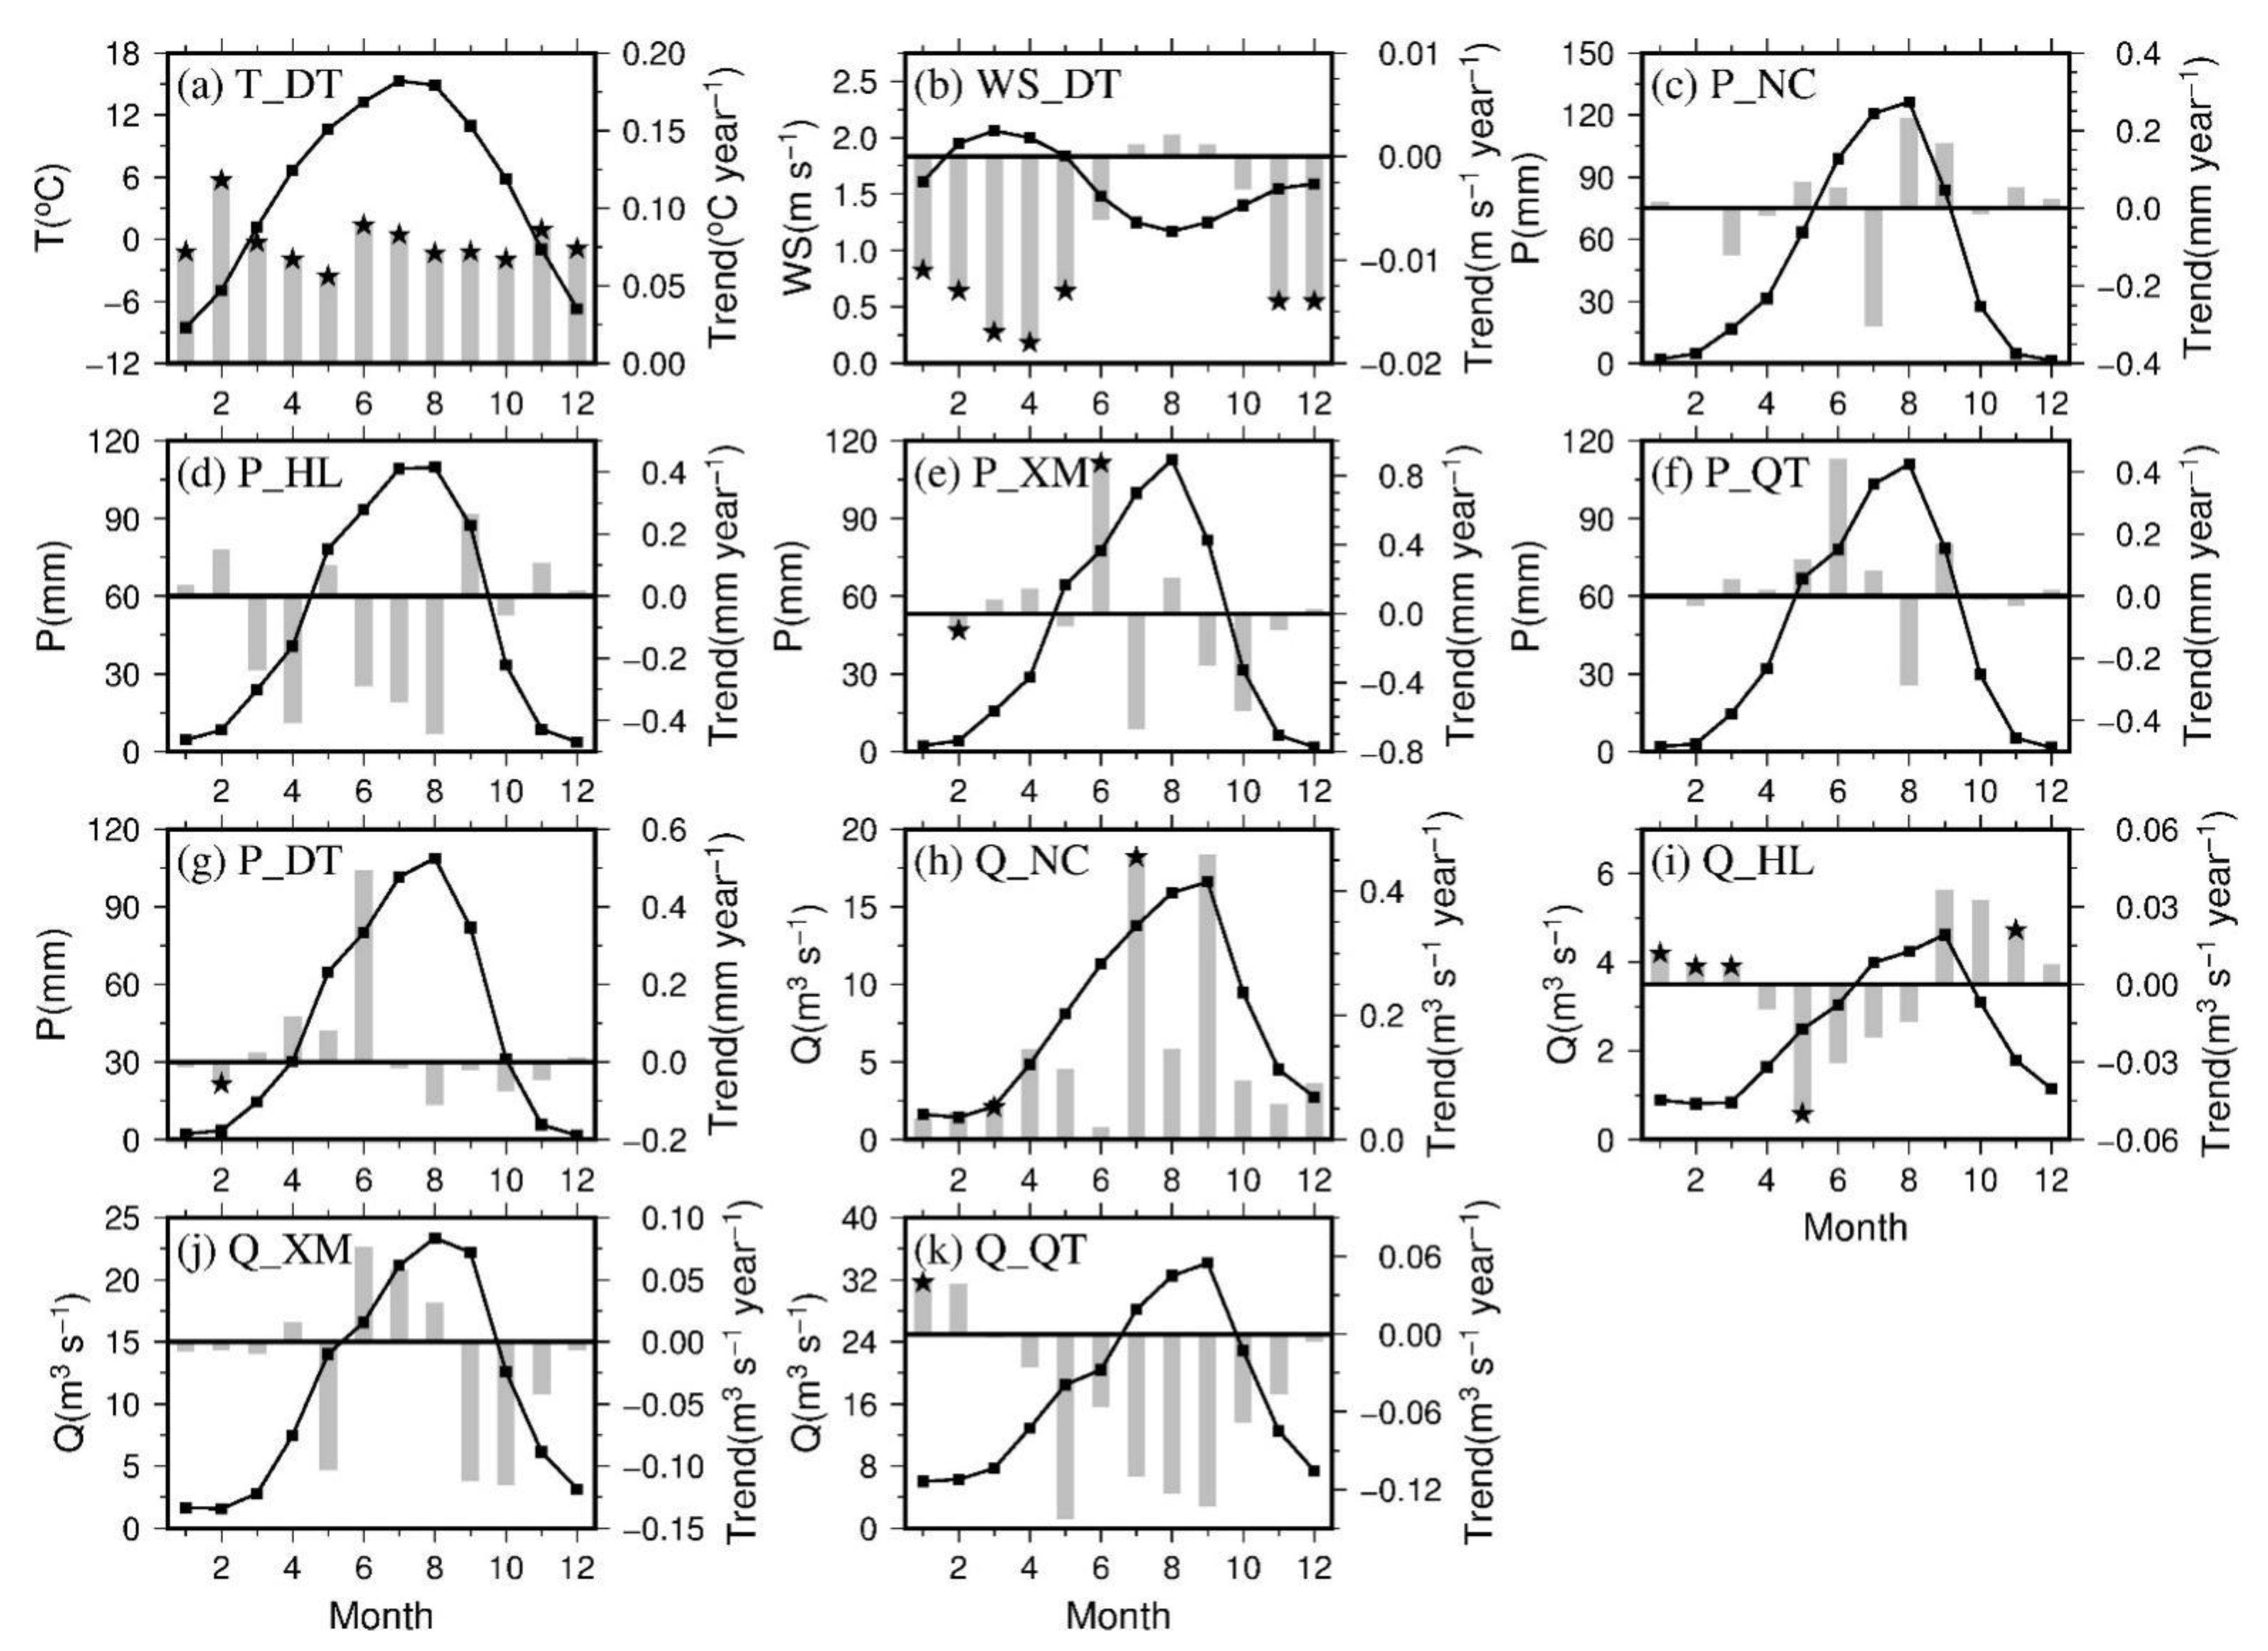
Table 1 shows mean annual, annual trend, and variability of observed air temperature, wind speed, precipitation, and streamflow obtained from daily time series at each station. Figure 2 shows mean monthly and monthly trend of these variables. The mean annual air temperature at DT station was 4.84 °C (Table 1), high in July and low in January (Figure 2a). Both annual and monthly temperature increased significantly, ranging from 0.056 to 0.118 °C year−1 for the monthly and 0.08 °C year−1 for the annual over 1966–2016. The coefficient of variation (CVyr) of annual temperature was 26.49%. The average annual wind speed was 1.59 m/s and decreased significantly at −0.008 m s−1 per year during the period. The CVyr of annual wind speed was 22.56%. Wind speed showed a strong seasonal pattern as well, high in spring and low in summer (Figure 2b). Wind speed significantly decreased in January–May and November–December, and the rates ranged from −0.018 to −0.011, increasing insignificantly in July–September.
Due to monsoon influence, precipitation was concentrated in May–September, accounting for 80% of annual total, and peaked in August for all stations (Figure 2c–g). Precipitation did not show a significant change, except in February and June at XM and February at DT. Table 1 shows that annual precipitation and elevation had a generally positive relationship in BRB, with the exception of HL. Although HL was located at the second highest place, lower than NC, HL measured the highest annual precipitation (600.88 mm) among all stations, perhaps due to it having the closest distance to Qinghai Lake, the largest inland lake in China. Abundant water vapor from the lake and orographic lifting could favor precipitation in winter and spring. CVyr of annual precipitation was between 11.19% and 14.98%.
The monthly streamflow pattern (Figure 2h–k) followed that of temperature and precipitation in general, with its peak 1 month lag behind that of precipitation at NC, HL, and QT. There were a few significant monthly streamflow trends at NC, HL, and QT, which were different from monthly precipitation change. At NC, HL, and XM, annual streamflow trends followed those of annual precipitation without any statistical significance (Table 1). However, at QT, annual streamflow decreased while annual precipitation increased slightly due to reservoir operation (Table 1). CVyr of annual streamflow in the BRB was less than 27%, which is relatively small compared to other rivers in China.
Figure S2 displays the change point detection of annual data. Figure S2a demonstrates that an obvious upward trend of temperature started in 1993 when the UF (Test statistic, details are provided in the Supplementary Materials section) curve exceeded the 0.05 confidence interval. However, because the intersection of the curves was located outside the confidence interval, the MK method failed to detect the exact year of the abrupt change point. We then used the moving t-test technique to detect again. Figure S2b shows that abrupt changes appeared in 1982 and 1984 for n = 15 and n = 10, respectively. We chose 1983 as the change point, and the annual temperature showed upward trends of 0.012 °C year−1 and 0.113 °C year−1 before and after 1983 on the basis of Sen’s slope test. For wind speed, UF and UB (Test statistic, details are provided in the Supplementary Materials section) curves intersected in 1980 (Figure S2c), an abrupt change year. After 1993, the UF curve was constantly lower than the confidence interval, indicating wind speed consistently and significantly decreasing at p < 0.05. The MK change point test identified no mutation point for precipitation and streamflow for all stations (not shown). In the following analysis, we used temperature and wind speed change to represent climate change during 1966–2016 in the BRB.
3.2. LUCC
As shown in Figure 3 and Table 2, the main landscape types in BRB were grassland, closed shrubland, and cropland, together accounting for more than 80% of the total area throughout the period. Grassland took up about 50% and was distributed across the whole river basin. More than 20% of the basin was occupied by closed shrubland, concentrated mostly in the upstream and midstream areas. The third largest land cover type was cropland, which made up 11.64%–12.75% of the downstream and lowland areas of the basin in 1980, 2000, and 2015. There was no cropland in 1960.
The transmission matrixes of land use in Tables S1 and S2 illustrate the interconversion between different landscape types from 1980 to 2000 and from 2000 to 2015. From 1960 to 1980, mere grassland transformed to cropland (358.52 km2). Table S1 illustrates that from 1980 to 2000, the most significant features of LUCC were urban and built area expansion and interconversion between grassland and other land cover types. Urban and built area increased by 1.57 times and reached to 41.65 km2, of which 37% (15.44 km2) was from cropland. Grassland interconverted mostly with closed shrubland, cropland, and bare ground. As a result, grassland increased by 45.52 km2, whereas closed shrubland, cropland, wooded grassland, woodland, and bare ground decreased moderately. Cropland decreased due to its conversions to grassland (38.03 km2), closed shrubland (5.76 km2), and woodland (5.06 km2). Water increased by 19.41% (0.64 km2) from cropland and closed shrubland transformation.
Compared to 1980–2000, there were a few changes from 2000 to 2015 (Table S2) due to the nature reserve that was approved for establishment by the Qinghai People’s Government in 2005, being promoted to a national nature reserve by the State Council in 2013, as well as other conservation policies. The greatest change was from bare ground to grassland, which was only 6.61 km2. Urban and built area only increased by 3.18 km2 during this period, indicating limited human activity after 2000. Moreover, cropland decreased slightly, owing to the increment of urban/built area and water area. Water area expanded by two times and was increased from 3.92 km2 in 2000 to 8.11 km2 in 2015 due to the operation of Heiquan reservoir since 2001.
3.3. Model Simulation
3.3.1. Calibration and Validation Results
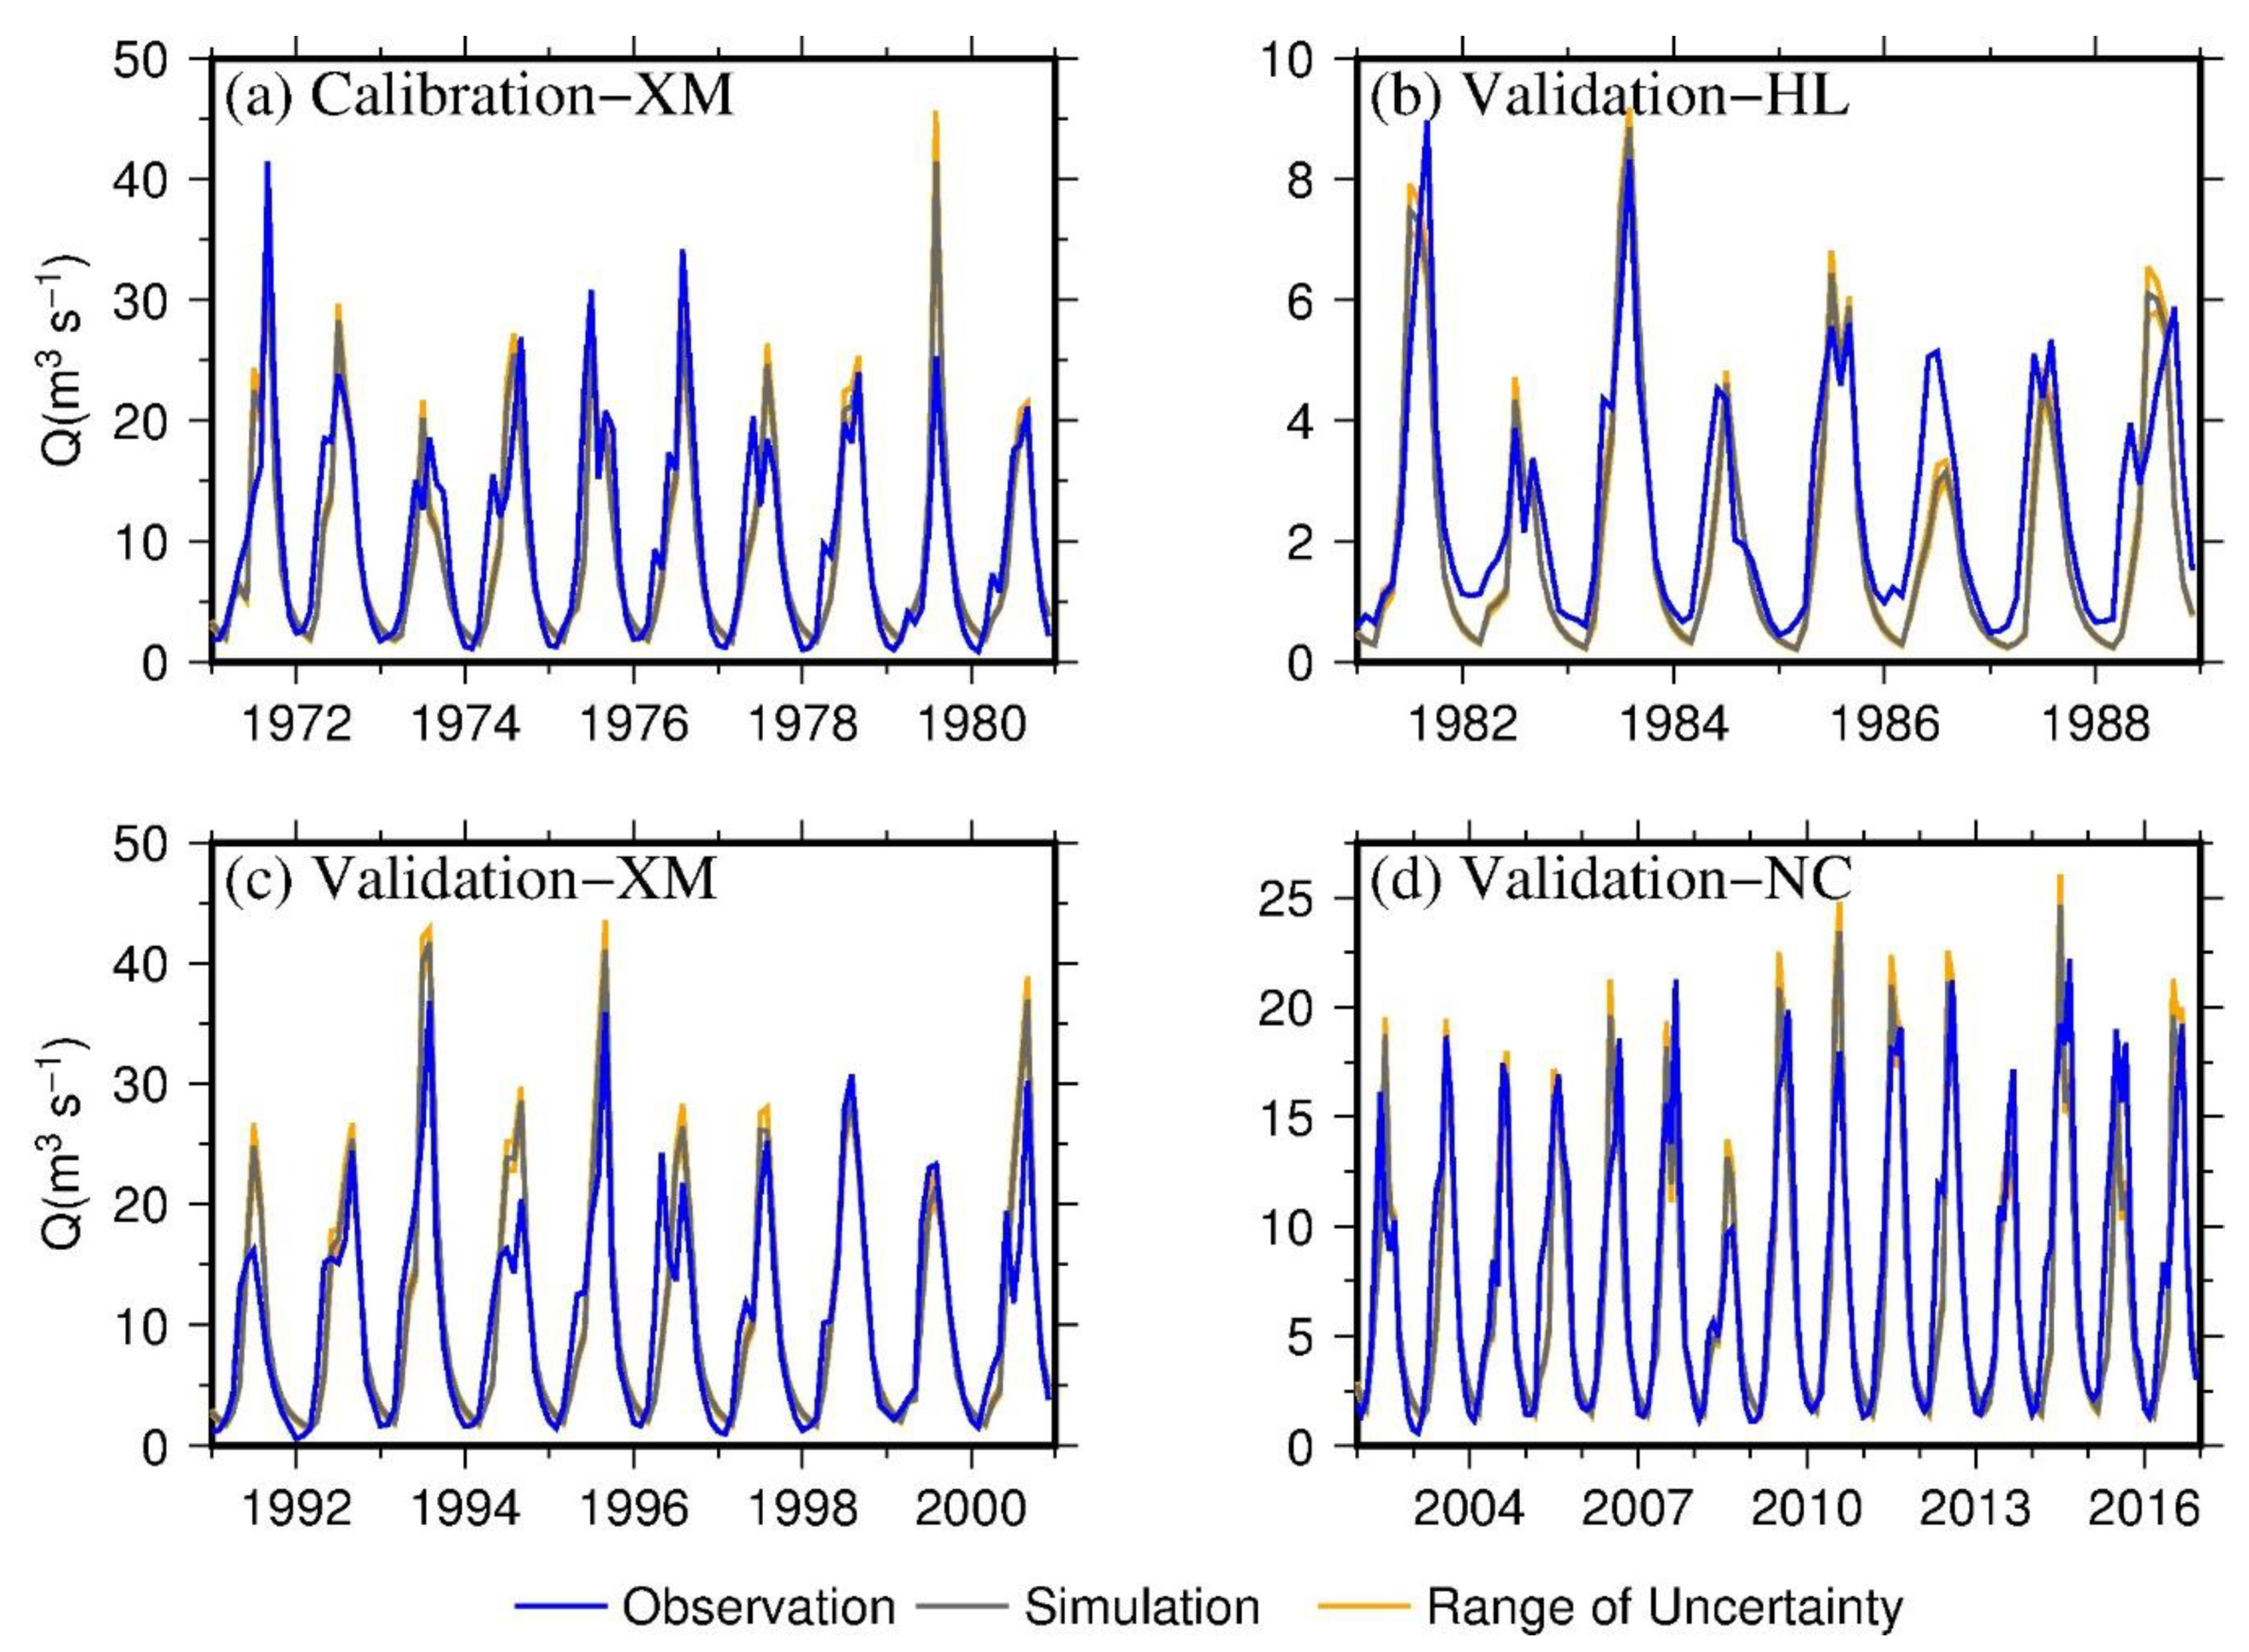
Model calibration was conducted for 1971–1980 at XM station. HL (1981–1988), XM (1991–2000), and NC (2002–2016) were used for model validation (Figure 4 and Table 3). The for monthly streamflow was 0.76, and monthly RSR and were low, which indicated that the DHSVM-simulated streamflow matched the “very good” observation during calibration periods (Table 3). Peakflows were overestimated in 1979 (Figure 4a). To further investigate model performance of extreme streamflow, Table 4 compares the standard deviation and relative error of peakflows and low flows selected from the top 10 maximum flow and bottom 10 minimum flow in each year during the calibration period. It can be seen that the model could capture the basic features of peakflows, but there was large relative error (48.64% due to low observed value as denominator) for low flow simulation, although the absolute difference (only at 0.57 m3 s−1) was reasonable.
For model validation, monthly , RSR, and showed “good” or “very good” agreements between simulation and observation, wherein NC station had the highest monthly at up to 0.8 (Table 3). In contrast, the simulation at HL station was inferior to XM and NC stations; this may have been caused by its low annual streamflow, which was only about 33% and 25% of NC and XM annual streamflow, respectively. Simulated peakflows could always meet the “satisfactory” standard, especially upstream at HL and NC, whereas low flows showed “dissatisfactory” status, owing to the small value (Table 4). In general, the above analysis indicates that the DHSVM model could reproduce the flow pattern fairly well in the BRB.
After calibration and validation, model uncertainty resulting from the parameter uncertainty was evaluated. Sensitive parameters including lateral conductivity, exponential decrease, porosity, field capacity, leaf area index, and vapor pressure deficit were increased (or decreased) by 10% at the same time, and two extra simulations were conducted for the ±10% changes. The streamflow of the two simulations were also shown in Figure 4. The figure shows that model parameter uncertainty yielded very small uncertainty ranges in streamflow, as uncertainty ranges of annual and monthly streamflow of all stations in BRB were within ±5% and ±12%, respectively.
To further evaluate the performance of the DHSVM, we also compared the annual and monthly simulated and observed streamflow regime indices in the longer overlapping periods at NC and HL (Table 5 and Figure S3), where human activity is not intense. Table 5 compares the mean annual; annual variability; and the trends of annual streamflow, annual 1-day peakflow (FX1day), and 1-day lowflow (FN1day). The relative errors of mean annual streamflow were only −8.21% and −10.77% at NC and HL, respectively. The simulated annual variability could also reflect the observed variability, especially at HL. At both stations, the directions of trends of annual mean and extreme streamflow were the same for the simulation and observation, although the quantities were slightly different.
Figure S3 shows the simulated and observed means and trends of monthly streamflow. In general, simulated streamflow could reflect the intra-annual variability to some extent, but with low spring flow and early occurrence of maximum monthly flow, as shown by the lines. The bar graph shows that the directions of most of the monthly trends of simulation and observation were the same at the two stations, and all six opposite trends (January, February, April, and May for NC, July and September for HL) in the simulation and observation were insignificant. Overall, the DHSVM could reflect real hydrological conditions and changes reasonably well in the upper BRB with limited human activity. Next, we investigated CC and LUCC impacts on streamflow regime and the spatial variation of the impacts across the basin using DHSVM throughout 1966–2016, which is longer than the observation periods at most stations except QT.
3.3.2. Scenarios and Streamflow Regime Metrics
As annual precipitation at all stations did not show statistical significant change over the period (Table 1), we did not examine long-term precipitation change effects on streamflow in this study. To evaluate the impacts of temperature and wind speed change on streamflow regime, we compared historical climate with the trend removed climate conditions. Figure S4 shows the annual maximum and minimum temperature as well as the wind speed for 1966–2016 and 1966 climate condition (climate 1966). Climate 1966 represents the beginning state of climate conditions during 1966–2016, with no climate change throughout the time period.
LUCC refers to cropland expansion, grassland change, urbanization, reservoir regulation, and so on. This study adopted the scenario method, which has been widely utilized [6,10,17,61] to investigate CC and LUCC impacts and to segregate their impacts. Six scenarios were used: (1) S1, a baseline represented by climate in 1966 and land cover in 1960; (2) S2, represented by historical wind speed condition, temperature in 1966, and land cover in 1960. The comparison between S2 and S1 showed the impact of wind speed change; (3) S3 was represented by historical temperature condition, wind speed in 1966, and land cover in 1960. The comparison between S3 and S1 denoted the impact of temperature change; (4) S4 was represented by historical climate conditions and land cover in 1960. The comparison between S4 and S1 showed the influence of CC in general; (5) S5 was represented by a series of simulations in the sequence using historical climate conditions bracketing land cover conditions in corresponding periods, that is, simulations with land cover in 1960 with 1966–1970 climate, 1980 land cover with 1971–1990 climate, 2000 land cover with 1991–2010 climate, and 2015 land cover with that of 2011–2016. The comparison between S5 and S4 revealed the impacts of LUCC without reservoir impacts; (6) S5R was the observed streamflow at QT station. The comparison of S5R and S4 represented the LUCC, including reservoir operation influences on streamflow at QT with the rationale that observed streamflow was affected by the combined impacts of CC and LUCC.
The full streamflow regime represented by magnitude, frequency, variability, timing, and duration [35] was examined. This study selected 18 streamflow metrics on the basis of the Indicators of Hydrologic Alteration (IHA) [62,63]. A detailed description of these metrics is provided in Table 6. The rigorously calibrated and validated DHSVM model was then employed to compare the differences of flow regimes among all the scenarios.
3.3.3. Magnitude and Variability
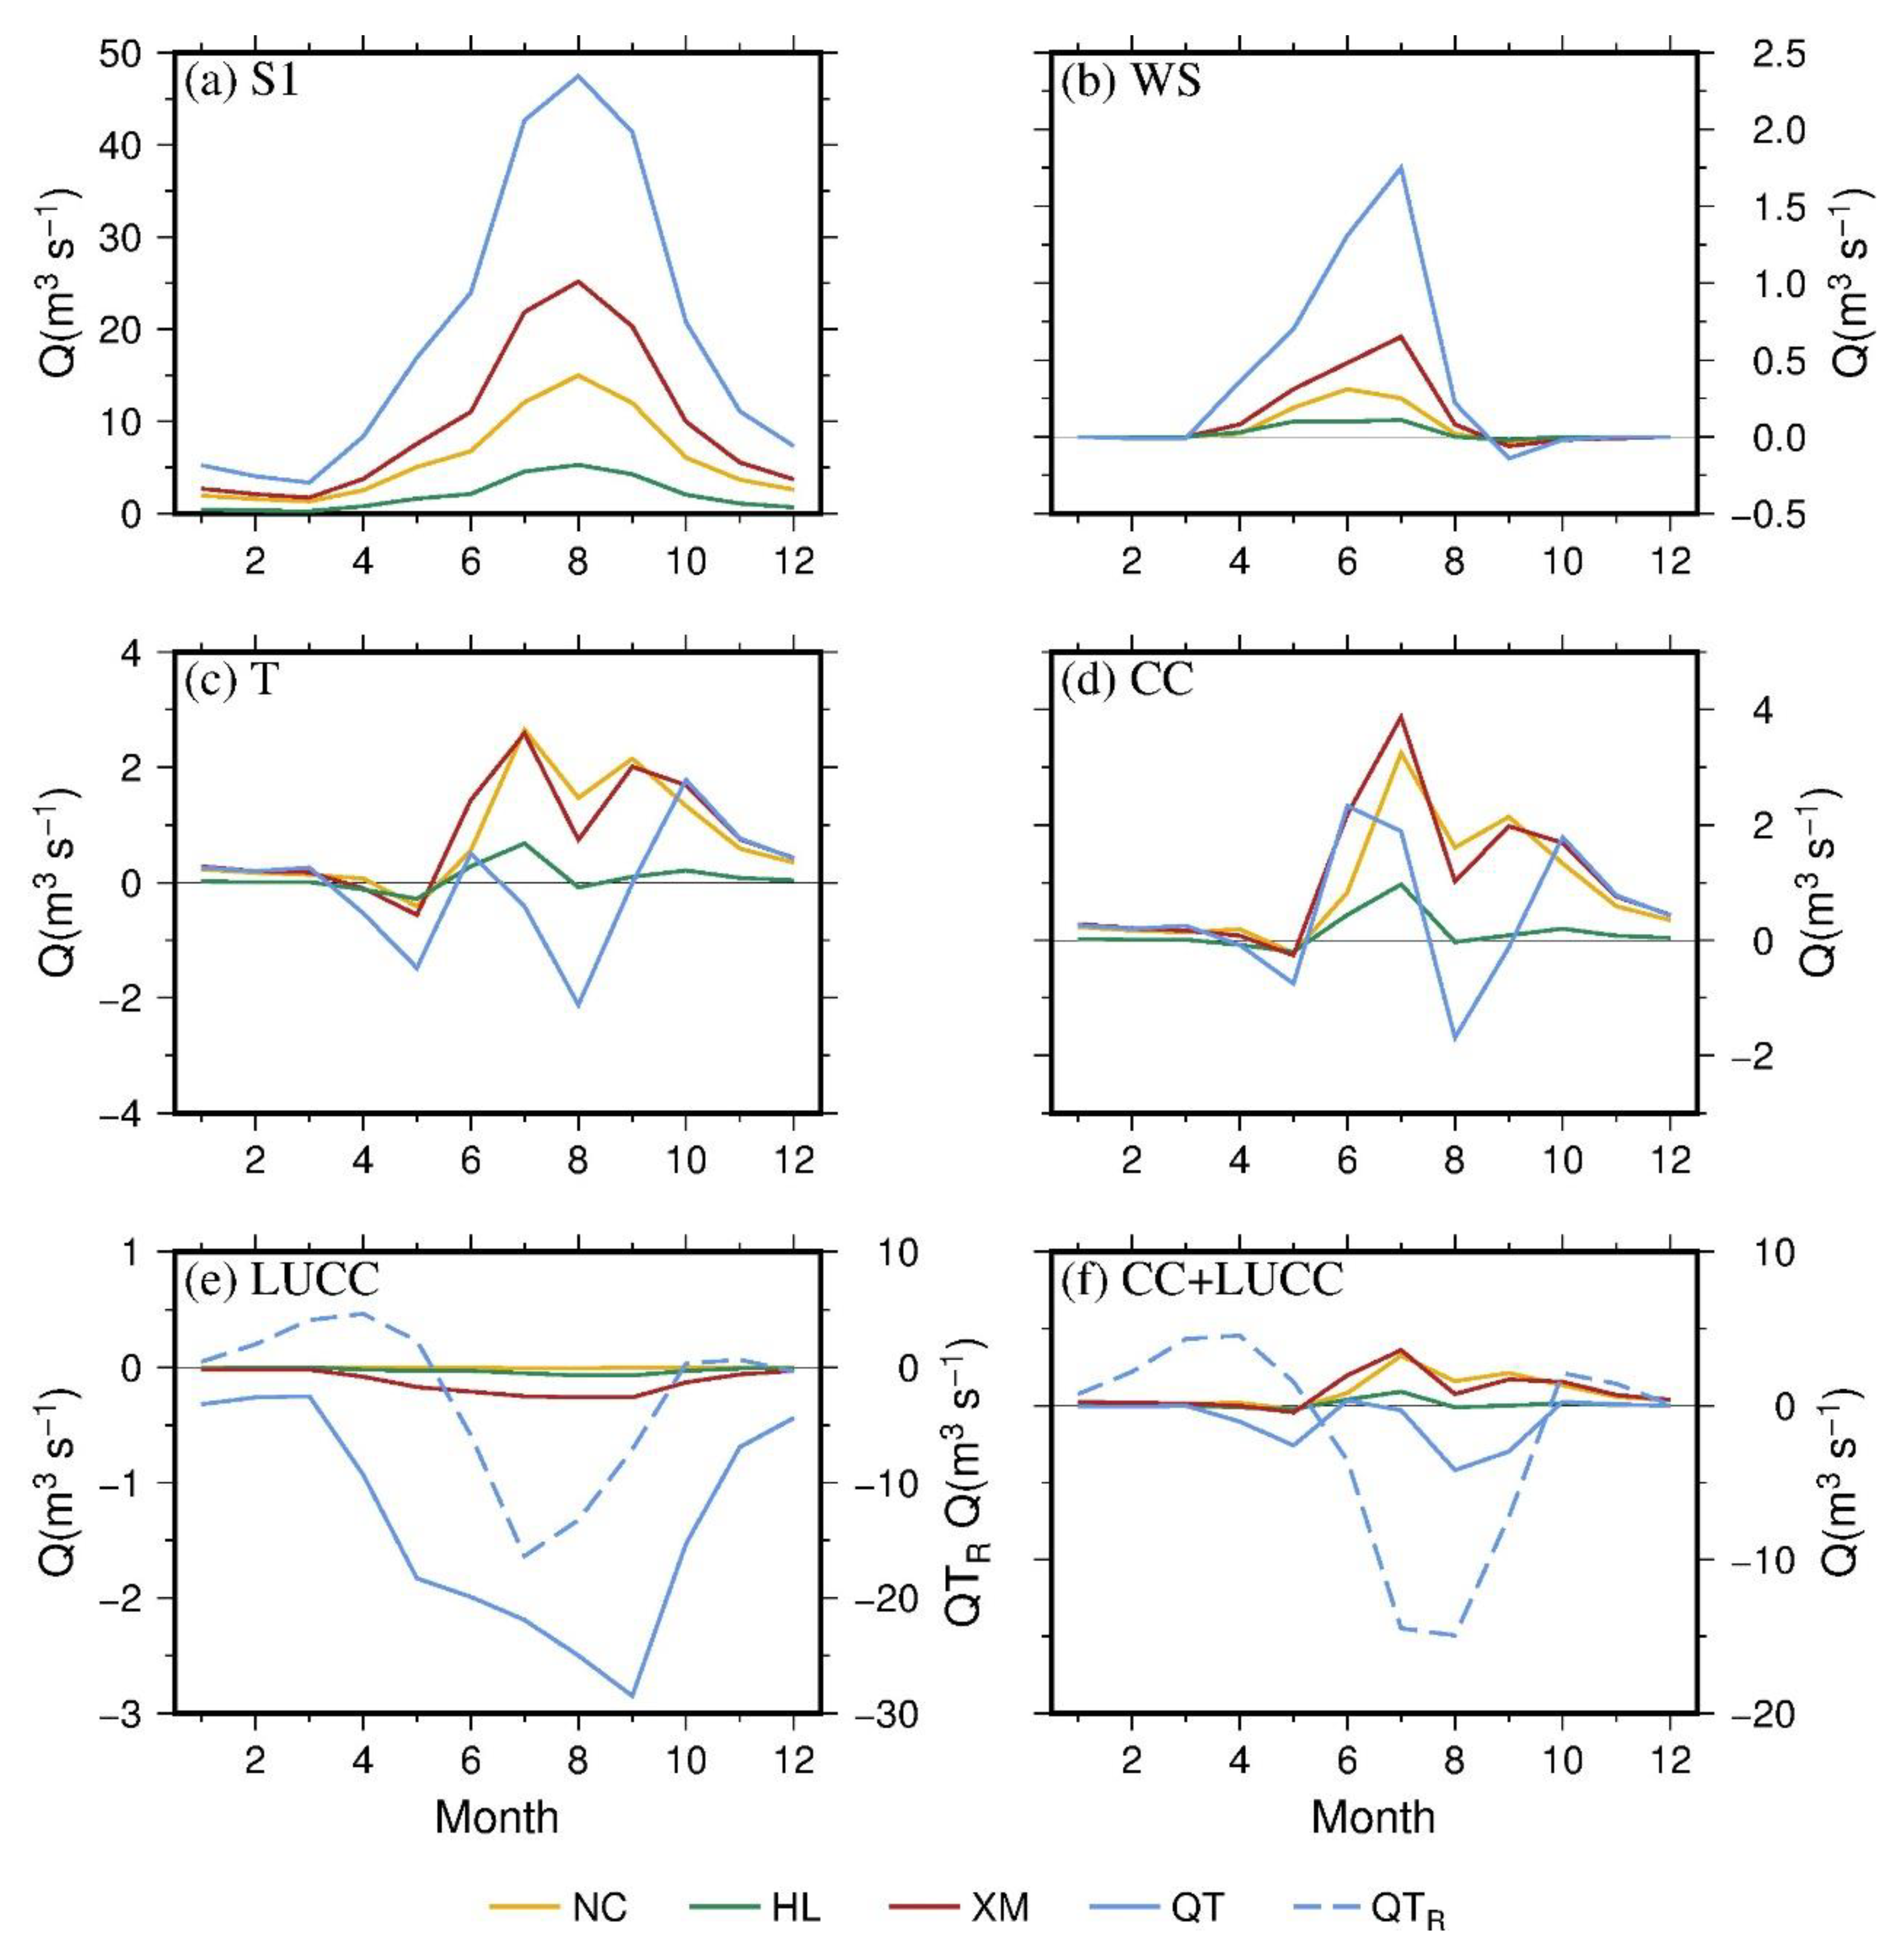
Figure 5 displays simulated monthly streamflow in baseline scenario and its response to CC and LUCC in 1966–2016. It is clear that the magnitude of monthly streamflow corresponded to the basin area (Figure 5a). For Beichuan river, wind speed decrease caused increase in monthly streamflow in most months, with higher increase for the downstream station during March–August (Figure 5b). Streamflow at NC, HL, XM, and QT rose by 0.06, 0.03, 0.12, and 0.35 m3 s−1, respectively, on average across the months. With the warming in the BRB, most months’ streamflow increased at NC, HL, and XM stations, except April, May, and August streamflow (Figure 5c). QT had decreased flow in the warm season, except June, and increased flow in autumn and winter. The increased winter flow at the four stations could be due to cryosphere degradation. The combined impact of wind speed and temperature generally resembled that of temperature impact, except in June and July at QT, indicating temperature was the predominant impact factor for changing monthly streamflow magnitude (Figure 5d). The impacts of LUCC on monthly streamflow amplified from the upstream to the downstream areas, largely reflecting the reality in the basin (Figure 5e). As cropland expansion was the main feature of land cover change taking place in the middle to lower reaches in 1980, NC and HL streamflow was barely affected, whereas streamflow at XM dropped slightly during May–September (reduced by 0.23 m3 s−1). Streamflow at QT trended similarly with XM, but with 10-fold reduction from May to October without considering the reservoir (left y-axis). However, with the reservoir, the change was mixed, with increases and decreases across months (Figure 5e, right y-axis). Streamflow reduced by 10.65 m3 s−1 on average in June–September, and increased by 4.37 m3 s−1 on average in March and April, resulting from flood control in the rainy season and water release for spring irrigation. Under the combined CC and LUCC (Figure 5f), monthly streamflow at NC, HL, and XM increased in most months, similar to the changes caused by CC impacts, indicating the dominance of CC impacts. Although monthly streamflow without reservoir influence at QT had similar variability caused by CC impacts (Figure 5d), the magnitude of monthly streamflow was mainly negative, like that by LUCC impacts (Figure 5e), with the greatest decline (4.19 m3 s−1) in August. With reservoir regulation, October–May streamflow increased, whereas June–September streamflow decreased dramatically, especially in August, which dropped markedly by 14.93 m3 s−1.
Figure 6 demonstrates that extreme streamflow (Qmax1 and Qmax3, hereafter Qmax with reference to left y-axis; Qmin1 and Qmin3, hereafter Qmin with reference to right y-axis) increased with basin area (Figure 6a) and responded diversely to CC and LUCC. Wind speed decrease resulted in higher Qmax, which was enhanced in the downstream area, but had a smaller negative change in Qmin (Figure 6b). With greater temperature, Qmax increased at NC, HL, and XM, but decreased at QT, whereas Qmin consistently increased in the whole basin (Figure 6c). Figure 6b–d also shows that temperature was the dominant impact factor on Qmax and Qmin in the whole river basin. The impacts of LUCC with and without the reservoir were different (Figure 6e). LUCC without the reservoir displayed negative effects on all Qmax and Qmin, whereas LUCC with the reservoir had positive effect on Qmin but greater negative influence on Qmax. By comparing Figure 6d–f, it can be found that CC impacts on Qmax and Qmin were dominant in the upstream (NC and HL) and the midstream (XM) areas. As for the downstream area (QT), LUCC was the principal factor for extreme streamflow change.
The variability of extreme streamflow (CVmax1 and CVmax3, hereafter CVmax; CVmin1 and CVmin3, hereafter CVmin) are depicted in Figure 7. Average values of CVmax and CVmin in the BRB in baseline scenario were around 55% and 12%, respectively. In general, the two indices showed an inverse relationship with basin area, with CVmax decreasing and CVmin increasing with area (Figure 7a). CVmax decreased with the wind speed change at all stations, whereas CVmin decreased at NC and HL, but increased at XM and QT (Figure 7b). Temperature increasing led to declining CVmax but rising CVmin at each station (Figure 7c). Comparing Figure 7b–d shows that CVmax and CVmin were dominated by temperature increase, except CVmax at QT. LUCC, especially LUCC with the reservoir, exerted positive effects on CVmax1 and CVmin (Figure 7e). The great positive effects on variability could make extreme streamflow less predictable. The impacts of the combined CC and LUCC (Figure 7f), especially including the reservoir, increased the variability of CVmin at all stations. However, CC and LUCC effects had negative impacts on CVmax at most stations. Figure 6 and Figure 7 show inverse change in Qmax and CVmax, but similar change in Qmin and CVmin caused by CC and LUCC. This is because streamflow magnitude changes can arouse standard deviation change of data series, and different magnitudes of extreme flow can result in various trends of variability.
3.3.4. Frequency
Non-exceedance probability of annual maximum peakflows for each station are shown in Figure 8. Peakflows with 95% non-exceedance probability for baseline (S1) corresponded to 78.35, 29.47, 124.26, and 323.34 m3 s−1 at NC, HL, XM, and QT, respectively. CC and LUCC caused little change in NC, HL, and XM peakflow frequency, with characteristics the same as CC and LUCC impacts on their magnitude of extreme flow. Peakflow frequency changed moderately at QT affected by CC and LUCC. The 95% non-exceedance probability of peakflow for S1, S4, and S5R corresponded to 323.34, 285.11, and 190.2 m3 s−1, respectively.
3.3.5. Timing
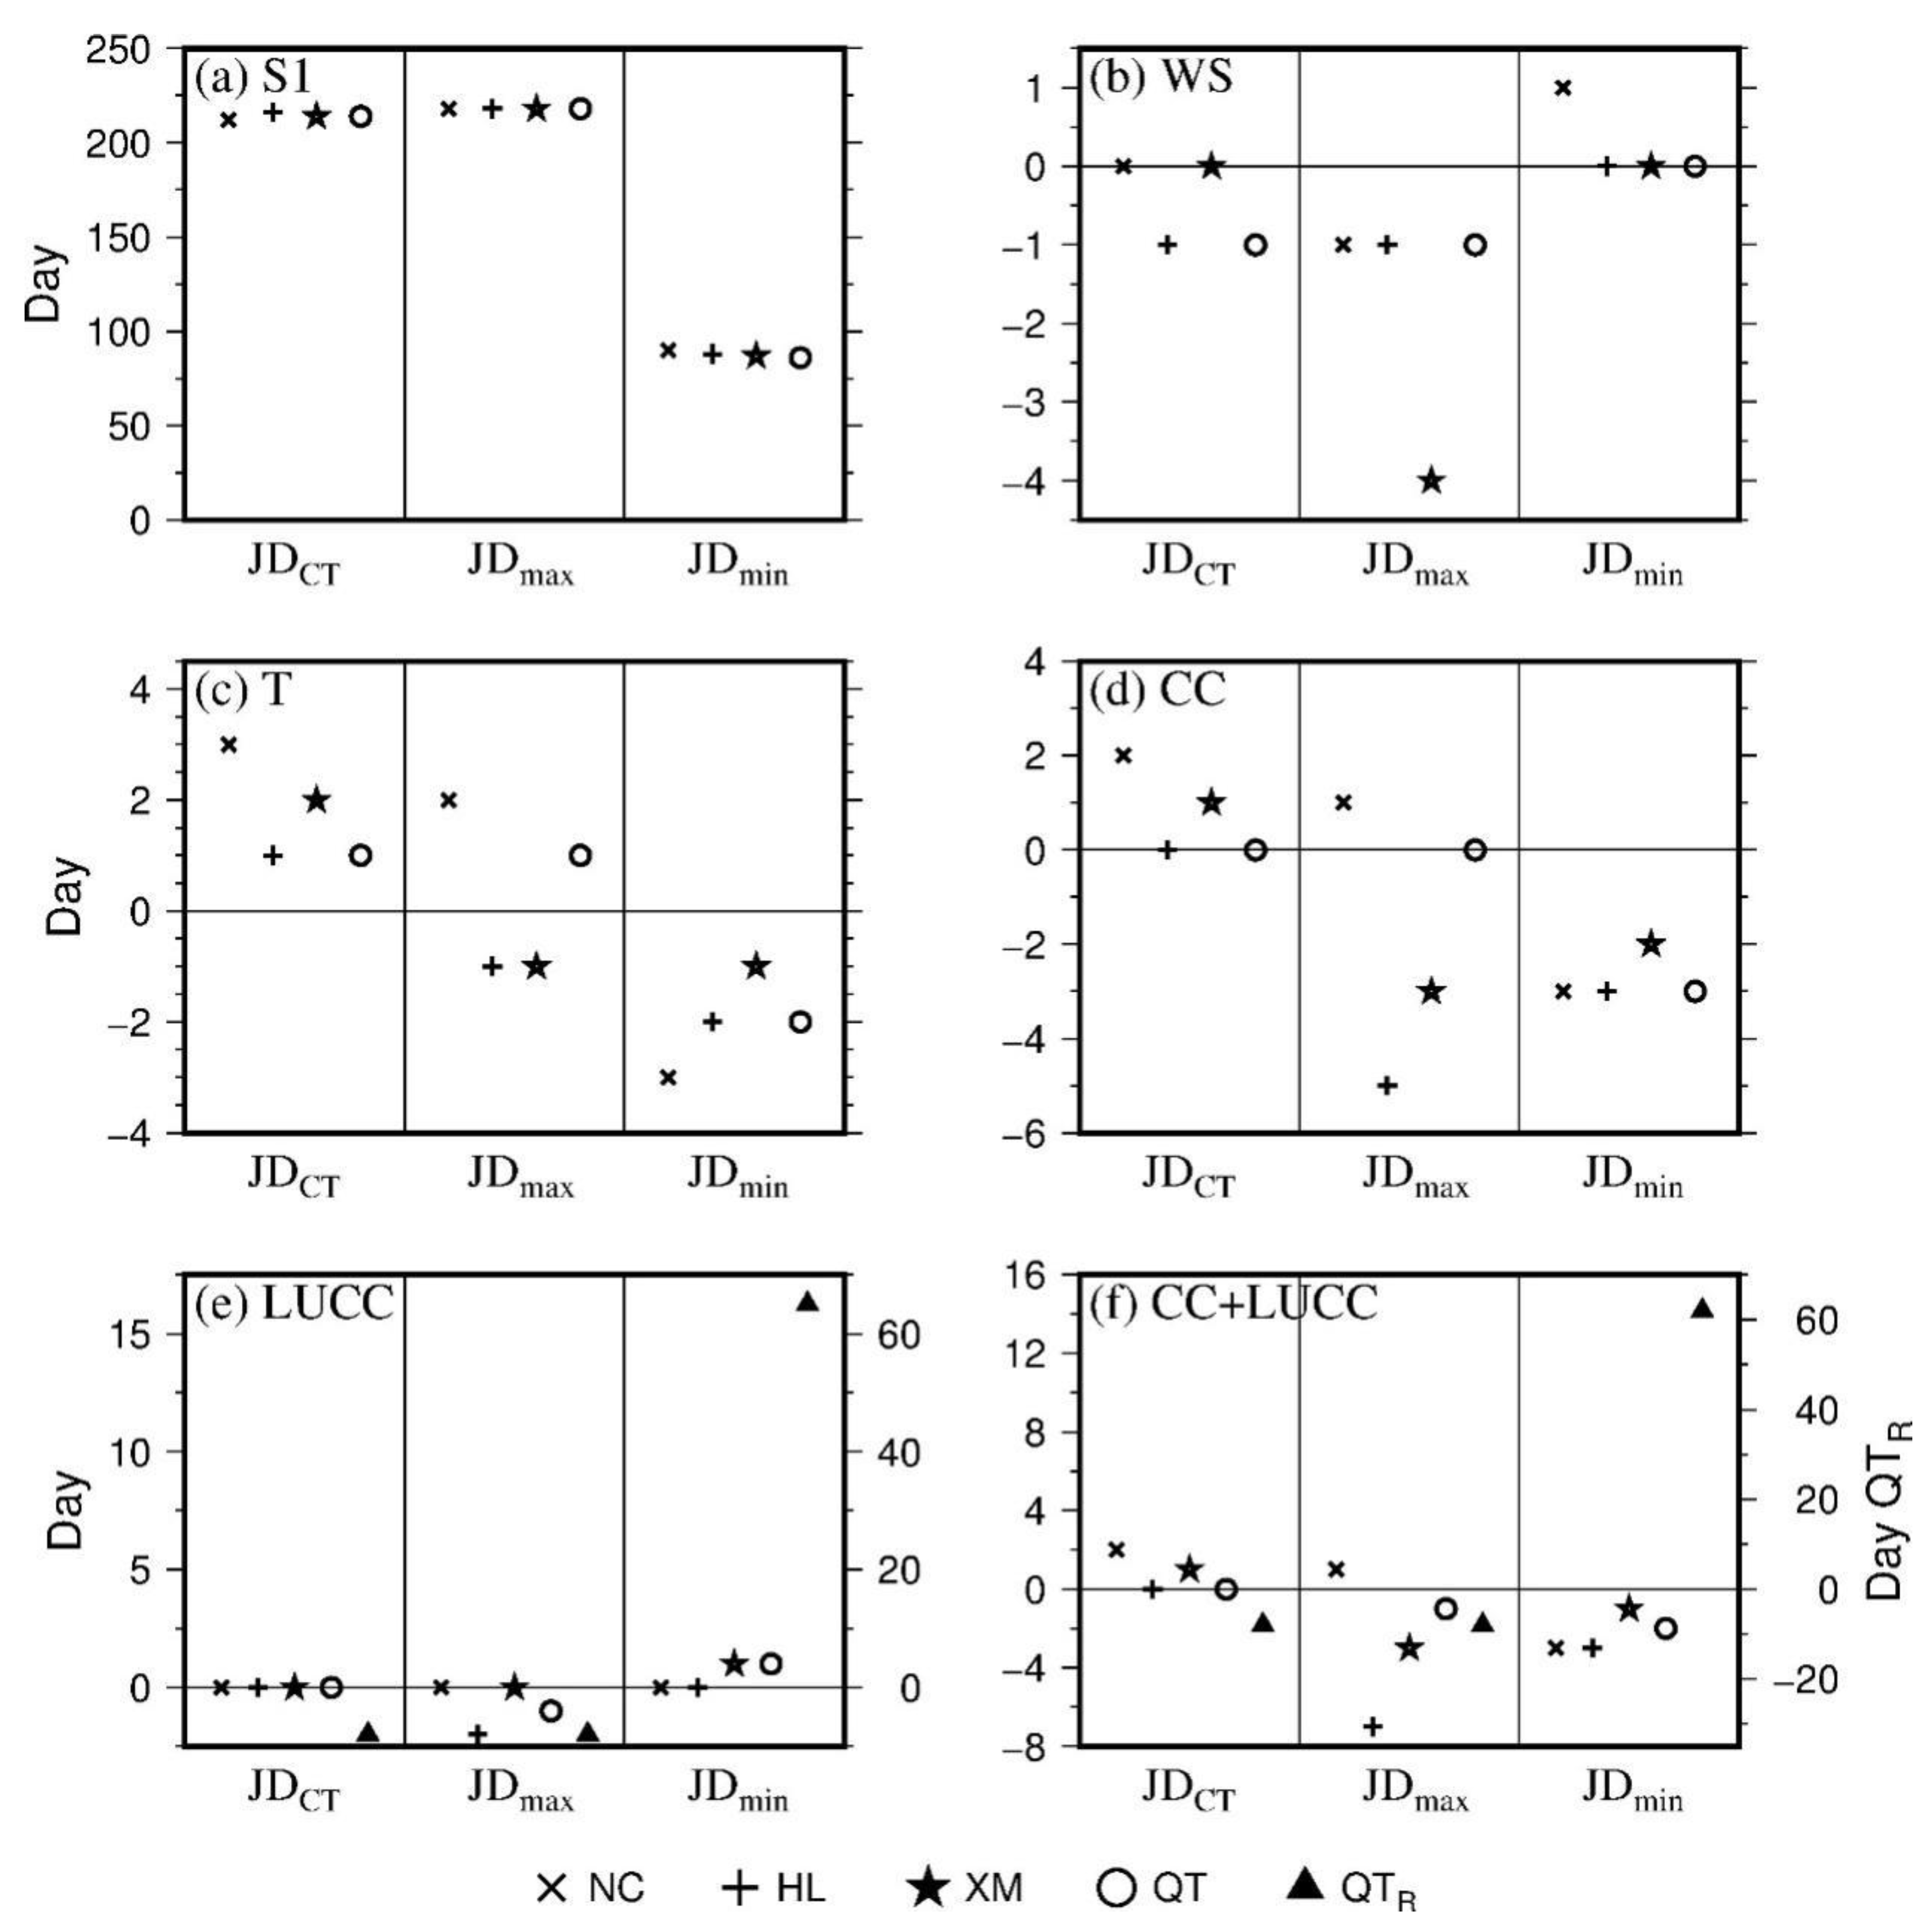
Three timing indices were selected—the occurrences of centroid of annual mean daily streamflow (JDCT) [63], annual maximum peakflow (JDmax), and annual minimum streamflow (JDmin), all represented by Julian day. In baseline scenario, JDCT, JDmax, and JDmin appeared on the 214th, 218th, and 88th days on average for all stations, respectively, during the course of a year on average, which were in early August for JDmax and JDCT and in late March for JDmin (Figure 9a). Figure 9b shows that wind speed had little influence on JDCT, JDmax, and JDmin, with only a 1 day difference for most stations. Temperature rising, on the one hand, postponed JDCT, but advanced JDmin and resulted in mixed change in JDmax (Figure 9c). Figure 9d reveals that JDmin appeared earlier due to CC, similar to temperature increase effect, whereas JDCT and JDmax had various changes at each station. Figure 9e shows that when there was no reservoir, LUCC changed a little in JDCT. Moreover, there were 8 days in advance for JDmax and JDCT after the reservoir operation (solid triangle of QTR in Figure 9e, values on the right y-axis). Additionally, under the reservoir operation, JDmin was delayed for 62 days compared with baseline, which was in late May. On the basis of Figure 9d–f, CC played a leading role in changing timing indices for NC, HL, and XM. However, CC and LUCC showed equal impacts on QT timing indices when there was no reservoir (left y-axis), and LUCC was the dominant factor when reservoir began to operate (right y-axis). Overall, timing indices only changed greatly under reservoir operation, whereas in other situations the changes in timing was within 7 days.
3.3.6. Duration
Three streamflow duration indices encompassing number of days with daily streamflow higher than annual mean streamflow (DAve), higher than high streamflow (DHigh), or lower than low streamflow (DLow) were chosen in this study. At baseline, the average durations were 128–132 days, 51–57 days, and 2–7days for DAve, DHigh, and DLow, respectively (Figure 10a). Compared to baseline, wind speed change only lengthened DAve within 2 days, but exerted no influence on DHigh and DLow (Figure 10b). Temperature change lengthened the duration of DHigh by 1–3 days, but cut down DLow by about 0–4 days, and also exerted mixed influences on DAve at different stations (Figure 10c). Combined CC effect was dominated by temperature change effect (Figure 10d). As for LUCC, it had almost no influence when there was no reservoir (Figure 10e). However, once the reservoir was put into operation, DAve, DHigh, and DLow were all extended, especially DLow, which was prolonged by 15 days. Figure 10f suggests that the combined impacts of CC and LUCC were generally similar to CC impacts when there was no reservoir, and reservoir operation on top of CC and LUCC still had the greatest impacts on the duration.
3.3.7. Deconvolve the Impacts of CC and LUCC
The coefficients of variation in annual streamflow (CVyr) for all scenarios fluctuated slightly around 24% (Table 7). Temperature played a more important role in changing CVyr relative to wind speed. Comparing the impacts of CC and LUCC on CVyr, it is clear that CC impact was dominant at NC and HL in the upstream area, whereas LUCC with or without reservoir was dominant at XM and QT in the downstream area. In general, combined CC and LUCC moderately increased CVyr at NC, XM, and QT, but decreased CVyr at HL.
Table 8 demonstrates the deconvolved effects of multiple impact factors. During the period of 1966–2016, most changes caused by CC and LUCC on annual mean streamflow passed the 0.01 significance test. On the basis of the first two columns of WS and T, it is clear that temperature affected mean annual streamflow more than wind speed, except for QT. In addition, the third column of CC was not the linear addition of temperature and wind speed impacts.
Streamflow at different stations responded differently to CC and LUCC. NC, HL, and XM stations, which are in the upstream and midstream areas, were mostly affected by CC, which accounted for 100%, 81.25%, and 88.89%, respectively (Table 8), indicating that streamflow change at NC was totally controlled by CC because of the protection from national natural reserve. Streamflow at QT, the outlet of the BRB, was decreased by 1.96 m3 s−1 (p < 0.01) due to CC and LUCC, accounting for 10.06% of the mean annual streamflow of S1 at QT. LUCC was the predominant factor, causing 84.51% reduction in mean annual streamflow, whereas CC accounted for only 15.49%. In general, upstream and midstream flow were more controlled by CC, whereas downstream flow was mainly predominated by LUCC.
4. Discussion
Generally, the DHSVM provided good agreement between simulation and observation in the overlapping periods (Table 5 and Figure S3). However, some discrepancies appeared in monthly simulated and observed streamflow at NC and HL (Figure S3). For example, in the line graph, maximum monthly streamflow was in September for the observation but in July for the simulation, and spring streamflow was underestimated. Both of them were caused by inaccurate estimation of cryospheric variables such as snow water equivalent (SWE) and frozen soil, which will be investigated in the future.
Depending on the elevation and location of the intensity of human activity, streamflow regime changes were different in the BRB. Decreased wind speed restrained the annual evapotranspiration by −0.24 mm in the BRB on average, resulting in increases in the means of maximum, monthly, and annual streamflow (Figure 5b and Figure 6b; Table 8), leading to decreases in streamflow variability (Figure 7b and Table 7). Although annual wind speed decreased significantly, monthly wind speed trends in July–September increased slightly (Figure 2b), which resulted in decreased streamflow in July–September, shuffling the timing of the maximum daily flow by usually advancing its occurrence; thus, JDmax appeared earlier (Figure 9b). In the meantime, DAve lengthened consistently in this river basin (Figure 10b), which happened in April–June when great increase in streamflow occurred.
Temperature increase impacts on evaporation could be explained by the following three ways. According to the Clausius–Clapeyron equation, saturation water vapor increases with air temperature, and thus vapor pressure deficit between land surface and air increases. The rate of evaporation is dependent on the amount of heat transferred, and warmer dry air may supply more energy to an evaporating surface. Less energy is required to evaporate warm water than cool water, as latent heat of vaporization (Lv) becomes smaller with higher temperatures, for instance, Lv at 20 °C and 35 °C are 2.44 and 2.40 MJ kg−1, respectively. For the same energy input, more water will be evaporated at the higher temperature. In the BRB, temperature increase intensified the mean annual evapotranspiration by 51.57 mm on average in the BRB, and a similar amount in the upper basins.
Temperature increase also reduced mean daily SWE by 20.86 mm on average in the entire BRB, and by 32.01 mm and 26.47 mm in the upstream basins above NC and HL, respectively, on the basis of the model scheme. Reduction in SWE and increase in evapotranspiration due to temperature increase interrupted the original partition among water balance terms over the simulation period across the BRB, hence changing the streamflow regime indices as shown above. In the upstream (NC and HL) and midstream (XM), snow melt increase was greater than evapotranspiration increase over the year on average, which resulted in greater streamflow magnitude at most monthly and annual time steps (Figure 5c and Figure 6c; Table 8). In the lower elevation, SWE increase could not balance the evaporation increase, leading to decreased maximum and annual flow in lower stream (Figure 6c and Table 8). With temperature increase, starting date of snow melt was brought forward, making lower JDmin, whereas JDCT was postponed due to the delaying of starting freeze date, resulting in greater streamflow in September and October (Figure 9c).
For CC impacts, streamflow regime variables, such as magnitude (annual, monthly, and extreme streamflow), variability (annual, extreme flow), timing (minimum flow), and duration were more influenced by temperature than by wind speed at most stations. Notwithstanding, effects of wind speed change on mean annual and monthly streamflow, Qmax, CVmax, and CVyr increased from upstream to downstream, which indicated significant spatially accumulative effects that wind speed change exerted on streamflow. By contrast, temperature change had completely opposite impacts on some streamflow regime indices, especially for annual streamflow and CVmax, which indicated that temperature is more important at high elevation. The accumulative effects resulted in greater wind speed influence than temperature effect on mean annual streamflow and CVmax at the downstream QT (Table 8 and Figure 7b). It is thus inferred that accumulative effects of wind speed change on streamflow may be more severe in large river basins, requiring more studies to evaluate this phenomenon, as such studies are lacking. The analysis also showed that combined climate change impacts were not the linear addition of temperature and wind speed impacts (Table 7 and Table 8).
Since the 1960s and 2001, the downstream BRB has experienced cropland expansion and Heiquan reservoir operation, respectively. The former increased evapotranspiration by 15.29 mm in the BRB, and thus led to the reduction of the flow magnitude (Figure 5e and Figure 6e; Table 8) and peakflow (Figure 8), which resulted in lower means in maximum and annual flow and increased their variability (Figure 7e and Table 7). Reservoir operation caused re-distribution of monthly streamflow, decreasing maximum streamflow and its variability during the flooding season (Figure 5e and Figure 6e), but increasing them for minimum streamflow (Figure 6e and Figure 7e). This change narrowed the gap between maximum and minimum flow throughout the year, making intra-annual streamflow pattern flatter and prolonging durations (Figure 10e). The operation could also make JDmin occur on any day in a year, not only in March, which could postpone JDmin considerably. On the other hand, with the noteworthy increase of streamflow in January–April after reservoir operation, JDCT appeared earlier (Figure 9e). At QT mean, annual streamflow declined by 6.78% due to LUCC without considering reservoir operation. The Heiquan reservoir also caused it to fall by 5.54% (12.32% minus 6.78%; Table 8). It seems that the effects of cropland expansion on mean annual streamflow were slightly larger than that of reservoir regulation. However, Figure 5f shows that reservoir regulation played a stronger role in intra-annual streamflow re-distribution.
As there was no streamflow observation right below the reservoir after 2001 when the reservoir started operation and reservoir information was recorded, the reservoir effects cannot be accounted for in this study. When examining LUCC (including the reservoir) impacts on river flow, we used a simplified approach, as mentioned above. Reservoir regulation rules, reservoir storage, and open water evaporation were not considered, as they would introduce errors and bring uncertainty into the results. In a future study, we plan to incorporate a reservoir module by considering reservoir storage and regulations with the DHSVM to further investigate reservoir impacts on streamflow in detail.
Model uncertainties result from input data, model structure, and parameter values. In this study, we only examined parameter-related uncertainty. As we have relatively high confidence in our model input data, including soil and vegetation types and climate forcing, the uncertainty from input data was not analyzed. As for model structure uncertainty, it was beyond the scope of the current study, but certainly can be examined in the future by using an ensemble of hydrological models.
5. Conclusions
The BRB experienced prominent upward trends in temperature and downward trends in wind speed at p < 0.01 from 1966 to 2016, with abrupt changes appearing in the 1980s, whereas annual precipitation and streamflow exhibited non-significant trends.
In general, the impacts of temperature change dominated over those of wind speed change, especially at high elevation, but accumulative effects of wind speed change on streamflow should not be ignored. As for magnitude, CC enhanced annual and maximum flow in the upstream and midstream areas but reduced those in the downstream area, and also increased minimum flow at all stations. For variability, annual and minimum flow showed upward trends, wheras maximum flow decreased. The frequency of peakflow under CC was changed little. For timing, CC brought the early occurrence of daily minimum streamflow. The duration of maximum streamflow was always extended.
Since the 1960s, cropland expansion, interconversion between grassland and other land cover types, and the Heiquan reservoir operation were the major characteristics of BRB LUCC. Reservoir regulation was the predominant factor altering the streamflow regime in the downstream area. It significantly increased the streamflow variability and extended the duration of all indices while decreasing the maximum flow and flood frequency. Additionally, there was earlier timing for maximum and temporal centroid streamflow, but later timing for minimum streamflow. Cropland expansion and reservoir regulation were the two major land cover type changes, with the former exerting greater impacts on annual streamflow, and the later primarily affecting intra-annual streamflow distribution.
Spatially, upstream and midstream flow in high elevation were more sensitive to CC, whereas downstream flow in low elevation was mainly predominated by LUCC.
The results of this study expand our understanding of the wind speed change impacts on hydrological processes, and also provide evidence to support mitigation schemes to better manage the water resources synergistically in this river basin.
Supplementary Materials
The following are available online at https://www.mdpi.com/2073-4441/12/4/1198/s1, Figure S1: Conceptual representation (a) and flow chart (b) of the DHSVM. Figure S2: Change point detection of annual data. Mann–Kendall test on annual temperature at DT (T, (a)), moving t-test technique applied to annual temperature at DT (T, (b)), Mann–Kendall test on annual wind speed at DT (WS, (c)). Figure S3: Means and trends of monthly streamflow for simulation and observation at NC (2002–2016) and HL (1981–2016). Figure S4: Minimum and maximum temperature, wind speed for historical period 1966–2016, and climate 1966 for Datong station. Table S1: Transition matrix of land use in the Beichuan River Basin from 1980 to 2000 (km2). Table S2: Transition matrix of land use in the Beichuan River Basin from 2000 to 2015 (km2).
Author Contributions
Methodology, Z.L. and L.C.; software, Z.L., L.C., and L.L.; validation, Z.L.; formal analysis, Z.L. and L.C.; data curation, Q.L., X.L., and X.M.; writing—original draft preparation, Z.L.; writing—review and editing, L.C.; visualization, Z.L.; supervision, L.C. and J.D. All authors have read and agreed to the published version of the manuscript.
Funding
This work was supported by the National Natural Science Foundation (grant 41571067), and partially supported by a grant (XDA20060202) from the Chinese Academy of Sciences and National Natural Science Foundation (grant 91747201).
Acknowledgments
We thank two anonymous reviewers for their constructive comments and suggestions that helped us to improve the original manuscript substantially.
Conflicts of Interest
The authors declare no conflict of interest.
References
- Arthington, A.H.; Naiman, R.J.; McClain, M.E.; Nilsson, C. Preserving the biodiversity and ecological services of rivers: New challenges and research opportunities. Freshw. Biol. 2010, 55, 1–16. [Google Scholar] [CrossRef] [Green Version]
- Patterson, L.A.; Lutz, B.; Doyle, M.W. Climate and direct human contributions to changes in mean annual streamflow in the South Atlantic, USA. Water Resour. Res. 2013, 49, 7278–7291. [Google Scholar] [CrossRef]
- Gleick, P.H. Regional hydrologic consequences of increases in atmospheric CO2 and other trace gases. Clim. Chang. 1987, 10, 137–160. [Google Scholar] [CrossRef]
- Milly, P.C.D.; Betancourt, J.; Falkenmark, M.; Hirsch, R.M.; Zbigniew, W.; Lettenmaier, D.P.; Stouffer, R.J. Climate change—stationarity is dead: Whither water management? Science 2008, 319, 573–574. [Google Scholar] [CrossRef] [PubMed]
- Wang, S.; Kang, S.; Zhang, L.; Li, F. Modelling hydrological response to different land-use and climate change scenarios in the Zamu River basin of northwest China. Hydrol. Process. 2008, 22, 2502–2510. [Google Scholar] [CrossRef]
- Chawla, I.; Mujumdar, P.P. Isolating the impacts of land use and climate change on streamflow. Hydrol. Earth Syst. Sci. 2015, 12, 2201–2242. [Google Scholar] [CrossRef]
- Cuo, L. Land Use/Cover Change Impacts on Hydrology in Large River Basins, 1st ed.; Tang, Q., Taikan, O., Eds.; John Wiley & Sons, Inc: Hoboken, NJ, USA, 2016. [Google Scholar]
- Milly, P.C.; Dunne, K.A.; Vecchia, A.V. Global pattern of trends in streamflow and water availability in a changing climate. Nature 2005, 438, 347–350. [Google Scholar] [CrossRef] [PubMed]
- Piao, S.; Ciais, P.; Huang, Y.; Shen, Z.; Peng, S.; Li, J.; Zhou, L.; Liu, H.; Ma, Y.; Ding, Y.; et al. The impacts of climate change on water resources and agriculture in China. Nature 2010, 467, 43. [Google Scholar] [CrossRef] [PubMed]
- Cuo, L.; Lettenmaier, D.P.; Alberti, M.; Richey, J.E. Effects of a century of land cover and climate change on the hydrology of the Puget Sound basin. Hydrol. Process. 2009, 23, 907–933. [Google Scholar] [CrossRef]
- Islam, S.A.; Bari, M.A.; Anwar, A.H.M.F. Hydrologic impact of climate change on Murray–Hotham catchment of Western Australia: A projection of rainfall–runoff for future water resources planning. Hydrol. Earth Syst. Sci. 2014, 18, 3591–3614. [Google Scholar] [CrossRef] [Green Version]
- Jiang, C.; Wang, F. Temporal changes of streamflow and its causes in the Liao River Basin over the period of 1953–2011, northeastern China. Catena 2016, 145, 227–238. [Google Scholar] [CrossRef]
- Rogger, M.; Agnoletti, M.; Alaoui, A.; Bathurst, J.C.; Bodner, G.; Borga, M.; Chaplot, V.; Gallart, F.; Glatzel, G.; Hall, J.; et al. Land use change impacts on floods at the catchment scale: Challenges and opportunities for future research. Water Resour. Res. 2017, 53, 5209–5219. [Google Scholar] [CrossRef] [PubMed] [Green Version]
- Shang, X.; Jiang, X.; Jia, R.; Wei, C. Land Use and Climate Change Effects on Surface Runoff Variations in the Upper Heihe River Basin. Water 2019, 11, 344. [Google Scholar] [CrossRef] [Green Version]
- Wang, H.; Chen, L.; Yu, X. Distinguishing human and climate influences on streamflow changes in Luan River basin in China. Catena 2016, 136, 182–188. [Google Scholar] [CrossRef]
- Zhang, X.; Li, P.; Li, D. Spatiotemporal Variations of Precipitation in the Southern Part of the Heihe River Basin (China), 1984–2014. Water 2018, 10, 410. [Google Scholar] [CrossRef] [Green Version]
- Cuo, L.; Zhang, Y.; Gao, Y.; Hao, Z.; Cairang, L. The impacts of climate change and land cover/use transition on the hydrology in the upper Yellow River Basin, China. J. Hydrol. 2013, 502, 37–52. [Google Scholar] [CrossRef]
- Yang, K.; Wu, H.; Qin, J.; Lin, C.; Tang, W.; Chen, Y. Recent climate changes over the Tibetan Plateau and their impacts on energy and water cycle: A review. Glob. Planet Chang. 2014, 112, 79–91. [Google Scholar] [CrossRef]
- Yao, T.; Thompson, L.; Yang, W.; Yu, W.; Gao, Y.; Guo, X.; Yang, X.; Duan, K.; Zhao, H.; Xu, B.; et al. Different glacier status with atmospheric circulations in Tibetan Plateau and surroundings. Nat. Clim. Chang. 2012, 2, 663–667. [Google Scholar] [CrossRef]
- Zhang, L.; Su, F.; Yang, D.; Hao, Z.; Tong, K. Discharge regime and simulation for the upstream of major rivers over Tibetan Plateau. J. Geophys. Res. Atmos. 2013, 118, 8500–8518. [Google Scholar] [CrossRef]
- Bosch, J.M.; Hewlett, J.D. A review of catchment experiments to determine the effect of vegetation changes on water yield and evapotranspiration. J. Hydrol. 1982, 55, 3–23. [Google Scholar] [CrossRef]
- Brown, A.E.; Zhang, L.; Mcmahon, T.A.; Western, A.W.; Vertessy, R.A. A review of paired catchment studies for determining changes in water yield resulting from alterations in vegetation. J. Hydrol. 2005, 310, 28–61. [Google Scholar] [CrossRef]
- Hibbert, A.R. Forest treatment effects on water yield. In International Symposiumon on Forest Hydrology; Pergamon Press: Oxford, UK, 1967. [Google Scholar]
- Tian, F.; Yang, Y.H.; Han, S.M. Using runoff slope-break to determine dominate factors of runoff decline in Hutuo River Basin, North China. Water Sci. Technol. 2009, 60, 2135–2144. [Google Scholar] [CrossRef] [PubMed]
- Xu, X.L.; Scanlon, B.R.; Schilling, K.; Sun, A. Relative importance of climate and land surface changes on hydrologic changes in the US Midwest since the 1930s: Implications for biofuel production. J. Hydrol. 2013, 497, 110–120. [Google Scholar] [CrossRef]
- Ye, X.; Zhang, Q.; Liu, J.; Li, X.; Xu, C.Y. Distinguishing the relative impacts of climate change and human activities on variation of streamflow in the Poyang Lake catchment, China. J. Hydrol. 2013, 494, 83–95. [Google Scholar] [CrossRef]
- Alvarenga, L.A.; de Mello, C.R.; Colombo, A.; Cuartas, L.A.; Bowling, L.C. Assessment of land cover change on the hydrology of a Brazilian headwater watershed using the Distributed Hydrology-Soil-Vegetation Model. Catena 2016, 143, 7–17. [Google Scholar] [CrossRef]
- Yan, B.; Fang, N.F.; Zhang, P.C.; Shi, Z.H. Impacts of land use change on watershed streamflow and sediment yield: An assessment using hydrologic modelling and partial least squares regression. J. Hydrol. 2013, 484, 26–37. [Google Scholar] [CrossRef]
- Wang, X.; He, K.; Dong, Z. Effects of climate change and human activities on runoff in the Beichuan River Basin in the northeastern Tibetan Plateau, China. Catena 2019, 176, 81–93. [Google Scholar] [CrossRef]
- Jones, R.N.; Chiew, F.H.S.; Boughton, W.C.; Zhang, L. Estimating the sensitivity of mean annual runoff to climate change using selected hydrological models. Adv. Water Resour. 2006, 29, 1419–1429. [Google Scholar] [CrossRef] [Green Version]
- Li, L.-J.; Zhang, L.; Wang, H.; Wang, J.; Yang, J.-W.; Jiang, D.-J.; Li, J.-Y.; Qin, D.-Y. Assessing the impact of climate variability and human activities on streamflow from the Wuding River basin in China. Hydrol. Process. 2007, 21, 3485–3491. [Google Scholar] [CrossRef]
- Gao, P.; Li, P.; Zhao, B.; Xu, R.; Zhao, G.; Sun, W.; Mu, X. Use of double mass curves in hydrologic benefit evaluations. Hydrol. Process. 2017, 31, 4639–4646. [Google Scholar] [CrossRef]
- Yilmaz, A.G.; Imteaz, M.A. Impact of climate change on runoff in the upper part of the Euphrates basin. Hydrolog. Sci. J. 2011, 56, 1265–1279. [Google Scholar] [CrossRef]
- McVicar, T.R.; Roderick, M.L.; Donohue, R.J.; Li, L.T.; Van Niel, T.G.; Thomas, A.; Grieser, J.; Jhajharia, D.; Himri, Y.; Mahowald, N.M.; et al. Global review and synthesis of trends in observed terrestrial near-surface wind speeds: Implications for evaporation. J. Hydrol. 2012, 416–417, 182–205. [Google Scholar] [CrossRef]
- Poff, N.L.; Allan, J.D.; Bain, M.B.; Karr, J.R.; Prestegaard, K.L.; Richter, B.D.; Sparks, R.E.; Stromberg, J.C. The Natural Flow Regime. BioScience 1997, 47, 769–784. [Google Scholar] [CrossRef]
- Mu, X.; Zhang, L.; McVicar, T.R.; Chille, B.; Gau, P. Analysis of the impact of conservation measures on stream flow regime in catchments of the Loess Plateau, China. Hydrol. Process. 2007, 21, 2124–2134. [Google Scholar] [CrossRef]
- Zhang, L.; Zhao, F.F.; Brown, A.E. Predicting effects of plantation expansion on streamflow regime for catchments in Australia. Hydrol. Earth Syst. Sci. 2012, 16, 2109–2121. [Google Scholar] [CrossRef] [Green Version]
- Zhao, F.; Xu, Z.; Zhang, L. Changes in streamflow regime following vegetation changes from paired catchments. Hydrol. Process. 2012, 26, 1561–1573. [Google Scholar] [CrossRef]
- Zhang, C.; Shen, Y.; Liu, F.; Meng, L. Changes in reference evapotranspiration over an agricultural region in the Qinghai-Tibetan plateau, China. Theor. Appl. Climatol. 2014, 123, 1–9. [Google Scholar] [CrossRef]
- Wigmosta, M.S.; Nijssen, B.; Storck, P.; Singh, V.P.; Frevert, D.K. The Distributed Hydrology Soil Vegetation Model. Math. Models Small Watershed Hydrol. Appl. 2002, 22, 4205–4213. [Google Scholar]
- Wigmosta, M.S.; Vail, L.W.; Lettenmaier, D.P. A Distributed Hydrology-Vegetation Model for Complex Terrain. Water Resour. Res. 1994, 30, 1665–1679. [Google Scholar] [CrossRef]
- Beckers, J.; Smerdon, B.; Wilson, M. Review of Hydrologic Models for Forest Management and Climate Change Applications in British Columbia and Alberta; Forrex Forum for Research and Extension in Natural Resources No 25: Kamloops, BC, Canada, 2009. [Google Scholar]
- Cuo, L.; Giambelluca, T.W.; Ziegler, A.D.; Nullet, M.A. Use of the distributed hydrology soil vegetation model to study road effects on hydrological processes in Pang Khum Experimental Watershed, northern Thailand. For. Ecol. Manag. 2006, 224, 81–94. [Google Scholar] [CrossRef]
- Cuo, L.; Lettenmaier, D.P.; Mattheussen, B.V.; Storck, P.; Wiley, M. Hydrologic prediction for urban watersheds with the Distributed Hydrology–Soil–Vegetation Model. Hydrol. Process. 2008, 22, 4205–4213. [Google Scholar] [CrossRef]
- Thanapakpawin, P.; Richey, J.; Thomas, D.; Rodda, S.; Campbell, B.; Logsdon, M. Effects of landuse change on the hydrologic regime of the Mae Chaem river basin, NW Thailand. J. Hydrol. 2007, 334, 215–230. [Google Scholar] [CrossRef]
- Cuo, L.; Giambelluca, T.W.; Ziegler, A.D. Lumped parameter sensitivity analysis of a distributed hydrological model within tropical and temperate catchments. Hydrol. Process. 2011, 25, 2405–2421. [Google Scholar] [CrossRef]
- Sun, N.; Wigmosta, M.; Zhou, T.; Lundquist, J.; Dickerson-Lange, S.; Cristea, N. Evaluating the functionality and streamflow impacts of explicitly modelling forest–snow interactions and canopy gaps in a distributed hydrologic model. Hydrol. Process. 2018, 32, 2128–2140. [Google Scholar] [CrossRef]
- Elsner, M.M.; Cuo, L.; Voisin, N.; Deems, J.S.; Hamlet, A.F.; Vano, J.A.; Mickelson, K.E.B.; Lee, S.-Y.; Lettenmaier, D.P. Implications of 21st century climate change for the hydrology of Washington State. Clim. Chang. 2010, 102, 225–260. [Google Scholar] [CrossRef] [Green Version]
- Burges, S.J.; Wigmosta, M.S.; Meena, J.M. Hydrological effects of land-use change in a zero-order catchment. J. Hydrol. Eng. 1998, 3, 86–97. [Google Scholar] [CrossRef]
- Sun, N.; Yersley, J.; Voisin, N.; Lettenmaier, D.P. A spatially distributed model for the assessment of land use impacts on stream temperature in small urban watersheds. Hydrol. Process. 2015, 29, 2331–2345. [Google Scholar] [CrossRef]
- Sun, N.; Yearsley, J.; Baptiste, M.; Cao, Q.; Lettenmaier, D.P.; Nijssen, B. A spatially distributed model for assessment of the effects of changing land use and climate on urban stream quality. Hydrol. Process. 2016, 30, 4779–4798. [Google Scholar] [CrossRef]
- Doten, C.O.; Bowling, L.C.; Lanini, J.S.; Maurer, E.P.; Lettenmaier, D.P. A spatially distributed model for the dynamic prediction of sediment erosion and transport in mountainous forested watersheds. Water Resour. Res. 2006, 42, W04417. [Google Scholar] [CrossRef]
- Moriasi, D.N.; Arnold, J.G.; Van Liew, M.W.; Bingner, R.L.; Harmel, R.D.; Veith, T.L. Model evaluation guidelines for systematic quantification of accuracy in watershed simulations. Trans. ASABE 2007, 50, 885–900. [Google Scholar] [CrossRef]
- Servat, E.; Dezetter, A. Selection of calibration objective functions in the context of rainfall—runoff modelling in a Sudanese savannah area. Hydrolog. Sci. J. 1991, 36, 307–330. [Google Scholar] [CrossRef]
- Nijssen, B.; Schnur, R.; Lettenmaier, D.P. Global Retrospective Estimation of Soil Moisture Using the Variable Infiltration Capacity Land Surface Model, 1980–1993. J. Clim. 1999, 14, 1790–1808. [Google Scholar] [CrossRef]
- Kimball, J.S.; Running, S.W.; Nemani, R. An improved method for estimating surface humidity from daily minimum temperature. Agric. For. Meteorol. 1997, 85, 87–98. [Google Scholar] [CrossRef]
- Thornton, P.E.; Running, S.W.J.A.; Meteorology, F. An improved algorithm for estimating incident daily solar radiation from measurements of temperature, humidity, and precipitation. Agric. For. Meteorol. 1999, 93, 211–228. [Google Scholar] [CrossRef]
- Chen, Y.; Takeuchi, K.; Xu, C.; Chen, Y.; Xu, Z. Regional climate change and its effects on river runoff in the Tarim Basin, China. Hydrol. Process. 2006, 20, 2207–2216. [Google Scholar] [CrossRef]
- Kendall, M.G. Rank Correlation Methods; Charles Griffin: London, UK, 1955. [Google Scholar]
- Mann, H. Nonparametric Tests Against Trend. Econometrica 1945, 13, 245–259. [Google Scholar] [CrossRef]
- Li, Y.; Chang, J.; Wang, Y.; Jin, W.; Guo, A. Spatiotemporal Impacts of Climate, Land Cover Change and Direct Human Activities on Runoff Variations in the Wei River Basin, China. Water 2016, 8, 220. [Google Scholar] [CrossRef] [Green Version]
- Sanborn, S.C.; Bledsoe, B.P. Predicting streamflow regime metrics for ungauged streamsin Colorado, Washington, and Oregon. J. Hydrol. 2006, 325, 241–261. [Google Scholar] [CrossRef]
- Stewart, I.T.; Cayan, D.R.; Dettinger, M.D. Changes in Snowmelt Runoff Timing in Western North America under a ’Business as Usual’ Climate Change Scenario. Clim. Chang. 2004, 62, 217–232. [Google Scholar] [CrossRef]
Figure 1.
Geographic location and topography of the Beichuan River Basin. NC: Niuchang, XM: Xiamen, HL: Heilin, and QT: Qiaotou hydrological stations; DT: Datong climate station; AWS: automatic weather station; R: Heiquan reservoir. Qinghai Province is outlined in the northeastern plateau in the inset figure.

Figure 2.
Means and trends of monthly hydrometeorological variables at DT, NC, HL, XM, and QT stations. Curve represents mean monthly values (left y-axis), and bar chart displays monthly trends (right y-axis). Star represents significant trends at 0.05 significance level.
Figure 2.
Means and trends of monthly hydrometeorological variables at DT, NC, HL, XM, and QT stations. Curve represents mean monthly values (left y-axis), and bar chart displays monthly trends (right y-axis). Star represents significant trends at 0.05 significance level.

Figure 3.
Spatial distribution of land use/land cover types in 1960 (a), 1980 (b), 2000 (c), and 2015 (d).
Figure 3.
Spatial distribution of land use/land cover types in 1960 (a), 1980 (b), 2000 (c), and 2015 (d).

Figure 4.
Monthly observed and simulated streamflow during calibration and validation periods at XM, HL, and NC hydrological stations. Orange lines represent the range of uncertainty resulted from parameter value uncertainty.
Figure 4.
Monthly observed and simulated streamflow during calibration and validation periods at XM, HL, and NC hydrological stations. Orange lines represent the range of uncertainty resulted from parameter value uncertainty.

Figure 5.
Monthly streamflow of baseline scenario S1 (a) and its change in scenarios of wind speed change (b); temperature change (c); wind speed and temperature change, that is, climate change (d); land use/cover change (e); and both climate change and land use/cover change (f). QTR represents Qiaotou streamflow change caused by land use/cover change, which covered reservoir regulation (the same below for QTR).

Figure 6.
Extreme streamflow indices (left y-axis represents Qmax1 and Qmax3, right y-axis represents Qmin1 and Qmin3) under baseline scenario (a) and the impacts of wind speed change (b), temperature change (c), climate change (d), land use/cover change (e), and both climate change and land use/cover change (f).

Figure 7.
Extreme streamflow variability (CVmax1, CVmax3, CVmin1, CVmin3) under scenario 1 baseline (a) and the impacts of wind speed change (b), temperature change (c), climate change (d), land use/cover change (e), and both climate change and land use/cover change (f).
Figure 7.
Extreme streamflow variability (CVmax1, CVmax3, CVmin1, CVmin3) under scenario 1 baseline (a) and the impacts of wind speed change (b), temperature change (c), climate change (d), land use/cover change (e), and both climate change and land use/cover change (f).

Figure 8.
Non-exceedance probability of annual maximum peakflow for six scenarios at NC (a), HL (b), XM (c), and QT (d).
Figure 8.
Non-exceedance probability of annual maximum peakflow for six scenarios at NC (a), HL (b), XM (c), and QT (d).

Figure 9.
Timings of centroid of streamflow (JDCT), annual maximum (JDmax), and minimum (JDmin) flow in baseline (a), and the impacts of wind speed (b), temperature (c), climate change (d), land use/cover change (e), and both climate change and land use/cover change (f).
Figure 9.
Timings of centroid of streamflow (JDCT), annual maximum (JDmax), and minimum (JDmin) flow in baseline (a), and the impacts of wind speed (b), temperature (c), climate change (d), land use/cover change (e), and both climate change and land use/cover change (f).

Figure 10.
Duration of streamflow higher than annual mean streamflow (DAve), higher than high streamflow (DHigh), or lower than low streamflow (DLow) in baseline scenario S1 (a), and the impacts of wind speed (b), temperature (c), climate change (d), land use/cover change (e), and both climate change and land use/cover change (f).


Table 1.
Mean annual, annual trend, and variability of air temperature (T), wind speed (WS), precipitation (P), and streamflow (Q) calculated from daily time series observed at Niuchang (NC), Heilin (HL), Xiamen (XM), Qiaotou (QT), and Datong (DT) in the Beichuan River Basin (BRB).
Table 1.
Mean annual, annual trend, and variability of air temperature (T), wind speed (WS), precipitation (P), and streamflow (Q) calculated from daily time series observed at Niuchang (NC), Heilin (HL), Xiamen (XM), Qiaotou (QT), and Datong (DT) in the Beichuan River Basin (BRB).
| Stations | NC | HL | XM | QT | DT | |
|---|---|---|---|---|---|---|
| Elevation (m) | 3004 | 2756 | 2618 | 2442 | 2459 | |
| Data Periods | 2002–2016 | 1981–2016 | 1966–2000 | 1966–2016 | 1966–2016 | |
| T | Mean (°C) | —— | —— | —— | —— | 4.84 |
| Trend (°C year−1) | —— | —— | —— | —— | 0.080 ** | |
| CVyr (%) | —— | —— | —— | —— | 26.49 | |
| WS | Mean (m s−1) | —— | —— | —— | —— | 1.59 |
| Trend (m s−1 year−1) | —— | —— | —— | —— | −0.008 ** | |
| CVyr (%) | —— | —— | —— | —— | 22.56 | |
| P | Mean (mm) | 581.79 | 600.88 | 526.60 | 525.56 | 525.93 |
| Trend (mm year−1) | 0.857 | −0.888 | −0.701 | 1.068 | 0.879 | |
| CVyr (%) | 11.19 | 13.42 | 14.24 | 14.98 | 13.62 | |
| Q | Mean (m3 s−1) | 7.73 | 2.39 | 11.11 | 17.51 | —— |
| Trend (m3 s−1 year−1) | 0.136 | −0.003 | −0.021 | −0.051 | —— | |
| CVyr (%) | 17.57 | 26.32 | 24.49 | 24.19 | —— | |
Note: (1) CVyr is the coefficient of variation in annual time series. (2) Although the period of NC streamflow was 2002–2016, the period of NC precipitation was 1976–2016. (3) ** represents significant level of 0.01. (4) —— means no data. The same below.
Table 2.
Land use/cover type area (units: km2) and proportion (P; units: %) in the Beichuan River Basin in 1960, 1980, 2000, and 2015.
Table 2.
Land use/cover type area (units: km2) and proportion (P; units: %) in the Beichuan River Basin in 1960, 1980, 2000, and 2015.
| Category | 1960 | 1980 | 2000 | 2015 | ||||
|---|---|---|---|---|---|---|---|---|
| Area | P | Area | P | Area | P | Area | P | |
| Woodland | 117.04 | 4.16 | 117.04 | 4.16 | 113.87 | 4.05 | 115.42 | 4.11 |
| Wooded grassland | 114.82 | 4.08 | 114.82 | 4.08 | 111.17 | 3.95 | 111.31 | 3.96 |
| Closed shrubland | 620.59 | 22.07 | 620.59 | 22.07 | 594.26 | 21.14 | 591.3 | 21.03 |
| Grassland | 1730.56 | 61.55 | 1372.04 | 48.8 | 1417.56 | 50.42 | 1423.98 | 50.65 |
| Cropland | 0 | 0 | 358.52 | 12.75 | 333.15 | 11.85 | 327.22 | 11.64 |
| Bare ground | 198.85 | 7.07 | 198.85 | 7.07 | 196.01 | 6.97 | 189.42 | 6.74 |
| Urban and built | 26.44 | 0.94 | 26.44 | 0.94 | 41.65 | 1.48 | 44.83 | 1.59 |
| Water | 3.29 | 0.12 | 3.29 | 0.12 | 3.92 | 0.14 | 8.11 | 0.29 |
| Total | 2811.59 | 100 | 2811.59 | 100 | 2811.59 | 100 | 2811.59 | 100 |
Table 3.
Statistics of Distributed Hydrology Soil Vegetation Model (DHSVM) calibration and validation.
Table 3.
Statistics of Distributed Hydrology Soil Vegetation Model (DHSVM) calibration and validation.
| Stations | Calibration | Validation | |||
|---|---|---|---|---|---|
| XM | HL | XM | NC | ||
| Year | 1971–1980 | 1981–1988 | 1991–2000 | 2002–2016 | |
| Nash–Sutcliffe | Daily | 0.56 | 0.54 | 0.59 | 0.65 |
| Monthly | 0.76 | 0.66 | 0.74 | 0.80 | |
| RSR | Daily | 0.66 | 0.68 | 0.64 | 0.59 |
| Monthly | 0.49 | 0.59 | 0.51 | 0.45 | |
| Relative error (%) | −7.65 | −19.81 | 5.10 | −8.21 | |
| Annual simulated Q (m3 s−1) | 9.28 | 2.06 | 10.82 | 7.10 | |
| Annual observed Q (m3 s−1) | 10.05 | 2.57 | 10.30 | 7.73 | |
Note: RSR represents the ratio of root mean square error and standard deviation of the observation.
Table 4.
Statistics of daily peak flows and low flows selected from top 10 maximum flow and bottom 10 minimum flow in each year during calibration and validation.
Table 4.
Statistics of daily peak flows and low flows selected from top 10 maximum flow and bottom 10 minimum flow in each year during calibration and validation.
| Flows | Q (m3 s−1) | Standard Deviation (m3 s−1) | Relative Error (%) | |
|---|---|---|---|---|
| Calibr_XM | Sim. Qmax | 41.93 | 13.46 | −6.75 |
| Obs. Qmax | 44.97 | 12.36 | ||
| Sim. Qmin | 1.75 | 0.12 | 48.64 | |
| Obs. Qmin | 1.18 | 0.49 | ||
| Validt_HL | Sim. Qmax | 8.88 | 3.11 | 19.05 |
| Obs. Qmax | 7.46 | 4.49 | ||
| Sim. Qmin | 0.25 | 0.04 | −67.88 | |
| Obs. Qmin | 0.79 | 0.29 | ||
| Validt_XM | Sim. Qmax | 44.02 | 14.09 | 27.48 |
| Obs. Qmax | 34.53 | 21.99 | ||
| Sim. Qmin | 1.81 | 0.18 | −47.81 | |
| Obs. Qmin | 3.47 | 2.52 | ||
| Validt_NC | Sim. Qmax | 27.06 | 5.92 | 17.05 |
| Obs. Qmax | 23.12 | 10.45 | ||
| Sim. Qmin | 1.48 | 0.10 | −36.62 | |
| Obs. Qmin | 2.34 | 0.74 | ||
Table 5.
Mean annual, variability, and annual trends of streamflow at NC and HL in the overlapping periods of simulation and observation.
Table 5.
Mean annual, variability, and annual trends of streamflow at NC and HL in the overlapping periods of simulation and observation.
| Stations | NC | HL | |||
|---|---|---|---|---|---|
| Year | 2002–2016 | 1981–2016 | |||
| Sim. | Obs. | Sim. | Obs. | ||
| Mean (m3 s−1) | 7.10 | 7.73 | 2.13 | 2.39 | |
| CVyr (%) | 12.84 | 17.57 | 25.76 | 26.32 | |
| Trend (m3 s−1 year−1) | Annual | 0.098 | 0.136 | −0.004 | −0.003 |
| FX1day | 0.310 | 0.483 | −0.008 | −0.119 * | |
| FN1day | 0.002 | 0.042 * | 0.001 | 0.004 ** | |
Note: * and ** represent significant level of 0.05 and 0.01, respectively.
Table 6.
Streamflow regime metrics examined for impact analyses.
| Types | Name | Definitions | Units |
|---|---|---|---|
| Magnitude | Qyr | annual mean streamflow | m3 s−1 |
| Qm1-12 | monthly mean streamflow, Jan-Dec | m3 s−1 | |
| Qmax1 | annual 1-day maximum streamflow | m3 s−1 | |
| Qmax3 | annual consecutive 3-day maximum streamflow | m3 s−1 | |
| Qmin1 | annual 1-day minimum streamflow | m3 s−1 | |
| Qmin3 | annual consecutive 3-day minimum streamflow | m3 s−1 | |
| Frequency | P | non-exceedance probability of annual maximum streamflow | |
| Variability | CVyr | the coefficient of variation in annual average streamflow | % |
| CVmax1 | the coefficient of variation in annual 1-day maximum streamflow | % | |
| CVmin1 | the coefficient of variation in annual 1-day minimum streamflow | % | |
| CVmax3 | the coefficient of variation in annual 3-day maximum streamflow | % | |
| CVmin3 | the coefficient of variation in annual 3-day minimum streamflow | % | |
| Timing | JDmax | Julian day of annual maximum streamflow occurrence | - |
| JDmin | Julian day of annual minimum streamflow occurrence | - | |
| JDCT | Julian day of annual temporal centroid of streamflow occurrence | - | |
| Duration | DAve | number of days with daily streamflow higher than annual mean streamflow | days |
| DHigh | number of days with daily streamflow higher than high streamflow, high streamflow = annual mean streamflow + 1 standard deviation | days | |
| DLow | number of days with daily streamflow lower than low streamflow, low streamflow = annual mean streamflow – 1 standard deviation | days |
Table 7.
The coefficient of variation in annual average streamflow (CVyr) of S1 and the impacts of wind speed, temperature, climate change, land use/cover change, and both climate change and land use/cover change on CVs at four stations.
Table 7.
The coefficient of variation in annual average streamflow (CVyr) of S1 and the impacts of wind speed, temperature, climate change, land use/cover change, and both climate change and land use/cover change on CVs at four stations.
| CVyr (%) | NC | HL | XM | QT | |
|---|---|---|---|---|---|
| S1 | 23.11 | 25.91 | 23.12 | 23.02 | |
| CC | WS | −0.08 | −0.07 | −0.15 | −0.24 |
| T | 0.18 | 0.23 | 0.34 | 1.03 | |
| CC | 0.24 | −0.47 | 0.01 | 0.46 | |
| LUCC | 0.02 | 0.23 | 0.24 | 1.29 (0.71) | |
| CC + LUCC | 0.26 | −0.24 | 0.25 | 1.75 (1.17) | |
Note: For the last two rows of land use/cover change (LUCC) and climate change (CC) + LUCC at QT, inside and outside brackets represent impacts of land use/cover change with and without reservoir, respectively.
Table 8.
Total and deconvolved impacts of temperature, wind speed, climate change, and land use/cover change on mean annual streamflow with reference to S1.
Table 8.
Total and deconvolved impacts of temperature, wind speed, climate change, and land use/cover change on mean annual streamflow with reference to S1.
| Impact Factors | CC | LUCC | CC + LUCC | |||
|---|---|---|---|---|---|---|
| WS | T | CC | ||||
| NC | AC (m3 s−1) | 0.06 * | 0.78 * | 0.89 * | 0 | 0.89 * |
| RC (%) | 1.01* | 13.18 * | 15.03 * | 0 | 15.03 * | |
| P (%) | —— | —— | 100 | 0 | 100 | |
| HL | AC (m3 s−1) | 0.03 * | 0.08 * | 0.13 * | −0.03 * | 0.1* |
| RC (%) | 1.52 * | 4.04 * | 6.57 * | −1.52 * | 5.05 * | |
| P (%) | —— | —— | 81.25 | 18.75 | 100 | |
| XM | AC (m3 s−1) | 0.13 * | 0.8 * | 1.04 * | −0.13 * | 0.91 * |
| RC (%) | 1.34 * | 8.26 * | 10.74 * | −1.34 * | 9.40 * | |
| P (%) | —— | —— | 88.89 | 11.11 | 100 | |
| QT | AC (m3 s−1) | 0.35 * | −0.03 | 0.44 * | −1.32 * (−2.40 *) | −0.88 * (−1.96 *) |
| RC (%) | 1.80 * | −0.15 | 2.26 * | −6.78 * (−12.32*) | −4.52 * (−10.06 *) | |
| P (%) | —— | —— | 25 (15.49) | 75 (84.51) | 100 (100) | |
Note: (1) AC is absolute change; RC is relative change; P is percentage impacts of CC and LUCC. (2) For the last three rows at QT, numbers inside and outside brackets represent impacts of land use/cover change with and without reservoir, respectively. (3) * represents significant level of 0.01 using a paired sample t-test.
© 2020 by the authors. Licensee MDPI, Basel, Switzerland. This article is an open access article distributed under the terms and conditions of the Creative Commons Attribution (CC BY) license (http://creativecommons.org/licenses/by/4.0/).
Share and Cite
MDPI and ACS Style
Liu, Z.; Cuo, L.; Li, Q.; Liu, X.; Ma, X.; Liang, L.; Ding, J. Impacts of Climate Change and Land Use/Cover Change on Streamflow in Beichuan River Basin in Qinghai Province, China. Water 2020, 12, 1198. https://doi.org/10.3390/w12041198
AMA Style
Liu Z, Cuo L, Li Q, Liu X, Ma X, Liang L, Ding J. Impacts of Climate Change and Land Use/Cover Change on Streamflow in Beichuan River Basin in Qinghai Province, China. Water. 2020; 12(4):1198. https://doi.org/10.3390/w12041198
Chicago/Turabian StyleLiu, Zhe, Lan Cuo, Qijiang Li, Xisheng Liu, Xuelian Ma, Liqiao Liang, and Jin Ding. 2020. "Impacts of Climate Change and Land Use/Cover Change on Streamflow in Beichuan River Basin in Qinghai Province, China" Water 12, no. 4: 1198. https://doi.org/10.3390/w12041198
Note that from the first issue of 2016, this journal uses article numbers instead of page numbers. See further details here.