The Evolution and Sources of Major Ions in Hot Springs in the Triassic Carbonates of Chongqing, China

1
School of Water Resources and Environment, China University of Geosciences (Beijing), Xueyuan Road 29, Beijing 100083, China
2
MOE Key Laboratory of Groundwater Circulation and Environmental Evolution, China University of Geosciences (Beijing), Xueyuan Road 29, Beijing 100083, China
*
Author to whom correspondence should be addressed.
Water 2020, 12(4), 1194; https://doi.org/10.3390/w12041194
Submission received: 15 March 2020
/
Revised: 18 April 2020
/
Accepted: 18 April 2020
/
Published: 22 April 2020
(This article belongs to the Special Issue Geochemistry of Groundwater)
Abstract
:Thermal groundwater in the Lower and Middle Triassic carbonates in Chongqing, China, is mainly concentrated in anticlines. Hot springs (32.9 to 57 °C) with SO4-Ca type waters and Total Dissolved Solids (TDS) of 1620 to 2929 mg/L emerge in the middle and the plunging ends of the structures. Multivariate methods are used to analyze the hydrochemical characteristics of the waters, and identify the sources of the main dissolved components, providing an insight into the evolution of the environment in which they formed. Hierarchical cluster analysis of compositional data differentiates samples in the study area into three categories: high TDS-high Ca2+ and SO42− water; medium TDS-high Na+ and Cl− water; and low TDS-high HCO3− water. Factor analysis and ion ratio relationships show that Ca2+ and SO42− are mainly derived from the dissolution of gypsum and anhydrite within the geothermal reservoir, with some addition of SO42− from coal-bearing cap rocks. The main source of HCO3−, is in the dissolution of dolomite and CO2 that also promotes the incongruent dissolution of albite and K-feldspar, adding Na+ and K+ to the groundwater. Reverse modelling of the transfers of each phase shows, in three models, that the minerals dissolved decrease progressively—with the exception of halite and albite. Combined with the hydrochemical characteristics of hot water in the same reservoir in the adjacent area (Cl-Na type, TDS of 13.37 g/L), a process of desalination of the hot water can be confirmed, which has not yet reached the ‘freshwater’ stage dominated by HCO3−.
1. Introduction
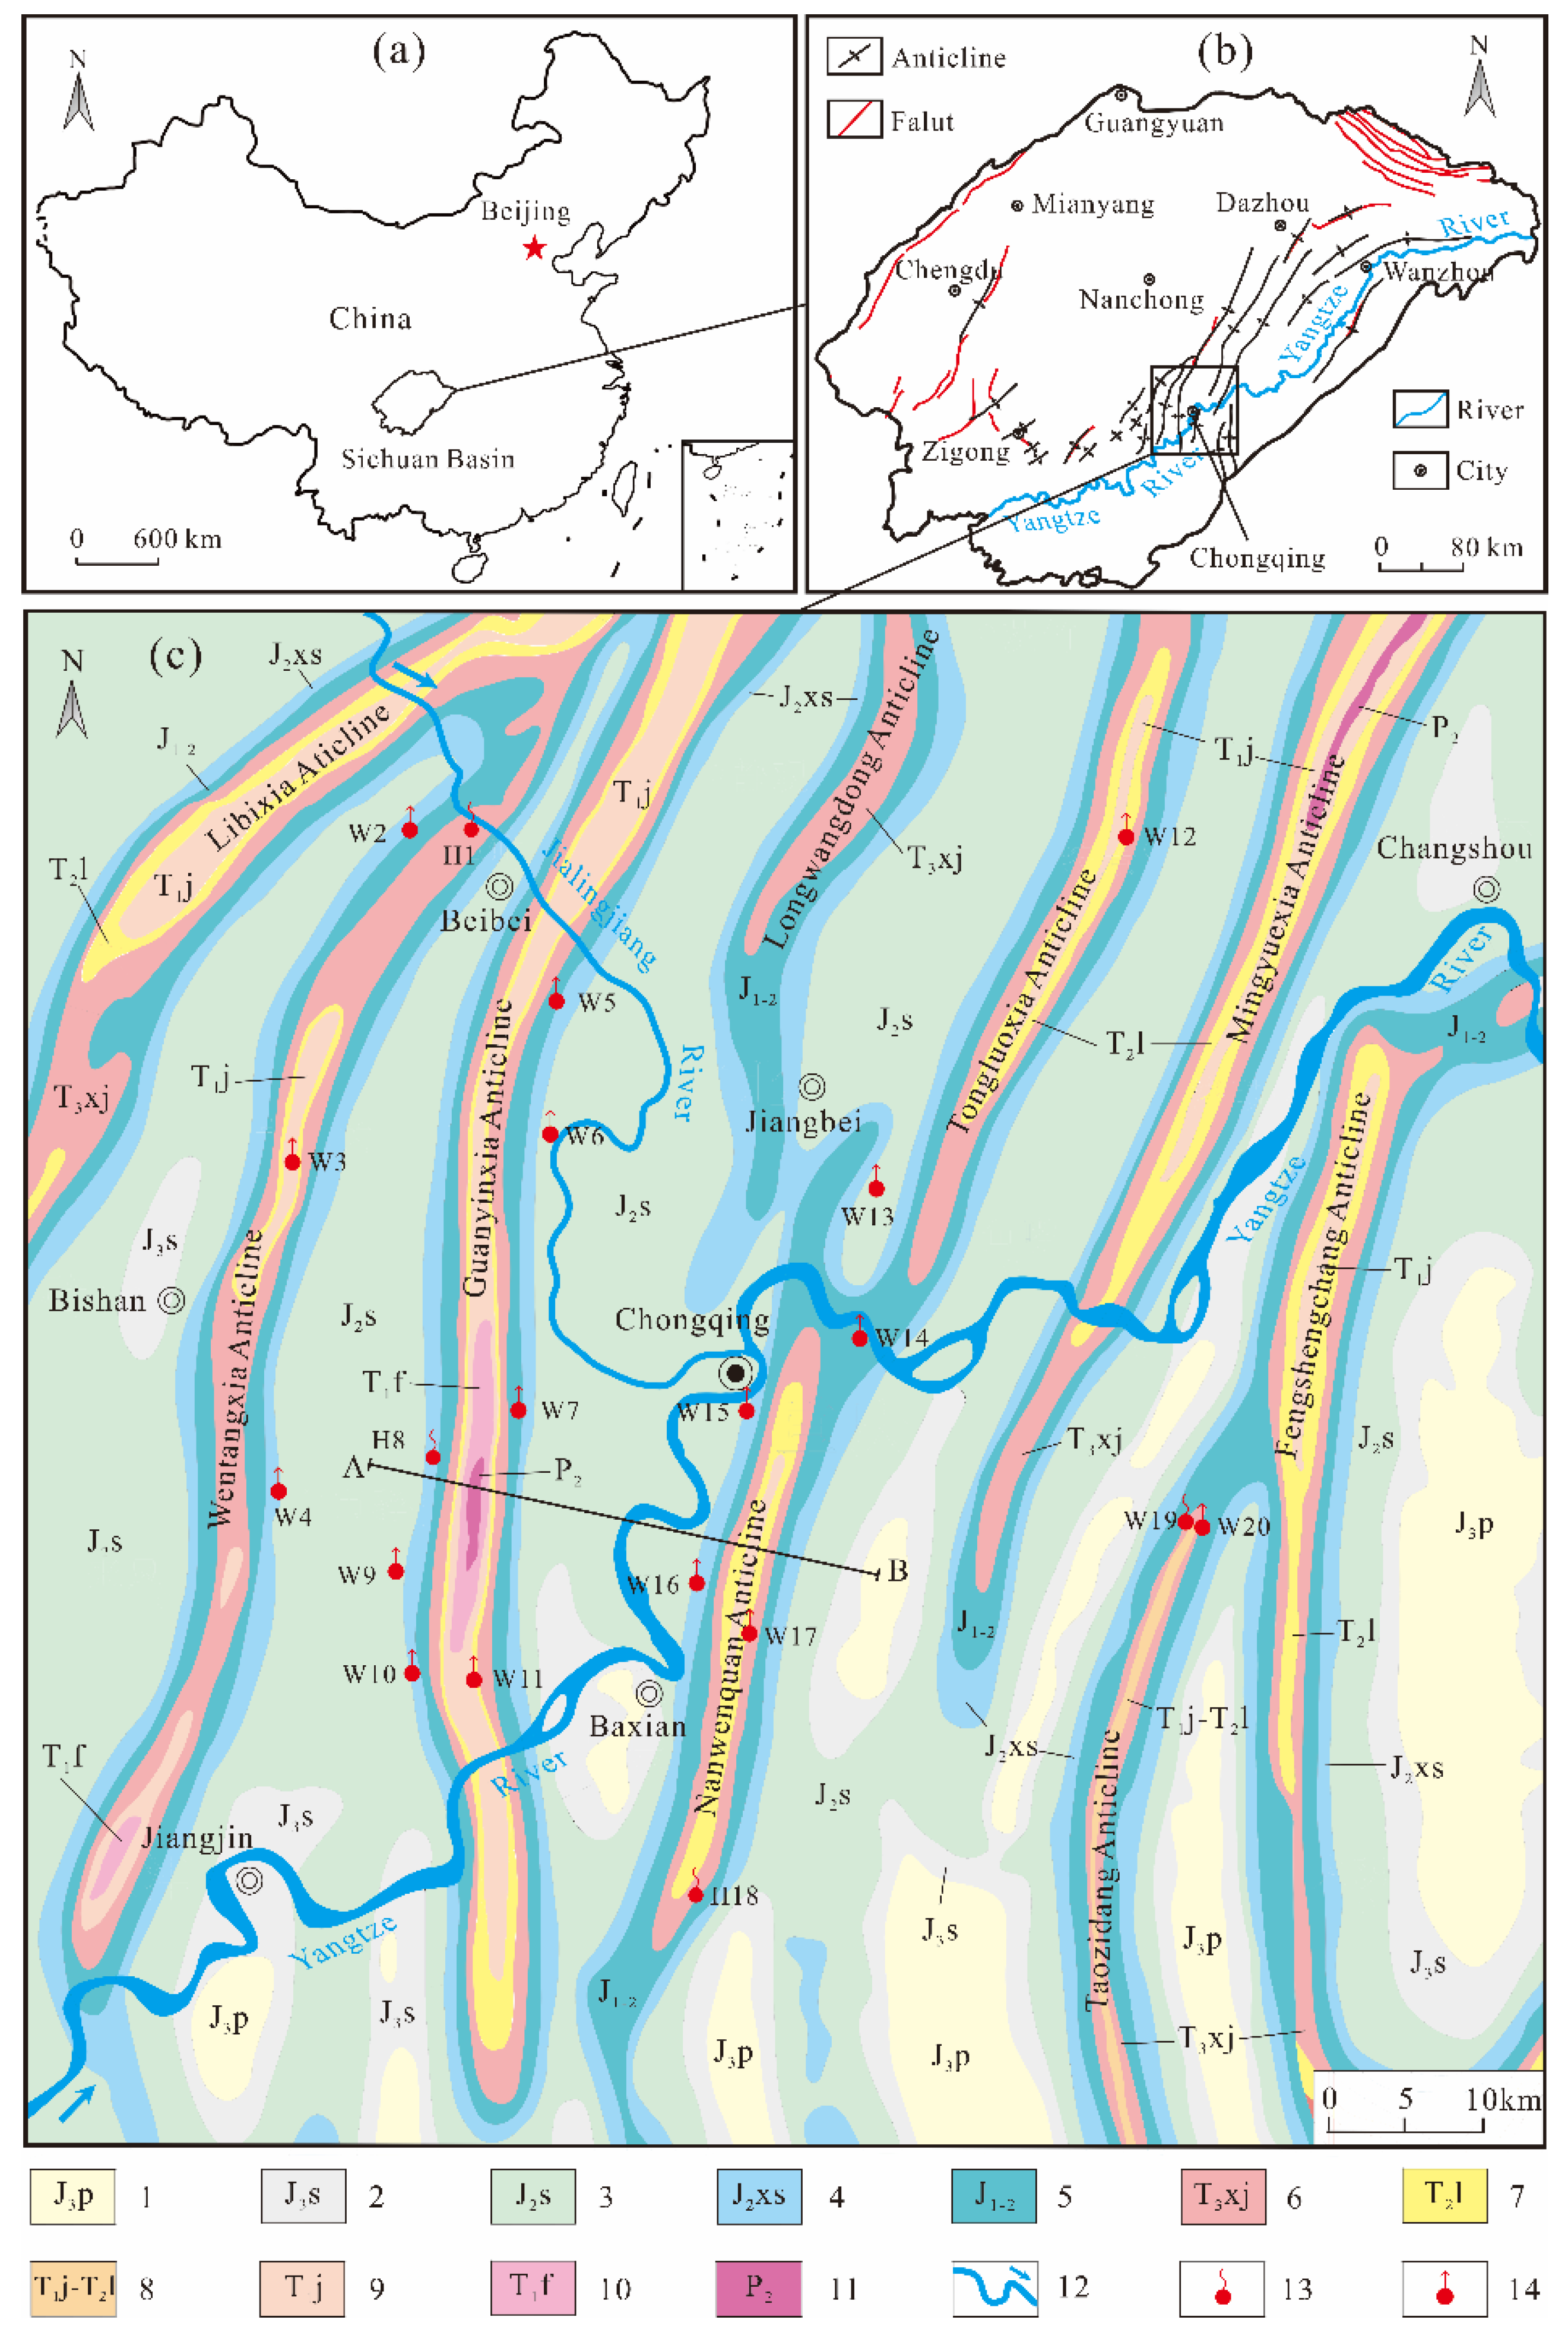
Subsurface brines, saline springs, and hot waters (32–64 °C) are common in the Triassic carbonates of the Sichuan Basin in southwestern China [1,2,3], in the eastern and northeastern parts of the basin [3,4]. The hot springs of the eastern basin, in the Chongqing area, appear in the axes, cores, two flanks and plunging ends of a series of northeast-southwest (NE-SW) trending anticlines (Figure 1). Geothermal wells have been drilled near the hot springs and on the flanks of the anticlines, and hot water is also present in the tunnels in these areas. The thermal groundwaters are characteristically of SO4-Ca type, with Total Dissolved Solids (TDS) of 2 to 3 g/L [4,5]. The utilization and development of the thermal waters in this area has grown rapidly in the past two decades, and thus an understanding of the hydrochemical characteristics and compositional evolution of the geothermal water—apparently strongly controlled by the anticlines—is important in providing insight into the geothermal potential of other carbonate reservoirs.
Much research has been applied to the thermal waters of Chongqing, using correlation analysis and traditional graphical methods (Piper, Schoeller, Ludwig-Langelier and Durov diagrams). Xiao et al. (2013) discussed the water-rock interactions of the Bei hot spring in the reservoir using δ13C-HCO3− and δ34S-SO42−. These reveal that the main water rock reaction is the dissolution of gypsum, followed by the reaction of CO2 with the host rock to produce HCO3− [6]. The hot water in Chongqing reservoirs flows along the flanks of the anticlines, obtaining heat from below and recharging in the cores of the anticlines from infiltration of precipitation (rain) in mountain areas, at approximately 670 to 1500 m altitude, where the carbonates outcrop [4]. The thermal groundwater issues at the surface as hot springs in the axis or plunging ends of the anticlines [5,6]. However, the circulation compositional evolution and the quantitative analysis of water-rock interactions have been little studied.
Methods widely applied in the analysis of the hydrogeochemical evolution of geothermal waters include major ion ratios, isotope tracers, graphic methods (Gibbs diagrams, box diagrams, etc.), multivariate statistical analysis and hydrogeochemical simulations. Many researchers have studied the evolution characteristics and water-rock interactions of hot waters at local or regional scales using isotope tracers of carbon (δ13C-CO2, δ13C-TDIC) [7,8], beryllium (δ11B) [9,10], sulphur and strontium (δ34S-SO42−, 87Sr/86Sr) [11,12]. Gibbs (1970) proposed a descriptive model (a Gibbs diagram) based on the relationship between TDS and Na+/(Na+ + Ca2+), and Cl−/(Cl− + HCO3−) to explain the mechanism controlling the source of dissolved components in groundwater, from atmospheric precipitation, rock weathering, processes of evaporation, and crystallization process [13]. This model has become the classical model for the study of hydrochemistry and has been widely used worldwide [14,15,16]. Because of their advantages in processing large-scale hydrochemical data sets, multivariate statistical methods have been successfully applied in the study of hydrogeochemical processes [17,18,19,20]. They have become powerful tools for characterizing the spatial and temporal variations of hydrogeochemistry and identifying the sources of chemical components. In this paper, R-model factor analysis (FA) is used to study the relationship between variables, and Q-model cluster analysis (CA), to group samples. Based on the principle of mass conservation, hydrogeochemical simulation can quantitatively calculate the amount of material transfer during water-rock interaction and the dissolution and precipitation state of various minerals, mapping the evolution of the groundwater [21,22,23]. The graphics of multimineral stability are used to analyze the main water-rock interaction in a groundwater system from the perspective of mineralogy and its application in hydrogeochemical research can provide more intuitive evidence [24,25,26].
The purpose of this study is to discuss the unique hydrochemical characteristics of the thermal groundwaters of Chongqing and the compositional evolution of the major ions in the geothermal reservoir, using field and historical data and combining the main hydrochemical methods with simulation models. The results provide an understanding of water-rock interactions in these Triassic carbonate reservoirs and may serve as a reference for similar sites elsewhere.
2. Description of the Study Area
The Sichuan Basin, lies in the northwestern part of the Upper Yangtze Platform, with extensional faulting defining the approximately rhombic basin margins (Figure 1) [27]. During the Palaeozoic, the basin received wide-spread marine deposits, including limestones. During the Mesozoic, these peripheral faults were transformed by compression, and the basin was inverted, and deposits were predominantly lacustrine. Cenozoic deposits consisted principally of intermountain plain fluvial facies [28].
The study area in the eastern part of the basin lies in a high steep fold belt, formed by the early Cretaceous-Eocene Sichuan Movement. A series of NE-NNE trending and nearly parallel anticlinal folds were developed in this area with broad hills forming parallel ridge-valleys (Figure 1). Mesozoic rocks form the main bodies of the folds, characterized by long narrow axes, high cores, and steep flanks. Middle and Lower Triassic carbonates outcrop in the axes. By contrast, complementary synclines are wide and gentle and in these areas the Triassic rocks are deeply buried. Some of the anticlines are asymmetrical with dips on adjacent limbs varying from relatively gentle 20–30°, to steeper 40–70°, with some even vertical or inverted [1]. The Wentangxia anticline (Figure 1) extends more than 200 km NE-NNE along its axis. The northern part of the anticline is steep and narrow with a width of 5 to 8 km and an elevation of 800 to 110 m. Limestones with typical karst valleys are exposed along the axis. In the Guanyinxia anticline, dips are gentler to the east than to the west. This anticline is rich in geothermal water and wells have been drilled along both flanks. The Tongluoxia anticline is slightly curved, with an axis of approximately 230 km, with the southern end plunging obliquely and connecting with the eastern flank of the Nanwenquan anticline [29]. The Yangtze River, forming the base level of erosion and discharge in the study area, cuts across the anticlines to form deep gorges and, together with the tributary Jialingjiang River, and forms a deep gorge with drainage points for thermal groundwater (up-flow springs and erosion springs) [1,6].
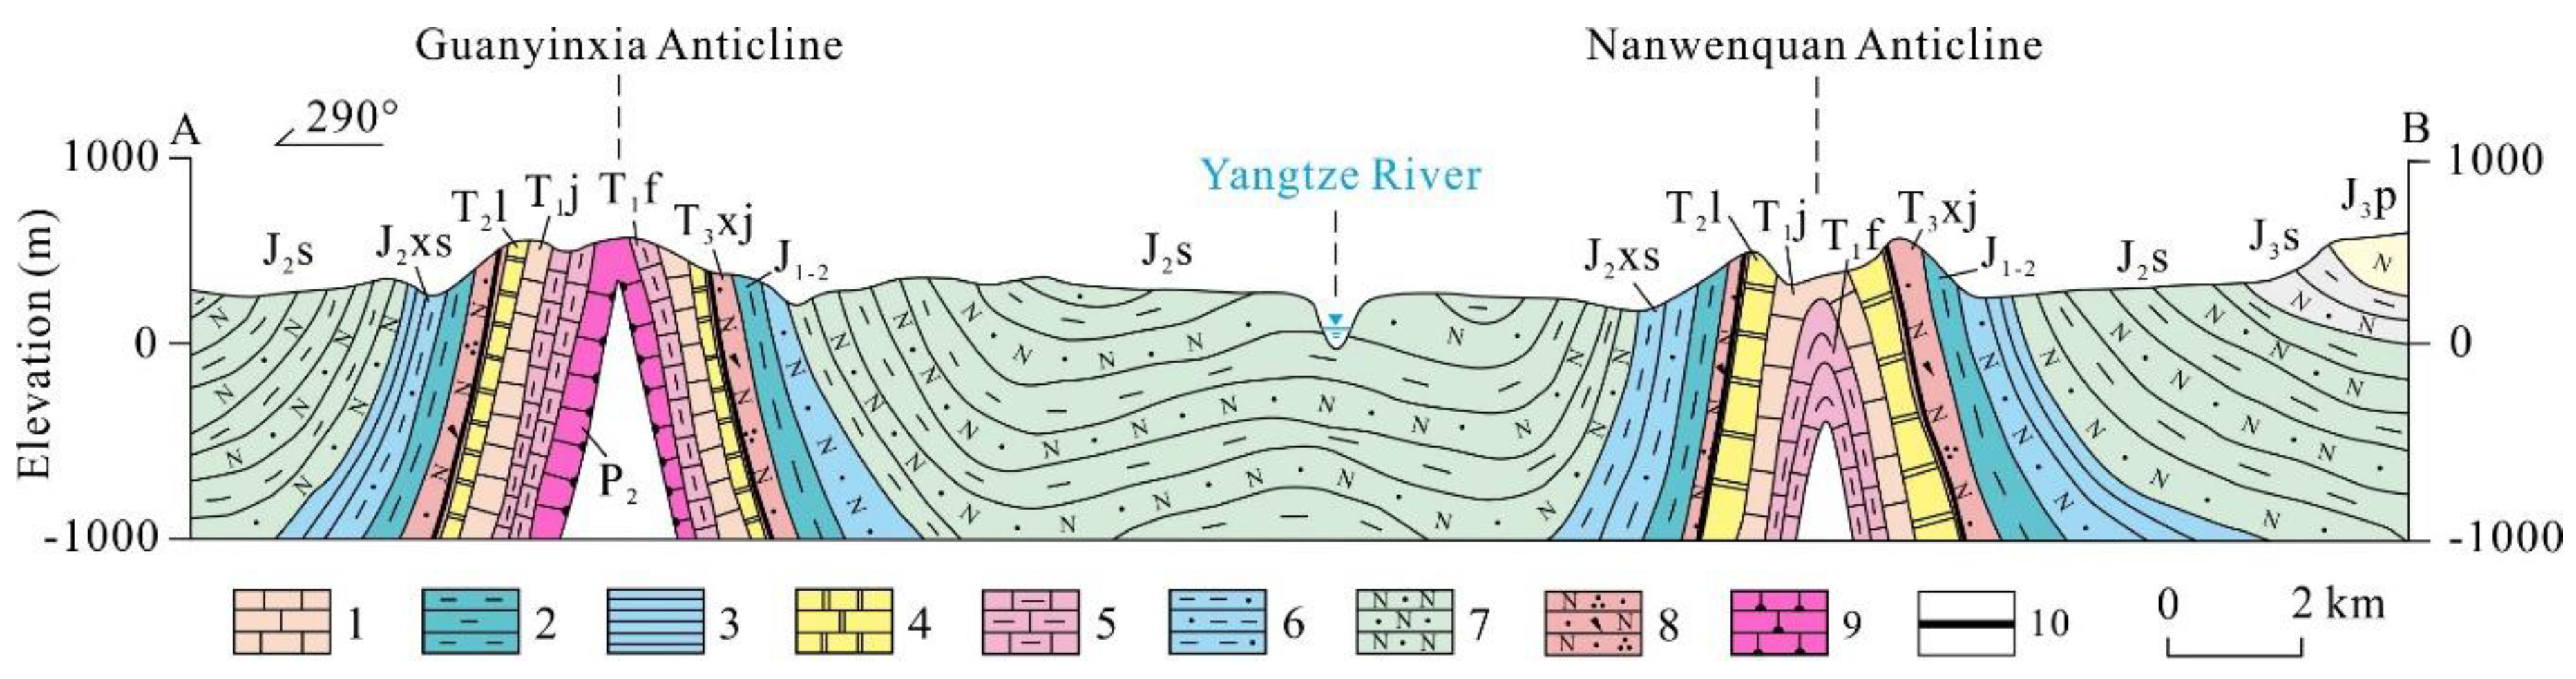
The geothermal reservoirs in this area are mainly in carbonate rocks of the Lower Triassic Jialingjiang Group (T1j) and Middle Triassic Leikoupo Group (T2l), together about 600 m thick, and outcrop in the cores of the anticlines (Figure 2). The Jianglingjiang Group can be divided into four sections (T1j1, T1j2, T1j3, and T1j4). T1j1 consists of grey limestone, and mudstone interbedded with limestone bearing insect tracks and bio-limestone. T1j2, comprises grey argillaceous dolomite with limestone (the lower part of the T1j2 is gypsum), grey-green and purple mudstone. T1j3, consists of light grey medium to thick bedded limestone, argillaceous limestone, dolomitic limestone and bio-limestone. T1j4, comprises light grey dolomite, argillaceous dolomite, and limestone. The overlying Leikoupo Group (T2l) is mainly limestone and yellowish-grey dolomite, with argillaceous dolomite, limestone with anhydrite (the bottom part of the T2l is hydromica clay rock). The Upper Triassic Xujiahe Group (T3xj) comprises siliciclastic rocks (450 m thick) and outcrops on the flanks of the anticlines. These include grey-white feldspar-rich quartz arenite, quartz arenite with grey-black shale, carbonaceous shale and a thin coal seam. The impervious shale and coal at the bottom of T3xj and red Jurassic sandy mudstones (1000 m or more in thickness) outcrop on both sides of the anticlines and constitute the cap rocks of the geothermal reservoirs (Figure 3). The Lower Triassic Feixianguan Group (T1f) that lies beneath the reservoirs consists of purple-red, grey-purple and yellow-green mudstones and dark-grey marl with varying thickness. This acts as an impermeable base, and locally outcrops in the cores of some of the anticlines (e.g.; the Wentangxia and Guanyinxia anticlines, Figure 1).
3. Material and Methods
3.1. Sampling and Testing
A total of 28 hot water samples were analysed in this study. Of these, 18 were sampled in the field survey in October 2013 and August 2016, while analyses of the other 10, cited in [30], were collected from geothermal wells in the main urban area of Chongqing in the wet season of 2009 for comparison. Variable hydrochemical parameters, including temperature (±0.1 °C) and pH (±0.1 unit), were measured in-situ with a hand-held thermometer (TP101), pH and ORP meters (CT-6821), calibrated in the field prior to sampling. Water samples were stored in polyethylene bottles, including one large (1500 mL) bottle and two smaller (550 mL) bottles that were rinsed with water samples three times before actual sampling. SiO2 was measured at the laboratory of the Beijing Brigade of Hydrogeology and Engineering Geology by Si-Mo yellow colorimetry (UV spectrophotometer). Laboratory testing of other chemical parameters was completed at the Analysis Center of the Beijing Research Institute of Uranium Geology, determining the following parameters: concentrations of cations K+, Na+, Ca2+ and Mg2+, and anions Cl- and SO42− were determined using ion chromatography (ICS-1100 and 883 Basic IC plus); HCO3− by the volumetric method (HCl titration using an AT-510 automatic titration analyzer); and Li+, and Sr2+ using inductively coupled plasma-mass spectrometry (NexION300D). The results of anion-cation equilibrium tests show that the equilibrium errors of the water samples ranged from 2.92% to 3.63%.
3.2. Methods
3.2.1. Cluster Analysis (CA)
Clustering analysis is an unsupervised pattern recognition technology that can reveal the intrinsic structure or potential features of data sets without any prior assumption. It classifies the objects of the system into categories or clusters based on their proximity or similarity, and is commonly used in the management of hydrogeochemical data [31,32,33]. Q-mode hierarchical cluster analysis (HCA) is the most widely used method. In this, comparisons based on multiple parameters from different samples are made and the samples are grouped in clusters according to their “similarity” to each other, forming higher order clusters step-by-step [34,35,36]. The Euclidean distance may be used quantitatively to describe the similarity between samples. In other words, the difference between the statistical values of samples can be expressed by “distance”. Without considering other factors, groundwaters with a close “distance” should have the same recharge source or closely hydraulic connection. The further the “distance” is, the greater the difference in chemical composition and the weaker the hydraulic connection becomes [37,38]. HCA was performed using Ward’s linkage rule. This method uses an analysis of variance approach to evaluate the distance between clusters, attempting to minimize the sum of squares of any two (hypothetical) clusters that could be formed at each step [39,40]. The results of HCA are finally shown by a dendrogram, which intuitively reflects the clustering process. Coefficients of variation (CV) can reflect the degree of dispersion of data. It is generally considered that CV ≤ 0.1 shows a weak, CV > 0.1 ≤ 1 moderate, and CV ≥ 1 strong variation.
3.2.2. Factor Analysis (FA)
R-mode FA including Principal Components Analysis (PCA), was carried out to reveal the internal structure of the correlation matrix between variables. In general, this attempts to simplify the complex and diverse relationships that exist among a set of variables (measured geochemical constituents) by revealing common and unobserved factors that link together with the seemingly unrelated variables [36,41,42]. The PCA technique extracts the eigenvalues and eigenvectors from the covariance matrix of original variables. The common factors are the uncorrelated (orthogonal) variables, obtained by multiplying the original correlated variables with the eigenvector, which is a list of coefficients (loadings or weightings) [31,35,43]. The number of factors retained based on the Kaiser criterion, from which only the factors with eigenvalues greater than 1 are extracted [44]. The loading matrix of the original variables and the common factors are obtained by the method of varimax rotation, in which each factor is described only in terms of those variables and affords greater ease for interpretation [45]. The largest loading, either positive or negative, suggests the meaning of the dimension; positive loading indicates that the contribution of variables towards the geochemical processes increases with the increasing loadings in a dimension; whereas negative loading indicates a decrease [33,46,47]. Cluster analysis and factor analysis are performed with the IBM SPSS 22 statistical software.
3.2.3. Geochemical Modelling (GM)
Geochemical modelling is a powerful technique for characterizing geochemical phenomena and predicting their evolution in time, as well as in space when coupled with widely applied flow modelling [48,49,50]. PHREEQC, designed by the USGS, is one of the most popular software packages for modelling [51]. It is used here to calculate the saturation index of minerals and to conduct reverse modelling for the water-rock interactions on flow paths. The saturation index can qualitatively reflect the dissolution and precipitation of minerals during geochemical evolution. Based on the principle of mass conservation, inverse modelling calculates the molar amounts of minerals and gases that dissolve or precipitate (degas), and quantitatively explains the difference of hydrochemical components between initial solution and final solution, assessing the evolution of groundwater characteristics along the flow path [25,32]. The reaction path is determined by the hydrogeological conditions (hydrochemical characteristics, including changes in regional head and the geographical locations of sampling points) [34,52]. The determination of hydrogeochemical reactions along the flow path mainly depends on the determination of “possible mineral phases”, and is mainly based on the lithologies and mineral compositions of aquifer host media, and on the chemical compositions and storage conditions of the groundwater [21].
4. Results and Discussion
4.1. General Hydrochemical Characteristics
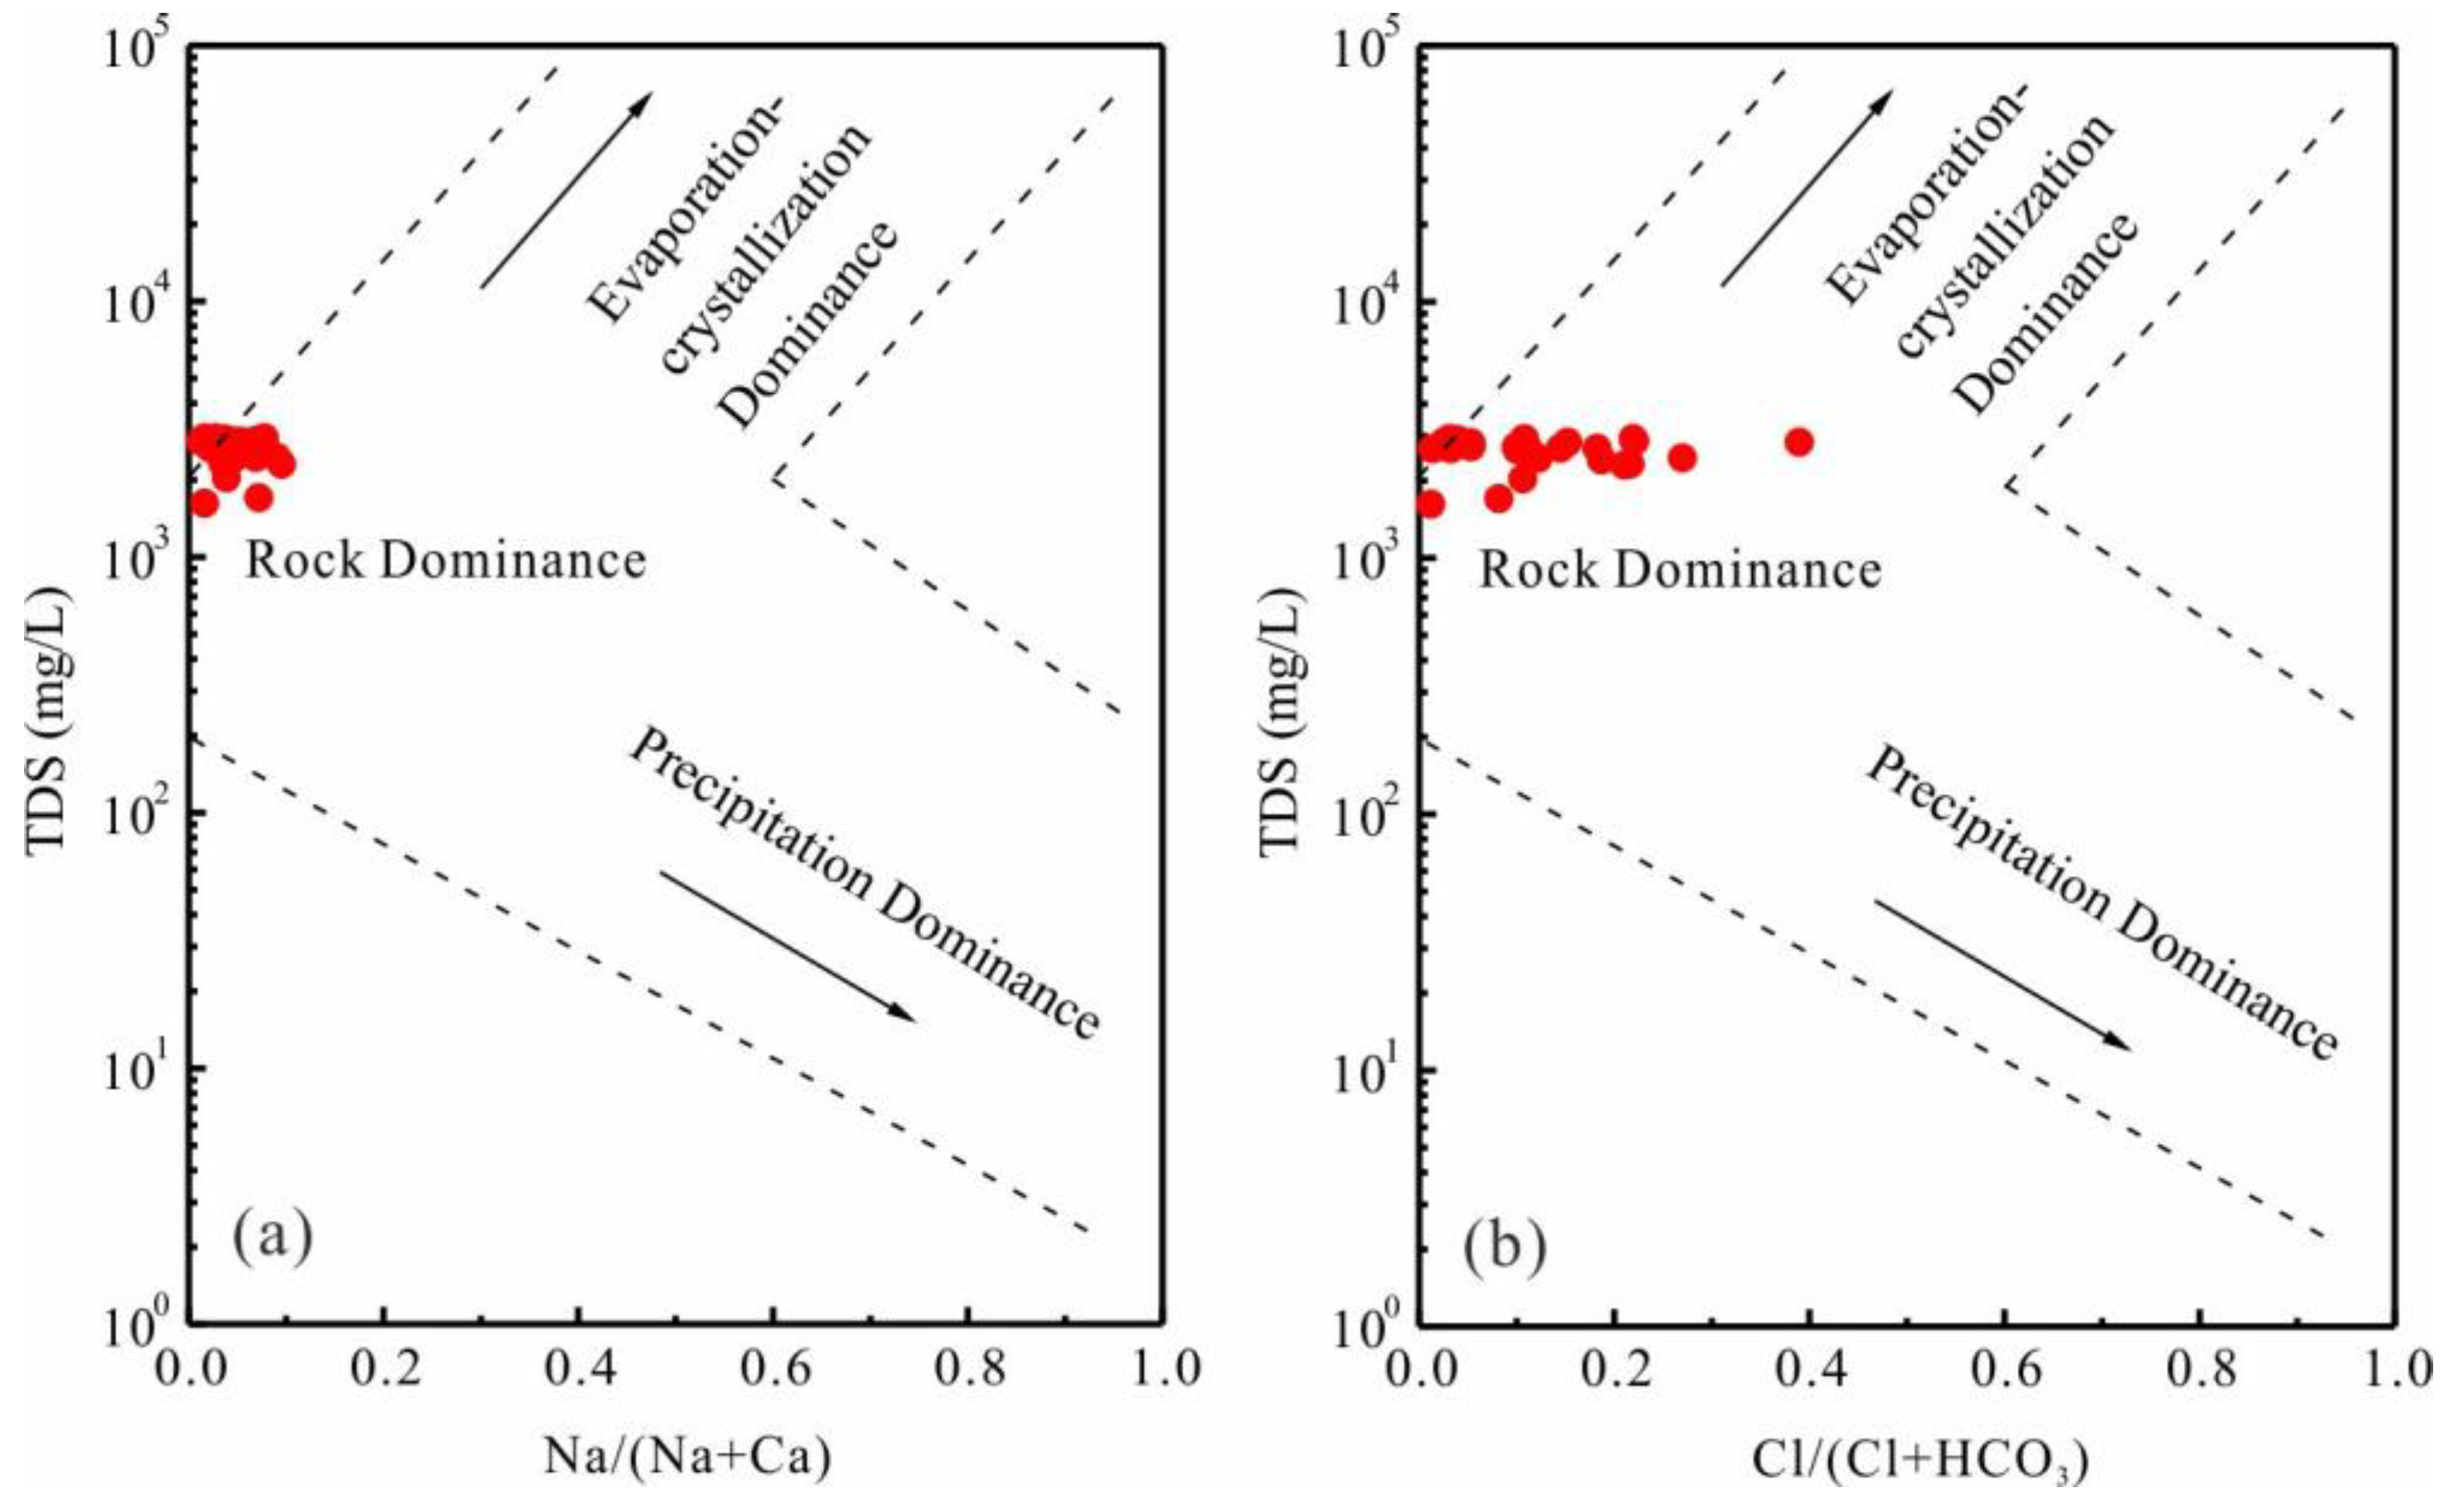
Sampling information, chemical analyses, and hydrochemical types of the hot waters in the study area are shown in Table S1. Descriptive statistical analysis of the major and minor hydrochemical parameters of the 28 hot water samples is listed in Table S2. The pH of the water ranges from 6.2 to 8.5, with an average value of 7.27, showing weak acidity to alkalinity. The low-to moderate temperature of the thermal groundwater (32.9–57 °C) decreased between 2009 and 2016 (Figure 4). The TDS of the samples ranges from 1620 mg/L to 2929 mg/L with an average value of 2594.07 mg/L. In the Gibbs diagram (Figure 5), the data points of the water samples plot in the field of rock dominance, and the ratios of Na+/(Na+ + Ca2+) and Cl−/(Cl− + HCO3−) are 0.012 to 0.095 and 0.012 to 0.039, respectively. This indicates that the hydrochemical characteristics of the hot water are controlled by rock weathering, confirming that the changes in TDS are caused by the dissolution of rock minerals. The main anion in the water is SO42− with a concentration of 1005 to 1974 mg/L, followed by HCO3− (106–223.6 mg/L). Cations are dominated by Ca2+ and Mg2+, with concentrations of 358.3 to 663.1 mg/L and 60.5 to 131 mg/L, respectively. SiO2, Li+, and Sr2+ are characteristic components of thermal groundwater with concentration ranges of 14.62 to 42.23 mg/L, 0.10 to 1.22 mg/L and 7.38 to 20.27 mg/L, respectively. Table S2 shows that all the hydrochemical parameters except pH (CV = 0.0617) and Li+ (CV = 1.0490) reflect moderate variation. The samples have good dispersion and are suitable for cluster analysis.
4.2. Multivariate Statistical Analysis
4.2.1. Hierarchical Cluster Analysis (HCA)
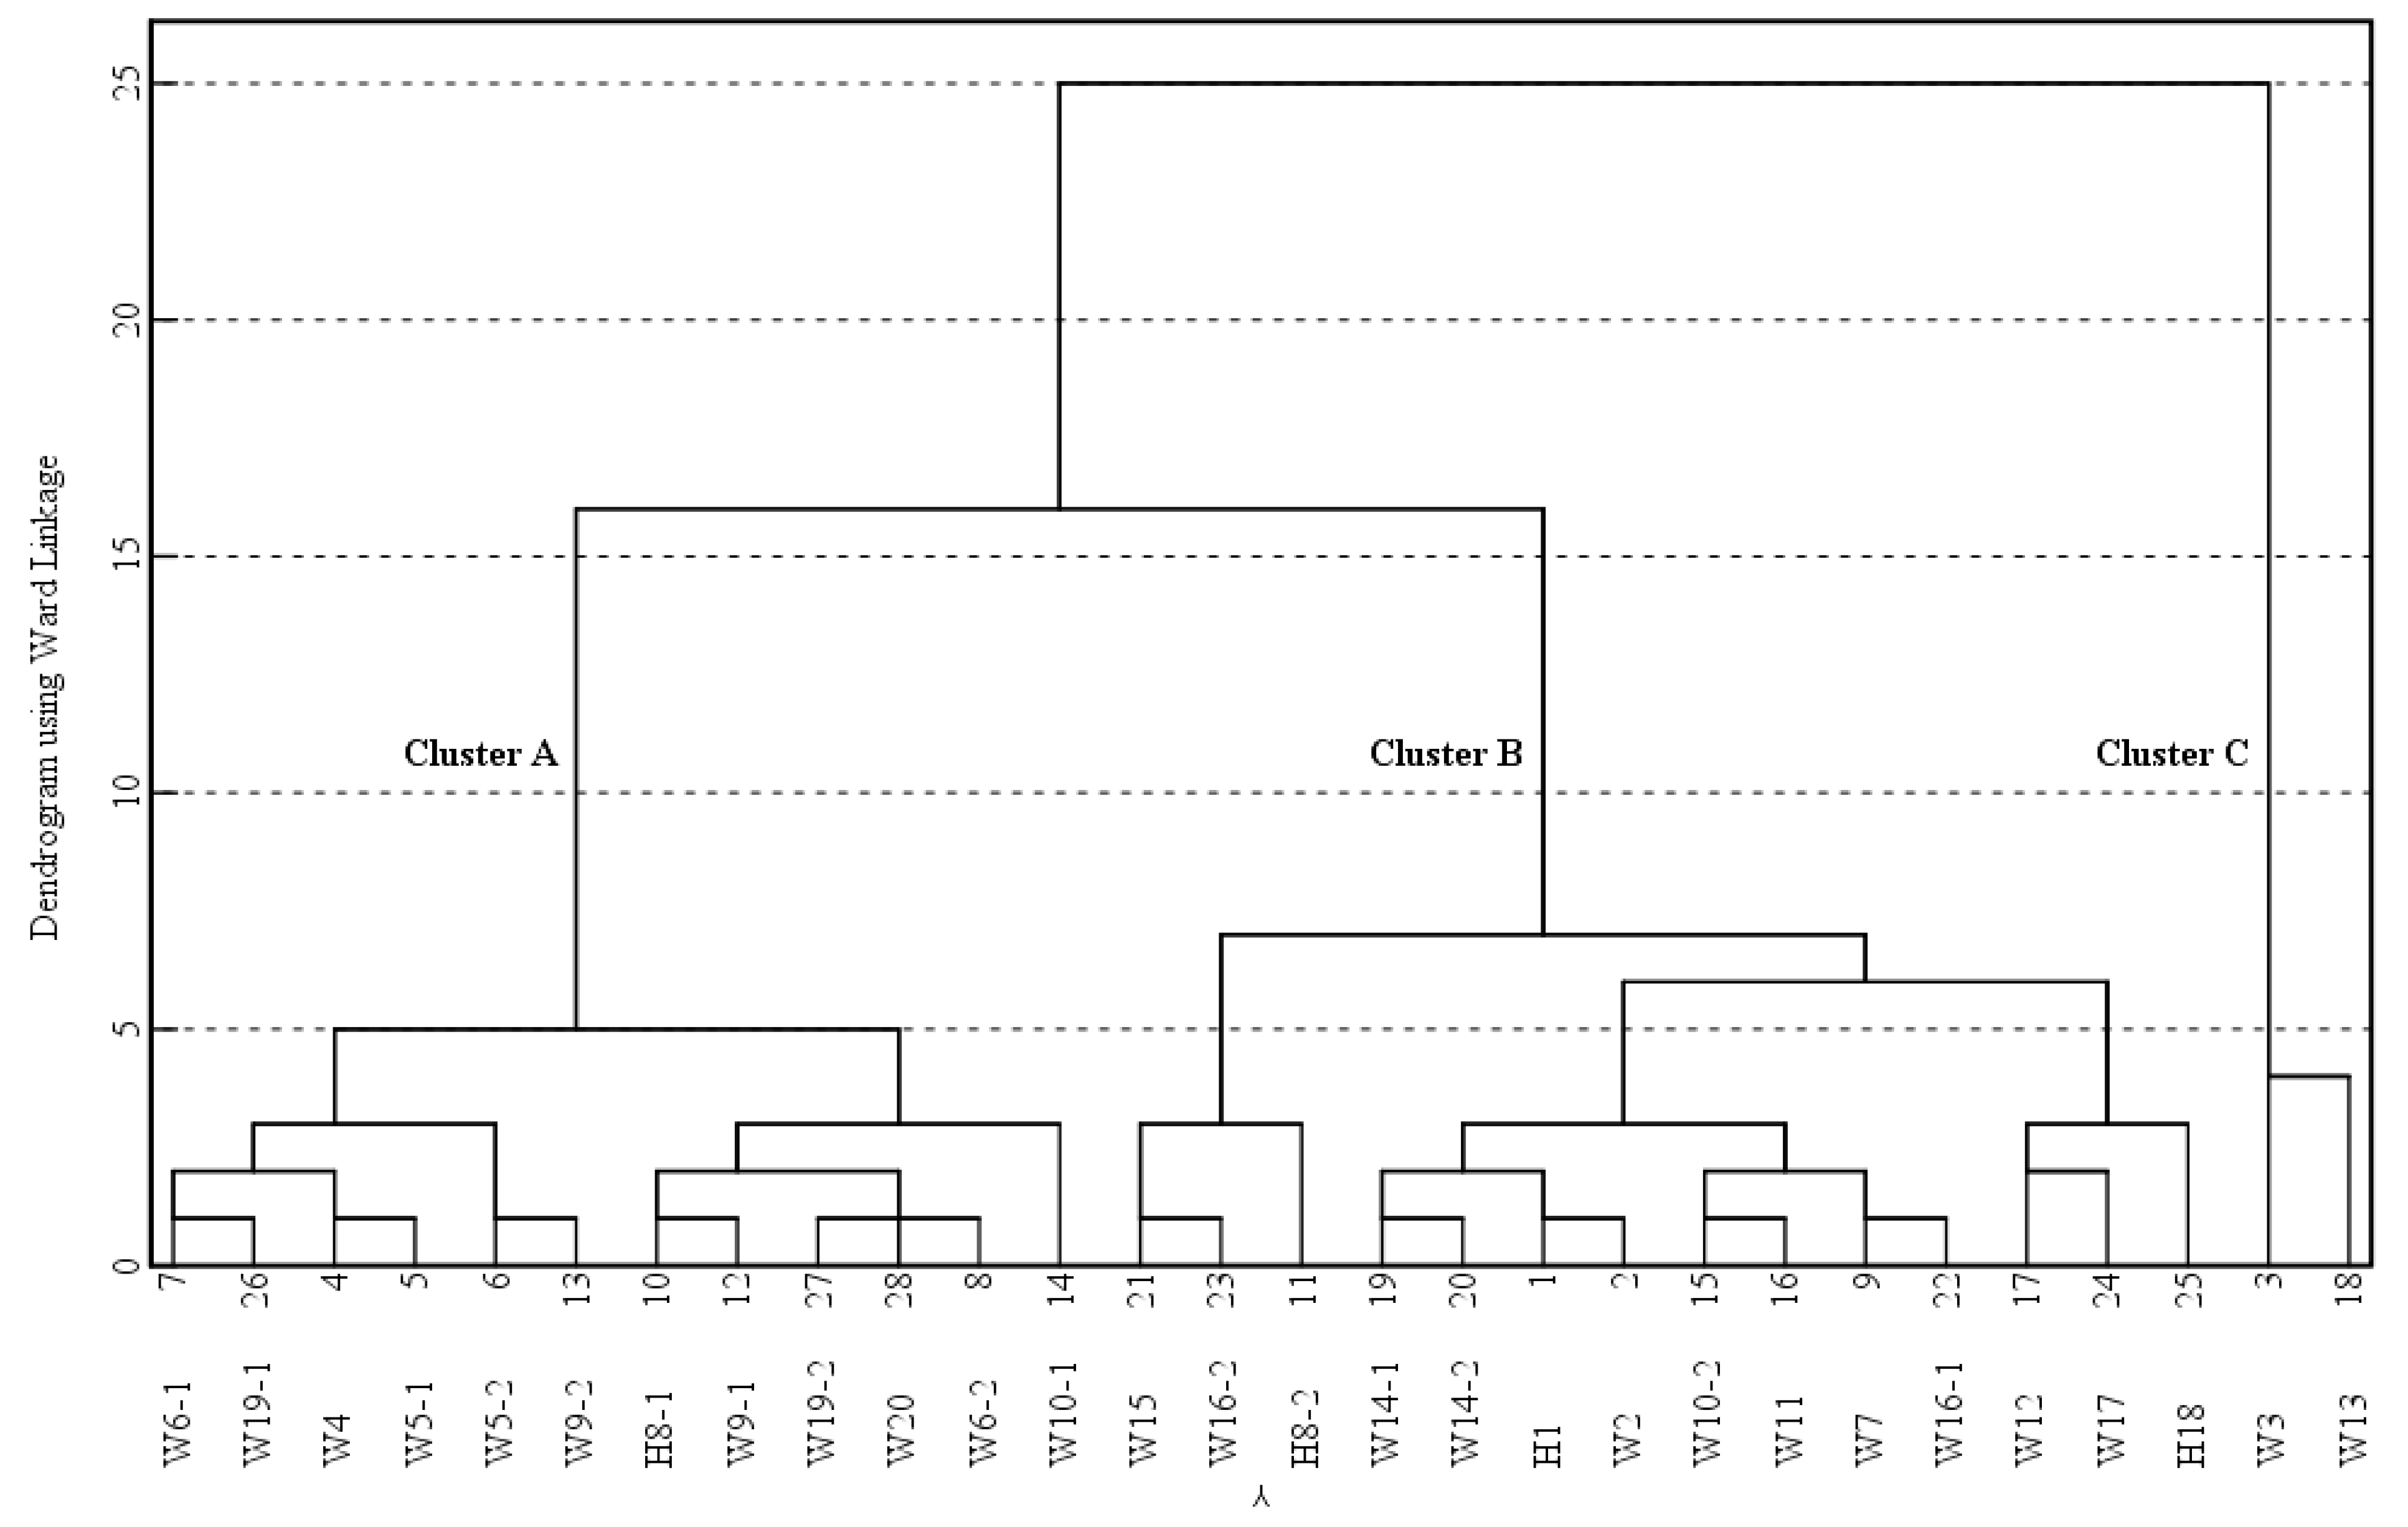
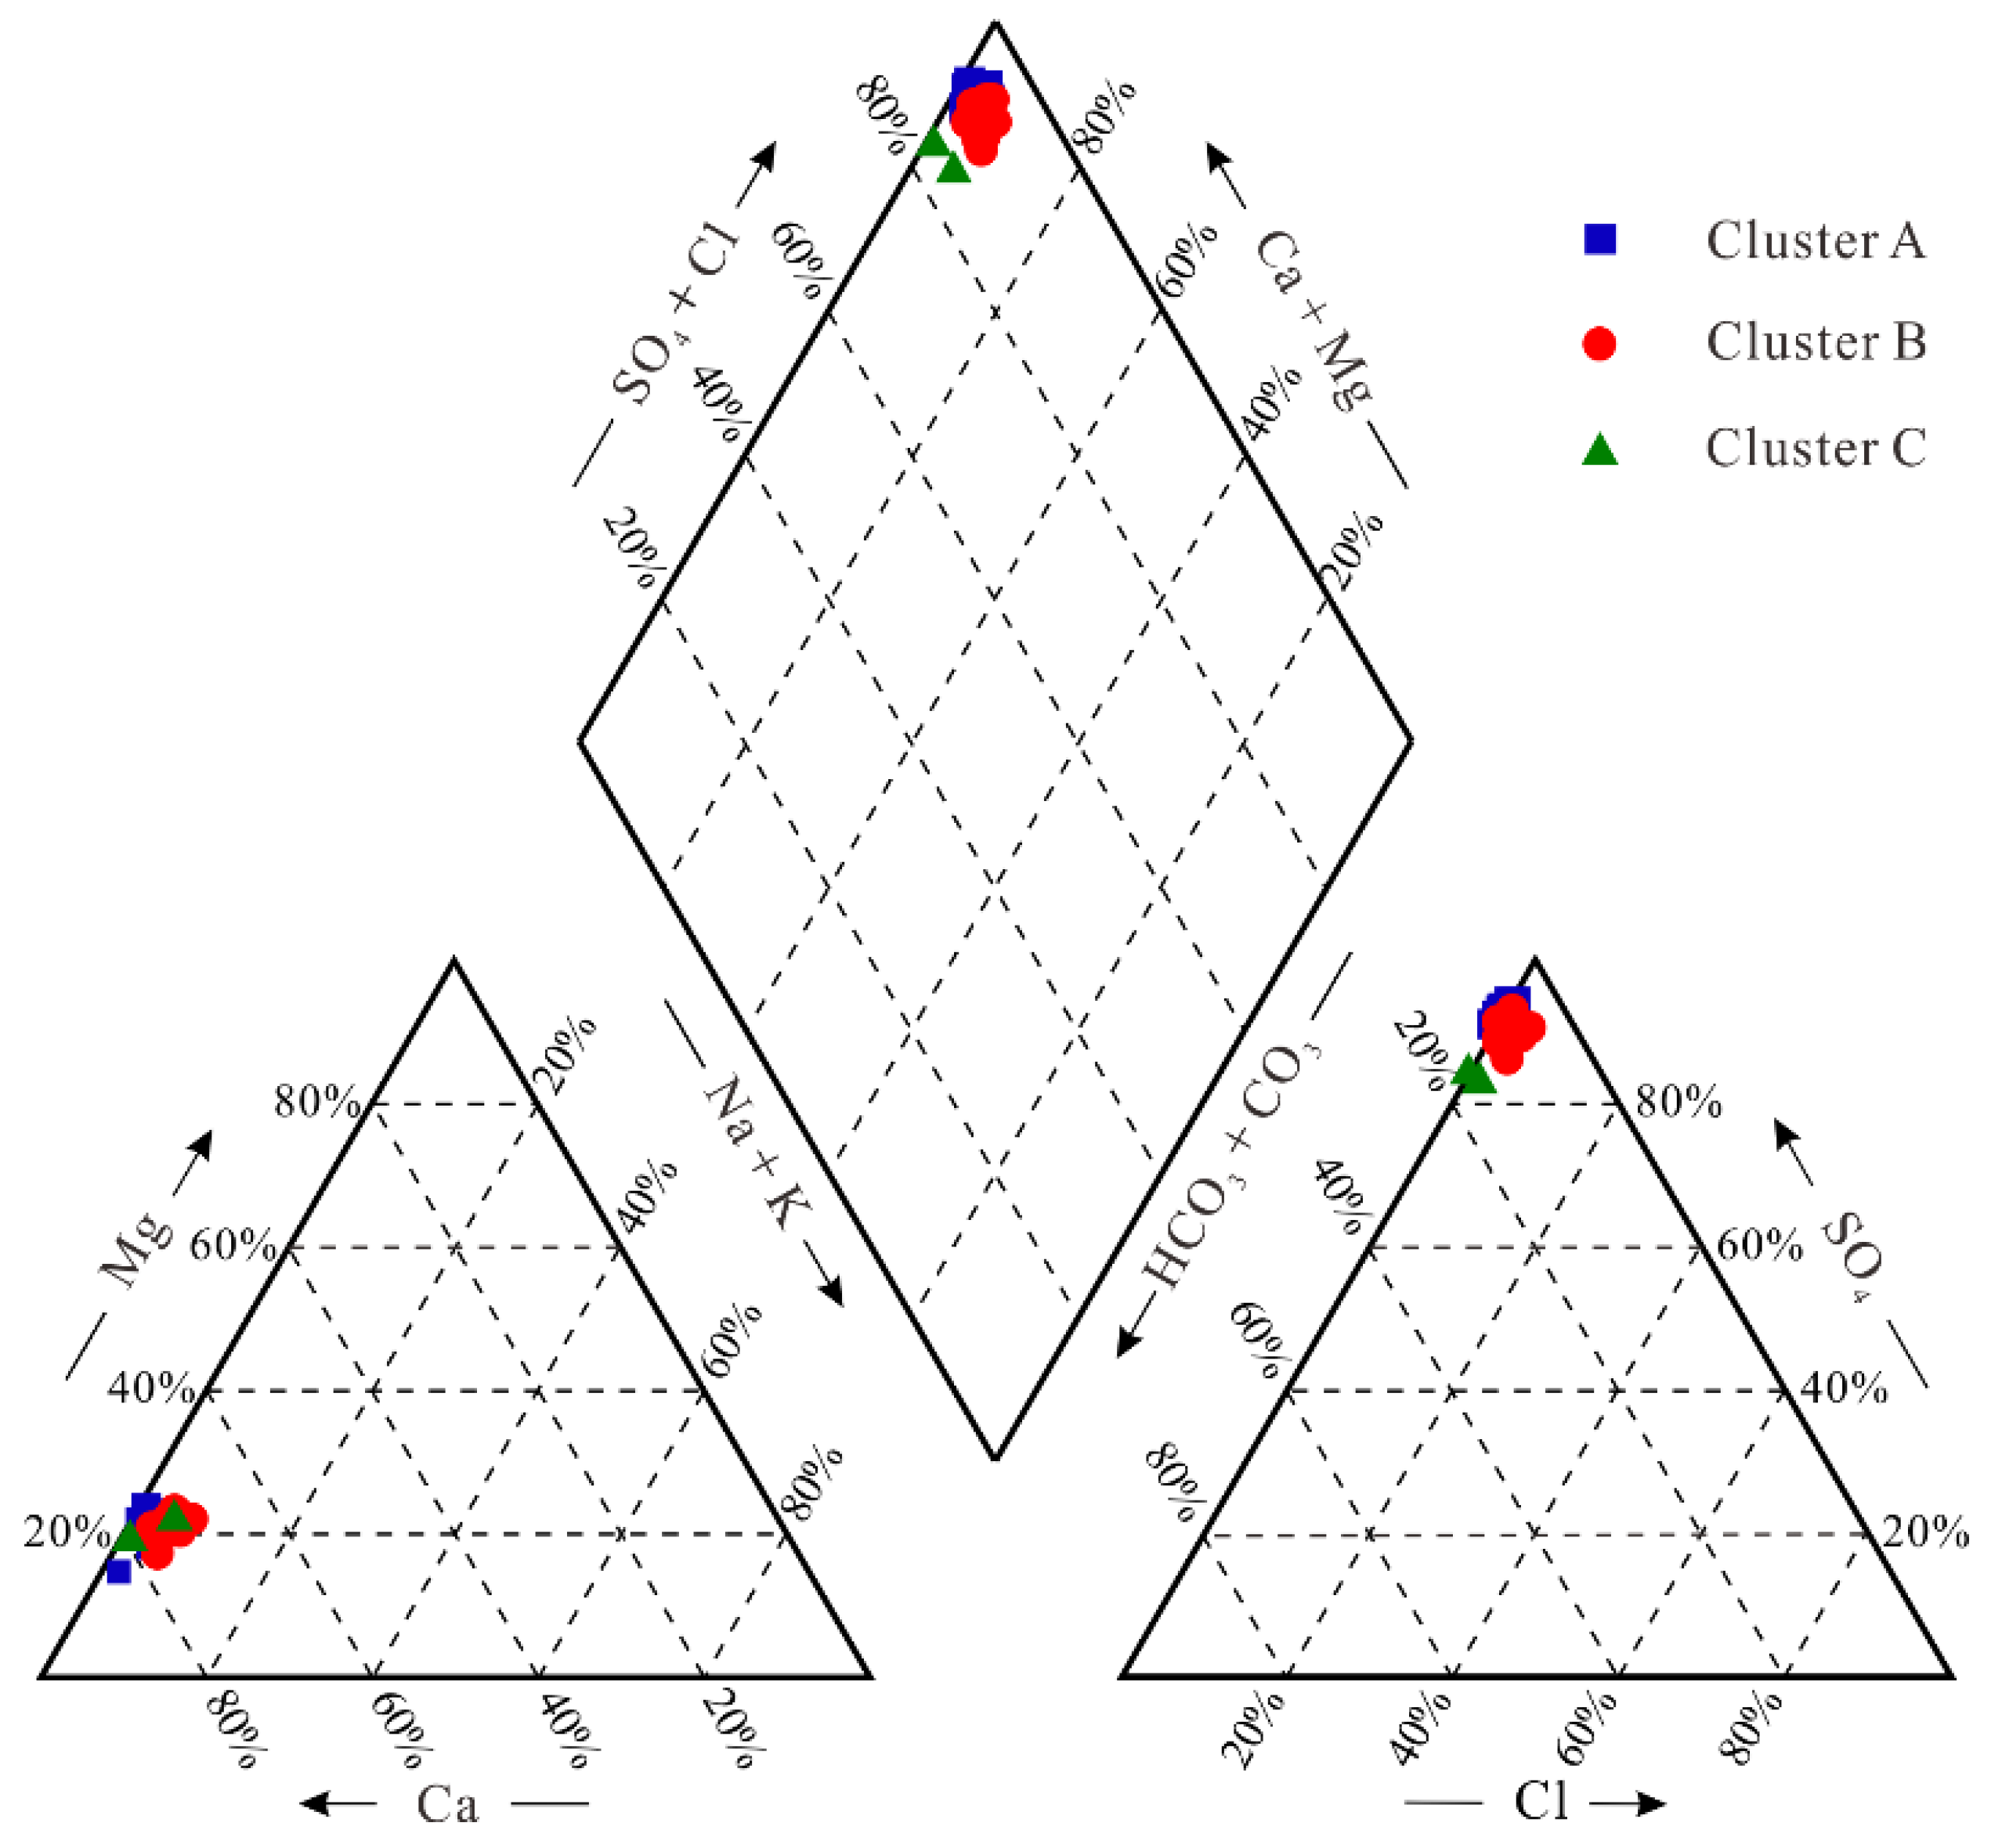
Based on the 11 main hydrochemical parameters (T, pH, K+, Na+, Ca2+, Mg2+, Cl−, SO42−, HCO3−, SiO2, and TDS), Q-mode HCA was carried out on results from the thermal groundwater. The results of cluster analysis are represented using a dendrogram (Figure 6). Classification is clearest when the distance is 10 (Figure 6) and the 28 samples can be divided into three clusters: A, B, and C. Observations of the dendrogram, provides information on the degree of similarity of the three categories. The link distances between clusters A and B are relatively small (16), indicating that the hydrogeochemical characteristics of these clusters are similar, whereas the link distances between cluster C and the others are up to 25. Thus, the hydrogeochemical characteristics are quite different from those of the other clusters. The Piper diagram (Figure 7) shows that the waters in all three clusters are of SO4-Ca type. Among the clusters, the milliequivalent of SO42− decreases gradually between A, B, and C, with the range of 91.5% to 93.8%, 87.3% to 92%, and 84% to 84.8%, respectively, while that of Ca2+ is 71.4% to 80.2%, 68.1% to 75.1%, and 70.7% to 77.7%. The milliequivalent of Mg2+ is higher, with an average of 22.115%, 22.76%, and 22.12%, respectively—and even 24.8% in sample W4.
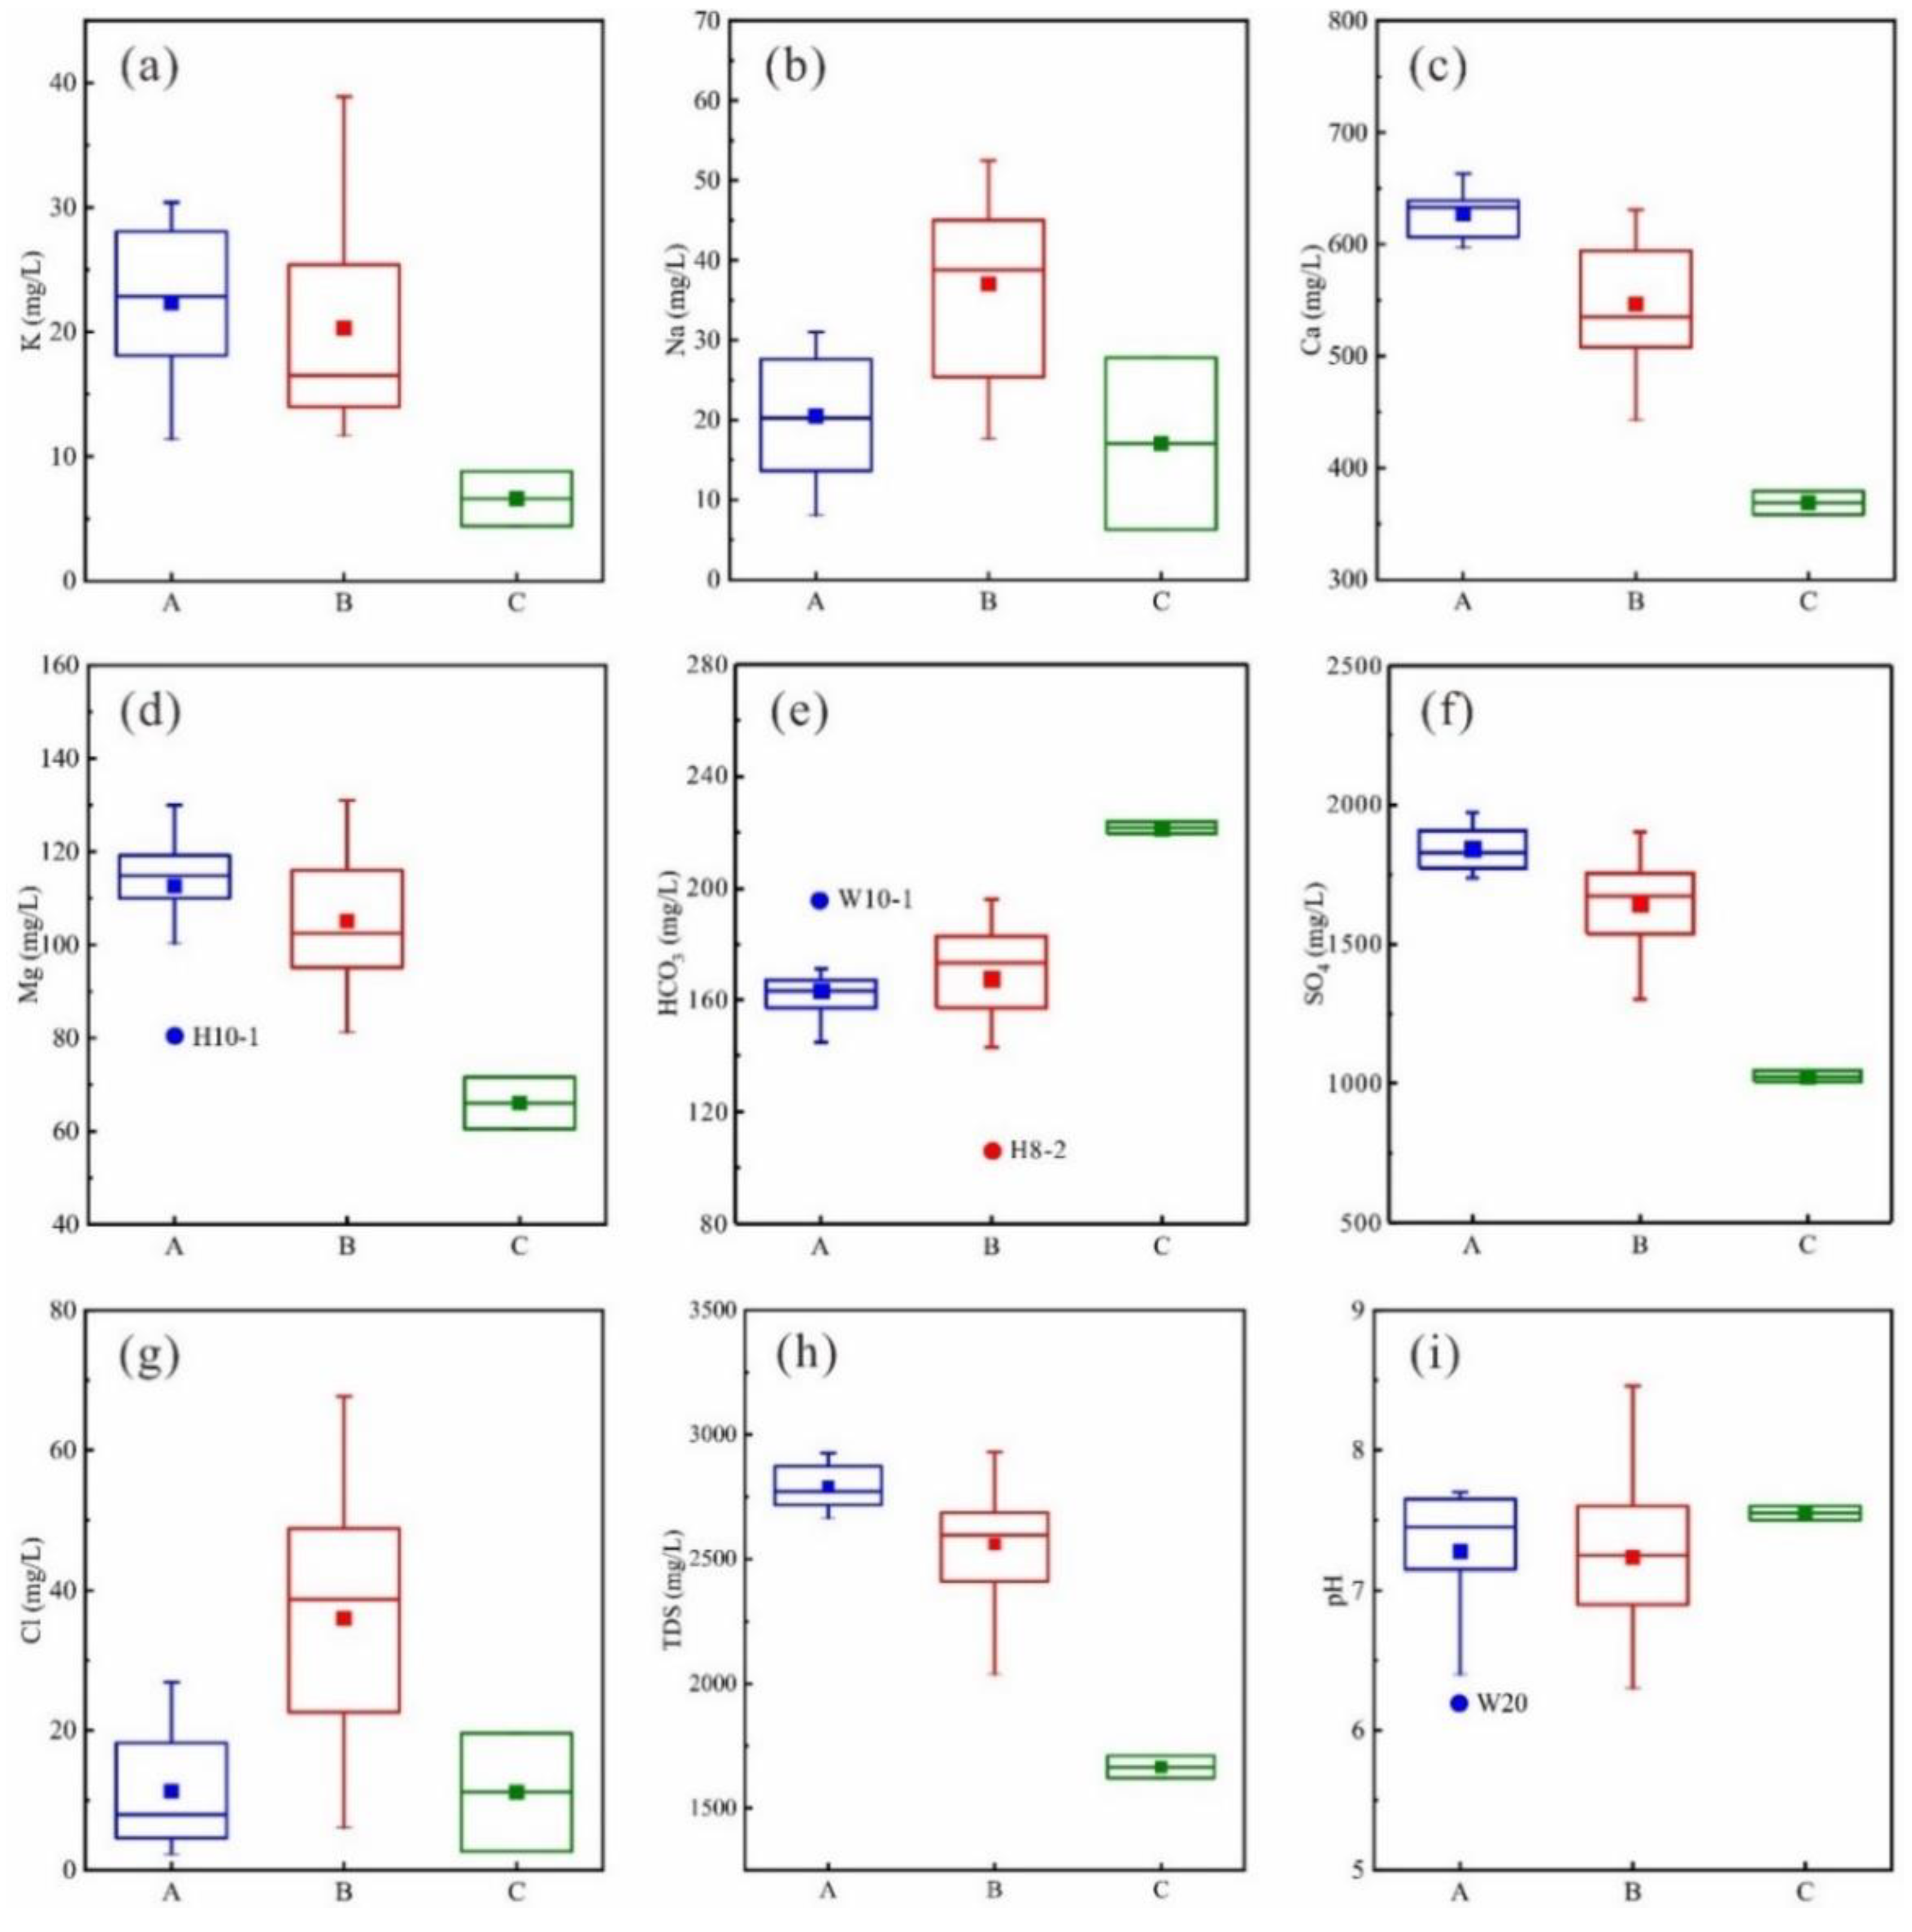
Cluster A contains 12 samples, accounting for 42.9% of the total. Compared with other clusters the TDS of this cluster is obviously higher (up to 2789.3 g/L), and the concentrations of K+, Ca2+, Mg2+, and SO42− are highest in cations and anions, respectively, while the contents of HCO3− are the lowest (Table 1, Figure 8a,c,d,f,h). Sample H10-1 was the lowest Mg2+ concentration and the highest HCO3− concentration—80.4 mg/L and 195.9 mg/L—respectively. Based on the stratigraphy lithology of the study area, it can be inferred that cluster A waters may dissolve more evaporite (gypsum and anhydrite) and silicate rocks, but relatively less carbonate. Cluster B contains 14 samples, accounting for 50% of the total. The concentrations of each parameter in this cluster lies between those of the other two, with the exception of Na+ and Cl−, where the concentrations of these ions are the maximum of all the water samples, at 37.0 mg/L and 36.0 mg/L, respectively (Table 1, Figure 8b,g). This may reflect the dissolution of more halite. Cluster C contains only two samples, accounting for about 7.1% of the total. However, the concentration of HCO3− and pH of these samples are the highest (221.6 mg/L and 7.6, respectively), of all samples, whereas other parameters are the smallest, indicating that more carbonate was dissolved (Figure 8e,i). Thus, cluster A has high TDS, high Ca2+ and SO42−, cluster B is medium TDS, and high Na+ and Cl−, and cluster C has low TDS and high HCO3−.
Comparison of the TDS, Ca2+, SO42−, and HCO3− contents in the three clusters of water samples show that TDS, Ca2+, and SO42− gradually decrease, whereas HCO3− gradually increases. According to the dissolution order of anions in crustal rocks (Cl− > SO42− > HCO3−), and combined with the hydrochemical characteristics of the salty hot spring (Cl-Na type, TDS of 13.37 g/L) in Wenquanzhenn, eastern Sichuan basin, which is formed in the same geothermal reservoir [3], the geothermal groundwater in the study area (SO4-Ca type) is undergoing gradual desalination, but it has not yet reached the stage of ‘fresh water’ dominated by HCO3−.
4.2.2. Factor Analysis
The correlation coefficient matrix is the basis of factor analysis. Table 2 illustrates the statistics of correlation among the hydrochemical parameters of hot water in the study area. There is a significant correlation among SO42−, Cl−, Ca2+, Mg2+, Na+ and TDS (correlation coefficients are greater than 0.7), which indicates that there is information overlap among variables, and data dimensionality reduction analysis is needed.
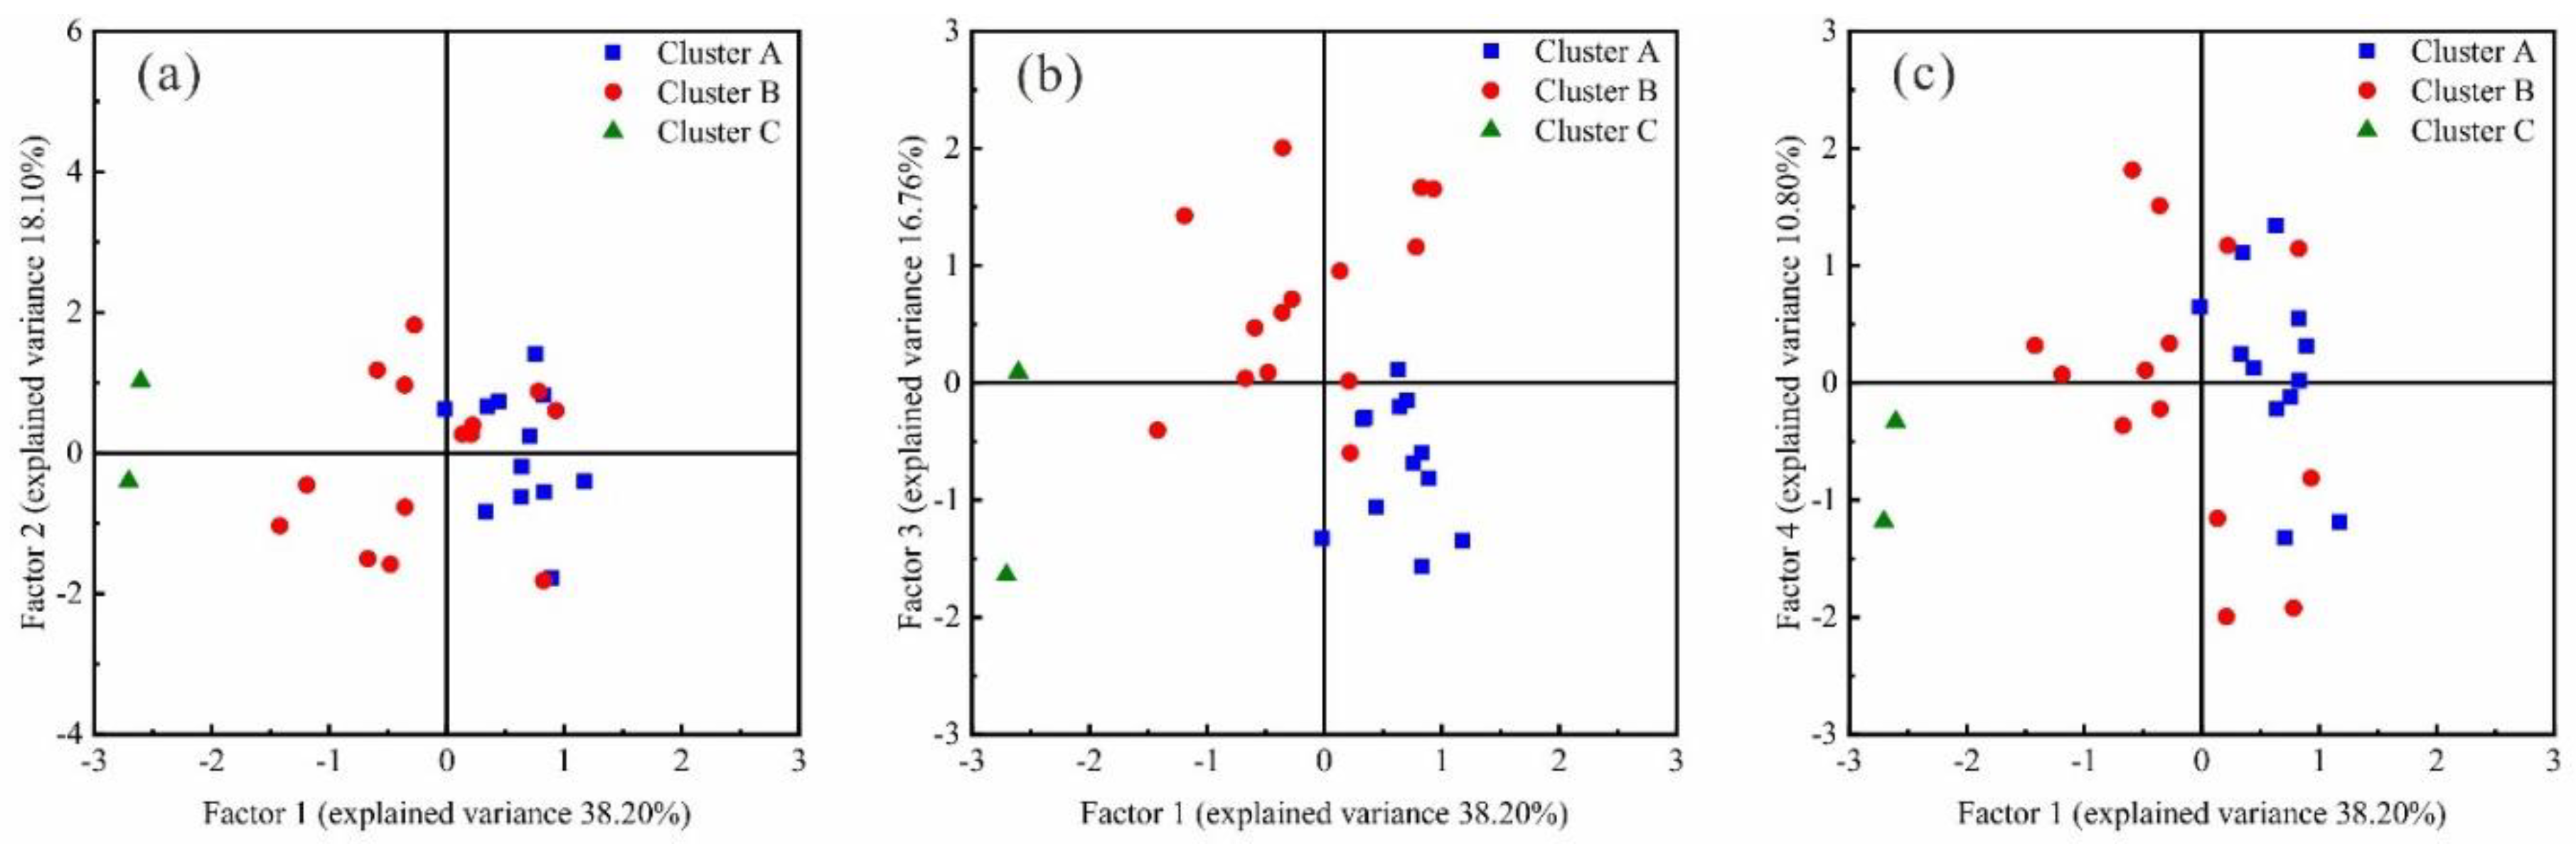
PCA is used to extract the eigenvalues from physico-chemical parameters of the 28 water samples in the study area. The eigenvalues of the extracted factors, their percentage of variance, and cumulative percentage of variance of the hydrochemical parameters are presented in Table 3. In particular, four factors are extracted based on the Kaiser criterion, which explain 83.86% of the total variance. These are considered to reflect the basic information of the original data. The loadings for varimax rotated factor matrix in the four factors model are compiled in Table 4. It is considered that the corresponding hydrochemical components are closely related to the hydrogeochemical processes represented by the factor when the absolute value of factor loading is more than 0.5 (marked in bold). The scores of each factor reflecting the degree of influence on each water sample are calculated, and the scatter plots of factor scores are drawn (Figure 9).
Factor 1 has the largest proportion of total variance (38.2%) with high positive loadings for SO42 (0.98), Ca2+ (0.95), Mg2+ (0.88), and TDS (0.98) (Table 4). The high value points of factor 1 scores are mostly from cluster A, indicating that in this cluster is greatly affected by Factor 1 (Figure 9a). The scores of samples corresponding to Factor 1 gradually decrease in the three clusters, implying that the effects of Factor 1 are gradually weakened. There is a good linear correlation between SO42 and Ca2+ in the geothermal water (R2 = 0.92, Figure 10a), indicating that the dissolution of gypsum and anhydrite in the T1j2 and T2l rocks is the main source of these components. Figure 10a shows that the trend lines of SO42 and Ca2+ lie below the dissolution line of CaSO4, demonstrates that other hydrogeochemical processes have increased the SO42− contents. The lithology suggests that the dissolution of the coal-bearing formation (pyrite and marcasite) in T3xj may increase the SO42 content in the groundwater [53]. The values of Ca2+/HCO3− and (Ca2+ + Mg2+)/HCO3− are much greater than 1 (Figure 10b,c), suggesting that the dissolution of carbonate rocks is not the main source of Ca2+ and Mg2+. The dissolution of gypsum also increases the content of Ca2+ in the hot water and inhibits the dissolution of carbonate rocks due to the common ion effect, consistent with the negative factor loading of HCO3− (−0.57). Mg2+ may originate from the dissolution of magnesium sulfate minerals in the geothermal reservoirs, indicated by the relatively good correlation between Mg2+ and SO42 (R2 = 0.69) (Figure 10d). Factor 1 therefore, reflects the dissolution of gypsum and anhydrite, magnesium sulfate minerals and pyrite-bearing formation rocks.
Factor 2, accounting for 18.1% of the total variance, contains HCO3−, T and SiO2 with positive loadings of 0.6, 0.78 and 0.86, respectively. The high points are uniformly distributed, corresponding to the relative consistency of the influence of this factor (Figure 9a). As one of the characteristic components of geothermal water, SiO2 has a good correlation with temperature (Table 2), and SiO2 geothermometers are widely used to estimate the temperature of reservoirs waters. The positive loadings for HCO3− and SiO2 indicate that the increasing SiO2 content of geothermal waters may promote an increase in HCO3− concentration. Factor 2 reflects the dissolution of quartz or chalcedony and other silicates.
Factor 3, with high positive loadings for Cl− (0.89) and Na+ (0.93), accounts for 16.76% of the total variance. The high value points of the scores are mainly from cluster B, which shows that these water samples are greatly affected this factor (Figure 9b). The ionic ratios of Cl− and Na+ (Figure 10e) show that most of the water falls above the dissolution line for halite, indicating that Na+ has other sources apart from the dissolution of halite. The ratio of (Ca2+ + Mg2+)/(SO42− + HCO3−) is close to 1 (Figure 10f), suggesting that the dissolution of dolomite, calcite, gypsum, and anhydrite is responsible for the production of Ca2+, Mg2+, SO42− and HCO3−, thus eliminating the cation exchange between Na+, Ca2+, and Mg2+ [50,54,55]. The incongruent dissolution of albite may contribute to the excess Na+. Thus, Factor 3 reflects the dissolution of halite and albite.
Factor 4 corresponds to a variance portion of 10.8% with positive loadings for pH (0.62) and K+ (0.76). The high value points of the scores are mainly from clusters A and B, and the trend is similar to that of Factor 1. The Factor 4 score gradually decreases from cluster A to cluster C, indicating that the influence of this factor gradually weakens. The lithology and factor analyses results indicate that the main source of K+ is in dissolution of silicate rocks (K-feldspar). Thus, Factor 4 therefore reflects the dissolution of K-feldspar related to pH.
4.3. Geochemical Modelling
4.3.1. Saturation Index
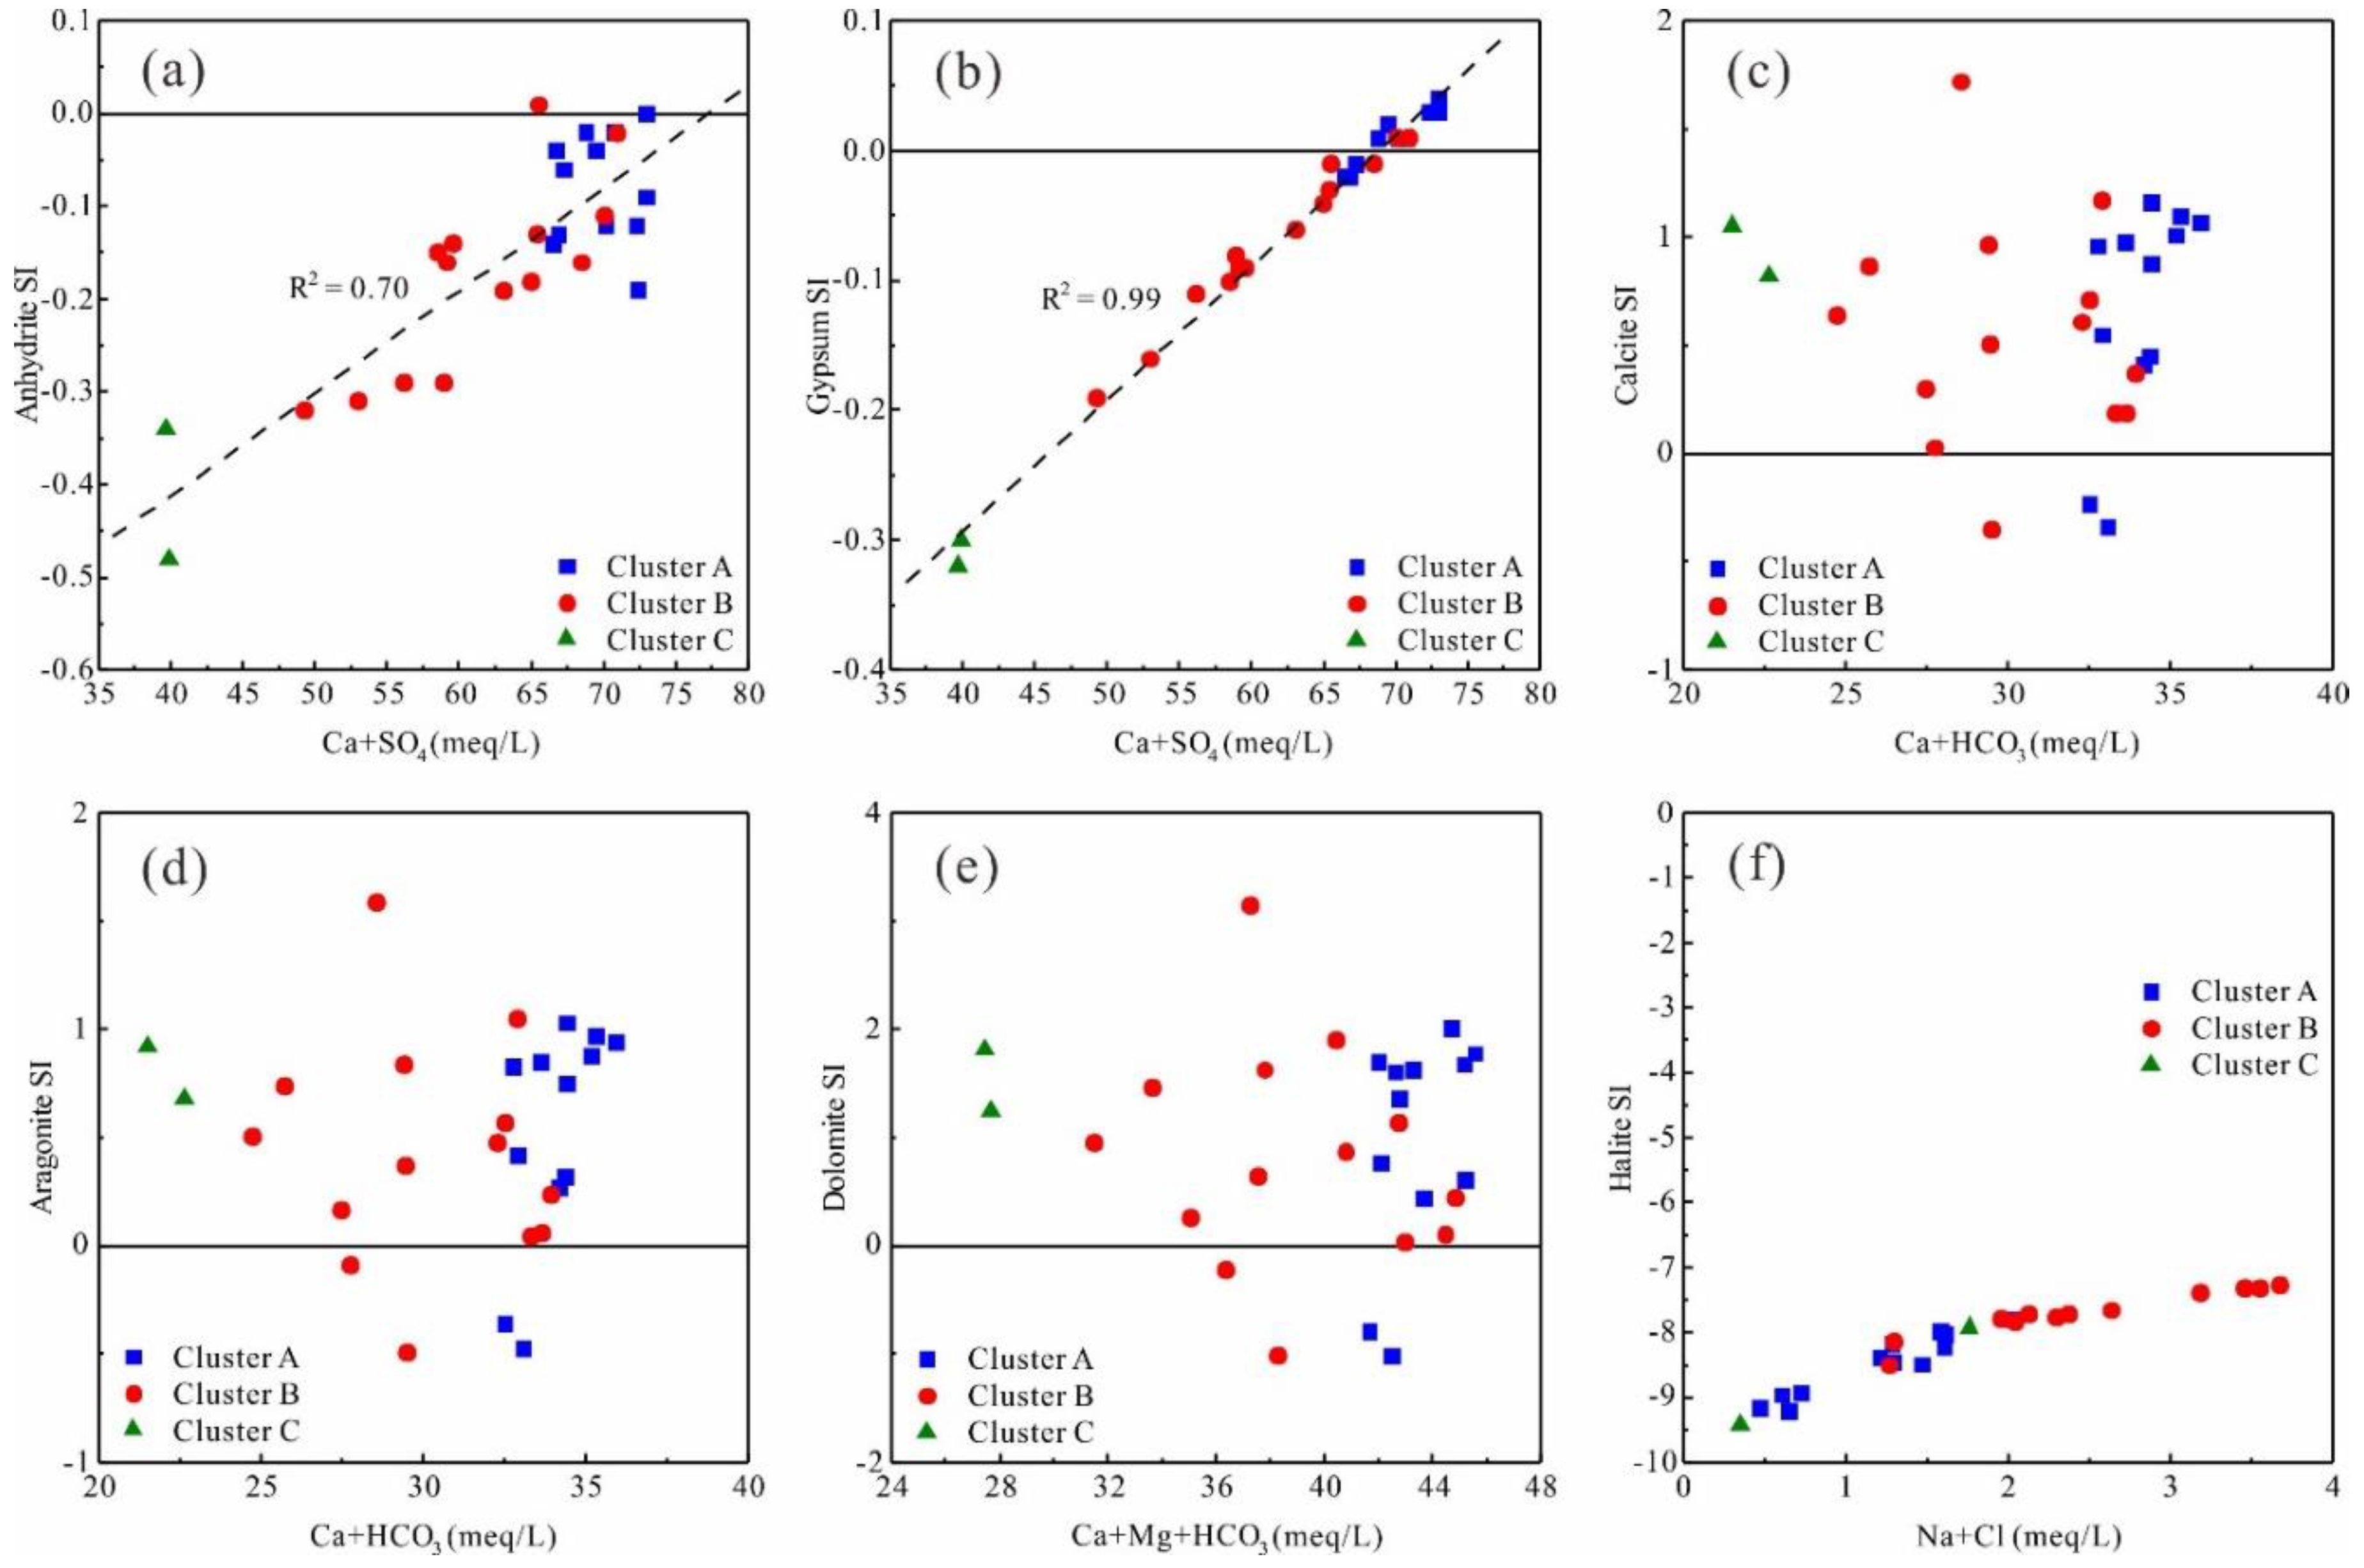
The saturation index is an important measure, evaluating the equilibrium between water and minerals. Characteristics variation can be used to differentiate the stages of hydrochemical evolution and identify the main water-rock interactions controlling the process. The saturation indices of the 28 water samples and minerals in the study were calculated using PHREEQC software and are presented in Table S3. The results show that in all samples the saturation index of quartz is greater than 0 (0.04–0.62), with an average of 0.35, and that for chalcedony is also close to 0, with an average value of −0.024 (−0.32–0.24). Compared to quartz, chalcedony is closest to the saturation state, indicating that chalcedony most likely controls the SiO2 content of the water. Except for W16-1 and W9-1, the saturation index of anhydrite for the water samples is less than 0 (Figure 11a), and thus gypsum is undersaturated for most of the samples (Figure 11b). Anhydrite and gypsum are well-correlated with (Ca2+ + SO42−) (R2 is 0.70 and 0.99, respectively), indicating that the dissolution of suplhate minerals is the main source of Ca2+ and SO42−. Calcite and dolomite are both supersaturated in most of the water samples (Figure 11c–e), confirming that the dissolution of carbonates is limited by the increase in the Ca2+ content of the water due to the dissolution of gypsum. Halite is undersaturated in the water samples, and its saturation index is positively correlated with (Na+ + Cl−) (Figure 11f), indicating that the dissolution of halite controls the content of both of these.
4.3.2. Reverse Modelling of Hydrochemical Pathways
Determination of the modelling path: The genetic model of the thermal groundwater in the Chongqing area is summarized as follows [4,29]: Groundwater receives recharge from precipitation in areas of outcrop of carbonate rocks in the cores of the anticlines. The cool water flows through these rocks along the flanks of the anticlines to deeper areas. After being heated by the geothermal heat flow, the hot water rises and issues in the form of hot springs at low points in the topography at the middle or the plunging ends of the anticlines, appearing in wells in the flanks of the structures. Rainwater (RW) was selected as the initial water for the reverse modelling in this study, with composition taken from the average of nine rainfall events from 2009 to 2011 in the Beibei District of northwest Chongqing [56]. The average values of the three groups obtained by cluster analysis are used as the final water. Three modelling paths are selected: defining the evolution of rainwater to Clusters A, B, and C.
Determination of possible mineral phases: The dissolution and precipitation of calcite, dolomite and gypsum in the geothermal reservoir controls the proportions of Ca2+, Mg2+, SO42− and HCO3− in the geothermal waters. Changes in Cl− and Na+ concentrations are attributed to the dissolution of halite, and the incongruent dissolution of albite may be another source of Na+. The dissolution of K-feldspar and chalcedony may explain changes in K+ and SiO2 content, respectively. Changes in dissolution and evasion of CO2 may also occur as the waters evolve. Calcite, dolomite, gypsum, halite, albite, K-feldspar, chalcedony, kaolinite, CO2, and water were selected as reaction phases, and the mineral transfers obtained by inverse modelling using PHREEQC are shown in Table 5.
Discussion of modelling results: Results show that similar hydrochemical reactions took place in the three reaction paths. Albite, dolomite, gypsum, halite, K-feldspar, and CO2 all dissolve and enter the hot water whereas calcite, chalcedony and kaolinite all precipitate. The implied dissolution reactions are shown in Table 6. As an example, the strongest dissolution of gypsum, 19.57 mmol/L, occurs in Model 1 and as a result, the proportions of Ca2+ and SO42− in the groundwater increase significantly, by 624.01 and 1820.6 mg/L, respectively, and become the dominant ions. The dissolution of dolomite and CO2 are reflected in values of 4.645 and 2.059 mmol/L, respectively. The dissolution of dolomite contributes Mg2+ and HCO3− to the water whereas calcite precipitates (−8.519 mmol/L). The dissolution of halite is 0.3196 mmol/L, increasing the concentrations of Na+ and Cl− in the water, and the dissolution of albite (0.5746 mmol/L) is an important additional source of Na+. The change in K+ concentration is mainly attributed to the dissolution of K-feldspar (0.5719 mmol/L). Model 1 shows that kaolinite precipitates (−0.5733 mmol/L), mainly as a result of dissolution of albite and K-feldspar (Table 5). Modelling results also show the precipitation of chalcedony, contrary to the results of the dissolution of chalcedony noted above. This is because only the mass balance of Si is taken into account in the modelling and the precipitation condition of SiO2 (reaching the solubility of amorphous SiO2) is neglected. The dissolution of both albite and K-feldspar increase the content of HCO3− in the groundwater, consistent with the results of factor analysis.
Comparison of the amount of minerals dissolved in the three reaction pathways indicates that the dissolution of gypsum gradually decreases, from Model 1 to Model 3 (19.57 mmol/L, 17.18 mmol/L and 10.42 mmol/L), consistent with the decreasing trend in concentrations of Ca2+ and SO42− from cluster A to cluster C. The dissolution of dolomite also decreases, resulting in a decrease in HCO3− in the water. The dissolution of CO2 and silicate minerals and the precipitation of calcite leads to an increase in HCO3−, producing a gradual increase in concentrations in the three clusters. The dissolution of K-feldspar decreases from Model 1 to Model 2, whereas halite and albite show increasing trends with a significantly increasing dissolution of halite resulting in the concentration of Na+ in cluster B, significantly greater than that in cluster A. However, the dissolution of halite and albite gradually decreases from Model 2 to Model 3. In summary, the dissolution of mineral phases in the Chongqing geothermal groundwater gradually decreases as it evolves. Compared to the hydrochemical characteristics of the salty hot spring (Cl-Na type, TDS of 13.37 g/L) in Wenquanzhenn, eastern Sichuan basin, which is formed in the same geothermal reservoir [3], the hot water is in the stage of desalination, but has not reached the stage of fresh water dominated by HCO3−.
5. Conclusions
The distribution and characteristics of the thermal groundwaters in Chongqing are strongly controlled by the anticlinal structures in the area. The pH of the water ranges from 6.2 to 8.5, and this low-to-middle temperature hot water (32.9–57 °C) shows a slight cooling with time (2009–2016) most likely influenced by their degree of development and utilization. The groundwater is of SO4-Ca type with the TDS ranging from 1620 to 2929 mg/L. It can be conjectured that for highly exploited hot waters, TDS gradually decreases; whereas less exploited waters show an increase. The major ions are Ca2+, Mg2+, SO42−, and HCO3−, but waters are poor in Na+, K+, and Cl−, with only trace amounts of SiO2. Both Li+ and Sr2+ are relatively abundant in the hot water. The three clusters of water samples are summarized using hierarchical clustering analysis (HCA): high TDS-high Ca2+ and SO42− water (cluster A); medium TDS-high Na+ and Cl− water (cluster B); low TDS-high HCO3− water (cluster C), respectively.
Combined with previous analyses, data provide a clear understanding of the origin and evolution of major ions in the thermal groundwater. Ca2+ and SO42− mainly derive from the dissolution of gypsum and anhydrite in the Triassic rocks but, in addition, SO42− also increases by dissolution of pyrite in coal-bearing deposits. Mg2+ may be derived from the dissolution of magnesium sulfate minerals (epsomite) in the reservoir, resulting in the relatively good correlation between Mg2+ and SO42− (R2 = 0.69). Although calcite is precipitated, the dissolution of dolomite and CO2 are the main sources of HCO3−, and the dissolution of dolomite also releases Mg2+ into the hot water. The dissolution of halite is the main cause of the increase in Na+ and Cl−. The dissolution of CO2 promotes the dissolution of albite and K-feldspar, adding Na+ and K+ to the water. The saturation index shows that the characteristic component (SiO2) of the water is controlled by the dissolution of chalcedony. Taking the rainwater of the northwest of the study area as the initial water and three clusters of water samples as the final water the hydrochemical pathway modelling, quantitatively analyzes the water-rock interaction during the evolution of the water. Comparing the mineral transfers in the three models, it is found that—except for halite and albite in Model 2—the dissolution of all minerals decreases. Combined with the hydrochemical characteristics of hot water in the same reservoir in the adjacent area (Cl-Na type, TDS of 13.37 g/L), we believe that the thermal groundwater in Chongqing is in the stage of desalination, but it has not yet reached the stage of fresh water dominated by HCO3−.
In this paper, traditional graphic methods, multivariate statistics and hydrogeochemical modelling are used to discuss the hydrochemical characteristics, source and evolution of dissolved components in the thermal groundwaters of the Triassic carbonates in Chongqing, China. Distribution of the waters is controlled by anticlines and the study provides a deeper and more comprehensive knowledge for the genesis mechanism and evolution trend of SO4-Ca type water in carbonate reservoirs in an exploiting environment.
Supplementary Materials
The following are available online at https://www.mdpi.com/2073-4441/12/4/1194/s1, Table S1: Analytical results of hydrochemistry, Table S2: Descriptive statistical analyses of hydrochemical parameters (in mg/L except T and pH), Table S3: Saturation index of multiple minerals in the hot water samples.
Author Contributions
Conceptualization, M.T. and X.Z.; funding acquisition, X.Z.; investigation, M.T., X.Z., J.G., X.W., Y.W., and Y.X.; visualization, M.T.; writing—original draft preparation, M.T.; writing—review and editing, M.T. and X.Z. All authors (M.T., X.Z., J.G., X.W., Y.W., and Y.X.) have read and agreed to the published version of the manuscript.
Funding
This work was funded by the National Natural Science Foundation of China (41572223, 41772261).
Conflicts of Interest
The authors declare no conflict of interest.
References
- Zhou, X.; Cao, Q.; Yin, F.; Guo, J.; Wang, X.; Zhang, Y.; Shen, Y. Characteristics of the brines and hot in the high and steep fold zone springs in the Triassic carbonates of the Eastern Sichuan Basin. Acta Geol. Sin. 2015, 89, 1908–1920. (In Chinese) [Google Scholar]
- Zhou, X.; Wang, X.; Han, J.; Cao, Q.; Jiang, C.; Guo, J.; Zhou, H. Evolution of the Subsurface K-Rich Brines in the Triassic Carbonates in the Sichuan Basin of China. Groundwater 2017, 56, 832–843. [Google Scholar] [CrossRef]
- Guo, J.; Zhou, X.; Wang, L.; Zhang, Y.; Shen, X.; Zhou, H.; Ye, S.; Fang, B. Hydrogeochemical characteristics and sources of salinity of the springs near Wenquanzhen in the eastern Sichuan Basin, China. Hydrogeol. J. 2017, 26, 1–15. [Google Scholar] [CrossRef]
- Ta, M.; Zhou, X.; Guo, J.; Wang, X.; Wang, Y.; Xu, Z. Occurrence and formation of the hot springs and thermal groundwater in Chongqing. Hydrogeol. Eng. Geol. 2018, 45, 165–172. (In Chinese) [Google Scholar]
- Yang, P.; Cheng, Q.; Xie, S.; Wang, J.; Chang, L.; Yu, Q.; Zhan, Z.; Chen, F. Hydrogeochemistry and geothermometry of deep thermal water in the carbonate formation in the main urban area of Chongqing, China. J. Hydrol. 2017, 549, 50–61. [Google Scholar] [CrossRef]
- Xiao, Q.; Shen, L.; Yang, L.; Wu, K.; Wang, P. Environmental significance of carbon and sulfur isotopes of the North hot spring in Chongqing. Hydrogeol. Eng. Geol. 2013, 40, 127–133. (In Chinese) [Google Scholar]
- Bishop, P.K. Chemical and isotopic evidence for hydrogeochemical processes occurring in the Lincolnshire Limestone. J. Hydrol. 1990, 121, 293–320. [Google Scholar] [CrossRef]
- Capecchiacci, F.; Tassi, F.; Vaselli, O.; Bicocchi, G.; Cabassi, J.; Giannini, L.; Nisi, B.; Chiocciora, G. A combined geochemical and isotopic study of the fluids discharged from the Montecatini thermal system (NW Tuscany, Italy). Appl. Geochem. 2015, 59, 33–46. [Google Scholar] [CrossRef] [Green Version]
- Aggarwal, J.K.; Palmer, M.R.; Bullen, T.D.; Arnorsson, S.; Ragnarsdottir, K.V. The boron isotope systematics of Icelandic geothermal waters: 1. Meteoric water charged systems. Geochim. Cosmochim. Acta 2000, 64, 579–585. [Google Scholar] [CrossRef]
- Larsen, D.; Swihart, G.H.; Xiao, Y. Hydrochemistry and isotope composition of springs in the Tecopa basin, southeastern California, USA. Chem. Geol. 2001, 179, 17–35. [Google Scholar] [CrossRef]
- Boschetti, T.; Venturelli, G.; Toscani, L.; Barbieri, M.; Mucchino, C. The Bagni di Lucca thermal waters (Tuscany, Italy): An example of Ca-SO4 waters with high Na/Cl and low Ca/SO4 ratios. J. Hydrol. 2005, 307, 270–293. [Google Scholar] [CrossRef]
- Pasvanoğlu, S. Hydrogeochemical and isotopic investigation of the Bursa-Oylat thermal waters, Turkey. Environ. Earth Sci. 2011, 64, 1157–1167. [Google Scholar] [CrossRef]
- Gibbs, R.J. Mechanisms controlling world water chemistry. Science 1970, 170, 1088–1090. [Google Scholar] [CrossRef] [PubMed]
- Wu, Y.; Gibson, C.E. Mechanisms controlling the water chemistry of small lakes in Northern Ireland. Water Res. 1996, 30, 178–182. [Google Scholar] [CrossRef]
- Wang, H.; Jiang, X.W.; Wan, L.; Han, G.; Guo, H. Hydrogeochemical characterization of groundwater flow systems in the discharge area of a river basin. J. Hydrol. 2015, 527, 433–441. [Google Scholar] [CrossRef]
- Bouzourra, H.; Bouhlila, R.; Elango, L.; Slama, F.; Ouslati, N. Characterization of mechanisms and processes of groundwater salinization in irrigated coastal area using statistics, GIS, and hydrogeochemical investigations. Environ. Sci. Pollut. Res. 2015, 22, 2643–2660. [Google Scholar] [CrossRef]
- Cloutier, V.; Lefebvre, R.; Therrien, R.; Savard, M.M. Multivariate statistical analysis of geochemical data as indicative of the hydrogeochemical evolution of groundwater in a sedimentary rock aquifer system. J. Hydrol. 2008, 353, 294–313. [Google Scholar] [CrossRef]
- Güler, C.; Thyne, G.D.; Mccray, J.E.; Turner, K.A. Evaluation of graphical and multivariate statistical methods for classification of water chemistry data. Hydrogeol. J. 2002, 10, 455–474. [Google Scholar] [CrossRef]
- Ghesquière, O.; Walter, J.; Chesnaux, R.; Rouleau, A. Scenarios of groundwater chemical evolution in a region of the Canadian Shield based on multivariate statistical analysis. J. Hydrol. Reg. Stud. 2015, 4, 246–266. [Google Scholar] [CrossRef] [Green Version]
- Zhang, X.; Guo, Q.; Liu, M.; Luo, J.; Yin, Z.; Zhang, C.; Zhu, M.; Guo, W.; Li, J.; Zhou, C. Hydrogeochemical processes occurring in the hydrothermal systems of the Gonghe-Guide basin, northwestern China: Critical insights from a principal components analysis (PCA). Environ. Earth Sci. 2016, 75, 1187. [Google Scholar] [CrossRef]
- Jia, Z.; Zang, H.; Hobbs, P.; Zheng, X.; Xu, Y.; Wang, K. Application of inverse modeling in a study of the hydrogeochemical evolution of karst groundwater in the Jinci Spring region, northern China. Environ. Earth Sci. 2017, 76, 312. [Google Scholar] [CrossRef]
- Liu, C.W.; Wang, C.J.; Kao, Y.H. Assessing and simulating the major pathway and hydrogeochemical transport of arsenic in the Beitou–Guandu area, Taiwan. Environ. Geochem. Health 2016, 38, 219. [Google Scholar] [CrossRef] [PubMed]
- Lu, H.Y.; Peng, T.R.; Liou, T.S. Identification of the origin of salinization in groundwater using multivariate statistical analysis and geochemical modeling: A case study of Kaohsiung, Southwest Taiwan. Environ. Geol. 2008, 55, 39–352. [Google Scholar] [CrossRef]
- Grasby, S.E.; Hutcheon, I.; Krouse, H.R. The influence of water-rock interaction on the chemistry of thermal springs in western Canada. Appl. Geochem. 2000, 15, 439–454. [Google Scholar] [CrossRef]
- Güler, C.; Thyne, G.D. Hydrologic and geologic factors controlling surface and groundwater chemistry in Indian Wells-Owens Valley area, southeastern California, USA. J. Hydrol. 2004, 285, 177–198. [Google Scholar] [CrossRef]
- Raju, N.J.; Patel, P.; Reddy, B.C.S.R.; Suresh, U.; Reddy, T.V.K. Identifying source and evaluation of hydrogeochemical processes in the hard rock aquifer system: Geostatistical analysis and geochemical modeling techniques. Environ. Earth Sci. 2016, 75, 1157. [Google Scholar] [CrossRef]
- Liu, J.; Zhu, X.; Wang, S.; Wei, J. Geologic-tectonic evolutional characteristics and prospecting potential for ISL-amenable sandstone-type uranium deposits in Sichuan basin. Uranium Geol. 2005, 21, 321–330. (In Chinese) [Google Scholar]
- Cui, X. The Genetic Model of Hot Spring in Western Sichuan Basin China. Master’s Thesis, Chengdu University of Technology, Chengdu, China, 2014. (In Chinese). [Google Scholar]
- Luo, X. Formation and characteristics of the geothermal spring in Tongjing scenic spot, North Chongqing district, Chongqing city. Carsologica Sin. 2000, 19, 159–163. (In Chinese) [Google Scholar]
- Yu, Q. Study on the Reservoir Temperature and Scaling of Borehole Geothermal Water of Carbonate Rocks in Chongqing. Master’s Thesis, Southwest University, Chongqing, China, 2017. [Google Scholar]
- Singh, K.P.; Amrita, M.; Dinesh, M.; Sarita, S. Multivariate statistical techniques for the evaluation of spatial and temporal variations in water quality of Gomti River (India)—A case study. Water Res. 2004, 38, 3980–3992. [Google Scholar] [CrossRef]
- Helstrup, T.; Jørgensen, N.O.; Banoeng-Yakubo, B. Investigation of hydrochemical characteristics of groundwater from the Cretaceous-Eocene limestone aquifer in southern Ghana and southern Togo using hierarchical cluster analysis. Hydrogeol. J. 2007, 15, 977–989. [Google Scholar] [CrossRef]
- Obeidat, M.M.; Awawdeh, M.; Al-Rub, F.A. Multivariate statistical analysis and environmental isotopes of Amman/Wadi Sir (B2/A7) groundwater, Yarmouk River Basin, Jordan. Hydrol. Process. 2013, 27, 2449–2461. [Google Scholar] [CrossRef]
- Belkhiri, L.; Boudoukha, A.; Mouni, L.; Baouz, T. Application of multivariate statistical methods and inverse geochemical modeling for characterization of groundwater—A case study: Ain Azel plain (Algeria). Geoderma 2010, 159, 390–398. [Google Scholar] [CrossRef]
- Oueslati, O.; De Girolamo, A.M.; Abouabdillah, A.; Kjeldsen, T.R.; Lo Porto, A. Classifying the flow regimes of Mediterranean streams using multivariate analysis. Hydrol. Process. 2015, 29, 4666–4682. [Google Scholar] [CrossRef]
- Lindsey, C.R.; Neupane, G.; Spycher, N.; Fairley, J.P.; Dobson, P.; Wood, T.; Mcling, T.; Conrad, M. Cluster analysis as a tool for evaluating the exploration potential of Known Geothermal Resource Areas. Geothermics 2018, 72, 358–370. [Google Scholar] [CrossRef]
- Daughney, C.J.; Raiber, M.; Moreau-Fournier, M.; Morgenstern, U.; van der Raaij, R. Use of hierarchical cluster analysis to assess the representativeness of a baseline groundwater quality monitoring network: Comparison of New Zealand’s national and regional groundwater monitoring programs. Hydrogeol. J. 2012, 20, 185–200. [Google Scholar] [CrossRef]
- Rissmann, C.; Leybourne, M.; Benn, C.; Christenson, B. The origin of solutes within the groundwaters of a high Andean aquifer. Chem. Geol. 2015, 396, 164–181. [Google Scholar] [CrossRef]
- Ward, J.H. Hierarchical Grouping to Optimize an Objective Function. Publ. Am. Stat. Assoc. 1963, 58, 236–244. [Google Scholar] [CrossRef]
- Kim, J.H.; Kim, R.H.; Lee, J.; Cheong, T.J.; Yum, B.W.; Chang, H.W. Multivariate statistical analysis to identify the major factors governing groundwater quality in the coastal area of Kimje, South Korea. Hydrol. Process. 2005, 19, 1261–1276. [Google Scholar] [CrossRef]
- Suk, H.; Lee, K.K. Characterization of a ground water hydrochemical system through multivariate analysis: Clustering into ground water zones. Groundwater 2010, 37, 358–366. [Google Scholar] [CrossRef]
- Yidana, S.M. Groundwater classification using multivariate statistical methods: Southern Ghana. J. Afr. Earth Sci. 2010, 57, 455–469. [Google Scholar] [CrossRef]
- Alberto, W.D.; Del Pilar, D.M.; Valeria, A.M.; Fabiana, P.S.; Cecilia, H.A.; Bm, D.L.A. Pattern Recognition Techniques for the Evaluation of Spatial and Temporal Variations in Water Quality. A Case Study: Suquía River Basin (Córdoba–Argentina). Water Res. 2001, 35, 2881–2894. [Google Scholar] [CrossRef]
- Kaiser, H.F. The varimax criterion for analytic rotation in factor analysis. Psychometrika 1958, 23, 187–200. [Google Scholar] [CrossRef]
- Dassi, L. Investigation by multivariate analysis of groundwater composition in a multilayer aquifer system from North Africa: A multi-tracer approach. Appl. Geochem. 2011, 26, 1386–1398. [Google Scholar] [CrossRef]
- Sundaray, S.K.; Panda, U.C.; Nayak, B.B.; Bhatta, D. Multivariate statistical techniques for the evaluation of spatial and temporal variations in water quality of the Mahanadi river–estuarine system (India)—A case study. Environ. Geochem. Health 2006, 28, 317–330. [Google Scholar] [CrossRef]
- Mondal, N.C.; Singh, V.P.; Singh, V.S.; Saxena, V.K. Determining the interaction between groundwater and saline water through groundwater major ions chemistry. J. Hydrol. 2010, 388, 100–111. [Google Scholar] [CrossRef]
- Rodríguez, M.; Sfer, A.; Sales, A. Application of chemometrics to hydrochemical parameters and hydrogeochemical modeling of Calera River basin in the Northwest of Argentina. Environ. Earth Sci. 2016, 75, 1–12. [Google Scholar] [CrossRef]
- Bozau, E.; Häußler, S.; Berk, W.V. Hydrogeochemical modelling of corrosion effects and barite scaling in deep geothermal wells of the North German Basin using PHREEQC and PHAST. Geothermics 2015, 53, 540–547. [Google Scholar] [CrossRef]
- Han, Y.; Wang, G.; Iii, C.A.C.; Hu, W.; Bian, Y.; Zhang, Z.; Liu, Y. Hydrogeochemical evolution of Ordovician limestone groundwater in Yanzhou, North China. Hydrol. Process. 2013, 27, 2247–2257. [Google Scholar] [CrossRef]
- Parkhurst, D.L.; Appelo, C.A.J. User’s Guide to PHREEQC (Version 2)—A Computer Program for Speciation, Batch-Reaction, One-Dimensional Transport, and Inverse Geochemical Calculations. Water-Resour. Investig. Rep. 1999, 99, 312. [Google Scholar]
- Pavlovskiy, I.; Selle, B. Integrating hydrogeochemical, hydrogeological, and environmental tracer data to understand groundwater flow for a karstified aquifer system. Groundwater 2015, 53, 156–165. [Google Scholar] [CrossRef]
- Xiao, Q.; Jiang, Y.; Shen, L.; Yuan, D. Origin of calcium sulfate-type water in the Triassic carbonate thermal water system in Chongqing, China: A chemical and isotopic reconnaissance. Appl. Geochem. 2018, 89, 49–58. [Google Scholar] [CrossRef]
- Wang, P.; Yu, J.; Zhang, Y.; Liu, C. Groundwater recharge and hydrogeochemical evolution in the Ejina Basin, northwest China. J. Hydrol. 2013, 476, 72–86. [Google Scholar] [CrossRef]
- He, J.; Ma, J.; Zhang, P.; Tian, L.; Zhu, G.; Edmunds, W.M.; Zhang, Q. Groundwater recharge environments and hydrogeochemical evolution in the Jiuquan Basin, Northwest China. Appl. Geochem. 2012, 27, 866–878. [Google Scholar] [CrossRef]
- Guo, P.; Wang, Y.; Wang, Y.; Wang, R.; Hu, B.; Tang, X. Preliminary study of the chemical properties of broad-leaved forest under acid deposition in Jinyun mountain. J. Soil Water Conserv. 2012, 26, 235–238. (In Chinese) [Google Scholar]
Figure 1.
(a) Location of the Sichuan Basin; (b) Location of the study area; (c) Geology and sample locations of the study area. Legend: 1. Quartz sandstones of the Upper Jurassic Penglaizhen Group; 2. Sandy mudstones of the Upper Jurassic Suining Group; 3. Sandy mudstones of the Middle Jurassic Shangshaximiao Group; 4. Shale and sandy mudstones of the Middle Jurassic Xiashangshaximiao Group; 5. Mudstone of the Lower and Middle Jurassic; 6. Feldspathic detritus quartz sandstone of the Upper Triassic Xujiahe Group; 7. Dolomite of the Middle Triassic Leikoupo Group; 8. Limestones of the Lower Triassic Jialingjiang and Middle Triassic Leikoupo Groups; 9. Limestones of the Lower Triassic Jialingjiang Group; 10. Marls of the Lower Triassic Feixianguan Group; 11. Chert nodule limestone of the Upper Permian; 12. River; 13. Hot spring; 14. Geothermal well.

Figure 2.
Stratigraphic column of the formations that outcropping formations in the study area.

Figure 3.
Geological cross-section along line A–B in Figure 1. (approximate vertical exaggeration = 2.5). Legend: 1. Limestone; 2. Mudstone; 3. Shale; 4. Dolomite; 5. Marl; 6. Arenaceous mudstone; 7. Arkose; 8. Feldspathic quartz arenite; 9. Chert nodule limestone; 10. Coal layer.
Figure 3.
Geological cross-section along line A–B in Figure 1. (approximate vertical exaggeration = 2.5). Legend: 1. Limestone; 2. Mudstone; 3. Shale; 4. Dolomite; 5. Marl; 6. Arenaceous mudstone; 7. Arkose; 8. Feldspathic quartz arenite; 9. Chert nodule limestone; 10. Coal layer.

Figure 4.
Changes in (a) Total Dissolved Solids (TDS) and (b) T in the water samples between 2009 and 2016.
Figure 4.
Changes in (a) Total Dissolved Solids (TDS) and (b) T in the water samples between 2009 and 2016.

Figure 5.
Gibbs diagram of thermal groundwater in the study area: (a) TDS vs. Na+/(Na+ + Ca2+), (b) TDS vs. Cl−/(Cl− + HCO3−).
Figure 5.
Gibbs diagram of thermal groundwater in the study area: (a) TDS vs. Na+/(Na+ + Ca2+), (b) TDS vs. Cl−/(Cl− + HCO3−).

Figure 6.
Dendrogram of Q-model hierarchical cluster analysis (HCA) including all water samples.

Figure 7.
Piper diagram of the thermal groundwater samples.

Figure 8.
Box and whisker plots of concentrations of the major constituents, TDS and pH of the hot water samples of clusters A, B, and C: (a) for K+; (b) for Na+; (c) for Ca2+; (d) for Mg2+; (e) for HCO3−; (f) for SO42−; (g) for Cl−; (h) for TDS; (i) for pH. The boxes show the upper quartile, the median and the lower quartile. The smallest and largest values are indicated by the small horizontal bars at the end of the whiskers. ■ Represents mean values; ● Represents outlier values.

Figure 9.
Scatter plots of factor scores: (a) Factor 1 vs. Factor 2; (b) Factor 1 vs. Factor 3; (c) Factor 1 vs. Factor 4.
Figure 9.
Scatter plots of factor scores: (a) Factor 1 vs. Factor 2; (b) Factor 1 vs. Factor 3; (c) Factor 1 vs. Factor 4.

Figure 10.
Plots of ions ratios in the hot water samples: (a) SO42− vs. Ca2+; (b) HCO3− vs. Ca2+; (c) HCO3− vs. (Ca2+ + Mg2+); (d) SO42− vs. Mg2+, (e) Cl− vs. Na+; (f) (SO42− + HCO3−) vs. (Ca2+ + Mg2+).
Figure 10.
Plots of ions ratios in the hot water samples: (a) SO42− vs. Ca2+; (b) HCO3− vs. Ca2+; (c) HCO3− vs. (Ca2+ + Mg2+); (d) SO42− vs. Mg2+, (e) Cl− vs. Na+; (f) (SO42− + HCO3−) vs. (Ca2+ + Mg2+).

Figure 11.
The relationship of (a) (Ca2+ + SO42−) vs. anhydrite SI; (b) (Ca2+ + SO42−) vs. gypsum SI, (c) (Ca2+ + HCO3−) vs. calcite SI; (d) (Ca2+ + HCO3−) vs. aragonite SI; (e) (Ca2+ + Mg2+ + HCO3−) vs. dolomite SI; (f) (Na+ + Cl−) vs. halite SI.
Figure 11.
The relationship of (a) (Ca2+ + SO42−) vs. anhydrite SI; (b) (Ca2+ + SO42−) vs. gypsum SI, (c) (Ca2+ + HCO3−) vs. calcite SI; (d) (Ca2+ + HCO3−) vs. aragonite SI; (e) (Ca2+ + Mg2+ + HCO3−) vs. dolomite SI; (f) (Na+ + Cl−) vs. halite SI.


Table 1.
Average and standard deviation of hydrochemical parameters for three clusters water samples (in mg/L except T and pH).
Table 1.
Average and standard deviation of hydrochemical parameters for three clusters water samples (in mg/L except T and pH).
| Parameter | Cluster | |||||
|---|---|---|---|---|---|---|
| A | B | C | ||||
| Mean | SD | Mean | SD | Mean | SD | |
| T | 45.7 | 6.0 | 44.0 | 6.4 | 44.5 | 10.6 |
| pH | 7.3 | 0.5 | 7.2 | 0.5 | 7.6 | 0.1 |
| K+ | 22.3 | 6.1 | 20.3 | 8.6 | 6.6 | 3.1 |
| Na+ | 20.5 | 8.0 | 37.0 | 11.6 | 17.1 | 15.2 |
| Ca2+ | 627.4 | 20.9 | 546.4 | 60.6 | 368.8 | 14.8 |
| Mg2+ | 112.6 | 12.6 | 105.1 | 14.9 | 66.1 | 7.8 |
| Cl− | 11.3 | 8.7 | 36.0 | 17.2 | 11.2 | 12.0 |
| SO42− | 1841.6 | 81.5 | 1645.3 | 167.8 | 1024.0 | 26.8 |
| HCO3− | 163.6 | 12.7 | 167.6 | 24.5 | 221.6 | 2.9 |
| SiO2 | 27.4 | 6.4 | 27.1 | 9.3 | 25.4 | 3.5 |
| TDS | 2789.3 | 96.0 | 2559.4 | 244.3 | 1665.0 | 63.6 |
Table 2.
Correlation coefficient matrix among the physico-chemical variables of the thermal groundwater.
Table 2.
Correlation coefficient matrix among the physico-chemical variables of the thermal groundwater.
| Parameters | T | pH | K+ | Na+ | Ca2+ | Mg2+ | Cl− | SO42− | HCO3− | SiO2 | TDS |
|---|---|---|---|---|---|---|---|---|---|---|---|
| T | 1.00 | ||||||||||
| pH | 0.18 | 1.00 | |||||||||
| K+ | 0.02 | 0.07 | 1.00 | ||||||||
| Na+ | 0.29 | −0.16 | 0.05 | 1.00 | |||||||
| Ca2+ | 0.16 | −0.13 | 0.41 * | −0.04 | 1.00 | ||||||
| Mg2+ | 0.05 | −0.24 | 0.15 | 0.22 | 0.75 ** | 1.00 | |||||
| Cl− | −0.20 | −0.24 | −0.08 | 0.70 ** | −0.12 | 0.19 | 1.00 | ||||
| SO42− | 0.12 | −0.19 | 0.38 * | 0.07 | 0.96 ** | 0.84 ** | −0.03 | 1.00 | |||
| HCO3− | 0.18 | 0.24 | −0.48 ** | −0.03 | −0.46 * | −0.49 ** | −0.35 | −0.51 ** | 1.00 | ||
| SiO2 | 0.50 ** | 0.09 | 0.03 | 0.14 | 0.18 | 0.18 | −0.33 | 0.17 | 0.45 * | 1.00 | |
| TDS | 0.13 | −0.19 | 0.40 * | 0.15 | 0.95 ** | 0.86 ** | 0.04 | 0.99 ** | −0.51 ** | 0.19 | 1.00 |
*. Correlation is significant at the 0.05 level (two-tailed). **. Correlation is significant at the 0.01 level (two-tailed).
Table 3.
Eigenvalues and percent of variance for the factor analysis of the physico-chemical parameters.
Table 3.
Eigenvalues and percent of variance for the factor analysis of the physico-chemical parameters.
| Factor | Initial Eigenvalues | Rotation Sums of Squared Loadings | ||||
|---|---|---|---|---|---|---|
| Eigenvalue | Variance % | Cumulative % | Eigenvalue | Variance % | Cumulative % | |
| 1 | 4.30 | 39.12 | 39.12 | 4.20 | 38.20 | 38.20 |
| 2 | 2.14 | 19.50 | 58.62 | 1.99 | 18.10 | 56.31 |
| 3 | 1.70 | 15.45 | 74.07 | 1.84 | 16.76 | 73.06 |
| 4 | 1.08 | 9.80 | 83.86 | 1.19 | 10.80 | 83.86 |
| 5 | 0.72 | 6.52 | 90.38 | |||
| 6 | 0.56 | 5.06 | 95.45 | |||
| 7 | 0.27 | 2.48 | 97.93 | |||
| 8 | 0.14 | 1.29 | 99.22 | |||
| 9 | 0.06 | 0.55 | 99.77 | |||
| 10 | 0.02 | 0.22 | 99.99 | |||
| 11 | 0.00 | 0.01 | 100.00 | |||
Extraction method: Principal component analysis.
Table 4.
Matrix of varimax rotated factors loading.
| Parameter | Factors | |||
|---|---|---|---|---|
| 1 | 2 | 3 | 4 | |
| T | 0.08 | 0.78 | 0.15 | 0.22 |
| pH | −0.31 | 0.27 | −0.21 | 0.62 |
| K+ | 0.38 | −0.13 | 0.03 | 0.76 |
| Na+ | 0.06 | 0.27 | 0.93 | −0.01 |
| Ca2+ | 0.95 | 0.08 | −0.12 | 0.13 |
| Mg2+ | 0.88 | 0.04 | 0.19 | −0.15 |
| Cl− | 0.00 | −0.33 | 0.89 | −0.12 |
| SO42− | 0.98 | 0.05 | −0.02 | 0.07 |
| HCO3− | −0.57 | 0.60 | −0.24 | −0.31 |
| SiO2 | 0.17 | 0.86 | −0.10 | −0.08 |
| TDS | 0.98 | 0.07 | 0.06 | 0.08 |
Extraction method: Principal component analysis. Rotation method: Varimax with Kaiser normalization. The absolute value of factor loading greater than 0.5 are marked in bold.
Table 5.
Mineral transfers obtained by inverse modeling using PHREEQC (mmol/L).
| Phases | Formula | Model 1 | Model 2 | Model 3 |
|---|---|---|---|---|
| RW-Cluster A | RW-Cluster B | RW-Cluster C | ||
| Albite | NaAlSi3O8 | 0.5746 | 0.5955 | 0.4286 |
| Calcite | CaCO3 | −8.519 | −7.85 | −3.927 |
| Chalcedony | SiO2 | −1.836 | −1.78 | −0.7719 |
| CO2(g) | CO2 | 2.059 | 2.151 | 2.159 |
| Dolomite | CaMg(CO3)2 | 4.645 | 4.335 | 2.724 |
| Gypsum | CaSO4·2H2O | 19.57 | 17.18 | 10.42 |
| Halite | NaCl | 0.3196 | 1.018 | 0.3165 |
| K-feldspar | KAlSi3O8 | 0.5719 | 0.5205 | 0.1691 |
| Kaolinite | Al2Si2O5(OH)4 | −0.5733 | −0.558 | −0.2989 |
| H2O | H2O | 55470 | 55480 | 55490 |
Note: Positive values indicates that the phase dissolves and enters the groundwater, while negative values imply precipitation.
Table 6.
Mineral dissolution reactions.
| Possible Phases | Dissolution |
|---|---|
| Albite | NaAlSi3O8 + 8H2O → Na+ + Al(OH)4− + 3H4SiO40 |
| 2NaAlSi3O8 + 2CO2 + 11H2O → 2Na+ + 2HCO3− + 4H4SiO40 + Al2Si2O5(OH)4 | |
| Calcite | CaCO3 + H+ → Ca2+ + HCO3− |
| Chalcedony | SiO2 + 2H2O → H4SiO40 |
| CO2(g) | CO2 + H2O → H2CO3 |
| Dolomite | CaMg(CO3)2 + 2H+ → Ca2+ + Mg2+ +2HCO3− |
| CaMg(CO3)2 + H2CO3 → CaCO3 + Mg2+ + 2HCO3− | |
| Gypsum | CaSO4:2H2O → Ca2+ +SO42− + 2H2O |
| Halite | NaCl → Na+ + Cl− |
| K-feldspar | KAlSi3O8 + 8H2O → K+ + Al(OH)4− +3H4SiO40 |
| 2KAlSi3O8 + 2CO2 + 11H2O → 2K+ + 2HCO3− + 4H4SiO40 + Al2Si2O5(OH)4 | |
| Kaolinite | Al2Si2O5(OH)4 + 6H+ → H2O + 2H4SiO40 + 2Al3+ |
© 2020 by the authors. Licensee MDPI, Basel, Switzerland. This article is an open access article distributed under the terms and conditions of the Creative Commons Attribution (CC BY) license (http://creativecommons.org/licenses/by/4.0/).
Share and Cite
MDPI and ACS Style
Ta, M.; Zhou, X.; Guo, J.; Wang, X.; Wang, Y.; Xu, Y. The Evolution and Sources of Major Ions in Hot Springs in the Triassic Carbonates of Chongqing, China. Water 2020, 12, 1194. https://doi.org/10.3390/w12041194
AMA Style
Ta M, Zhou X, Guo J, Wang X, Wang Y, Xu Y. The Evolution and Sources of Major Ions in Hot Springs in the Triassic Carbonates of Chongqing, China. Water. 2020; 12(4):1194. https://doi.org/10.3390/w12041194
Chicago/Turabian StyleTa, Mingming, Xun Zhou, Juan Guo, Xinyun Wang, Yuan Wang, and Yanqiu Xu. 2020. "The Evolution and Sources of Major Ions in Hot Springs in the Triassic Carbonates of Chongqing, China" Water 12, no. 4: 1194. https://doi.org/10.3390/w12041194
Note that from the first issue of 2016, this journal uses article numbers instead of page numbers. See further details here.