Countrywide Groundwater Quality Trend and Suitability for Use in Key Sectors of Korea
by
 , , , ,
Chanhyeok Jeon
1,2 ,
,
Maimoona Raza
1,2, 
Jin-Yong Lee
1,2,*,
Heejung Kim
1,
Chang-Seong Kim
1,2 ,
,
Bora Kim
3,
Jeong-Woo Kim
3,
Rak-Hyeon Kim
4 and
Sun-Woo Lee
4 1
Department of Geology, College of Natural Sciences, Kangwon National University, Chuncheon 24341, Korea
2
Critical Zone Frontier Research Laboratory, Kangwon National University, Chuncheon 24341, Korea
3
GeoGreen21 Co., Ltd., Seoul 08976, Korea
4
Korea Environment Corporation, Incheon 22689, Korea
*
Author to whom correspondence should be addressed.
Water 2020, 12(4), 1193; https://doi.org/10.3390/w12041193
Submission received: 10 March 2020
/
Revised: 20 April 2020
/
Accepted: 21 April 2020
/
Published: 22 April 2020
(This article belongs to the Special Issue Environmental Chemistry of Water Quality Monitoring)
Abstract
:Under changing climate, increasing groundwater use has risen the concern for groundwater quality variations over recent years, to maintain a healthy ecosystem. The objectives were to identify trend of temporal variations in groundwater quality and its suitability for different uses in Republic of Korea. Water quality data were collected from 198 monitoring stations of Groundwater Quality Monitoring Network (GQMN), annually for the period of ten years (2008–2017). Non-parametric trend analysis of a Mann–Kendall test and Theil–Sen’s slope was done on groundwater physico-chemical data of ten years. Groundwater suitability evaluation was done for use in main sectors including domestic (drinking) and agriculture (irrigation). For drinking suitability analysis, results were compared with World Health Organization (WHO) and Korean Ministry of Environment (KME) established guidelines. For irrigation suitability evaluation, electrical conductivity (EC), Sodium Adsorption Ratio (SAR), percent of Na+, Residual Sodium Carbonate (RSC), US Salinity Laboratory (USSL), and Wilcox diagram were used. Most significantly, water type belongs to Ca-HCO3 and Ca-SO4 types, but a small proportion belongs to Na-CO3 and Na-Cl types. Approximately, 96% and 93% of groundwater samples are suitable for drinking, based on WHO and KME guidelines, respectively. Around 98% and 83% of groundwater samples are in suitable range for irrigation use, based on USSL and Wilcox diagrams, respectively.
1. Introduction
Groundwater is one of the major sources of drinking and irrigation water all over the world [1,2]. In the Republic of Korea, increased annual precipitation associated with the increase in intensity, frequency, and duration of monsoon’s precipitation in summer season, and decreased precipitation during other seasons have effects on water resource management [3]. This increasing variable and extreme precipitation are making the country more susceptible to flood and drought hazards [4,5]. To deal with frequent droughts, there is a need to construct dams to store water in the summer, but there is no more suitable sites left for the construction of mega dams in the country [6,7]. Water demand is increasing with growing agricultural innovation and urban sprawl, and an alternative to groundwater is needed. Approximately, 13% of the total annual agricultural, domestic, and industrial water supplies are based on groundwater [8]. Total groundwater use was 2838 million (M) m3 in 1996, which had been increased to 4071 M m3 in 2013, with an average increasing rate of 43.9 M m3 per year [9]. The major use of groundwater is for agricultural (51.2%) and domestic (39%) purposes [9]. In addition, practice of using groundwater as bottled drinking water (enforced by Korean Drinking Water Management Act) has increased the use of groundwater by 11% per year, from 2000 to 2015 [5,6]. In recent decades, less precipitation in the dry season and increasing groundwater use has caused a decrease in the groundwater level [10]. This decreasing water level situation helps us to know the water quality variations over recent decades and its potential use for different purposes, to maintain a healthy system.
Water scarcity, droughts, decreasing water level, and completion for various uses have affected groundwater quality in various regions of the world [11]. In Senegal, chemical processes were identified that control hydrochemistry to assess the suitability of groundwater quality for drinking and agricultural purposes [12]. Spatial variation in groundwater quality was analyzed to be geochemically controlled and unsafe for dinking in Gujrat, Pakistan [13]. A trend in groundwater quality was analyzed using non parametric Mann–Kendall test in Iran [14]. In Korea, various studies have evaluated groundwater quality in different regions, in different years [15,16,17,18,19]. Studies on trend in water quality using Mann–Kendall test and Sen’s slope found in different regions of the country [20,21]. A few studies evaluated groundwater suitability for drinking and irrigation in the local areas of Korea [22,23]. After these studies, still there is a need to develop a big picture explaining changes in groundwater quality, reasons of those changes, and its suitability for domestic and agriculture purposes.
In Korea, to address the groundwater quality issues, the Groundwater Quality Monitoring Network (GQMN) was developed in 2007, to monitor water quality. Several monitoring stations under GQMN have automatic probes were adjusted to measure nineteen water quality parameters including: cations, anions, and microorganisms, and then automatically saved in a host computer connected to the website of the Korean Ministry of Environment (KME). The data collection started in 2008, one year after the installation of the system. The effects of climate change and decreasing water level in Korea is making it necessary to study groundwater quality trend over the last decade (2008–2017) and its suitability for different uses. The objectives were; (i) to analyze the variations and trend of groundwater physico-chemical parameters over the period of ten years, and (ii) to evaluate overall quality of groundwater for drinking and irrigation uses, during the studied time period. Results of this comprehensive study would be useful for decision makers, to manage groundwater resource with respect to water quality and its suitability of use in different sectors.
2. Materials and Methods
2.1. Study Area Location and Hydrometeorology
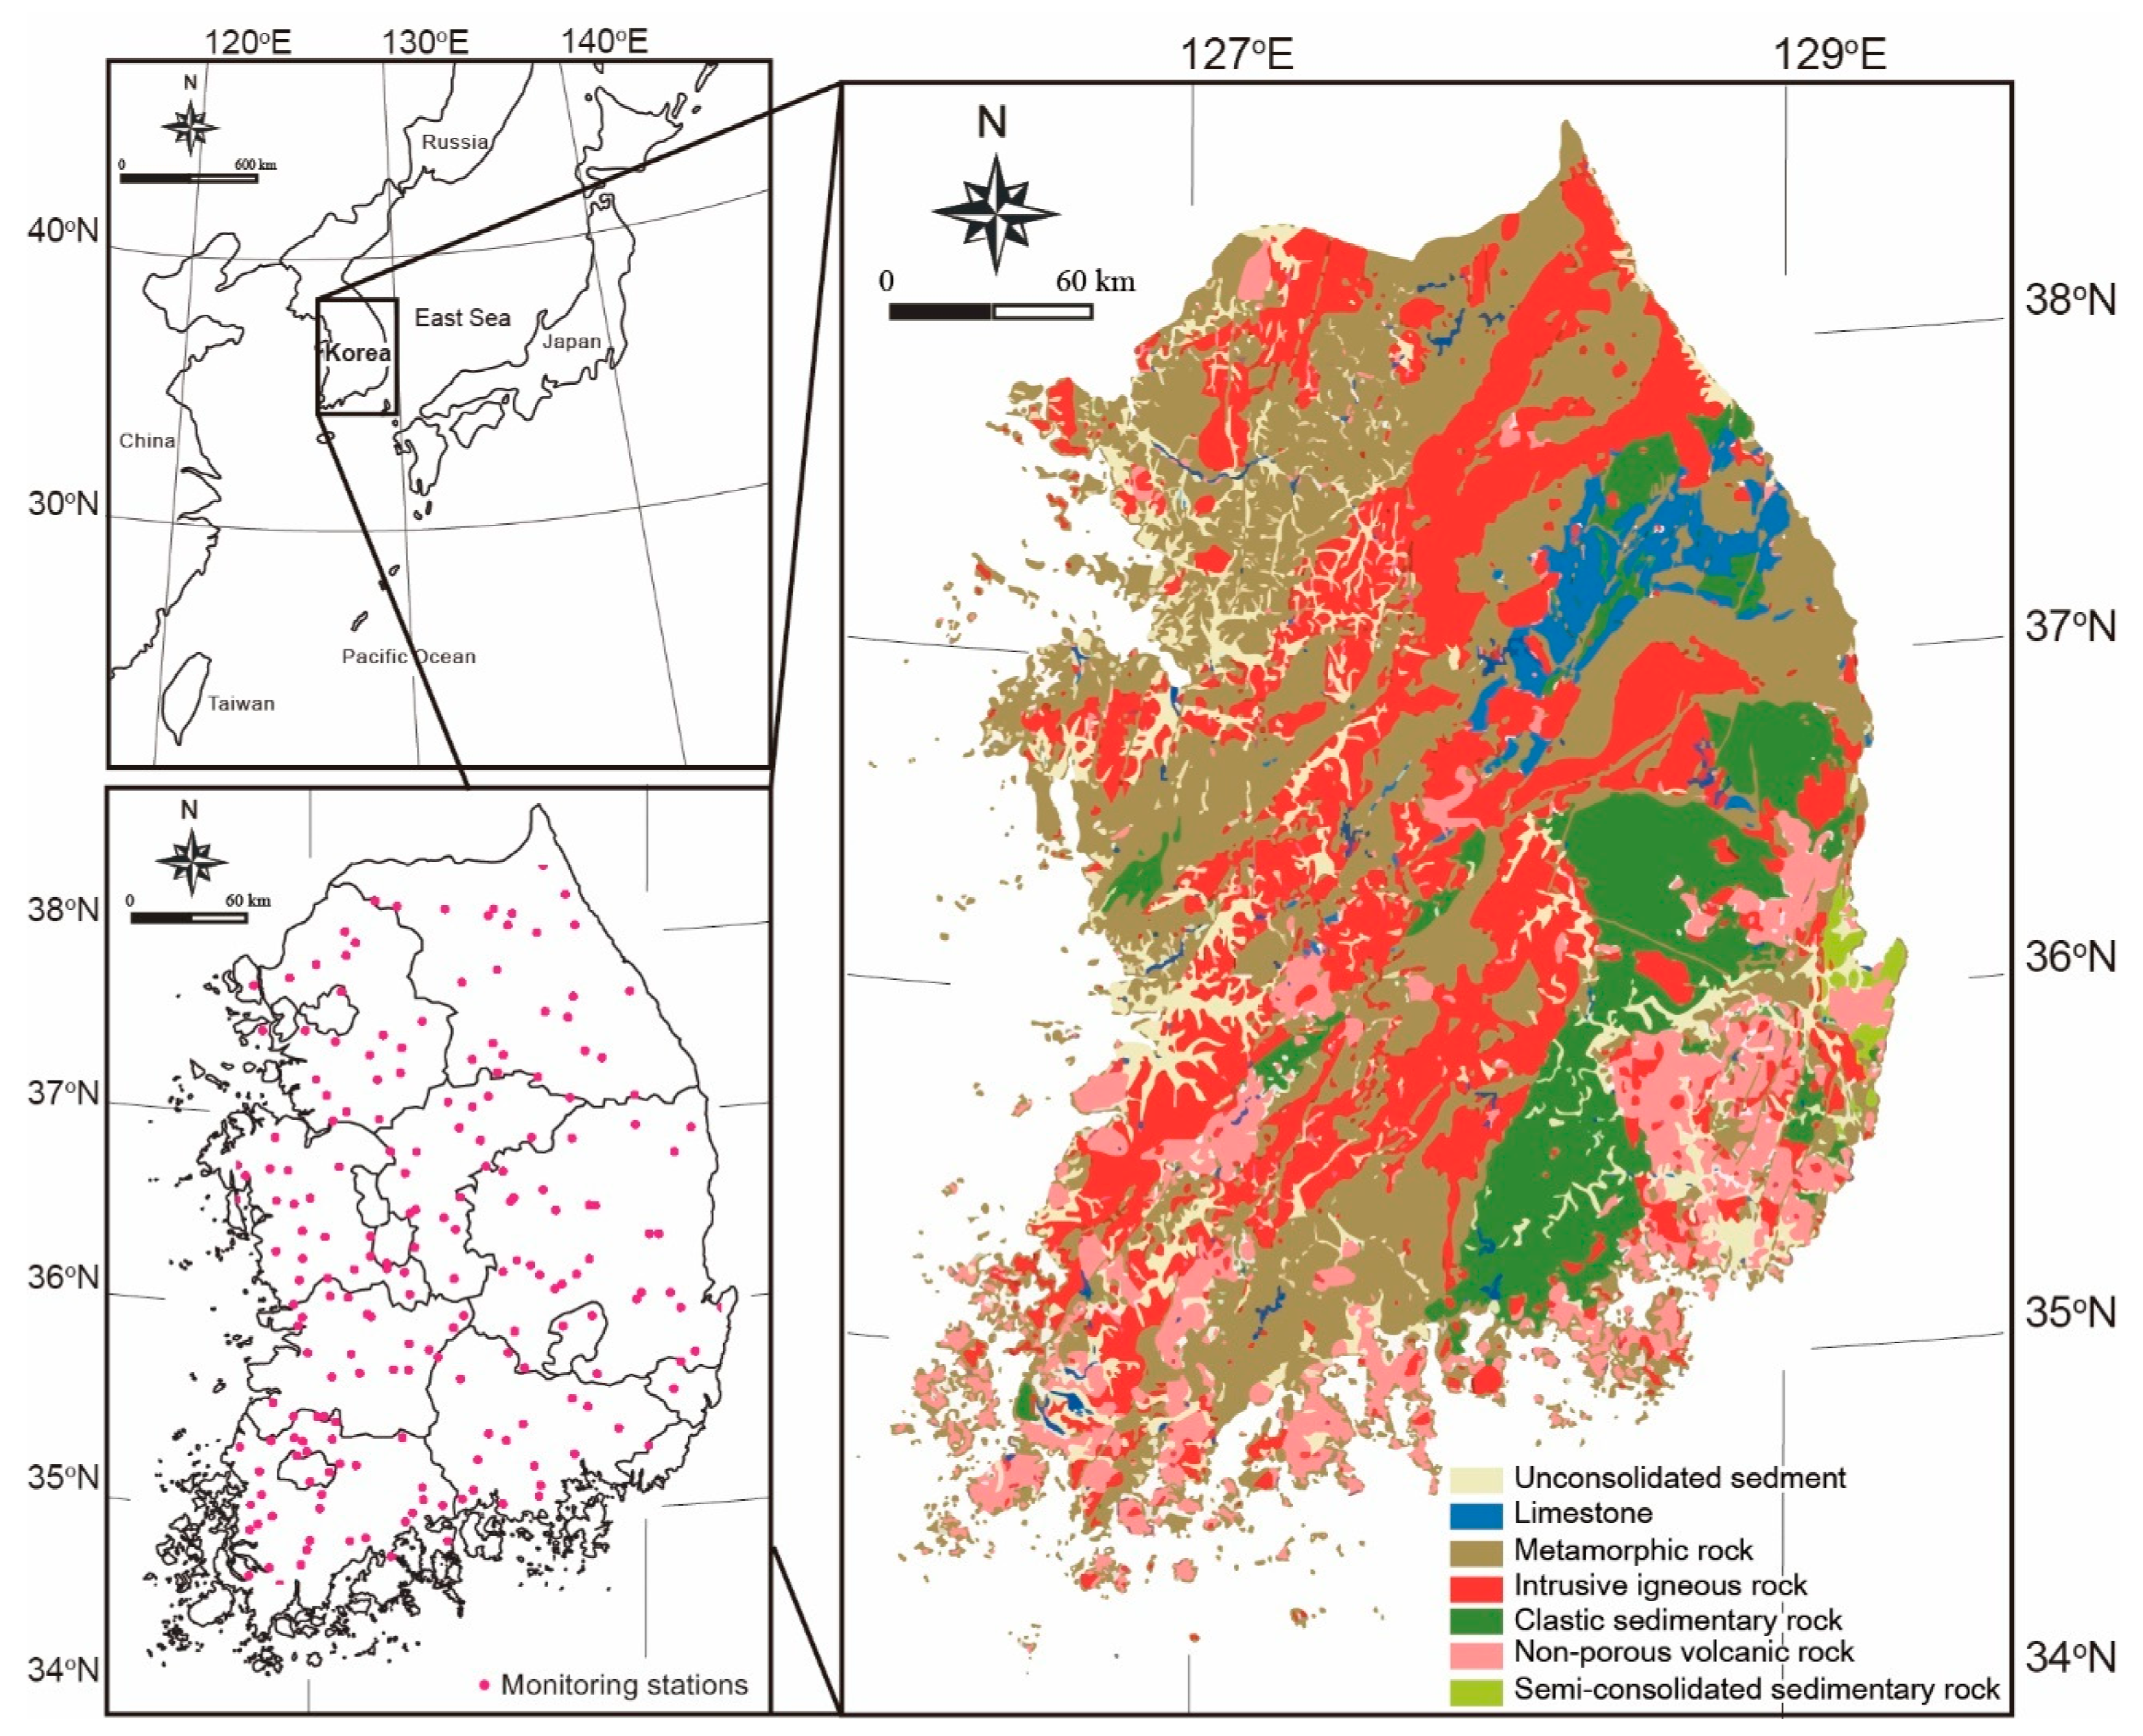
The study area is located in the northeastern part of the East Asian continent, between 33 and 39° N latitude and 124 and 130° E longitude, covering an area of 100,210 km2 (Figure 1). Approximately, 70% of the area is mountainous mainly concentrated to the north and east. While, south and west parts are arable plains [20]. The topographical feature causes most of rivers to flow westward, resulting in recharge in the eastern highlands areas and the discharge in the western lowlands areas [8]. The study area has a humid continental-subtropical climate which is affected by the East Asian monsoon and most of the annual precipitation are extreme during three months of the summer season [24]. The data for average annual precipitation and temperature was measured from a network of 102 weather stations under Automated Synoptic Observing System (ASOS), in Korea. The average annual precipitation during study period (2008–2017) was 1253 mm, ranging from 37.2 to 2507.6 mm in ten years. The annual average air temperature for the same period was 12.7 °C, ranging from 6.5 to 15.8 °C, depending on the local regions within the study area [25]. The geological setting of the area is characterized by Granite and crystalline metamorphic rocks in Gyeonggi-do, Chungcheong-do, and Jeolla-do where groundwater is present in the lower weathering zone. Dispersed Limestone sediments are present along the east coast and along the rivers (Samcheok River and the South Han River) [5].
2.2. Geological Settings
To classify aquifers in study area, hydrogeologic units are investigated according to their geological characteristics such as geological age, rock type, pore shape etc. [26]. The aquifers are separated into eight hydrologic units: unconsolidated sediment, limestone, metamorphic rock, intrusive igneous rock, clastic sedimentary rock, non-porous volcanic rock, semi-consolidated sedimentary rock. The limestone unit is composed of marine carbonate sedimentary rocks and clastic sedimentary rocks. Owing to the compaction and recrystallization of limestone, the rock has enormously low penetrability. However, the karst area and cave caused by component characterize are contained a huge groundwater source. The metamorphic rock unit is distributed most territory in Korea and has low porosity, and the groundwater flow depends on the size and distribution of fracture. The intrusive igneous rock unit is occupied about 19% of the whole area. The primary porosity of crystallized plutonic rock is very low, and groundwater flows horizontal and vertical fractures with low velocity. The clastic sedimentary rock unit has weak development of primary pores due to a high degree of solidification by diagenesis. The groundwater forms part of an old associated water body. The non-porous volcanic rock unit included vented volcanic rock and the development of primary pores is limited that groundwater flows mostly along secondary pores.
2.3. Data Collection and Analysis
KME was regularly monitoring all stations of GQMN, for water quality parameters quarterly in a year, since year 2008. Data used in this study were from shallow to intermediately deep wells (7–210 m) of GQMN. Each GQMN station is equipped with number of probes for different purposes, is providing a huge data set of water quality parameters. The number of monitoring stations and number of installed probes in stations have been increasing, since the first year of GQMN development. During quarterly data collection for water quality, the data were recorded from 398 installed probes (maximum number) in 198 different stations (maximum number), for this study. During the studies duration (2008–2017) of ten years, data were collected from a total 8887 probes for groundwater quality parameters viz., water temperature (T), pH (power of hydrogen), EC (electrical conductivity), redox potential (Eh), total dissolved solids (TDS), sodium (Na+), potassium (K+), calcium (Ca2+), magnesium (Mg2+), chloride (Cl−), nitrate (NO3−), sulphate (SO42−), carbonate (CO32−), and bicarbonate (HCO3−) [26,27]. Obtained groundwater physico-chemical data were analyzed for water type by plotting Piper trilinear plot using Grapher 12 (Golden software, Golden, CO, USA) and correlation of water quality parameters by Pearson correlation using SPSS 20 (IBM, New York, NY, USA). Statistical evaluation of groundwater physico-chemical parameters would help to understand main factors controlling water quality variations over time [12].
2.4. Statistical Trend Analysis
A Mann–Kendall (MK) test was initially proposed by Mann in 1945 and was further developed by Kendall in 1975 [28,29]. This is commonly used non-parametric test, to determine linear and non-linear time series trends in hydrological and meteorological data sets [14,30]. Considering reliability and consistency of collected data per year, we excluded the data obtained from stations that became operations within four years. Hence, the trend was identified for data collected from total 106 monitoring stations. It is simple method and can handle extreme values, missing values, and values below a detection limit. The test is appropriate for the data that do not have a normal distribution and can supports numerous observations per time series [30,31]. The value of MK test for the data as S statistics is calculated as:
In Equation (1), xj and xi represent sequential data in the j and i years, respectively, and n represents the duration of statistical period (total amount of data). In Equation (2), a pair of measurement values were compared through subtractions while considering the increasing values = +1, decreasing = −1, no changing = 0, and are expressed as:
Variance signifies the variance of S that has a zero mean for n ≥ 8, the statistic S can be expressed using the mean (E) and the variance (V), as:
In Equation (3), n is the number of data points, m is the number of tied groups, ti denotes number of ties for the ith value. A tied group is a set of data having the same value. In situation, where the data points n > 10, then the standard normal test statistic Z for the normal distribution at 95% and 99% confidence level, is computed as:
Positive values of Z indicate that there are increasing trends and negative Z values indicate decreasing trends. Testing of trends is done at the α significance level. When |Z|> Z1−α/2, the null hypothesis H0 that there is no trend is rejected and alternative hypothesis H1 that there is a significant trend exists is accepted. Z1−α/2 is attained from the standard normal distribution of table. Null or alternative hypothesis is accepted or rejected depending on computed Z-statistics, if it is less than or more than the critical Z-statistics value, got from the normal distribution of table. In this trend analysis, we applied the MK test to identify if a trend in the groundwater quality parameters is statistically significant, at significance levels of α = 0.05 (or 95% confidence intervals) and α = 0.01 (or 99% confidence intervals).
The slope (trend) of n data pairs was estimated using Theil–Sen (TS) test [32,33]. The TS was used in this study, to quantify the magnitude (percentage) of the trend. For this test, interval between data points of time series, should be equally spaced and arranged in ascending order referring to time. Sen’s slope can be calculated as:
In Equation (5), xj and xi are values at times j and i, respectively. Total N values of Q are classified from smallest to largest, and the median of Sen’s slope is computed as:
2.5. Evaluation of Groundwater Suitability
An overall groundwater suitability evaluation was done for the use as drinking water and irrigation water. The suitability of groundwater for drinking purpose and public health was evaluated by comparing the most important parameters of drinking water quality, such as, T, pH, EC, Eh, TDS, Na+, Mg2+, Ca2+, K+, Cl−, NO3−, SO42−, CO32−, and HCO3− with guidelines specified by WHO and KME for drinking water [36]. An evaluation of the groundwater quality suitability for irrigation use was done based on EC, SAR, Na+ %, RSC, USSL, and Wilcox diagram. The equations or methods used to evaluate mentioned parameters are given as follow:
- The EC values in groundwater were compared with EC based classification (from unfit to excellent for irrigation) given by Richard [37].
- The Na % was calculated by using following equation given by Wilcox [39]:
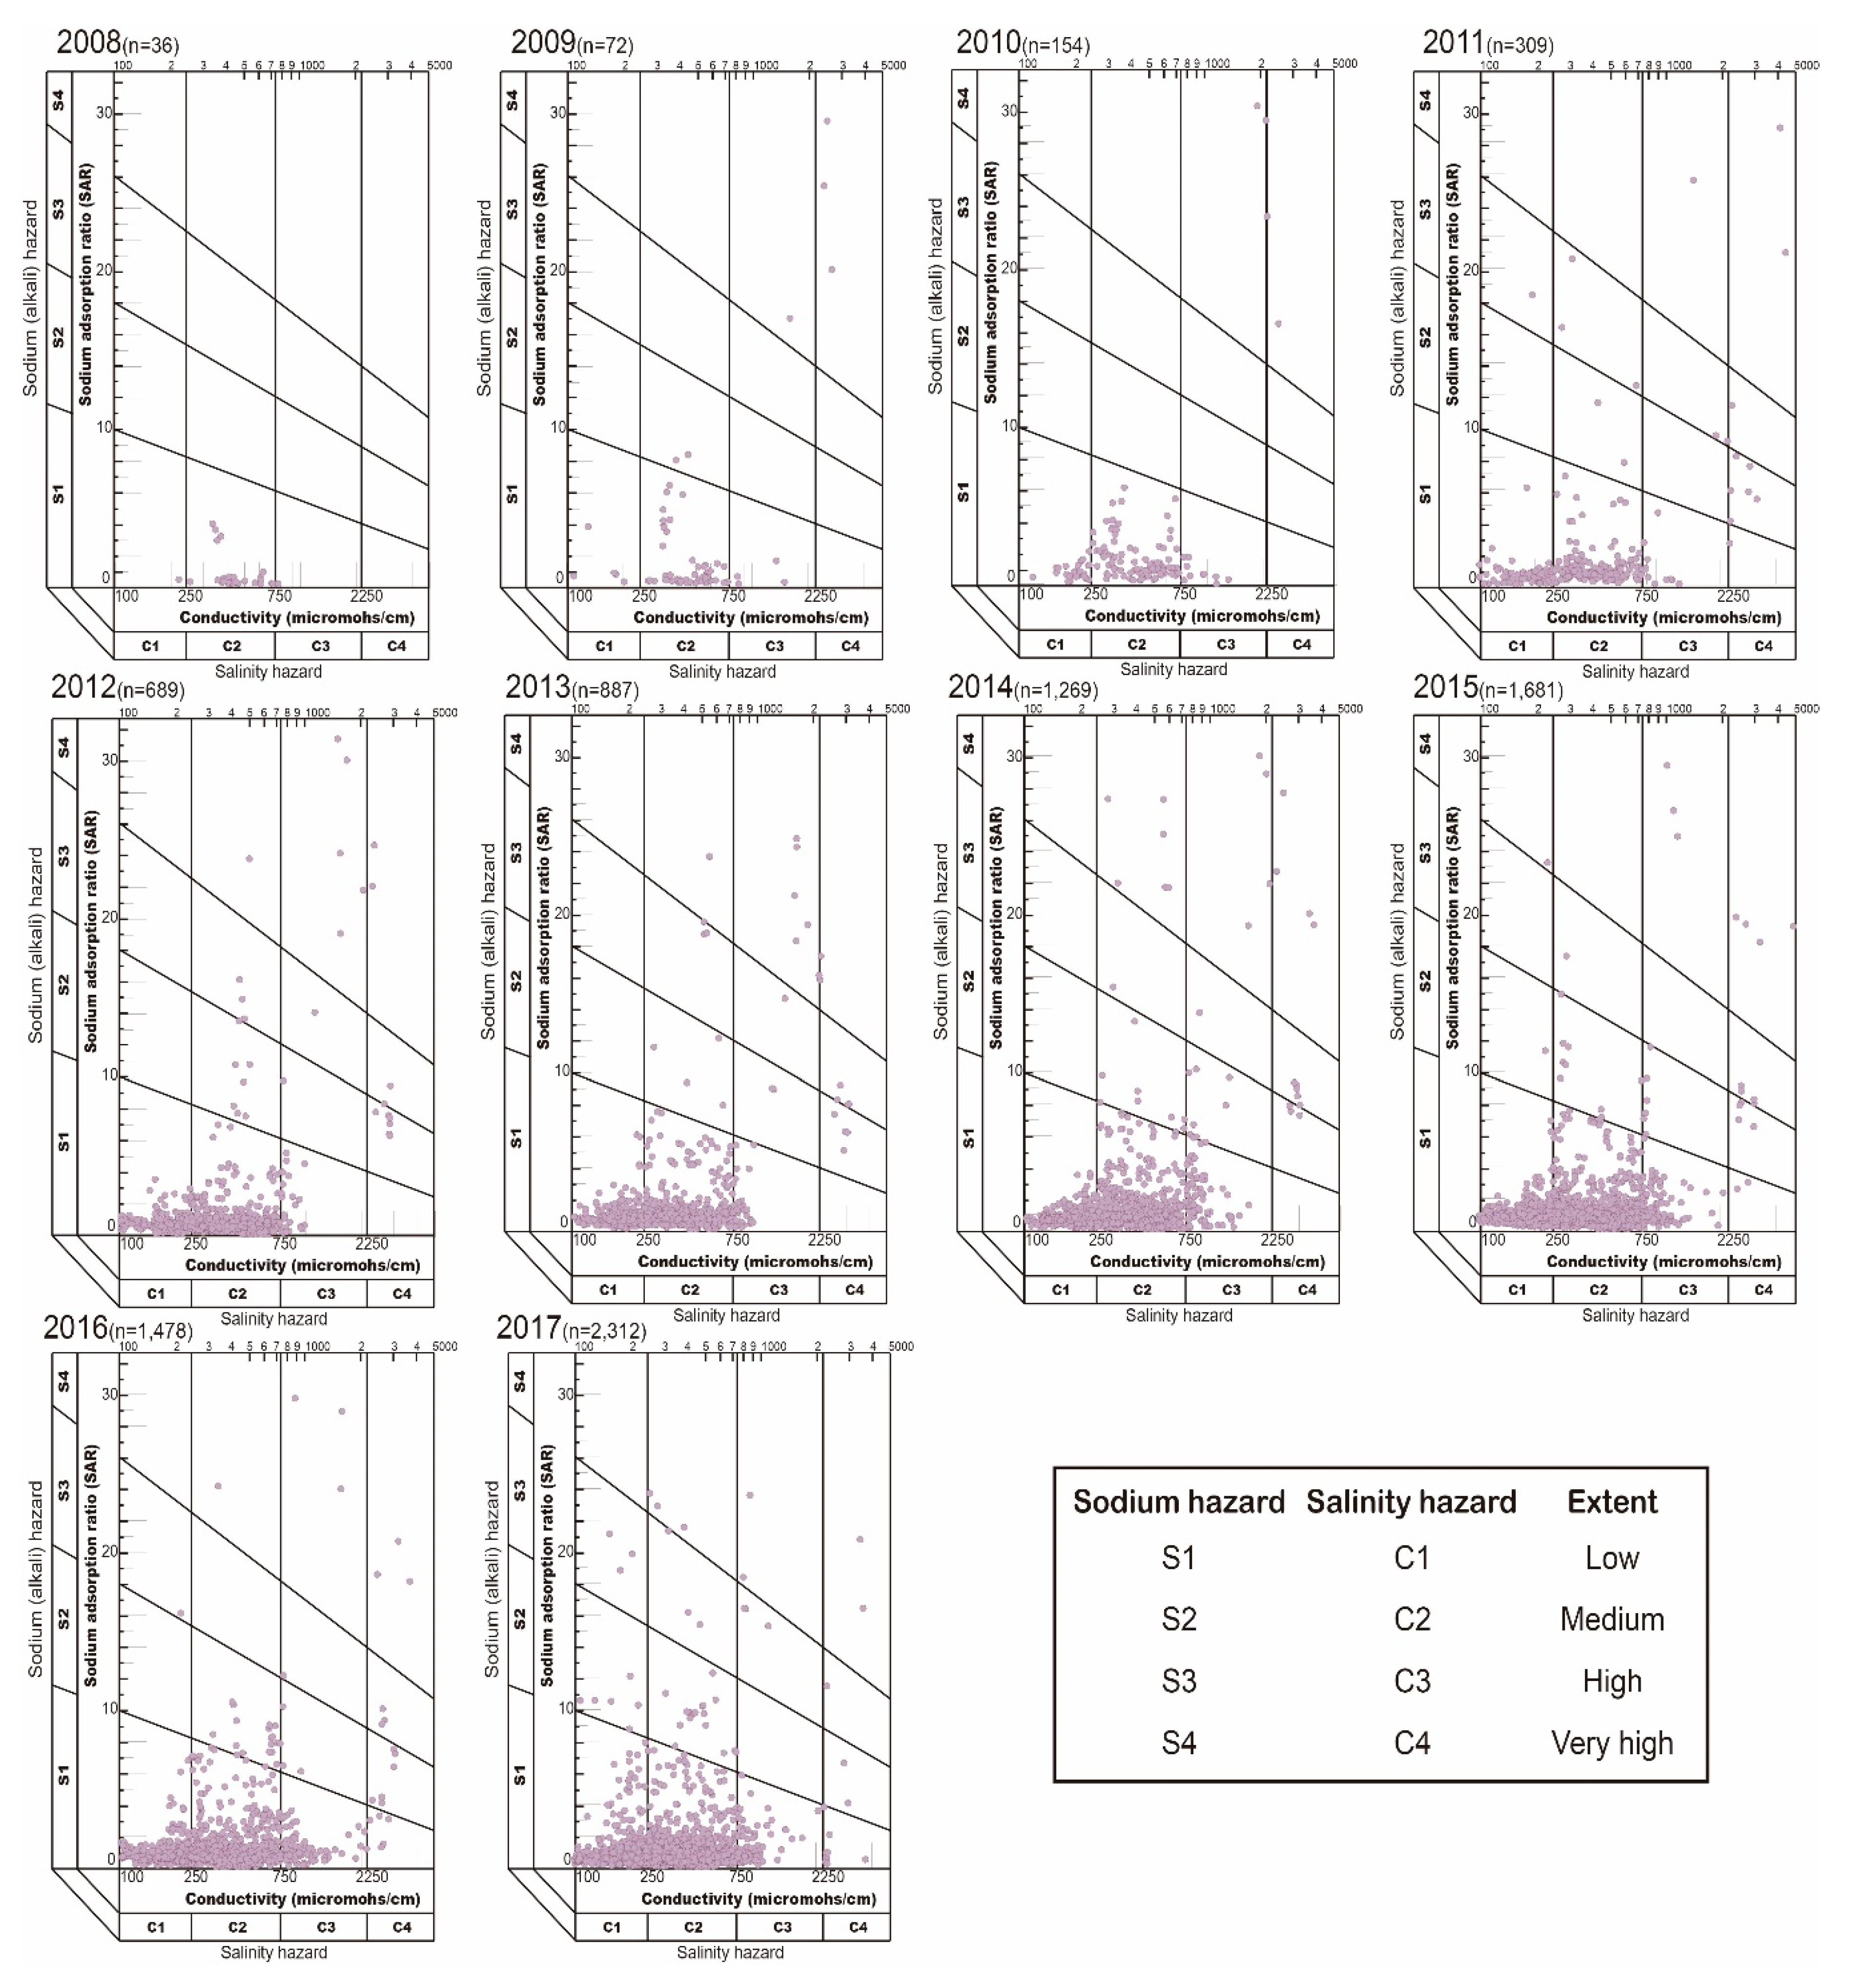
- The suitability class of groundwater data were also described using a USSL diagram that specifies the combined effect of salinity hazard (EC) and sodium hazard (SAR) [2]. Wilcox diagram was used to calculate combined effect of sodium hazard as sodium percent (Na+ %) and salinity hazard (EC), to evaluate groundwater suitability for irrigation [39].
The values for each equation were calculated for the collected data using Equations (8)–(10), and ionic concentrations were used in meq/L. Plotting of USSL and Wilcox diagram was done using the Grapher 12 software.
3. Results and Discussion
3.1. Nationwide Groundwater Chemistry
Statistical summary including range (minimum–maximum), median, and standard deviation (SD) for nationwide groundwater quality parameters concentration from 2008 to 2017, is given in Table 1. The existence of large SD values in different years for most of the parameters is indicating chemistry of groundwater affected by different processes [41]. The annual median groundwater T (°C) has increased from 14.1 °C to 16.3 °C, from 2008 to 2017, respectively. Global warming and extensive urbanization have resulted in surface warming that effect deeper in the groundwater recharge areas and increase groundwater T [42]. The pH was ranged 5.5–8.7 in 2008 and 4.4–10.8 in 2017 with a median of 7.0 and 6.6, respectively. In the start of monitoring period, groundwater pH was slightly acidic to neutral, in the last studied year groundwater pH was acidic to alkaline. However, the median pH remained in neutral category, and this increased range of groundwater pH is attributed number of reasons including, influx of precipitation of low alkalinity, influence of industrial and mining activities, leaching of applied chemical fertilizers in agricultural fields to groundwater [21,43]. Increase in number of monitoring stations at different regions with diverse land uses lead to increased range of pH in groundwater. The values of groundwater EC during start and end of studied period ranged from 220.0 to 759.0 µS/cm and 42.0 to 36,610.0 µS/cm with corresponding median values of 414.0 µS/cm and 311.0 µS/cm. Similar to pH value, the range of groundwater EC values increased because of increasing monitoring stations in different regions. A decrease in median values is representing reduction in groundwater contamination [16]. The range and median values of Eh varied during the studied period, as the amount of data increased. The groundwater TDS values varied from 121.0 to 418.0 mg/L and 20.3 to 2312.0 mg/L in the start and end of studied period with median values of 228.0 and 199.0 mg/L, respectively. High TDSin the groundwater is due to leaching of salts from the soil and sewage percolation to groundwater [1].
In the first monitoring year, median values of Na+, K+, Ca2+, and Mg2+ in groundwater were, 10.7, 3.4, 55.4, and 8.9 mg/L, respectively. In the last year of studied period, annual median values of Na+, K+, Ca2+, and Mg2+ in groundwater were, 15.3, 1.9, 33.9, 6.4 mg/L, respectively. The median values of groundwater Na+ increased while the median values of groundwater K+, Ca2+ and Mg2+ decreased over the time. The mass abundance was in order of Na+ > Ca2+ > Mg2++ > K+ for cations. Presence of geogenic rocks (i.e., calcite and dolomite) is the source of cations in groundwater, when undergone through the process of weathering [1,44]. The median values of groundwater Cl−, NO3−, SO42−, CO32−, and HCO3− in 2008 were, 12.0, 23.3, 24.5, 0.1, and 110.7 mg/L, respectively. The median values in last year of studied period for groundwater Cl−, NO3−, SO42−, CO32−, and HCO3− were, 13.1, 4.8, 11.9, 0.1, and 122.0 mg/L, respectively. Values of groundwater NO3− and SO42− have decreased over time, while values of groundwater Cl− and HCO3− have increased during the studied period. The order of anions abundance in groundwater was Cl− > HCO3− > SO42− > NO3− > CO32−. Generally, high concentration of Cl−, HCO3−, SO42−, NO3−, and CO32− might be attributed to the landward intrusion of saline water near coastal area, lower river discharge rate, weathering and leaching of sedimentary rocks, agricultural activities, and mismanaged domestic sewage [13,45]. Specifically, high HCO3− values reveal the occurrence of mineral dissolution and the input of carbon dioxide from the atmosphere [46]. Occurrence of groundwater NO3− is attributed to presence of organic matter, domestic waste, and fertilizers applied in agricultural fields [16]. Other than saltwater intrusion, recent high values of groundwater Cl− are thought to be due to anthropogenic factors such as road salt, water softeners, and sewage contamination [47,48].
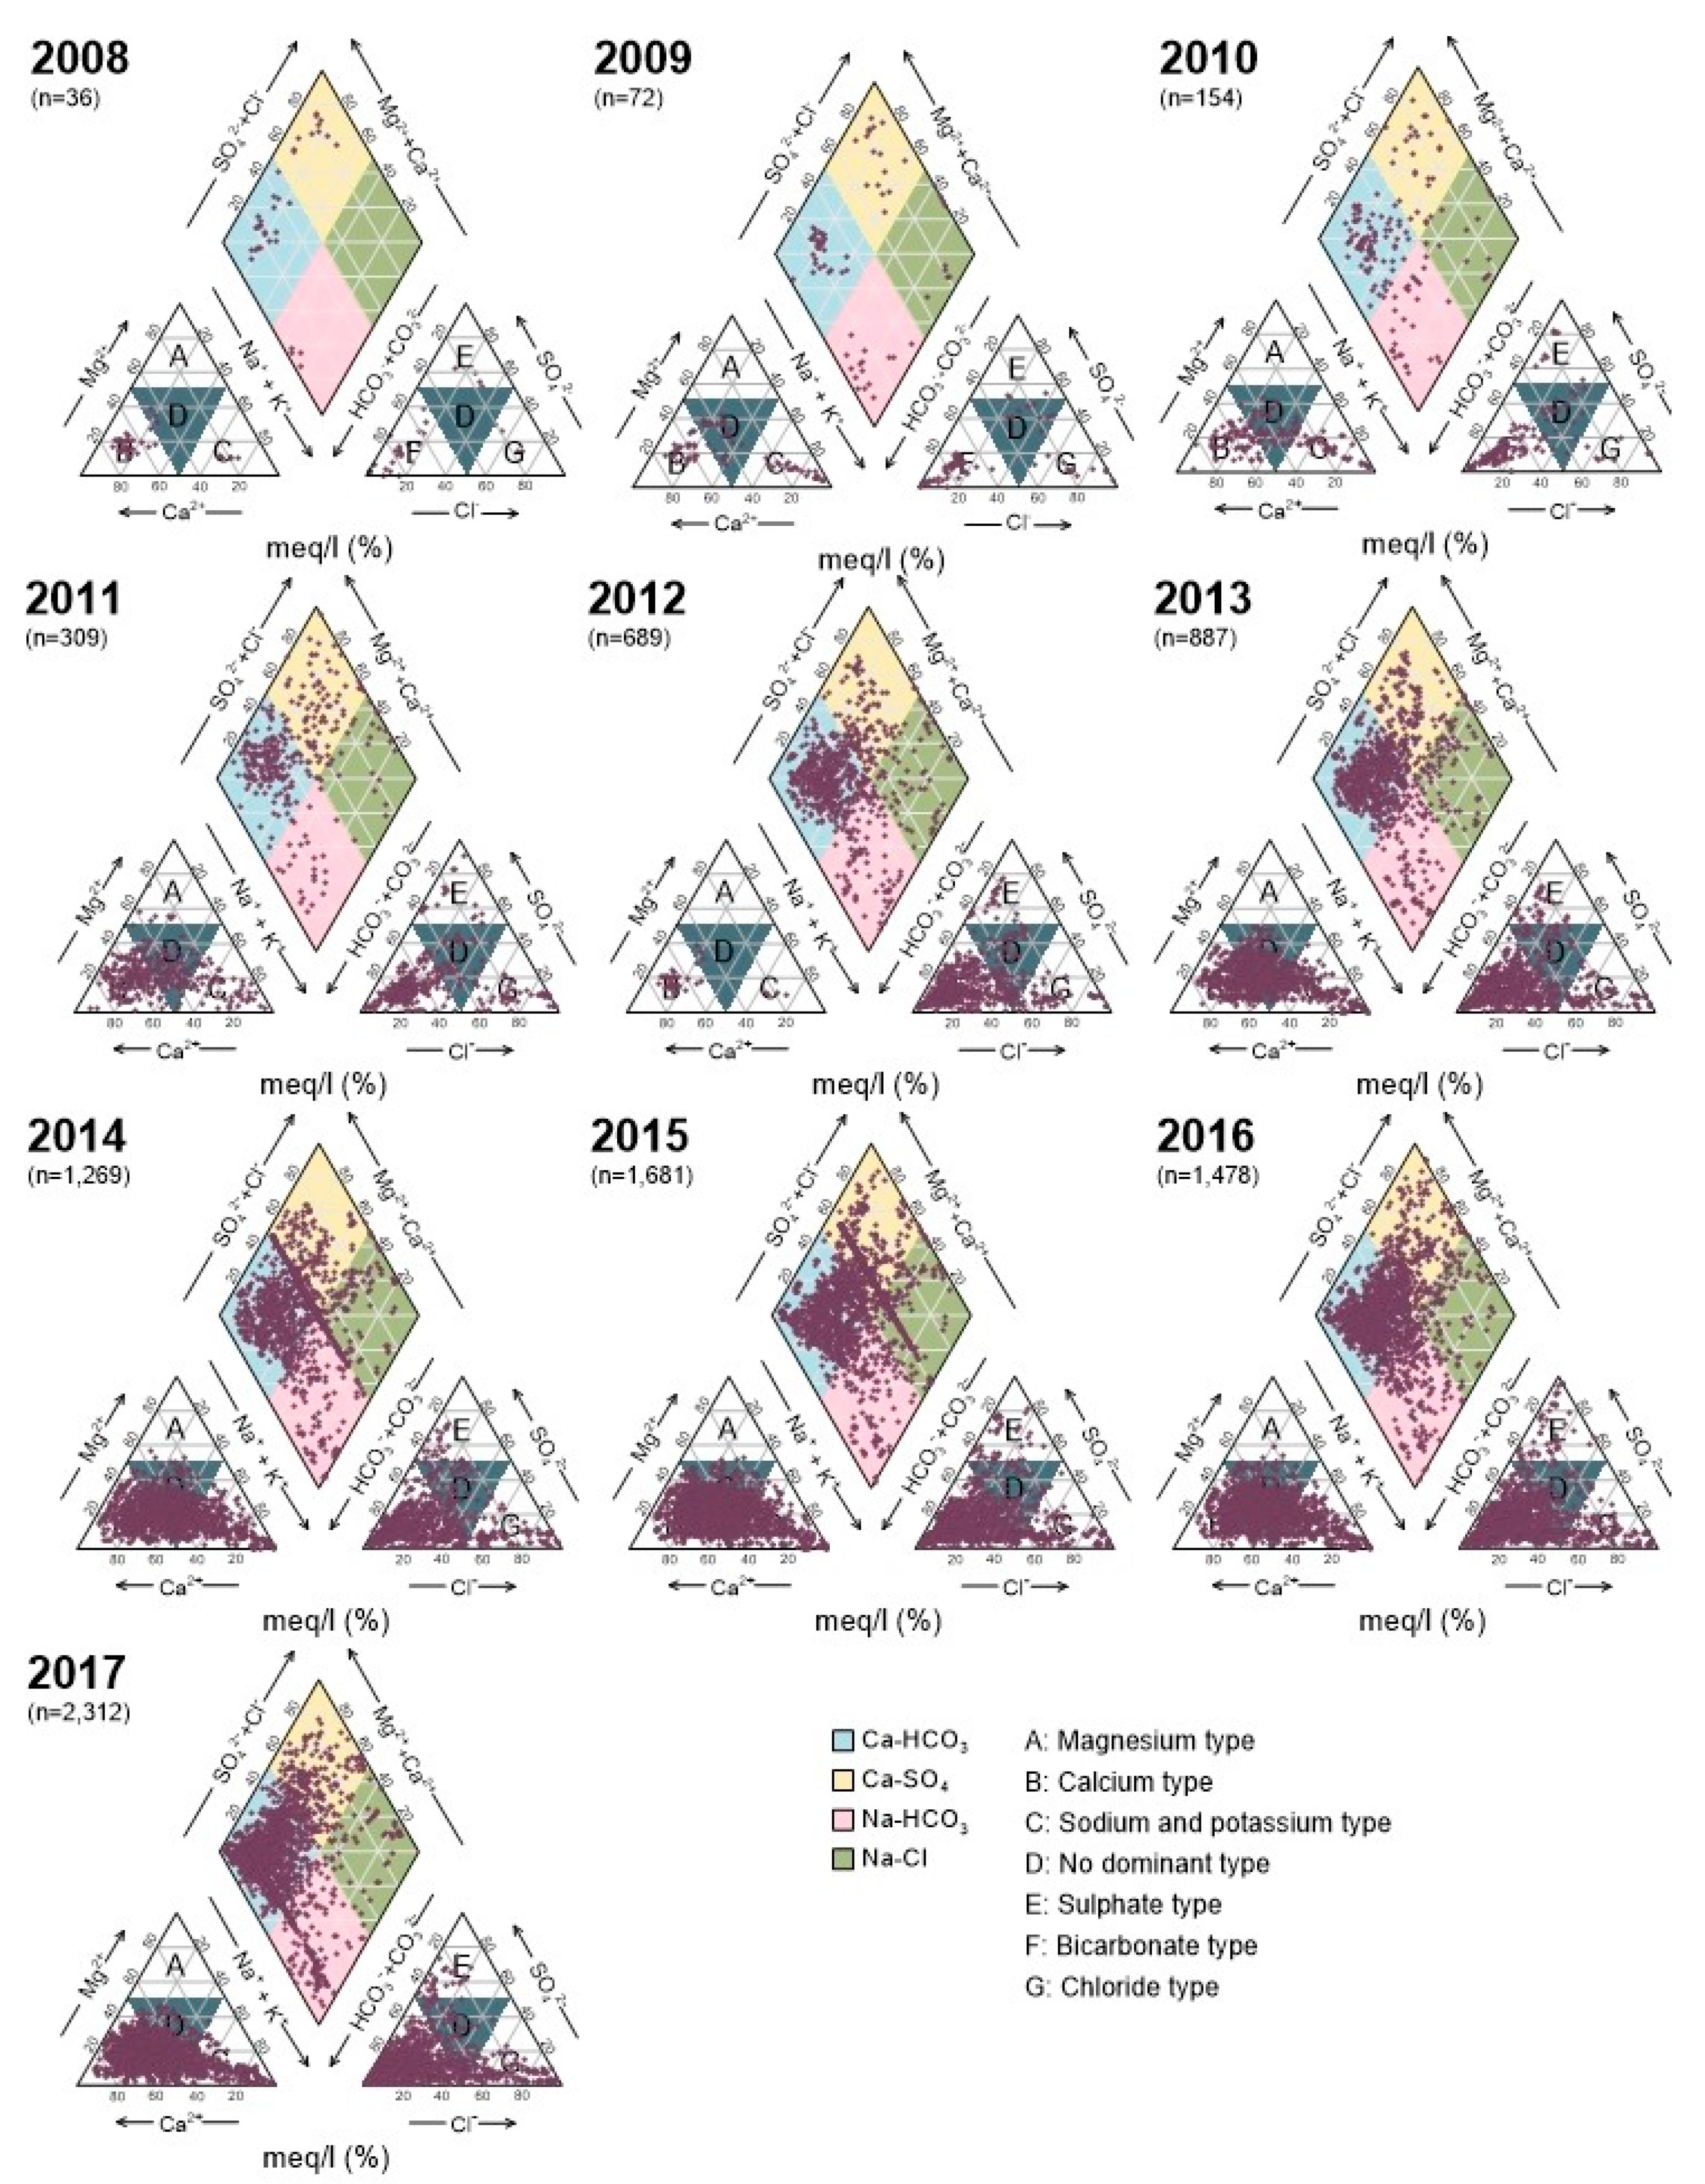
The composition of groundwater varies depending on regional flow pattern of water and lithology of the area [49]. Based on chemical composition, all waters are classified into three main classes: bicarbonate, chloride, and sulfate and types [50]. The Piper diagram was used to classify the type of groundwater in Korea (Figure 2). This diagram consists of three parts, one diamond shaped figure in the middle and two trilinear figures on left and right along the bottom. The comparative concentrations of anions (right diagram) and cations (left diagram) are shown in the trilinear figure. Each concentration is represented by a point in trilinear figure and the water type will qualify according to the colored area in piper diagram. From 2008 to 2017, the number of monitoring stations and installed probes were increasing, consequently increasing the number of points in trilinear figure. Over the period of ten years, groundwater composition did not show a major shift from one water type to another. The dominating cation in groundwater was Ca2+ (B: calcium type) and dominating anion was HCO3− (F: bicarbonate type). The abundance of water type found was in order: Ca-HCO3 > Ca-SO4 > Na-CO3 > Na-Cl. On average, more than 80% of groundwater in Korea belonged to Ca-HCO3 water type, and only few water samples belonged to Na-Cl water type. The mentioned water types indicated that the Na-Cl water type in Korea is because of sea water intrusion in groundwater near coastal areas [17]. The Ca-HCO3 type indicated the groundwater is recharged from precipitation or fresh water [51]. In Korea, Ca-HCO3 type exists in shallow groundwater which is younger water and recharged after the 1950s. The groundwater composition in study area was mainly evolved through the mineral dissolution and precipitation of clay and oxide minerals during groundwater recharge [52].
3.2. Trend Analysis of Groundwater Quality Parameters
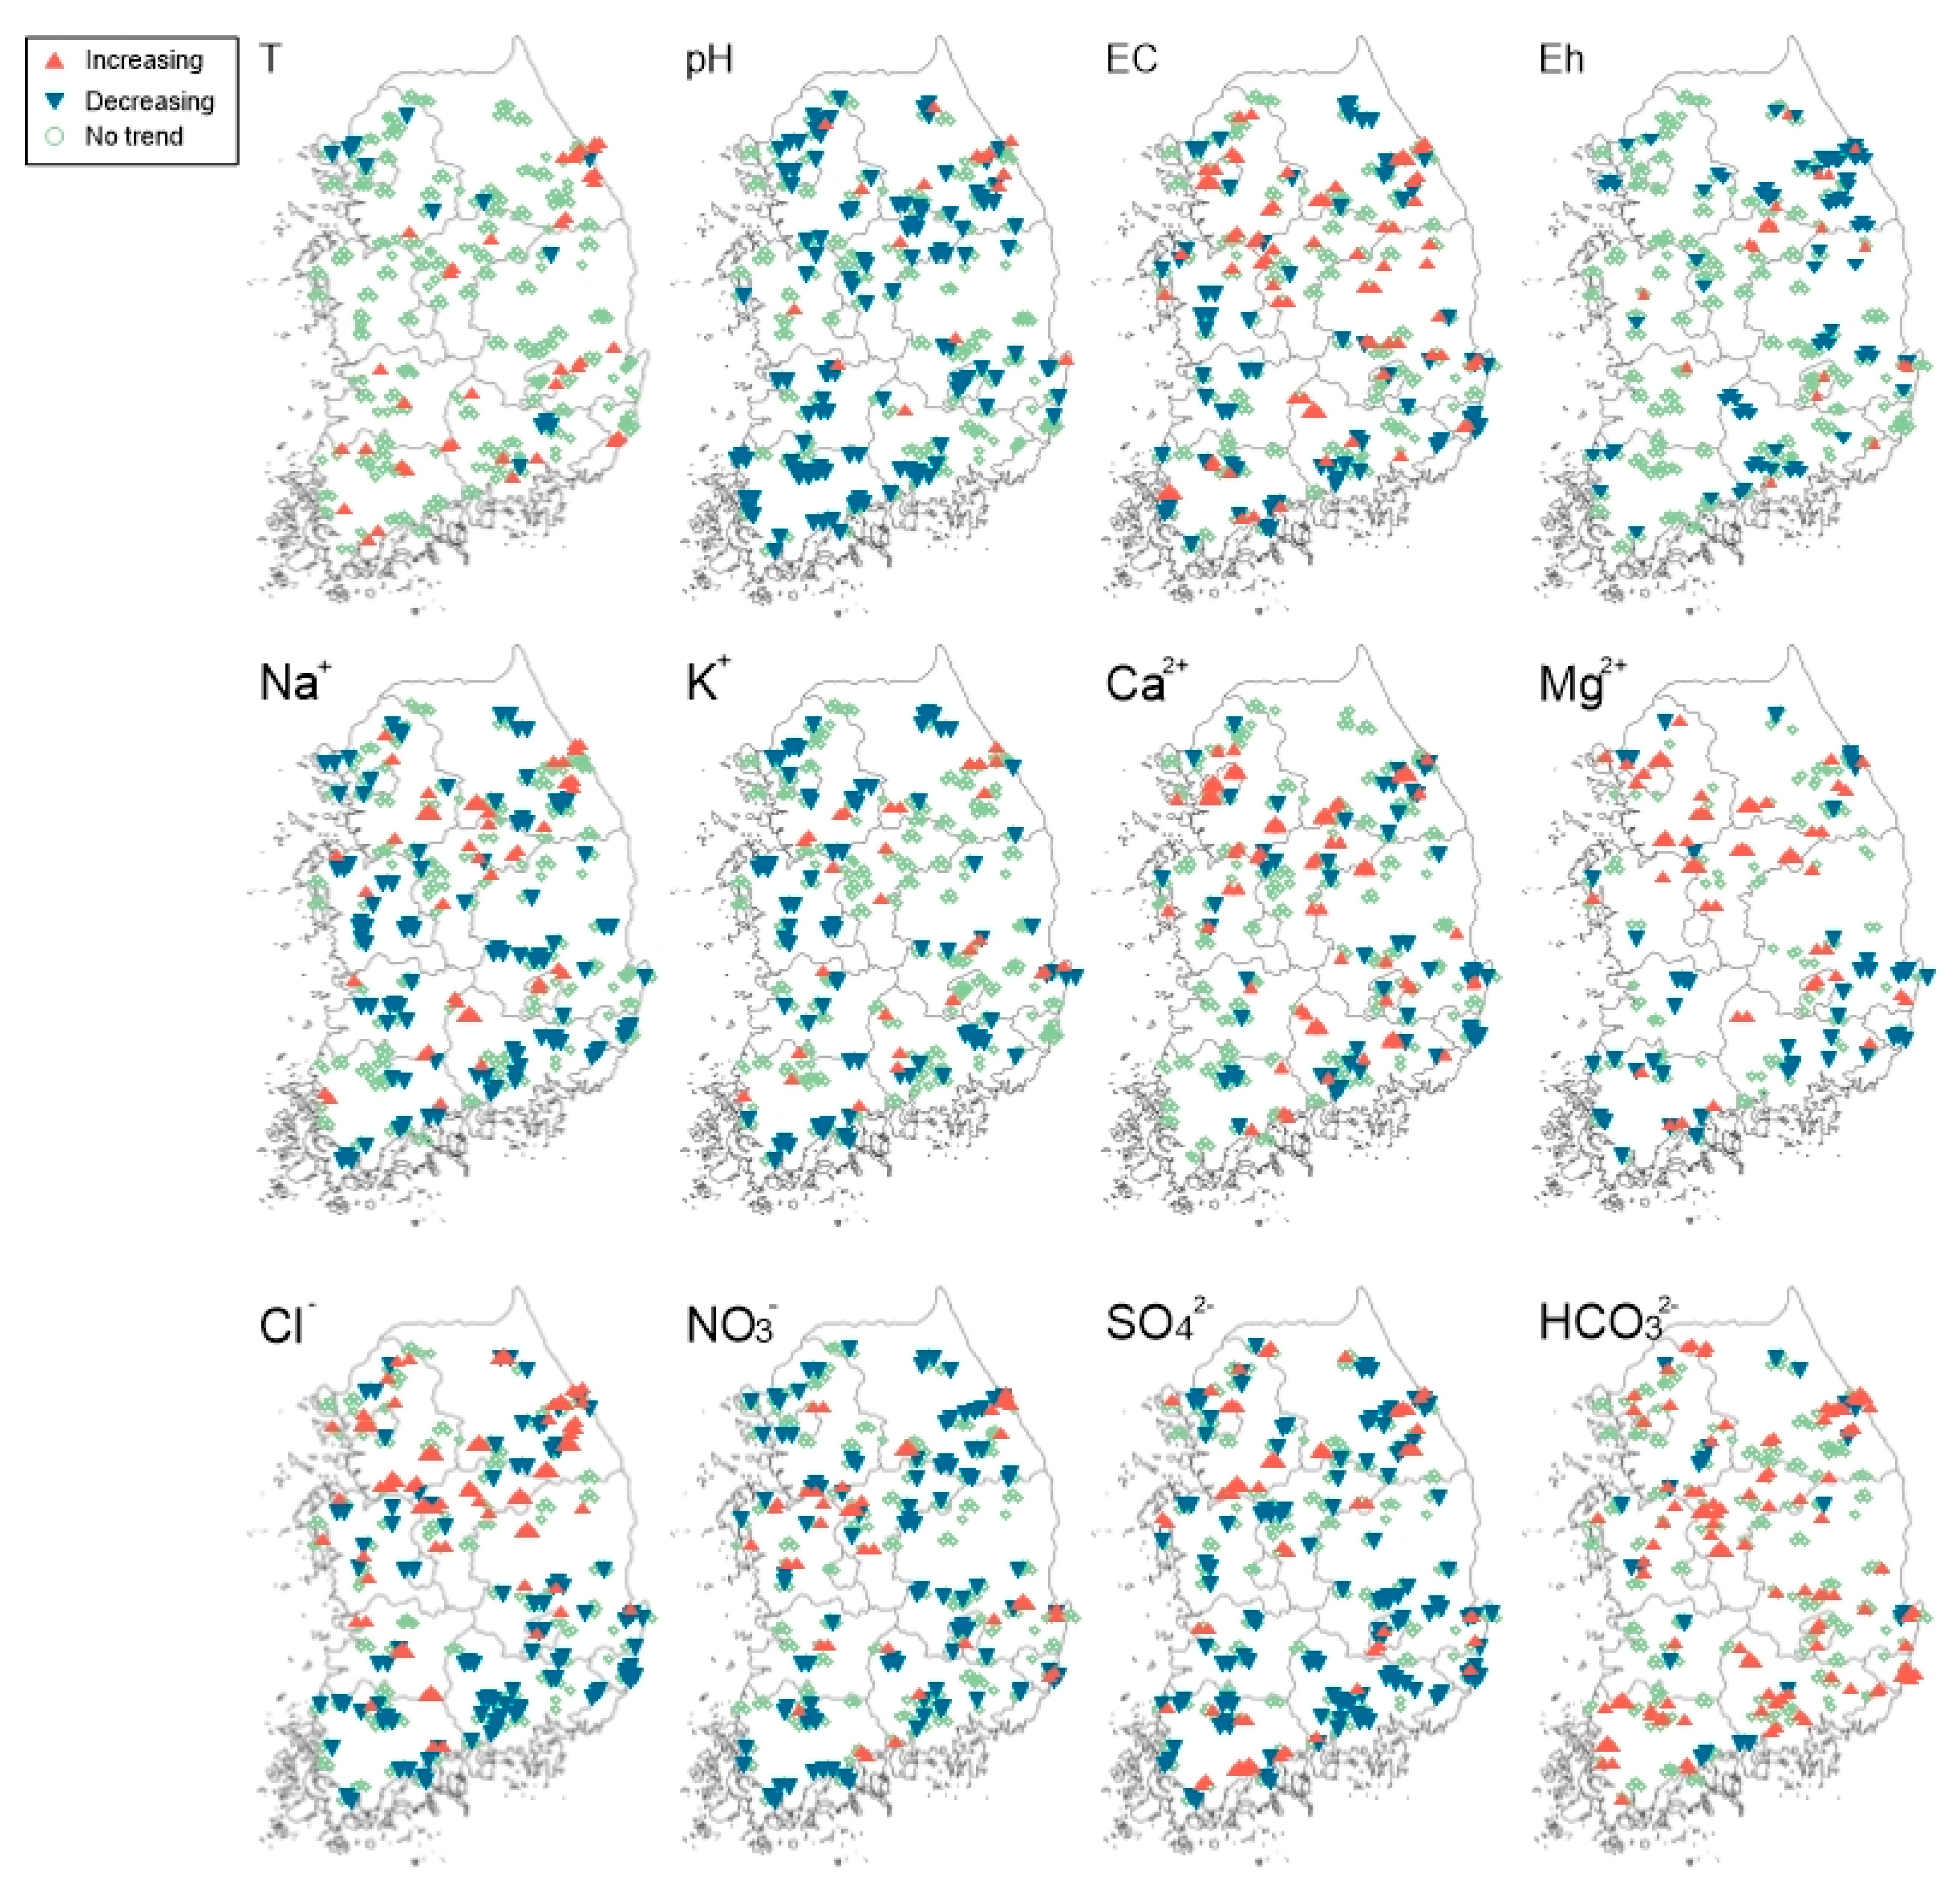
Results of the MK test and Sen’s test for the annual trends of groundwater quality parameters data for the period of 2008–2017, are shown in Table 2 and Table 3 results of parameter, which relatively divided by region, of MK test according to each well was plotted in Figure 3. MK and Sen’s analysis results of increasing and decreasing are same for all water quality parameters. A trend with a negative slope specifies that the concentration of parameter is declining, and positive slope indicates that the concentration is increasing. Both positive and negative trends were identified by the MK and Sen’s tests for the data. However, most of the trends did not show any change over time at the 95% and 99% confidence levels. It is more important to consider ratio of data with decreasing trend to the data with increasing trend and vice versa. Sen’s test gave higher values than MK test at same confidence level of 95%, but have similar trends for a parameter.
Temperature values have prominent increasing trend of 13.1% and 61.6% over the period of ten years using MK and Sen’s test, respectively. For pH, decreasing trend is dominating over increasing trend as 29.1% and 71.1% of samples found with decreasing trend by MK and Sen’s tests. EC (μS/cm) has increased in 19.6% (MK) and 54.5% (Sen’s) of samples, over the period of ten years. Eh (mV) has prominent decreasing trend in 20.1% (MK) and 65.1% (Sen’s) of samples, over the percentage of samples with increasing trend. In cations Na+ (mg/L) and K+ (mg/L), the values have decreased for 24.1% and 18.8% (MK), and 58.8% and 52.8% (Sen’s) of groundwater data, respectively. The percentage of groundwater data with increasing trend for Na+ and K+ is lower than data with decreasing trend. Cations Ca2+ (mg/L) and Mg2+ (mg/L), values showed a dominating increasing trend by MK (18.6% and 20.6%) and Sen’s (57.8% and 55.0%) test, over ten years. Most of the anions have showed decreasing trends. Anions Cl− (mg/L), NO3− (mg/L), and SO42− (mg/L) have decreasing trends as resulted by MK: 24.6%, 24.1%, and 30.9%, and Sen’s: 51.5%, 53.0%, and 58.3%, respectively. The percentage of groundwater data with increasing trends of mentioned anions was relatively lower than data with decreasing trends. Anions CO32− (mg/L) and HCO3− (mg/L) on the other hand, have showed an increasing trend in 65.3% and 28.6% (MK), and 62.9% and 67.3% (Sen’s) of groundwater data, respectively. Figure 3 shows similar variations as Table 2, Table 3 and trend in parameters are expressed as increasing, decreasing, and no trend using the MK test value calculated with 95% confidence. There was no prominent trend for T in groundwater over the period of ten years. Prominent increasing trend over the decreasing trend was observed for groundwater; EC, Ca2+, Mg2+, and HCO3−. The dominating decreasing trend over increasing trend pH, Eh, Na+, K+, Cl−, NO3−, and SO42−, during the studied period.
There are two main sources of ions in water: one is ion recharge through precipitation water including contaminants from atmosphere, and the other is ions input to groundwater from rock weathering and soil minerals dissolution [53]. Extreme precipitations, floods, and droughts have effects on variation in water quality parameters. As precipitation decreases, the concentration of ions such as Na+, K+, Ca2+, Mg2+, Cl−, HCO32−, SO42−, and EC increases in groundwater and this study also increase Ca2+, Mg2+, HCO32− [54]. Air temperature affects soil temperature, and soil temperature affects weathering of rocks and the melting of minerals [11,55]. Likewise, pH are main factors controlling geochemistry of ions present in groundwater [11]. A decline in pH and increase in EC, is common during the dry season, and concentrations got diluted in wet season [16]. Any change in duration and intensity of dry and wet season could be responsible for changing values of groundwater quality parameters.
Bivariate Plots and Geochemistry of Water Quality Parameters
A Spearman correlation matrix was used to measure the degree of relation between important groundwater quality parameters. The numerical values of the correlation coefficients for the important groundwater quality parameters were presented in Table 4. The greater (+1) the value of correlation coefficient is, the useful regression parameters are [5]. EC and TDS were observed to have strong positive correlation between them and with other parameters: Na+, K+, Ca2+, Mg2+, Cl−, and SO42− (r > 0.83) at significance level of <0.005 (Table 4). The Na+ and Ca2+ showed significant results of strong positive correlation between each other and with other parameters: Mg2+, Cl−, and SO42− (r > 0.89). The Mg2+ and Cl− showed significant results of strong positive correlation between each other and with SO42− (r > 0.95). The strong positive correlation between parameters indicates the extent of the relation and suggests that these parameters derived from a common source [56].
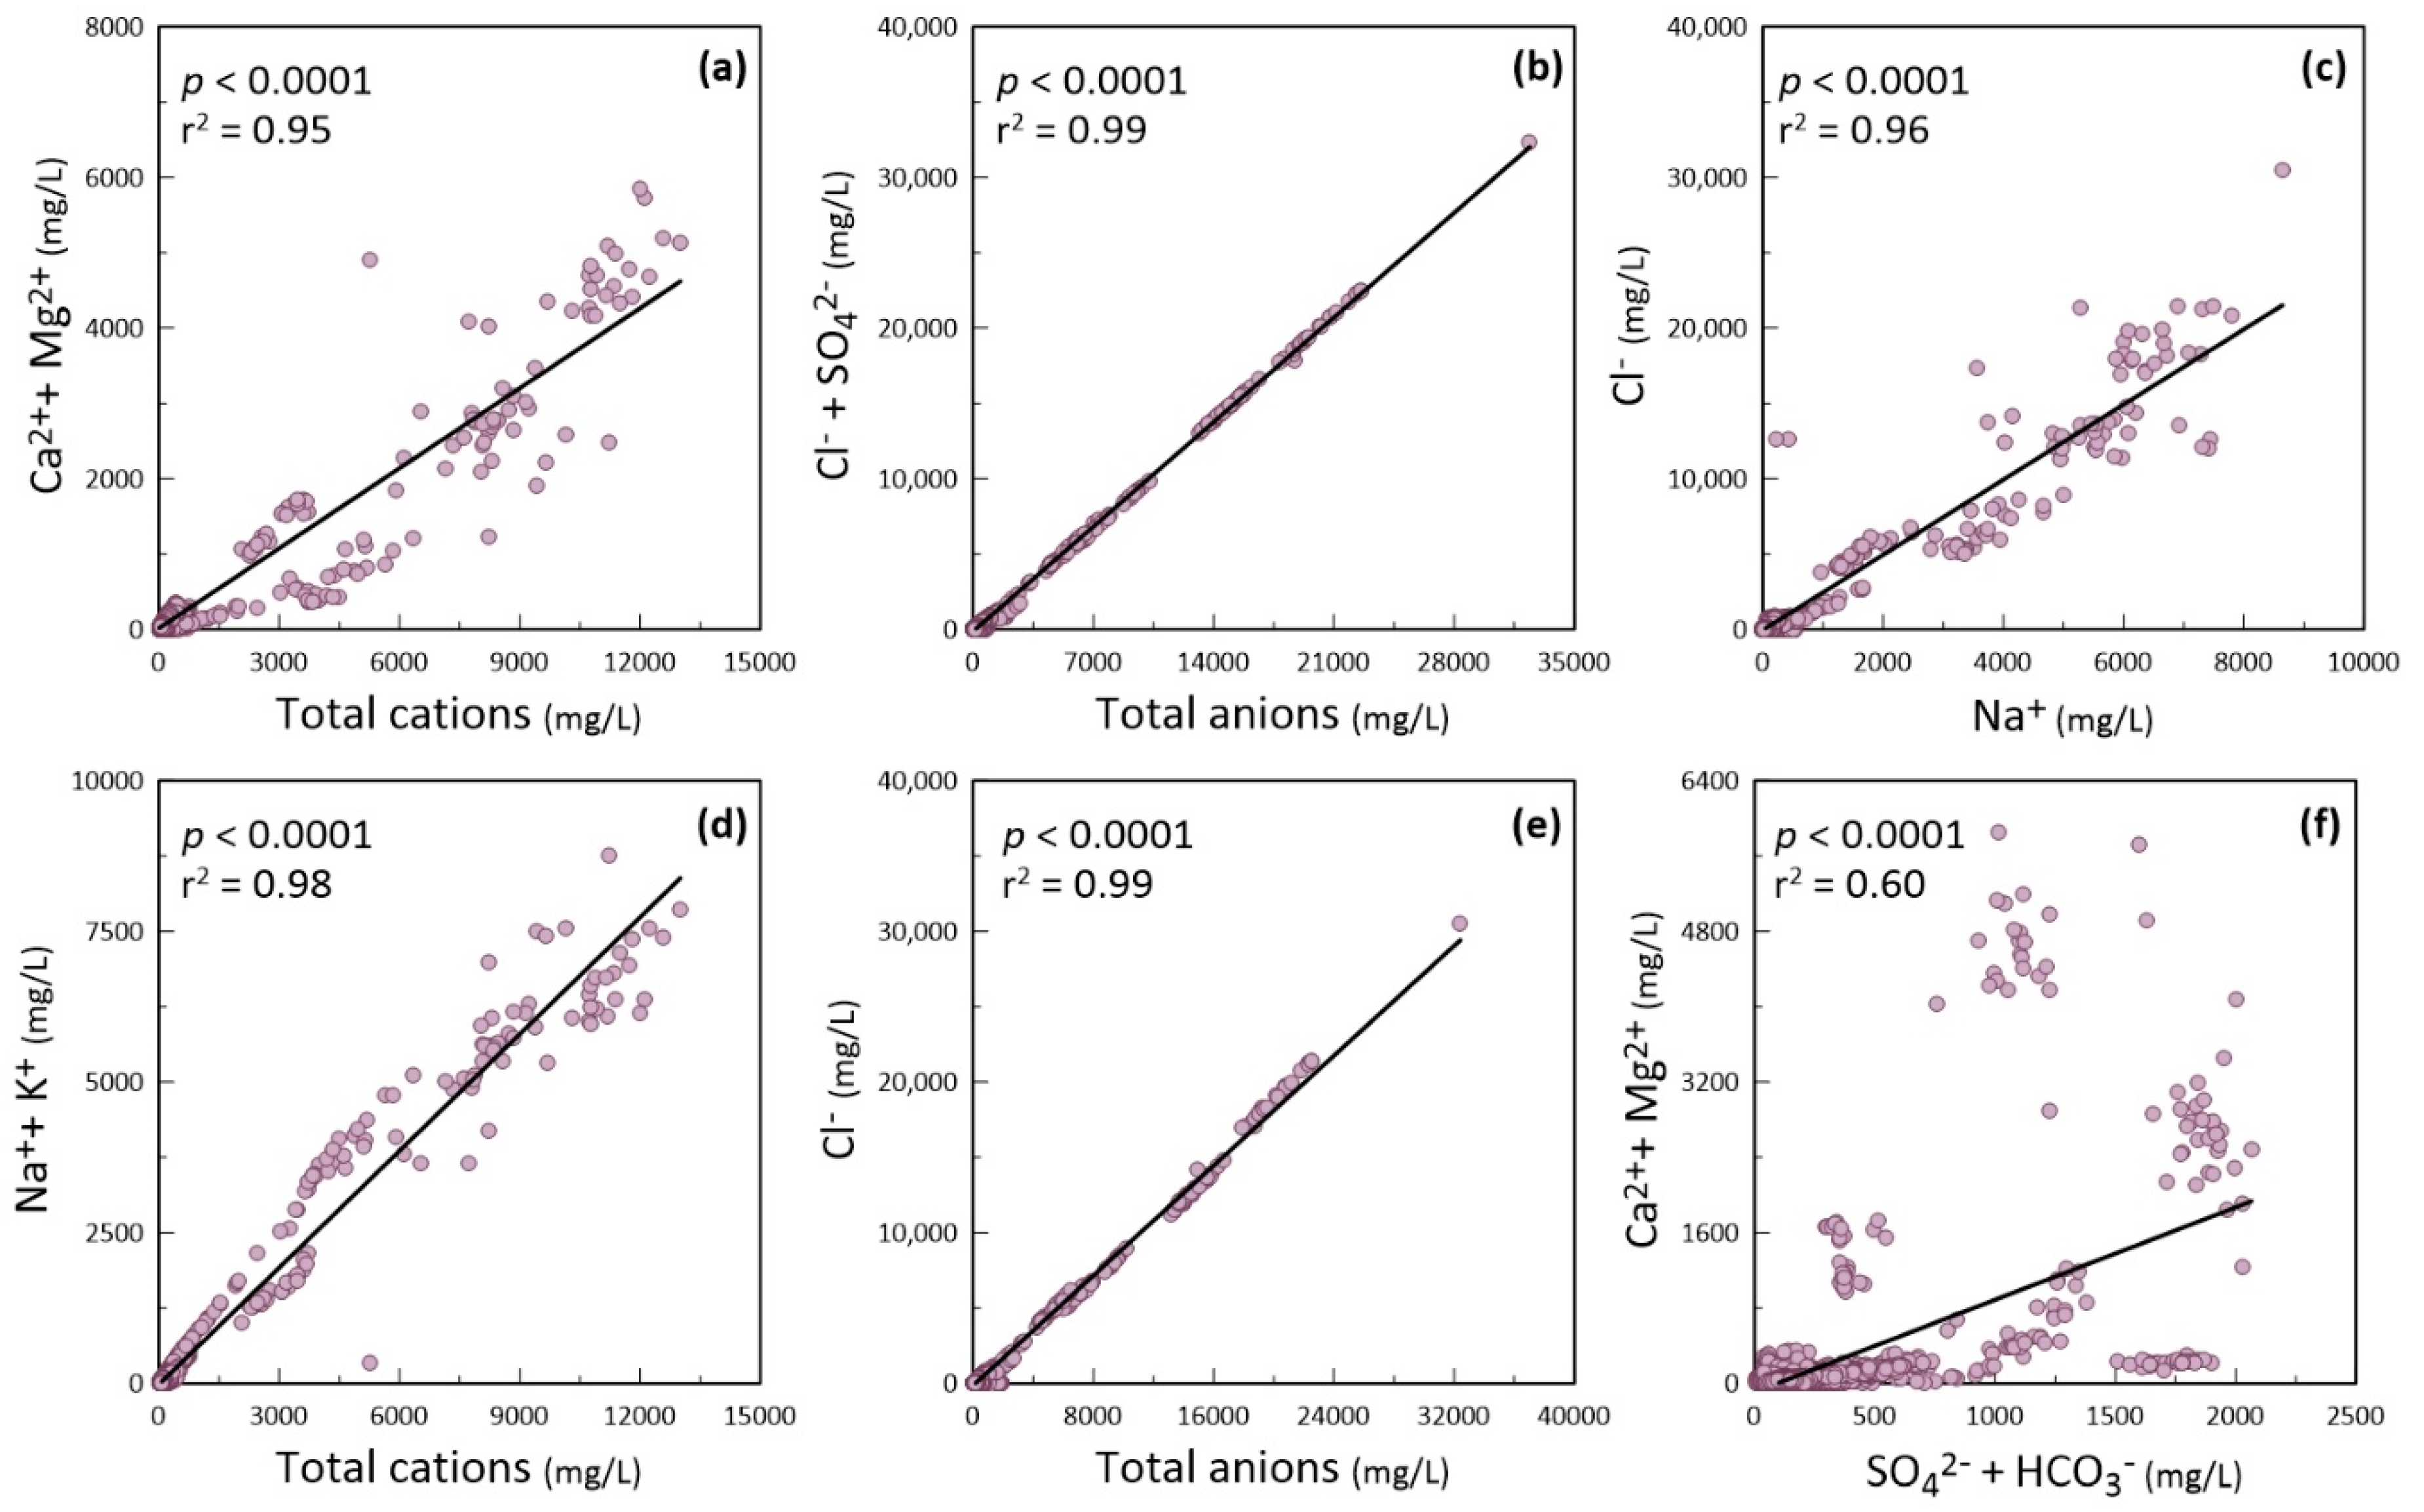
The relationships between average values of the major elements are shown as bivariate plots in Figure 4. Bivariate plot of Ca2+ and Mg2+ versus total cations was found to have a ratio of 0.95, indicating that most of the ions were balanced by total cations (Figure 4a). The increasing Na+ value might result from the weathering process of silicate, which can be clarified by ratio of Na+ and K+ versus total cations. In Figure 4d, most of the samples are plotted on and near the trend line with the ratio of 0.98, indicates the input of silicate weathering with abundance of Na+ and K+ [57]. Generally, Na+ is the relatively dominant ion and potassium is apparently low. Chemical weathering of minerals of regional rocks (sedimentary and igneous) and clay minerals are the natural source of K+ in water [58]. In Figure 4b,e, the ratio of bivariate plot of Cl− and SO42− versus total anions and Cl− versus total anions was 0.99, clearly showing the dominance of bicarbonates over the alkaline ions [41]. The ratio of Cl− versus Na+ was used to recognize the sources of salinity in groundwater settings. In Figure 4c, value of Cl− is shown as a function of Na+ in the groundwater and have a strong correlation of 0.96 between them. High values of Cl− and Na+ can be resulted from the seawater intrusion in groundwater in coastal areas. In areas away from coast, can be resulted from dissolution of salts in soil with high evaporation rate during the dry season [59]. The ratio of Ca2+ and Mg2+ versus SO42− and HCO3− was 0.60. Bicarbonate ions in groundwater generally originate from the reaction of carbonate ions with water molecules, releasing hydroxyl ions into the water, increasing the water alkalinity [60]. The main processes responsible for the Ca2+ ion release in waters are dissolution of calcite and the modification of feldspar [61]. In Figure 4f, some points are present on or near to trend line suggesting dissolution of carbonates, and some are away from trend line suggesting other sources [62]. Excess of Ca2+ over Mg2+ is when calcite is more plentiful than dolomite. Ca2+ ions can be derived from calcite and dolomite (carbonates) or gypsum (sulfates) [59,63]. The quality of groundwater in Korea is majorly resultant from water–rock interaction with weathering of rock, dissolution of carbonates or sulfates, and ion exchange between water molecules and clay minerals.
3.3. Groundwater Suitability
3.3.1. Suitability for Drinking
The results obtained from the physico-chemical data of groundwater in Korea, were further assessed for the suitability of drinking uses in the domestic sector. The data for drinking water quality was compared with WHO and KME established guidelines [35,36]. Summary of groundwater data of ten years with its suitability for drinking and possible health effects are given in Table 5. Groundwater average pH value falls within the guided values, but showed acidic to alkaline nature of water. Approximately, 33.4% and 7.9% of groundwater data were not suitable for drinking based on WHO and KME guidelines, respectively. This may be attributed to the anthropogenic activities which initiates the weathering process of soil rocks [64]. Groundwater median EC value (1325.0 µS/cm) remained within WHO guideline of 1300 µS/cm. Most of the groundwater was suitable for drinking, except 2.6% of groundwater, which might cause human health effects. Higher groundwater EC in the data is indicating the enrichment of salts in groundwater [1]. The TDS values varied from 21.6 to 25,630.0 mg/L with a median value of 168.0 mg/L. Around 28% of the groundwater was exceeding the WHO guided limit (1000 mg/L). High TDS in groundwater might resulted from the leaching of salts from soil, and can cause gastrointestinal effects in human [44]. Groundwater Ca2+, Mg2+, Na+, and K+ average values of 53.7, 18.5, 83.5, and 5.0 mg/L were below the WHO guidelines of 200, 100, 200, and 12 mg/L in drinking water, respectively. From 1.5% to 3.7% of groundwater was unsuitable for drinking purpose considering cationic values. These cations exist in groundwater mainly as bicarbonates and minerals and sometimes in the form of sulfate and chlorides, might cause health effects [1,44]. High Cl− concentration in groundwater is indicator of nature weathering of soil rocks, organic wastes of animal or industrial region, or seawater intrusion [45]. High SO42− concentration in groundwater is possible to retort with human organs [45]. In Korea, the average values of Cl− and SO42− in groundwater were 13.8 and 40.7 mg/L, and falls within the WHO guideline of 250 mg/L for both anions. About 3.0% and 2.1% (2.5% when compared to Korean guideline) of groundwater was unsuitable for drinking purpose, considering groundwater Cl− and SO42− values, respectively. From 1.5% to 33.4% of groundwater in Korea was unsuitable for drinking, considering the overall groundwater quality, but other than that, it was suitable for drinking purpose.
3.3.2. Suitability for Irrigation
Presence of excessive dissolved ions in water used for irrigation might affect agricultural soils and crops, both chemically and physically, and could lead to reduced productivity [65]. In this study, following measures were used to check groundwater quality for irrigation: EC, SAR, Na+ hazard (%), and RSC. The USSL diagram (SAR and EC plot) and Wilcox diagram (Na+% and EC plot) were used in addition, to evaluate the suitability of groundwater for irrigation purpose.
The water salinity is directly linked to the amount of dissolved salts that are measured by the EC of groundwater [66]. Table 6 revealed groundwater classification in five groups based on EC values, according to Richards classification [37]. There was 0% of data that showed unsuitability for irrigation purpose regarding EC value. The order of EC based classified groundwater was: good > excellent > doubtful with data values (%) of 6240 (70.21%), 2642 (29.73%), and 5 (0.06%), respectively. Irrigation water with high EC values can lead to the soil salinization, which is the major cause of decreasing crop productivity [51]. SAR is a measure of the water suitability for irrigation, because Na+ presence can reduce the permeability and structure of soil [38]. Groundwater with high SAR value used for irrigation, has an important affiliation with the level to which Na+ is absorbed by the soils. It might require soil amendments to stop long-term effects to the soil, because the Na+ in the water can shift the Ca2+ and Mg2+ in the soil. This can decrease the ability of the soil to procedure stable aggregates, damage of soil structure, decrease in soil permeability to water, and problems with crop production [38,51]. The classification of groundwater based on SAR values given in Table 6, are according to Rodd and Richards classification [37,38]. The order of SAR based classified groundwater was: excellent > unsuitable > doubtful > good with data values (%) of 8649 (97.32%), 86 (0.97%), 84 (0.95%), and 68 (0.77%), respectively. The Na+ hazard (%) in groundwater was used to evaluate groundwater for irrigation, based on Wilcox classification [39]. Table 6 indicated the order of groundwater suitability for irrigation considering Na+ (%) was: good (43.10%) > permissible (28.00%) > excellent (11.93%) > doubtful (11.07%) > unsuitable (5.91%). There were n = 525, with high Na+ (%) and unsuitable for irrigation purpose. In water with high HCO3−, there is a tendency for Ca2+ and Mg2+ to precipitate out as CO32−, and the residual CO32− or HCO3− remained as RSC [67]. In Table 6, groundwater RSC was classified according to Eaton and Richards classification [37,40]. The order of RSC groundwater classification was: suitable (94.09%) > marginal (3.52%) > unsuitable (2.39%). Overall, 98% of the groundwater was suitable for irrigation.
For rating the suitability of irrigation water, the USSL salinity diagram was used in which the graph is plotted between SAR an EC values [2]. Groundwater was ranked into classes from low-, medium-, high-, and very high-quality water for irrigation. In Figure 5, the USSL diagram was used to identify groundwater quality from 2008 to 2017. Most of groundwater data (98%) belonged to low Na+ hazard class (S1) and medium alkalinity hazard class (C2). The minimum values for Na+ hazard and alkalinity hazard were observed in 2008, when the amount of data was small. The data points with very high salinity and alkalinity class (C4-S4) were about 6% of total data in year 2009. Data points with very high salinity and alkalinity (C4-S4) were observed for 0.5% of total data in year 2017. Collectively, from 2008 to 2017, 94% of the groundwater was suitable in agricultural sector for irrigation. Groundwater with low Na+ can be used for irrigation in all soils with little risk of developing unsafe levels of exchangeable Na+. Groundwater belonged to medium Na+ class, can cause Na+ hazard in certain fine textured soils, particularly poorly percolated soils. But, this water might be safe to use in coarse textured or organic soils with good ability of permeability. High Na+ groundwater may resulted in harmful levels of exchangeable Na+ in most soil types and will need special management of soil, such as: good drainage, leaching, and addition of organic matter [67].
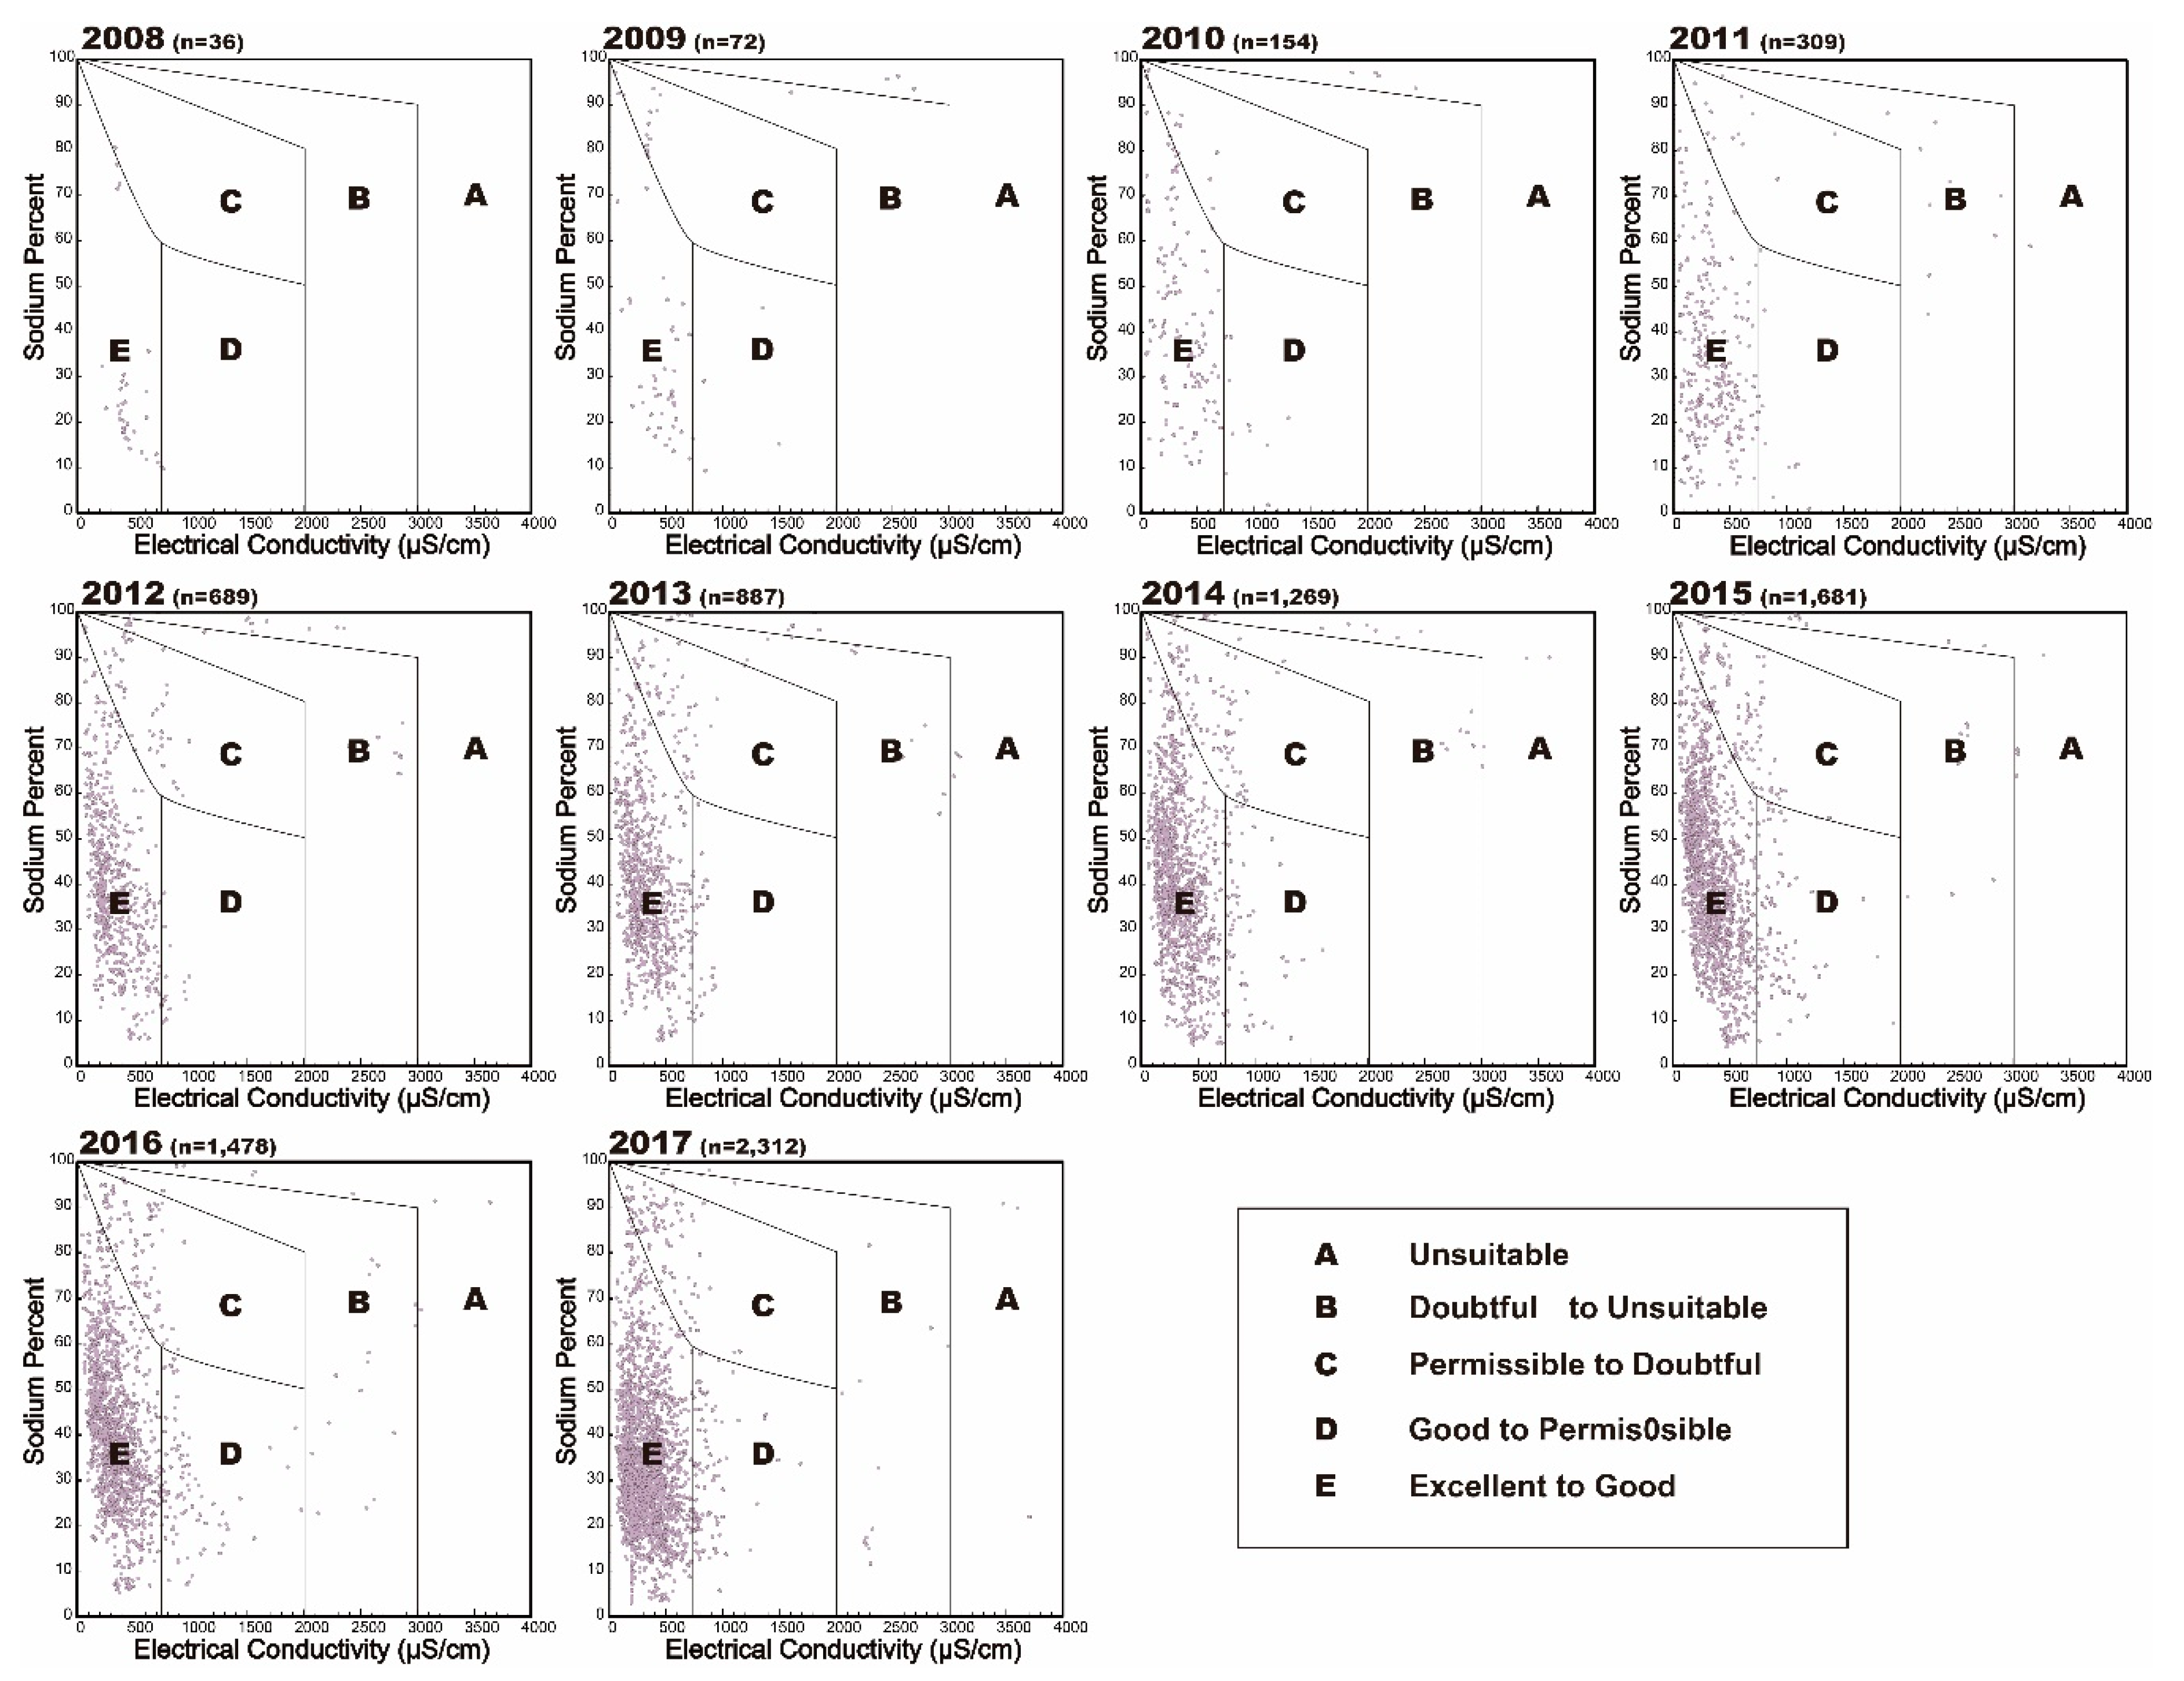
The groundwater quality classification for irrigation water quality was done using Wilcox diagram [39]. For this diagram groundwater data were plotted between annual average values of Na+% and EC values, from 2008 to 2017 (Figure 6). The groundwater data is classified as: unsuitable, doubtful to unsuitable, permissible to doubtful, good to permissible, and excellent to good for use as irrigation water. Majority of the groundwater data (65–89%) belonged to the excellent to good class, while remaining groundwater data (5–12%) were belonged to the permissible to doubtful class. However, year 2009 showed an exception, when 23% of the groundwater were observed to be unsuitable for irrigation. Generally, in studied ten years, the percentage of groundwater unsuitable for irrigation remained between 3% and 7%, except in year 2009 (23%). This is attributed to insufficient data numbers in the starting years of study, and good groundwater quality in study ending years is due to the increased data numbers. In every year (2008–2017), groundwater data points found in all classes of Wilcox diagram, with most of them in excellent to good class.
4. Conclusions
The purpose of this study was to assess hydrochemical properties of groundwater, its temporal trend, and suitability for use in Korea. Groundwater data for physico-chemical parameters was collected from 2008 to 2017. On average, the order of water type in Korea was: Ca-HCO3 > Ca-SO4 > Na-CO3 > Na-Cl during the studied period. There was no major change observed in the chemical composition of groundwater over the period of ten years. Certain variations in water quality parameters were observed over time. MK and Sen’s temporal trend analysis rvealed an increasing trends in: T, EC, Ca2+, Mg2+, CO32−, and HCO3− values of groundwater during the studied period. MK and Sen’s analysis showed decreasing trends in: pH, Na+, K+, Cl−, NO3−, and SO42− values in groundwater, during studied period. The quality of groundwater in Korea is majorly resulted from water-rock interaction with weathering of rock, dissolution of carbonates or sulphates, and ion exchange between water molecules and clay minerals. The suitability of groundwater for drinking was evaluated by comparing the groundwater quality data with WHO and KME guidelines for drinking water. From 1.5% to 33.4% of groundwater in Korea was unsuitable for drinking, considering the overall groundwater quality, but other than that, it was suitable for drinking purpose. To check groundwater suitability for irrigation purpose EC, SAR, Na+ hazard (%), USSL diagram, and Wilcox diagram were used. Approximately, 98% of the samples belonged to C1-S1 and C2-S1 class in USSL plot, which is low to medium quality irrigation water. The number of unsuitable groundwater data belonged to C4-S4 in USSL plot decreased over the time from 6% to 0.5%. In the Wilcox diagram, 83% of the groundwater data were excellent to good for irrigation, and 3 to 7% of groundwater was suitable for irrigation, except in year 2009 when 23% of the groundwater was unsuitable for irrigation. The RSC values revealed that approximately 94% of the groundwater was suitable for irrigation. Climate change, expanding industrialization, and agriculture is requiering a sustainable management of groundwater resource. For sustainability of groundwater resoucre in Korea, the GQMS data should be analyzed for decision making. New monitoring stations should be developed in area with few amount of data, to get reliable results of water quality analysis.
Author Contributions
Conceptualization, methodology, software, validation, formal analysis, investigation, writing—original draft preparation, writing—review and editing, and supervision, C.J., M.R., and J.-Y.L.; resources, data curation, visualization, project administration, and funding acquisition, C.-S.K., H.K., B.K., J.-W.K., R.-H.K., and S.-W.L. All authors have significantly contributed in manuscript preparation. All authors have read and agreed to the published version of the manuscript.
Funding
This research was funded by National Research Foundation of Korea (NRF) grant by the Korean government (MSIT) (No. NRF-2015R1A4A1041105). This research was also funded by Basic Science Research Program through the National Research Foundation of Korea (NRF) funded by the Ministry of Education (NRF-2018R1D1A1B07047200) and (No.2019R1A6A1A03033167).
Acknowledgments
We would like to thank the anonymous reviewers for their suggestions and comments.
Conflicts of Interest
The authors declare no conflict of interest.
References
- Prasanth, S.S.; Magesh, N.; Jitheshlal, K.; Chandrasekar, N.; Gangadhar, K. Evaluation of groundwater quality and its suitability for drinking and agricultural use in the coastal stretch of Alappuzha District, Kerala, India. Appl. Water Sci. 2012, 2, 165–175. [Google Scholar] [CrossRef] [Green Version]
- Staff, U.S.L. Diagnosis and improvement of saline and alkali soils. USDA Agric. Handb. 1954, 60, 160. [Google Scholar]
- Jung, I.W.; Bae, D.H.; Kim, G. Recent trends of mean and extreme precipitation in Korea. Int. J. Climatol. 2011, 31, 359–370. [Google Scholar] [CrossRef]
- Nam, W.-H.; Hayes, M.J.; Svoboda, M.D.; Tadesse, T.; Wilhite, D.A. Drought hazard assessment in the context of climate change for South Korea. Agric. Water Manag. 2015, 160, 106–117. [Google Scholar] [CrossRef]
- Lee, J.-Y.; Kwon, K.D.; Raza, M. Current water uses, related risks, and management options for Seoul megacity, Korea. Environ. Earth Sci. 2018, 77, 1–20. [Google Scholar] [CrossRef]
- Raza, M.; Lee, J.-Y.; Kwon, K.D. Estimation of quantitative spatial and temporal distribution for groundwater storage in agricultural basin of Korea: Implications for rational water use. Environ. Earth Sci. 2019, 78, 169. [Google Scholar] [CrossRef]
- KNCLD. Korea National Committee on Large Dams. Available online: http://www.kncold.or.kr/eng/ds6_1.html. (accessed on 12 December 2018).
- Lee, J.-Y.; Raza, M.; Park, Y.-C. Current status and management for the sustainable groundwater resources in Korea. Epis. J. Int. Geosci. 2018, 41, 179–191. [Google Scholar] [CrossRef] [Green Version]
- Lee, J.-Y.; Kwon, K. Current status of groundwater monitoring networks in Korea. Water 2016, 8, 168. [Google Scholar] [CrossRef] [Green Version]
- Lee, B.; Hamm, S.-Y.; Jang, S.; Cheong, J.-Y.; Kim, G.-B. Relationship between groundwater and climate change in South Korea. Geosci. J. 2014, 18, 209–218. [Google Scholar] [CrossRef]
- Raza, M.; Hussain, F.; Lee, J.-Y.; Shakoor, M.B.; Kwon, K.D. Groundwater status in Pakistan: A review of contamination, health risks, and potential needs. Crit. Rev. Environ. Sci. Technol. 2017, 47, 1713–1762. [Google Scholar] [CrossRef]
- Ndoye, S.; Fontaine, C.; Gaye, C.; Razack, M. Groundwater quality and suitability for different uses in the Saloum area of Senegal. Water 2018, 10, 1837. [Google Scholar] [CrossRef] [Green Version]
- Raza, M.; Farooqi, A.; Niazi, N.K.; Ahmad, A. Geochemical control on spatial variability of fluoride concentrations in groundwater from rural areas of Gujrat in Punjab, Pakistan. Environ. Earth Sci. 2016, 75, 1364. [Google Scholar] [CrossRef]
- Amirataee, B.; Zeinalzadeh, K. Trends analysis of quantitative and qualitative changes in groundwater with considering the autocorrelation coefficients in west of Lake Urmia, Iran. Environ. Earth Sci. 2016, 75, 371. [Google Scholar] [CrossRef]
- Yun, S.W.; Lee, J.-Y.; Lee, H.G. Variation of stream water quality and baseflow contribution from groundwater during rainfall event in the Haean basin. J. Geol. Soc. Korea 2015, 51, 611–621. [Google Scholar] [CrossRef]
- Raza, M.; Lee, J.-Y. Factors affecting spatial pattern of groundwater hydrochemical variables and nitrate in agricultural region of Korea. Epis. J. Int. Geosci. 2019, 42, 135–148. [Google Scholar] [CrossRef]
- Lee, J.-Y.; Song, S.-H. Evaluation of groundwater quality in coastal areas: Implications for sustainable agriculture. Environ. Geol. 2007, 52, 1231–1242. [Google Scholar] [CrossRef]
- Kim, H.; Lee, J.-Y.; Jeon, W.-H.; Lee, K.-K. Groundwater environment in Seoul, Republic of Korea. In Groundwater Environment in Asian Cities; Elsevier: Amsterdam, The Netherlands, 2016; pp. 413–449. [Google Scholar]
- Chae, G.-T.; Yun, S.-T.; Choi, B.-Y.; Yu, S.-Y.; Jo, H.-Y.; Mayer, B.; Kim, Y.-J.; Lee, J.-Y. Hydrochemistry of urban groundwater, Seoul, Korea: The impact of subway tunnels on groundwater quality. J. Contam. Hydrol. 2008, 101, 42–52. [Google Scholar] [CrossRef]
- Park, Y.-C.; Jo, Y.-J.; Lee, J.-Y. Trends of groundwater data from the Korean National groundwater monitoring stations: Indication of any change? Geosci. J. 2011, 15, 105–114. [Google Scholar] [CrossRef]
- Kaown, D.; Hyun, Y.; Bae, G.-O.; Oh, C.W.; Lee, K.-K. Evaluation of spatio-temporal trends of groundwater quality in different land uses using Kendall test. Geosci. J. 2012, 16, 65–75. [Google Scholar] [CrossRef]
- Hwang, J.Y.; Park, S.; Kim, H.-K.; Kim, M.-S.; Jo, H.-J.; Kim, J.-I.; Lee, G.-M.; Shin, I.-K.; Kim, T.-S. Hydrochemistry for the assessment of groundwater quality in Korea. J. Agric. Chem. Environ. 2017, 6, 72576. [Google Scholar] [CrossRef] [Green Version]
- Chung, S.; Venkatramanan, S.; Kim, T.; Kim, D.; Ramkumar, T. Influence of hydrogeochemical processes and assessment of suitability for groundwater uses in Busan City, Korea. Environ. Dev. Sustain. 2015, 17, 423–441. [Google Scholar] [CrossRef]
- Chae, J.-S.; Kim, G. Seasonal and spatial variations of tritium in precipitation in Northeast Asia (Korea) over the last 20 years. J. Hydrol. 2019, 574, 794–800. [Google Scholar] [CrossRef]
- KMA. Korea Meteorological Administration, Rainfall. Available online: http://web.kma.go.kr/eng/index.jsp (accessed on 23 December 2019).
- Groundwater Management Basic Plan; Ministry of Land, Transport and Maritime Affairs (MLTMA): Sejong, Korea, 2012; p. 159.
- Korea Ministry of Environment. A Master Plan for Expansion and Revision of the Groundwater Quality Monitoring Network. Available online: http://eng.me.go.kr/eng/web/main.do (accessed on 5 December 2018).
- Mann, H. Non-parametric tests against trend. Econometrica 1945, 13, 245–259. [Google Scholar] [CrossRef]
- Kendall, M. Rank Correlation Measures; Charles Griffin: London, UK, 1975; p. 202. [Google Scholar]
- Tabari, H.; Abghari, H.; Hosseinzadeh Talaee, P. Temporal trends and spatial characteristics of drought and rainfall in arid and semiarid regions of Iran. Hydrol. Process. 2012, 26, 3351–3361. [Google Scholar] [CrossRef]
- Kampata, J.M.; Parida, B.P.; Moalafhi, D. Trend analysis of rainfall in the headstreams of the Zambezi River Basin in Zambia. Phys. Chem. Earth Parts A/B/C 2008, 33, 621–625. [Google Scholar] [CrossRef]
- Theil, H. A rank-invariant method of linear and polynomial regression analysis, 3; confidence regions for the parameters of polynomial regression equations. Indag. Math. 1950, 1, 467–482. [Google Scholar]
- Sen, P.K. Estimates of the regression coefficient based on Kendall’s tau. J. Am. Stat. Assoc. 1968, 63, 1379–1389. [Google Scholar] [CrossRef]
- Some’e, B.S.; Ezani, A.; Tabari, H. Spatiotemporal trends and change point of precipitation in Iran. Atmos. Res. 2012, 113, 1–12. [Google Scholar]
- Sayemuzzaman, M.; Jha, M.K. Seasonal and annual precipitation time series trend analysis in North Carolina, United States. Atmos. Res. 2014, 137, 183–194. [Google Scholar] [CrossRef]
- Guidelines for Drinking-Water Quality; WHO: Washington, DC, USA, 2011; Volume 216, pp. 303–304.
- Richard, L. Diagnosis and Improvement of Saline and Alkaline Soils, USDA; USA Government, Printing Office: Washington, DC, USA, 1954; p. 60.
- Todd, D.K. Ground Water Hydrology; Education Revolucionaria, El Instituto Cubano del Libro: La Habana, Cuba, 1970; p. 336. [Google Scholar]
- Wilcox, L. Classification and Use of Irrigation Waters; USA Department of Agriculture: Washington, DC, USA, 1955; pp. 1–19.
- Eaton, F.M. Significance of carbonates in irrigation waters. Soil Sci. 1950, 69, 123–134. [Google Scholar] [CrossRef]
- Islam, M.A.; Zahid, A.; Rahman, M.M.; Rahman, M.S.; Islam, M.; Akter, Y.; Shammi, M.; Bodrud-Doza, M.; Roy, B. Investigation of groundwater quality and its suitability for drinking and agricultural use in the south central part of the coastal region in Bangladesh. Expo. Health 2017, 9, 27–41. [Google Scholar]
- Taniguchi, M.; Shimada, J.; Uemura, T. Transient effects of surface temperature and groundwater flow on subsurface temperature in Kumamoto Plain, Japan. Phys. Chem. Earth Parts A/B/C 2003, 28, 477–486. [Google Scholar]
- Lee, J.M.; Kwon, E.H.; Woo, N.C. Natural and human-induced drivers of groundwater sustainability: A case study of the Mangyeong river basin in Korea. Sustainability 2019, 11, 1486. [Google Scholar] [CrossRef] [Green Version]
- Sharma, D.A.; Rishi, M.S.; Keesari, T. Evaluation of groundwater quality and suitability for irrigation and drinking purposes in southwest Punjab, India using hydrochemical approach. Appl. Water Sci. 2017, 7, 3137–3150. [Google Scholar] [CrossRef] [Green Version]
- Selvakumar, S.; Ramkumar, K.; Chandrasekar, N.; Magesh, N.; Kaliraj, S. Groundwater quality and its suitability for drinking and irrigational use in the Southern Tiruchirappalli district, Tamil Nadu, India. Appl. Water Sci. 2017, 7, 411–420. [Google Scholar] [CrossRef] [Green Version]
- Stumm, W.; Morgan, J. Aquatic Chemistry; John Wiley & Sons. Inc.: New York, NY, USA, 1996; p. 1022. [Google Scholar]
- Roy, A.; Keesari, T.; Mohokar, H.; Sinha, U.K.; Bitra, S. Assessment of groundwater quality in hard rock aquifer of central Telangana state for drinking and agriculture purposes. Appl. Water Sci. 2018, 8, 124. [Google Scholar] [CrossRef] [Green Version]
- Hölting, B.; Coldewey, W.G. Groundwater classifications. In Hydrogeology; Springer: Berlin/Heidelberg, Germany, 2019; pp. 193–199. [Google Scholar]
- Franke, O.L. Concepts and Modeling in Ground-Water Hydrology: A Self-Paced Training Course; USA Geological Survey: Reston, VA. USA, 1991; Volume 90, p. 707.
- Hosseinifard, S.J.; Aminiyan, M.M. Hydrochemical characterization of groundwater quality for drinking and agricultural purposes: A case study in Rafsanjan plain, Iran. Water Qual. Expo. Health 2015, 7, 531–544. [Google Scholar] [CrossRef] [Green Version]
- Ako, A.A.; Shimada, J.; Hosono, T.; Ichiyanagi, K.; Nkeng, G.E.; Fantong, W.Y.; Eyong, G.E.T.; Roger, N.N. Evaluation of groundwater quality and its suitability for drinking, domestic, and agricultural uses in the Banana Plain (Mbanga, Njombe, Penja) of the Cameroon Volcanic Line. Environ. Geochem. Health 2011, 33, 559–575. [Google Scholar] [CrossRef]
- Jeong, C.-H. Mineral-water interaction and hydrogeochemistry in the Samkwang mine area, Korea. Geochem. J. 2001, 35, 1–12. [Google Scholar] [CrossRef] [Green Version]
- Taniguchi, M. Subsurface water responses to land cover/use changes: An overview. In Subsurface Hydrological Responses to Land Cover and Land Use Changes; Springer: Berlin/Heidelberg, Germany, 1997; pp. 1–20. [Google Scholar]
- Ghazavi, R.; Vali, A.B.; Eslamian, S. Impact of flood spreading on groundwater level variation and groundwater quality in an arid environment. Water Resour. Manag. 2012, 6, 1651–1663. [Google Scholar] [CrossRef]
- Kurylyk, B.L.; MacQuarrie, K.T.B.; McKenzie, J.M. Climate change impacts on groundwater and soil temperatures in cold and temperate regions: Implications, mathematical theory, and emerging simulation tools. Earth Sci. Rev. 2014, 138, 313–334. [Google Scholar] [CrossRef]
- Wang, P.; Yu, J.; Zhang, Y.; Liu, C. Groundwater recharge and hydrogeochemical evolution in the Ejina Basin, northwest China. J. Hydrol. 2013, 476, 72–86. [Google Scholar] [CrossRef]
- Ka, S.; Ka, S.; Ra, P.; Sa, G.; CS, S. An evaluation of hydrogeochemistry of groundwater in upper Vellar sub–basin using mineral stability and solute transport modelling. Aquat. Proc. 2015, 4, 1119–1125. [Google Scholar]
- Sarin, M.; Krishnaswami, S.; Dilli, K.; Somayajulu, B.; Moore, W. Major ion chemistry of the Ganga-Brahmaputra river system: Weathering processes and fluxes to the Bay of Bengal. Geochim. Cosmochim. Acta 1989, 53, 997–1009. [Google Scholar] [CrossRef]
- Datta, P.; Tyagi, S. Major ion chemistry of groundwater in Delhi area: Chemical weathering processes and groundwater flow regime. J. Geol. Soc. India 1996, 47, 179–188. [Google Scholar]
- Rajmohan, N.; Elango, L. Identification and evolution of hydrogeochemical processes in the groundwater environment in an area of the Palar and Cheyyar River Basins, Southern India. Environ. Geol. 2004, 46, 47–61. [Google Scholar] [CrossRef]
- Touhari, F.; Meddi, M.; Mehaiguene, M.; Razack, M. Hydrogeochemical assessment of the upper Cheliff groundwater (North West Algeria). Environ. Earth Sci. 2015, 73, 3043–3061. [Google Scholar] [CrossRef] [Green Version]
- Fisher, R.S.; Mullican, W.F. III Hydrochemical evolution of sodium-sulfate and sodium-chloride groundwater beneath the northern Chihuahuan Desert, Trans-Pecos, Texas, USA. Hydrogeol. J. 1997, 5, 4–16. [Google Scholar] [CrossRef]
- Cerling, T.; Pederson, B.; Von Damm, K. Sodium-calcium ion exchange in the weathering of shales: Implications for global weathering budgets. Geology 1989, 17, 552–554. [Google Scholar] [CrossRef]
- Bhunia, G.S.; Keshavarzi, A.; Shit, P.K.; Omran, E.-S.E.; Bagherzadeh, A. Evaluation of groundwater quality and its suitability for drinking and irrigation using GIS and geostatistics techniques in semiarid region of Neyshabur, Iran. Appl. Water Sci. 2018, 8, 168. [Google Scholar] [CrossRef] [Green Version]
- Ebong, E.D.; Akpan, A.E.; Emeka, C.N.; Urang, J.G. Groundwater quality assessment using geoelectrical and geochemical approaches: Case study of Abi area, southeastern Nigeria. Appl. Water Sci. 2017, 7, 2463–2478. [Google Scholar] [CrossRef] [Green Version]
- Houatmia, F.; Azouzi, R.; Charef, A.; Bédir, M. Assessment of groundwater quality for irrigation and drinking purposes and identification of hydrogeochemical mechanisms evolution in Northeastern, Tunisia. Environ. Earth Sci. 2016, 75, 746. [Google Scholar] [CrossRef]
- Haritash, A.; Kaushik, C.P.; Kaushik, A.; Kansal, A.; Yadav, A.K. Suitability assessment of groundwater for drinking, irrigation and industrial use in some North Indian villages. Environ. Monit. Assess. 2008, 145, 397–406. [Google Scholar] [CrossRef]
Figure 1.
Location of the study area, stations of Groundwater Quality Monitoring Network (GQMN), and hydrogeologic units in Korea.
Figure 1.
Location of the study area, stations of Groundwater Quality Monitoring Network (GQMN), and hydrogeologic units in Korea.

Figure 2.
Piper plot showing groundwater chemical composition from 2008 to 2017, in Korea.

Figure 3.
Results of the Mann–Kendall trend for groundwater quality parameters from 2008 to 2017, at 95% significance.
Figure 3.
Results of the Mann–Kendall trend for groundwater quality parameters from 2008 to 2017, at 95% significance.

Figure 4.
Bivariate plots plotted between average values (2008–2017) of main ions in groundwater of Korea. P-values were significant (< 0.0001) in all bivariate plots.
Figure 4.
Bivariate plots plotted between average values (2008–2017) of main ions in groundwater of Korea. P-values were significant (< 0.0001) in all bivariate plots.

Figure 5.
USSL plot for classification of irrigation water quality based on groundwater SAR and EC values. The classification was done for annual average values of groundwater data from 2008 to 2017.
Figure 5.
USSL plot for classification of irrigation water quality based on groundwater SAR and EC values. The classification was done for annual average values of groundwater data from 2008 to 2017.

Figure 6.
Classification of groundwater for irrigation water quality, with respect to Na+% and EC values (Wilcox diagram). The classification was done for annual average values of groundwater data from 2008 to 2017.
Figure 6.
Classification of groundwater for irrigation water quality, with respect to Na+% and EC values (Wilcox diagram). The classification was done for annual average values of groundwater data from 2008 to 2017.


Table 1.
Statistical summary of groundwater quality parameters from 2008 to 2017, in Korea.
| Parameter | Year (Data No.) | 2008 (36) | 2009 (72) | 2010 (154) | 2011 (309) | 2012 (689) | 2013 (887) | 2014 (1269) | 2015 (1681) | 2016 (1478) | 2017 (2312) |
|---|---|---|---|---|---|---|---|---|---|---|---|
| T 1 | Range | 9.4–21.9 | 6.5–20.1 | 4.4–22.7 | 8.2–23.7 | 5.2–24.2 | 8.1–22.9 | 10.4–25.4 | 10.8–25.3 | 11.2–21.8 | 4.7–191.0 |
| Median | 14.1 | 14.6 | 14.4 | 15.4 | 15.9 | 15.7 | 16.1 | 16.1 | 16.1 | 16.3 | |
| SD | 2.5 | 2.8 | 3.0 | 2.2 | 2.3 | 2.0 | 1.9 | 1.8 | 1.8 | 4.6 | |
| pH | Range | 5.5–8.7 | 5.4–8.5 | 5.0–8.7 | 5.6–9.2 | 5.1–10.4 | 5.2–10.4 | 4.3–10.0 | 5.0–10.0 | 3.9–10.2 | 4.4–10.8 |
| Median | 7.0 | 6.9 | 6.9 | 7.1 | 7.0 | 6.8 | 7.0 | 7.0 | 7.0 | 6.6 | |
| SD | 0.8 | 0.8 | 0.7 | 0.7 | 0.9 | 0.8 | 0.8 | 0.7 | 0.8 | 0.7 | |
| EC 2 | Range | 220.0–759.0 | 50.0–35,600.0 | 47.0–35,300.0 | 46.0–23,000.0 | 53.0–46,400.0 | 55.0–46,600.0 | 57.0–48,100.0 | 56.0–47,300.0 | 43.0–47,620.0 | 42.0–36,610.0 |
| Median | 414.0 | 259.0 | 349.5 | 330.0 | 305.0 | 317.0 | 327.0 | 331.0 | 334.0 | 311.0 | |
| SD | 132.1 | 4293.2 | 5178.0 | 4190.1 | 4157.5 | 3680.7 | 3401.4 | 3216.6 | 2997.2 | 986.1 | |
| Eh 3 | Range | −56.0–606.0 | −159.0–801.0 | −30.0–533.0 | −109.0–813.0 | −148.0–638.0 | −128.0–798.0 | −150.0–685.0 | −325.0–604.0 | −306.9–659.3 | −425.0–892.0 |
| Median | 415.5 | 374.5 | 331.5 | 318.0 | 291.0 | 310.0 | 322.0 | 309.0 | 280.0 | 299.5 | |
| SD | 178.3 | 206.2 | 128.9 | 142.3 | 137.5 | 130.5 | 131.2 | 115.4 | 101.5 | 98.4 | |
| TDS | Range | 121.0–418.0 | 28.0–19,580.0 | 26.0–19,415.0 | 25.0–2035.0 | 29.0–25,520.0 | 30.0–25,630.0 | 28.0–24,000.0 | 27.0–23,650.0 | 21.6–23,330.0 | 20.3–2312.0 |
| Median | 228.0 | 259.0 | 192.0 | 182.0 | 168.0 | 174.0 | 160.0 | 162.0 | 164.0 | 199.0 | |
| SD | 72.8 | 4293.2 | 2847.9 | 2304.6 | 2286.6 | 2024.4 | 1663.9 | 1587.7 | 1472.0 | 1410.0 | |
| Na+ | Range | 7.7–64.8 | 7.8–8640.0 | 0.0–7420.0 | 0.1–6350.0 | 2.9–6363.0 | 3.1–6720.0 | 1.4–7795.0 | 2.2–7480.0 | 2.3–7075.0 | 1.4–4981.0 |
| Median | 10.7 | 23.1 | 26.7 | 15.4 | 16.7 | 19.2 | 19.8 | 18.6 | 19.4 | 15.3 | |
| SD | 16.5 | 1578.1 | 921.4 | 756.7 | 667.5 | 599.2 | 571.3 | 477.2 | 455.4 | 256.2 | |
| K+ | Range | 1.3–8.5 | 0.5–114.5 | 0.5–3200.0 | 0.2–124.0 | 0.6–106.9 | 0.1–97.6 | 0.3–129.1 | 0.3–122.7 | 0.3–120.2 | 0.1–135.4 |
| Median | 3.4 | 3.9 | 2.7 | 1.4 | 2.4 | 2.2 | 2.6 | 2.7 | 2.6 | 1.9 | |
| SD | 1.9 | 22.6 | 257.8 | 13.0 | 12.1 | 10.0 | 9.8 | 9.2 | 8.3 | 6.8 | |
| Ca2+ | Range | 11.2–107.5 | 0.1–1832.0 | 0.1–3400.0 | 1.7–3830.0 | 0.1–2668.0 | 0.1–3155.8 | 0.1–4000.0 | 0.1–3327.0 | 0.1–2914.8 | 1.3–1506.4 |
| Median | 55.4 | 49.9 | 28.8 | 27.4 | 23.0 | 26.9 | 25.0 | 25.1 | 225.7 | 33.9 | |
| SD | 21.3 | 381.4 | 338.5 | 394.1 | 292.5 | 237.8 | 224.9 | 188.9 | 167.6 | 87.2 | |
| Mg2+ | Range | 3.0–18.3 | 0.2–824.0 | 0.3–776.0 | 0.2–2357.0 | 0.2–21,180.8 | 0.1–1731.0 | 0.1–1794.0 | 0.1–1662.0 | 0.0–1564.0 | 0.1–633.0 |
| Median | 8.9 | 14.1 | 7.2 | 7.63 | 5.9 | 6.9 | 6.8 | 7.1 | 7.3 | 6.4 | |
| SD | 4.4 | 170.6 | 114.3 | 218.1 | 141.0 | 116.9 | 95.0 | 97.5 | 83.0 | 32.0 | |
| Cl− | Range | 1.0–100.0 | 0.6–30,479.0 | 2.0–12,594.0 | 1.4–21,324.0 | 2.0–19,776.1 | 1.9–18,256.3 | 0.1–21,430.0 | 1.9–21,407.0 | 1.5–19,942.0 | 0.1–11,992.5 |
| Median | 12.0 | 18.0 | 17.0 | 17.0 | 12.7 | 14.3 | 13.4 | 14.3 | 14.0 | 13.1 | |
| SD | 23.6 | 4309.3 | 1907.9 | 2535.7 | 1722.8 | 1527.7 | 1442.7 | 1244.5 | 1154.4 | 553.9 | |
| NO3− | Range | 0.1–170.9 | 0.1–335.6 | 0.1–344.0 | 0.1–325.4 | 0.1–248.9 | 0.1–218.5 | 0.1–220.1 | 0.1–227.3 | 0.1–368.9 | 0.1–327.8 |
| Median | 23.3 | 8.2 | 5.6 | 6.2 | 7.9 | 7.0 | 7.7 | 7.5 | 6.5 | 4.8 | |
| SD | 47.4 | 63.7 | 60.8 | 46.2 | 28.9 | 31.0 | 29.0 | 26.9 | 29.0 | 22.0 | |
| SO42− | Range | 0.1–92.7 | 0.1–1817.0 | 0.1–1909.0 | 0.1–1921.0 | 0.1–1863.5 | 0.1–1854.5 | 0.1–1950.0 | 0.1–1821.9 | 1.9–1983.2 | 0.1–1612.5 |
| Median | 24.5 | 29.0 | 18.7 | 19.0 | 14.5 | 15.0 | 14.6 | 14.5 | 14.7 | 11.9 | |
| SD | 28.1 | 397.5 | 296.4 | 255.3 | 171.3 | 154.4 | 142.6 | 125.1 | 125.0 | 69.9 | |
| CO32− | Range | 0.1–1.5 | 0.1–23.0 | 0.1–10.0 | 0.1–32.0 | 0.1–118.0 | 0.1–178.0 | 0.1–111.0 | 0.1–89.0 | 0.1–83.0 | 0.1–121.8 |
| Median | 0.1 | 0.1 | 0.1 | 0.1 | 0.1 | 0.1 | 0.1 | 0.1 | 0.1 | 0.1 | |
| SD | 0.2 | 2.7 | 3.5 | 1.9 | 5.8 | 8.7 | 5.5 | 3.5 | 3.3 | 4.1 | |
| HCO3− | Range | 23.2–200.0 | 13.0–290.0 | 10.0–266.0 | 2.0–804.0 | 10.0–825.0 | 8.0–881.0 | 0.1–1095.0 | 1.0–974.0 | 0.0–990.0 | 0.1–940.3 |
| Median | 110.7 | 157.5 | 115.0 | 80.2 | 94.0 | 98.0 | 105.0 | 96.0 | 99.0 | 122.0 | |
| SD | 55.4 | 84.9 | 95.6 | 121.4 | 91.8 | 89.5 | 98.9 | 94.6 | 93.9 | 88.5 |
The units of all parameters are in mg/L except; 1 T (°C), 2 EC (µS/cm), 3 Eh (mV).
Table 2.
Statistically significant trends at 95% and 99% confidence levels with Mann–Kendall of groundwater quality parameters from year 2008 to 2017.
Table 2.
Statistically significant trends at 95% and 99% confidence levels with Mann–Kendall of groundwater quality parameters from year 2008 to 2017.
| Parameter | Trend | Mann–Kendall Test | |||
|---|---|---|---|---|---|
| 95% | Z Value Range | 99% | Z Value Range | ||
| T | Increasing | 52 1 (13.1% 2) | 1.96~3.59 | 17 (4.3%) | 2.58~3.59 |
| Decreasing | 13 (3.3%) | −2.82~−2.00 | 2 (0.5%) | −2.82~−2.78 | |
| No trend | 333 (83.7%) | −1.92~1.94 | 379 (95.2%) | −2.35~2.57 | |
| pH | Increasing | 20 (5.0%) | 1.97~5.19 | 11 (2.8%) | 2.58~5.19 |
| Decreasing | 116 (29.1%) | −5.67~−1.96 | 77 (19.3%) | −5.67~−2.63 | |
| No trend | 262 (65.8%) | −1.94~1.94 | 310 (77.9%) | −2.57~2.56 | |
| EC (μS/cm) | Increasing | 78 (19.6%) | 1.97~6.62 | 50 (12.6%) | 2.74~6.62 |
| Decreasing | 71 (17.8%) | −5.42~−1.98 | 44 (11.1%) | −5.42~−2.67 | |
| No trend | 249 (62.6%) | −1.94~1.95 | 304 (76.4%) | −2.56~2.57 | |
| Eh (mV) | Increasing | 20 (5.0%) | 2.08~4.13 | 8 (2.0%) | 2.64~4.13 |
| Decreasing | 80 (20.1%) | −5.05~−1.97 | 51 (12.8%) | −5.05~−2.58 | |
| No trend | 298 (74.9%) | −1.90~1.96 | 339 (85.2%) | −2.54~2.56 | |
| Na+ (mg/L) | Increasing | 50 (12.6%) | 1.96~5.76 | 25 (6.3%) | 2.59~5.76 |
| Decreasing | 96 (24.1%) | −4.63~−1.98 | 56 (14.1%) | −4.63~−2.58 | |
| No trend | 252 (63.3%) | −1.94~1.95 | 317 (79.6%) | −2.57~2.54 | |
| K+ (mg/L) | Increasing | 32 (8.0%) | 1.96~4.46 | 16 (4.0%) | 2.64~4.46 |
| Decreasing | 75 (18.8%) | −4.86~−2.04 | 44 (11.1%) | −4.86~−2.59 | |
| No trend | 291 (73.1%) | −1.93~1.96 | 338 (84.9%) | −2.54~2.57 | |
| Ca2+ (mg/L) | Increasing | 74 (18.6%) | 1.98~7.50 | 52 (13.1%) | 2.58~7.50 |
| Decreasing | 43 (10.8%) | −6.90~−2.01 | 22 (5.5%) | −6.90~−2.58 | |
| No trend | 281 (70.6%) | −1.96~1.95 | 324 (81.4%) | −2.54~2.57 | |
| Mg2+ (mg/L) | Increasing | 82 (20.6%) | 1.98~5.26 | 56 (14.1%) | 2.58~5.26 |
| Decreasing | 48 (12.1%) | −4.52~−1.96 | 32 (8.0%) | −4.52~−2.81 | |
| No trend | 268 (67.3%) | −1.93~1.96 | 310 (77.9%) | −2.57~2.57 | |
| Cl− (mg/L) | Increasing | 85 (21.4%) | 1.98~7.90 | 64 (16.1%) | 2.58~7.90 |
| Decreasing | 98 (24.6%) | −6.75~−1.97 | 70 (17.6%) | −6.75~−2.58 | |
| No trend | 215 (54.0%) | −1.95~1.85 | 264 (66.3%) | −2.56~2.48 | |
| NO3− (mg/L) | Increasing | 46 (11.6%) | 2.01~5.77 | 30 (7.5%) | 2.63~5.77 |
| Decreasing | 96 (24.1%) | −7.03~−2.06 | 62 (15.6%) | −7.03~−2.59 | |
| No trend | 256 (64.3%) | −1.96~1.93 | 306 (76.9%) | −2.57~2.54 | |
| SO42− (mg/L) | Increasing | 65 (16.3%) | 2.00~5.44 | 49 (12.3%) | 2.59~5.44 |
| Decreasing | 123 (30.9%) | −6.21~−1.98 | 87 (21.9%) | −6.21~−2.59 | |
| No trend | 210 (52.8%) | −1.89~1.89 | 262 (65.8%) | −2.57~2.52 | |
| HCO3− (mg/L) | Increasing | 114 (28.6%) | 1.96~6.41 | 71 (17.8%) | 2.59~6.41 |
| Decreasing | 23 (5.8%) | −3.91~−1.98 | 10 (2.5%) | −3.91~−2.59 | |
| No trend | 261 (65.6%) | −1.90~1.96 | 317 (79.6%) | −2.56~2.57 | |
1 Corresponding station numbers, 2 percentage of selective domain.
Table 3.
Statistically significant trends at 95% and 99% confidence levels with Sen’s tests of groundwater quality parameters from year 2008 to 2017.
Table 3.
Statistically significant trends at 95% and 99% confidence levels with Sen’s tests of groundwater quality parameters from year 2008 to 2017.
| Parameter | Trend | Sen’s Test | ||
|---|---|---|---|---|
| 95% and 99% | Qmed (minimum) | Qmed (maximum) | ||
| T | Increasing | 245 (61.6%) | 0.00 | 0.30 |
| Decreasing | 132 (33.2%) | −0.50 | 0.00 | |
| No trend | 21 (5.3%) | 0.00 | 0.00 | |
| pH | Increasing | 90 (22.6%) | 0.00 | 0.08 |
| Decreasing | 283 (71.1%) | −0.14 | 0.00 | |
| No trend | 25 (6.3%) | 0.00 | 0.00 | |
| EC (μS/cm) | Increasing | 217 (54.5%) | 0.01 | 213.33 |
| Decreasing | 174 (43.7%) | −57.57 | −0.01 | |
| No trend | 7 (1.8%) | 0.00 | 0.00 | |
| Eh (mV) | Increasing | 135 (33.9%) | 0.09 | 11.55 |
| Decreasing | 259 (65.1%) | −19.00 | −0.13 | |
| No trend | 4 (1.0%) | 0.00 | 0.00 | |
| Na+ (mg/L) | Increasing | 159 (39.9%) | 0.00 | 49.2 |
| Decreasing | 234 (58.8%) | −34.25 | 0.00 | |
| No trend | 5 (1.3%) | 0.00 | 0.00 | |
| K+ (mg/L) | Increasing | 135 (33.9%) | −1.26 | 2.35 |
| Decreasing | 210 (52.8%) | −2.59 | 0.78 | |
| No trend | 53 (13.3%) | 0.00 | 0.00 | |
| Ca2+ (mg/L) | Increasing | 230 (57.8%) | 0.01 | 53.12 |
| Decreasing | 165 (41.5%) | −0.30 | −0.01 | |
| No trend | 3 (0.8%) | 0.00 | 0.00 | |
| Mg2+ (mg/L) | Increasing | 219 (55.0%) | 0.00 | 2.67 |
| Decreasing | 159 (39.9%) | −25.45 | 0.00 | |
| No trend | 20 (5.0%) | 0.00 | 0.00 | |
| Cl− (mg/L) | Increasing | 183 (46.0%) | 0.00 | 34.56 |
| Decreasing | 205 (51.5%) | −15.60 | 0.00 | |
| No trend | 10 (2.5%) | 0.00 | 0.00 | |
| NO3− (mg/L) | Increasing | 107 (26.9%) | 0.01 | 3.30 |
| Decreasing | 211 (53.0%) | −8.34 | 0.00 | |
| No trend | 80 (20.1%) | 0.00 | 0.00 | |
| SO42− (mg/L) | Increasing | 145 (36.4%) | 0.00 | 20.28 |
| Decreasing | 232 (58.3%) | 0.00 | −27.70 | |
| No trend | 21 (5.3%) | 0.00 | 0.00 | |
| HCO3− (mg/L) | Increasing | 268 (67.3%) | 0.01 | 10.32 |
| Decreasing | 111 (27.9%) | −17.2 | −0.01 | |
| No trend | 19 (4.8%) | 0.00 | 0.00 | |
1 Corresponding station numbers, 2 percentage of selective domain.
Table 4.
Spearman correlation matrix showing the correlation between average values of groundwater quality parameters. Strong positive correlations are shown in bold letters.
Table 4.
Spearman correlation matrix showing the correlation between average values of groundwater quality parameters. Strong positive correlations are shown in bold letters.
| Parameter | pH | EC | TDS | Na+ | K+ | Ca2+ | Mg2+ | Cl− | SO42− | CO32− | HCO3− |
|---|---|---|---|---|---|---|---|---|---|---|---|
| pH | 1.00 | ||||||||||
| EC | 0.51 | 1.00 | |||||||||
| TDS | 0.48 | 0.98 | 1.00 | ||||||||
| Na+ | 0.48 | 0.97 | 0.98 | 1.00 | |||||||
| K+ | 0.39 | 0.85 | 0.83 | 0.83 | 1.00 | ||||||
| Ca2+ | 0.47 | 0.90 | 0.85 | 0.86 | 0.66 | 1.00 | |||||
| Mg2+ | 0.52 | 0.97 | 0.98 | 0.97 | 0.77 | 0.86 | 1.00 | ||||
| Cl− | 0.52 | 0.96 | 0.97 | 0.98 | 0.77 | 0.87 | 0.98 | 1.00 | |||
| SO42− | 0.51 | 0.95 | 0.93 | 0.96 | 0.74 | 0.91 | 0.95 | 0.97 | 1.00 | ||
| CO32− | 0.21 | 0.14 | 0.07 | 0.25 | 0.17 | −0.12 | 0.17 | 0.19 | 0.10 | 1.00 | |
| HCO3− | −0.45 | 0.26 | 0.34 | 0.37 | 0.37 | 0.30 | 0.27 | 0.29 | 0.22 | 0.30 | 1.00 |
Table 5.
Summary of important groundwater physico-chemical data exceeding the drinking water quality guidelines by WHO and Korean guidelines. The percentage of data unsuitable for drinking have possible human health effects.
Table 5.
Summary of important groundwater physico-chemical data exceeding the drinking water quality guidelines by WHO and Korean guidelines. The percentage of data unsuitable for drinking have possible human health effects.
| Parameter | Range | Median | WHO Guideline 2011 (% Samples Exceeding Limit) | Korean Guideline (% Samples Exceeding Limit) | Effects on Human |
|---|---|---|---|---|---|
| pH | 3.9–10.8 | 6.9 | 6.5–8.5 (33.4%) | 5.8–8.5 (7.9%) | Taste |
| EC (µS/cm) | 42.0–48,100.0 | 1325.0 | 1400 (2.6%) | − | Laxative effects |
| TDS (mg/L) | 21.6–25,630.0 | 168.0 | 1000 (28.0%) | − | Gastrointestinal |
| Ca2+ (mg/L) | 0.1–4000.0 | 27.8 | 200 (1.5%) | − | Kidney and bladder |
| Mg2+ (mg/L) | 0.1–2357.0 | 6.8 | 100 (1.5%) | − | Laxative effects |
| Na+ (mg/L) | 0.1–8640.0 | 17.8 | 200 (2.9%) | − | Taste |
| K+ (mg/L) | 0.1–3200.0 | 2.4 | 12 (3.7%) | − | Laxative effects |
| Cl− (mg/L) | 0.1–30,479.0 | 13.8 | 250 (3.0%) | 250 (3.0%) | Taste, indigestion |
| SO42− (mg/L) | 0.1–1983.2 | 14.2 | 250 (2.1%) | 200 (2.5%) | Gastrointestinal |
Table 6.
Classification of groundwater based on EC, SAR, Na+ hazard, and RSC for suitability of use as irrigation water.
Table 6.
Classification of groundwater based on EC, SAR, Na+ hazard, and RSC for suitability of use as irrigation water.
| Parameters | Reference | Range | Classification for Irrigation Use | Sample Number 1 (%) |
|---|---|---|---|---|
| EC (µS/cm) | Richards (1954) | 100–250 | Excellent | 2642 (29.73%) |
| 250–750 | Good | 6240 (70.21%) | ||
| 750–2250 | Doubtful | 5 (0.06%) | ||
| >2250 | Unsuitable | 0 (0.00%) | ||
| SAR | Todd (1959) and Richards (1954) | <10 | Excellent | 8649 (97.32%) |
| 10–18 | Good | 68 (0.77%) | ||
| 18–26 | Doubtful | 84 (0.95%) | ||
| >26 | Unsuitable | 86 (0.97%) | ||
| Na+ hazard (%) | Wilcox (1955) | <20 | Excellent | 1060 (11.93%) |
| 20–40 | Good | 3830 (43.10%) | ||
| 40–60 | Permissible | 2488 (28.00%) | ||
| 60–80 | Doubtful | 984 (11.07%) | ||
| >80 | Unsuitable | 525 (5.91%) | ||
| RSC | Eaton (1950) and Richards (1954) | <1.25 | Suitable | 8362 (94.09%) |
| 1.25–2.5 | Marginal | 313 (3.52%) | ||
| >2.5 | Unsuitable | 212 (2.39%) |
1 Total data number = 8887.
© 2020 by the authors. Licensee MDPI, Basel, Switzerland. This article is an open access article distributed under the terms and conditions of the Creative Commons Attribution (CC BY) license (http://creativecommons.org/licenses/by/4.0/).
Share and Cite
MDPI and ACS Style
Jeon, C.; Raza, M.; Lee, J.-Y.; Kim, H.; Kim, C.-S.; Kim, B.; Kim, J.-W.; Kim, R.-H.; Lee, S.-W. Countrywide Groundwater Quality Trend and Suitability for Use in Key Sectors of Korea. Water 2020, 12, 1193. https://doi.org/10.3390/w12041193
AMA Style
Jeon C, Raza M, Lee J-Y, Kim H, Kim C-S, Kim B, Kim J-W, Kim R-H, Lee S-W. Countrywide Groundwater Quality Trend and Suitability for Use in Key Sectors of Korea. Water. 2020; 12(4):1193. https://doi.org/10.3390/w12041193
Chicago/Turabian StyleJeon, Chanhyeok, Maimoona Raza, Jin-Yong Lee, Heejung Kim, Chang-Seong Kim, Bora Kim, Jeong-Woo Kim, Rak-Hyeon Kim, and Sun-Woo Lee. 2020. "Countrywide Groundwater Quality Trend and Suitability for Use in Key Sectors of Korea" Water 12, no. 4: 1193. https://doi.org/10.3390/w12041193
Note that from the first issue of 2016, this journal uses article numbers instead of page numbers. See further details here.