Recent Trends in Freshwater Influx to the Arctic Ocean from Four Major Arctic-Draining Rivers


1
Department of Geography, Water and Climate Impacts Research Centre, University of Victoria, P.O. Box 1700 STN CSC, Victoria, BC V8W 2Y2, Canada
2
Watershed Hydrology and Ecology Research Division, Environment and Climate Change Canada, University of Victoria, P.O. Box 3060 STN CSC, Victoria, BC V8W 3R4, Canada
3
Watershed Hydrology and Ecology Research Division, National Hydrology Research Centre, Environment and Climate Change Canada, Saskatoon, SK S7N 3H5, Canada
*
Author to whom correspondence should be addressed.
Water 2020, 12(4), 1189; https://doi.org/10.3390/w12041189
Submission received: 27 March 2020
/
Revised: 13 April 2020
/
Accepted: 17 April 2020
/
Published: 21 April 2020
(This article belongs to the Special Issue Hydrology of the Arctic Region)
Abstract
:Runoff from Arctic rivers constitutes a major freshwater influx to the Arctic Ocean. In these nival-dominated river systems, the majority of annual discharge is released during the spring snowmelt period. The circulation regime of the salinity-stratified Arctic Ocean is connected to global earth–ocean dynamics through thermohaline circulation; hence, variability in freshwater input from the Arctic flowing rivers has important implications for the global climate system. Daily discharge data from each of the four largest Arctic-draining river watersheds (Mackenzie, Ob, Lena and Yenisei; herein referred to as MOLY) are analyzed to identify historic changes in the magnitude and timing of freshwater input to the Arctic Ocean with emphasis on the spring freshet. Results show that the total freshwater influx to the Arctic Ocean increased by 89 km3/decade, amounting to a 14% increase during the 30-year period from 1980 to 2009. A distinct shift towards earlier melt timing is also indicated by proportional increases in fall, winter and spring discharges (by 2.5%, 1.3% and 2.5% respectively) followed by a decrease (by 5.8%) in summer discharge as a percentage of the mean annual flow. This seasonal increase in discharge and earlier pulse onset dates indicates a general shift towards a flatter, broad-based hydrograph with earlier peak discharges. The study also reveals that the increasing trend in freshwater discharge to the Arctic Ocean is not solely due to increased spring freshet discharge, but is a combination of increases in all seasons except that of the summer.
1. Introduction
Terrestrial freshwater contribution from Arctic-draining rivers to the Arctic Ocean plays an important role in several oceanic processes, affecting systems on both global and regional scales. Variability in this contribution can have wide-ranging effects on global feedback interactions, hydrological extremes and contaminant and nutrient pathways [1]. For example, runoff from Arctic-draining rivers influences salinity stratification within the Arctic Ocean. This stratification regime governs freshwater export from the Arctic Ocean through the northern North Atlantic Ocean, and is an integral part of the global ocean circulation regime. A change in the stratification of surface waters can affect North Atlantic Deep Water (NADW) formation which, coupled with Atlantic Meridional Overturning Circulation (AMOC), is a critical driving force in the global thermohaline circulation [2,3,4,5,6,7]. Arctic runoff plays an important role as a nutrient supplier to near-shore and estuarine ecosystems, providing an influx of organic carbon during the spring freshet, yet diluting waters with respect to inorganic nitrate and silica compounds [8,9,10,11].
In Arctic-draining rivers, the annual spring freshet following snowmelt and river ice break-up provides up to 60% of the total annual flow volume [12]. The seasonality and magnitude of this event play a key role in the processes which govern freshwater storage and circulation in the Arctic Ocean. For example, discharge seasonality can affect freshwater runoff trajectory upon entering the Arctic Ocean, influencing whether freshwater is placed into storage or released. Seasonality also has important impacts on Arctic sea ice production and ablation, as well as distribution, timing and magnitude of ecosystem production in Arctic coastal communities [6,13].
It is well-documented that changes in Arctic river discharge have been occurring, particularly increases in overall freshwater flow to the Arctic Ocean [11,14]. During the period from 1936 to 1999, discharge from Eurasian basins draining to the Arctic Ocean increased annually by 2.0 ± 0.7 km3 yr−1, which resulted in a cumulative increase of 128 km3 more freshwater released annually by the end of the period as compared to the beginning [15]. Additionally, Haine et al. [16] calculated that total runoff to the Arctic increased from 3900 ± 390 km3 yr−1 during 1980–2000 to 4200 ± 420 km3 yr−1 during 2000–2010, using averages of reanalysis and in-situ data, and Durocher et al. [14] observed an annual discharge increase of 5.8 km3 yr−1 for the period 1975–2015 for the rivers directly flowing to the Arctic Ocean using stations from the Arctic Hydrological Cycle Observing System (Arctic-HYCOS).
This increase in freshwater discharge was tempered by an overall yearly decrease in Canadian discharge to high-latitude seas (including the Labrador Sea, Eastern and Western Hudson Bay, Arctic Ocean and Bering Strait) of −3.1 km3 yr−1 during the period 1964–2003, although Canadian discharge directly to the Arctic Ocean showed a non-statistically significant increase [17]. However, analyzing discharge data over a much longer period reveals a contrasting result of increasing Mackenzie River flows to the Arctic Ocean [18,19]. Global climate model projections show a potential increase in overall river influx to the Arctic Ocean of approximately 10–30% by the year 2100 [20]. This corresponds to an estimated total discharge of 5500 km3 yr−1, up from 4200 ± 420 km3 yr−1 for the period of 2000–2010 [16].
Despite the relative importance of seasonality to numerous Arctic physical processes, previous studies focused on changes in total annual runoff contribution, rather than temporal distribution of runoff timing. Given that Arctic climate change is occurring at an accelerated rate compared to the global average [1,7,21], there is a research need to assess potential changes in the seasonal runoff characteristics of major Arctic river systems providing freshwater influx to the Arctic Ocean. Reported changes in Arctic river discharge are not spatially uniform, with indications of increased discharges from Eurasian basins and decreased/increased discharges from North American basins. Given these regional variations, this study aims to determine what changes, if any, have occurred in combined spring freshet contribution from major basins, and whether there are any temporal correspondences in these changes. Seasonality of individual basin discharge was also investigated. These objectives were achieved by analyzing daily discharge data for the four largest Arctic-draining rivers: the Mackenzie Basin in North America, and the Ob, Lena and Yenisei river basins in Asia, herein referred to as MOLY. Combined, these four rivers contribute almost 1900 km3 of freshwater to the Arctic Ocean per year, or about 60% of annual flow volume from all Arctic contributing areas [22,23]. Discharge data were analyzed over the entire available length of record for each river, and collectively, during the period 1980–2009.
2. Basin Characteristics
The pan-Arctic drainage basins and outlet stations of the Mackenzie, Ob, Yenisei and Lena rivers are shown in Figure 1, with station characteristics provided in Table 1. Total contributing areas of the four major river systems, including ungauged drainage areas, are as follows: Mackenzie 1,800,000 km2 [24]; Ob 2,975,000 km2 [25]; Lena 2,488,000 km2 [26]; and Yenisei 2,554,482 km2 [27]. The pan-Arctic region contains nearly half of the global alpine and sub-polar glacial area [28]. Meanwhile, some major Eurasian Arctic basins extend below 50° N, further south than what is traditionally considered within the Arctic region [6] (see Figure 1). As a result, discharge behaviour at each of the four major drainage outlets is influenced along its course by sub-basin tributaries which may adhere to variety of hydrological regimes, such as nival, pluvial, prolacustrine, hybrid or other. For example, hydrologic retention due to extensive wetland coverage or large lakes within a catchment, such as is found in the Ob or Mackenzie basins, will lead to a more moderated seasonal discharge characteristic than basins without such retention [29].
Reservoir regulation is known to impact the seasonal distribution of discharge [30,31]. Each of the MOLY watersheds experiences some degree of flow regulation within their catchments, ranging from only one major reservoir in each of the Mackenzie and Lena basins, to four or more major reservoirs in the Ob and Yenisei basins [25,31,32]. In terms of flow regulation, the Yenisei basin is the most substantially regulated, with at least six major reservoirs having a capacity greater than 25 km3 located along the Yenisei and Angara stems [31,32]. It is considered “strongly affected” by flow regulation and fragmentation according to an assessment of anthropogenic changes in river flow and river channel continuity of large river systems [33]. The next-most regulated is the Ob basin, containing one major reservoir with a capacity greater than 25 km3 and three midsize dams [25]. The Ob basin is moderately affected based on its classification of flow regulation and fragmentation. Of the Asian basins, the Lena is least affected by flow regulation, with only one major reservoir located along the Vilyuy tributary. It is moderately affected in terms of regulation and fragmentation [33]. The Mackenzie basin is also moderately affected, despite having only one major reservoir located along the Peace tributary. Large lakes in the Mackenzie basin (e.g., Great Slave Lake and Great Bear Lake) provide substantial storage capacity, acting to reduce high spring peaks and sustain lower flows resulting in a more consistent runoff pattern throughout the year, similar to the effect of flow regulation [34]. The percentage of each basin’s area that is located directly upstream of a major reservoir (obtained by delineating the drainage areas of the reservoirs) is as follows: Mackenzie 3.9%; Ob 11.6%; Yenisei 46.5% and Lena 4.2%. See Figure 1 for the locations of major reservoirs.
3. Data and Analysis
3.1. Data Sources
Daily discharge data were obtained from the Environment and Climate Change Canada Hydrometric Database (HYDAT) for stations in the Mackenzie basin and from the Regional, Hydrometeorological Data Network for Russia (R-ArcticNET Russia v4.0) [35] for the Ob, Lena and Yenisei basins. Availability of Arctic hydrometric data is temporally limited, with all outlet stations having published records to 2009 only, and records in many smaller basins not extending past 2000. Complete records for the Mackenzie outlet station begin in 1973, while the Yenisei outlet station has several extensive gaps during the period 1963–1979. As a result, the period 1980–2009 was chosen for analysis of combined MOLY flow, while individual stations were assessed for the entire available record. Available record periods are given in Table 1.
3.2. Spring Freshet Definition
Two methods were used to define the volume of discharge released during the spring freshet period: (i) flows occurring during the period April through July (AMJJ), referred to as V1, and (ii) integrated flow from the date of the spring pulse onset to the hydrograph centre of mass, calculated from pulse onset to the last day of the calendar year, referred to as V2. July was used as the end-date of the V1 period, since some basins display high discharge rates well into the summer months. The date of the spring pulse onset was determined as the date at which cumulative departure from mean annual flow was most negative. This yields the date when flows on subsequent days are greater than the year average [36,37]. Visual inspection of the results verified that this is a reliable method for identifying the start date of the spring freshet. Choosing the freshet end date by visual means is subjective and influenced by precipitation, temperature and other factors; therefore, the hydrograph centre of mass adjusted by pulse onset as the freshet end date was used as a consistent method for determination of the freshet end date. Other descriptors used to analyze freshet characteristics are given in Table 2.
3.3. Trend Analysis
The Mann–Kendall test was applied to assess temporal trends in freshet timing and magnitude [38,39]. This non-parametric test is often used for detecting trends in hydrologic time series that may be affected by seasonal climatic variability, missing data or extremes and makes no prior assumptions about the normality of data [40]. In addition, a Trend-Free Pre-Whitening (TFPW) approach [41] was used to correct data for serial autocorrelation following the methods of Burn et al. [42]. This approach first fits a monotonic trend for a data series which is then removed prior to pre-whitening the data series. The monotonic trend is then re-added to the residual de-trended and pre-whitened data series, whereby the Mann–Kendall test statistic and local significance are calculated. To reject the null hypothesis Ho, which says there is no significant trend, the p-value must be smaller than α. All trends in this study were considered for their statistical significance at α = 5% and α = 10% level.
4. Results
4.1. Freshet Characteristics
Over the period 1980–2009, the average freshet start dates are May 12, 14, 28 and 19 for the Mackenzie, Ob, Lena and Yenisei rivers, respectively. Based on the freshet definition V2, during the period of 1980–2009, averages of 48%, 51%, 57% and 52% of the total annual flows in the Mackenzie, Ob, Lena and Yenisei Rivers, respectively, were released during the freshet period. Table 3 shows the percentage of total MOLY freshwater volume released by each of the four rivers based on the V1 and V2 freshet definitions as well as during the months of April through July. Overall, total proportional freshet volume contributions (based on the V1 or V2 freshet definitions) were greatest from the Lena and Yenisei, with the Yenisei reaching its peak proportional contribution in the month of April and the Lena slightly delayed, reaching its proportional peak contribution in June and July. The Lena River is largely unregulated and therefore characterized by a sharp spring peak and low winter flows typical of a naival basin with extensive permafrost coverage [43]. By contrast, extensive regulation of the Yenisei River dampens the spring freshet with flows being enhanced from storage releases at other times of the year, such as late fall and mid-winter [31]. The Mackenzie and Ob stations exhibit a more consistent spring contribution characteristic of flow regimes moderated by the existence of large lakes or wetland areas.
4.2. Changes in Timing and Magnitude
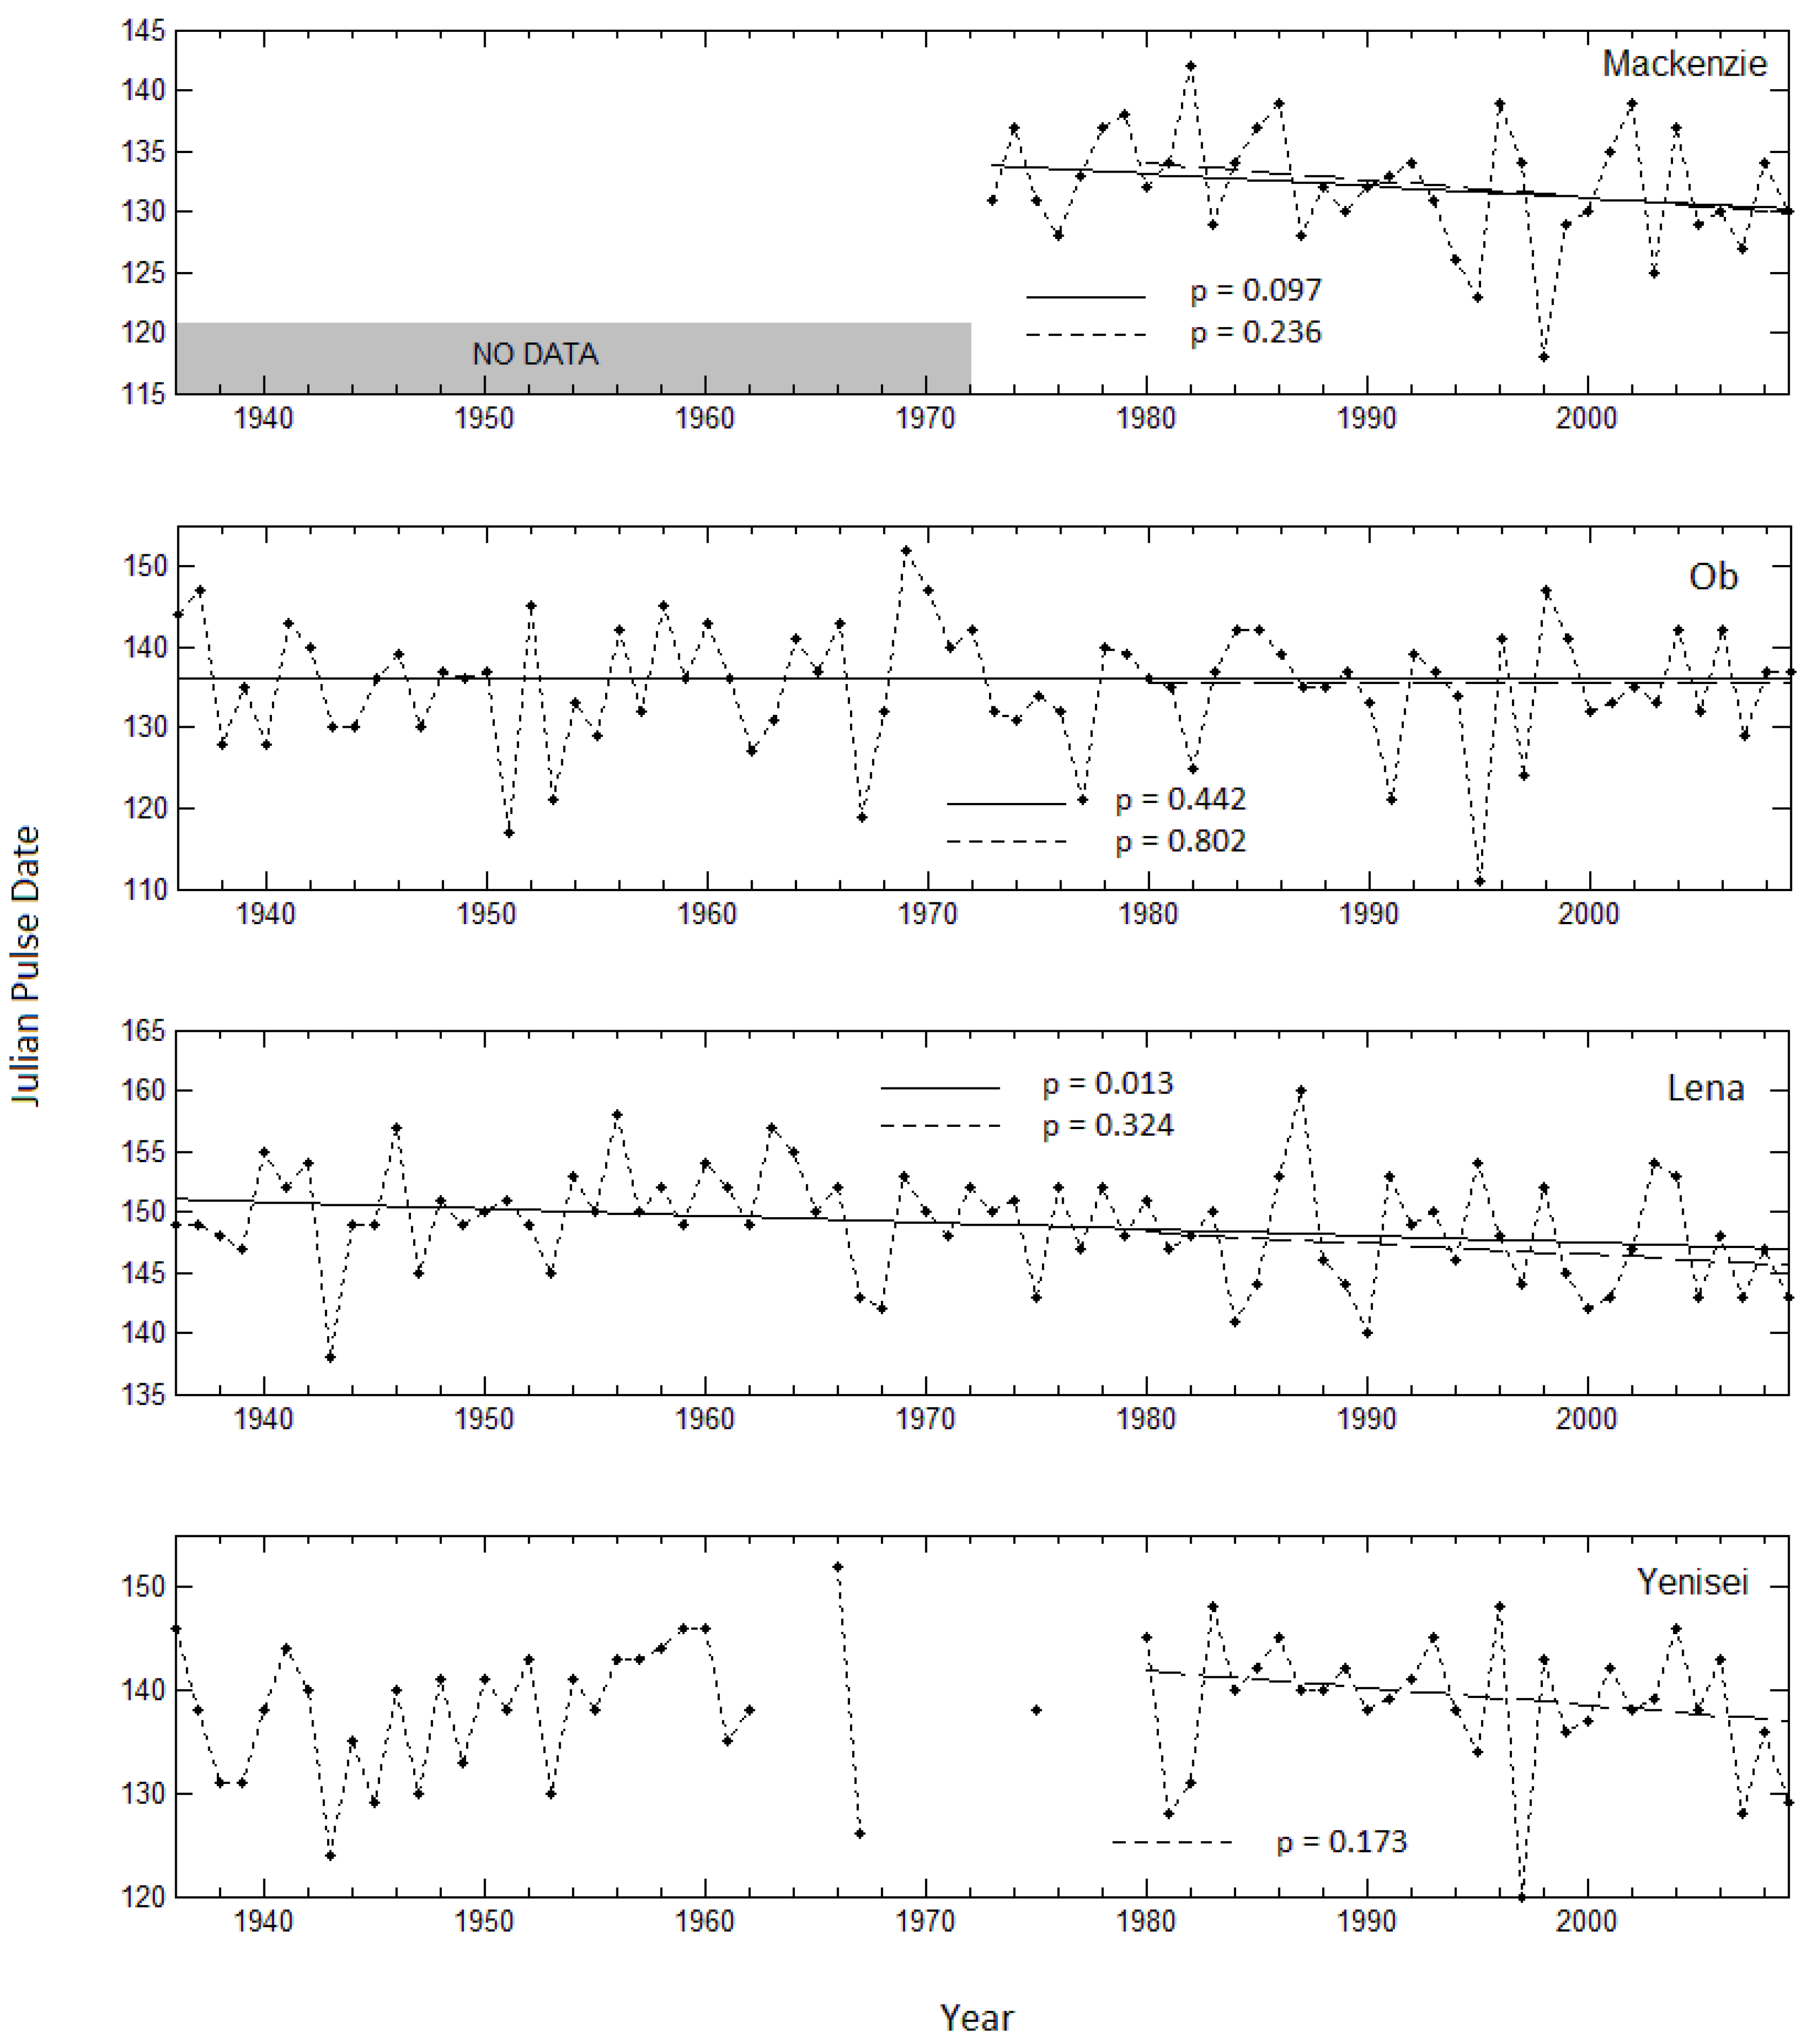
Observed changes in the timing of freshet discharge are generally most notable during the shorter period of 1980–2009 versus the entire length of available records. All outlets show either a decreasing (i.e., earlier) trend or no trend in pulse onset date (Table 4 and Figure 2), although only the Mackenzie and Lena stations exhibit a significant trend in earlier pulse onset dates of 1.2 to 1.4 days per decade, respectively, over their longer records. However, freshet duration over the longer record (Table 4) shows either a slight decreasing trend (Ob) or no trend, while all outlets have an increasing but non-significant trend in freshet length over the shorter period of 1980–2009 (Table 4). Although peak freshet magnitudes are generally decreasing, no significant changes were detected (Table 4), with the exception of a minor, non-significant increase in the Ob basin during 1980–2009.
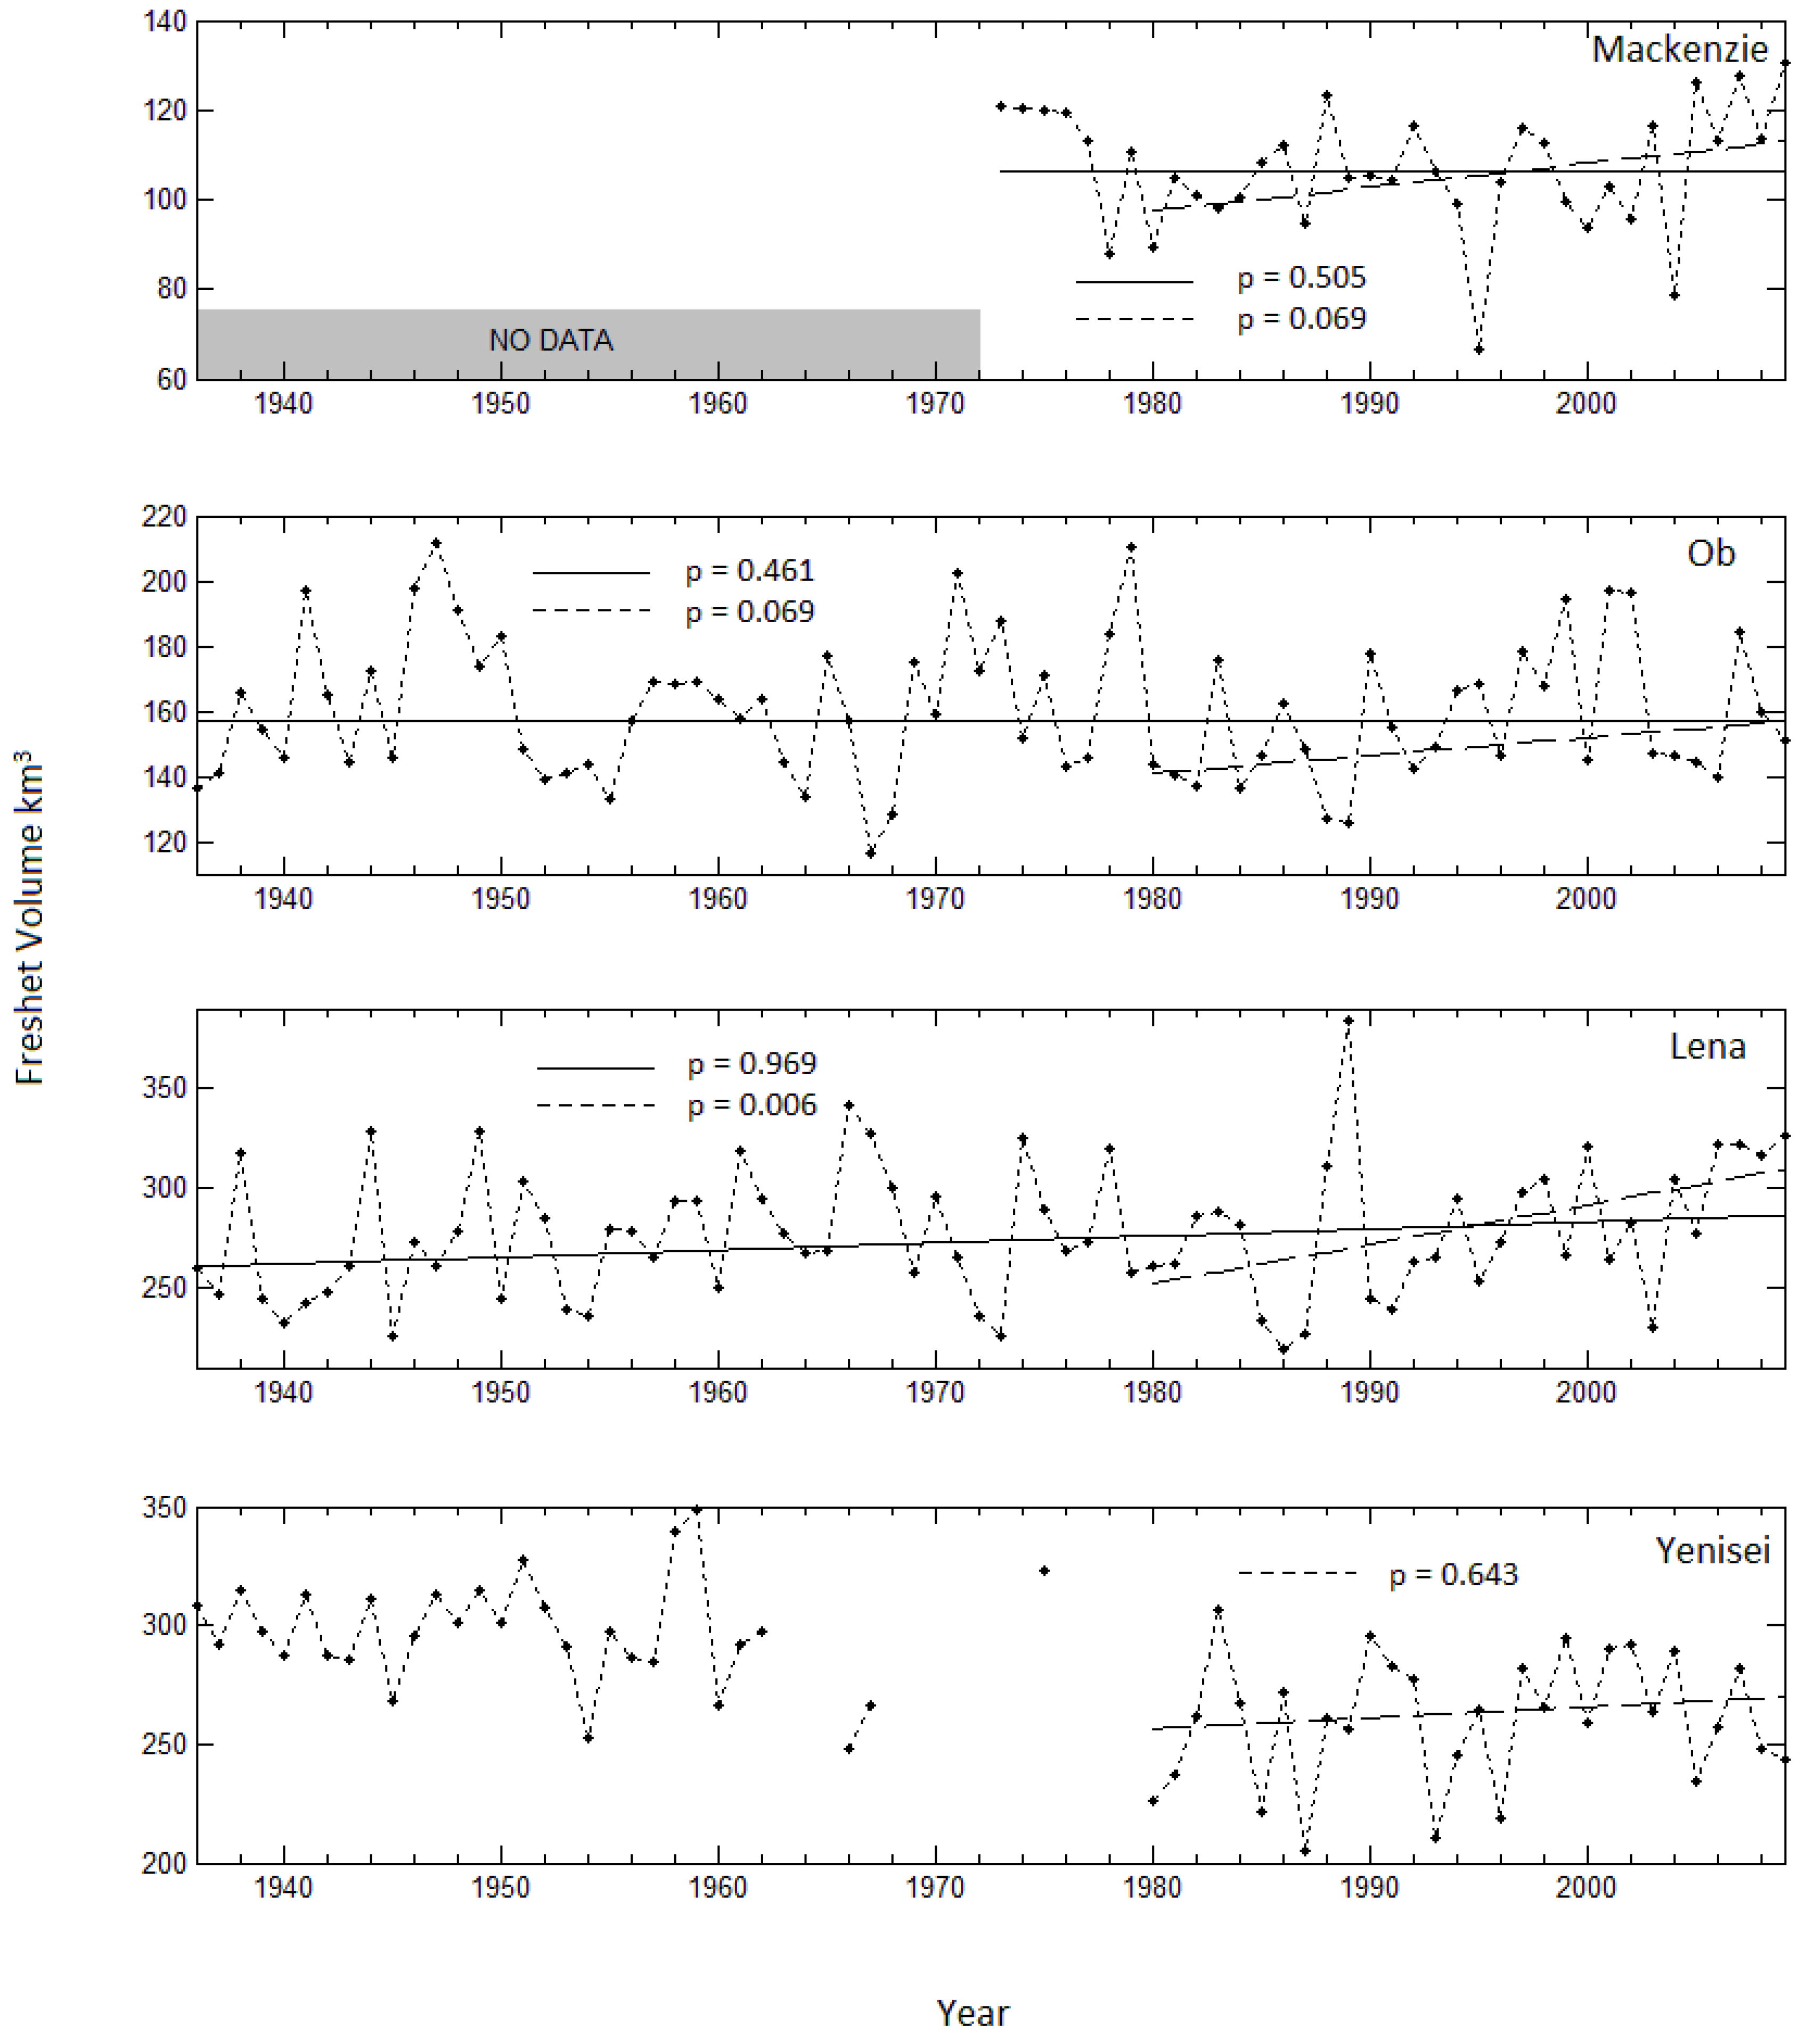
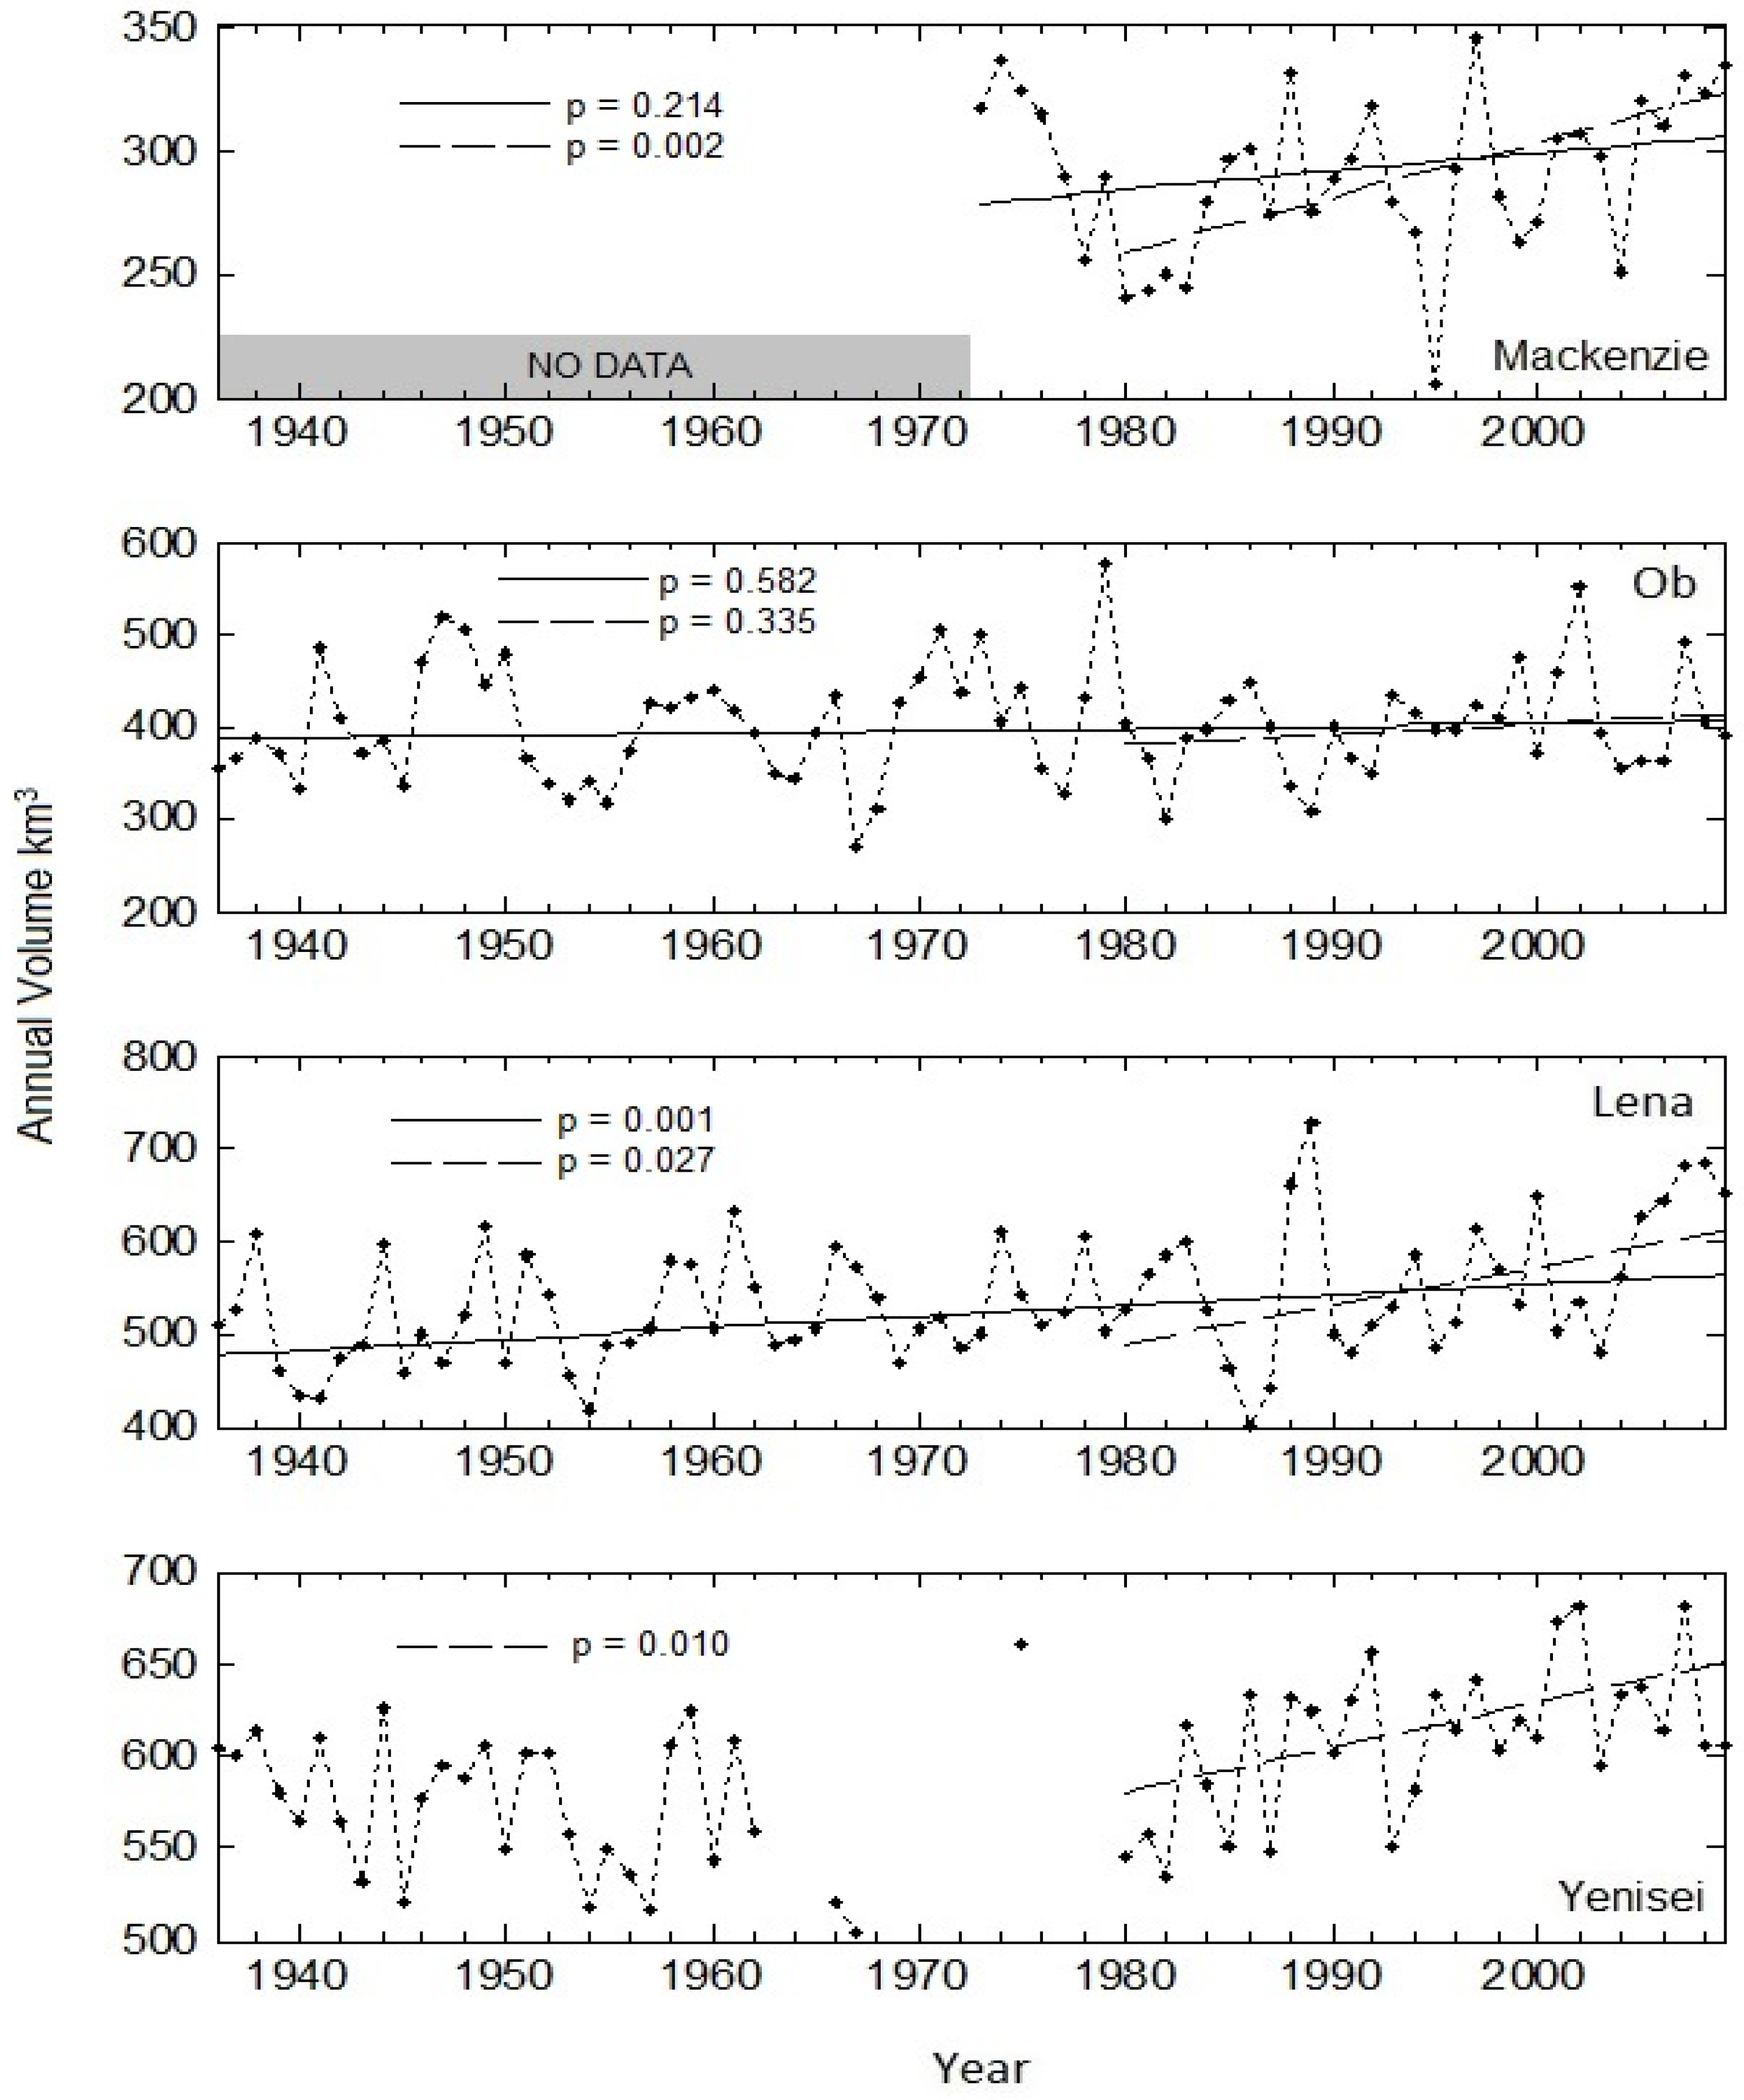
In terms of combined discharge magnitude released to the Arctic ocean, little change was detected in freshet volume (V2) over the longer records, while all outlets show an increase in freshet volume during the 1980–2009 period (Table 4, Figure 3). Increases are significant in all basins except for the Yenisei, with the Lena station having a significant increasing trend of up to an additional 18.9 km3/decade over the 30-year period. Annual volume also increases in both time periods, although only the Lena station exhibits a significant increase of up to 28.8 km3/decade from 1936–2009. During 1980–2009, however, all stations with the exception of the Ob show an increase of greater than 20 km3/decade by the end of the period (Table 4, Figure 4).
To assess whether discharge seasonality has shifted for individual stations, the fraction of flows released during the freshet and winter (VDJF), spring (VMAM), summer (VJJA) and fall (VSON) were calculated and are shown as percentage of total annual flow for each station. Table 5 gives trends in the percentage changes during each time window. Over both periods, the percentage of flow released during the freshet (V2) decreases for all stations (except the 0.3% increase for the Ob), although none of those trends are significant. Meanwhile, winter and spring percentages generally increase, while summer proportions decrease. An increase in VMAM percentage coupled with a decrease in VJJA percentage is notable, since it indicates a shift in the timing of overall peak discharges. Although pulse onset occurs in May for all stations, overall discharges typically peak in June. In addition to the decrease in the proportion of freshet discharge, peak discharges are also shifting towards earlier dates. Fall discharges show either a slight increase (Mackenzie) or decrease (Ob, Lena) during the longer records, while during 1980–2009 all stations indicate an increase in fall discharge.
4.3. Changes in Combined Circumpolar Discharge
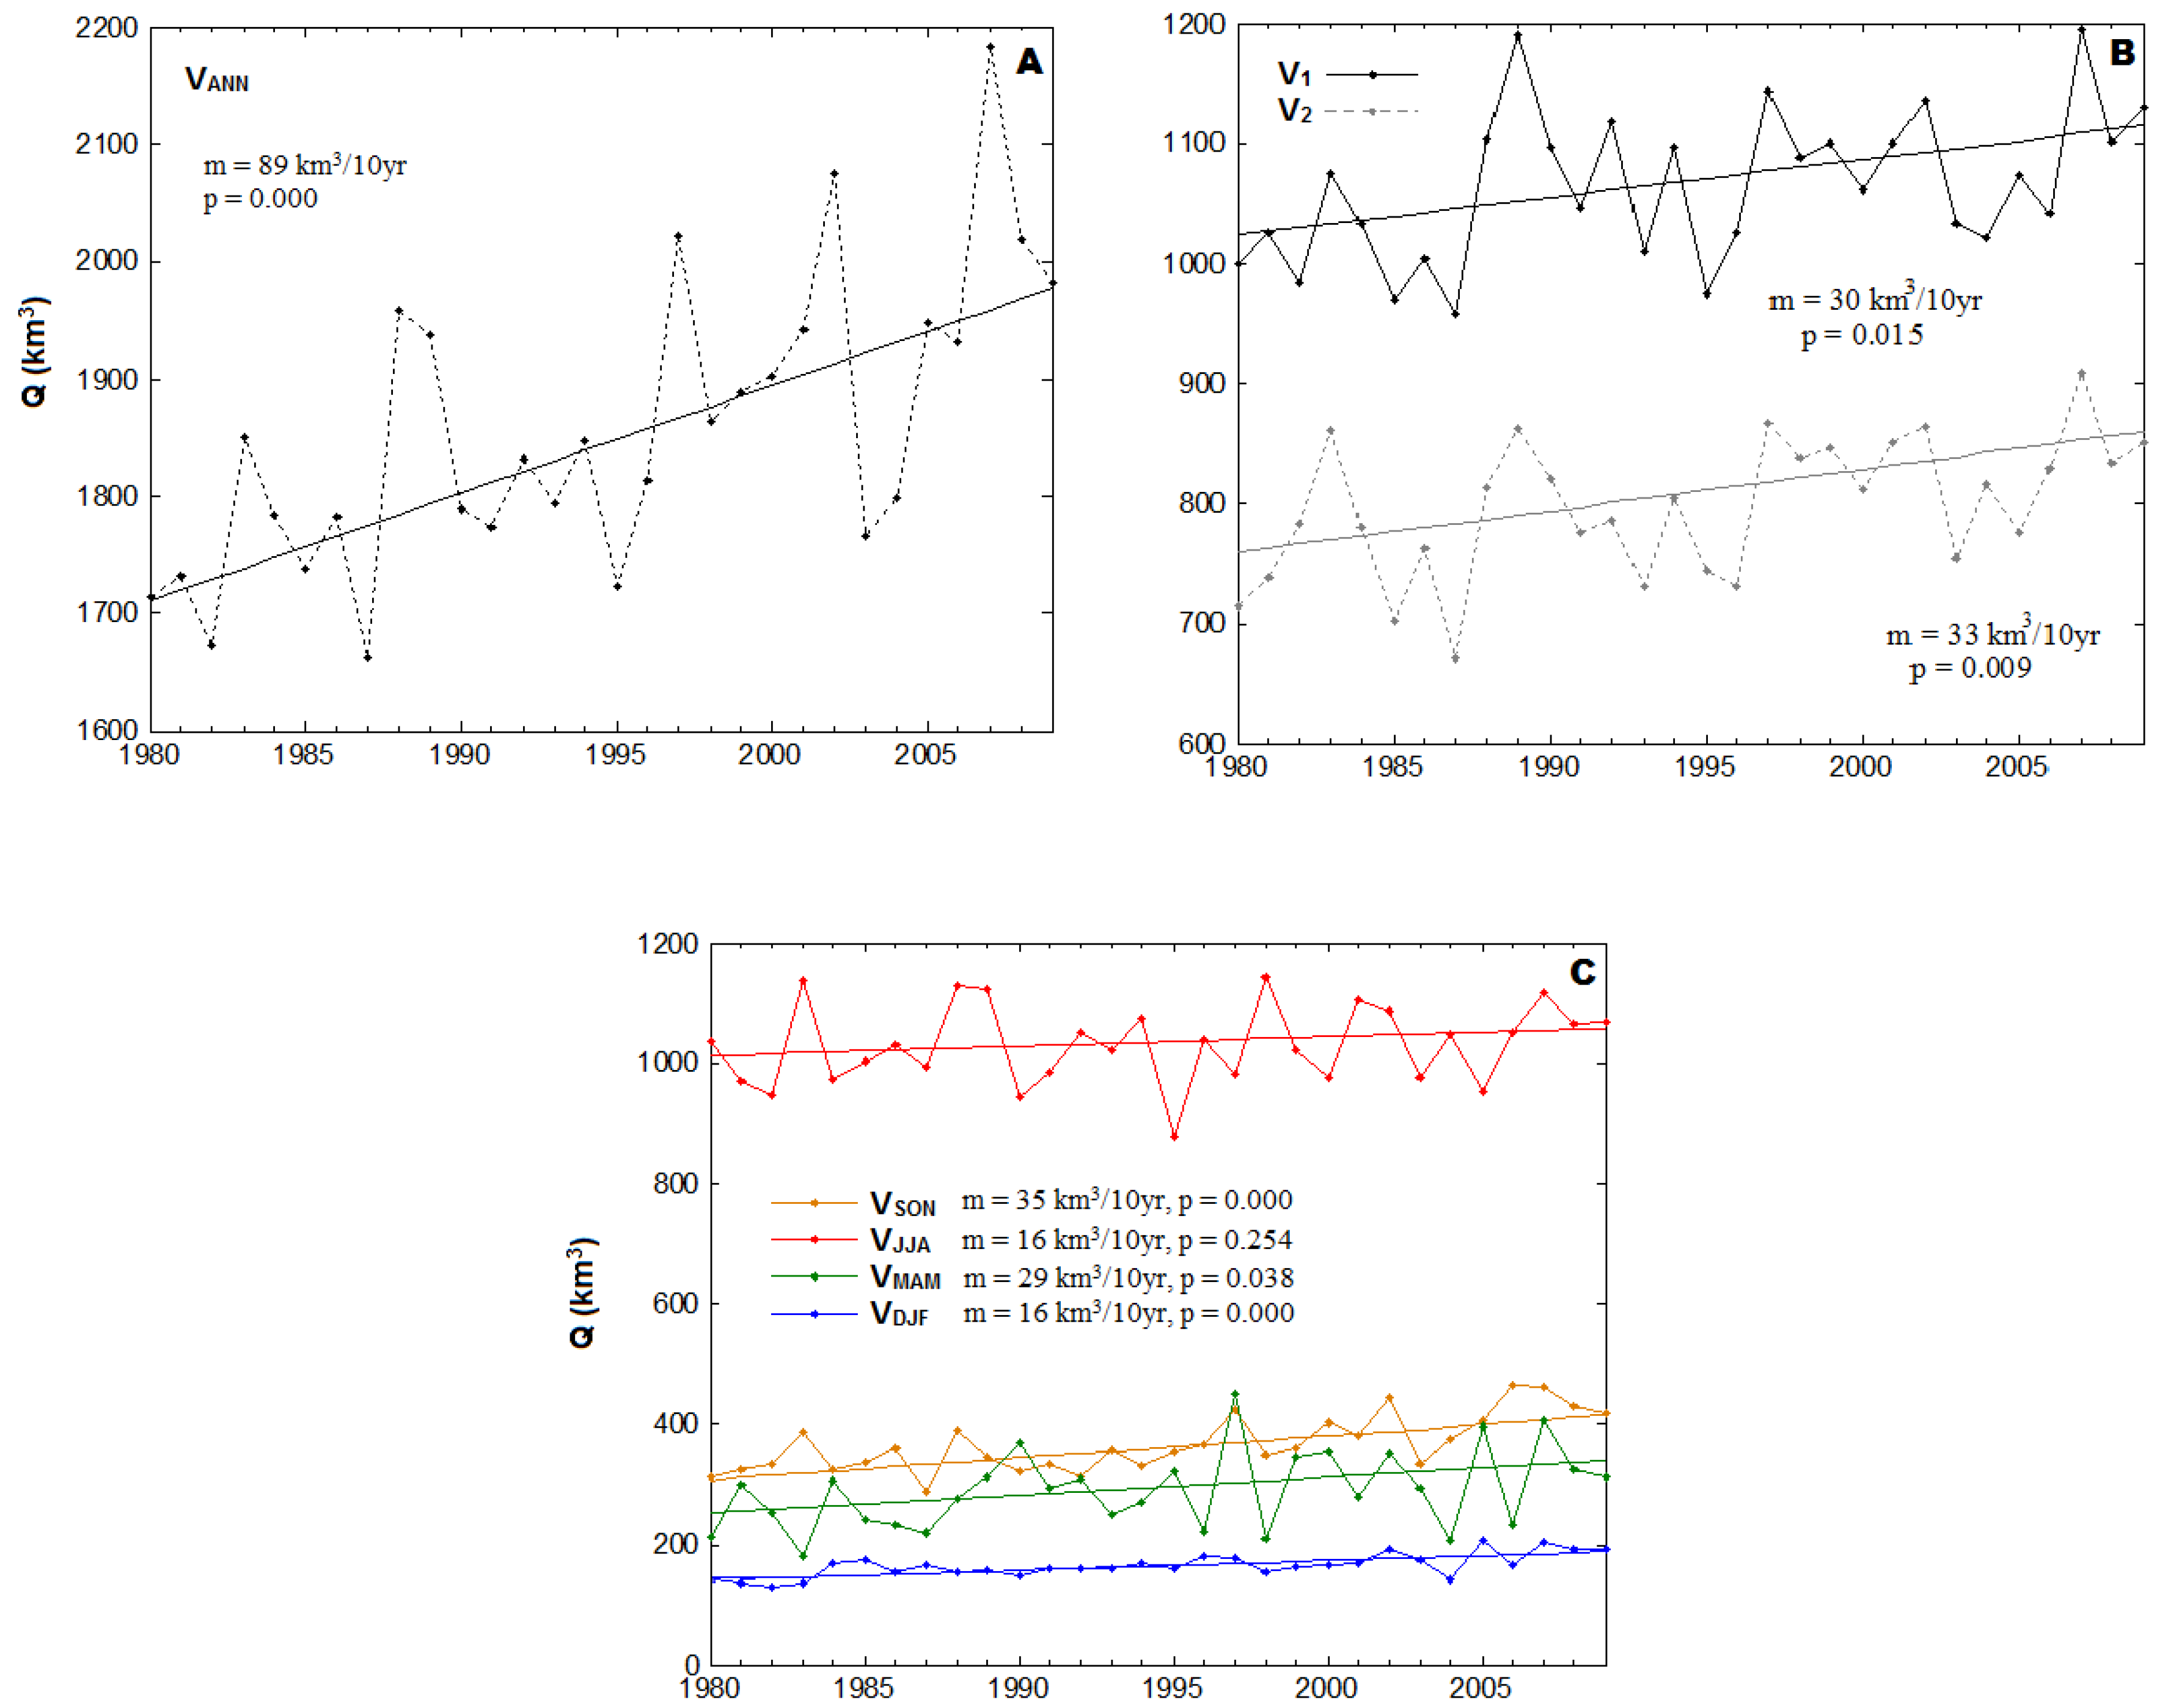
Total annual discharge from all four basins increased significantly by approximately 89 km3/decade over the 1980–2009 period (Figure 5A). To better assess the seasonal contributions to this overall annual increase, trends for all seasonal measures (V1, V2, VDJF, VMAM, VJJA, and VSON) were determined. From Figure 5B,C, it is apparent that, while freshet discharge V2 shows a statistically significant increase of up to 33 km3/decade, other seasons also display increasing discharges over the same period. With the exception of summer (+16 km3/decade, p = 0.254), all increases are statistically significant at the 5% level. Spring, fall and winter show increases of 29 km3/decade, 35 km3/decade and 16 km3/decade, respectively.
Despite variation in the individual proportions of seasonal flow, there is consistency in the sequencing of the combined discharge compared to individual flows. Freshet contribution as a fraction of combined annual flow for MOLY stations decreases by approximately 1.7% during 1980–2009, although this trend is not significant. Winter proportional contribution increases significantly by 1.3%, while spring fraction shows a non-significant increase. Combined summer fractional flows display a significant decrease of up to 5.8%, which is consistent with earlier findings indicating highly decreased summer proportions for individual outlet stations. Fall fractions show a statistically significant increase of approximately 2.5%.
5. Summary and Conclusions
Analysis of discharge at the outlet stations of the four largest Arctic-draining rivers indicates that the combined annual discharge from these rivers has increased by 89 km3/decade over the period 1980–2009, amounting to an approximate 14% increase over the 30-year period. This estimate is comparatively larger than the 7% increase found in a previous study using longer records from the six largest Eurasian rivers during 1936–2009 [15]. This is consistent with the results found here, which are consistently greater during the shorter, more recent period of analysis. As Figure 4 and Table 4 indicate, trends over the longer periods tended to occur at a much slower rate than those over the relatively shorter 1980–2009 period. This apparent rapid increase in freshwater volume contribution during 1980–2009 may be an effect of the shorter period of analysis, but could also be attributable to accelerated high-latitude warming in recent decades. Similar results from many Eurasian and North American pan-Arctic basins over the recent periods have been attributed to intensification of hydrological processes that are an expected manifestations of a warming climate [44,45]. In particular, the increases in winter baseflow were found to be caused predominately by increased permafrost thawing, which enhances infiltration and deeper flowpaths resulting in broad-scale mobilization of subsurface water into rivers [46].
Trends in combined MOLY seasonal flow were also investigated to determine whether this annual increase could be attributed to a rising freshet, rising winter low-flows, or some other combination of seasonal increases. While freshet discharge shows a significant increase of 30 to 33 km3/decade depending on the definition of freshet (Figure 5), this change is complemented by corresponding increases in winter, spring and fall. In fact, compared to other seasons, fall exhibited the greatest increase, of up to 35 km3/decade. This may be a result of delayed river ice freeze-up dates, or increased late-summer and autumn precipitation. Meanwhile, the fraction of discharge released during the freshet as a percentage of total annual flow decreased by approximately 1.7%, while winter and fall proportions increased. A distinct shift towards earlier melt timing was also indicated by a strong decrease (5.8%) in proportional summer discharge along with a corresponding increase (2.5%) in spring discharge.
Individually, trends in the fraction of flow released seasonally agree with overall trends in circumpolar flow. Individual rivers show varying decreases in portion of flow released during the freshet, coupled with increases in winter, spring and fall fractions and decreases in summer amounts. The only exception to this general tendency is in the Ob River, which shows a decrease in winter and a slight increase in summer proportional flow. These deviations are not substantial enough to affect the combined trends of all four rivers. Pulse onset dates occurred earlier, while freshet durations increased slightly and peak freshet magnitudes generally decreased. Rising winter and fall discharge proportions, combined with lower peak freshet magnitudes, increased freshet durations, and lower summer proportions are indicative of a potential shift to a flatter, more gradual annual hydrograph with an earlier pulse onset. While this apparent shift in seasonality can clearly have important consequences for the Arctic and global feedback systems, it remains yet to be determined how much of this change can be attributed to flow regulation and how much to climatic changes. Despite the recent window of observation used for combined flow, many basins have had some form of flow regulation in place for extended periods, and the establishment of such regulation will likely have impacts on the longer-term records. In addition, studying trends over large, continental-scale basins will obscure any effects of regional climatic variation on smaller-sized basins. It is thus recommended to undertake an analysis of trends and climatic drivers on a sub-basin level to determine potential causes of shifting seasonality in Arctic freshwater influx.
Author Contributions
Conceptualization, R.A., T.P., Y.D. and B.B.; Methodology, R.A., Y.D. and B.B.; Data analysis, R.A., Y.D., H.O. Original draft preparation, R.A. and T.P.; Review and editing, Y.D., B.B. and H.O. All the co-authors review the manuscript prior to and during the submission process to the Water-MDPI Journal. All authors have read and agreed to the published version of the manuscript.
Funding
This work was partially supported by a Discovery Grant and ArcticNet funding from the Natural Sciences and Engineering Council of Canada (NSERC) to one of the co-authors.
Acknowledgments
The authors would also like to acknowledge the Arctic Rapid Integrated Monitoring System (ArcticRIMS) and the Regional Hydrometeorological Data Network for the Pan-Arctic Region (R-ArcticNet) for freely providing data.
Conflicts of Interest
The authors declare no conflict of interest.
References
- Anisimov, O.; Vaughan, D.G.; Callaghan, T.; Furgal, C.; Marchant, H.; Prowse, T.D.; Vilhjalmsson, H.; Walsh, J.E. Polar regions (Arctic and Antarctic). In Climate Change 2007: Impacts, Adaptation and Vulnerability; Parry, M.L., Canziani, O.F., Palutikof, J.P., van der Linden, P.J., Hanson, C.E., Eds.; Contribution of Working Group II to the Fourth Assessment Report of the Intergovernmental Panel on Climate Change; Cambridge University Press: Cambridge, UK, 2007; pp. 653–685. [Google Scholar]
- Aagaard, K.; Carmack, E.C. The role of fresh water in ocean circulation and climate. J. Geophys. Res. 1989, 94, 14485–14498. [Google Scholar] [CrossRef]
- Anisimov, O.; Fitzharris, B.; Hagen, J.O.; Jefferies, R.; Marchant, H.; Nelson, F.; Prowse, T.D.; Vaughan, D.G. Polar regions (Arctic and Antarctic). In Climate Change 2001: Impacts, Adaptation and Vulnerability; McCarthy, J.J., Canziani, O.F., Leary, N.A., Dokken, D.J., White, K.S., Eds.; Contribution of Working Group II to the Third Assessment Report of the Intergovernmental Panel on Climate Change; Cambridge University Press: Cambridge, UK, 2001; pp. 803–841. [Google Scholar]
- Dickson, B.; Osborn, T.; Hurrell, J.W.; Meincke, J.; Blindheim, J.; Adlandsvik, B.; Vinje, T.; Alekseev, G.; Maslowski, W. The Arctic Ocean response to the North Atlantic Oscillation. J. Climatol. 2000, 13, 2671–2696. [Google Scholar] [CrossRef]
- Dickson, B.; Yashayaev, I.; Meincke, J.; Turrell, B.; Dye, S.; Holfort, J. Rapid freshening of the deep North Atlantic Ocean over the past four decades. Nature 2002, 416, 832–837. [Google Scholar] [CrossRef] [PubMed]
- Loeng, H.; Brander, K.; Carmack, E.; Denisenko, S.; Drinkwater, K.; Hansen, B.; Kovacs, K.; Livingston, P.; Mclaughlin, F.; Bellerby, R.; et al. Ch. 9: Marine Systems. In Arctic Climate Impact Assessment; Symon, C., Arris, L., Heal, B., Eds.; Cambridge University Press: New York, NY, USA, 2005; pp. 453–538. [Google Scholar]
- Serreze, M.C.; Francis, J.A. The Arctic Amplification Debate. Clim. Chang. 2006, 76, 241–264. [Google Scholar] [CrossRef] [Green Version]
- Kattsov, V.M.; Walsh, J.E.; Chapman, W.L.; Govorkova, V.; Pavlova, T.V.; Zhang, X. Simulation and Projection of Arctic Freshwater Budget Components by the IPCC AR4 Global Climate Models. J. Hydrometeorol. 2007, 8, 571–589. [Google Scholar] [CrossRef]
- McClelland, J.W.; Holmes, R.M.; Dunton, K.H.; Macdonald, R.W. The Arctic Ocean Estuary. Estuaries Coasts 2011, 35, 353–368. [Google Scholar] [CrossRef] [Green Version]
- Tank, S.E.; Manizza, M.; Holmes, R.M.; McClelland, J.W.; Peterson, B.J. The processing and impact of dissolved riverine nitrogen in the Arctic Ocean. Estuaries Coasts 2011, 35, 401–415. [Google Scholar] [CrossRef] [Green Version]
- Bring, A.; Fedorova, I.; Dibike, Y.; Hinzman, L.; Mård, J.; Mernild, S.H.; Prowse, T.; Semenova, O.; Stuefer, S.L.; Woo, M.-K. Arctic terrestrial hydrology: A synthesis of processes, regional effects, and research challenges. J. Geophys. Res. Biogeosci. 2016, 121, 621–649. [Google Scholar] [CrossRef]
- Lammers, R.B.; Shiklomanov, A.I.; Vörösmarty, C.J.; Fekete, B.M.; Peterson, B.J. Assessment of contemporary Arctic river runoff based on observational discharge records. J. Geophys. Res. 2001, 106, 3321–3334. [Google Scholar] [CrossRef]
- Carmack, E.C.; Barber, D.G.; Christensen, J.R.; Macdonald, R.W.; Rudels, B.; Sakshaug, E. Climate variability and physical forcing of the food webs and the carbon budget of pan-Arctic shelves. Prog. Oceanogr. 2006, 71, 145–181. [Google Scholar] [CrossRef]
- Durocher, M.; Requena, A.I.; Burn, D.H.; Pellerin, J. Analysis of trends in annual streamflow to the Arctic Ocean. Hydrol. Process. 2019, 33, 1143–1151. [Google Scholar] [CrossRef]
- Peterson, B.J.; Holmes, R.M.; McClelland, J.W.; Vörösmarty, C.J.; Lammers, R.B.; Shiklomanov, A.I.; Shiklomanov, I.A.; Rahmstorf, S. Increasing river discharge to the Arctic Ocean. Science 2002, 298, 2171–2173. [Google Scholar] [CrossRef] [PubMed] [Green Version]
- Haine, T.W.N.; Curry, B.; Gerdes, R.; Hansen, E.; Karcher, M.; Lee, C.; Rudels, B.; Spreen, G.; de Steur, L.; Stewart, K.D.; et al. Arctic freshwater export: Status, mechanisms, and prospects. Glob. Planet. Chang. 2015, 125, 13–25. [Google Scholar] [CrossRef] [Green Version]
- Déry, S.J.; Wood, J. Decreasing river discharge in northern Canada. Geophys. Res. Lett. 2005, 32, L10401. [Google Scholar] [CrossRef] [Green Version]
- Déry, S.J.; Stadnyk, T.A.; MacDonald, M.K.; Gauli-Sharma, B. Recent trends and variability in river discharge across northern Canada. Hydrol. Earth Syst. Sci. 2016, 20, 4801–4818. [Google Scholar] [CrossRef] [Green Version]
- Rood, S.B.; Kaluthota, S.; Philipsen, L.J.; Rood, N.J.; Zanewich, K.P. Increasing discharge from the Mackenzie River system to the Arctic Ocean. Hydrol. Process. 2017, 31, 150–160. [Google Scholar] [CrossRef]
- Walsh, J.E.; Anisimov, O.; Hagen, J.O.; Jakobsson, T.; Oerlemans, J.; Prowse, T.D.; Romanovsky, V.; Savelieva, N.; Serreze, M.C.; Shiklomanov, I.A.; et al. Cryosphere and hydrology. In Arctic Climate Impact Assessment (ACIA); Symon, C., Arris, L., Heal, B., Eds.; Cambridge University Press: Cambridge, UK, 2005; pp. 183–242. [Google Scholar]
- Larsen, J.N.; Anisimov, O.A.; Constable, A.; Hollowed, A.B.; Maynard, N.; Prestrud, P.; Prowse, T.D.; Stone, J.M.R. Polar regions. In Climate Change 2014: Impacts, Adaptation, and Vulnerability. Part B: Regional Aspects; Barros, V.R., Field, C.B., Dokken, D.J., Mastrandrea, M.D., Mach, K.J., Bilir, T.E., Chatterjee, M., Ebi, K.L., Estrada, Y.O., Genova, R.C., et al., Eds.; Contribution of Working Group II to the Fifth Assessment Report of the Intergovernmental Panel of Climate Change; Cambridge University Press: Cambridge, UK, 2014; pp. 1567–1612. [Google Scholar]
- Grabs, W.E.; Portmann, F.; De Couet, T. Discharge observation networks in Arctic regions: Computation of the river runoff into the Arctic Ocean, its seasonality and variability. In The Freshwater Budget of the Arctic Ocean; Lewis, E.L., Ed.; Kluwer: Dordrecht, The Netherlands, 2000; pp. 249–267. [Google Scholar]
- Prowse, T.D.; Flegg, P.O. Arctic river flow: A review of contributing areas. In The Freshwater Budget of the Arctic Ocean; Lewis, E.L., Ed.; Kluwer: Dordrecht, The Netherlands, 2000; pp. 269–280. [Google Scholar]
- Finnis, J.; Cassano, J.; Holland, M.; Uotila, P. Synoptically forced hydroclimatology of major Arctic watersheds in general circulation models, Part 1: The Mackenzie River Basin. Int. J. Climatol. 2009, 29, 1226–1243. [Google Scholar] [CrossRef]
- Yang, D.; Ye, B.; Shiklomanov, A. Discharge characteristics and changes over the Ob River watershed in Siberia. J. Hydrometeorol. 2004, 5, 595–610. [Google Scholar] [CrossRef] [Green Version]
- Yang, D.; Kane, D.L.; Hinzman, L.D.; Zhang, X.; Zhang, T.; Ye, H. Siberian Lena River hydrologic regime and recent change. J. Geophys. Res. 2002, 107, 4694. [Google Scholar] [CrossRef]
- Zhang, X.; Ikeda, M.; Walsh, J. Arctic sea ice and freshwater changes driven by the atmospheric leading mode in a coupled sea ice-ocean model. J. Climatol. 2003, 16, 2159–2177. [Google Scholar] [CrossRef]
- Dyurgerov, M.B.; Carter, C.L. Observational Evidence of Increases in Freshwater Inflow to the Arctic Ocean. Arct. Antarct. Alp. Res. 2004, 36, 117–122. [Google Scholar] [CrossRef]
- Carmack, E.C. The freshwater budget of the Arctic Ocean: Sources, storage and sinks. In The Freshwater Budget of the Arctic Ocean; Lewis, E.L., Ed.; Kluwer: Dordrecht, The Netherlands, 2000; pp. 91–126. [Google Scholar]
- Ye, B.; Yang, D.; Kane, D.L. Changes in Lena River streamflow hydrology: Human impacts versus natural variations. Water Resour. Res. 2003, 39, 1200. [Google Scholar] [CrossRef]
- Yang, D.; Ye, B.; Kane, D.L. Streamflow changes over Siberian Yenisei River Basin. J. Hydrol. 2004, 296, 59–80. [Google Scholar] [CrossRef]
- Stuefer, S.; Yang, D.; Shiklomanov, A. Effect of streamflow regulation on mean annual discharge variability of the Yenisei River. In Cold Region Hydrology in A Changing Climate, Proceedings of the Symposium H02 Held during IUGG2011 in Melbourne, Melbourne, Australia, 28 June–7 July 2011; IAHS Publ.: Wallingford, UK, 2011; Volume 346, pp. 27–32. [Google Scholar]
- Dynesius, M.; Nilsso, C. Fragmentation and flow regulation of river systems in the northern third of the world. Science 1994, 266, 753–762. [Google Scholar] [CrossRef]
- Woo, M.; Thorne, R. Streamflow in the Mackenzie basin, Canada. Arctic 2003, 56, 328–340. [Google Scholar] [CrossRef]
- Lammers, R.B.; Shiklomanov, A.I. A Regional, Hydrometeorological Data Network for Russia. 2013. Available online: http://www.r-arcticnet.sr.unh.edu/v4.0/index.html (accessed on 25 July 2015).
- Cayan, D.R.; Kammerdiener, S.A.; Dettinger, M.D.; Caprio, J.M.; Peterson, D.H. Changes in the Onset of Spring in the Western United States. Bull. Am. Meteorol. Soc. 2001, 82, 399–415. [Google Scholar] [CrossRef] [Green Version]
- Stewart, I.; Cayan, D.; Dettinger, M. Changes toward earlier streamflow timing across western North America. J. Climatol. 2005, 18, 1136–1155. [Google Scholar] [CrossRef]
- Mann, H.B. Nonparametric tests against trend. Econometrica 1945, 13, 245–259. [Google Scholar] [CrossRef]
- Kendall, M. Rank Correlation Measures; Charles Griffin: London, UK, 1975. [Google Scholar]
- Hirsch, R.M.; Slack, J.R. A non-parametric trend test for seasonal data with serial dependence. Water Resour. Res. 1984, 20, 727–732. [Google Scholar] [CrossRef] [Green Version]
- Yue, S.; Pilon, P.J.; Phinney, B.; Cavadias, G. The influence of autocorrelation on the ability to detect trend in hydrological series. Hydrol. Process. 2002, 16, 1807–1829. [Google Scholar] [CrossRef]
- Burn, D.H.; Cunderlik, J.M. Hydrological trends and variability in the Liard River basin. Hydrol. Sci. 2004, 49, 53–67. [Google Scholar] [CrossRef] [Green Version]
- Kane, D.L. The impact of Arctic hydrologic perturbations on Arctic ecosystems induced by climate change. In Global Change and Arctic Terrestrial Ecosystems; Oechel, W.C., Callaghan, T., Gilmanov, T.G., Holten, J.I., Maxwell, B., Molau, U., Sveinbjornsson, B., Eds.; Springer: New York, NY, USA, 1997; pp. 63–81. [Google Scholar]
- Shiklomanov, A.I.; Lammers, R.B. Record Russian river discharge in 2007 and the limits of analysis. Environ. Res. Lett. 2009, 4, 045015. [Google Scholar] [CrossRef]
- Rawlins, M.A.; Steele, M.; Holland, M.M.; Adam, J.C.; Cherry, J.E.; Francis, J.A.; Groisman, P.Y.; Hinzman, L.D.; Huntington, T.G.; Kane, D.L.; et al. Analysis of the Arctic system for freshwater cycle intensification: Observations and expectations. J. Clim. 2010, 23, 5715–5737. [Google Scholar] [CrossRef]
- St Jacques, J.M.; Sauchyn, D.J. Increasing winter baseflow and mean annual streamflow from possible permafrost thawing in the Northwest Territories, Canada. Geophys. Res. Lett. 2009, 36, L01401. [Google Scholar] [CrossRef]
Figure 1.
Map showing the Arctic Ocean, oceanic features, major surface currents, major reservoirs, and drainage basins and outlet stations of the Mackenzie, Ob, Yenisei and Lena rivers. Red arrows denote warmer currents, while black arrows denote colder currents. Adapted from Figure 6 in McClelland et al. [9].

Figure 2.
Trends in pulse dates with p-values for 1980–2009 and the entire available length of record. Only 1980–2009 trends are given for the Yenisei station, due to missing data from 1969–1979; Mackenzie station trends are calculated for continuous data from 1973–2009 due to missing data prior to 1973. Black markers denote observed time series values connected with a dotted line, with the thick solid line indicating the longer record trend line and the dashed line indicating the 30-year trend line.

Figure 3.
Trends in freshet volume (V2) with p-values for 1980–2009 and the entire available length of record. Only 1980–2009 trends are given for the Yenisei station due to missing data from 1969–1979; Mackenzie station trends are calculated for continuous data from 1973–2009 due to missing data prior to 1973. Black markers denote observed time series values connected with a dotted line, with the thick solid line indicating the longer record trend line and the dashed line indicating the 30-year trend line.

Figure 4.
Trends in annual volume with p-values for 1980–2009 and the entire available length of the record. Only 1980–2009 trends are given for the Yenisei station due to missing data from 1969–1979; Mackenzie station trends are calculated for continuous data from 1973–2009 due to missing data prior to 1973. Black markers denote observed time series values connected with a dotted line, with the thick solid line indicating the longer record trend line and the dashed line indicating the 30-year trend line.

Figure 5.
Trends in MOLY total freshwater volume contribution to the Arctic Ocean (A) annually, (B) during V1 and V2 freshet definitions, and (C) seasonally for the period 1980–2009. Solid, unmarked lines denote trends, with changes per decade and p-values given in annual.
Figure 5.
Trends in MOLY total freshwater volume contribution to the Arctic Ocean (A) annually, (B) during V1 and V2 freshet definitions, and (C) seasonally for the period 1980–2009. Solid, unmarked lines denote trends, with changes per decade and p-values given in annual.


Table 1.
Characteristics of outlet stations as labeled in Figure 1.
Table 1.
Characteristics of outlet stations as labeled in Figure 1.
| Basin | ID | Name | Location (°N, °E) | Area (km2) | Avail. Years |
|---|---|---|---|---|---|
| Mackenzie | 10LC014 | Mackenzie at Arctic Red | 67.5, −133.8 | 1,679,100 | 1973–2009 |
| Lena | 3821 | Lena at Kusur | 56.8, −111.4 | 2,430,000 | 1936–2009 |
| Yenisei | 9803 | Yenisei at Igarka | 55.7, −117.6 | 2,440,000 | 1936–2009 * |
| Ob | 11801 | Ob at Salekhard | 59.1, −112.4 | 2,950,000 | 1936–2009 |
* Yenisei station is missing records in the years 1963–1965, 1968–1974, and 1977–1979. Records are not infilled.
Table 2.
Metrics used to describe freshet characteristics. See text for definitions.
| Symbol | Description |
|---|---|
| FP | Freshet pulse date |
| FL | Freshet length |
| FM | Peak freshet magnitude |
| V1 | April–July volume |
| V2 | Freshet volume |
| VAPR | April volume |
| VMAY | May volume |
| VJUN | June volume |
| VJUL | July volume |
| VANN | Annual volume |
| VDJF | December–February volume |
| VMAM | March–May volume |
| VJJA | June–August volume |
| VSON | September–November volume |
Table 3.
Average proportional percentage contribution to total MOLY flow volume per river for different timing measures, 1980–2009.
Table 3.
Average proportional percentage contribution to total MOLY flow volume per river for different timing measures, 1980–2009.
| River | V1% | V2% | VAPR% | VMAY% | VJUN% | VJUL% |
|---|---|---|---|---|---|---|
| Mackenzie | 14 | 13 | 19 | 20 | 10 | 15 |
| Lena | 31 | 35 | 11 | 15 | 37 | 37 |
| Yenisei | 35 | 32 | 48 | 43 | 37 | 22 |
| Ob | 20 | 20 | 22 | 22 | 16 | 26 |
Table 4.
Trends in various flow characteristics for MOLY outlet stations. Negative time values indicate trends toward earlier dates and vice versa.
Table 4.
Trends in various flow characteristics for MOLY outlet stations. Negative time values indicate trends toward earlier dates and vice versa.
| Rivers | Entire Period Trend | 30-Year Trend (1980–2009) | ||||||||
|---|---|---|---|---|---|---|---|---|---|---|
| FP | FL | FM | V1 | VANN | FP | FL | FM | V1 | VANN | |
| d/ 10 Year | d/ 10 Year | m3 s−1/ 10 Year | km3/ 10 Year | km3/ 10 Year | d/ 10 Year | d/ 10 Year | m3 s−1/ 10 Year | km3/ 10 Year | km3/ 10 Year | |
| Mackenzie | −1.2 * | 0.0 | −767 | 0.0 | 9.0 | −1.4 | 0.8 | 0 | 5.1 ** | 21.5 ** |
| Ob | 0.0 | −0.7 ** | −123 | 0.0 | 5.4 | 0.0 | 0.8 | 290 | 5.3 ** | 10.3 |
| Lena | −1.4 ** | 0.0 | −622 | 3.5 | 28.8 ** | −0.9 | 2.4 | −2000 | 18.9 ** | 40.6 ** |
| Yenisei | -- | -- | -- | -- | -- | −1.6 | 1.7 | −1600 | 4.0 | 23.7 ** |
* denotes trend is significant at the 10% level and ** denotes trend is significant at the 5% level.
Table 5.
Trends in the fraction of flows during different seasons for MOLY outlet stations. Negative values indicate trends toward lower percentages and vice versa.
Table 5.
Trends in the fraction of flows during different seasons for MOLY outlet stations. Negative values indicate trends toward lower percentages and vice versa.
| Rivers | Entire Period Trend (% Change) | 30-year Trend (1980–2009) (% Change) | ||||||||
|---|---|---|---|---|---|---|---|---|---|---|
| V2 | VDJF | VMAM | VJJA | VSON | V2 | VDJF | VMAM | VJJA | VSON | |
| Mackenzie | −0.8 | 1.5 ** | 2.6 | −4.3 | 0.7 | −0.6 | 1.3 | 2.2 | −3.4 ** | 0.8 |
| Ob | 0.3 | 2.2 ** | 2.7 | −3.6 * | −0.7 | −1.2 | −1.4 | 0.8 | 0.3 | 1.4 |
| Lena | −1.6 | 2.0 ** | 3.8 ** | −7.1 ** | −0.1 | −2.7 | 0.5 | 2.5 | −8.3 | 7.5 ** |
| Yenisei | -- | -- | -- | -- | -- | −2.0 | 2.8 ** | 4.3 | −6.0 * | 2.1 |
* denotes trend is significant at the 10% level and ** denotes trend is significant at the 5% level.
© 2020 by the authors. Licensee MDPI, Basel, Switzerland. This article is an open access article distributed under the terms and conditions of the Creative Commons Attribution (CC BY) license (http://creativecommons.org/licenses/by/4.0/).
Share and Cite
MDPI and ACS Style
Ahmed, R.; Prowse, T.; Dibike, Y.; Bonsal, B.; O’Neil, H. Recent Trends in Freshwater Influx to the Arctic Ocean from Four Major Arctic-Draining Rivers. Water 2020, 12, 1189. https://doi.org/10.3390/w12041189
AMA Style
Ahmed R, Prowse T, Dibike Y, Bonsal B, O’Neil H. Recent Trends in Freshwater Influx to the Arctic Ocean from Four Major Arctic-Draining Rivers. Water. 2020; 12(4):1189. https://doi.org/10.3390/w12041189
Chicago/Turabian StyleAhmed, Roxanne, Terry Prowse, Yonas Dibike, Barrie Bonsal, and Hayley O’Neil. 2020. "Recent Trends in Freshwater Influx to the Arctic Ocean from Four Major Arctic-Draining Rivers" Water 12, no. 4: 1189. https://doi.org/10.3390/w12041189
Note that from the first issue of 2016, this journal uses article numbers instead of page numbers. See further details here.