Article

Evaluation of Multi-Satellite Precipitation Products and Their Ability in Capturing the Characteristics of Extreme Climate Events over the Yangtze River Basin, China

1
Key Laboratory of Water Cycle & Related Land Surface Processes, Institute of Geographic Sciences and Natural Resources Research, Chinese Academy of Sciences, Beijing 100101, China
2
College of Environment and Resources, University of Chinese Academy of Sciences, Beijing 100049, China
3
State Key Laboratory of Water Resources & Hydropower Engineering Sciences, Wuhan University, Wuhan 430000, China
*
Author to whom correspondence should be addressed.
Water 2020, 12(4), 1179; https://doi.org/10.3390/w12041179
Submission received: 14 March 2020 / Revised: 12 April 2020 / Accepted: 16 April 2020 / Published: 20 April 2020
(This article belongs to the Special Issue Remote Sensing in Water Cycle Management)

Abstract

:
Against the background of global climate change and anthropogenic stresses, extreme climate events (ECEs) are projected to increase in both frequency and intensity. Precipitation is one of the main climate parameters for ECE analysis. However, accurate precipitation information for extreme climate events research from dense rain gauges is still difficult to obtain in mountainous or economically disadvantaged regions. Satellite precipitation products (SPPs) with high spatial and temporal resolution offer opportunities to monitor ECE intensities and trends on large spatial scales. In this study, the accuracies of seven SPPs on multiple spatiotemporal scales in the Yangtze River Basin (YRB) during the period of 2003–2017 are evaluated, along with their ability to capture ECE characteristics. The seven products are the Tropical Rainfall Measuring Mission, Climate Hazards Group InfraRed Precipitation with Station Data (CHIRPS) (25), CHIRPS (05), Climate Prediction Center Morphing (CMORPH), Precipitation Estimation from Remotely Sensed Information using Artificial Neural Networks (PERSIANN)-Climate Data Record, PERSIANN-Cloud Classification System, and Global Precipitation Measurement (GPM) IMERG. Rain gauge precipitation data provided by the China Meteorological Administration are adopted as reference data. Various statistical evaluation metrics and different ECE indexes are used to evaluate and compare the performances of the selected products. The results show that CMORPH has the best agreement with the reference data on the daily and annual scales, but GPM IMERG performs relatively well on the monthly scale. With regard to ECE monitoring in the YRB, in general, GPM IMERG and CMORPH provide higher precision. As regards the spatial heterogeneity of the SPP performance in the YRB, most of the examined SPPs have poor accuracy in the mountainous areas of the upper reach. Only CMORPH and GPM IMERG exhibit superior performance; this is because they feature an improved inversion precipitation algorithm for mountainous areas. Furthermore, most SPPs have poor ability to capture extreme precipitation in the estuaries of the lower reach and to monitor drought in the mountainous areas of the upper reach. This study can provide a reference for SPP selection for ECE analysis.

1. Introduction

Extreme climate events (ECEs), including extreme precipitation, drought, extreme heat, and so on, refer to the occurrence of events in which climate variables exceed or fall below the threshold in tail of the probability distribution of observations [1]. Historical global warming has increased the number of ECEs in most parts of the world, especially in East and Southeast Asia, with more property losses and casualties in those areas as a result [2,3]. Against the background of global climate change and anthropogenic stresses, ECEs are expected to increase in both frequency and intensity [2,4,5,6]. Precipitation is one of the main climate parameters associated with ECEs, and heavy or reduced precipitation yield extreme precipitation or drought, respectively. Extreme precipitation and drought indexes are monitoring indexes commonly used to quantify the intensities and trends of these ECEs [7,8]. Precipitation information is the main input parameter required to obtain these monitoring indexes; therefore, precipitation data with high spatial and temporal resolutions are prerequisites for ECE analysis. Thus, monitoring and projection of precipitation changes are of great importance to both disaster prevention and ECE mitigation.
Rain gauges, radar, and satellites are common tools of precipitation measurement [9]. In situ gauge observations provide direct measurements of surface precipitation, but their areal coverage is small and usually insufficient for accurate characterization of the spatial variability of precipitation, which has high spatial heterogeneity [10]. Although radar-estimated precipitation data are, in many cases, quite reliable, radar coverage is still very limited relative to satellite observations. Moreover, there are regions where radar networks may not be deployed, such as high-elevation areas or areas with complex terrain [11,12]. Satellite remote sensing, which provides nearly global coverage, is a satisfactory means of compensating for the above limitations. Many satellite-based rainfall products have been generated to meet various hydrometeorological needs. Current satellite precipitation products (SPPs) include Climate Prediction Center Morphing (CMORPH) [13], the Tropical Rainfall Measuring Mission (TRMM) [14], Integrated Multi-Satellite Retrievals for Global Precipitation Measurement (GPM IMERG) [15], the Precipitation Estimation from Remotely Sensed Information using Artificial Neural Networks (PERSIANN) series [16,17], and Climate Hazards Group InfraRed Precipitation with Station Data (CHIRPS) [18]. These SPPs are widely used because of their relatively high levels of accuracy.
Extreme precipitation [19] refers to a period when the total rainfall exceeds a certain threshold, and drought [20] usually occurs over months to years in a region, mainly caused by lack of precipitation. They are devastating types of natural hazards and ultimately lead to a series of social, environmental, and ecological problems [19,20,21]. Most previous studies with SPPs have focused on satellite data accuracy evaluation as well as their individual capabilities to represent extreme precipitation and drought. For example, Fang et al. [22] evaluated the performance of the TRMM 3B42 and GPM IMERG products in capturing extreme precipitation events over China. They found that GPM IMERG and TRMM can effectively reproduce the spatial patterns of extreme precipitation. However, both products were found to underestimate the extreme precipitation, with GPM IMERG performing better than TRMM for central China and some parts of northern China. Stampoulis et al. [23] compared the reliability of CMORPH and PERSIANN in depicting heavy precipitation events over the Mediterranean, and they found that CMORPH yields smaller errors than PERSIANN in that case. Mayor et al. [24] found that IMERG highly underestimates extreme precipitation events over Mexico, with the errors tending to decrease over greater terrain elevations. Zhu et al. [25] evaluated IMERG V05, CMORPH with corrected bias (CMORPH-CRT), and TRMM 3B42V7 for drought monitoring over the Xiang River Basin using the standardized precipitation index (SPI), and they found that IMERG V05 exhibits the highest accuracy against grid-based precipitation in the examined case. However, extreme precipitation and drought events often coexist, and no comprehensive analysis of SPP capability to capture extreme precipitation and drought has been performed, which limits the practical application of these SPPs.
Yangtze River Basin (YRB) contains various terrain types and is located in South China. It is, dominated by both the southeast and southwest monsoons from the Pacific and Indian Oceans, respectively. The region is affected by both floods and droughts [26,27]. Therefore, there is an urgent need to examine SPP capacity to detect extreme precipitation and drought over the YRB.
This study evaluates the performance of various SPPs as regards comprehensive monitoring of extreme precipitation and drought, and it discusses the spatial heterogeneity of their performance over the YRB. The following questions are posed: (1) Which among the selected SPPs exhibits superior performance for extreme precipitation and drought event monitoring in the YRB? (2) Is there a spatial difference of the SPP accuracy in the YRB? First, the abilities of seven SPPs to capture extreme precipitation and drought events were comprehensively evaluated using precipitation data from 198 meteorological stations provided by the China Meteorological Administration (CMA). Then, the spatial differences on basin and station scale performance of the SPPs for extreme precipitation and drought monitoring are assessed. The remainder of this paper is organized as follows. The study area and data are presented in Section 2, and the evaluation methodology is introduced in Section 3. The results and discussion are presented in Section 4, and brief conclusions are given in Section 5. This study serves as a valuable reference for SPP application for ECE monitoring in the YRB, and it will contribute to future improvement of SPP algorithms.

2. Study Area and Data
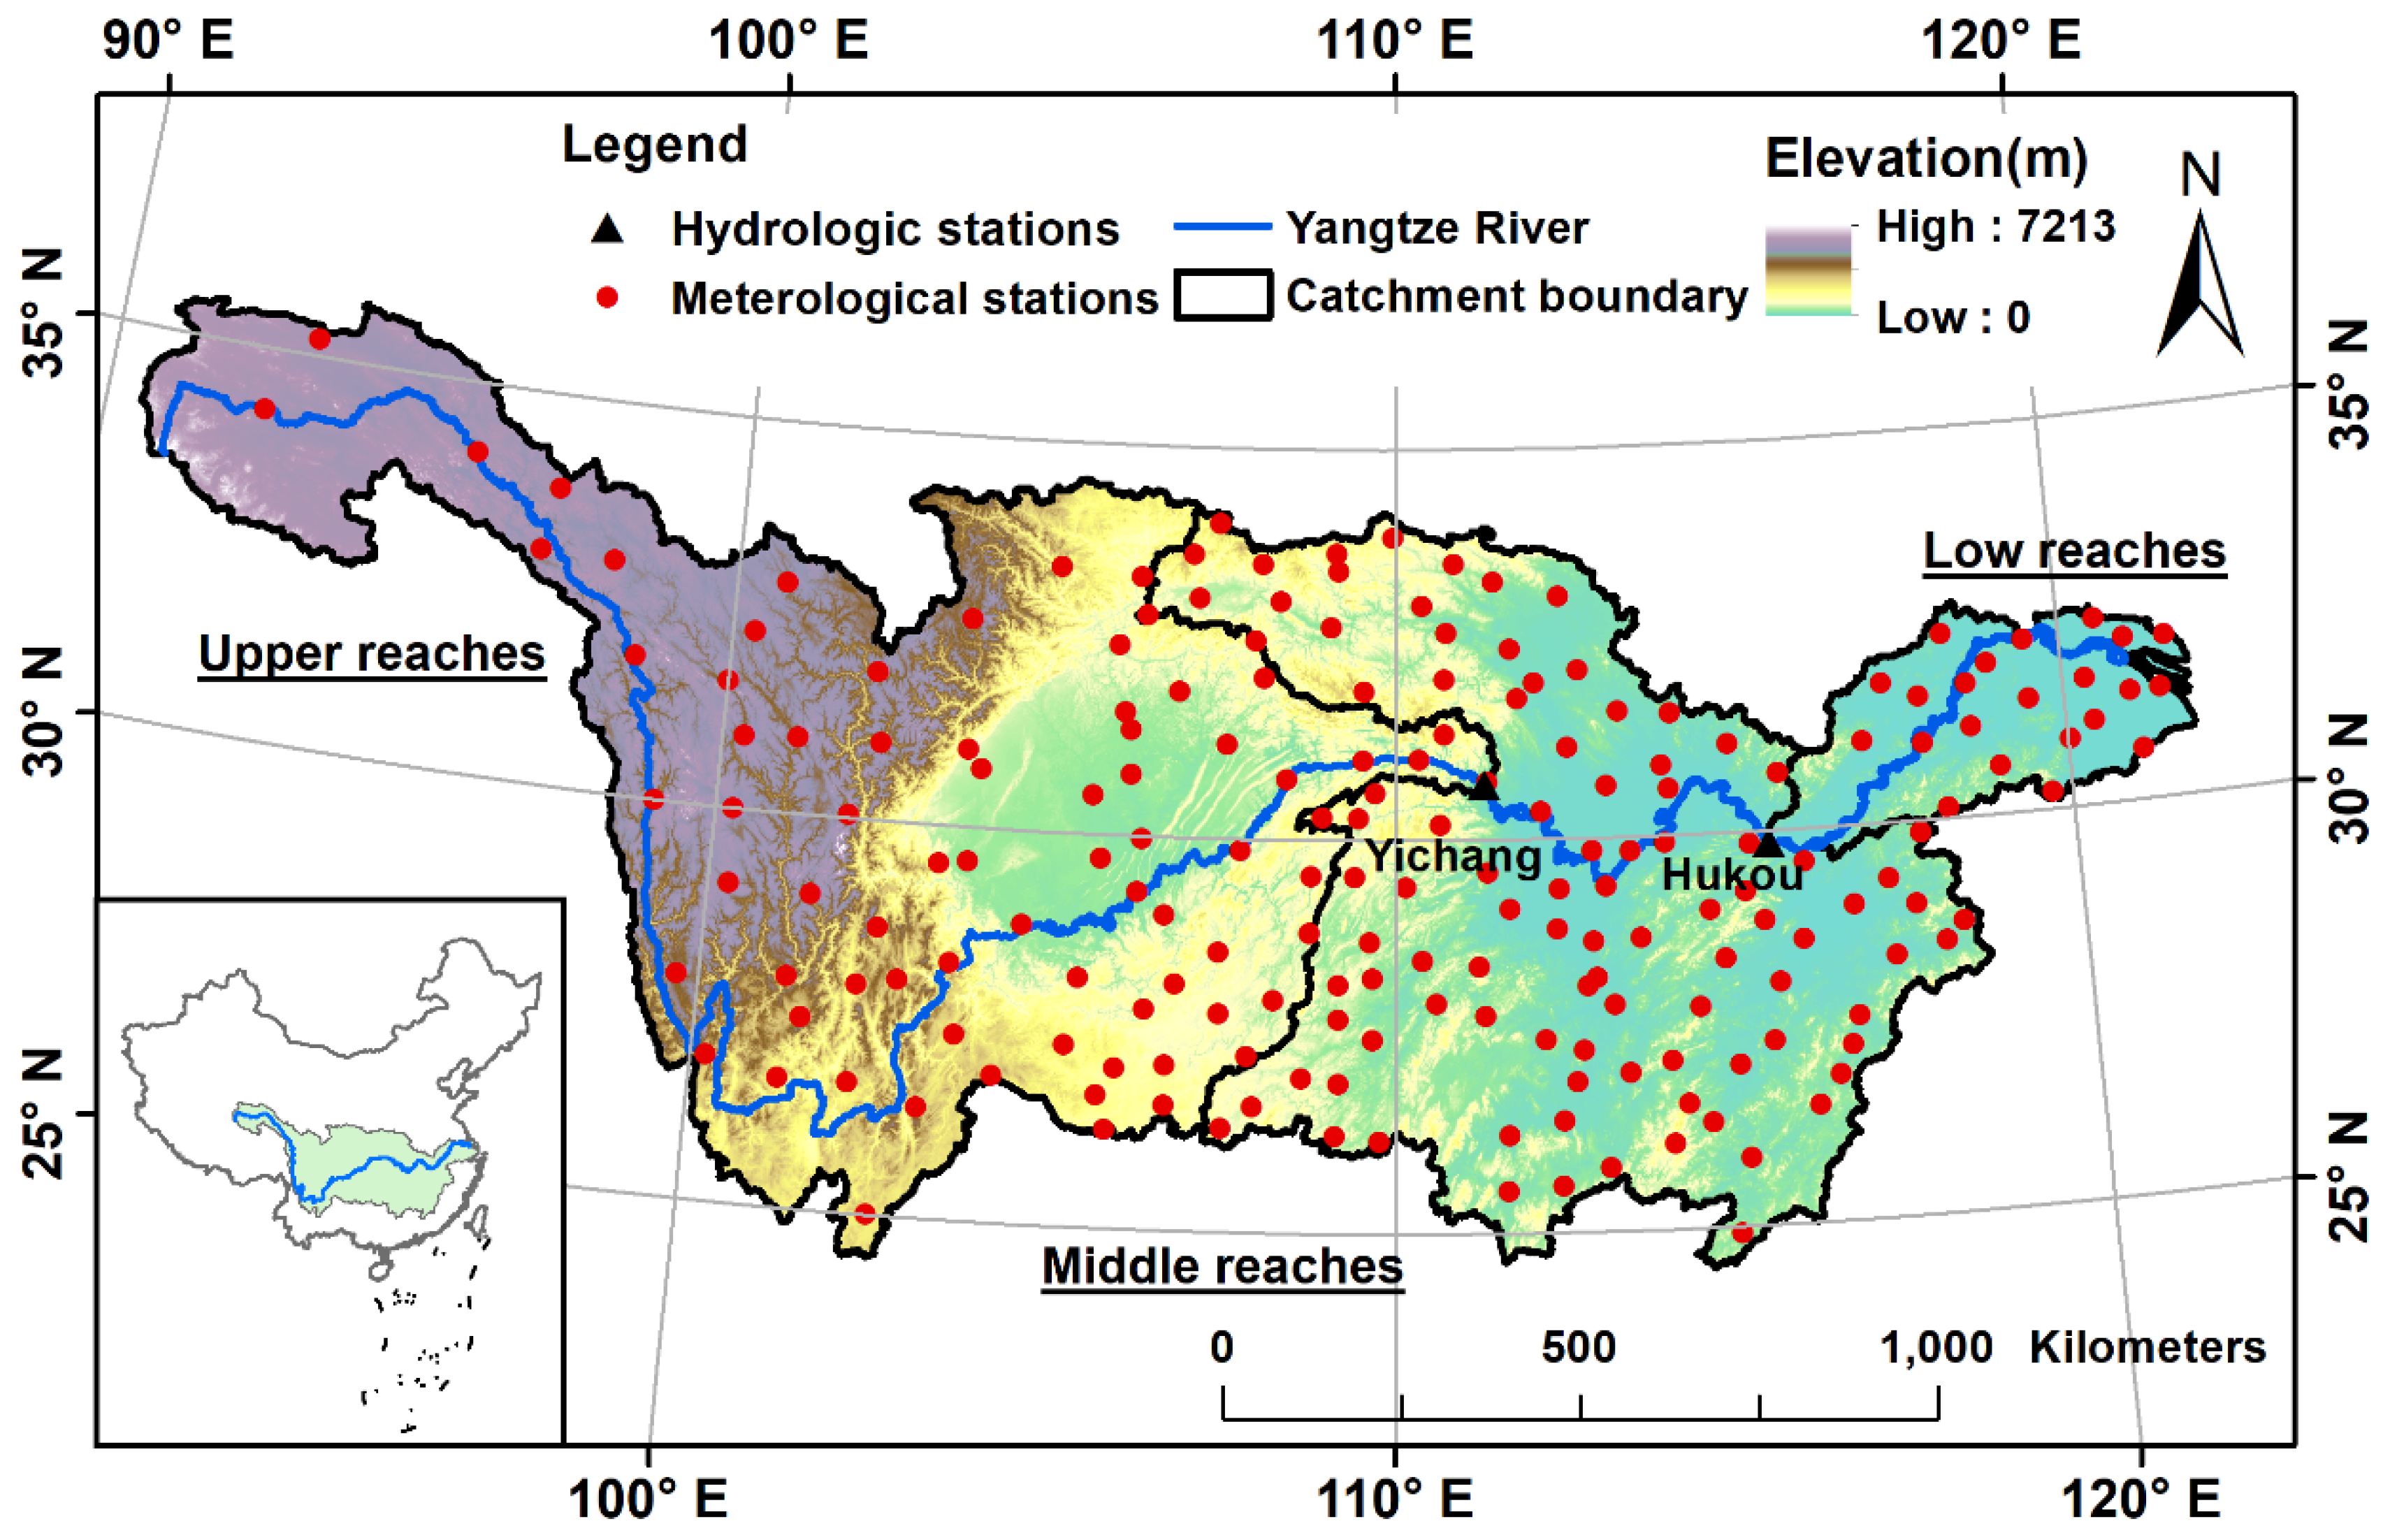
2.1. Study Area

The Yangtze River, located within 90°33′−122°25′ E and 24°30′−35°45′ N in South China, is 6300 km long, and it has a total drainage area of 1,800,000 km2 above the estuary (Figure 1). It is the longest river in China and the third longest river in the world, accounting for 18.8% of the national area, and it sustains a population of approximately 400 million, which equals 30% of the national population. The Yangtze River Basin (YRB) covers three steps of terrain in China, and the geomorphic types are complex as there is the Tibetan Plateau, known as the “roof of the world”, which includes mountains, basins, various types of hills, and low-lying plains. The YRB is located in subtropical and temperate climate zones. The average annual precipitation is about 1100 mm, and precipitation mainly occurs during summer. The annual mean air temperature is approximately 14 °C.
The YRB consists of three sub-reaches: the upper (river head to Yichang), middle (Yichang to Hukou), and lower reaches (Hukou to Estuary), which respectively cover 1,000,000, 680,000, and 120,000 km2 with mainstream lengths of 4504, 955, and 938 km, respectively. The three sections of the Yangtze River are divided according to the geographical environment and hydrological characteristics of the main stream. The mean annual precipitation in the YRB ranges from 270 to 1900 mm from the western to eastern regions. The YRB elevations range from 7213 m in the upstream mountainous areas to 0 m above sea level, changing drastically from west to east. The average elevations of the upper, middle, and lower reaches, respectively, are 2619, 436, and 82 m. The average elevation of the upstream source area ranges from 3000 to 5000 m. In this paper, three traditional sub-basins are selected to study SPP accuracy and the ability to capture extreme climate events on the basin scale.

2.2. Data

2.2.1. Reference Data

In this study, the daily precipitation data during 2003–2017 were used as a benchmark for the evaluation of SPPs. There are 198 meteorological stations in the YRB with 73, 102, and 22 sites in the upper, middle, and lower reaches, respectively (Figure 1). These data were provided by the China Meteorological Administration (http://data.cma.cn) with high quality.

2.2.2. SSPs

In this study, seven SPPs were considered: CHIRPS v2.0 (0.25) and CHIRPS v2.0 (0.05) (hereafter CHIRPS (25) and CHIRPS (05)), CMORPH, GPM IMERG, TRMM, PERSIANN-Climate Data Record (CDR), and PERSIANN-Cloud Classification System (CCS). The detailed descriptions of SPPs are listed in Table 1.
Climate Hazards Group InfraRed Precipitation with Station data (CHIRPS) was created by the USGS Earth Resources Observation and Science (EROS) Center. The CHIRPS datasets provide two sets of resolution precipitation data (0.25 degrees and 0.05 degrees), where the 0.05 degree resolution data is resampled from 0.25 degree resolution data. The CHIRPS datasets are now available at ftp://ftp.chg.ucsb.edu/pub/org/chg/products/CHIRPS-2.0/. In this study, CHIRPS datasets were used at a 0.25 degree daily and 0.05 degree daily spatiotemporal resolution (hereafter CHIRPS (25) and CHIRPS (05)).
The CMORPH datasets are provided by the National Oceanic and Atmospheric Administration (NOAA), including CMORPH RAW, CMORPH CRT, and CMORPH BLD. The CMORPH BLD was generated using optimal interpolation to merge CMORPH CRT and gauge observations. The CMORPH datasets are now available at https://ftp.cpc.ncep.noaa.gov/precip/CMORPH_V1.0/. In this study, CMORPH BLD (CMORPH) dataset was used at a 0.25 degree daily spatiotemporal resolution.
GPM is a TRMM follow-on satellite precipitation program initiated by the National Aeronautics and Space Administration (NASA) and the Japan Aerospace Exploration Agency (JAXA). GPM provides worldwide microwave-based 3 h and microwave-based infrared (IR)-based half-hour rain and snow data products. The GPM core observation unit was successfully launched in February 2014, and it is equipped with more advanced equipment than the TRMM satellite, which also provides wider coverage. GPM data are generated from the IMERG V06B algorithm, which is intended to intercalibrate, merge, and interpolate “all” satellite microwave precipitation estimates, together with microwave-calibrated IR satellite estimates, precipitation gauge analyses, and potentially other precipitation estimators on fine time and space scales for the TRMM and GPM eras over the entire globe. In this study, the “final run” IMERG dataset was used, which was calibrated using monthly gauge data and included TRMM-era data dating back to June 2000. The GPM IMERG datasets are available at https://pmm.nasa.gov/data-access/downloads/gpm. In this study, the GPM IMERG V06 (hereafter GPM IMERG) dataset was used at 0.1 degrees with daily spatiotemporal resolution.
Both PERSIANN-CDR and PERSIANN-CCS were developed by the Center for Hydrometeorology and Remote Sensing at the University of California Irvine. The PERSIANN-CDR output is generated from the PERSIANN algorithm using GridSat-B1 infrared data and adjusted using the Global Precipitation Climatology Project monthly product [17]. The adjustment is performed by maintaining consistency between the two datasets at 2.5 degrees and on the monthly scale throughout the entire record [17]. The PERSIANN-CCS output is generated from the variable threshold cloud segmentation algorithm using categorization of cloud-patch features based on cloud height, areal extent, and texture variability, as estimated from satellite imagery [16]. The PERSIANN-CDR and PERSIANN-CCS datasets are available at http://chrsdata.eng.uci.edu/. In this study, the PERSIANN-CDR and PERSIANN-CCS datasets were used at 0.25 and 0.04 degrees, respectively, with daily spatiotemporal resolution.

2.2.3. Data Pre-Processing

An overlap period (2003–2017) was used to compare the performances of different SPPs. We first found out the grid of the SPPs that contained the gauge station, and then we extracted the grid precipitation and compared them with corresponding observations. To compare performance for the upper, middle, and lower reaches, the regional average precipitation was computed by averaging the rain gauge precipitation.

3. Methodology

3.1. Evaluation Metrics

Seven statistical indicators were used to quantify the consistency between the SPPs and observation data on different temporal scales: the Pearson linear correlation coefficient (R), root-mean-square error (RMSE), relative bias (Bias), false alarm ratio (FAR), probability of detection (POD), frequency bias index (FBI), and equitable threat score (ETS) [28]. In detail, R, RMSE, and Bias were employed to estimate the SPP accuracy on the annual and monthly scales. To further examine the SPP accuracy on the daily scale, a set of categorical skill metrics was also adopted, i.e., FAR, POD, FBI, and ETS; these metrics are widely used to evaluate consistency between observation and SPPs for rainy event occurrences [29,30]. We used seven thresholds (0.5, 1, 2, 4, 6, 8, and 10 mm) to identify the SPP capability to reproduce light rainfall events (the amount of rain exceeding a certain threshold). Note that POD and FAR indicate the fraction of correctly and incorrectly (false alarm) detected rainfall events, respectively; FBI denotes the SPP tendency to underestimate (FBI <1) or overestimate (FBI >1) rain events; and ETS reveals the overall SPP skill based on integration of POD, FAR, and FBI. Overall, perfect agreement between observation and a given SPP is indicated when POD, ETS, and FBI approach 1, and when FAR approaches 0. Definitions of these metrics and detailed descriptions are given in Table 2.

3.2. Indexes for Describing ECEs

3.2.1. Extreme Precipitation Indexes

The World Meteorological Organization has recommended 11 extreme precipitation indexes [31,32], which can be divided into two categories according to their units: (1) extreme precipitation intensity, with units of millimeters (e.g., rx1day, rx5day, R95p, R99p, and the annual total wet-day precipitation (PRCPTOT)); (2) extreme precipitation frequency with units of days (e.g., r10, r20, consecutive wet days (CWD), and consecutive dry days (CDD)). The above indexes are widely used to describe the features of extreme precipitation [33,34]. In this study, to evaluate the SPP performance in capturing the characteristics of extreme precipitation events over the YRB, only eight extreme precipitation indexes were selected for comparison with the same indexes for the rain gauge dataset; this approach was adopted to avoid excessive indicators (Table 3).

3.2.2. Meteorological Drought Indices

The SPI proposed by McKee [35,36] in 1993 has been widely used for drought monitoring on different time scales. In this study, the SPI was used to compare the SPP consistency with rain gauge data for meteorological drought monitoring. Compared to other meteorological drought indexes (e.g., the Palmer drought severity index (PDSI) and standardized precipitation–evapotranspiration index (SPEI)), the SPI is more easily calculated as it is based on precipitation alone. According to previous studies, a 30-year or more long-term monthly precipitation database is need for SPI calculation [37]. However, most satellite-based precipitation databases span fewer than 30 years because of their development histories. In many previous studies, SPPs spanning fewer than 30 years, such as TRMM and GPM IMERG, were employed for SPI calculation [38,39]. The dryness and wetness severity classifications according to the SPI values are listed in Table 4.

4. Results and Discussion

4.1. SPP Evaluation on Different Temporal Scales
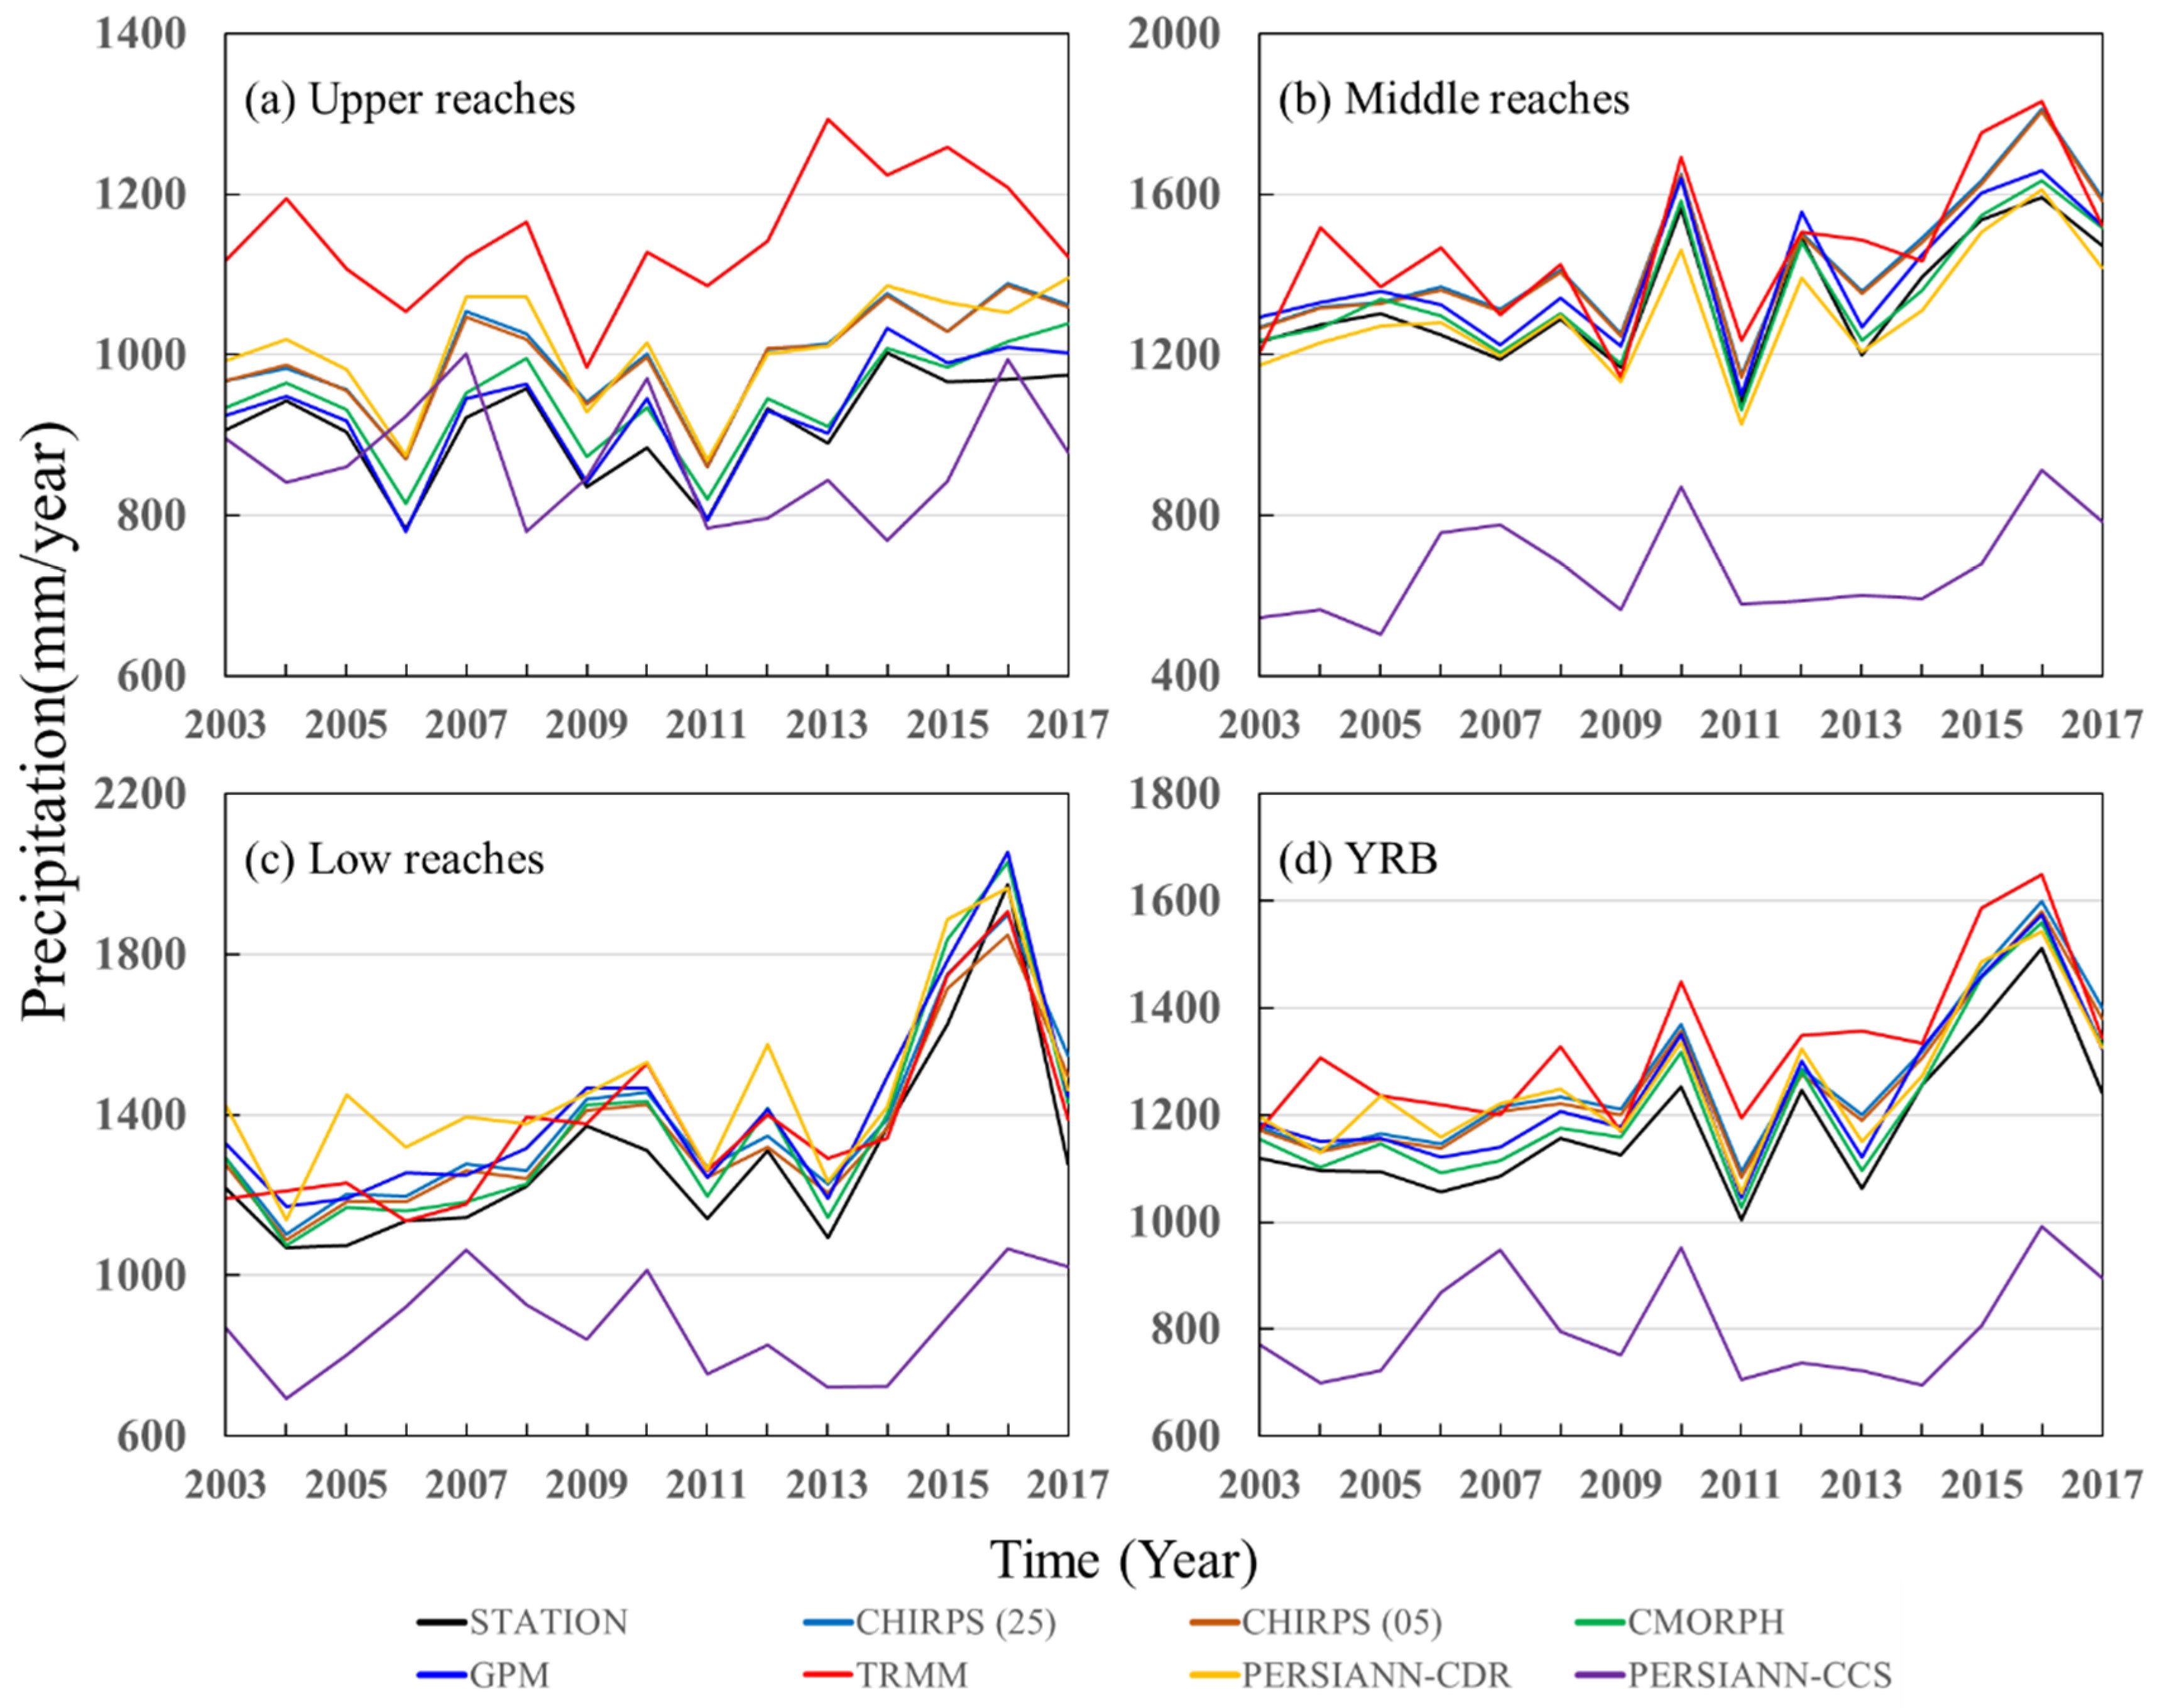
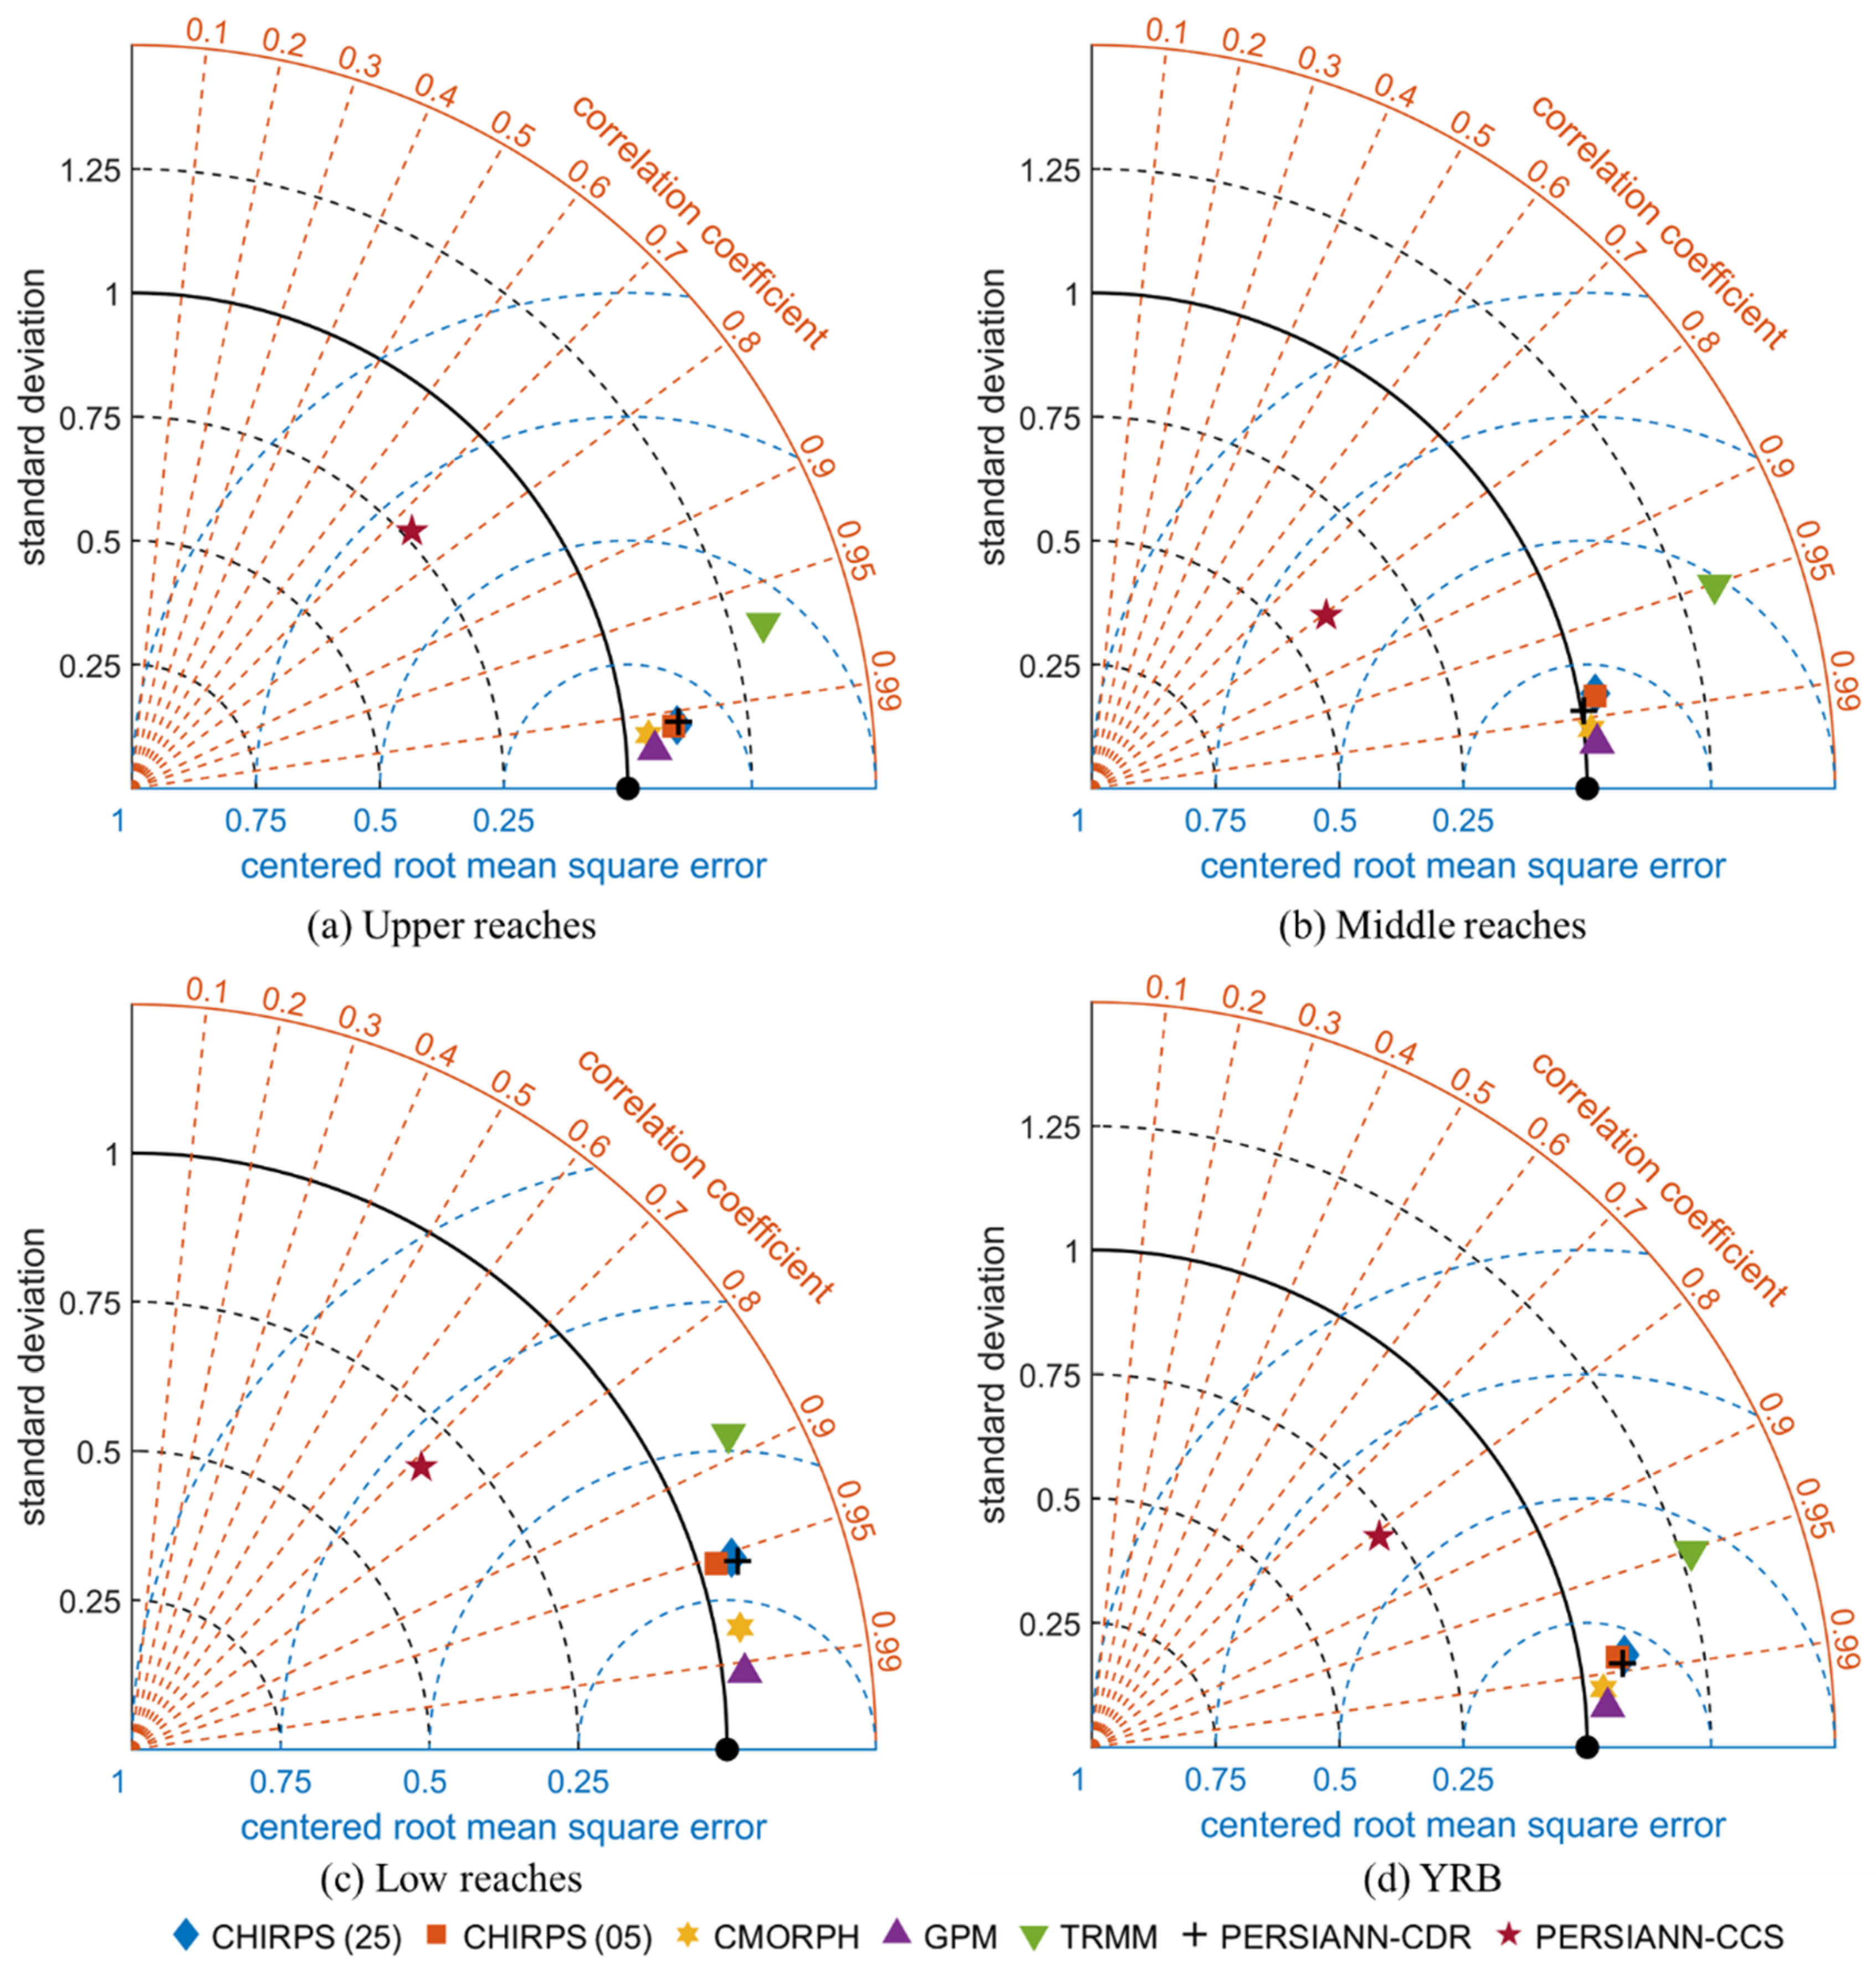
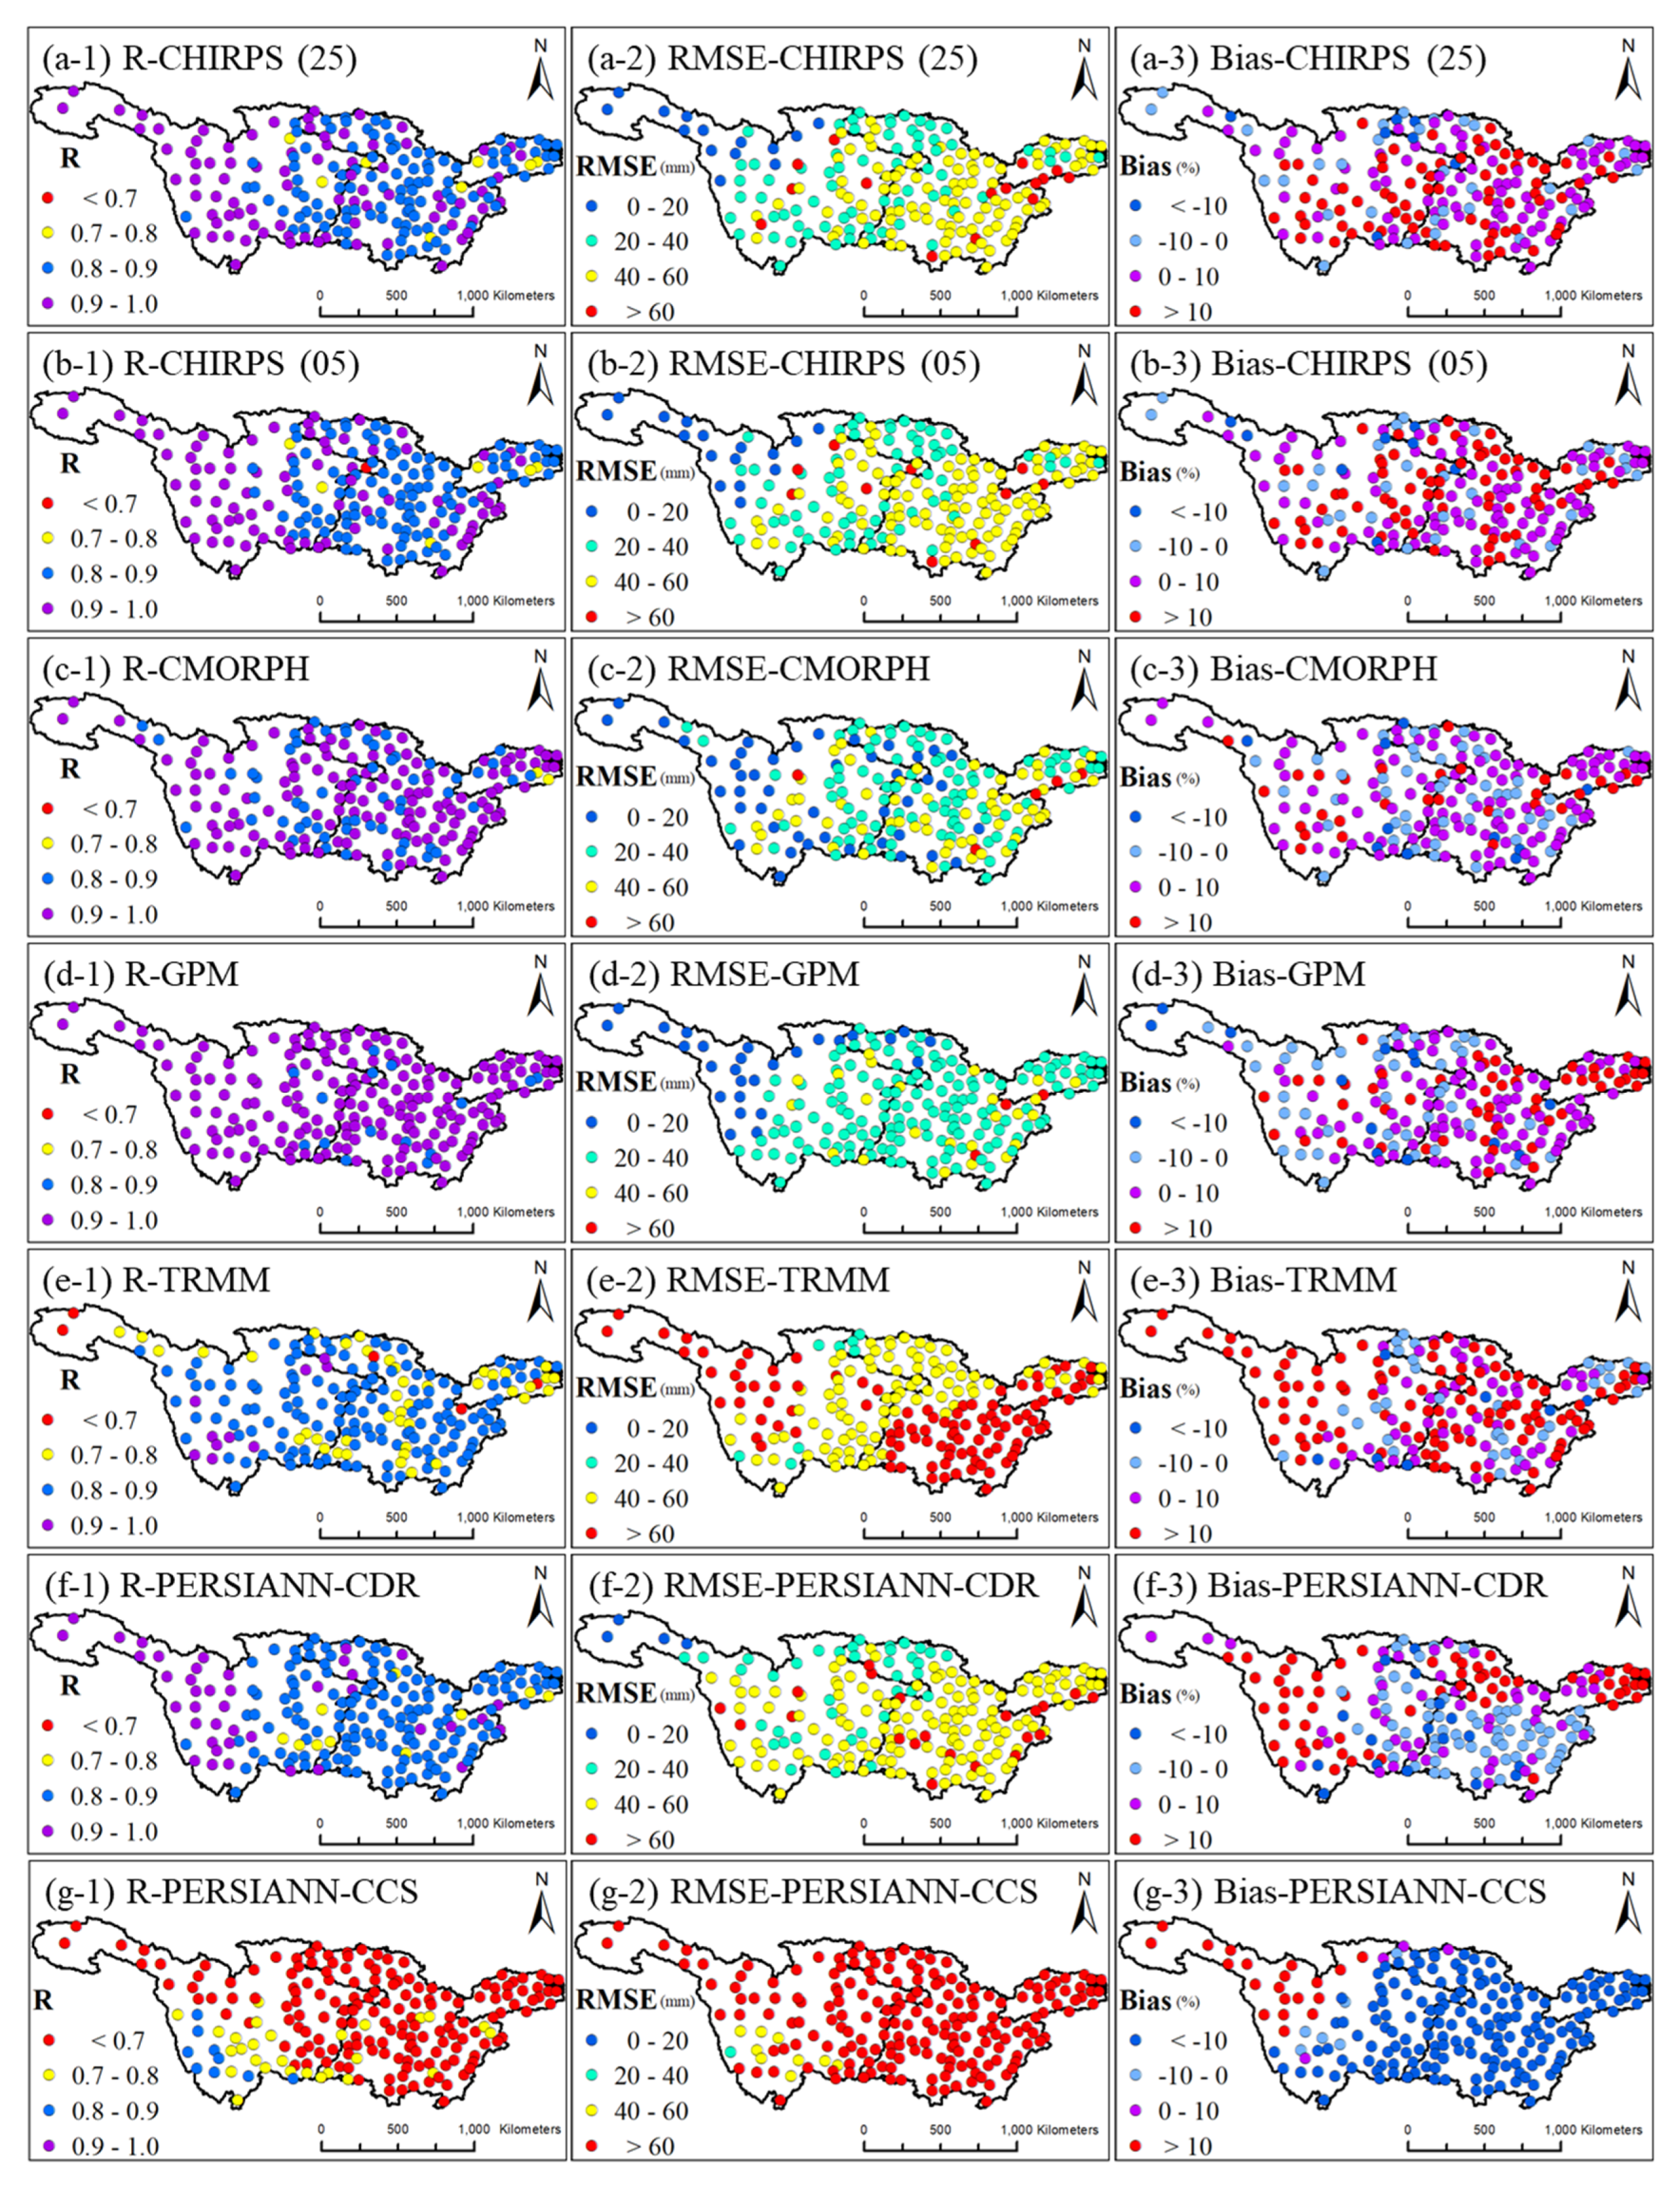
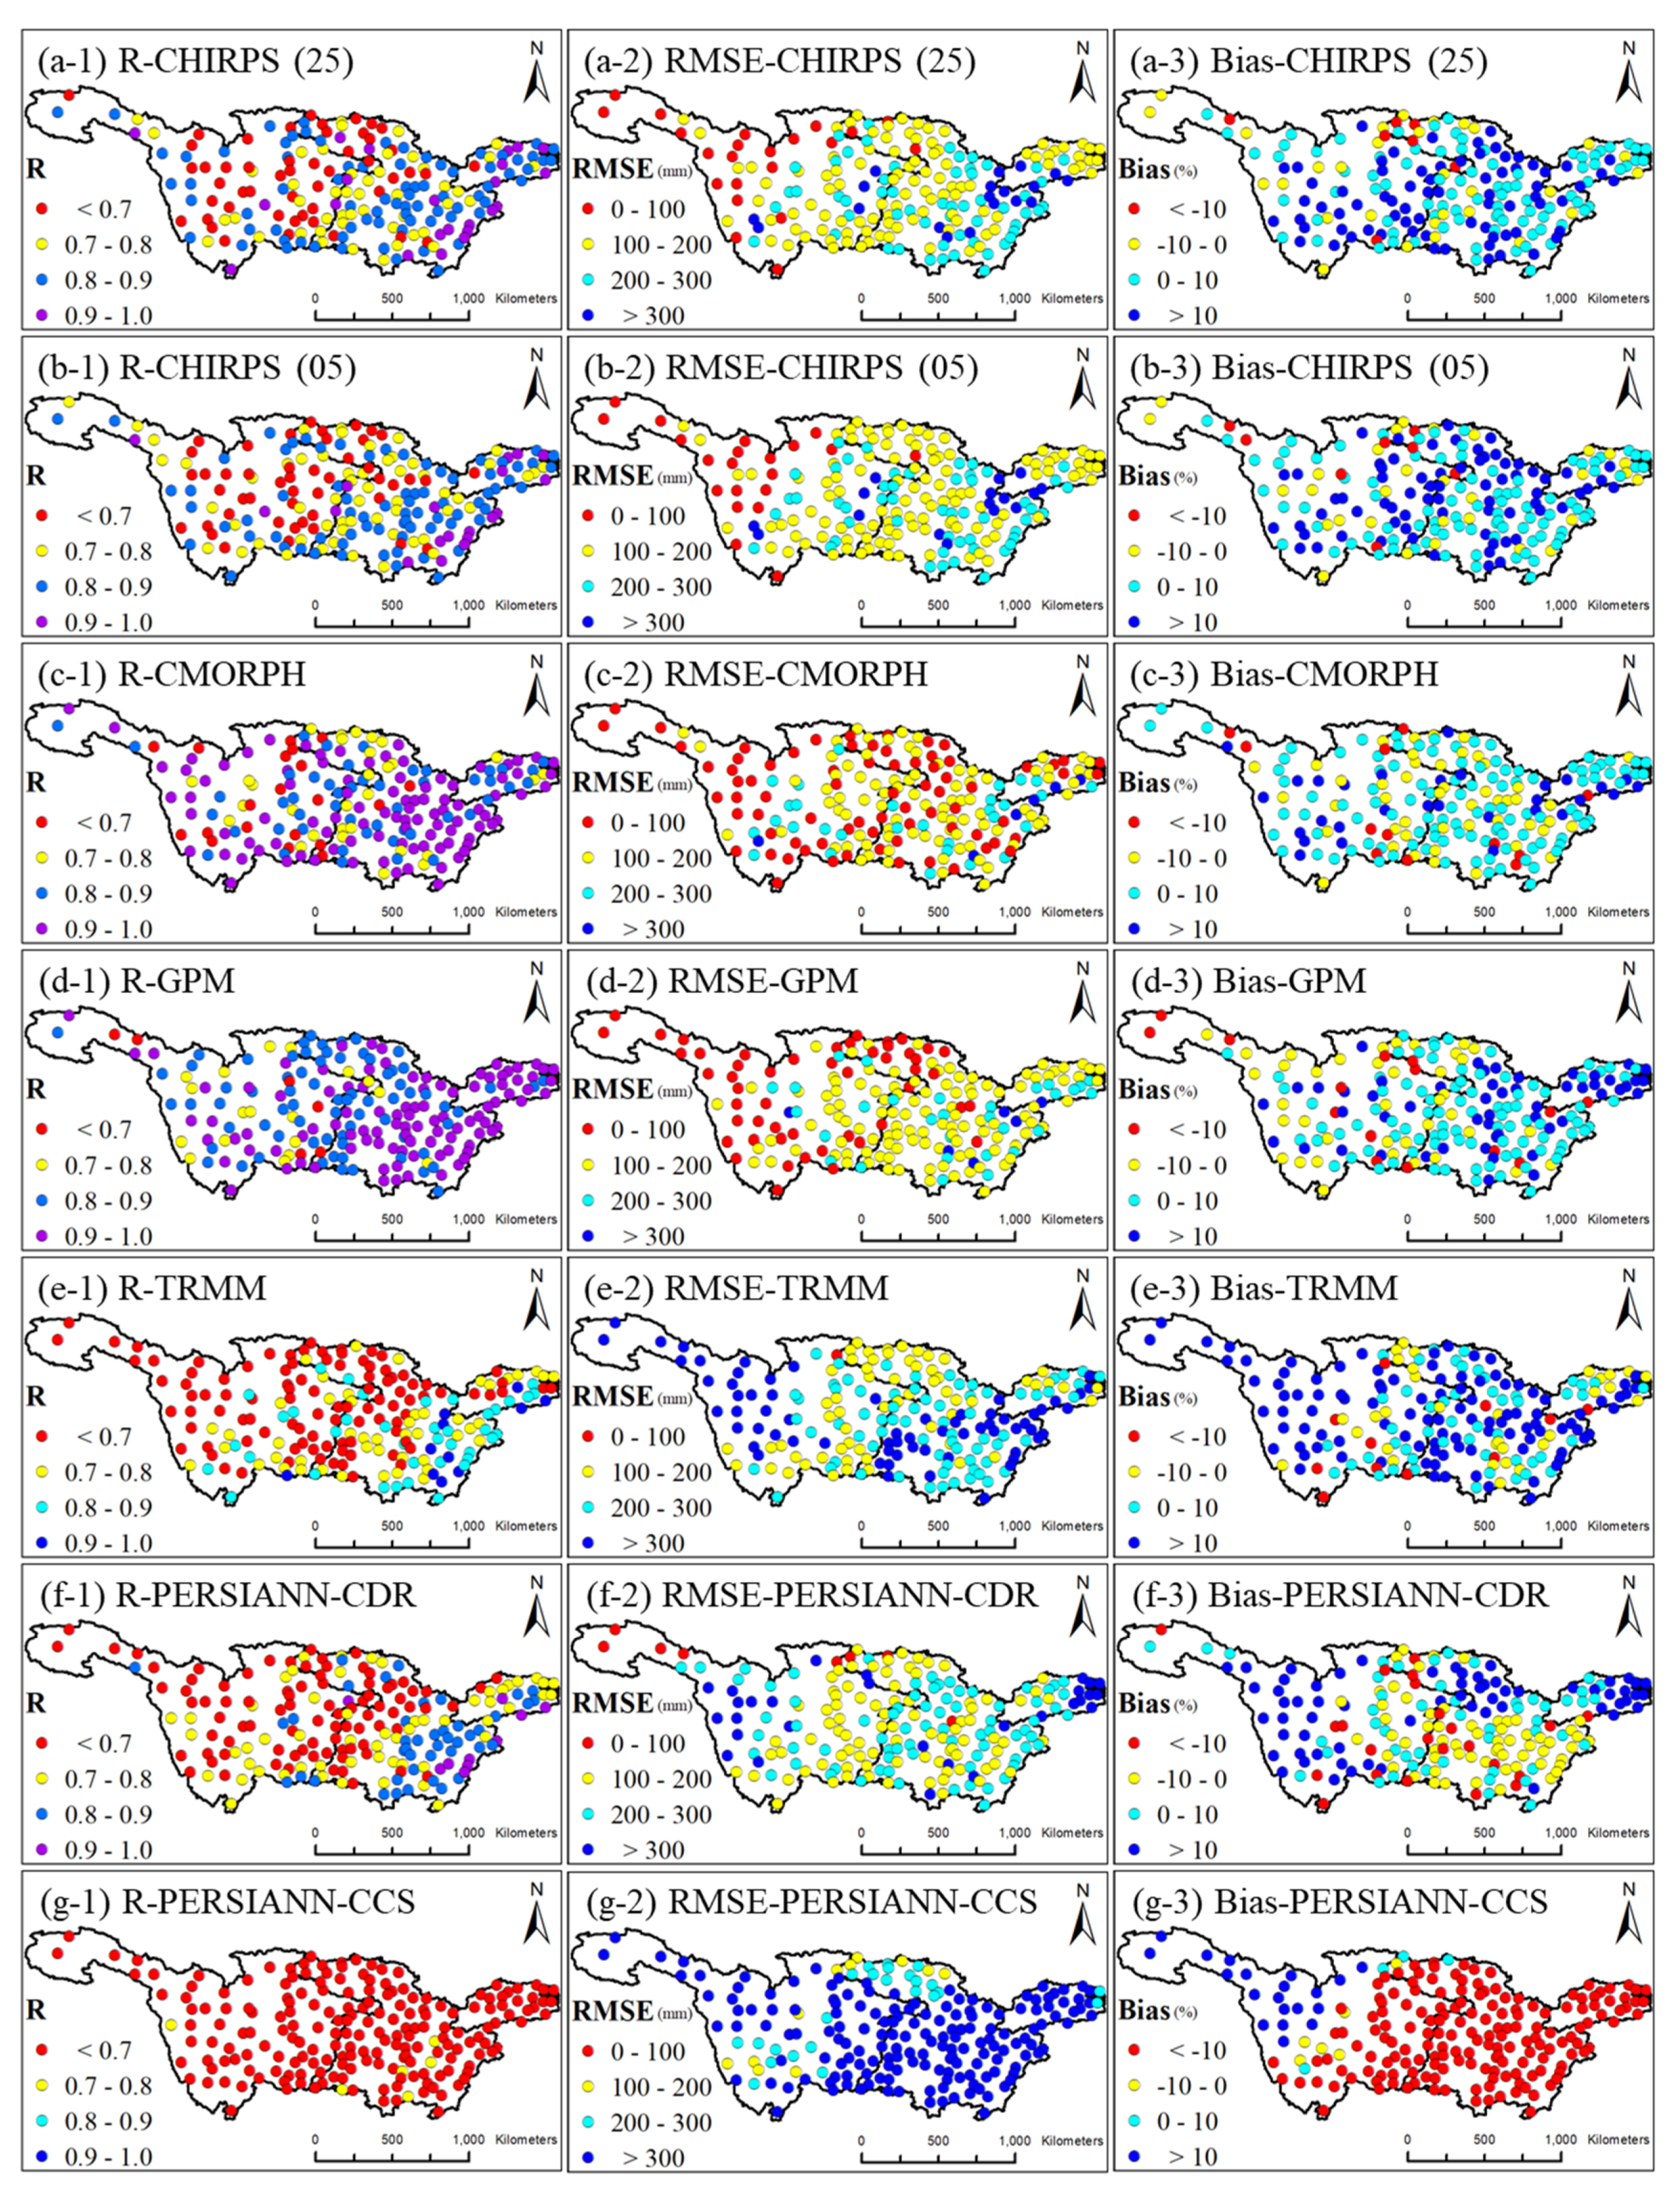
4.1.1. Annual Scale

Figure 2 shows the annual precipitation in the upper, middle, and lower reaches of the YRB, which was determined to assess the SPP annual precipitation variation and reference data. The relative bias between the SPPs and reference data was used to quantify the differences between these sources (Table 5).
As shown in Figure 2, although they can determine the annual precipitation variation trend, some of the SPPs considered in this work exhibited large errors compared with the rain gauge measurements. There are slight differences between CHIRPS (25) similar to CHIRPS (05), although the two products did show similar accuracy at basin scale. The accuracy of CHIRPS (05) was slightly better than that of CHIRPS (25). For the upper reaches, GPM IMERG and CMORPH showed good agreement with the rain gauge measurements, CHIRPS (05) and CHIRPS (25) slightly overestimated the precipitation, TRMM and PERSIANN-CDR significantly overestimated the precipitation, and PERSIANN-CCS underestimated the precipitation. For the middle reaches, CMORPH, PERSIANN-CDR, and GPM IMERG showed good agreement with the rain gauge measurements; CHIRPS (25), CHIRPS (05), and TRMM overestimated the precipitation; and PERSIANN-CCS significantly underestimated the precipitation. For the lower reaches, CMORPH and CHIRPS (05) agreed well with the rain gauge measurements; GPM IMERG, CHIRPS (25), and TRMM overestimated the precipitation, and PERSIANN-CDR and PERSIANN-CCS significantly underestimated the precipitation. Obviously, each SPP exhibited different performance levels in the three sub-catchments of the YRB. Synthesizing the annual precipitation variation and relative errors of both the SPPs and observations, the SPPs exhibited the best accuracy in the middle reach, followed by the lower and upper reaches.

4.1.2. Monthly Scale
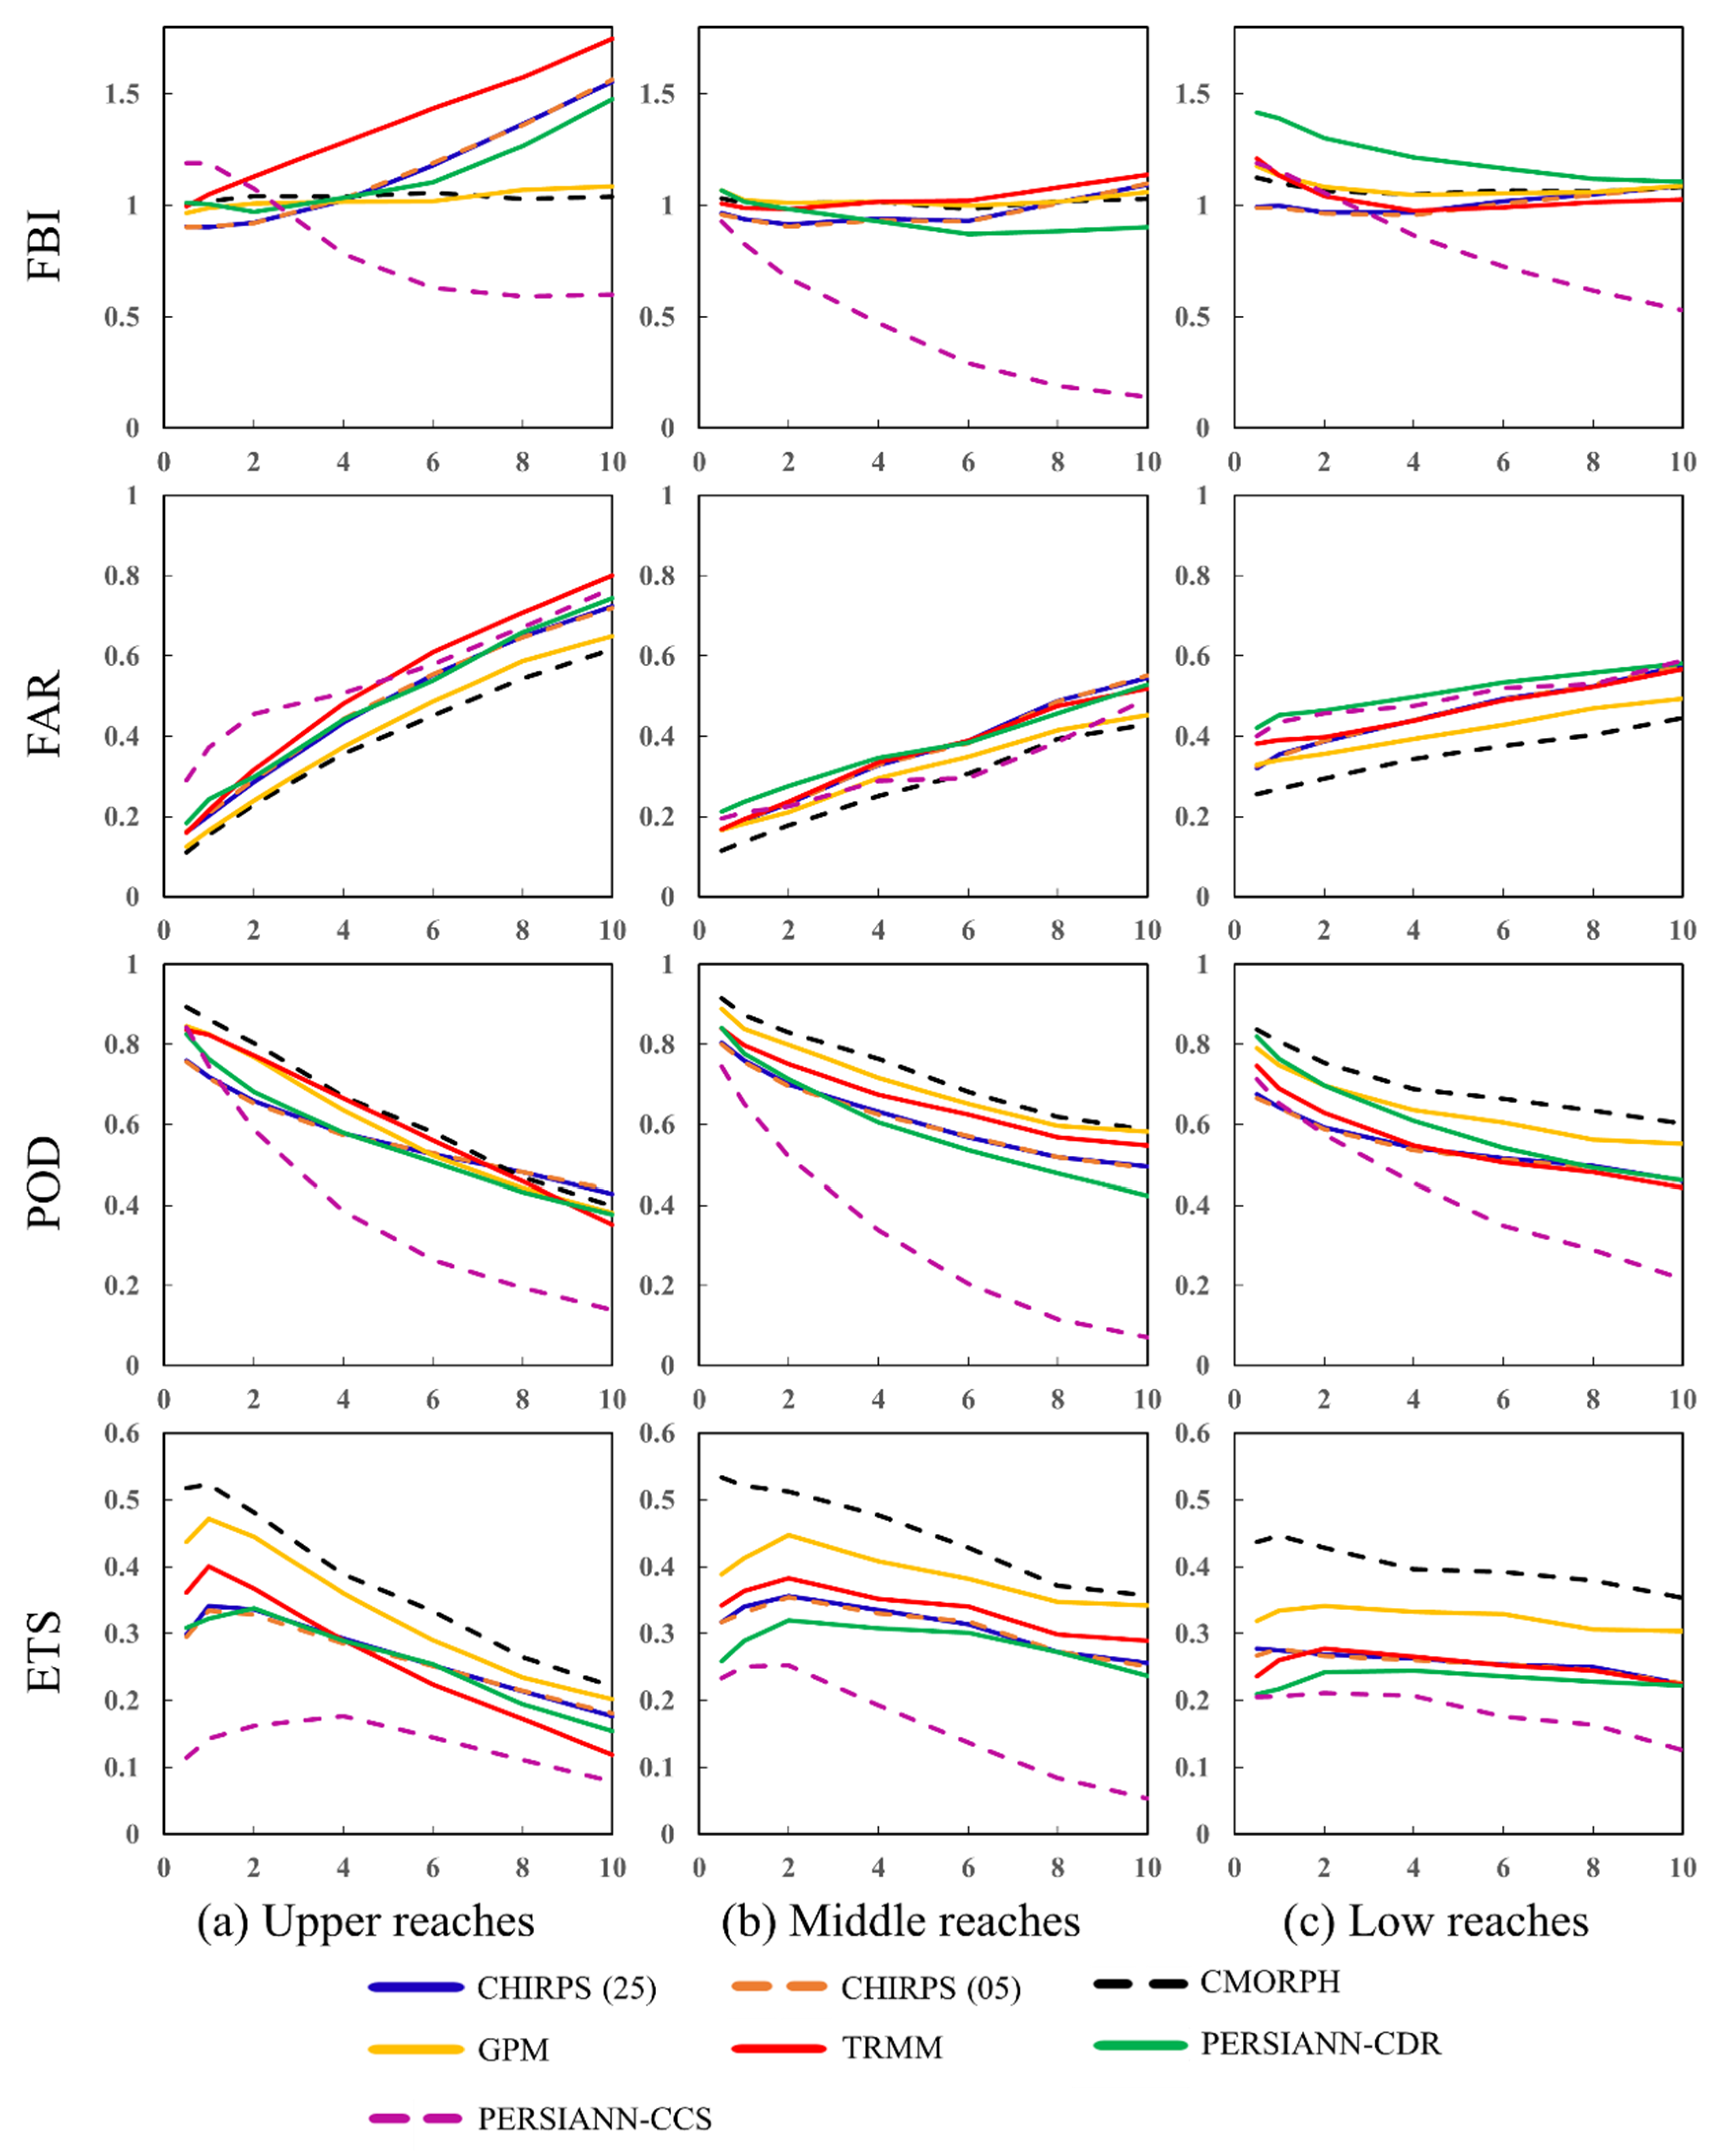
On the monthly scale, Figure 3 shows R, the centered RMSE, and standard deviation between the SPPs and rain gauge measurements using a Taylor diagram. The monthly precipitation was obtained by summing the daily precipitation of the month. Then, R, RMSE, and the standard deviation were calculated from all monthly precipitation observations and that of SPPs. The centered RMSE has the same statistical meaning as the RMSE, and its value ranges from 0 to 1; thus, it is more convenient to display this measure in a Taylor diagram. In this diagram, the closer the centered RMSE value to the observation point (the black point), the better the SPP performance. Thus, the order of accuracy for SPPs exhibited very similar performances for the upper, middle, and lower reaches. Among them, GPM IMERG and CMORPH had good performance, CHIRPS (05) and CHIRPS (25) exhibited intermediate performance, but TRMM, PERSIANN-CDR, and PERSIANN-CCS performed poorly. In terms of the overall SPP accuracy for the three sub-watersheds on the monthly scale, the best performance was achieved for the upper reach, followed by the middle and lower reaches.

4.1.3. Daily Scale

Figure 4 shows the FBI, POD, ETS, and FAR values on the daily scale over the upper, middle, and lower reaches, with storm thresholds from 0.5 to 10 mm. Typically, a threshold of 0.5 or 1 mm determines the performance, but we also took into account the slope of the decline curve. According to the four indexes at the different thresholds, all SPPs did not perform well in capturing different amounts of precipitation; thus, there was a larger error between the SPPs and observations on the daily scale than on the annual and monthly scales. When the threshold was 0.5 mm, according to the four indexes, all SPPs performed relatively well over the upper, middle, and lower reaches. When the thresholds increased, however, the SPP performance degraded, which means that the SPPs struggled to accurately capture heavy precipitation on the daily scale. In general, CMORPH and GPM IMERG had superior performance to the other SPPs for all YRB reaches. As shown in Figure 4, the overall accuracy order of the SPPs in the three sub-watersheds from best to worst was middle to lower to upper reach.
In general, CMORPH performed relatively well among the seven SPPs on the daily and annual scales, while GPM IMERG performed relatively well on the monthly scale. GPM IMERG is climatologically calibrated to the Global Precipitation Climatology Project (GPCP) monthly precipitation, which has been calibrated with ground observation data. Meanwhile, CMORPH is calibrated with daily gauge observations. This partly explains that the accuracies of GPM IMERG and CMORPH were relatively good compared to other SSPs at different timescales in station scale (Figure A1 and Figure A2). The SPPs had higher accuracy on the annual and monthly scales than on the daily scale. This finding is similar to the conclusions of other scholars regarding SPP accuracy on different time scales [40,41]. In terms of the spatial heterogeneity of SPP accuracy over the YRB, most SPPs exhibited large errors in the mountainous areas of the upper reach and in the coastal areas of the lower reach. In contrast, the SPPs exhibited good accuracy in the plains area of the middle reach. Several studies have drawn similar conclusions and provided explanations [42,43,44]. That is, the low SPP accuracy in mountainous areas mainly is due to the high altitude, while that in the estuaries and coastal areas is mainly caused by the air–sea interactions and coastal geometry [45]. Overall, topography has a complex influence on SPP accuracy, and this mechanism requires further exploration [46]. As for the spatial heterogeneity of SPP accuracy over the YRB on different time scales, the comparisons showed a greater consistency between ground values and satellite values obtained at greater time scales precisely because greater temporal aggregation scales usually correspond to less spatial variability. For the case considered in this study, only CMORPH and GPM IMERG exhibited superior performance to the other SPPs for the mountainous areas of the upper reach on the different time scales. This finding is also consistent with previous conclusions that GPM IMERG and CMORPH have an improved inversion precipitation algorithm for mountainous areas [47,48,49]. Notably, no SSP exhibited superior performance on different time scales throughout the YRB; thus, it is necessary to comprehensively consider geographical location and time scale when applying SPPs.

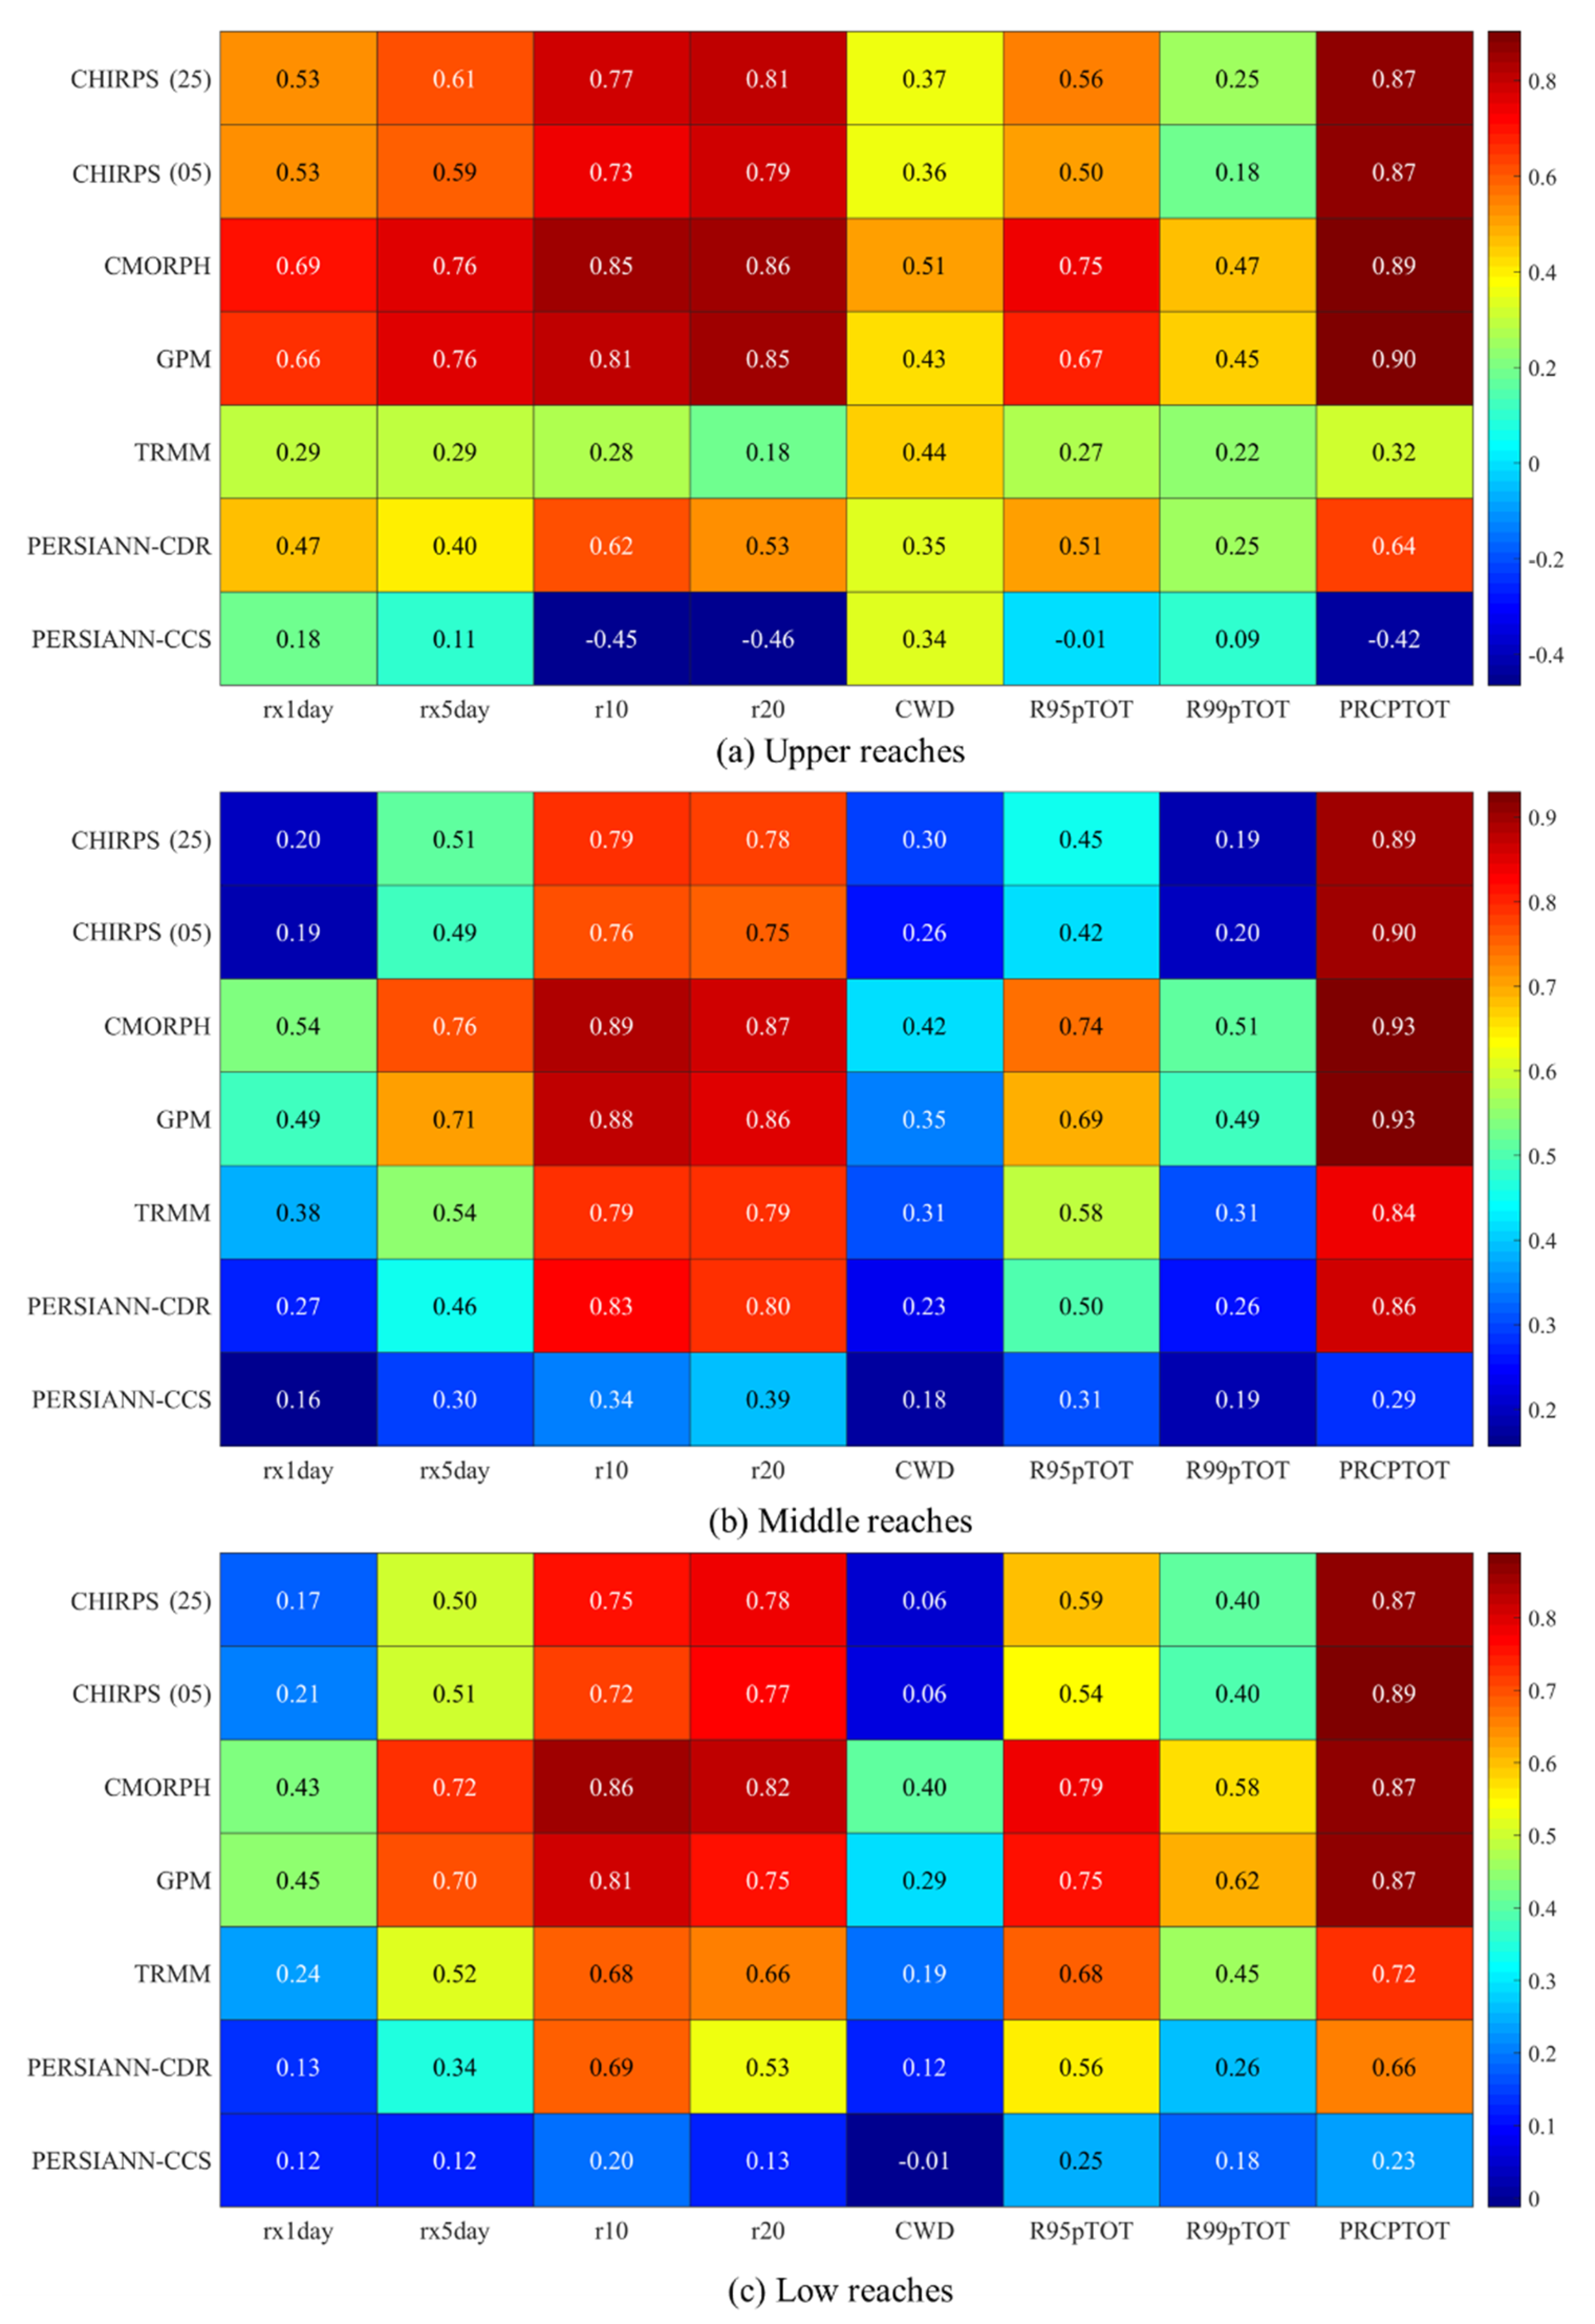
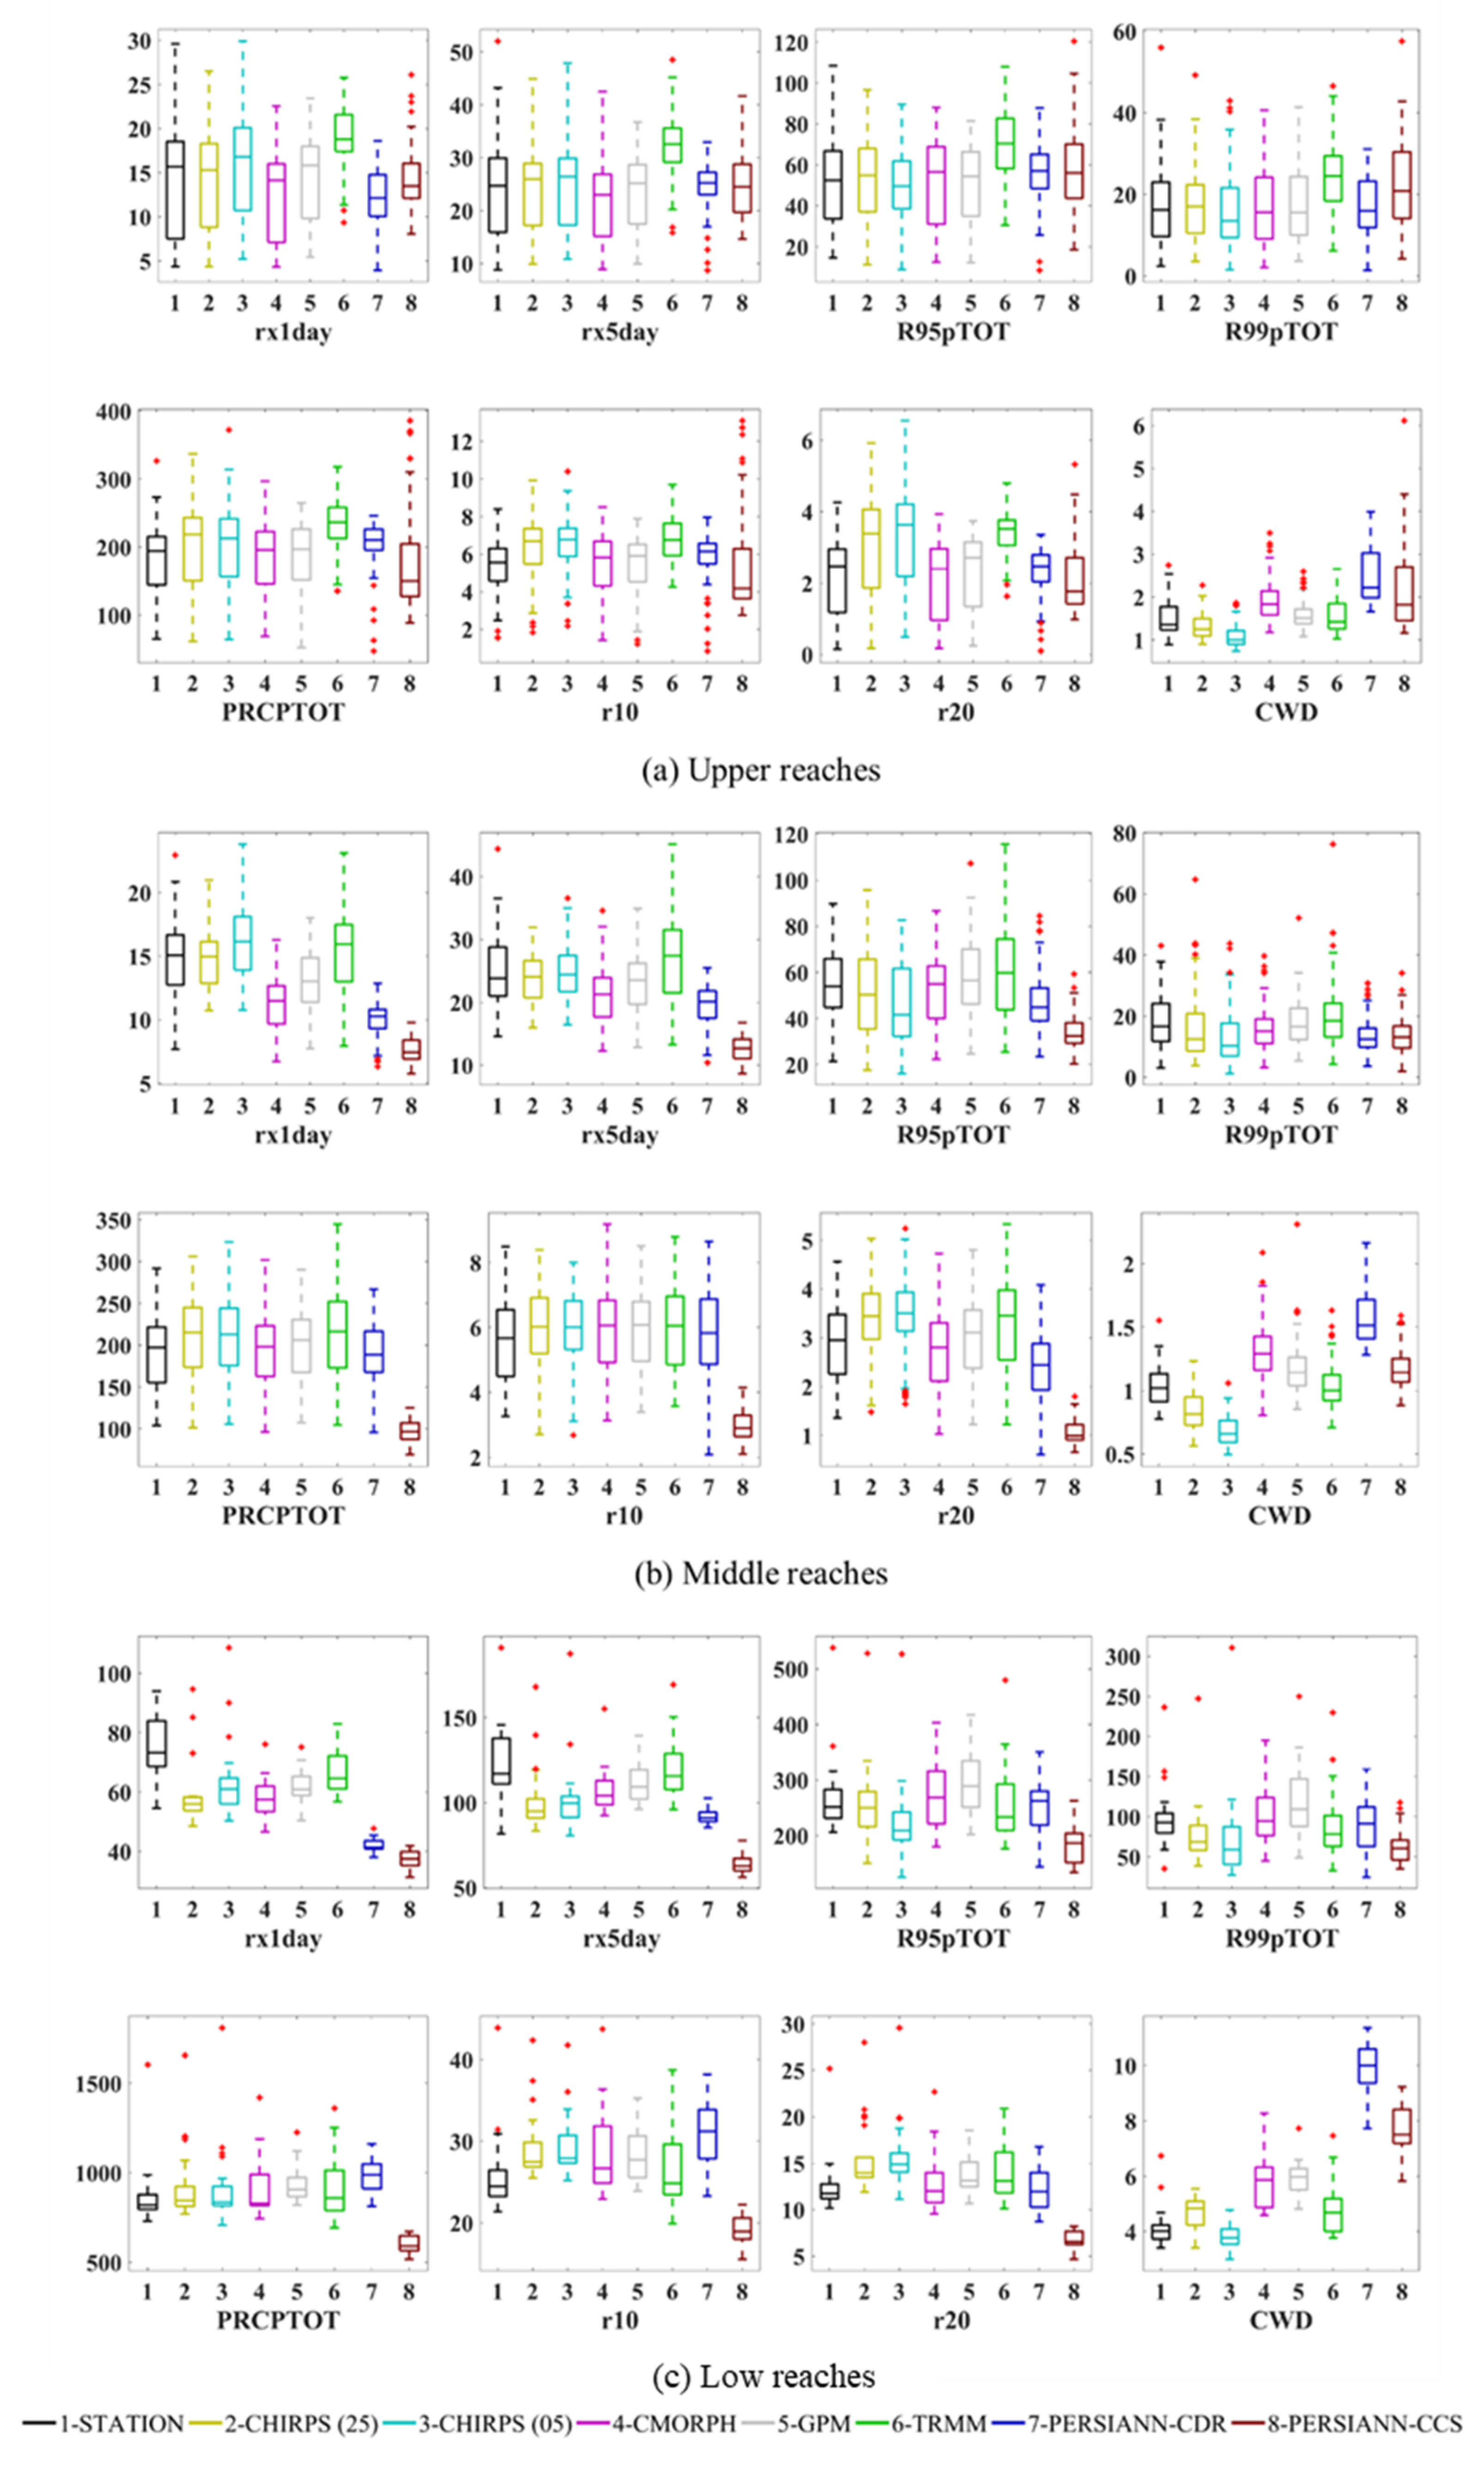
4.2. Accuracy of Extreme Precipitation Description

Figure 5 shows the R values between the extreme precipitation indexes obtained from the SPPs and rain gauge measurements. Higher R values were obtained for the CMORPH and GPM IMERG data with the rain gauge measurements, indicating relatively good performance of these SPPs in the three sub-watershed regions of the YRB. As regards the extreme precipitation frequency, all SPPs exhibited superior performance for r10 and r20 than for CWD across the YRB. Note that satellites are less capable of capturing continuous precipitation days compared to extreme precipitation days. As regards the extreme precipitation intensity across the YRB, the SPPs only exhibited good performance for PRCPTOT. This indicates that the SPPs have good ability to capture the extreme precipitation index of the total annual precipitation, but did not perform well as regards the daily-scale extreme precipitation indexes. This is consistent with the SPP accuracy assessments on the annual, monthly, and daily scales reported above. As regards the correlation coefficients for the extreme precipitation indexes on the watershed scale, the SPPs had superior performance in the upper reaches compared to the middle and lower reaches.
To further illustrate the differences in the extreme precipitation indexes over the three sub-watersheds, multi-year averages of the extreme precipitation indexes for each site were calculated. Box plots were used to analyze the distributions of the site-based extreme precipitation indexes over the three sub-basins. As shown in Figure 6, the mean values of each extreme precipitation index for the upper and middle reaches, calculated according to the measured site, were essentially the same. However, the average value of each extreme precipitation index in the lower reach was significantly greater than those in the upper and middle reaches, indicating that the extreme precipitation frequency and intensity in the lower reach were significantly higher than those in the upper and middle reaches.
Next, we focused on the differences in the extreme precipitation indexes between the observations and SPPs for each sub-watershed. We found that the extreme precipitation indexes for GPM IMERG had similar distributions to those of the reference data in the upper and middle reaches. However, the differences in the extreme precipitation index distributions between the SPPs and the reference data clearly varied among the seven SPPs in low reaches. Compared to their monitoring performance for extreme precipitation in the upper and middle reaches, the SPPs had low accuracy in the lower reaches. This is similar to the results of Fang et al. [22], who also found a larger error in the Yangtze River estuary area.

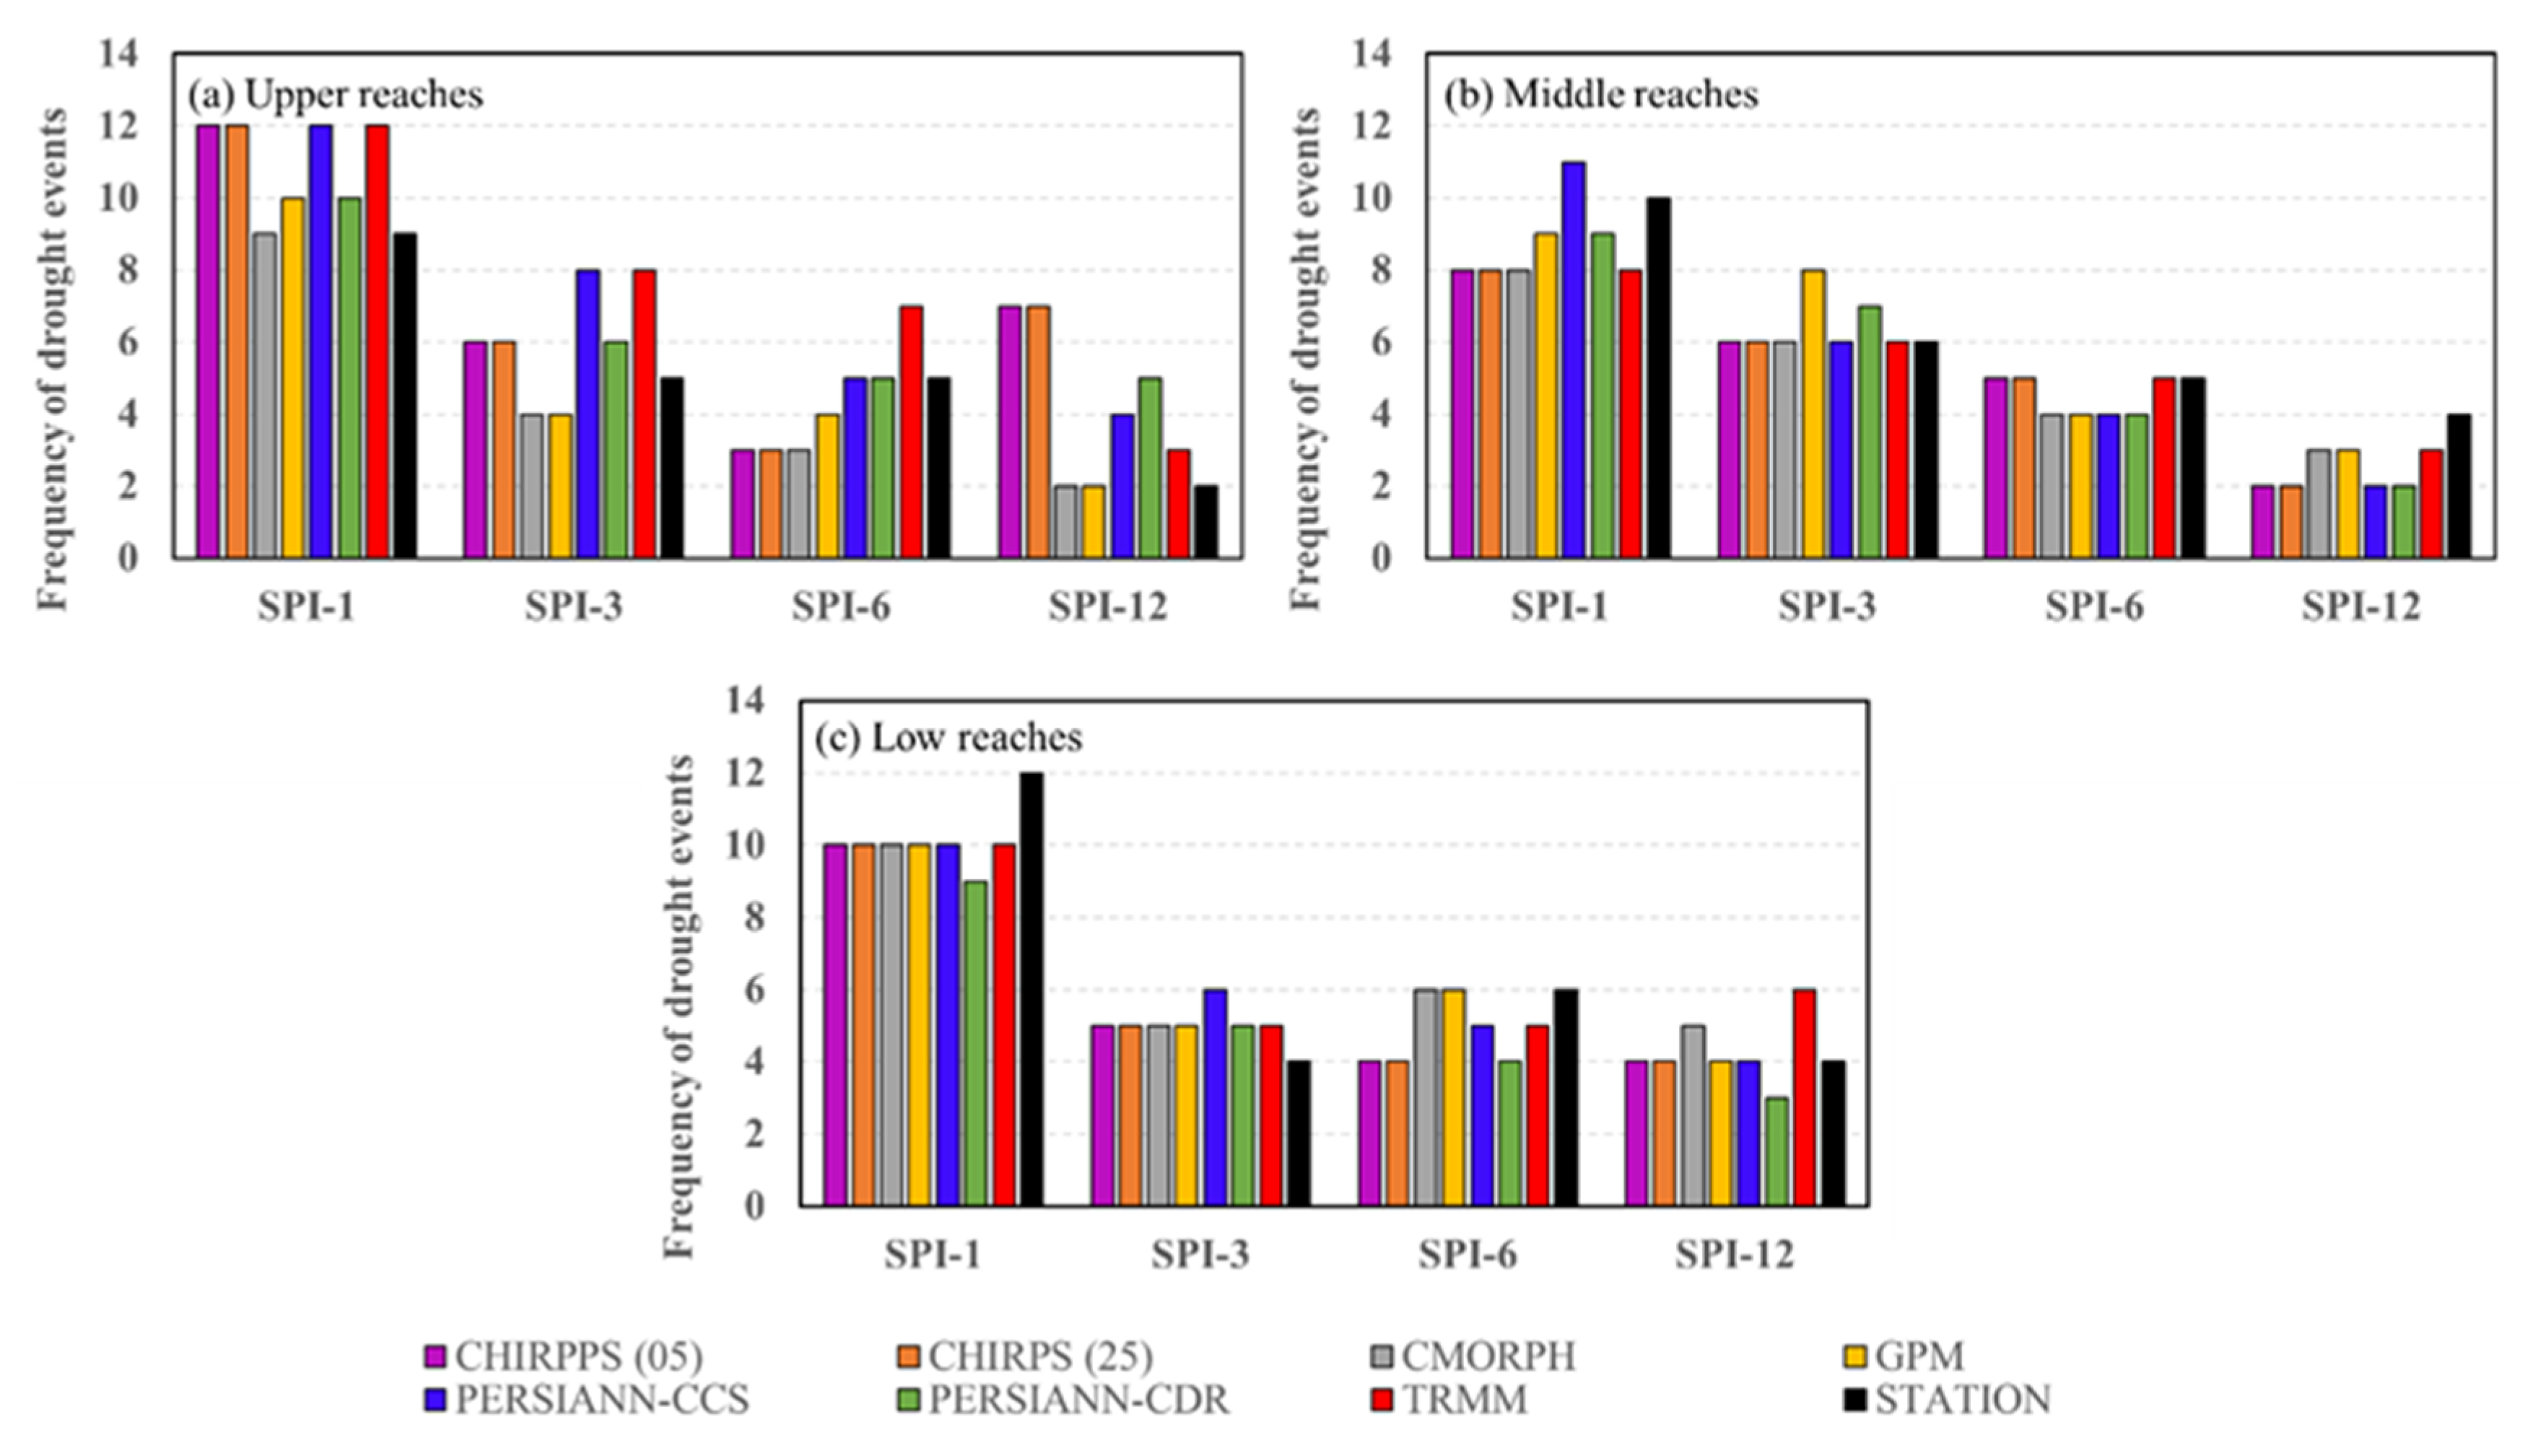
4.3. Drought Event Monitoring Accuracy

Drought is a regional ECE; therefore, we focused on droughts on the watershed scale when analyzing the corresponding SPP performance. The area rainfall was the average of the observations of all rain gauges in the sub-basin. To analyze the SPP ability to capture the temporal variability of drought, we compared the R values between the SPI scores obtained from the observations and SPPs on the watershed scale at different time scales.
As detailed in Table 6, when the time scale increased, the SPI R increased correspondingly; this is similar to previous research results [50]. In addition, the R values in the middle reach were higher than those in the upper and lower reaches. This means that the SPPs can better detect the drought process in the middle reaches. Note that TRMM and PERSIANN-CCS exhibited very poor performances on different time scales as regards this SPI; this is consistent with their performance on the monthly scale and, also, for extreme precipitation.
SPI–3 was selected as the only SPI index for evaluation of the drought process on multiple time scales. This index was selected because it reflects the drought on a seasonal scale [51], which is more in line with the characteristics of the monsoon climate in the YRB. In this case, GPM IMERG and CMORPH exhibited relatively good performances, with R values exceeding 0.9 for the upper, middle, and lower reaches. The R values for CHIRPS (25) and CHIRPS (05) for the middle and lower reaches exceeded 0.9, but were less than 0.9 in the upper reach. For the middle reach, the R value of PERSIANN-CDR exceeded 0.9; however, this value was less than 0.9 for the upper and low reaches. Therefore, GPM IMERG and CMORPH performed best as regards reproduction of the observation SPI–3 on the watershed scale. This means that the SPP accuracy on the monthly scale largely determines the ability to capture drought characteristics. This result is consistent with the findings concerning SPP performance for extreme precipitation monitoring.
Furthermore, to evaluate the SPP ability to capture drought events, the number of severe seasonal droughts indicated by both observation and SPP were counted, as reflected by the SPI–3 values for the upper, middle, and lower reaches. As shown in Figure 7, in the upper reach, all SPPs failed to accurately capture the number of severe droughts. CMORPH and GPM IMERG underestimated this number, while the other SPPs overestimated it. In the middle reach, none of the SPPs accurately captured the number of severe droughts. PERSIANN-CCS overestimated this value, whereas the remaining SPPs underestimated this number. In the lower reach, all SPPs overestimated the number of severe droughts. Therefore, in terms of the overall SPP performance in capturing drought events on the watershed scale, the SPPs performed best in the middle reach, which is consistent with the R-based results. As regards the SPI time scale variability, the drought events decreased in accordance with increasing SPI time scale; this is also similar to previous research results [50].
To evaluate the spatial differences in the SPP ability to capture drought, the R values between the SPI time series given by the meteorological stations and SPPs were used as evaluation indexes. The spatial distributions of the R on SPI–3 are presented in Figure 8. Here, CHIRPS (25) and CHIRPS (05) exhibited similar performances, with the former being slightly superior. The R values for the middle and lower reaches exceeded 0.6, but the values for most stations in the upper reach were in the range of 0.0–0.7. For CMORPH, the R values for the middle and lower reaches exceeded 0.7, but for the upper reach this value varied widely from 0.5 to 0.9. For GPM IMERG, the R values for the middle and lower reaches exceeded 0.7, and the R values for most stations in the upper reach were between 0.6 and 0.8. For TRMM, correlation coefficients outside the range of 0.6–0.8 were only obtained for the southern stations in the middle reach, with most stations in other regions having R values of less than 0.6. For PERSIANN-CDR, for the middle and lower reaches, the R values between the SPPs and stations were between 0.6 and 0.8. In the upper reach, however, the R values obtained for most stations were between 0.5 and 0.6. For PERSIANN-CCS, the R values obtained for most stations were less than 0.5 across the entire river basin. Therefore, as regards the spatial distribution of the R values between the SPPs and stations, the overall R values over the middle and lower reaches were superior to those of the upper reach. The best-performing SPPs as regards drought monitoring were CMORPH and GPM IMERG; this finding is similar to the finding regarding their extreme precipitation accuracy.

5. Conclusions

This study evaluated seven SPPs over the YRB in China through comparison with data from 198 rain gauges, focusing on their capability of capturing extreme events and the spatial heterogeneity of their performance. ECE indexes were also used to assess the ability of SPPs to capture the characteristics of ECEs. The major conclusions are summarized as follows.
(1)
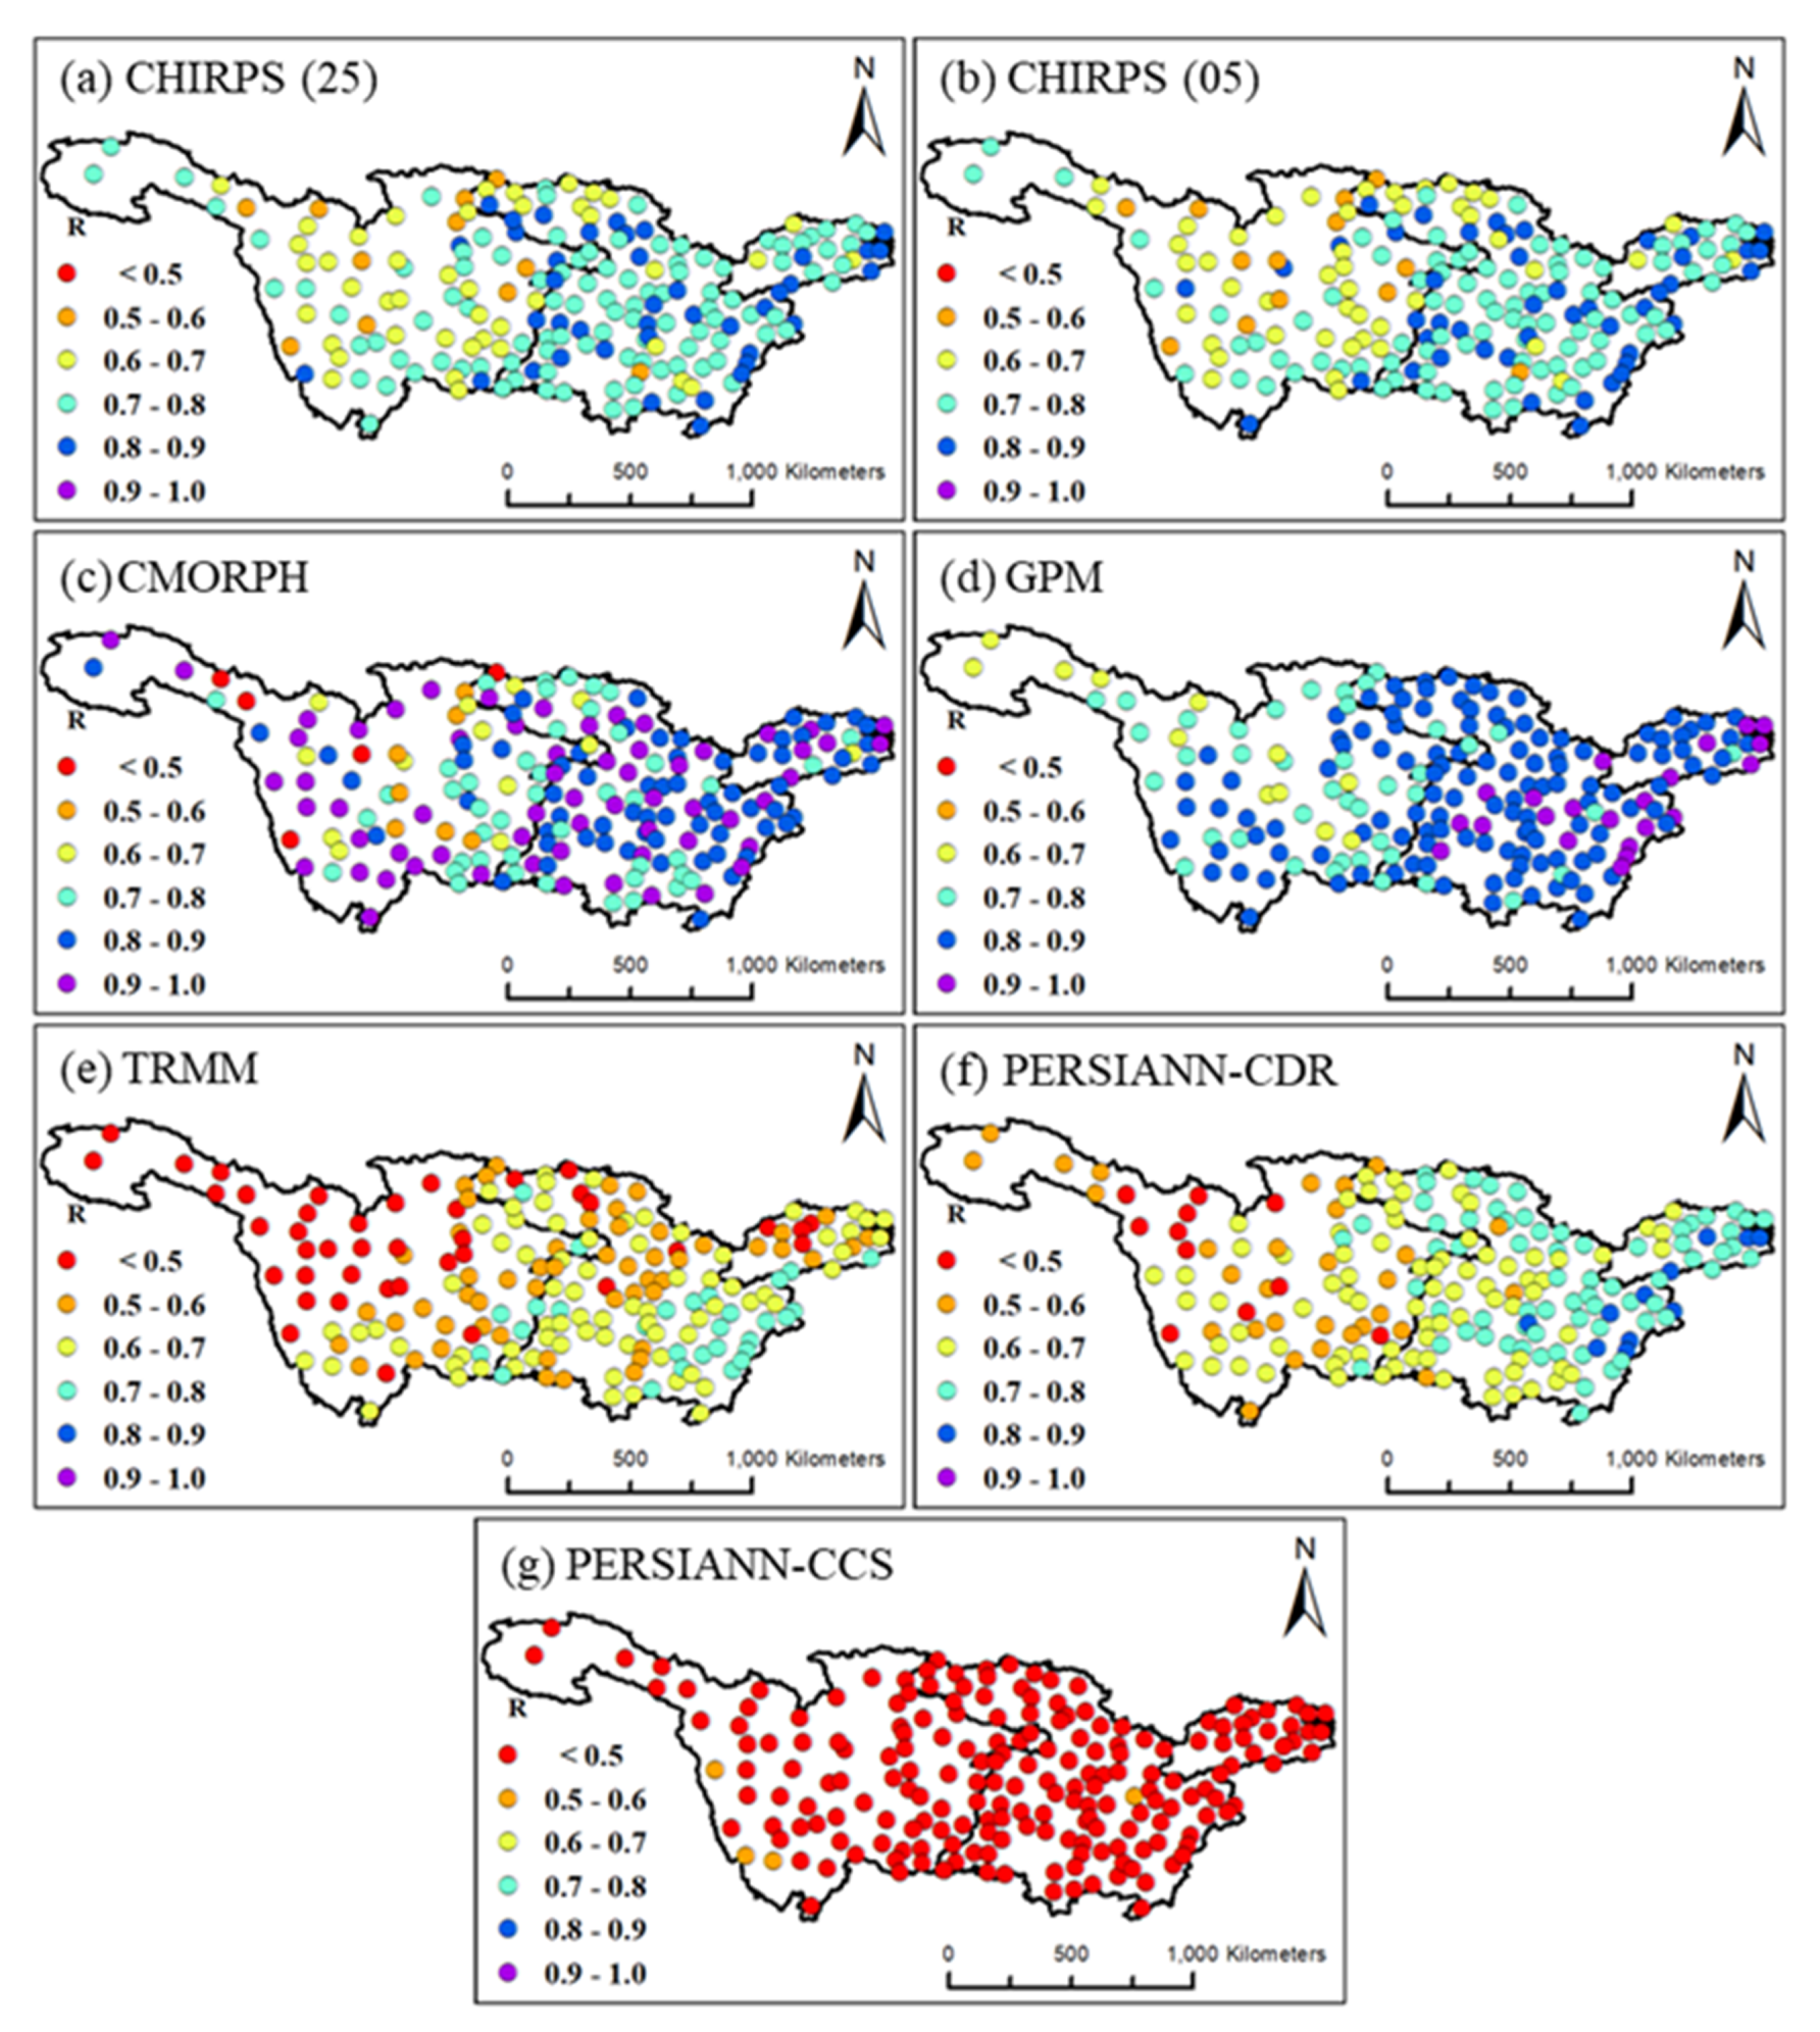
The SPPs have higher accuracy on the annual and monthly scales than on the daily scale. Among the seven SPPs, CMORPH performs relatively well on the daily and annual scales, whereas GPM IMERG performs relatively well on the monthly scale. In general, the SPPS have lower accuracy for monitoring of the mountainous areas in the upper reach and the estuary and coastal areas in the lower reach compared to the plains areas in the middle reach.
(2)
In response to extreme precipitation, GPM IMERG and CMORPH perform better in the upper, middle, and lower reaches, which is consistent with their accuracy on the daily scale. Higher errors were noted for extreme precipitation monitoring in the lower reach, for both intensity and frequency and compared to the results for the upper and middle reaches. Therefore, the SPPs can less effectively capture the characteristics of extreme precipitation in the lower reach compared to the upper and middle reaches.
(3)
As regards drought monitoring, the best-performing SPP varies for the upper, middle, and lower reaches. That is, GPM IMERG performs best in the upper reach, whereas CMORPH performs best for the middle and lower reaches; this finding is consistent with the accuracies of these SPPs on the monthly scale. As regards the overall performance of the SPPs in capturing drought characteristics at the three sub-watersheds, the SPPs exhibit inferior performance for the upper reach compared to the middle and lower reaches.
(4)
The SPP accuracy largely determines the extreme precipitation and drought monitoring performance. Meanwhile, the ability of a given SPP to capture extreme precipitation characteristics is consistent with its ability to capture drought characteristics. Therefore, more studies are necessary to verify the impact of mountainous and coastal areas on ECE monitoring.
According to the conclusions of this article, complex terrain and coastal areas have an impact on the ability of satellite precipitation to capture ECEs. Therefore, more studies are still needed to reveal the impact mechanism of them in capturing ECEs and to propose relative improvement measures.

Author Contributions

S.X. analyzed the data and prepared the draft of the manuscript. J.X. provided the analysis methodology. L.Z. conceived of this study, gave comments, and revised the manuscript. All authors have read and agreed to the published version of the manuscript.

Funding

This study was supported by the National Natural Science Foundation of China (41890822) and the Strategic Priority Research Program of the Chinese Academy of Sciences (Grant No. XDA23040304).

Acknowledgments

The authors’ great gratitude is extended to the China Meteorological Administration for providing ground-based precipitation data and all suppliers of satellite precipitation products. Thanks for the constructive comments from the two anonymous reviewers.

Conflicts of Interest

The authors declare no conflicts of interest.

Appendix A

Figure A1. The spatial distribution of the R, RMSE, and Bias of SPPs on the monthly scale.
Water 12 01179 g0a1
Figure A2. The spatial distribution of the R, RMSE, and Bias of SPPs on the annual scale.
Water 12 01179 g0a2

References

  1. Seneviratne, S.I.; Nicholls, N.; Easterling, D.; Goodess, C.M.; Zhang, X. Changes in climate extremes and their impacts on the natural physical environment: An overview of the IPCC SREX report. EGU General Assembly Conference Abstracts. In Managing the Risks of Extreme Events and Disasters to Advance Climate Change Adaptation (SREX); Cambridge University Press: Cambridge, UK; New York, NY, USA, 2012. [Google Scholar]
  2. Gao, L.P.; Tao, B.; Miao, Y.X.; Zhang, L.H.; Song, X.; Ren, W.; He, L.Y.; Xu, X.F. A Global Data Set for Economic Losses of Extreme Hydrological Events During 1960–2014. Water Resour. Res. 2019, 55, 5165–5175. [Google Scholar] [CrossRef]
  3. Diffenbaugh, N.S.; Singh, D.; Mankin, J.S.; Horton, D.E.; Swain, D.L.; Touma, D.; Charland, A.; Liu, Y.J.; Haugen, M.; Tsiang, M.; et al. Quantifying the influence of global warming on unprecedented extreme climate events. Proc. Natl. Acad. Sci. USA 2017, 114, 4881–4886. [Google Scholar] [CrossRef] [PubMed] [Green Version]
  4. Stocker, T. Climate Change 2013: The Physical Science Basis: Working Group I Contribution to the Fifth Assessment Report of the Intergovernmental Panel on Climate Change; Cambridge University Press: Cambridge, UK, 2014. [Google Scholar]
  5. Hirabayashi, Y.; Mahendran, R.; Koirala, S.; Konoshima, L.; Yamazaki, D.; Watanabe, S.; Kim, H.; Kanae, S. Global flood risk under climate change. Nat. Clim. Chang. 2013, 3, 816–821. [Google Scholar] [CrossRef]
  6. Soltani, M.; Laux, P.; Kunstmann, H.; Stan, K.; Sohrabi, M.M.; Molanejad, M.; Sabziparvar, A.A.; SaadatAbadi, A.R.; Ranjbar, F.; Rousta, I.; et al. Assessment of climate variations in temperature and precipitation extreme events over Iran. Theor. Appl. Climatol. 2016, 126, 775–795. [Google Scholar] [CrossRef] [Green Version]
  7. Ren, Z.G.; Zhang, M.J.; Wang, S.J.; Qiang, F.; Zhu, X.F.; Dong, L. Changes in daily extreme precipitation events in South China from 1961 to 2011. J. Geogr. Sci. 2015, 25, 58–68. [Google Scholar] [CrossRef]
  8. Buttafuoco, G.; Caloiero, T.; Coscarelli, R. Analyses of Drought Events in Calabria (Southern Italy) Using Standardized Precipitation Index. Water Resour. Manag. 2015, 29, 557–573. [Google Scholar] [CrossRef]
  9. Michaelides, S.; Levizzani, V.; Anagnostou, E.; Bauer, P.; Kasparis, T.; Lane, J.J.A.R. Precipitation: Measurement, remote sensing, climatology and modeling. Atmos. Res. 2009, 94, 512–533. [Google Scholar] [CrossRef]
  10. Jongjin, B.; Jongmin, P.; Dongryeol, R.; Minha, C.J.H.P. Geospatial blending to improve spatial mapping of precipitation with high spatial resolution by merging satellite-based and ground-based data. Hydrol. Process. 2016, 30, 2789–2803. [Google Scholar] [CrossRef]
  11. Sun, Q.H.; Miao, C.Y.; Duan, Q.Y.; Ashouri, H.; Sorooshian, S.; Hsu, K.L. A Review of Global Precipitation Data Sets: Data Sources, Estimation, and Intercomparisons. Rev. Geophys. 2018, 56, 79–107. [Google Scholar] [CrossRef] [Green Version]
  12. Habib, E.; Haile, A.T.; Tian, Y.; Joyce, R.J. Evaluation of the High-Resolution CMORPH Satellite Rainfall Product Using Dense Rain Gauge Observations and Radar-Based Estimates. J. Hydrometeorol. 2012, 13, 1784–1798. [Google Scholar] [CrossRef]
  13. Joyce, R.J.; Janowiak, J.E.; Arkin, P.A.; Xie, P.P. CMORPH: A method that produces global precipitation estimates from passive microwave and infrared data at high spatial and temporal resolution. J. Hydrometeorol. 2004, 5, 487–503. [Google Scholar] [CrossRef]
  14. Huffman, G.J.; Adler, R.F.; Bolvin, D.T.; Gu, G.J.; Nelkin, E.J.; Bowman, K.P.; Hong, Y.; Stocker, E.F.; Wolff, D.B. The TRMM multisatellite precipitation analysis (TMPA): Quasi-global, multiyear, combined-sensor precipitation estimates at fine scales. J. Hydrometeorol. 2007, 8, 38–55. [Google Scholar] [CrossRef]
  15. Hou, A.Y.; Kakar, R.K.; Neeck, S.; Azarbarzin, A.A.; Kummerow, C.D.; Kojima, M.; Oki, R.; Nakamura, K.; Iguchi, T. The Global Precipitation Measurement Mission. Bullet. Am. Meteorol. Soc. 2014, 95, 701. [Google Scholar] [CrossRef]
  16. Hong, Y.; Gochis, D.; Cheng, J.T.; Hsu, K.L.; Sorooshian, S. Evaluation of PERSIANN-CCS rainfall measurement using the NAME Event Rain Gauge Network. J. Hydrometeorol. 2007, 8, 469–482. [Google Scholar] [CrossRef] [Green Version]
  17. Ashouri, H.; Hsu, K.-L.; Sorooshian, S.; Braithwaite, D.K.; Knapp, K.R.; Cecil, L.D.; Nelson, B.R.; Prat, O.P. PERSIANN-CDR: Daily precipitation climate data record from multisatellite observations for hydrological and climate studies. Bullet. Am. Meteorol. Soc. 2015, 96, 69–83. [Google Scholar] [CrossRef] [Green Version]
  18. Funk, C.; Peterson, P.; Landsfeld, M.; Pedreros, D.; Verdin, J.; Shukla, S.; Husak, G.; Rowland, J.; Harrison, L.; Hoell, A.; et al. The climate hazards infrared precipitation with stations-a new environmental record for monitoring extremes. Sci. Data 2015, 2, 150066. [Google Scholar] [CrossRef] [Green Version]
  19. Bell, J.L.; Sloan, L.C.; Snyder, M.A. Regional Changes in Extreme Climatic Events: A Future Climate Scenario. J. Clim. 2004, 17, 81–87. [Google Scholar] [CrossRef]
  20. Wilhite, D.A. Drought as a natural hazard: Concepts and definitions. Drought A Glob. Assess. 2000, 1, 3–18. [Google Scholar]
  21. She, D.; Shao, Q.; Xia, J.; Taylor, J.A.; Zhang, Y.; Zhang, L.; Zhang, X.; Zou, L. Investigating the variation and non-stationarity in precipitation extremes based on the concept of event-based extreme precipitation. J. Hydrol. 2015, 530, 785–798. [Google Scholar] [CrossRef]
  22. Fang, J.; Yang, W.T.; Luan, Y.B.; Du, J.; Lin, A.W.; Zhao, L. Evaluation of the TRMM 3B42 and GPM IMERG products for extreme precipitation analysis over China. Atmos. Res. 2019, 223, 24–38. [Google Scholar] [CrossRef]
  23. Stampoulis, D.; Anagnostou, E.N.; Nikolopoulos, E.I. Assessment of High-Resolution Satellite-Based Rainfall Estimates over the Mediterranean during Heavy Precipitation Events. J. Hydrometeorol. 2013, 14, 1500–1514. [Google Scholar] [CrossRef]
  24. Mayor, Y.G.; Tereshchenko, I.; Fonseca-Hernandez, M.; Pantoja, D.A.; Montes, J.M. Evaluation of Error in IMERG Precipitation Estimates under Different Topographic Conditions and Temporal Scales over Mexico. Remote Sens. 2017, 9, 503. [Google Scholar] [CrossRef] [Green Version]
  25. Zhu, Q.; Luo, Y.L.; Zhou, D.Y.; Xu, Y.P.; Wang, G.Q.; Gao, H.Y. Drought Monitoring Utility using Satellite-Based Precipitation Products over the Xiang River Basin in China. Remote Sens. 2019, 11, 1483. [Google Scholar] [CrossRef] [Green Version]
  26. Gemmer, M.; Jiang, T.; Su, B.; Kundzewicz, Z.W. Seasonal precipitation changes in the wet season and their influence on flood/drought hazards in the Yangtze River Basin, China. Quat. Int. 2008, 186, 12–21. [Google Scholar] [CrossRef]
  27. Jiang, X.W.; Li, Y.Q.; Wang, X. Water vapor transport over China and its relationship with drought and flood in Yangtze River Basin. J. Geogr. Sci. 2009, 19, 153–163. [Google Scholar] [CrossRef]
  28. Wilks, D.S. Statistical Methods in the Atmospheric Sciences; Academic press: Cambridge, MA, USA, 2011; Volume 100. [Google Scholar]
  29. Su, F.G.; Hong, Y.; Lettenmaier, D.P. Evaluation of TRMM Multisatellite Precipitation Analysis (TMPA) and its utility in hydrologic prediction in the La Plata Basin. J. Hydrometeorol. 2008, 9, 622–640. [Google Scholar] [CrossRef] [Green Version]
  30. Shrestha, D.; Singh, P.; Nakamura, K. Spatiotemporal variation of rainfall over the central Himalayan region revealed by TRMM Precipitation Radar. J. Geophys Res.-Atmos. 2012, 117, 22106. [Google Scholar] [CrossRef] [Green Version]
  31. Zhang, X.B.; Alexander, L.; Hegerl, G.C.; Jones, P.; Tank, A.K.; Peterson, T.C.; Trewin, B.; Zwiers, F.W. Indices for monitoring changes in extremes based on daily temperature and precipitation data. Wires Clim. Chang. 2011, 2, 851–870. [Google Scholar] [CrossRef]
  32. Peterson, T.; Folland, C.; Gruza, G.; Hogg, W.; Mokssit, A.; Plummer, N. Report on the Activities of the Working Group on Climate Change Detection and Related Rapporteurs; World Meteorological Organization Geneva: Geneva, Swizerland, 2001. [Google Scholar]
  33. Zhang, Q.; Singh, V.P.; Li, J.F.; Jiang, F.Q.; Bai, Y.G. Spatio-temporal variations of precipitation extremes in Xinjiang, China. J. Hydrol. 2012, 434, 7–18. [Google Scholar] [CrossRef]
  34. Sen Roy, S.; Balling, R.C. Trends in extreme daily precipitation indices in India. Int. J. Climatol. 2004, 24, 457–466. [Google Scholar] [CrossRef]
  35. McKee, T.B. Drought monitoring with multiple time scales. In Proceedings of the 9th Conference on Applied Climatology, Dallas, TX, USA, 15–20 January 1995. [Google Scholar]
  36. McKee, T.B.; Doesken, N.J.; Kleist, J. The relationship of drought frequency and duration to time scales. In Proceedings of the 8th Conference on Applied Climatology, Anaheim, CA, USA, 17–22 January 1993; pp. 179–184. [Google Scholar]
  37. Hayes, M.J.; Svoboda, M.D.; Wiihite, D.A.; Vanyarkho, O.V. Monitoring the 1996 drought using the standardized precipitation index. Bullet. Am. Meteorol. Soc. 1999, 80, 429–438. [Google Scholar] [CrossRef] [Green Version]
  38. Li, R.; Shi, J.; Ji, D.; Zhao, T.; Plermkamon, V.; Moukomla, S.; Kuntiyawichai, K.; Kruasilp, J. Evaluation and Hydrological Application of TRMM and GPM Precipitation Products in a Tropical Monsoon Basin of Thailand. Water 2019, 11, 818. [Google Scholar] [CrossRef] [Green Version]
  39. Zeng, H.; Li, L.; Li, J. The evaluation of TRMM Multisatellite Precipitation Analysis (TMPA) in drought monitoring in the Lancang River Basin. J. Geogr. Sci. 2012, 22, 273–282. [Google Scholar] [CrossRef] [Green Version]
  40. Sharifi, E.; Steinacker, R.; Saghafian, B. Assessment of GPM-IMERG and Other Precipitation Products against Gauge Data under Different Topographic and Climatic Conditions in Iran: Preliminary Results. Remote Sens. 2016, 8, 135. [Google Scholar] [CrossRef] [Green Version]
  41. Tian, Y.; Peters-Lidard, C.D.; Choudhury, B.J.; Garcia, M. Multitemporal analysis of TRMM-based satellite precipitation products for land data assimilation applications. J. Hydrometeorol. 2007, 8, 1165–1183. [Google Scholar] [CrossRef]
  42. Hu, Q.; Yang, D.; Wang, Y.; Yang, H.J.S.C.T.S. Accuracy and spatio-temporal variation of high resolution satellite rainfall estimate over the Ganjiang River Basin. Sci. China Technol. Sci. 2013, 56, 853–865. [Google Scholar] [CrossRef]
  43. Liu, J.; Duan, Z.; Jiang, J.; Zhu, A.J.A.i.M. Evaluation of three satellite precipitation products TRMM 3B42, CMORPH, and PERSIANN over a subtropical watershed in China. Adv. Meteorol. 2015, 2015, 151239. [Google Scholar] [CrossRef] [Green Version]
  44. Hirpa, F.A.; Gebremichael, M.; Hopson, T. Climatology. Evaluation of high-resolution satellite precipitation products over very complex terrain in Ethiopia. AMS 2010, 49, 1044–1051. [Google Scholar]
  45. West, T.K.; Steenburgh, W.J.; Mace, G.G. Characteristics of Sea-Effect Clouds and Precipitation Over the Sea of Japan Region as Observed by A-Train Satellites. JGR Atmos. 2019, 124, 1322–1335. [Google Scholar] [CrossRef]
  46. Liu, J.; Xia, J.; She, D.X.; Li, L.C.; Wang, Q.; Zou, L. Evaluation of Six Satellite-Based Precipitation Products and Their Ability for Capturing Characteristics of Extreme Precipitation Events over a Climate Transition Area in China. Remote Sens. 2019, 11, 1477. [Google Scholar] [CrossRef] [Green Version]
  47. Chen, C.; Chen, Q.W.; Duan, Z.; Zhang, J.Y.; Mo, K.L.; Li, Z.; Tang, G.Q. Multiscale Comparative Evaluation of the GPM IMERG v5 and TRMM 3B42 v7 Precipitation Products from 2015 to 2017 over a Climate Transition Area of China. Remote Sens. 2018, 10, 944. [Google Scholar] [CrossRef] [Green Version]
  48. Tan, M.L.; Duan, Z. Assessment of GPM and TRMM Precipitation Products over Singapore. Remote Sens. 2017, 9, 720. [Google Scholar] [CrossRef] [Green Version]
  49. Tang, G.Q.; Ma, Y.Z.; Long, D.; Zhong, L.Z.; Hong, Y. Evaluation of GPM Day-1 IMERG and TMPA Version-7 legacy products over Mainland China at multiple spatiotemporal scales. J. Hydrol. 2016, 533, 152–167. [Google Scholar] [CrossRef]
  50. Zhao, L.; Wu, J.J.; Fang, J. Robust Response of Streamflow Drought to Different Timescales of Meteorological Drought in Xiangjiang River Basin of China. Adv. Meteorol. 2016, 2016, 1634787. [Google Scholar] [CrossRef] [Green Version]
  51. Ji, L.; Peters, A.J. Assessing vegetation response to drought in the northern Great Plains using vegetation and drought indices. Remote Sens. Environ. 2003, 87, 85–98. [Google Scholar] [CrossRef]
Figure 1. The geographical location of the Yangtze River Basin and meteorological stations.
Water 12 01179 g001
Figure 2. Annual average precipitation derived from stations and SPPs for 2003–2017.
Water 12 01179 g002
Figure 3. Taylor diagrams for monthly precipitation given by stations and SPPs.
Water 12 01179 g003
Figure 4. Skill scores (FBI, POD, ETS, FAR) of seven SPPs for storm thresholds ranging from 0.5 to 10 mm.
Water 12 01179 g004
Figure 5. R values between eight extreme precipitation indexes obtained from SPPs and gauge observations.
Water 12 01179 g005
Figure 6. Comparisons of eight precipitation indexes obtained from SPPs with those from gauge observations.
Water 12 01179 g006
Figure 7. Drought event frequencies given by SPPs and observations.
Water 12 01179 g007
Figure 8. The spatial distributions of R values between the SPI–3 time series given by the meteorological stations and seven SPPs, respectively.
Water 12 01179 g008
Table 1. Basic information of seven satellite precipitation products.
DatasetSpatial ResolutionTemporal ResolutionCoverageTime Span
CHIRPS v2.0 (0.25)0.25° × 0.25°daily50° N–50° S1981 to present
CHIRPS v2.0 (0.05)0.05° × 0.05°daily50° N–50° S1981 to present
CMORPH0.25° × 0.25°daily60° N–60° S1998 to present
GPM IMERG V060.1° × 0.1°daily60° N–60° S2001 to present
TRMM-3B42V70.25° × 0.25°daily50° N–50° S2001 to 2018
PERSIANN-CDR0.25° × 0.25°daily60° N–60° S1983 to present
PERSIANN-CCS0.04° × 0.04°daily60° N–60° S2003 to present
Table 2. Summary of statistical and skill metrics.
IndexUnitFormulaBest Value
Bias% B i a s = i = 1 n ( S i G i ) i = 1 n ( G i ) 0
RNA R = i = 1 n ( G i G ¯ ) ( S i S ¯ ) i = 1 n ( G i G ¯ ) 2 × i = 1 n ( S i S ¯ ) 2 1
RMSEmm R M S E = 1 n i = 1 n ( S i G i ) 2 0
FBINA F B I = H + F H + M 1
PODNA P O D = H H + M 1
FARNA F A R = F H + F 0
ETSNA E T S = H H e H + M + F H e where H e = ( H + M ) ( H + F ) T o t a l 1
Notes: G indicates the observed value; S indicates the satellite precipitation product (SPP); H represents the observed and correctly detected rain events; M indicates the observed rain events undetected by the SPP; F indicates detected rain events that were not observed; Total represents the total number of rain and “not rain” events. The rain event is the rain above the threshold.
Table 3. Extreme precipitation index descriptions.
IndexIntroductionUnit
rx1dayMonthly maximum 1-day precipitationmm
rx5dayMonthly maximum consecutive 5-day precipitationmm
R95PAnnual total PRCP when RR > 95th percentilemm
R99PAnnual total PRCP when RR > 99th percentilemm
RCPRTOTAnnual total PRCP in wet days (RR ≥ 1 mm)mm
r10Annual count of days when PRCP ≥ 10 mmdays
r20Annual count of days when PRCP ≥ 20 mmdays
CWDMaximum number of consecutive days with RR ≥ 1 mmdays
Notes: PRCP and RR indicate precipitation and daily precipitation, respectively.
Table 4. Dryness and wetness severity classifications according to SPI values.
SPI ValueDrought Level
2.0 ≤ SPIExtreme wet
1.5 ≤ SPI < 2.0Very wet
1 ≤ SPI < 1.5Moderate wet
−1.0 ≤ SPI < 1.0Normal
−1.5 ≤ SPI < −1.0Moderate drought
−2.0 ≤ SPI < −1.5Severe drought
SPI < −2.0Extreme drought
Table 5. Bias of SPP annual average precipitation relative to station (unit: %).
Upper ReachesMiddle ReachesLower ReachesYRB
CHIRPS (25)9.337.096.827.56
CHIRPS (05)9.126.664.837.57
CMORPH3.381.075.623.80
GPM IMERG1.944.298.996.17
TRMM25.939.236.4314.30
PERSIANN-CDR10.78−2.5813.237.58
PERSIANN-CCS−4.66−50.03−32.04−36.33
Table 6. R values between SPI–1, SPI–3, SPI–6, and SPI–12 results obtained from SPPs and observations for upper, middle, and lower reaches.
CHIRPS (25)CHIRPS (05)CMORPHGPM IMERGTRMMPERSIANN-CDRPERSIANN-CCS
Upper reachesSPI–10.870.870.920.920.660.860.40
SPI–30.850.860.930.940.650.860.25
SPI–60.870.880.930.960.670.880.14
SPI–120.860.860.950.960.640.880.04
Middle reachesSPI–10.910.910.950.970.790.930.49
SPI–30.910.910.950.970.710.930.47
SPI–60.930.930.970.980.790.950.57
SPI–120.930.930.980.990.880.940.46
Low reachesSPI–10.920.920.940.960.700.890.48
SPI–30.880.880.940.980.700.870.39
SPI–60.900.900.950.970.760.840.33
SPI–120.940.940.950.980.840.850.43

