Participatory Approach for More Robust Water Resource Management: Case Study of the Santa Rosa Sub-Watershed of the Philippines

 ,
,  ,
,  ,
,  , ,
, ,
Abstract
:1. Introduction
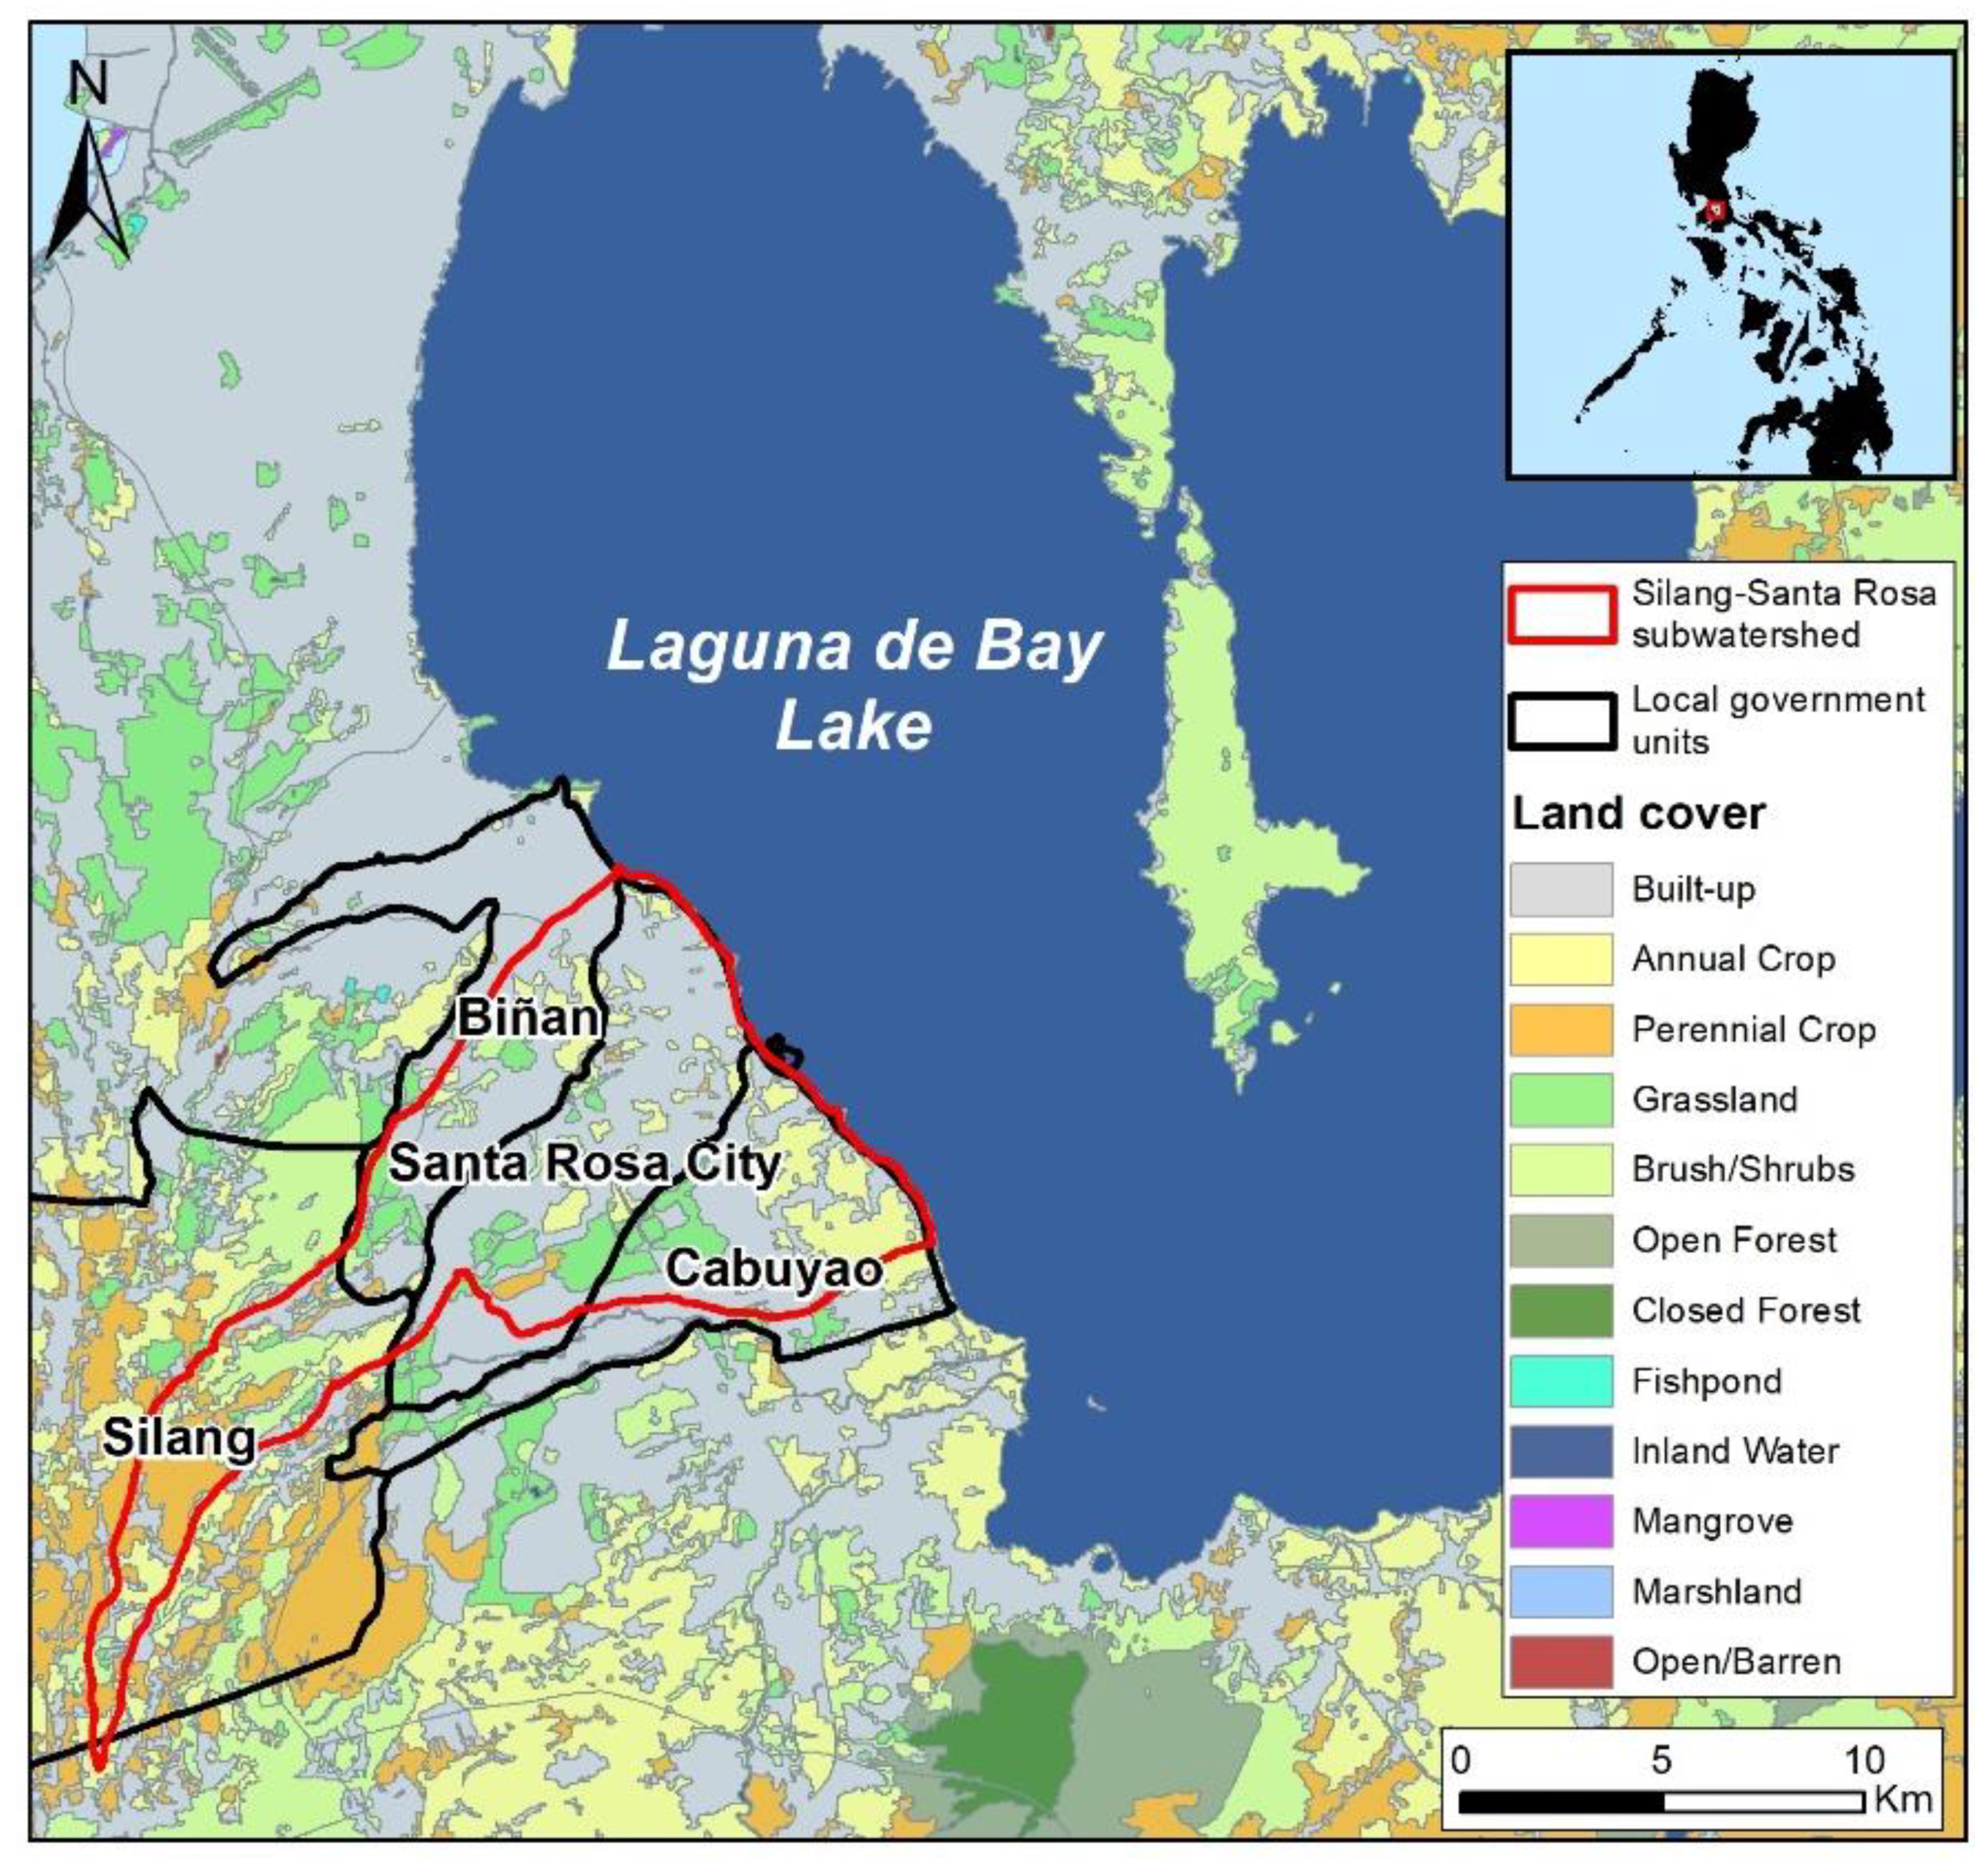
2. Study Area
3. Methodology
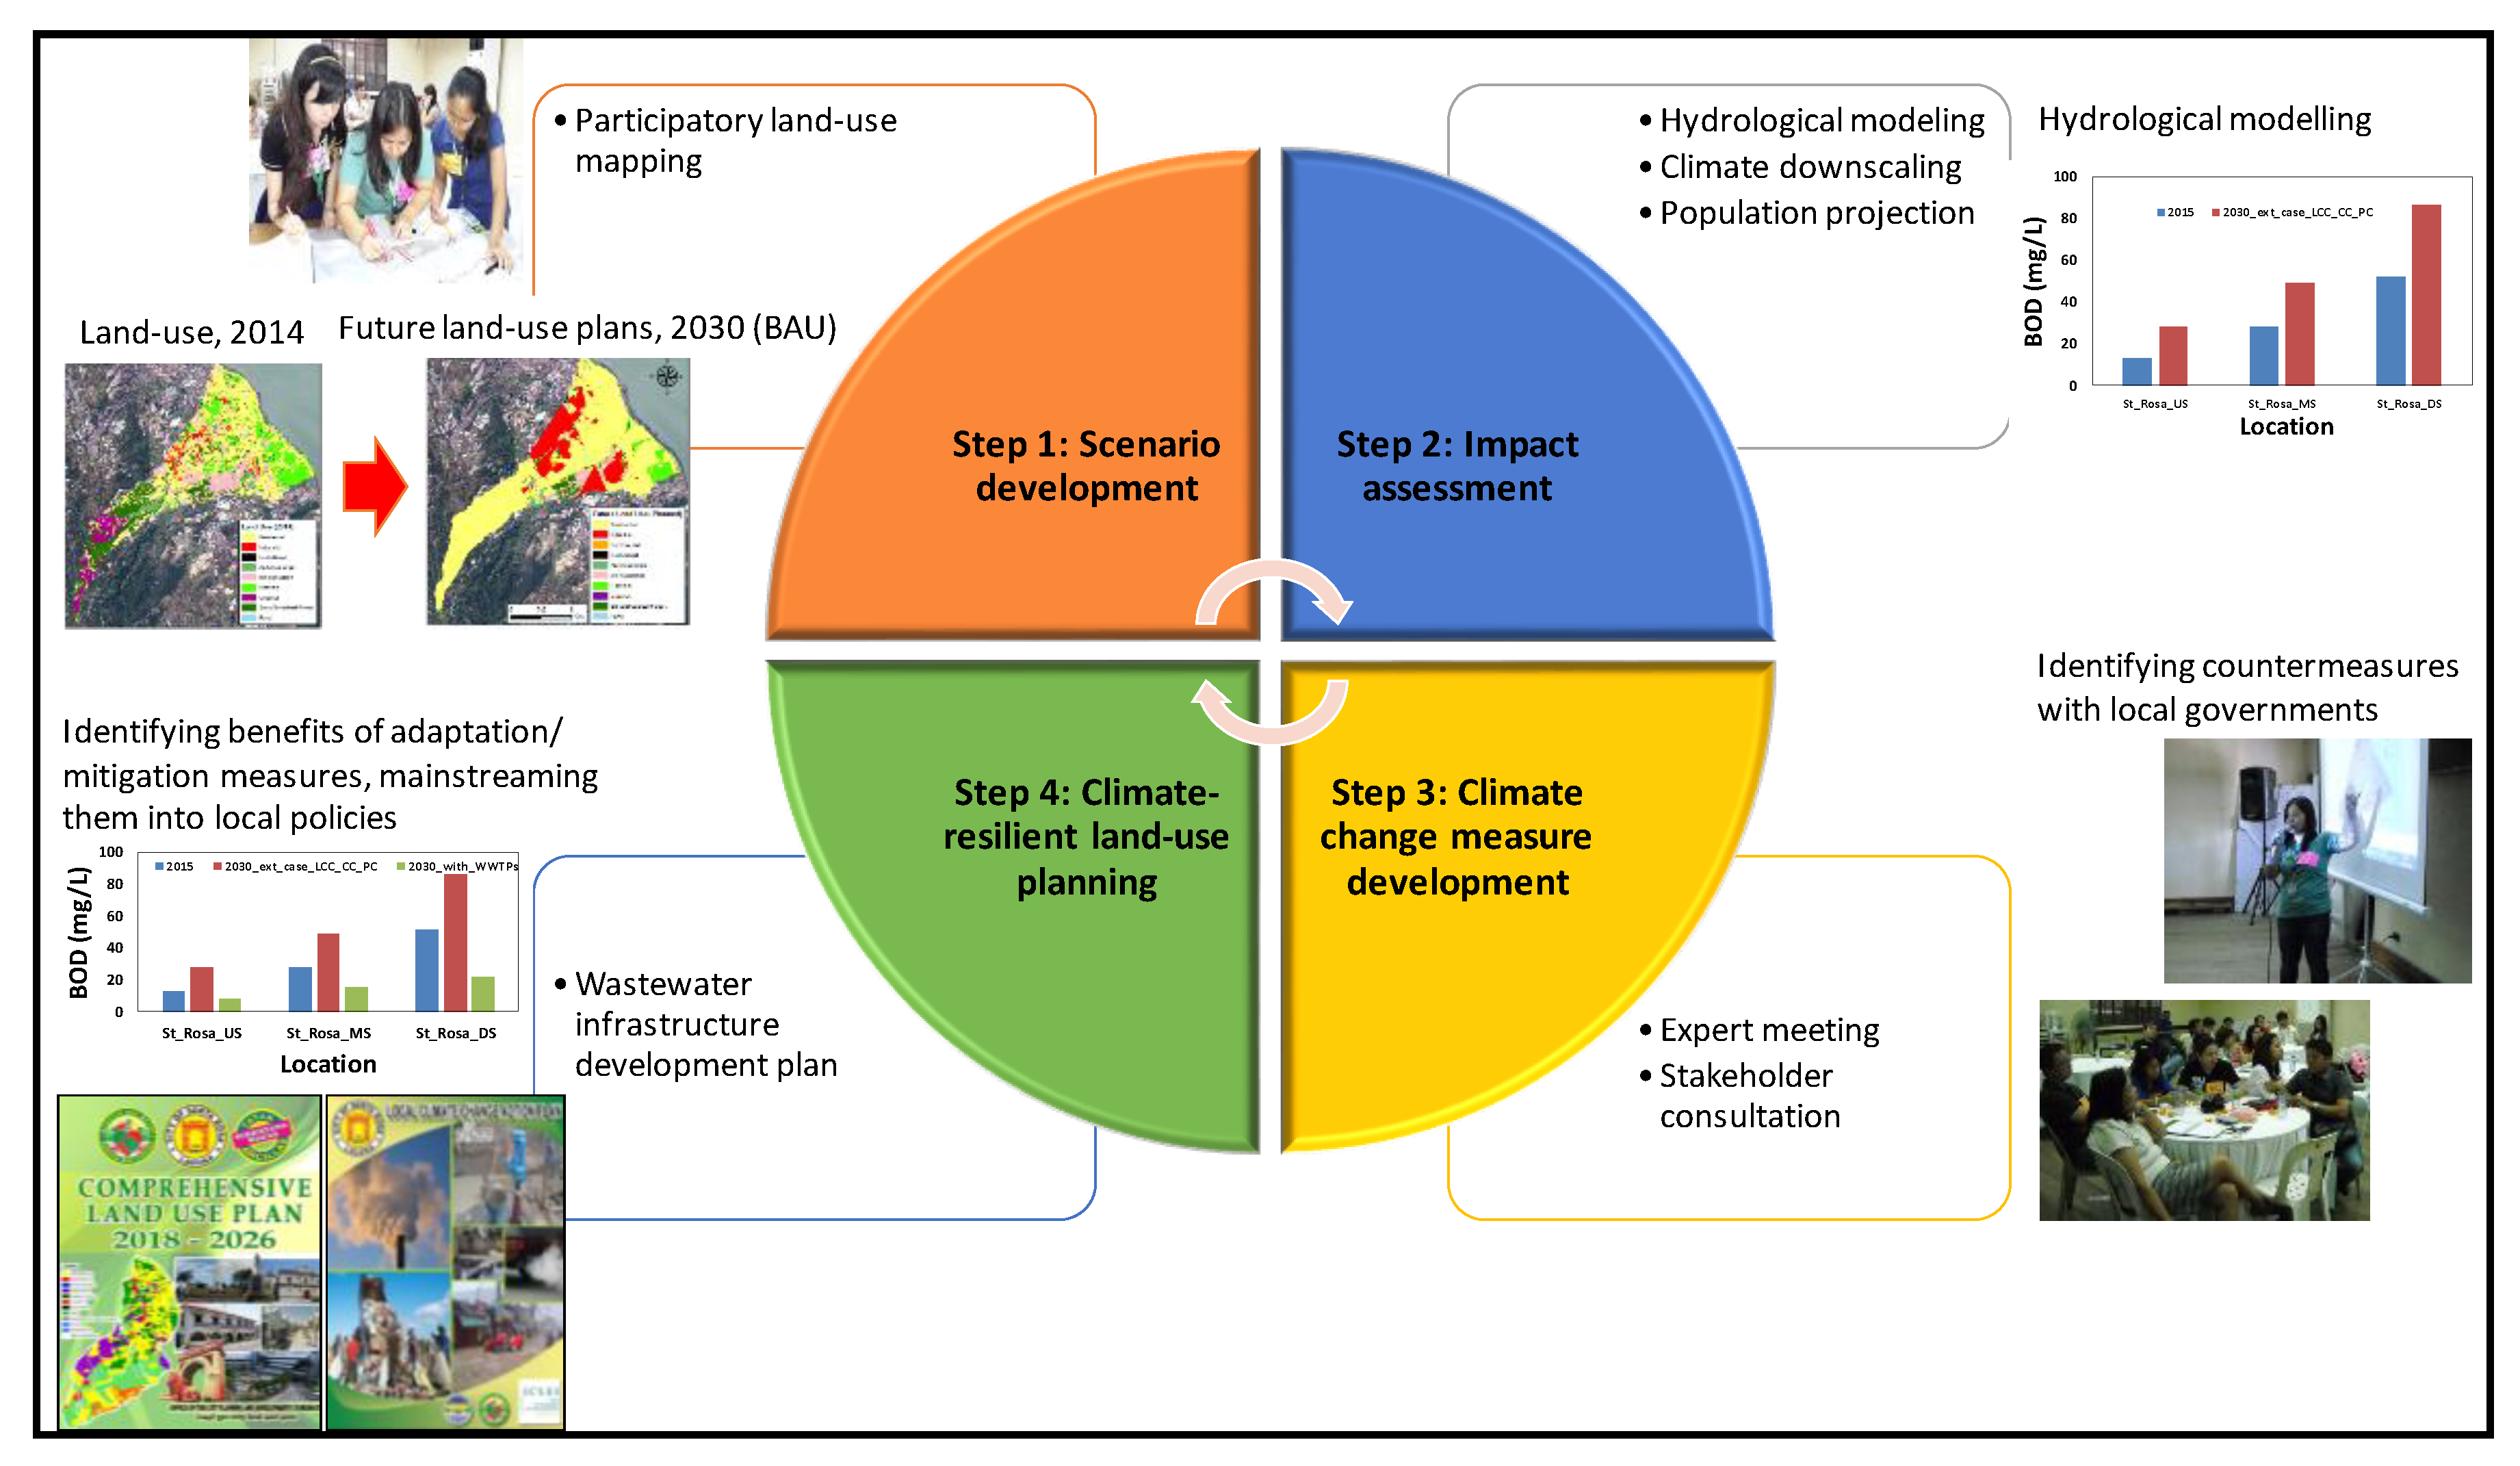
3.1. Participatory Watershed Land-Use Management (PWLM) Approach
- The first step, scenario analysis, aims at understanding the problems that the local governments face in terms of water quality deterioration, as well as the future land-use and development plans of the city/municipality. For this analysis, participatory rapid appraisal activities including key informant interviews, focus group discussions, and participatory land-use mapping, are conducted with representatives from each LGU. The government officials participating in these discussions typically come from different departments, including urban planning, agriculture, environment, and disaster risk reduction and water resource management. Through key informant interviews and focus group discussion, we identified the main issues pertaining water resource in terms of both quality and quantity, using basic sets of questions. For the participatory mapping, officials produce a map of the land-use changes expected to occur over the next decade (until 2030) by sketching the future land conversions on a (poster-sized) sheet of tracing paper overlaid onto the current land-use map. This information is later digitized and georeferenced using Geographical Information Systems (GIS) software as shown in Figure 2.
- The second step, impact assessment, involves estimating the impacts of the planned land-use changes, climate change and population growth on water quality. For this, Water Evaluation and Planning (WEAP), an integrated water resource management (IWRM) hydrological model, was used. The WEAP model is capable to estimate both water quality and quantity using scenario analysis. The other reason to select this model was that it is free for developing countries, hence easy for the hydrological officers to replicate such studies by themselves after capacity development.
- The third step, CCA&M measure development, aims to devise possible climate actions for both adaptation and mitigation in consultation with the local governments, and prioritize these actions according to their feasibility and urgency. Another focus group discussion (FGD) session was organized including participants from Water Quality Management Authority (WQMA) board members, Laguna Lake Development Authority (LLDA) (a prime nodal agency dedicated to water resource management in and around Laguna De Bay area) officials from environment and water divisions, environmental officers in-charge of water management from four LGUs falling within Santa Rosa river watershed. We requested the officials to identify measures based on the needs of each local government. Through this FGD, a set of possible countermeasures like building wastewater treatment plants (WWTPs), river rehabilitation, reduction in industrial effluent discharge without treatment were presented. Further consultation then led to the identification of priority measures.
- Step four, land-use plan improvement, aims to support local governments to strengthen their land-use and related development plans through dialogue on the recommendations generated from the previous three steps. At present, there is no adaptation and mitigation measures for water quality improvement, mentioned in the LGUs’ land-use plans. Therefore, we have evaluated the hypothetical installation of WWTPs of capacity 164MLD and its impact on water quality improvement. Based on the positive simulation result we got, suggestions were provided to local government units (LGUs) policy documents i.e., Comprehensive land use plan (CLUP) [19] or Local climate change action plan (LCCAP).
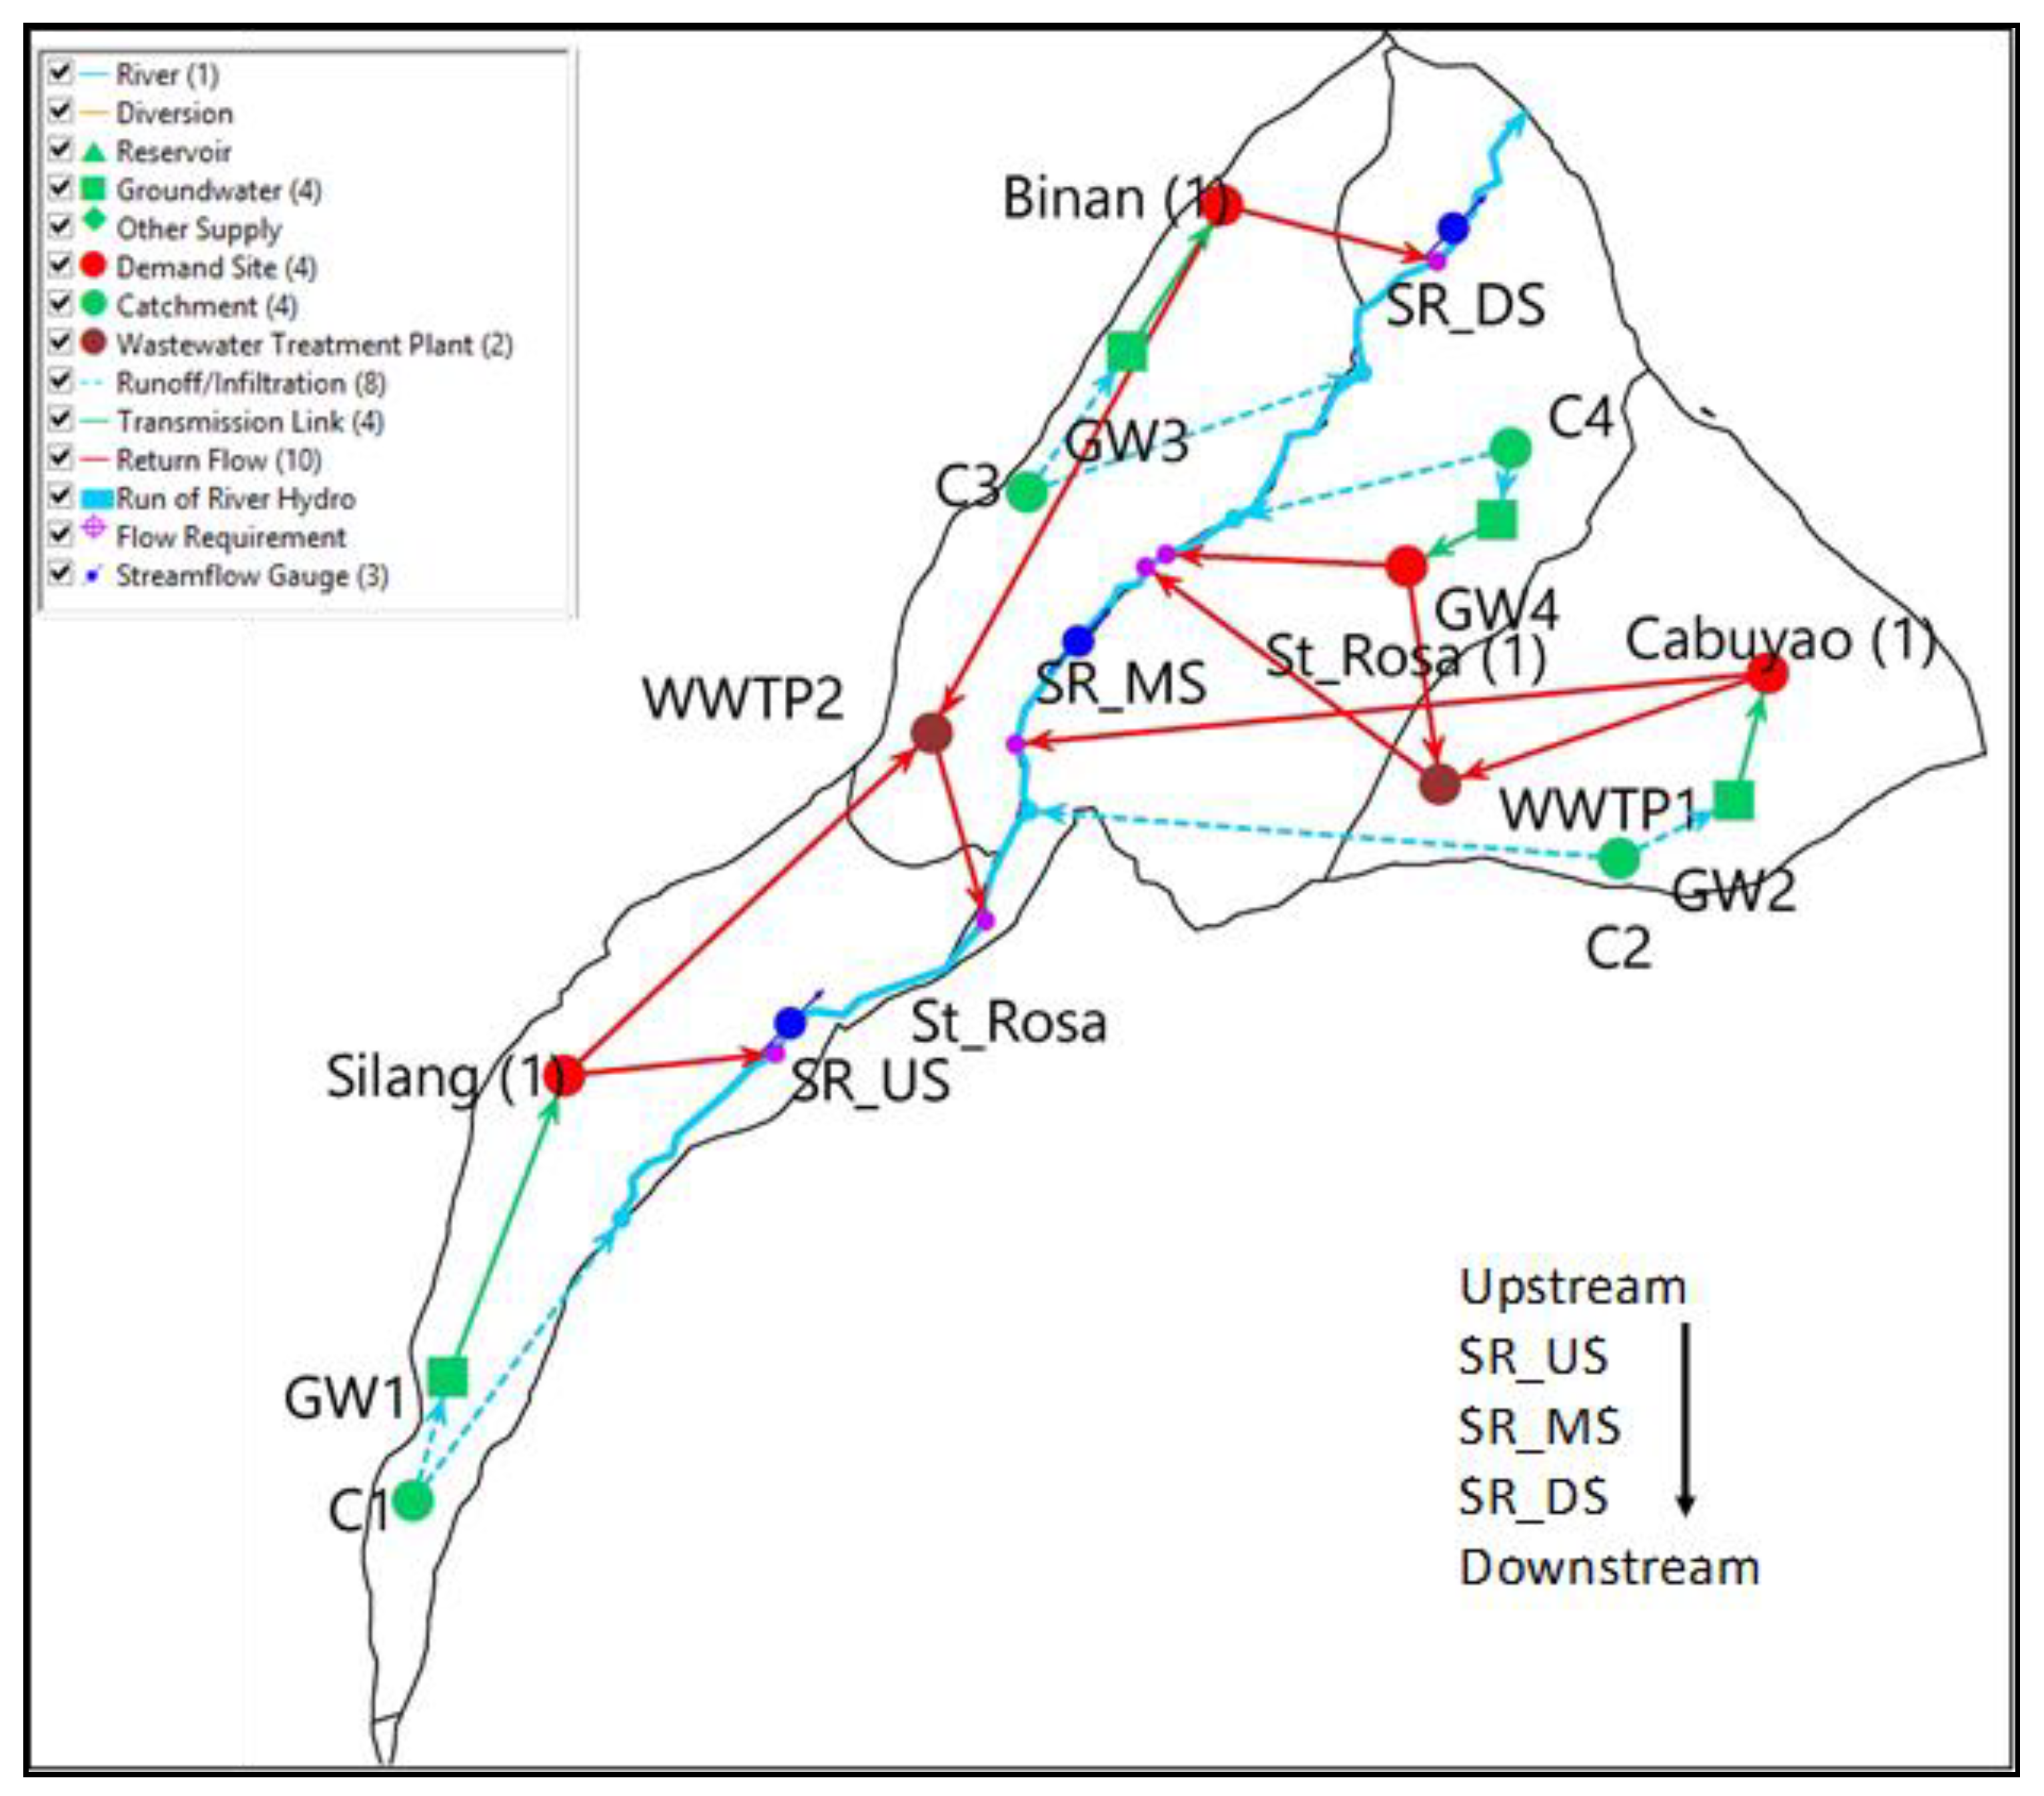
3.2. Hydrological Model
Data Requirement for Model Set Up
4. Results and Discussion
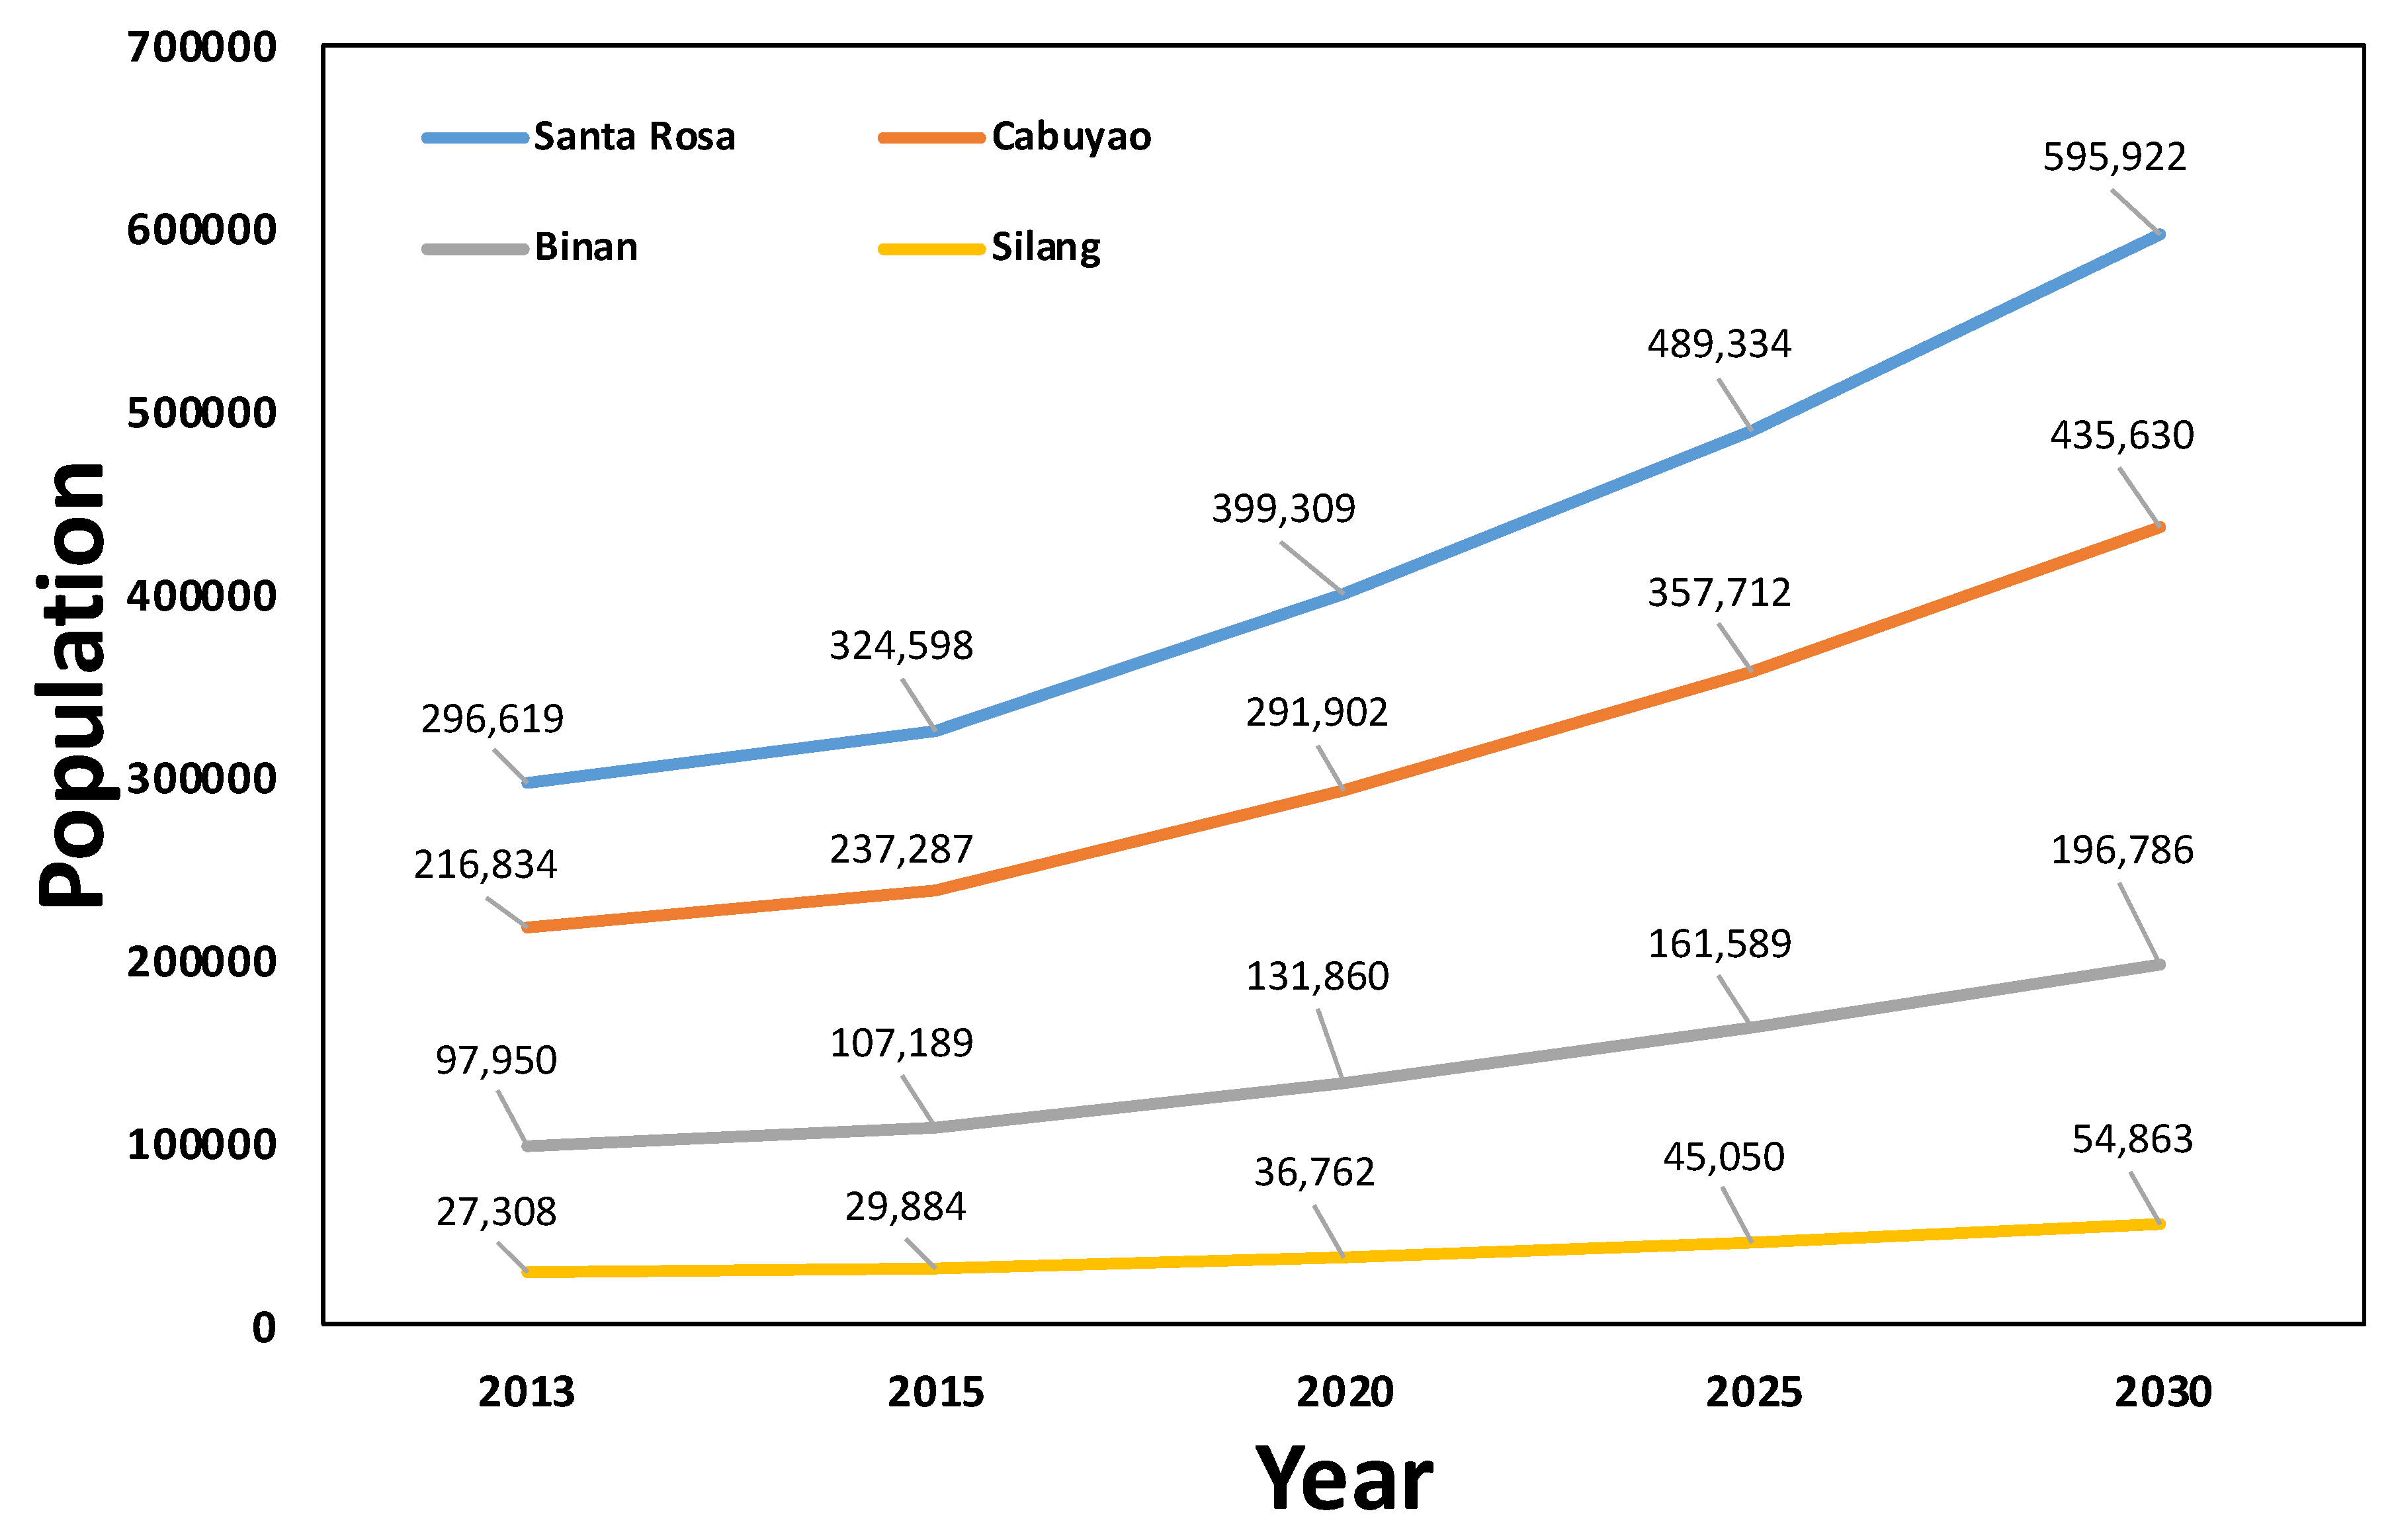
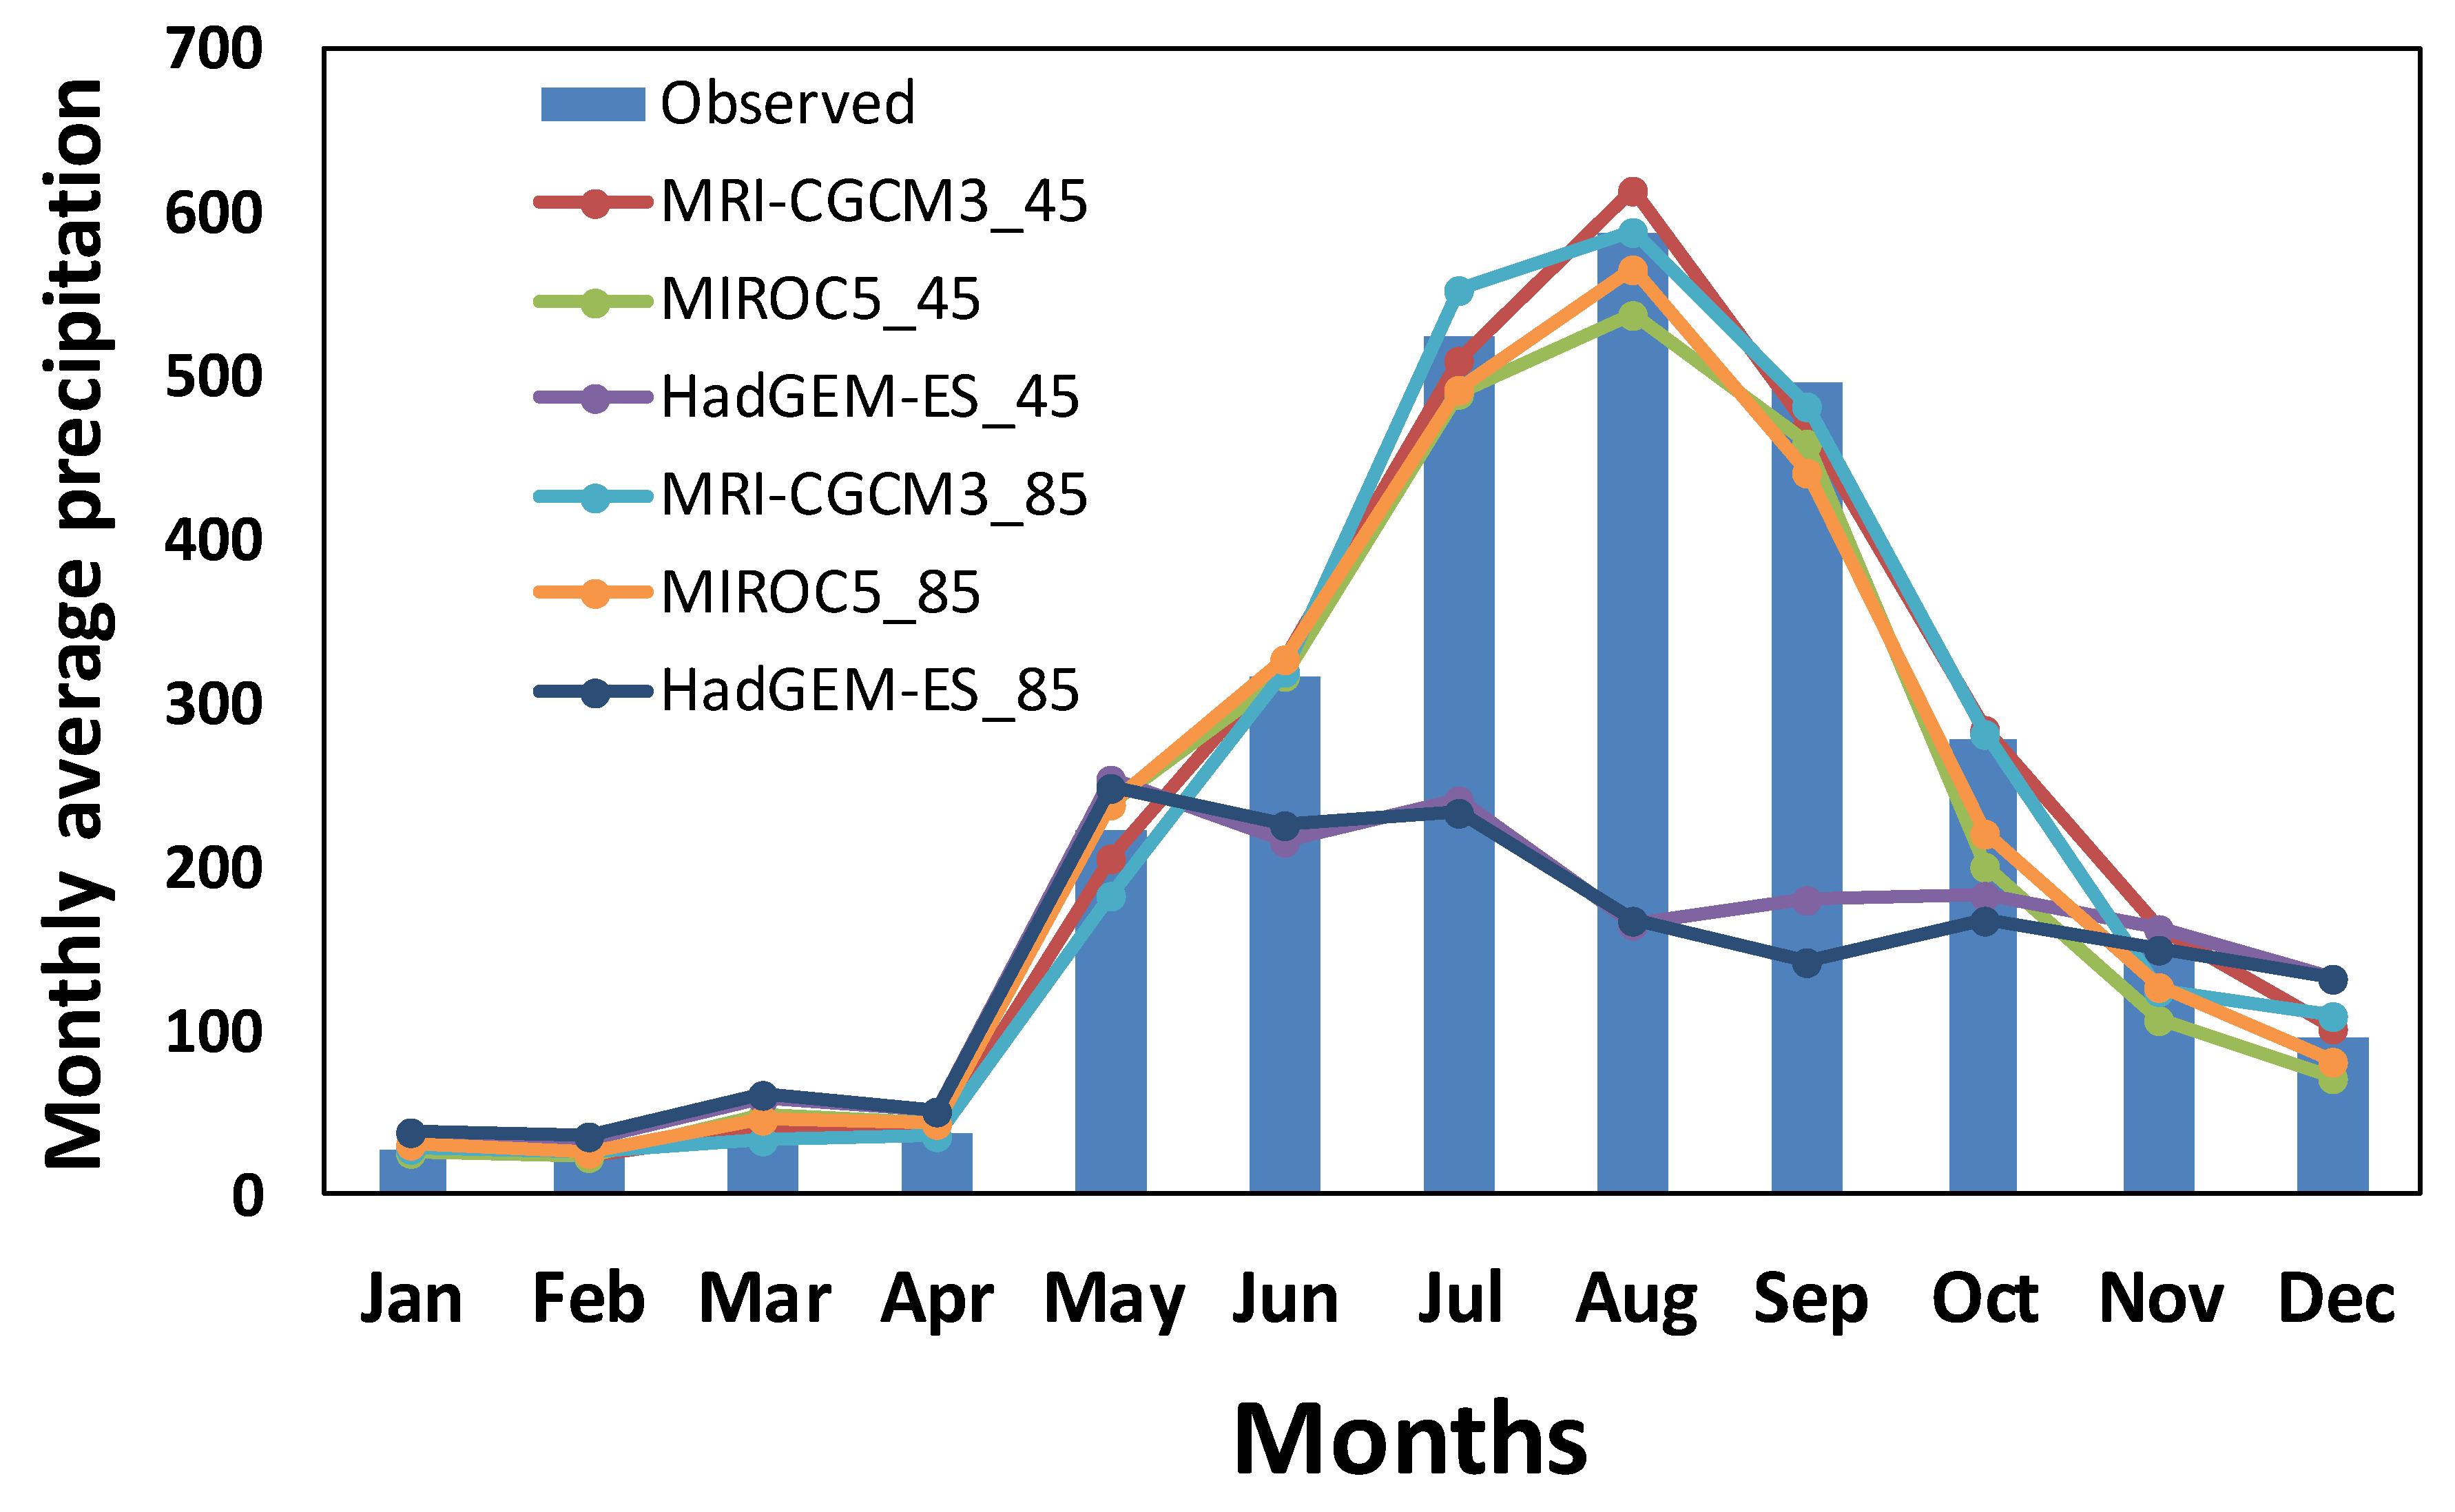
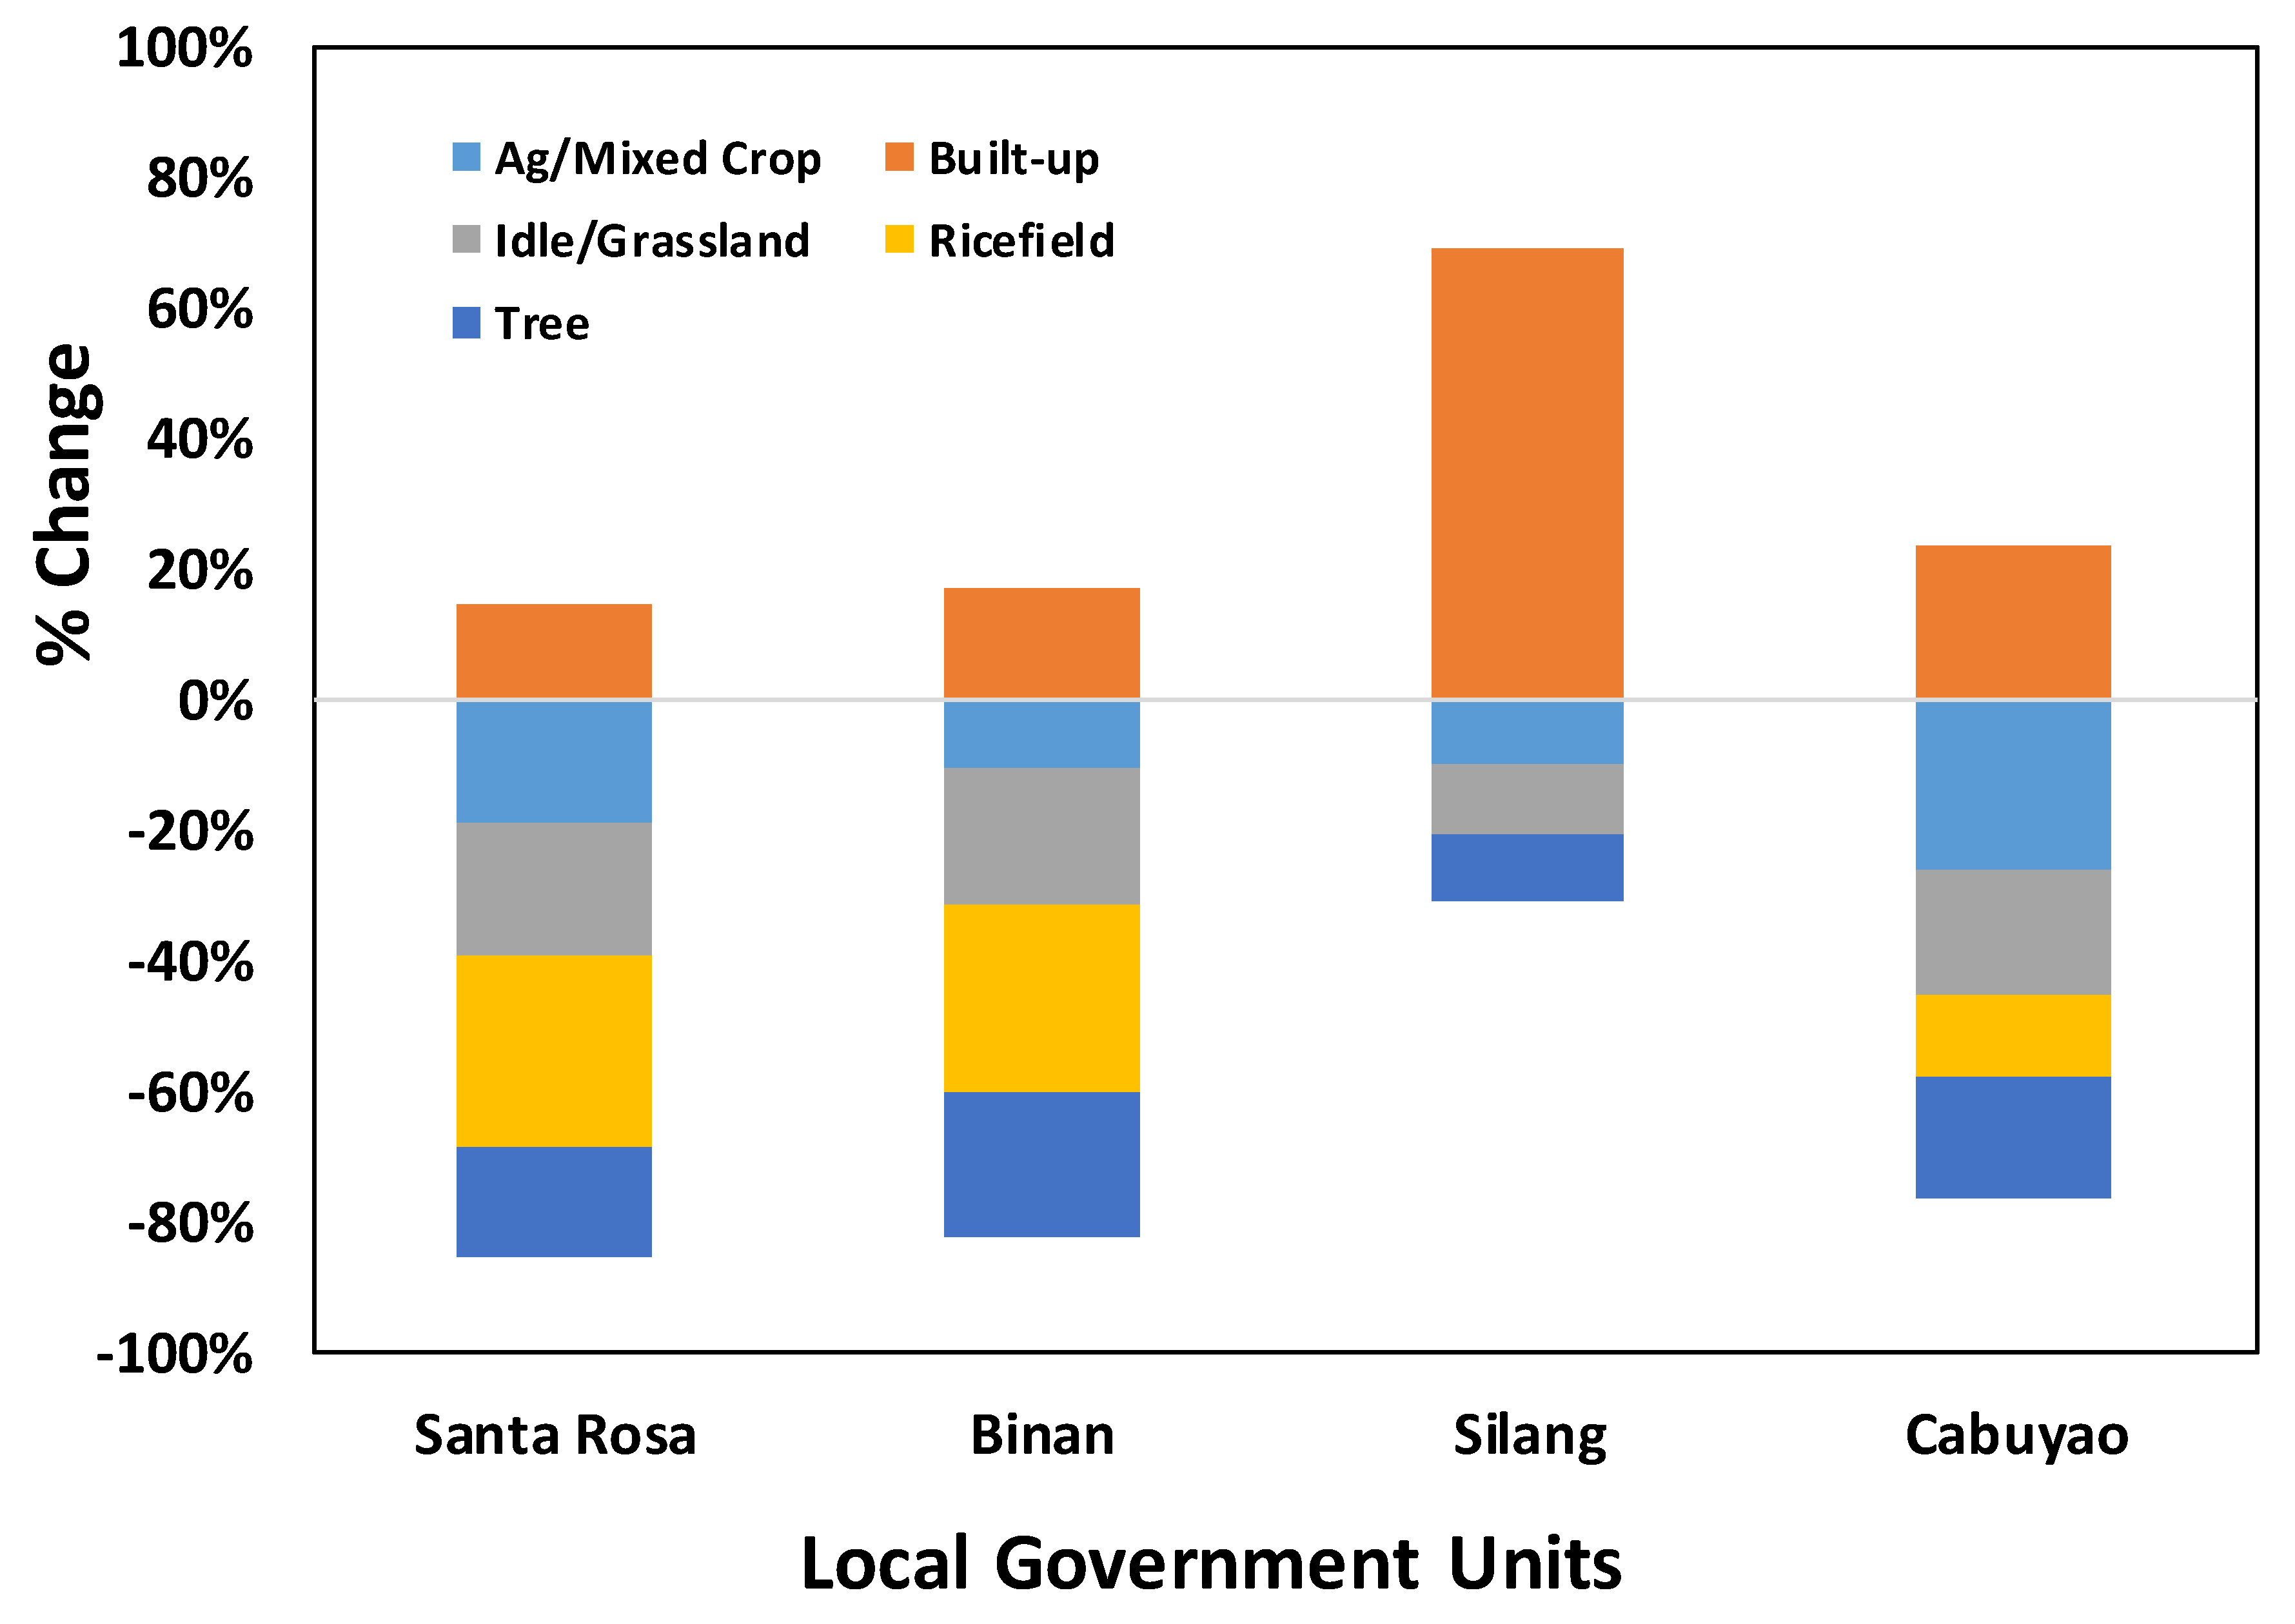
4.1. Future Prediction of Key Drivers and Pressures
4.2. Hydrological Simulation Using WEAP
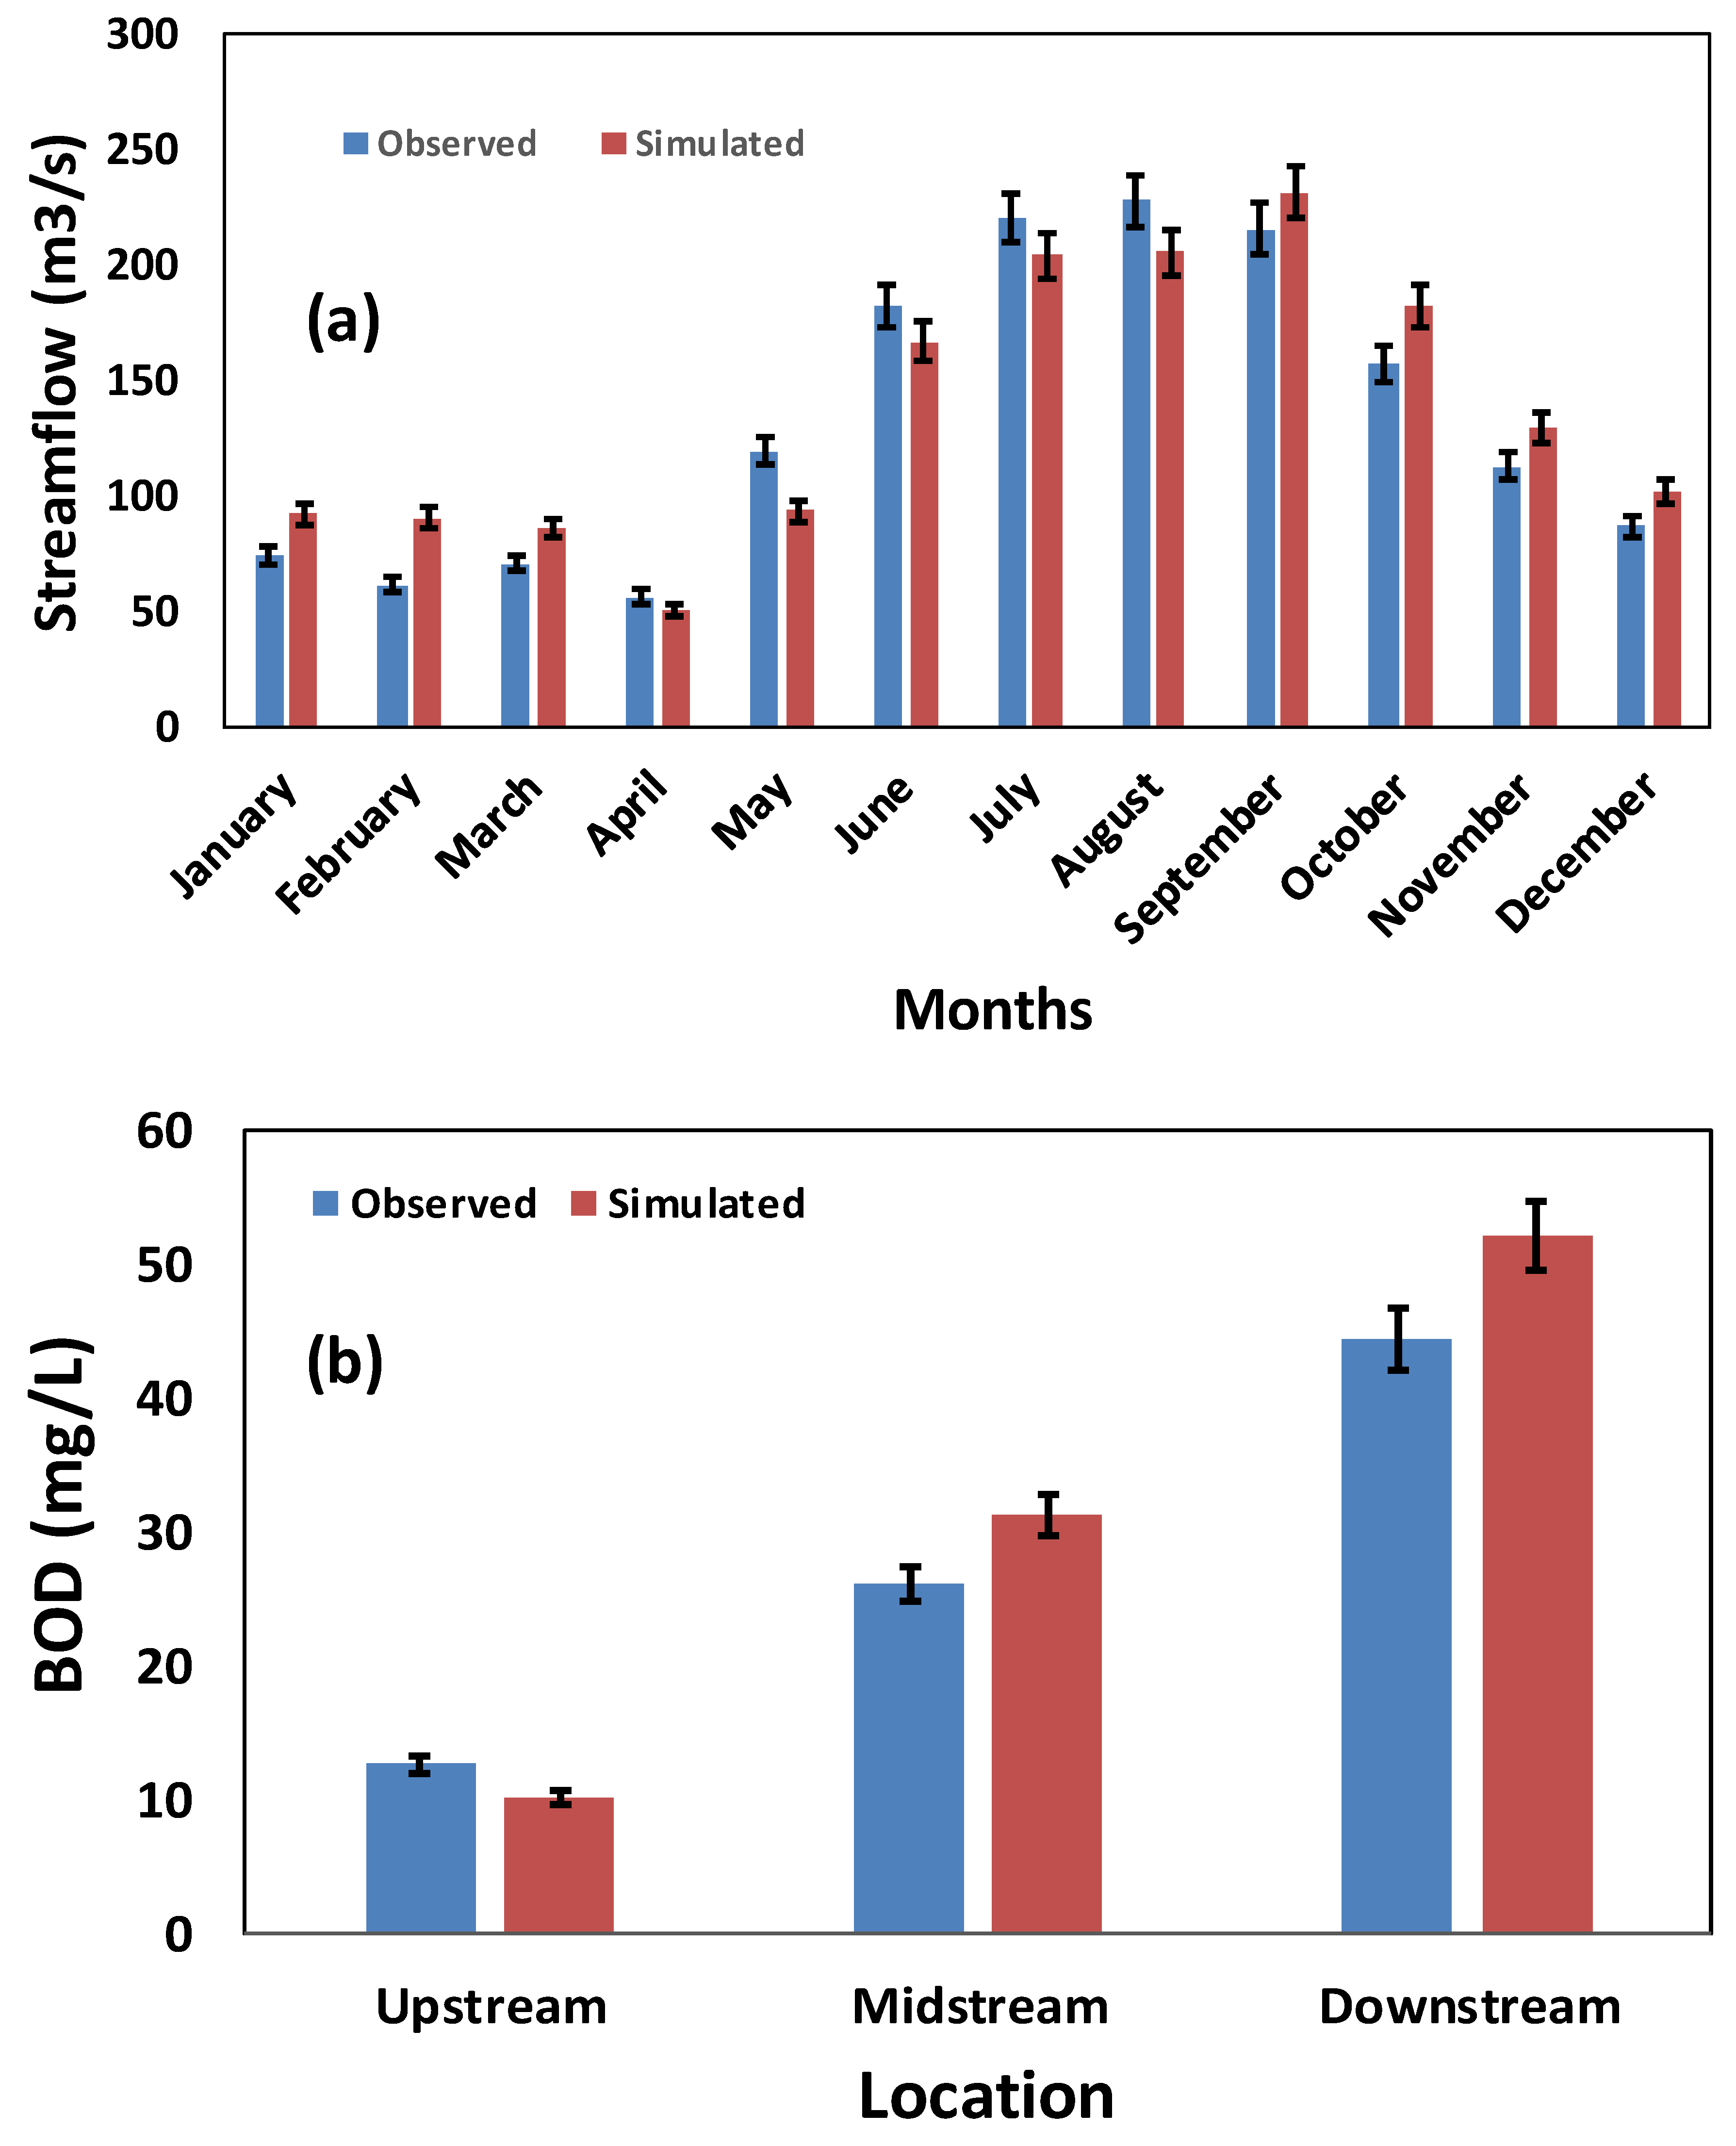
4.2.1. Model Performance Evaluation
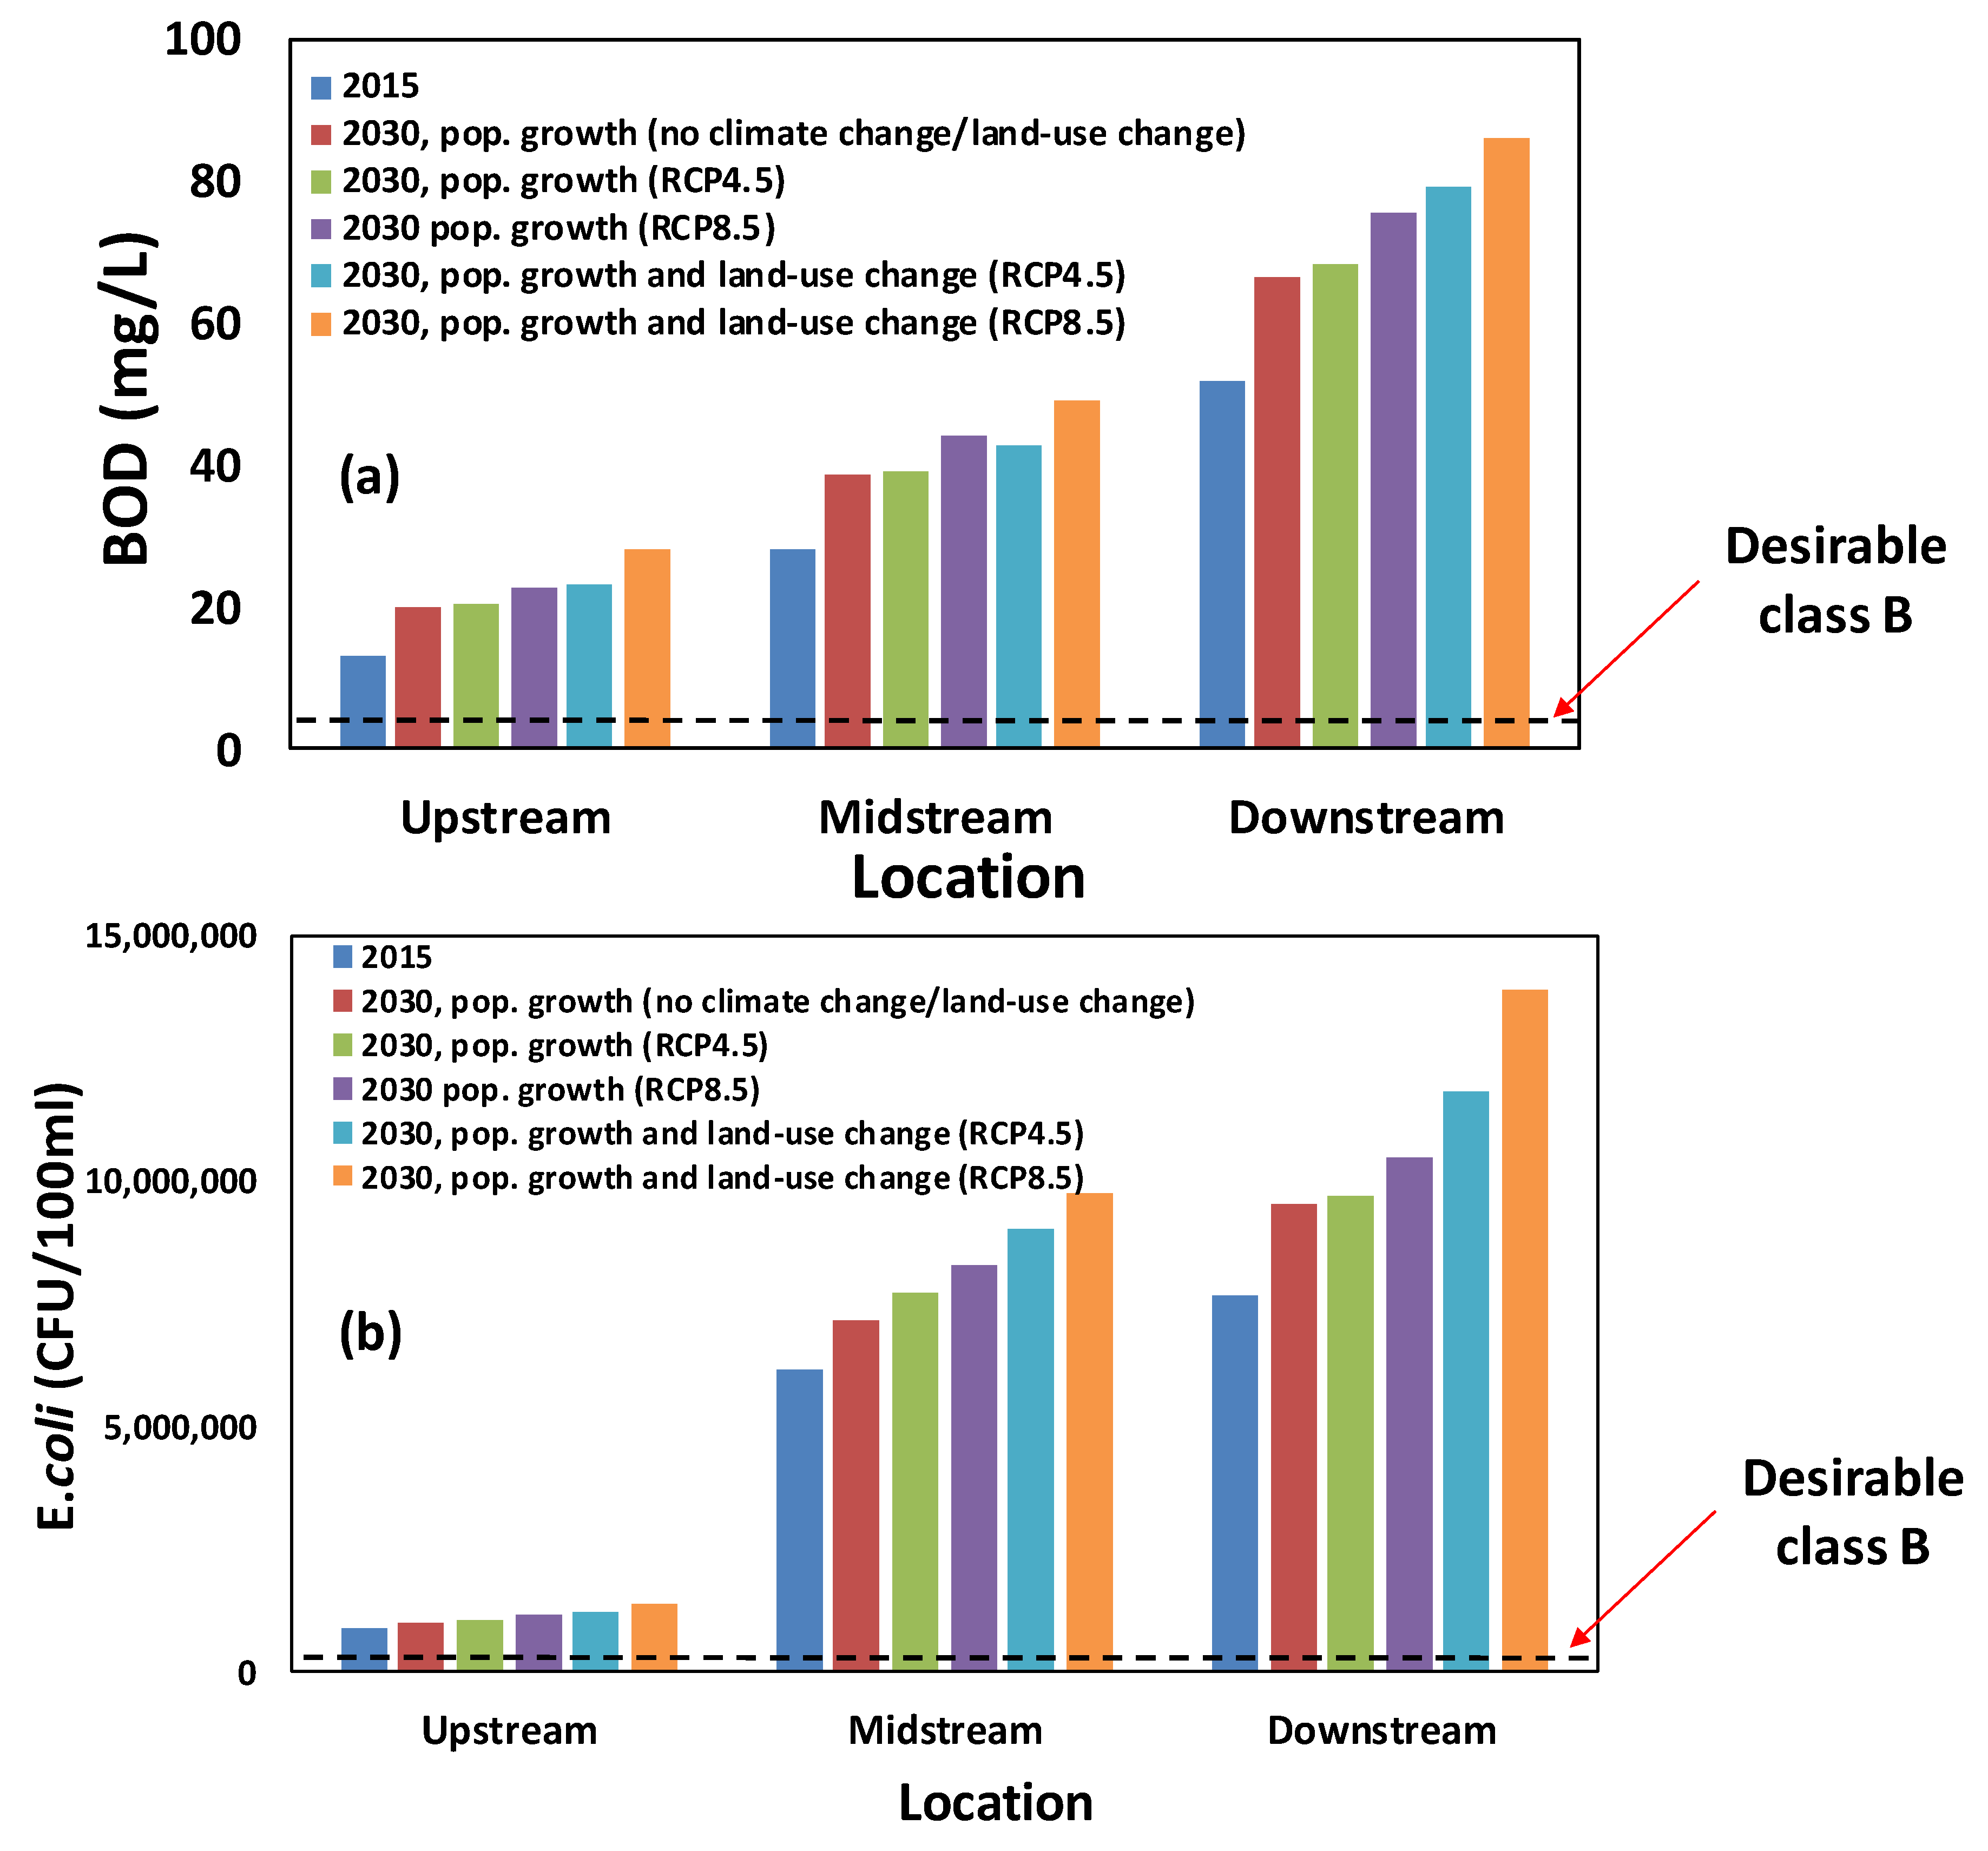
4.2.2. Scenario Analyses
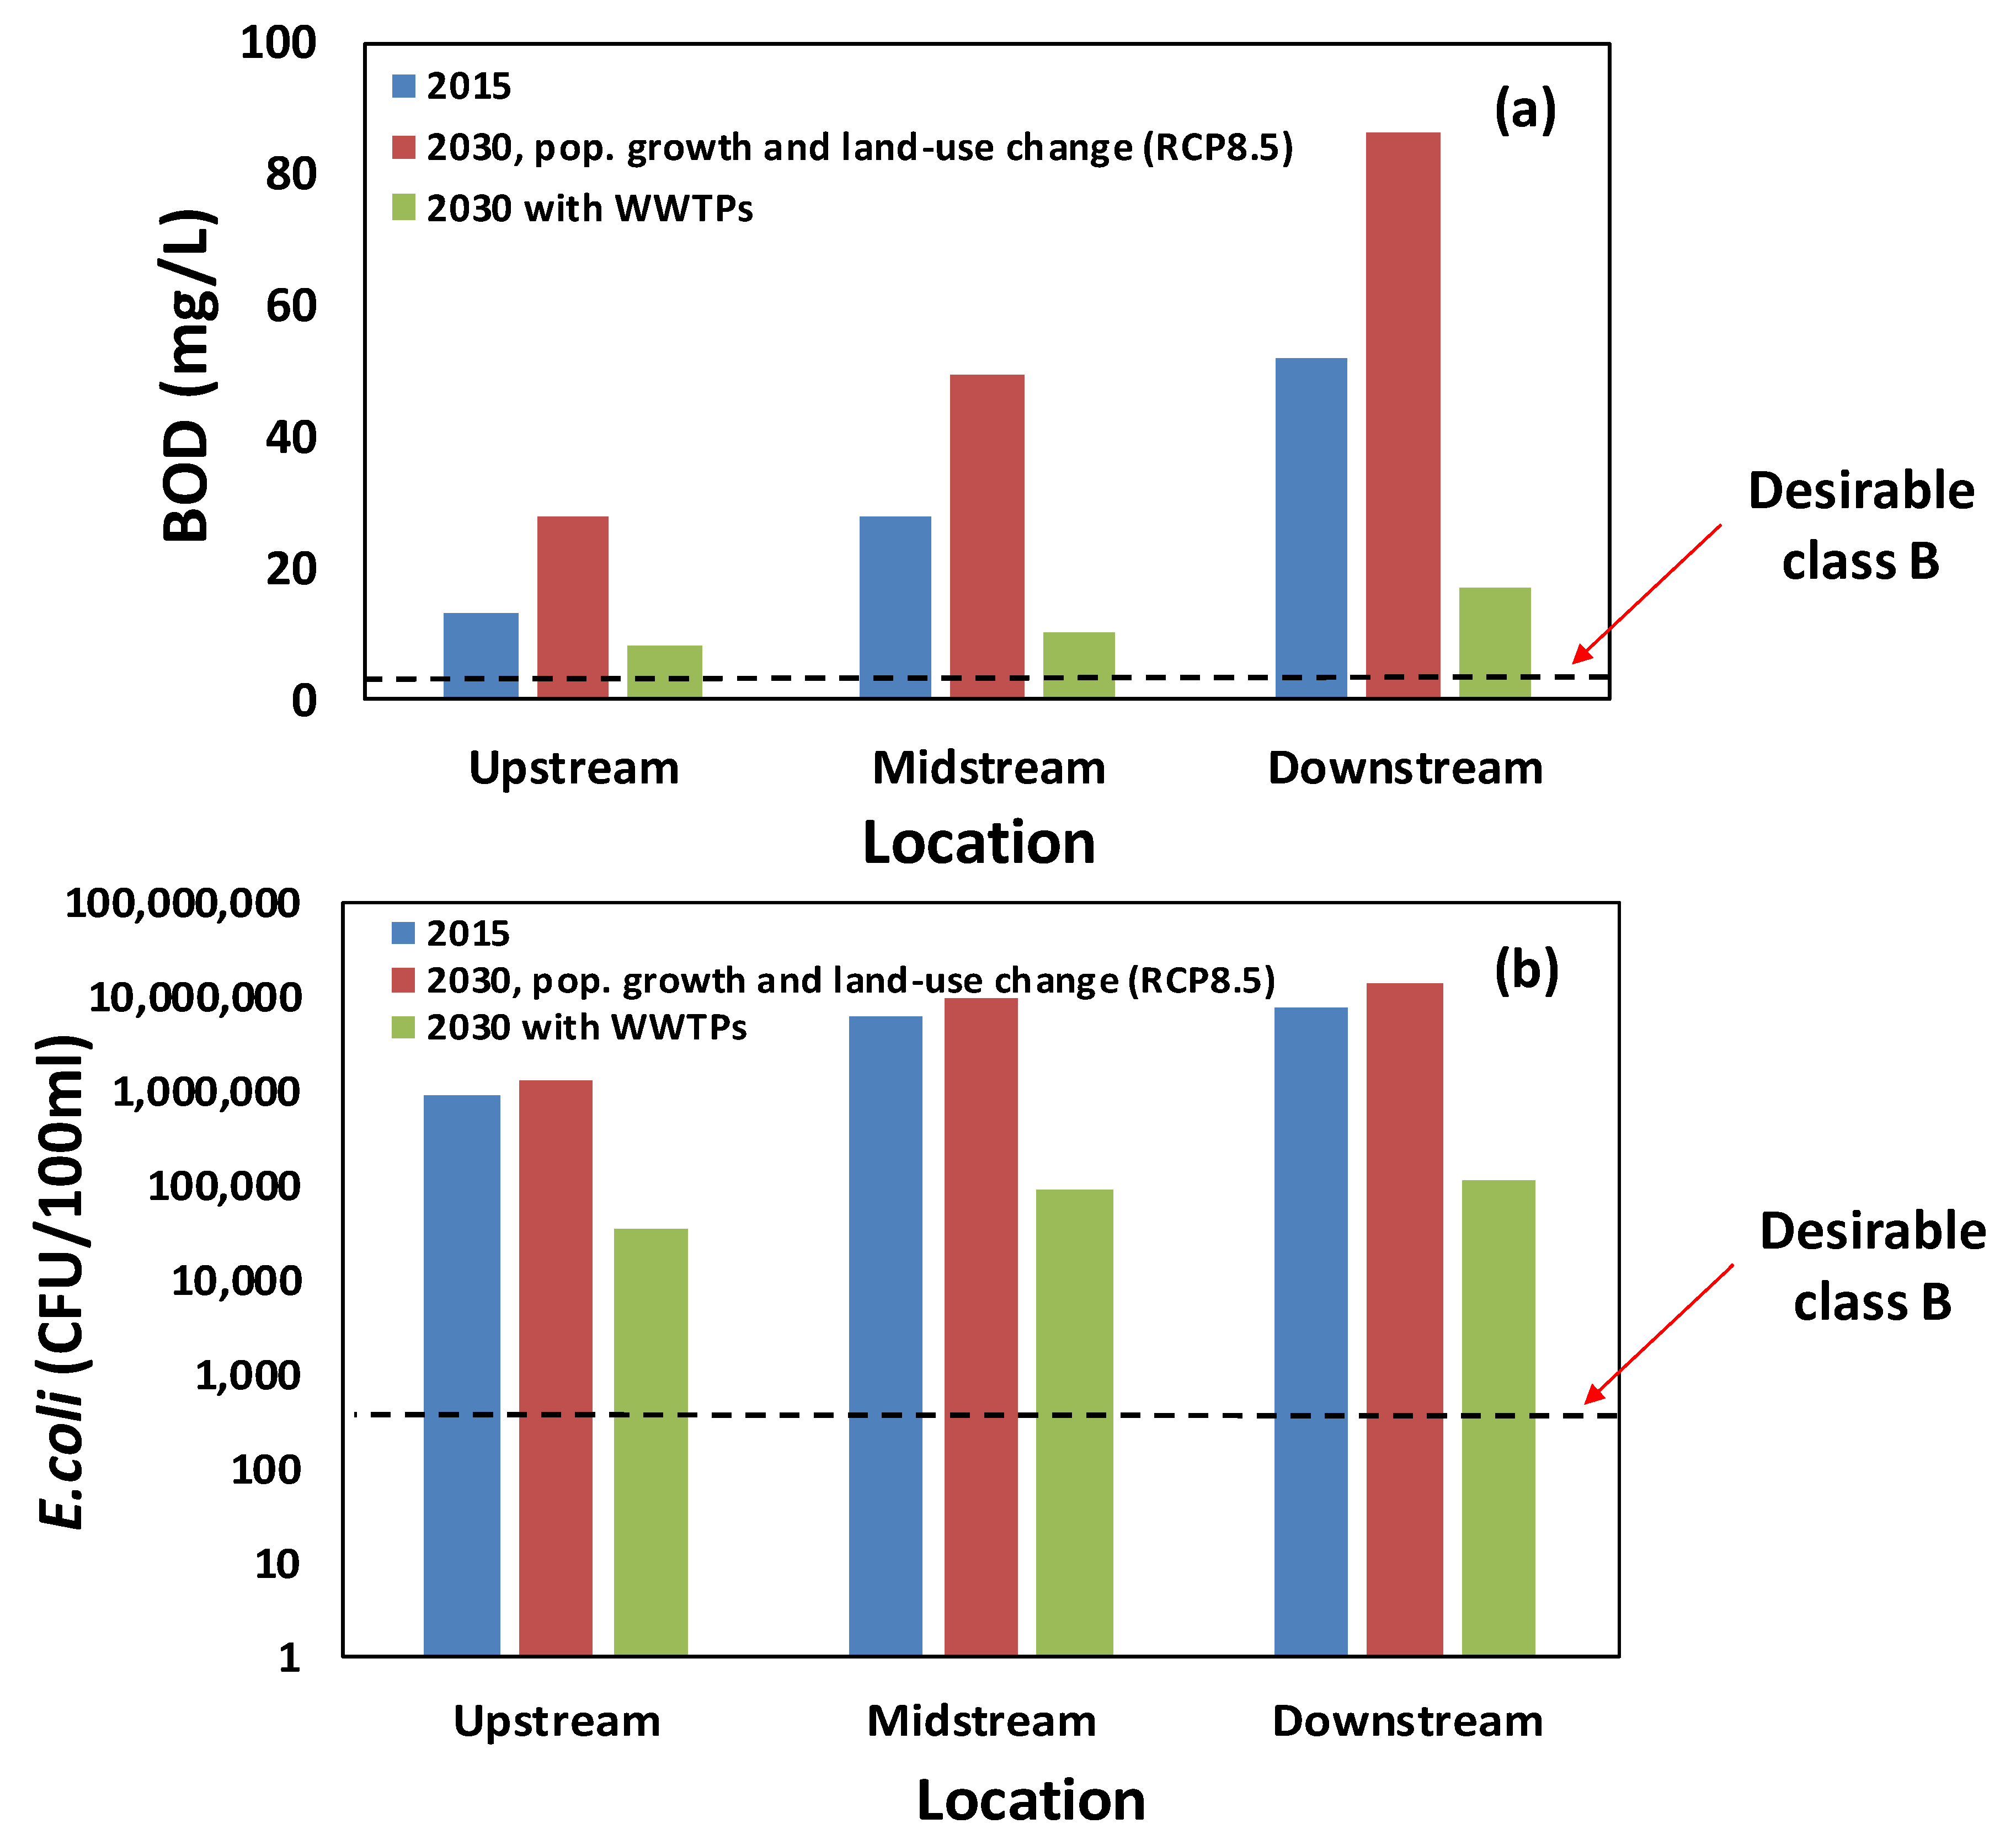
4.2.3. Scenario with Adaptation Measures
5. Conclusions
Author Contributions
Funding
Acknowledgments
Conflicts of Interest
References
- Mekonnen, M.M.; Hoekstra, A.Y. Four billion people facing severe water scarcity. Sci. Adv. 2016, 2, e1500323. [Google Scholar] [CrossRef] [PubMed] [Green Version]
- Hosseini, N.; Johnston, J.; Lindenschmidt, K. Impacts of climate change on the water quality of a regulated Prairie River. Water 2017, 9, 199. [Google Scholar] [CrossRef] [Green Version]
- Kumar, P.; Masago, Y.; Mishra, B.K.; Fukushi, K. Evaluating future stress due to combined effect of climate change and rapid urbanization for Pasig-Marikina River, Manila. Groundw. Sustain. Dev. 2018, 6, 227–234. [Google Scholar] [CrossRef]
- Kumar, P. Numerical quantification of current status quo and future prediction of water quality in eight Asian Mega cities: Challenges and opportunities for sustainable water management. Environ. Monit. Assess. 2019, 191, 319. [Google Scholar] [CrossRef] [PubMed]
- Endo, I.; Magcale-macandog, D.B.; Kojima, S.; Johnson, B.A.; Bragais, M.; Beatrice-macandog, P.; Scheyvens, H. Participatory land-use approach for integrating climate change adaptation and mitigation into basin scale local planning. Particip. Sustain. Cities Soc. 2017, 64, 184–193. [Google Scholar] [CrossRef]
- Procter, A.; McDaniels, T.; Vignola, R. Using expert judgments to inform economic evaluation of ecosystem-based adaptation decisions: Watershed management for enhancing water supply for Tegucigalpa, Honduras. Environ. Syst. Decis. 2017, 37, 410–422. [Google Scholar] [CrossRef]
- French, A.; Mechler, R. Managing El Niño Risks Under Uncertainty in Peru: Learning from the Past for a More Disaster-resilient Future; International Institute for Applied Systems Analysis: Laxenburg, Austria, 2017. [Google Scholar]
- IPCC. Climate Change 2014: Synthesis Report; Contribution of Working Groups I, II and III to the Fifth Assessment Report of the Intergovernmental Panel on Climate Change; Core Writing Team, Pachauri, R.K., Meyer, L.A., Eds.; IPCC: Geneva, Switzerland, 2014; p. 151. [Google Scholar]
- Jones, R.; Patwardhan, A.; Cohen, S.; Dessai, S.; Lammel, A.; Lempert, R.; Mirza, M.M.Q.; von Storch, H. Foundations for decision making. In Climate Change 2014: Impacts, Adaptation, and Vulnerability. Part A: Global and Sectoral Aspects; Contribution of Working Group II to the Fifth Assessment Report of the Intergovernmental Panel on Climate Change; Field, C.B., Barros, V.R., Dokken, D.J., Mach, K.J., Mastrandrea, M.D., Bilir, T.E., Chatterjee, M., Ebi, K.L., Estrada, Y.O., Genova, R.C., et al., Eds.; Cambridge University Press: Cambridge, UK; New York, NY, USA, 2014; pp. 195–228. [Google Scholar]
- Duguma, L.A.; Wambugu, S.W.; Minang, P.A.; van Noordwijk, M. A systematic analysis of enabling conditions for synergy between climate change mitigation and adaptation measures in developing countries. Environ. Sci. Policy 2014, 42, 138–148. [Google Scholar] [CrossRef] [Green Version]
- Wilbanks, T.; Sathaye, J. Integrating mitigation and adaptation as responses to climate change: A synthesis. Mitig. Adapt. Strateg. Glob. Chang. 2007, 12, 957–962. [Google Scholar] [CrossRef]
- VenkataRaman, S.; Iniyan, S.; Goic, R. A review of climate change, mitigation and adaptation. Renew. Sustain. Energy Rev. 2012, 16, 878–897. [Google Scholar] [CrossRef]
- Asian Development Bank (ADB); Felipe, J.; Estrada, G.B. Why has the Philippines’s Growth Performance Improved? From Disappointment to Promising Success; ADB economics working paper series, Number 542; ADB publications: Manila, Philippines, 2018. [Google Scholar]
- Webpage for City of Santa Rosa, Province of Laguna. Available online: www.santarosacity.gov.ph/home/ (accessed on 16 August 2018).
- Zimmer, V.; Bendoricchio, G. Nutrient and suspended solid loads in the Laguna de Bay, Philippines. Water Sci. Technol. 2001, 44, 77–86. [Google Scholar] [CrossRef] [PubMed]
- Victoriano, J.M.; Lacatan, L.L.; Vinluan, A.A. Predicting river pollution using random forest decision tree with GIS model: A case study of MMORS, Philippines. Int. J. Environ. Sci. Dev. 2020, 11, 1. [Google Scholar] [CrossRef] [Green Version]
- Philippine Atmospheric Geophysical Astronomical Services Administration (PAGASA). 2020. Available online: http://bagong.pagasa.dost.gov.ph/information/climate-philippines (accessed on 12 January 2020).
- Philippine Statistical Authority (PSA). Philippines in Figures; Databank and information services division: Quezon City, Philippines, 2015; p. 102. [Google Scholar]
- Comprehensive Land Use Plan (CLUP) City of Santa Rosa. Comprehensive Land Use Plan (2018–2026); CLUP: City of Santa Rosa, Philippine, 2018. [Google Scholar]
- Seiber, J.; Purkey, D. WEAP—Water Evaluation and Planning System User Guide for WEAP 2015; Stockholm Environment Institute: Stockholm, Sweden, 2015. [Google Scholar]
- American Public Health Association (APHA). Standard Methods for the Examination of Water and Wastewater, 22nd ed.; Rice, E.W., Baird, R.B., Eaton, A.D., Clesceri, L.S., Eds.; American Public Health Association (APHA), American Water Works Association (AWWA) and Water Environment Federation (WEF): Washington, DC, USA, 2012; p. 1496. [Google Scholar]
- United Nations, Department of Economic and Social Affairs, Population Division (UN DESA). World Urbanization Prospects: The 2014 Revision, 2015, (ST/ESA/SER.A/366); United Nations Publication: New York, NY, USA, 2015; p. 517. [Google Scholar]
- The United Nations World Water Development Report 2017; Wastewater: The Untapped Resource; UNESCO: Paris, France, 2017.
- Department of Environment and Natural Resources (DENR). Water Quality Guidelines and General Effluent Standards of 2016; Republic of Philippines: Quezon City, Philippines, 2016; p. 25. [Google Scholar]
- Khan, A.A.; Gaur, R.Z.; Diamantis, V.; Lew, B.; Mehrotra, I.; Kazmi, A.A. Continuous fill intermittent decant type sequencing batch reactor application to upgrade the UASB treated sewage. Bioprocess Biosyst. Eng. 2013, 36, 627–634. [Google Scholar] [CrossRef] [PubMed]


| Parameter | Initial Value | Step | Final Value |
|---|---|---|---|
| Effective precipitation | 100% | ±0.5% | 92% |
| Runoff/infiltration ratio | 50/50 | ±5/5 | 55/45 |
| Parameter | Average % Increase (2015 to 2030) | % Contribution from Population Growth | % Contribution from LULC Change | % Contribution from Climate Change |
|---|---|---|---|---|
| BOD | 76 | 66 | 23 | 11 |
| E. coli | 104 | 71 | 20 | 9 |
| WWTP | Future Population (2030) | Wastewater Generated in Liter Per Day for the Year 2030@130 liter/capita/day | WWTP Capacity in Million Liter Per Day (MLD) Assumed for Numerical Simulation |
|---|---|---|---|
| WWTP 1 (will serve Santa Rosa and Cabuyao) | 1,031,553 | 134,101,847 | 134 |
| WWTP 2 (will serve Binan and Silang) | 251,650 | 32,714,443 | 32 |
© 2020 by the authors. Licensee MDPI, Basel, Switzerland. This article is an open access article distributed under the terms and conditions of the Creative Commons Attribution (CC BY) license (http://creativecommons.org/licenses/by/4.0/).
Share and Cite
Kumar, P.; Johnson, B.A.; Dasgupta, R.; Avtar, R.; Chakraborty, S.; Kawai, M.; Magcale-Macandog, D.B. Participatory Approach for More Robust Water Resource Management: Case Study of the Santa Rosa Sub-Watershed of the Philippines. Water 2020, 12, 1172. https://doi.org/10.3390/w12041172
Kumar P, Johnson BA, Dasgupta R, Avtar R, Chakraborty S, Kawai M, Magcale-Macandog DB. Participatory Approach for More Robust Water Resource Management: Case Study of the Santa Rosa Sub-Watershed of the Philippines. Water. 2020; 12(4):1172. https://doi.org/10.3390/w12041172
Chicago/Turabian StyleKumar, Pankaj, Brian Alan Johnson, Rajarshi Dasgupta, Ram Avtar, Shamik Chakraborty, Masayuki Kawai, and Damasa B. Magcale-Macandog. 2020. "Participatory Approach for More Robust Water Resource Management: Case Study of the Santa Rosa Sub-Watershed of the Philippines" Water 12, no. 4: 1172. https://doi.org/10.3390/w12041172