Nitrogen Mass Balance and Pressure Impact Model Applied to an Urban Aquifer


1
Geological Survey of Slovenia, Dimičeva ulica 14, SI–1000 Ljubljana, Slovenia
2
Javno Podjetje Vodovod Kanalizacija Snaga d.o.o; Vodovodna cesta 90, SI-1000 Ljubljana, Slovenia
*
Author to whom correspondence should be addressed.
Water 2020, 12(4), 1171; https://doi.org/10.3390/w12041171
Submission received: 13 February 2020
/
Revised: 15 April 2020
/
Accepted: 16 April 2020
/
Published: 19 April 2020
(This article belongs to the Special Issue Urban Hydrogeology Studies)
Abstract
:The assurance of drinking water supply is one of the biggest emerging global challenges, especially in urban areas. In this respect, groundwater and its management in the urban environment are gaining importance. This paper presents the modeling of nitrogen load from the leaky sewer system and from agriculture and the impact of this pressure on the groundwater quality (nitrate concentration) in the urban aquifer located beneath the City of Ljubljana. The estimated total nitrogen load in the model area of 58 km2 is 334 ton/year, 38% arising from the leaky sewer system and 62% from agriculture. This load was used as input into the groundwater solute transport model to simulate the distribution of nitrate concentration in the aquifer. The modeled nitrate concentrations at the observation locations were found to be on average slightly lower (2.7 mg/L) than observed, and in general reflected the observed contamination pattern. The ability of the presented model to relate and quantify the impact of pressures from different contamination sources on groundwater quality can be beneficially used for the planning and optimization of groundwater management measures for the improvement of groundwater quality.
1. Introduction
In 2018, 55% of the world’s population lived in urban areas, and this proportion is expected to increase to 68% by 2050 [1]. Europe, with 74% of its population living in urban areas in 2018, is expected to reach an urban population of 80% in 2040 and approaching 85% by 2050 [1]. Considering this population growth in light of climate change projections, the estimates show that with current practices, the world will face a 40% shortfall between the forecasted demand and available supply of water by 2030. Water security is thus emerging as one of the biggest global risks in terms of developmental impact [2].
Groundwater will have an important role, as it represents over 95% of the world’s available freshwater reserves [3]. Compared to surface water, it is better protected and a more stable water resource. Better quality, proximity of the resource, and the relatively low cost of pumping wells make groundwater an increasingly important source for city populations in the future.
Aside from socio-economic benefits, urbanization has also created environmental problems, manifested in the deterioration of air and water quality as well as a significant change in water balance [4,5,6,7]. Urban subsurface infrastructures strongly influence the chemical as well as the quantitative status of groundwater. The subsurface infrastructure of Bucharest (sewer system and water supply network) contributes more than 71% of the groundwater recharge. In addition, more than 77% of the groundwater discharge is associated with non-natural sinks (mainly the sewer system and the drain of the main sewer collector) [4]. In the Baltimore metropolitan area, the infiltration of groundwater into wastewater pipelines was found to be the most important factor of urban development affecting the groundwater storage, which can cause its decrease by 11.1% [8].
The assurance of good quality groundwater in the urban environment is a complex task, due to numerous human activities and the number of potential sources of contamination [9,10]. Additionally, the limited ability for observation and the delay between the contamination and its detection make it complicated to define the causal relationship between human activities that exert pressures and their impacts on groundwater quality.
Wastewater exfiltration from the sewer system is an important factor influencing groundwater quality, with its impact being strongly variable both in space and time [11,12,13,14]. A review of exfiltration modeling approaches and measurement techniques in terms of both volume and pollutant load showed a wide range of exfiltration rates estimated on the catchment scale, ranging from 1% to 56% of dry-weather flow (DWF) [15].
Nitrate is one of the key groundwater contaminants, and measurements of its concentration are regularly included in groundwater quality monitoring. In Slovenia, about 37% of the groundwater in alluvial aquifers has a poor chemical status, mainly due to high concentrations of nitrate (above 50 mg/L) [16]. Background concentrations of nitrate largely depend on the geological properties of aquifers; in Slovenia, they are below 10 mg/L [17]. Increased concentrations are related to human activities, in particular to agriculture. The main source of diffuse nitrogen input on agricultural land in Slovenia are mineral fertilizers and livestock manure, which account for 84% of the total input of nitrogen [18]. Among the important non-agricultural sources of nitrate in groundwater, wastewater has been identified as one of the major sources of nitrogen in urban aquifers [19].
The impact of nitrogen sources on groundwater have been investigated in a number of studies. Different sources of nitrogen and their contribution to the nitrate content in the groundwater have been analyzed [20,21,22,23,24]. The research on the role of land use [25], vulnerability of groundwater [26,27], processes of leaching [28], and the migration and transformation of nitrogen in groundwater [29,30,31] have furthered the knowledge on factors controlling groundwater nitrate contamination and its mitigation. The spatial and temporal variation of nitrate in groundwater has been commonly simulated with numerical groundwater flow and transport models [24,29,32,33]. A fundamental step in the development of such models is the estimation of nitrogen loading. The broad range of nitrogen sources in urban areas makes reliable estimation of nitrogen load a difficult task in these areas [19].
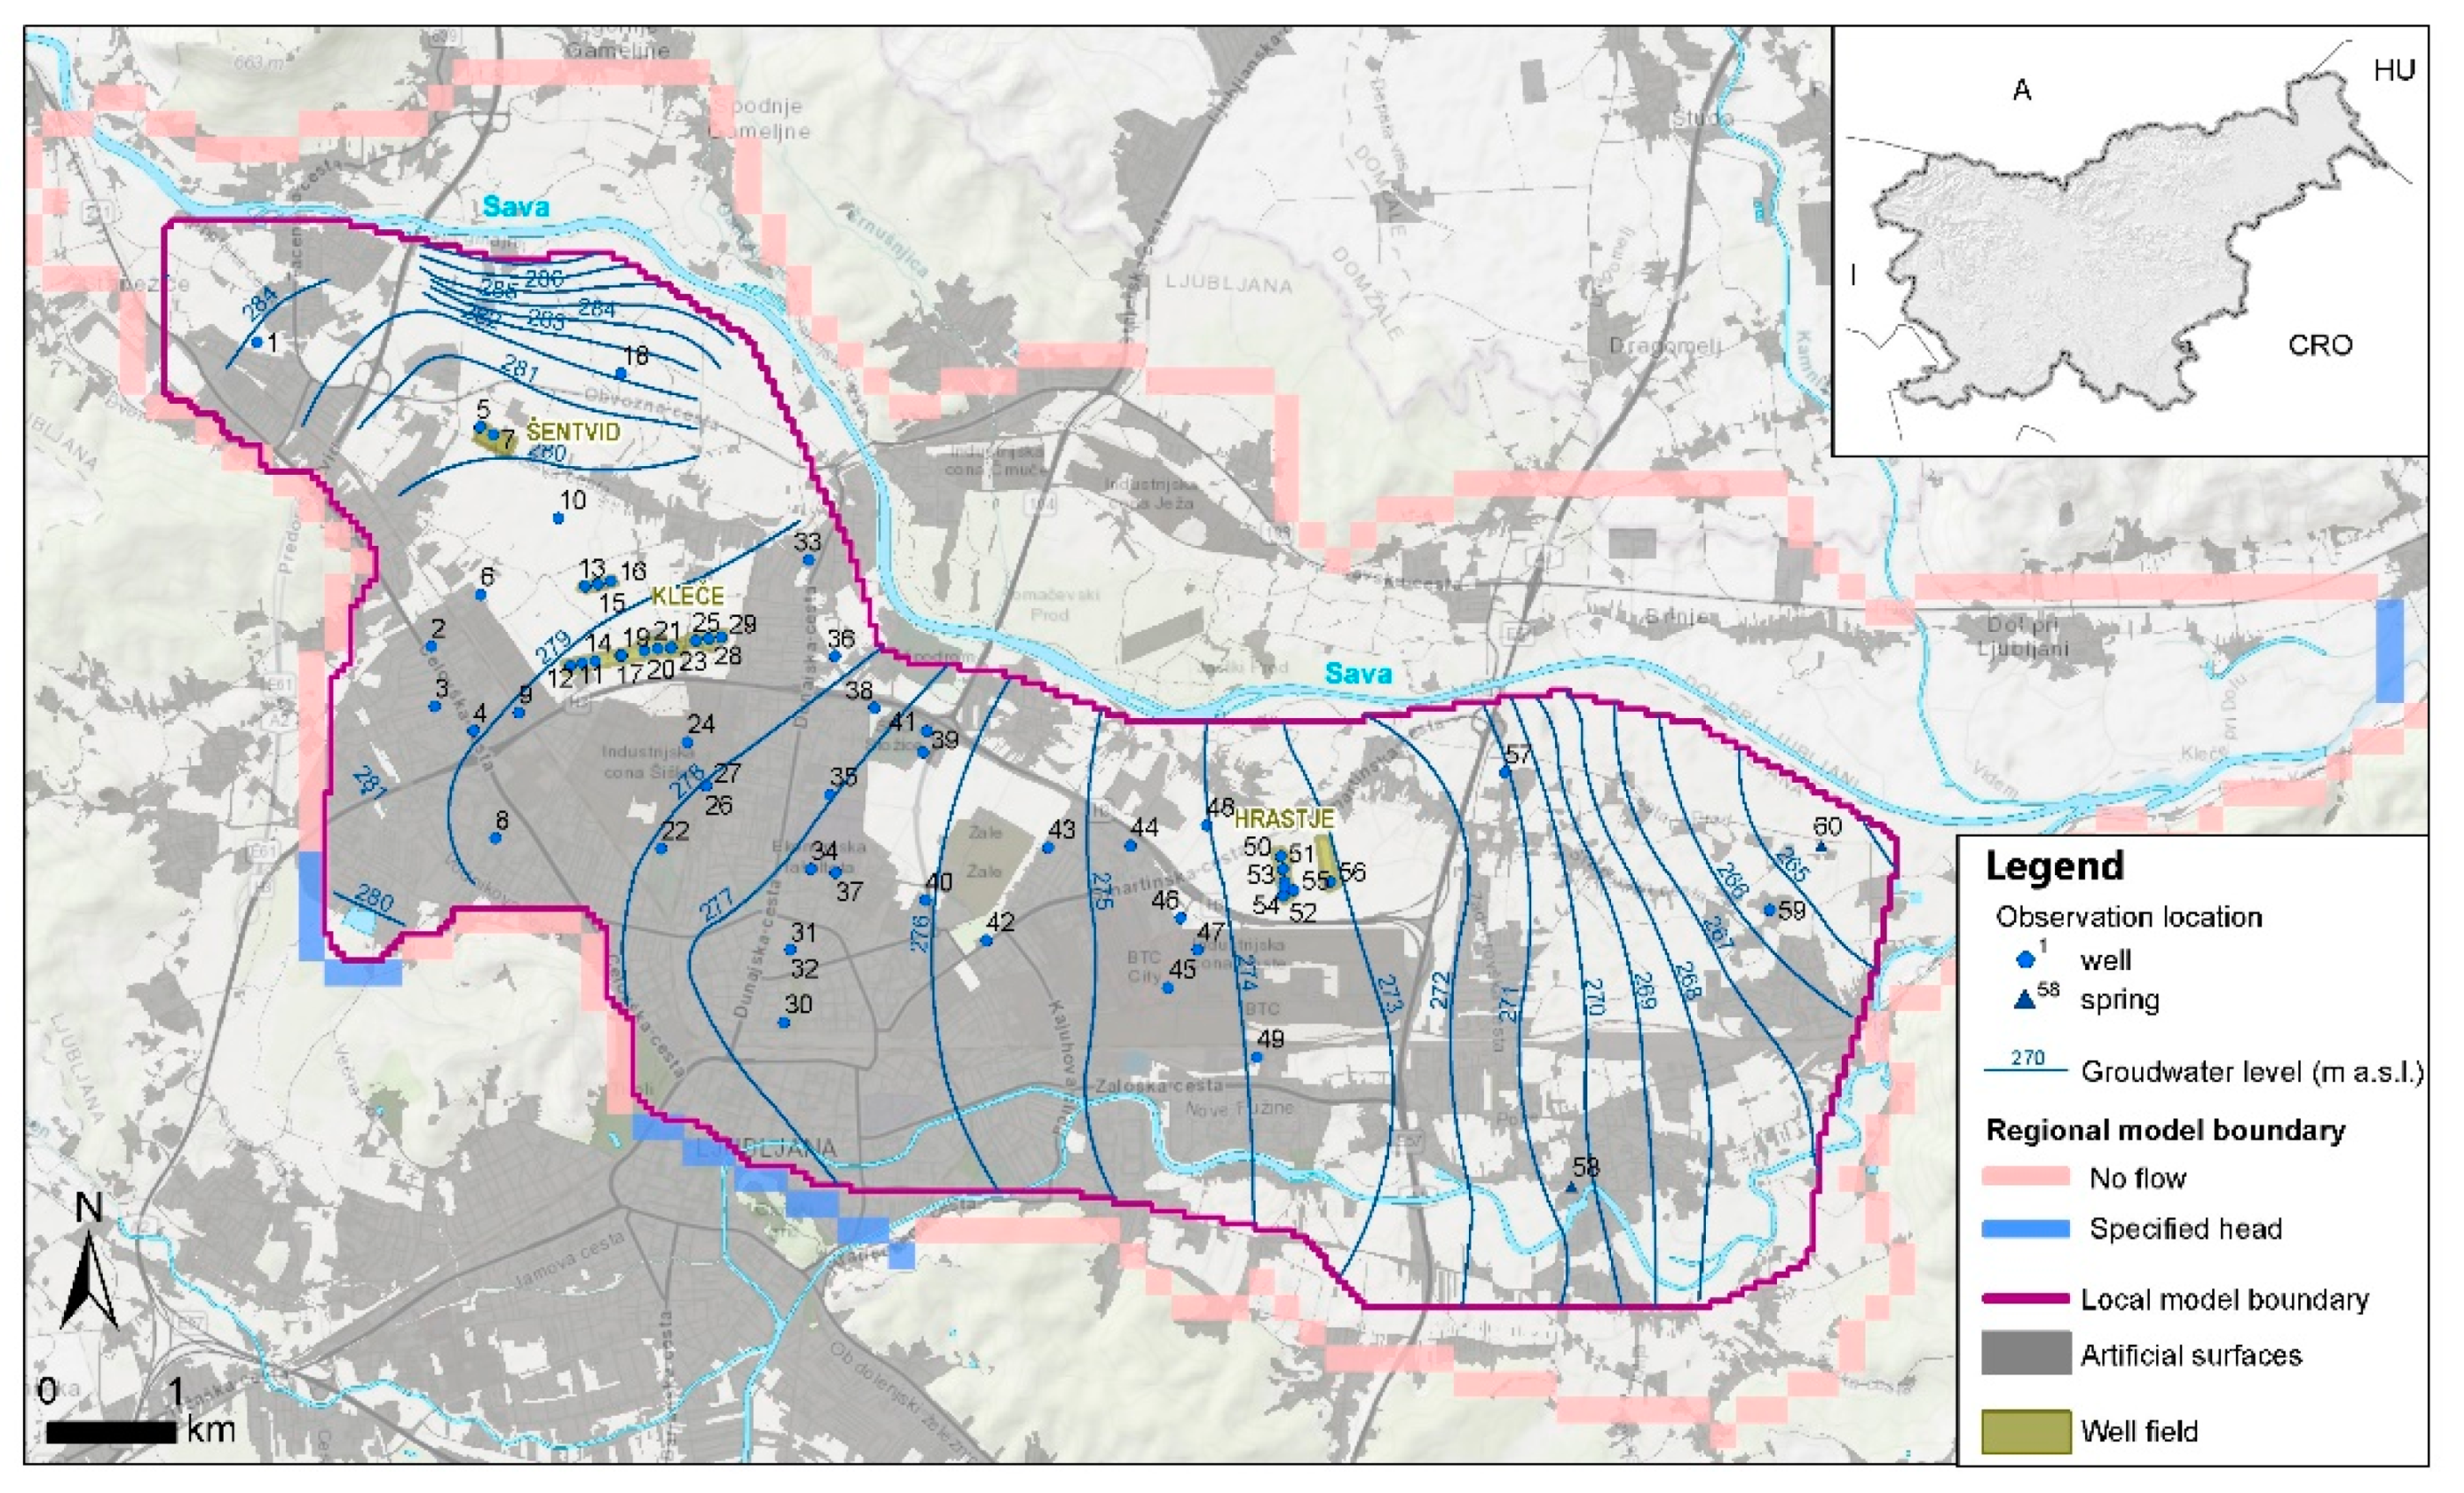
The drinking water supply of the City of Ljubljana relies on groundwater, primarily on its abstraction from the Ljubljansko polje aquifer, situated beneath the city. The well fields Kleče (55%), Hrastje (12%), and Šentvid (9%) (Figure 1) assure around three-quarters of all the water needs in Ljubljana’s drinking water supply system [34]. To determine the urban contamination in the Ljubljansko polje alluvial aquifer, an urban water balance modeling approach was applied [35]. The study focused on an area (approximately 0.76 km2) located within the City of Ljubljana, and indicated that residential land use in an urban area with a high unsaturated thickness may have a significantly smaller impact on groundwater quality than agriculture or industry.
The first catchment scale pressure impact model for the Ljubljansko polje aquifer was developed in the frame of the INCOME project [36]. The aim of the model was to simulate the concentrations in groundwater for a number of pollutants. The model was able to explain practically the entire mass of nitrogen in the sewer system by the known sources. On the basis of these results and an encouraging decrease of observed nitrate concentration in groundwater, more optimistic groundwater management objectives for the year 2017 were set. The targeted average nitrate concentration in the aquifer was set below 15 mg/L and in all observation wells below 25 mg/L [37]. Nitrogen input from agriculture was identified as the most important source of uncertainty in the model. The explanation of high nitrate concentration at the local level, that is, individual observation wells, was pointed out as an important groundwater management activity.
In the present study, a refined and updated groundwater flow and transport model [38] was applied in the catchment scale approach. The aim of the modeling was to analyze the causal relationship between pressure (nitrogen load) arising from the leaky sewer system and from agriculture, and its impact on the quality of groundwater (nitrate concentration) in the Ljubljansko polje aquifer [39]. Nitrogen load from the leaky sewer system was estimated with the empirical model of spatially distributed sewer exfiltration [40] and together with estimated nitrogen surpluses from agriculture [41] used as input into the groundwater transport model. Modeled and observed nitrate concentrations in groundwater were analyzed to assess the uncertainty of the model and to identify priority areas for remediation.
2. Materials and Methods
2.1. Study Area
The study area (57.91 km2) is located in the flat part of the catchment of the alluvial Ljubljansko polje aquifer forming the subsurface of the City of Ljubljana, the capital of Slovenia. It corresponds to the area of the local groundwater model (Figure 1). The mean altitude of the area is 292 m above sea level (m a.s.l.) and prevailing land cover types are artificial surfaces (59%) and agricultural areas (39%) [42].
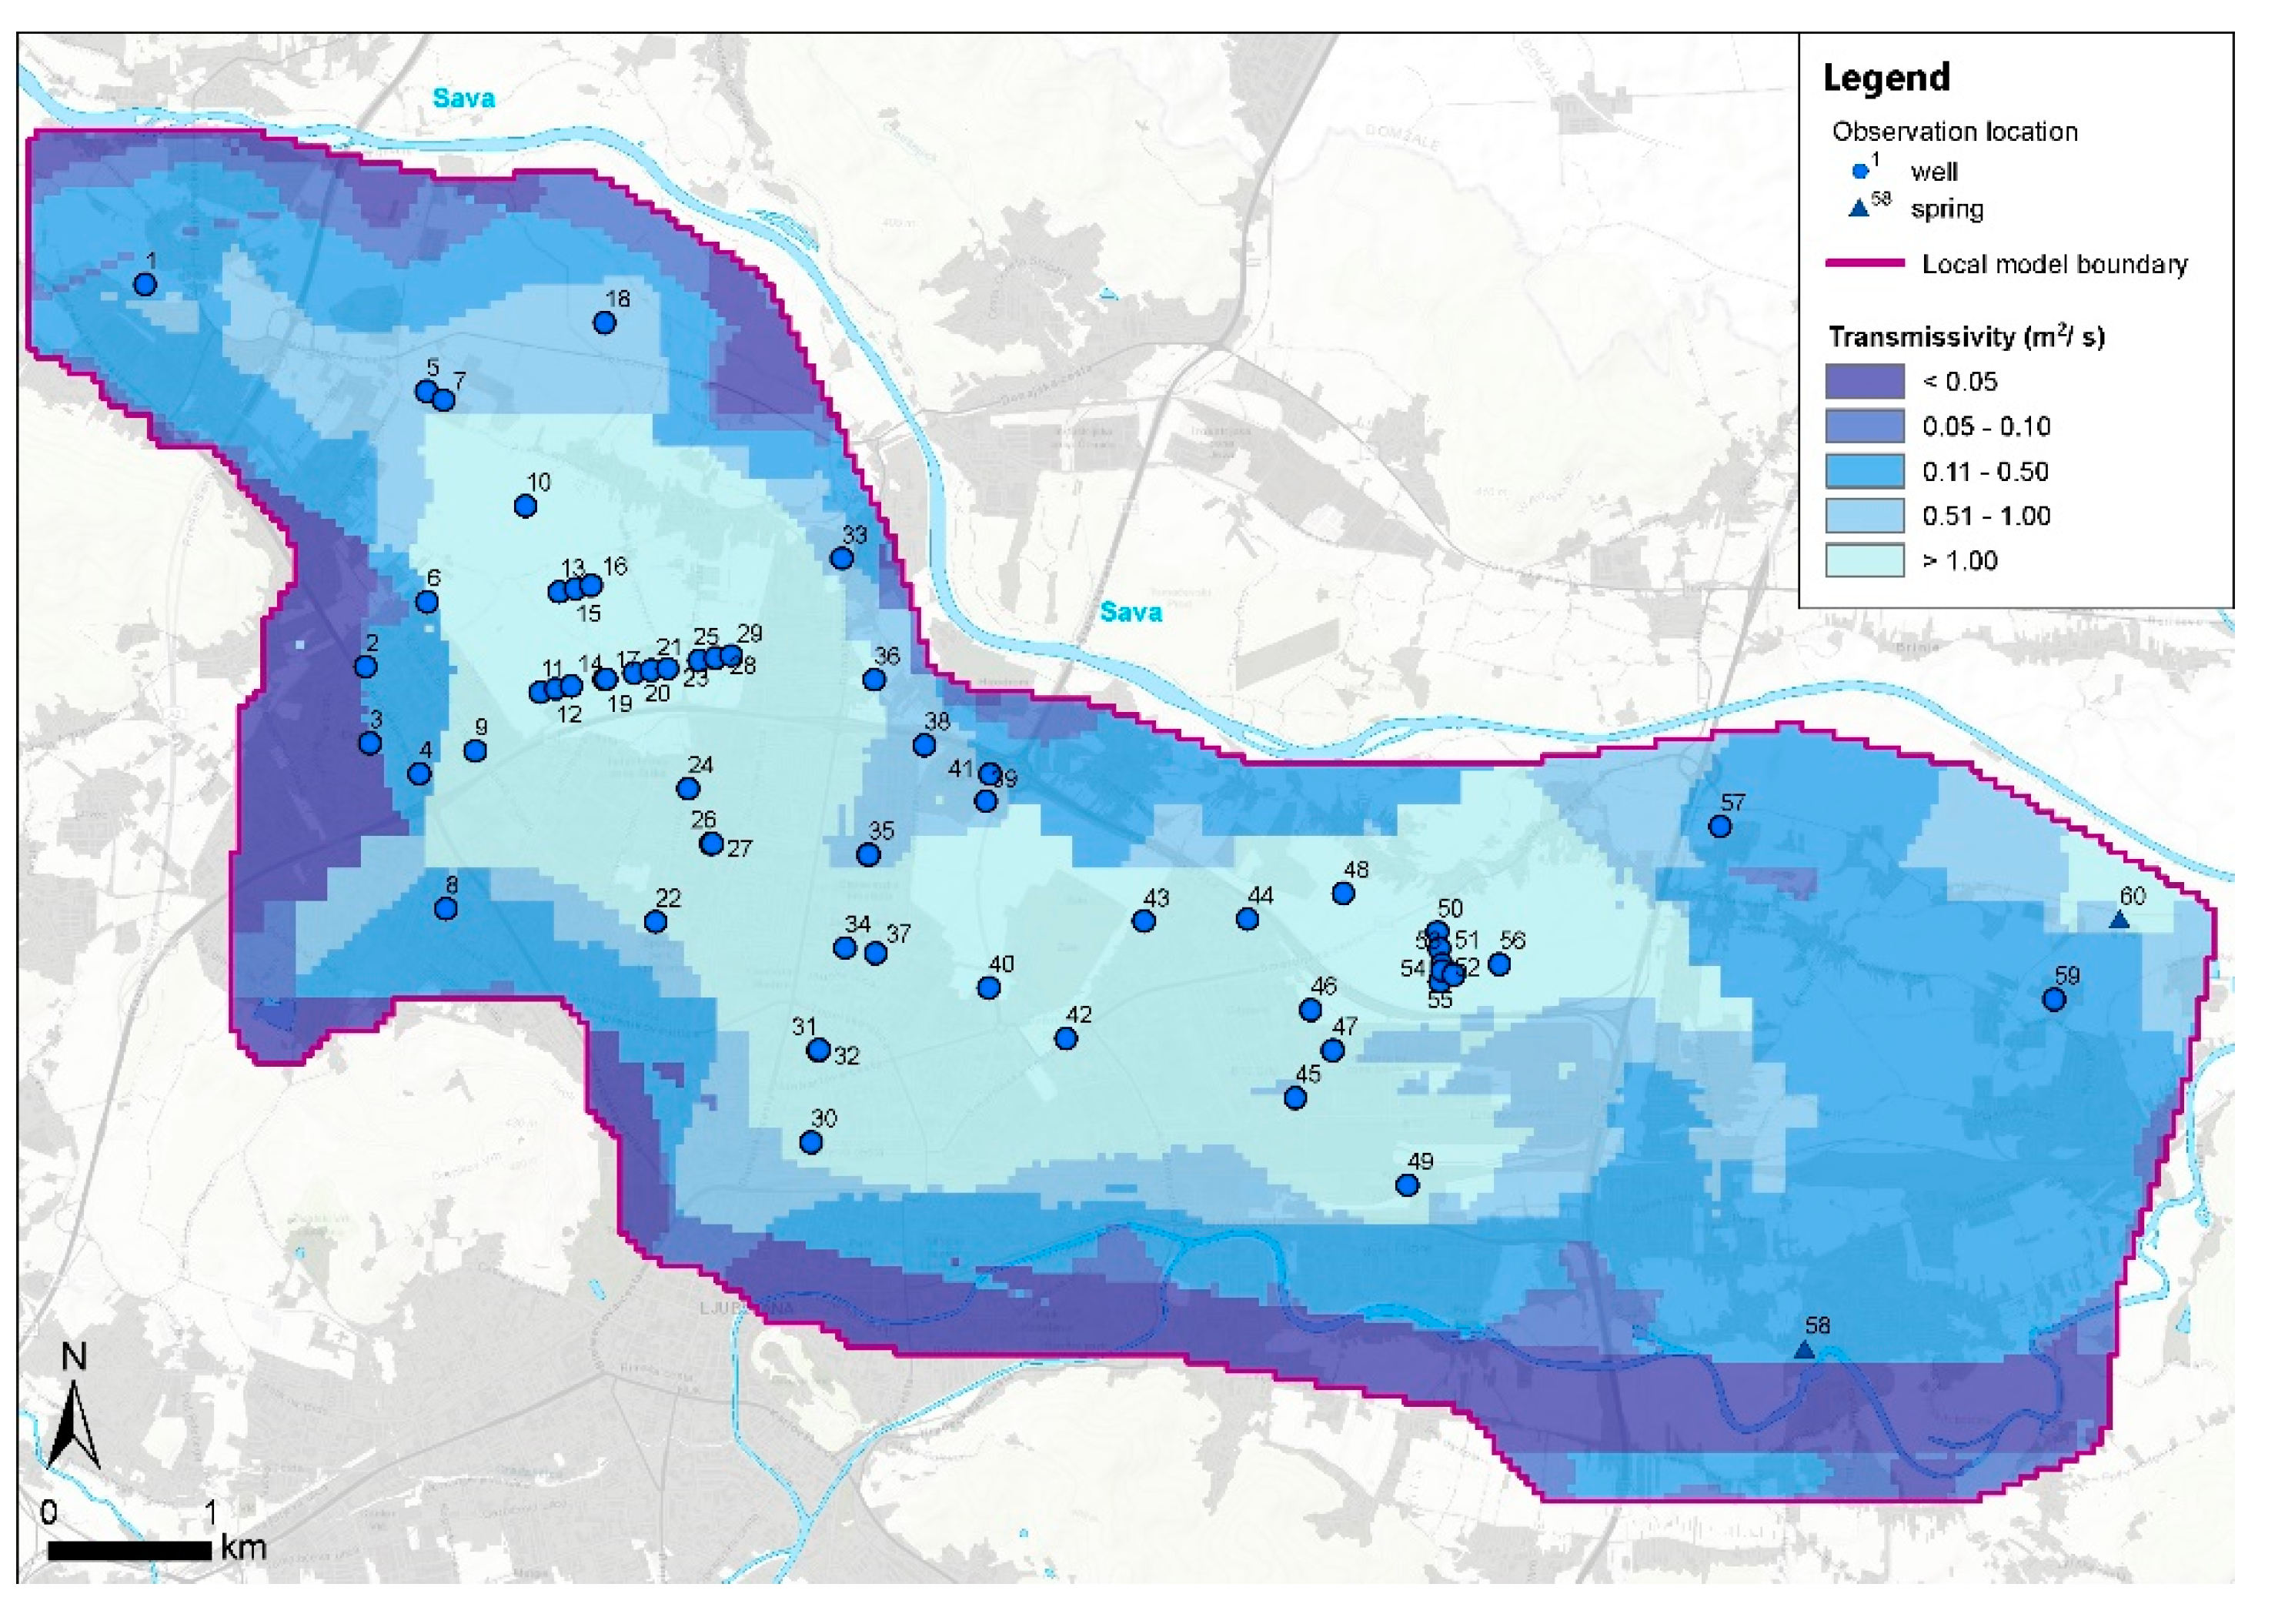
The Ljubljansko polje alluvial aquifer is developed in a tectonic basin, filled with highly permeable Quaternary gravel and sand beds, which are partly conglomerated (cemented with calcite cement) [43]. The thickness of the sedimentary fill is up to 100 m down to its very low permeable pre-Quaternary basement, composed of Carboniferous–Permian siliciclastic rocks. The groundwater table is on average 25 m below the surface. The unconfined intergranular aquifer with high transmissivity (Figure 2) is mainly recharged from the Sava River in the northwestern part of the study area. It drains into the river in the northwestern part, which largely predisposes the groundwater flow direction (Figure 1). The main water balance components of the regional model area (Figure 1) for the 3 year modeling period (2013–2015) are presented in Table 1.
2.2. Nitrogen Mass Balance and Pressure Impact Model
The applied methodology [36,37,40] comprises the following main steps: (1) estimation of the spatial distribution of nitrogen load from the leaky sewer system and agriculture (nitrogen mass balance model), (2) use of the nitrogen load as input into the groundwater transport model, and (3) analysis of the modeling results with observed nitrate concentrations in the observation wells.
2.2.1. Nitrogen Load from the Leaky Sewer System
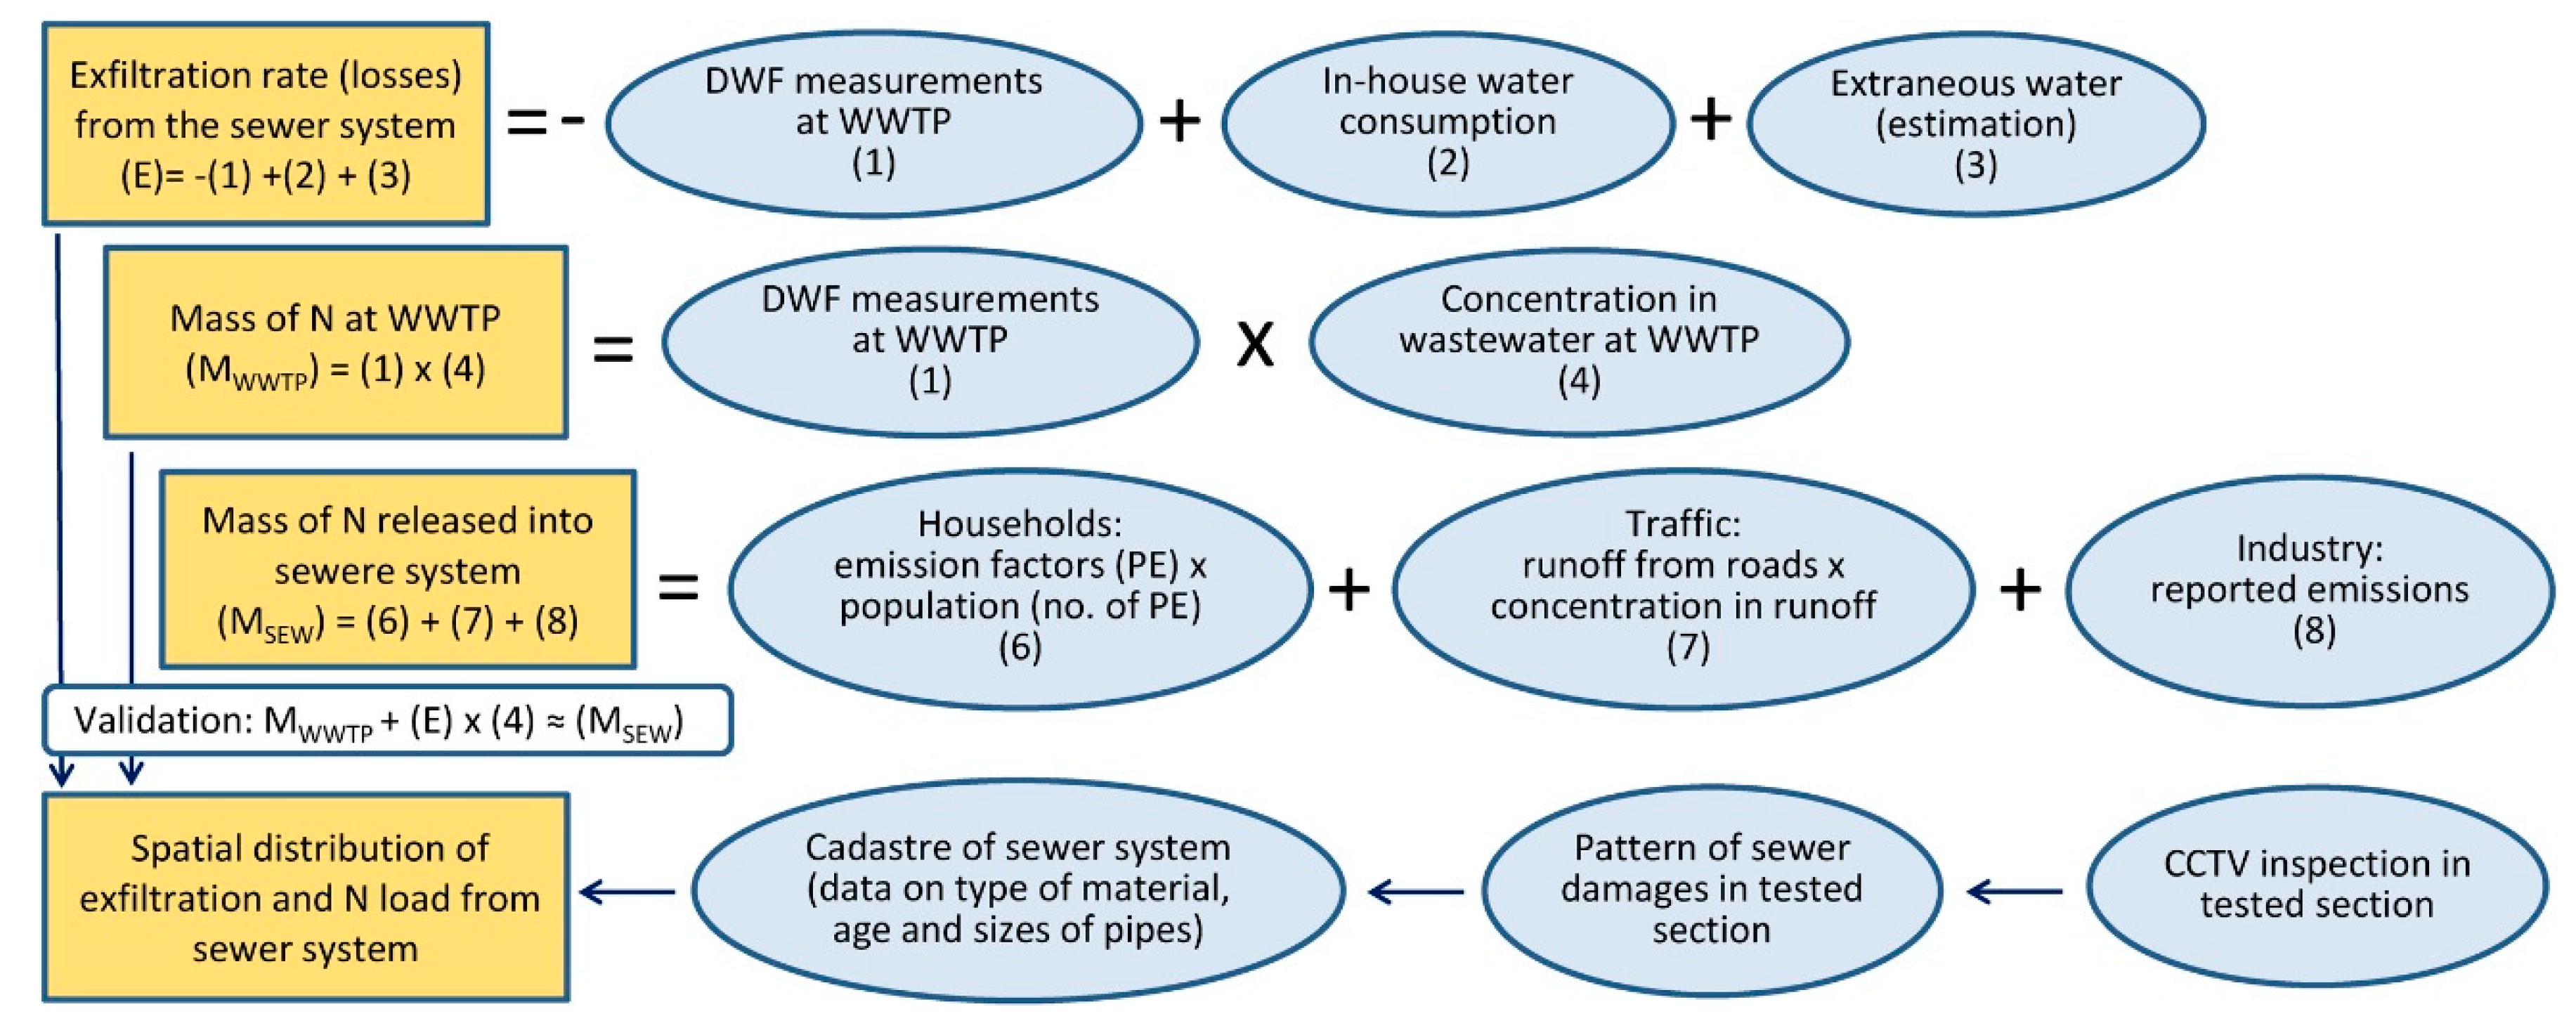
Assessment of nitrogen load from the leaky sewer system was based on the model of spatially distributed sewer exfiltration developed by Prestor et al. (2011) [36] for the sewer system of the City of Ljubljana. The main steps of workflow for the estimation of nitrogen load from the sewer system are presented in Figure 3. Firstly, the exfiltration rate (losses) from the sewer system was determined by the mass balance of wastewater released to sewer system and outflow from the sewer system. Then, the total mass of pollutant in the sewer system was calculated. In the next step, the exfiltration rate from the tested section of the sewer system was assessed and then upscaled to the spatial distribution of exfiltration of the entire sewer system.
Exfiltration Rate (Losses) from the Sewer System
Daily flow rate measurements at the wastewater treatment plant (WWTP) for the period 2000–2010 were compared with in-house water consumption for that period, provided by the drinking water supply and the wastewater system operator. In the analysis, 13 DWF measurements were used, mainly in the winter period, when rainfall infiltration and outdoor water use have a low influence on the sewer system water balance. Nevertheless, the measured flow rate at the WWTP exceeded the quantity of in-house water consumption, which indicated the presence of extraneous water. Estimation of the extraneous water was based on the assumption that 0.01 km2 of surface in the catchment of WWTP contributes 0.05 L/s of inflow of water [44], which accounted for the entire catchment 276.6 L/s. On the basis of this, the exfiltration rate from the entire sewer system in the catchment of WWTP was estimated to be 168 L/s (on average 0.21 L/s/km) [40].
Mass of Nitrogen in Wastewater
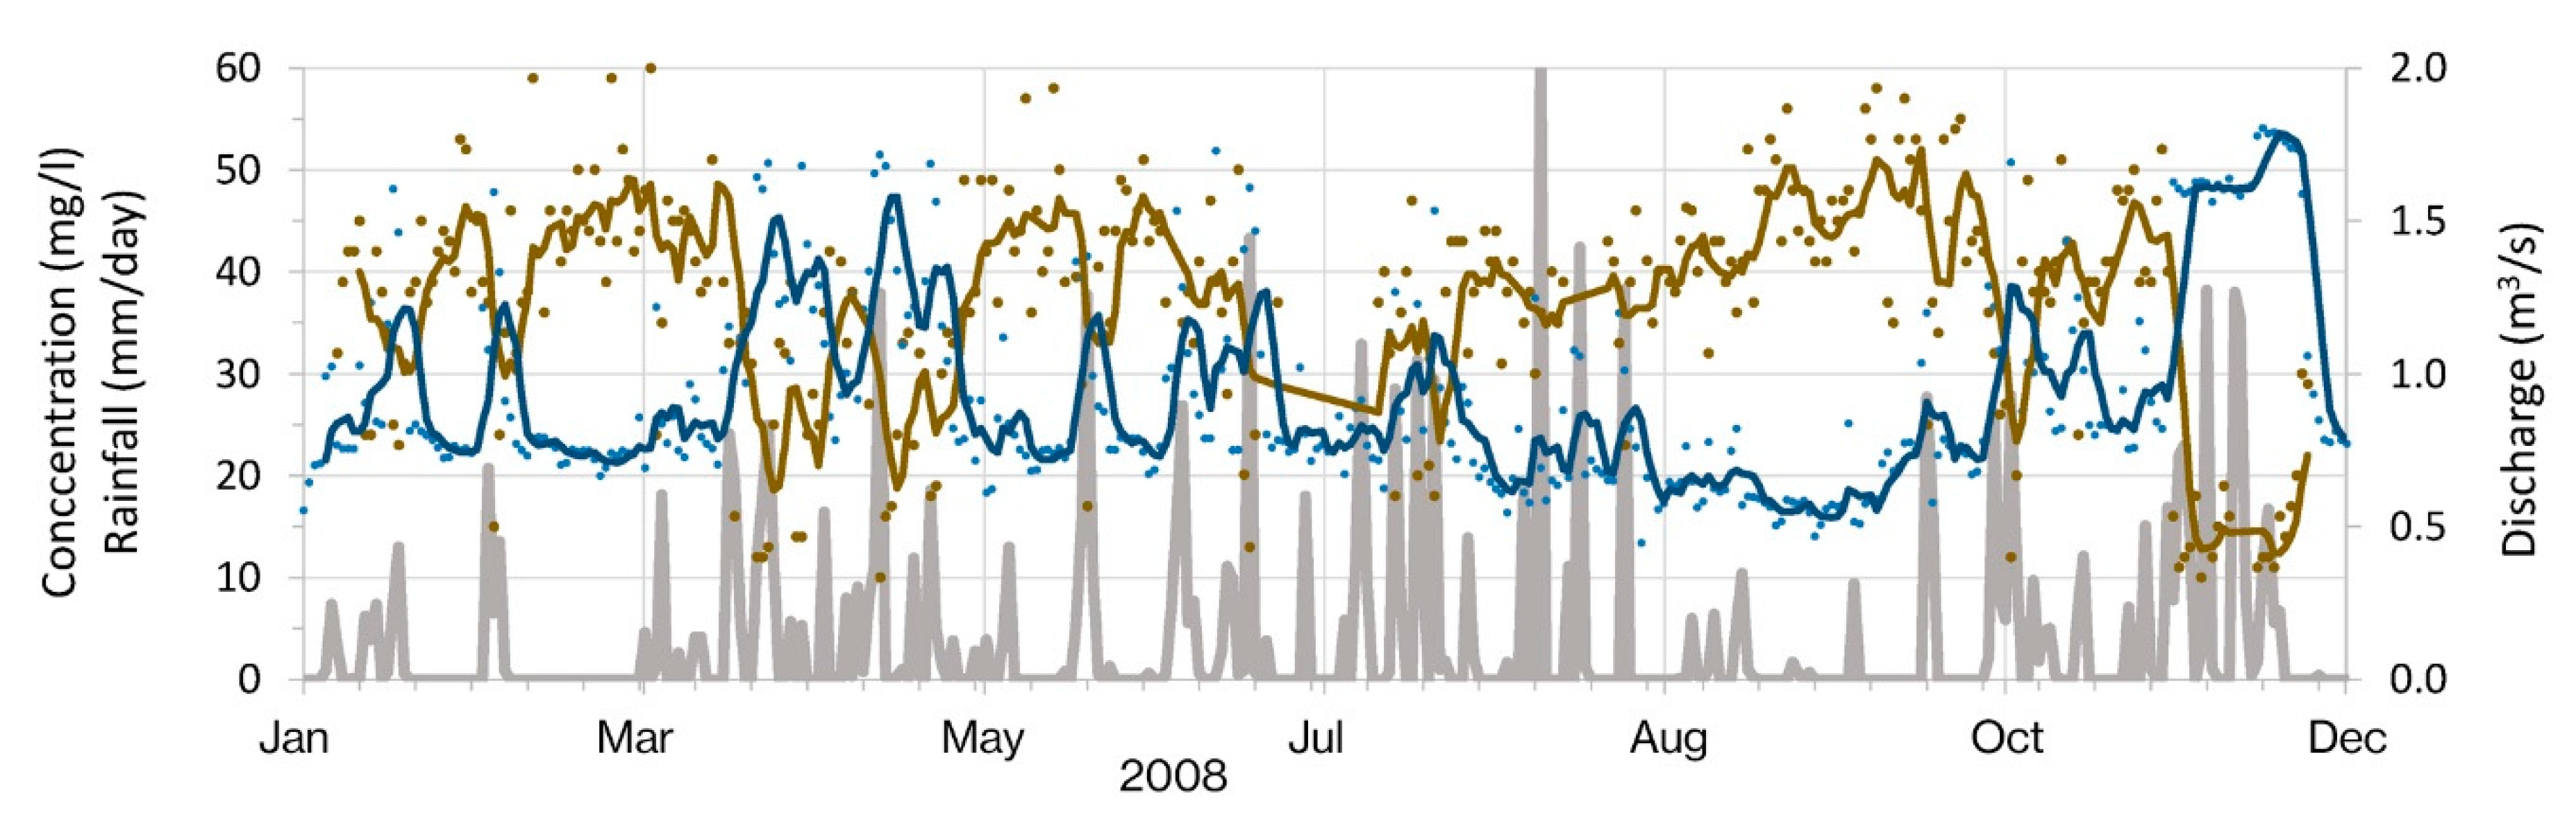
The estimation of the mass of nitrogen in water is based on the mass balance model [36,37]. The aim of this model was to investigate the shares of known and unknown sources of different pollutants (e.g., nitrogen, phosphorus, chloride, sulphate, copper, chromium, lead, organic carbon) in the sewer system. The mass of pollutants released into sewer system was calculated in the model as a sum of inputs from households, from roads and other traffic surfaces, and from industry. The model results were compared with two extensive analyses of chemical composition of wastewater at WWTP, made in 2008. More frequent measurements were performed only for nitrogen. The concentration of total nitrogen was correlated with discharge and both varied over time depending on the amount of rainfall (Figure 4). The yearly mass of other pollutants discharged at WWTP was a product of discharge and concentrations defined in the two mentioned analyses. Data from the first analysis was used as representative for the dry-weather periods (121 days), and from the second measurement as representative for the wet periods (121 days).
Spatial Distribution of Sewer Exfiltration
The model of spatial distribution of sewer exfiltration [36] was based on a detailed inspection of a 14.82 km section of the sewer system, which represents 2% of the entire sewer system. Closed-circuit television (CCTV) provided by the sewer system operator was used to detect the pattern of sewer damages in this section. Among 1246 detected damages, 104 were selected as significant and characterized in more detail to quantify exfiltration. This pattern and information on type of material, age, and size of pipes [45] were used to estimate the spatial distribution of the exfiltration and nitrogen load from the entire sewer system (Table 2).
For the calculation of the exfiltration flow rate from the leaky areas, an approach based on Darcy’s law was used. It assumes linear dependency between the hydraulic gradient (I), the hydraulic conductivity of the clogging layer (kf), the leakage area of the pipe (Aleak), and the exfiltration flow rate (Qex) [46]:
where the hydraulic gradient (I) is the ratio between the sum of the water level inside the sewer (hs) and the pipe wall thickness (hw), and the pipe wall thickness (hw):
Qex = kf × Aleak × I
I = (hs + hw)/hw
In the calculation, three different hydraulic conditions in the pipelines were considered: (1) dry-weather conditions, days with mainly waste water discharge from water consumers (DWF); (2) days with significant rainfall inflow; and (3) extreme storms events with very high rainfall inflow. An analysis of rainfall data of a 10 year period (2000–2010) was performed. It showed that on average, in 1 year, DWF conditions last for 146 days, significant rainfall inflow occurs in 218 days, and once a year extreme storms are expected. It was assumed that sewer pipes are 10% full in DWF period, 50% in significant inflow period, and 100% in storm events (Figure 5). These data were used together with data on the diameter of pipes and a representative sample of damages for different materials and ages of pipes to calculate the spatial distribution of yearly exfiltration (Figure 6).
2.2.2. Nitrogen Load from Agriculture
Nitrogen load from agriculture used in the model was the nitrogen surplus calculated as the difference between nitrogen added to an agricultural land (mineral fertilizers, livestock manure, atmospheric deposition, and mineralization of organic matter) and nitrogen removed from the agricultural land (removed field crops and denitrification in the soil) [41]. On the basis of literature and statistical data, the nitrogen mass balance for different agricultural land use areas (arable fields, vineyards, orchards, and meadows and pastures) was calculated, and the results were provided in the polygon information layer. These data were used to generate a model input grid (Figure 7).
2.2.3. Groundwater Transport Model
Groundwater flow and transport simulations were carried out using the MIKE SHE/MIKE 11 modeling framework [47], which enabled transient simulation of the most important processes of the hydrological cycle in the study area. The solute transport model used in the study [38] is a refined and local version of the calibrated regional hydrological model [48]. The regional model (Figure 1) is a spatially distributed (200 m grid cells) and transient model with implemented daily values of time-dependent variables (temperature, precipitation, river levels and discharges at boundaries, groundwater level observations, abstractions, and leakage from the water supply system). The calibration and validation of the model was based on a comparison of the observed and simulated groundwater heads at the locations of 12 observation wells distributed over the entire study area, and the Sava River levels at one gauging station [48]. Additionally, the solute transport model was validated against the observed concentrations of the trichloroethylene pollution plume discovered in 2004 [49].
The local model (Figure 1) has one calculation layer and at boundaries uses hydraulic conditions from the regional model. Its model domain is discretized into horizontal grid cells of the size 50 × 50 m. The estimated nitrogen load was used as a spatially distributed, subsurface and constant mass input into the saturated zone of the aquifer. Neither retardation nor degradation processes were considered in the simulations. For the nitrate background concentration, 6 mg/L was used. This concentration is comparable to the lowest observed nitrate concentration (7.2 mg/L in observation location 18, Table S1 and is slightly higher than the observed concentration (4.9 mg/L) in the Sava River [50].
Scenarios for a 6 year simulation period (2010–2015) were performed. The last 3 years (2013–2015) of simulations were considered for the analysis. The first half of the simulation period was used for the model warm-up, which assured the avoidance of biased results affected by initial conditions.
3. Results
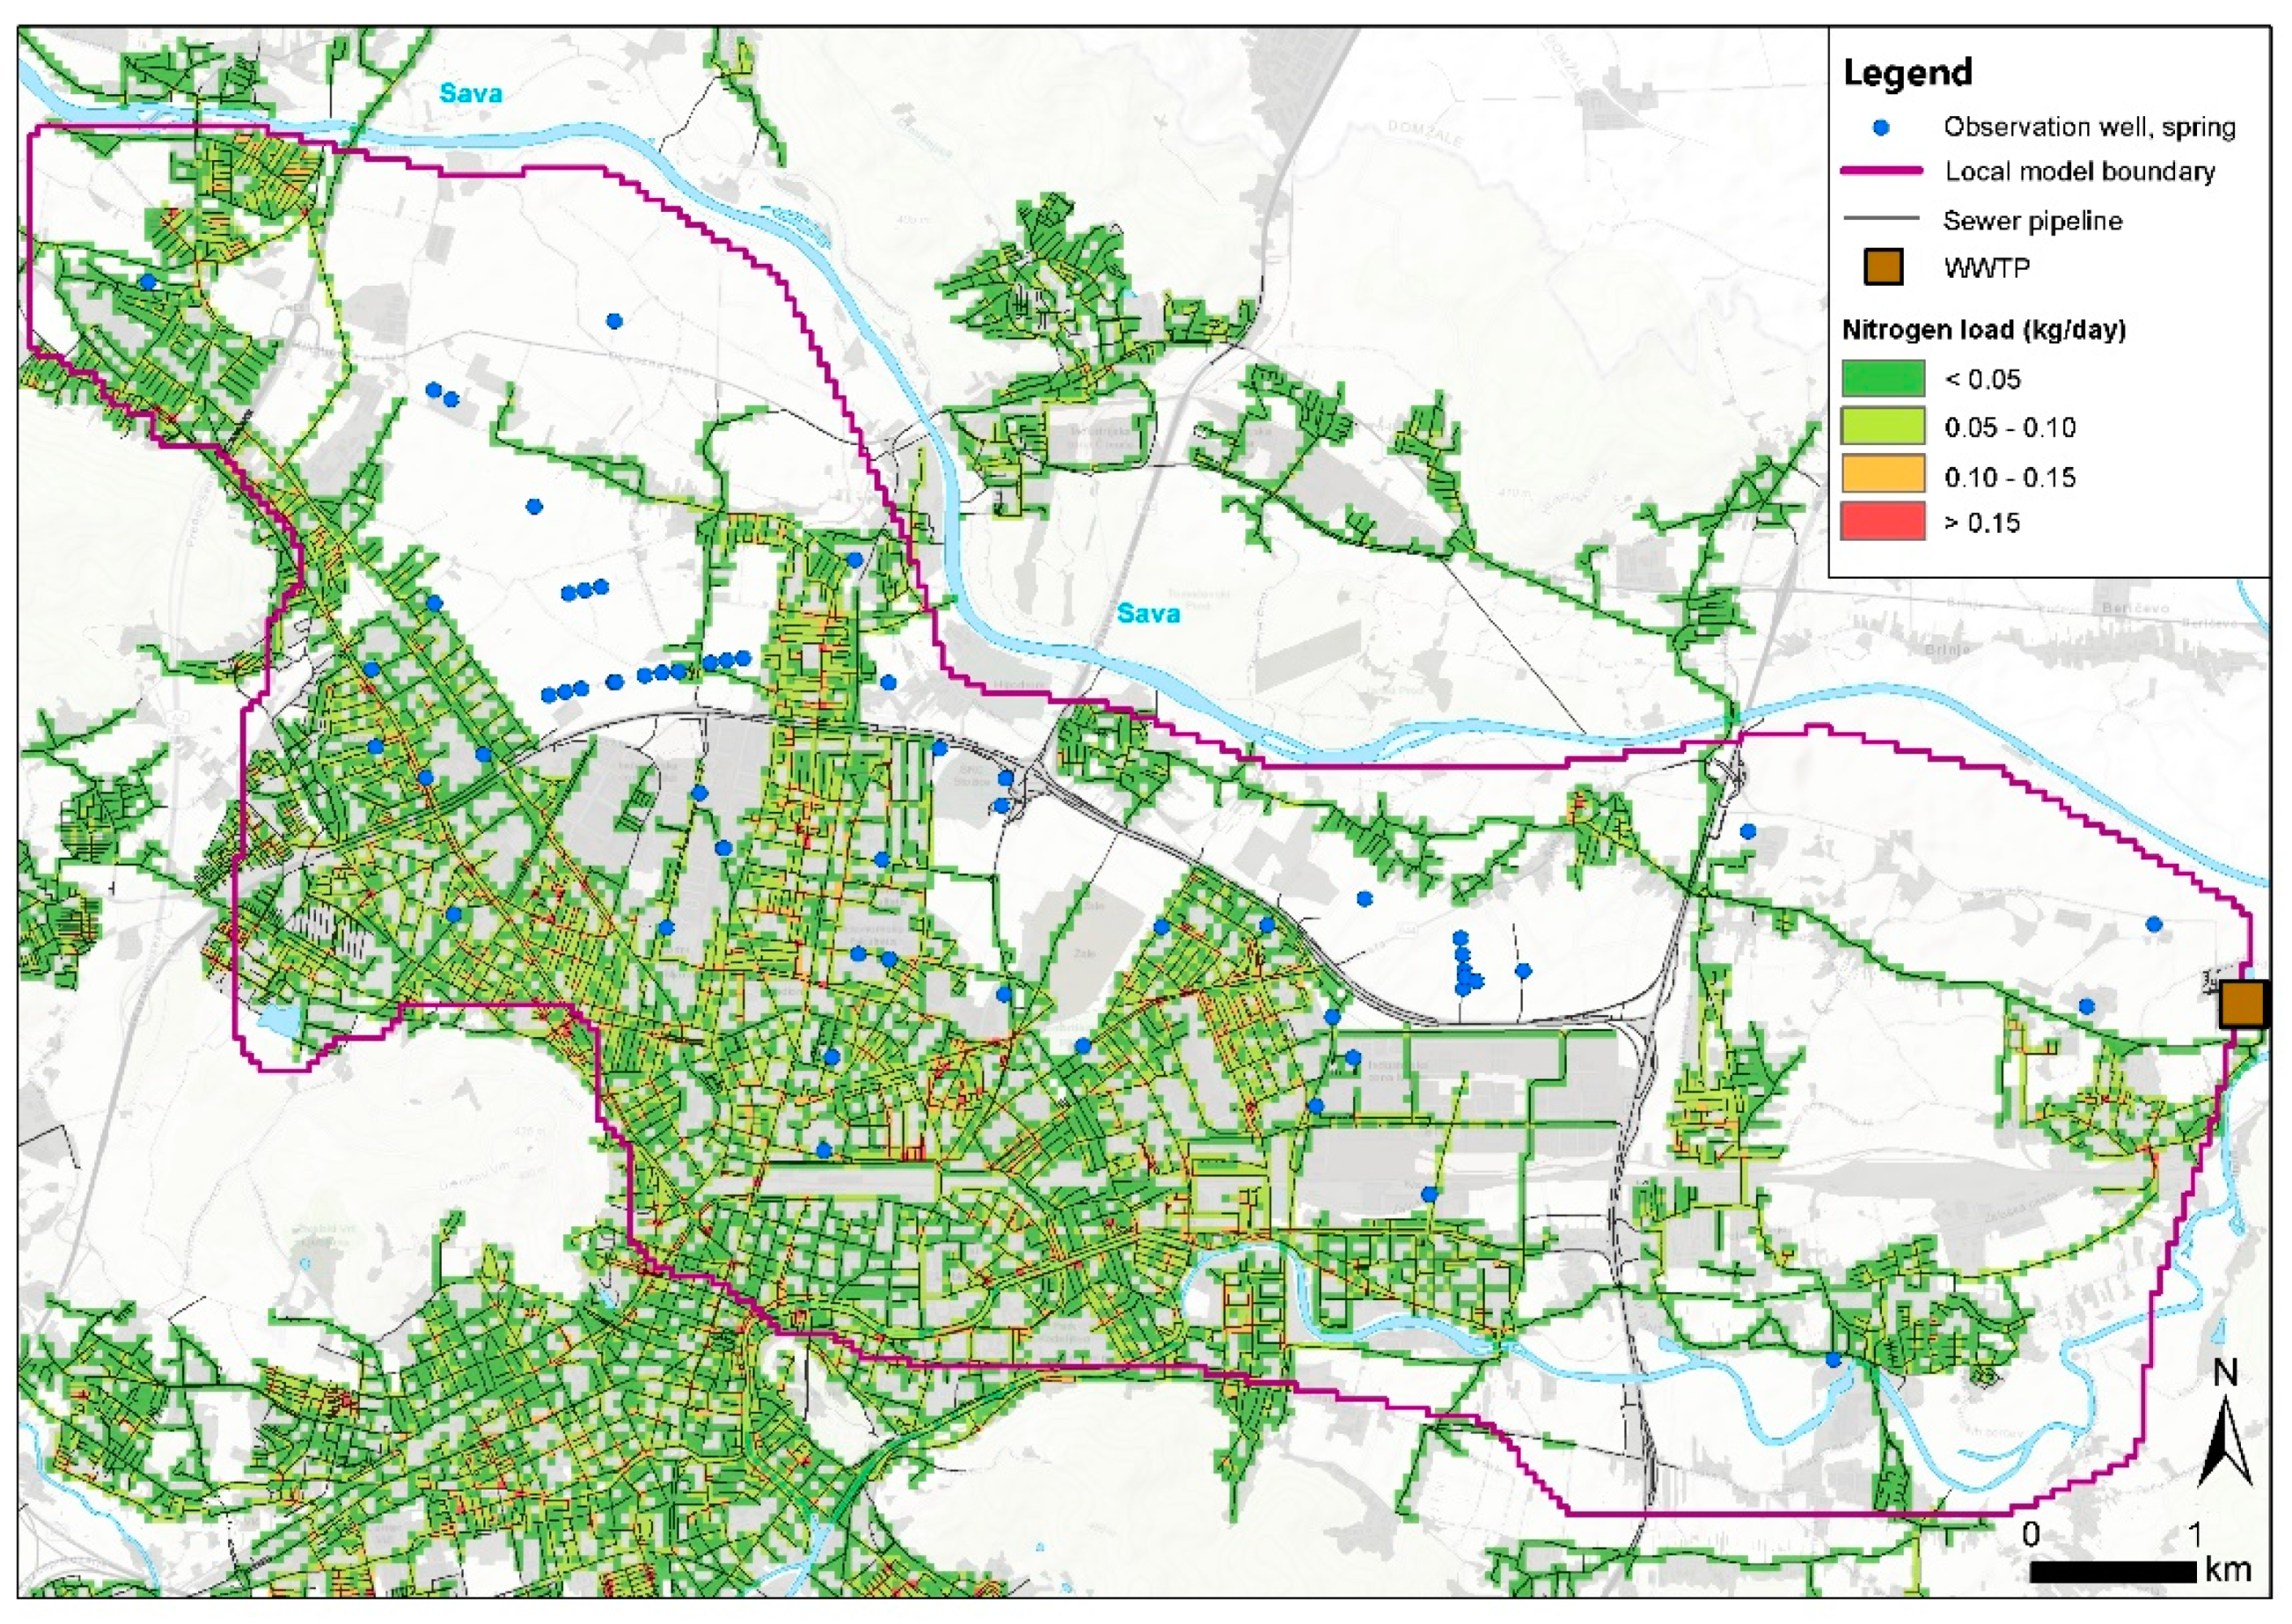
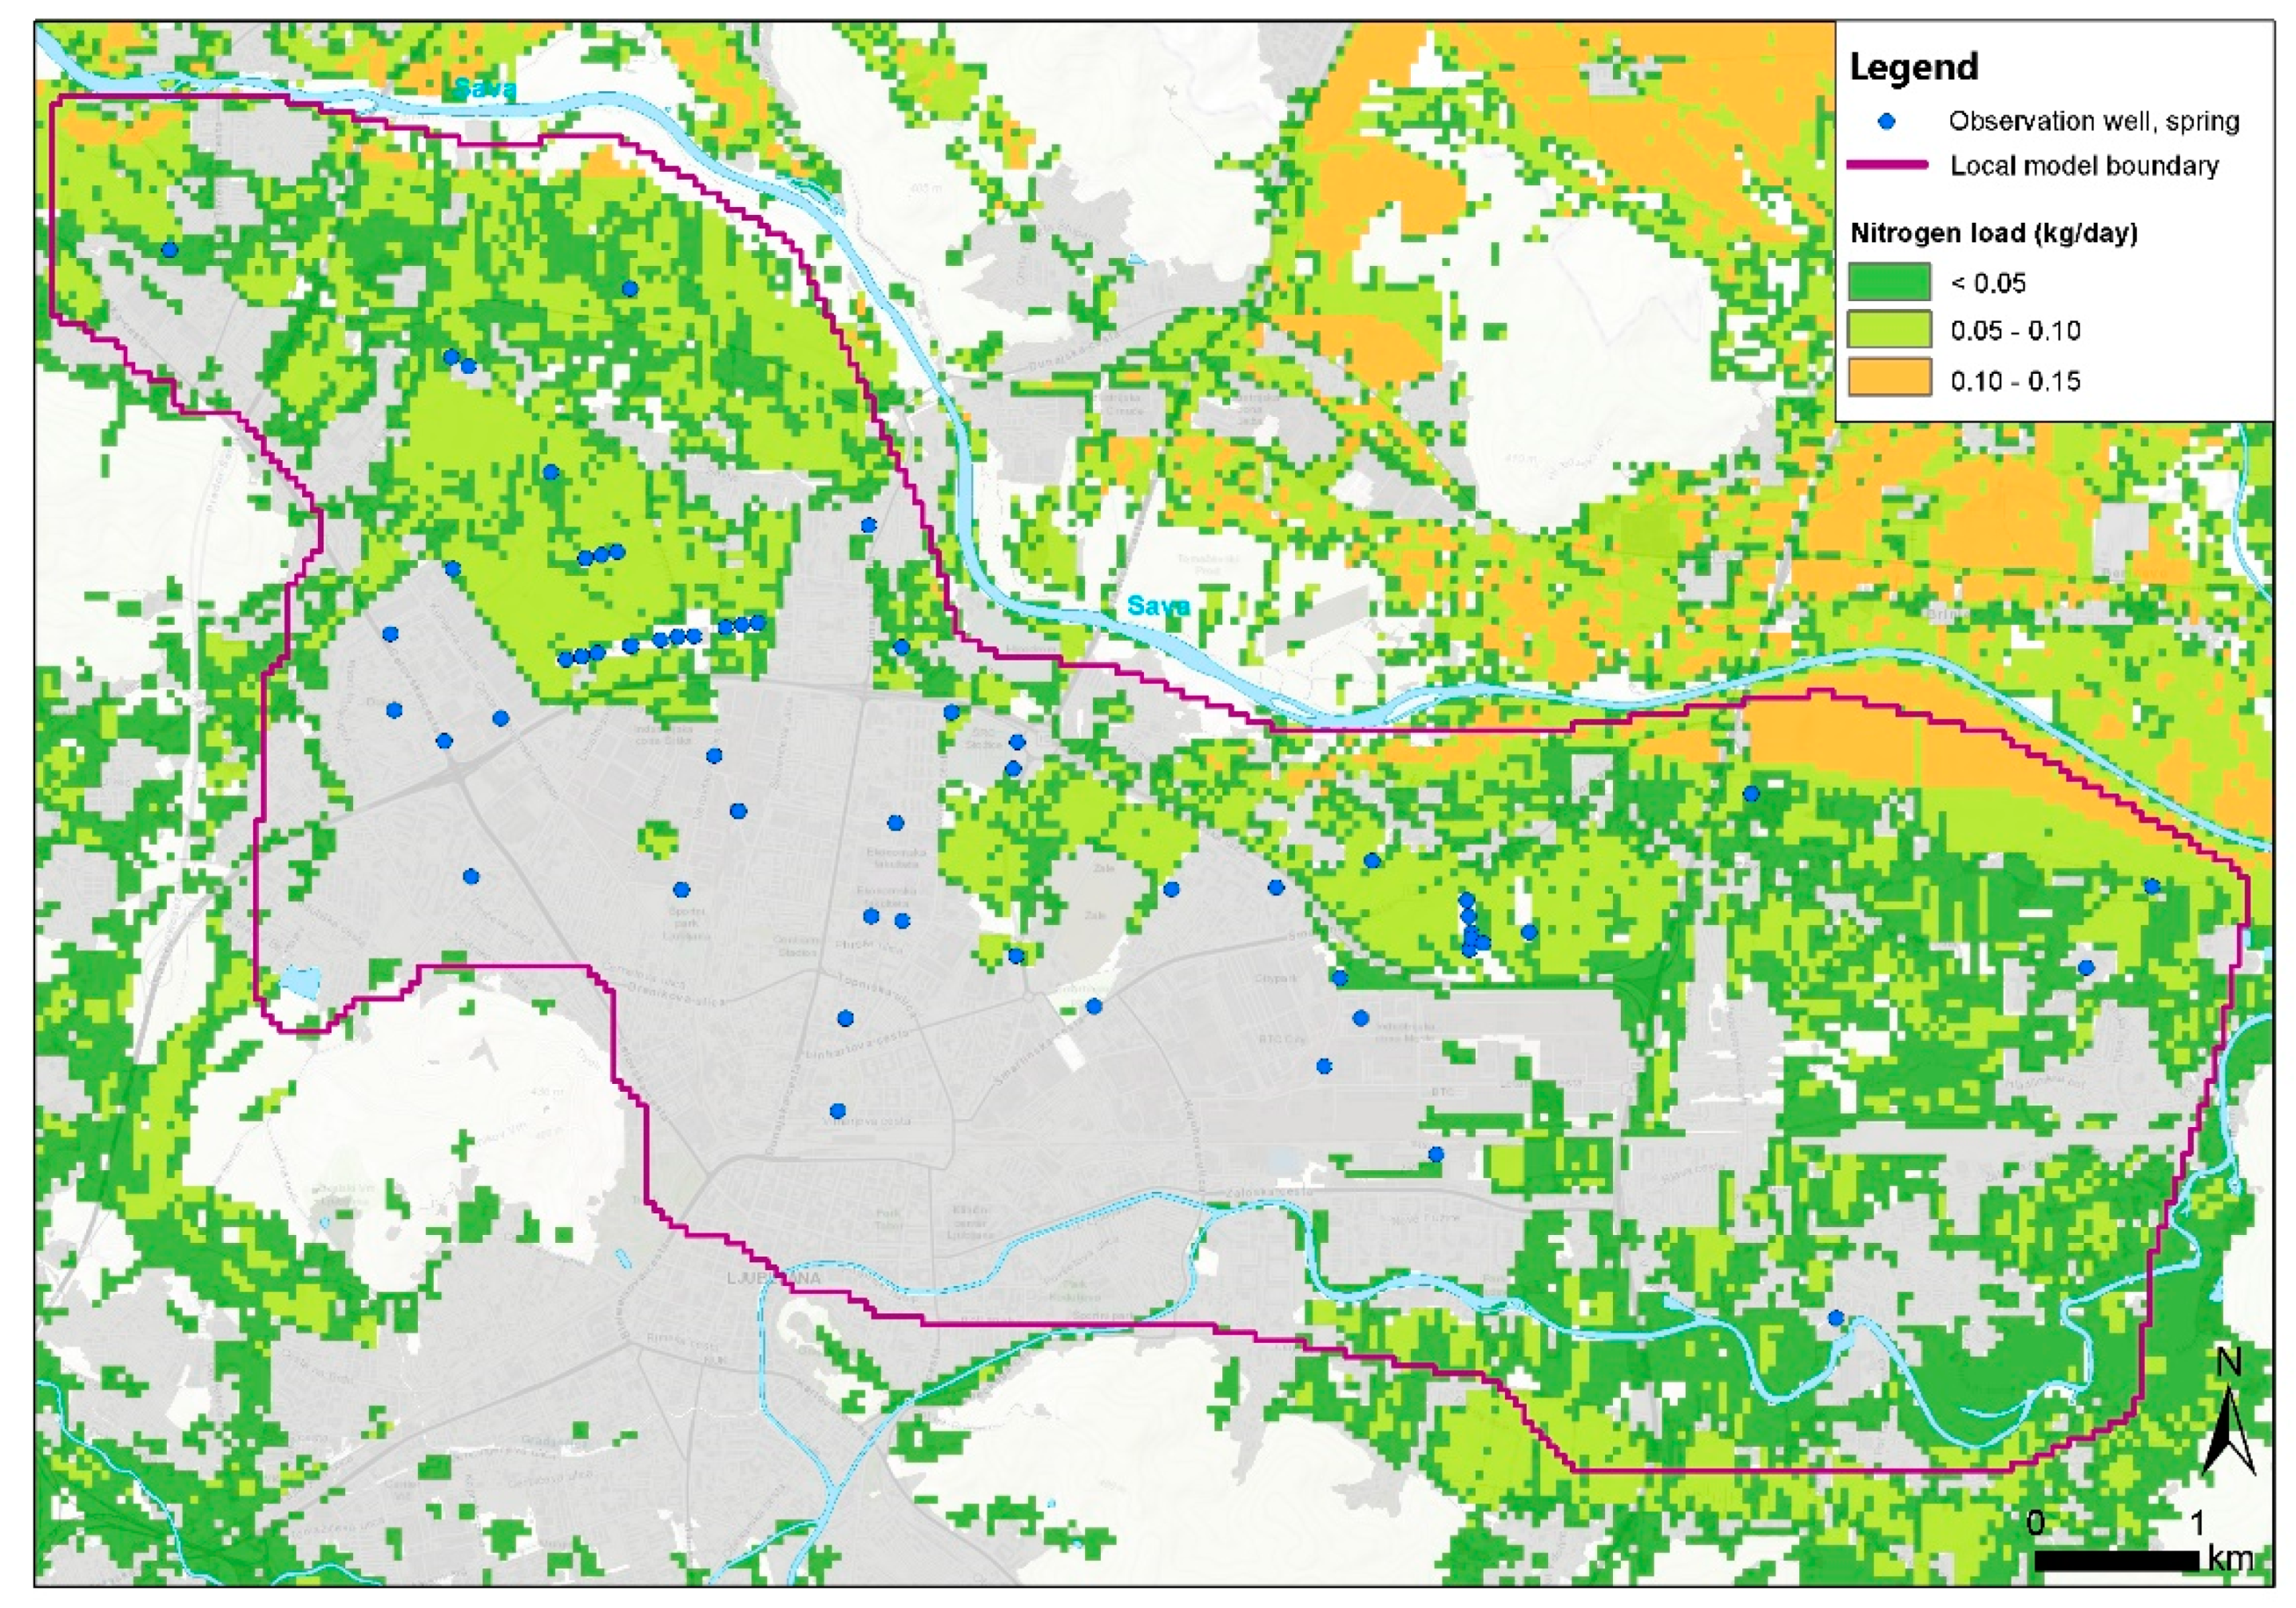
The estimated sources of nitrogen from the sewer system and from agriculture are distributed over an area of 19.84 km2 (34%) and 27.81 km2 (48% of model area), respectively. The mean nitrogen load in these model cells from the sewer system is 45 g/day and from agriculture is 52 g/day (Table 3). In the local model area of 58 km2, this accounts for a total nitrogen of 334.22 ton/year, 38% arising from the leaky sewer system (Figure 6) and 62% from agriculture (Figure 7).
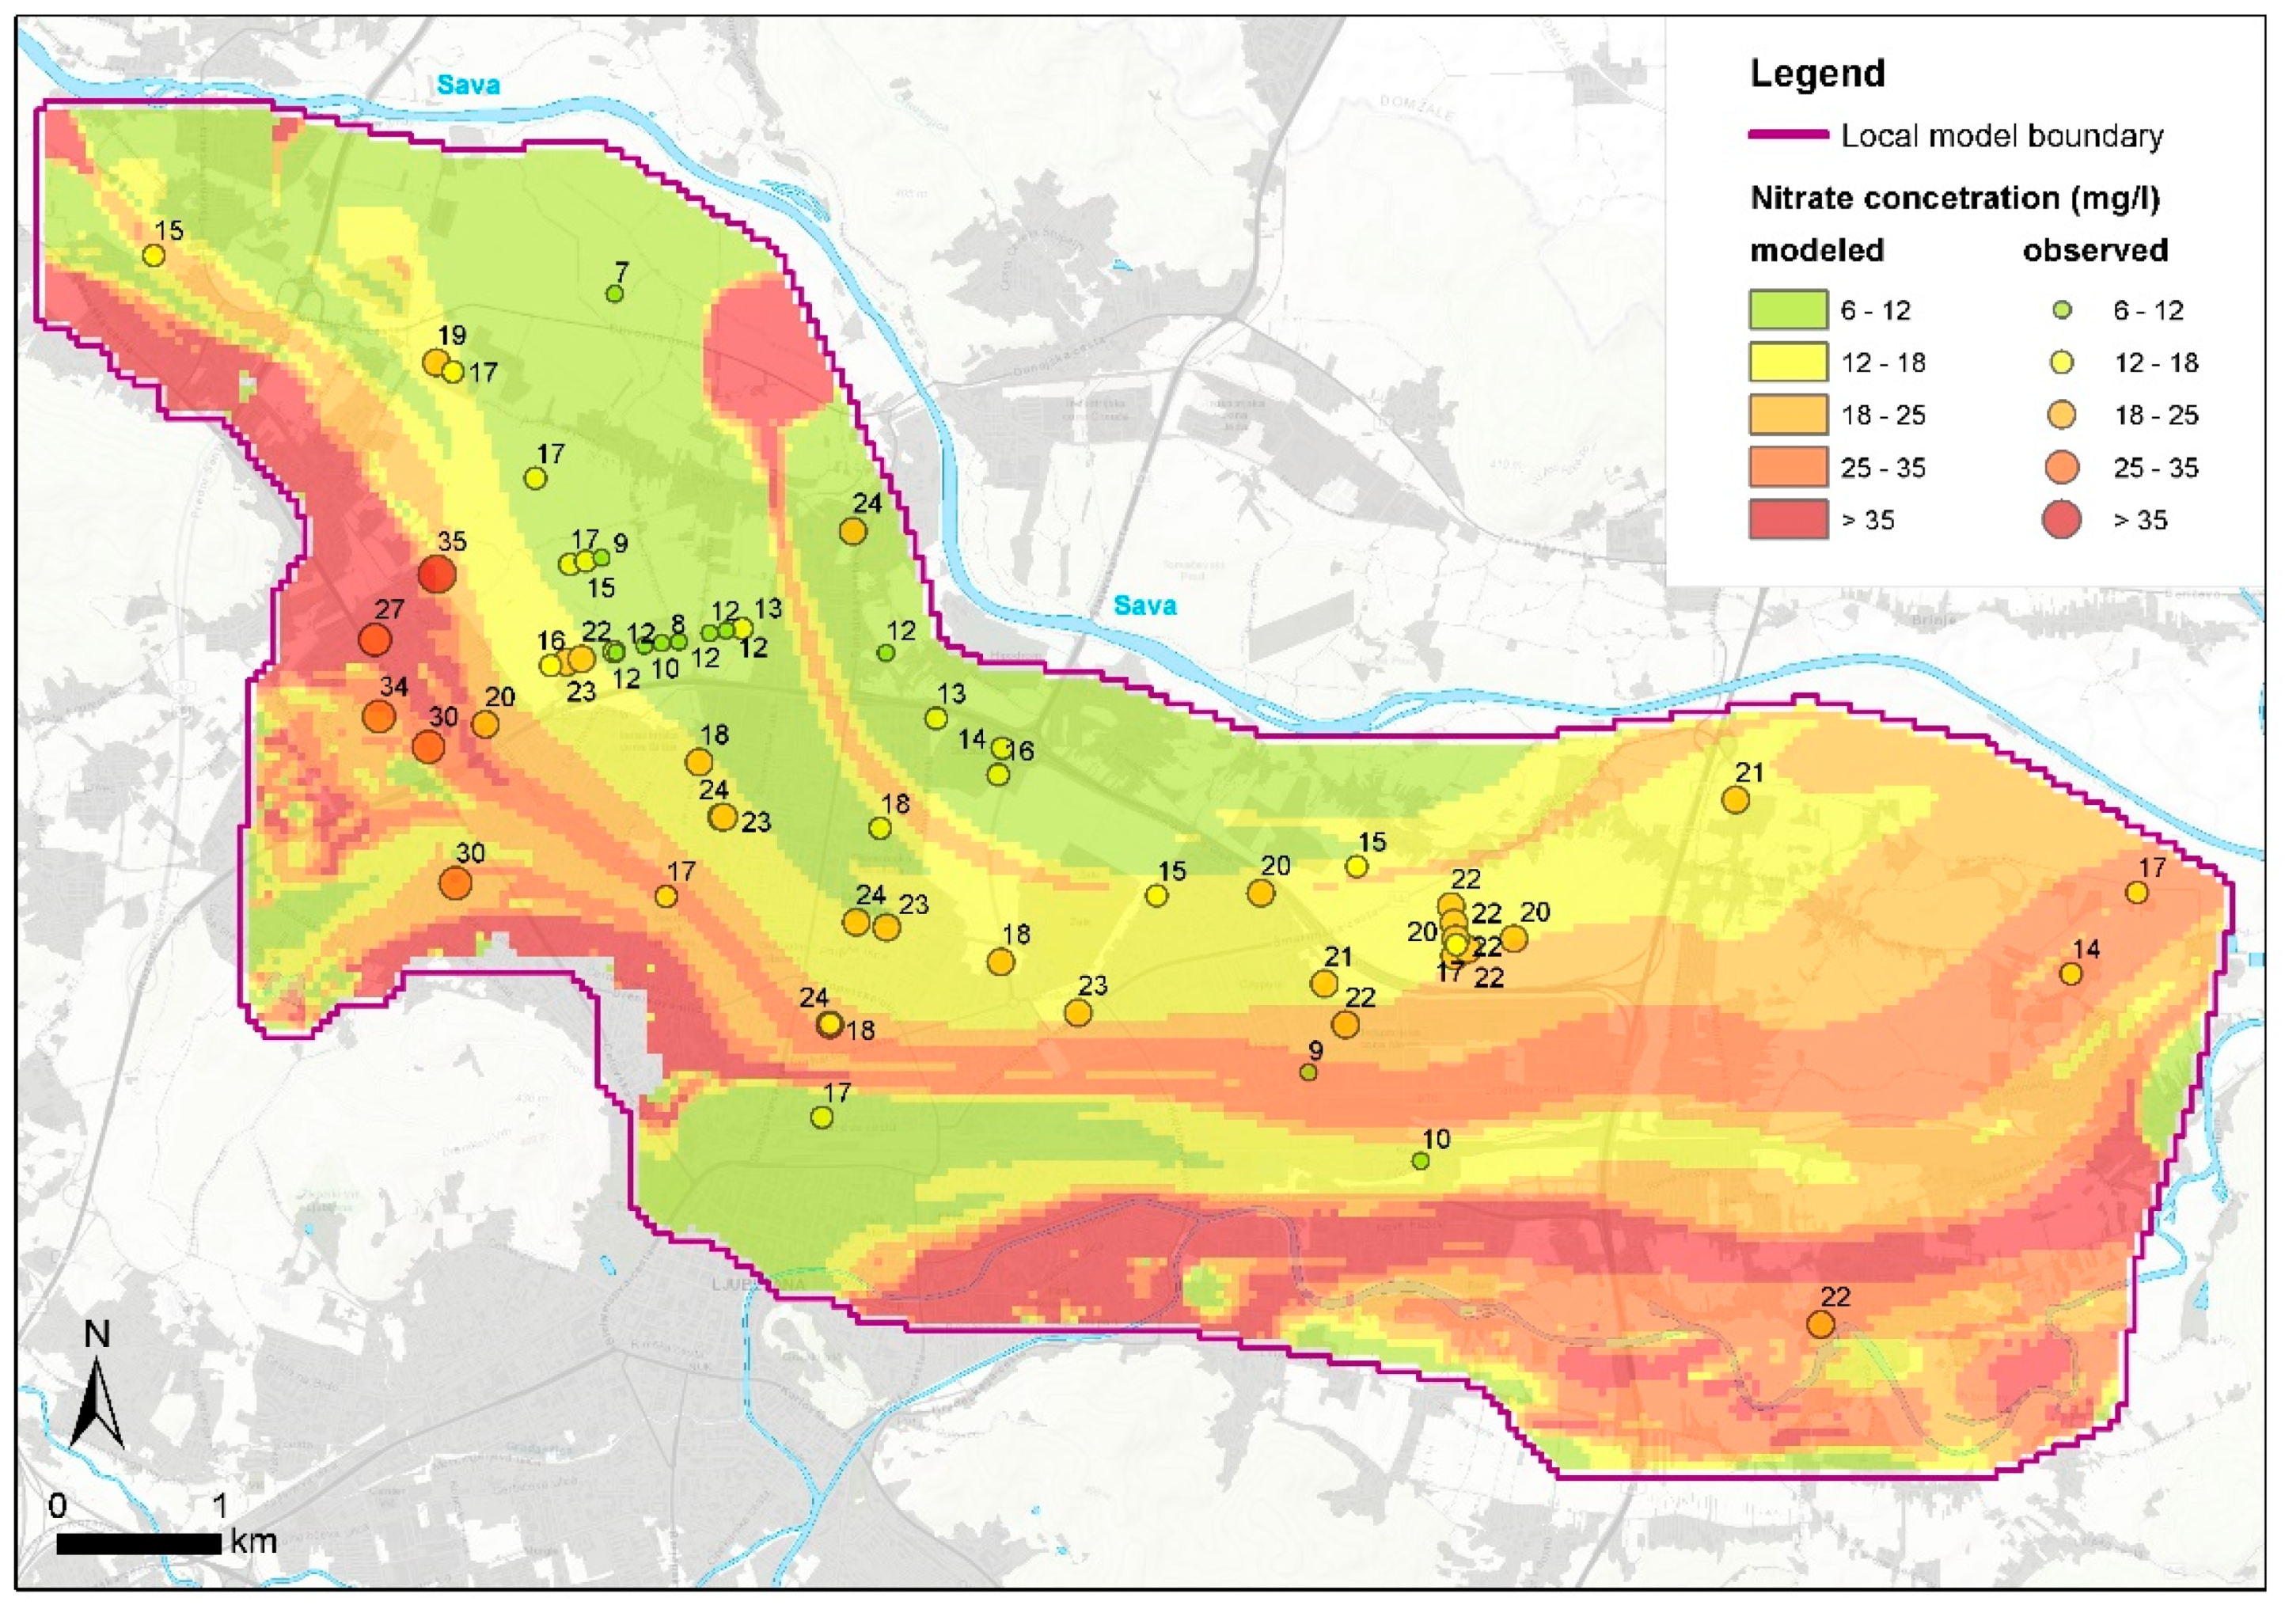
Nitrate concentration in groundwater was available from 58 observation wells and 2 springs. The observed locations were numbered according to their geographical positions, in accelerating order from the west towards the east (Figure 1). The modeled total nitrate concentration (Figure 8) is the sum of the modeled impacts of nitrogen load from the sewer system and agriculture (Figure S1, Figure S2) with an assumed natural background concentration of 6 mg/L. Median values of observed and modeled concentrations in a 3 year period (2013–2015) at observation locations (obs) are presented in Table S1 and summary statistics in Table 4.
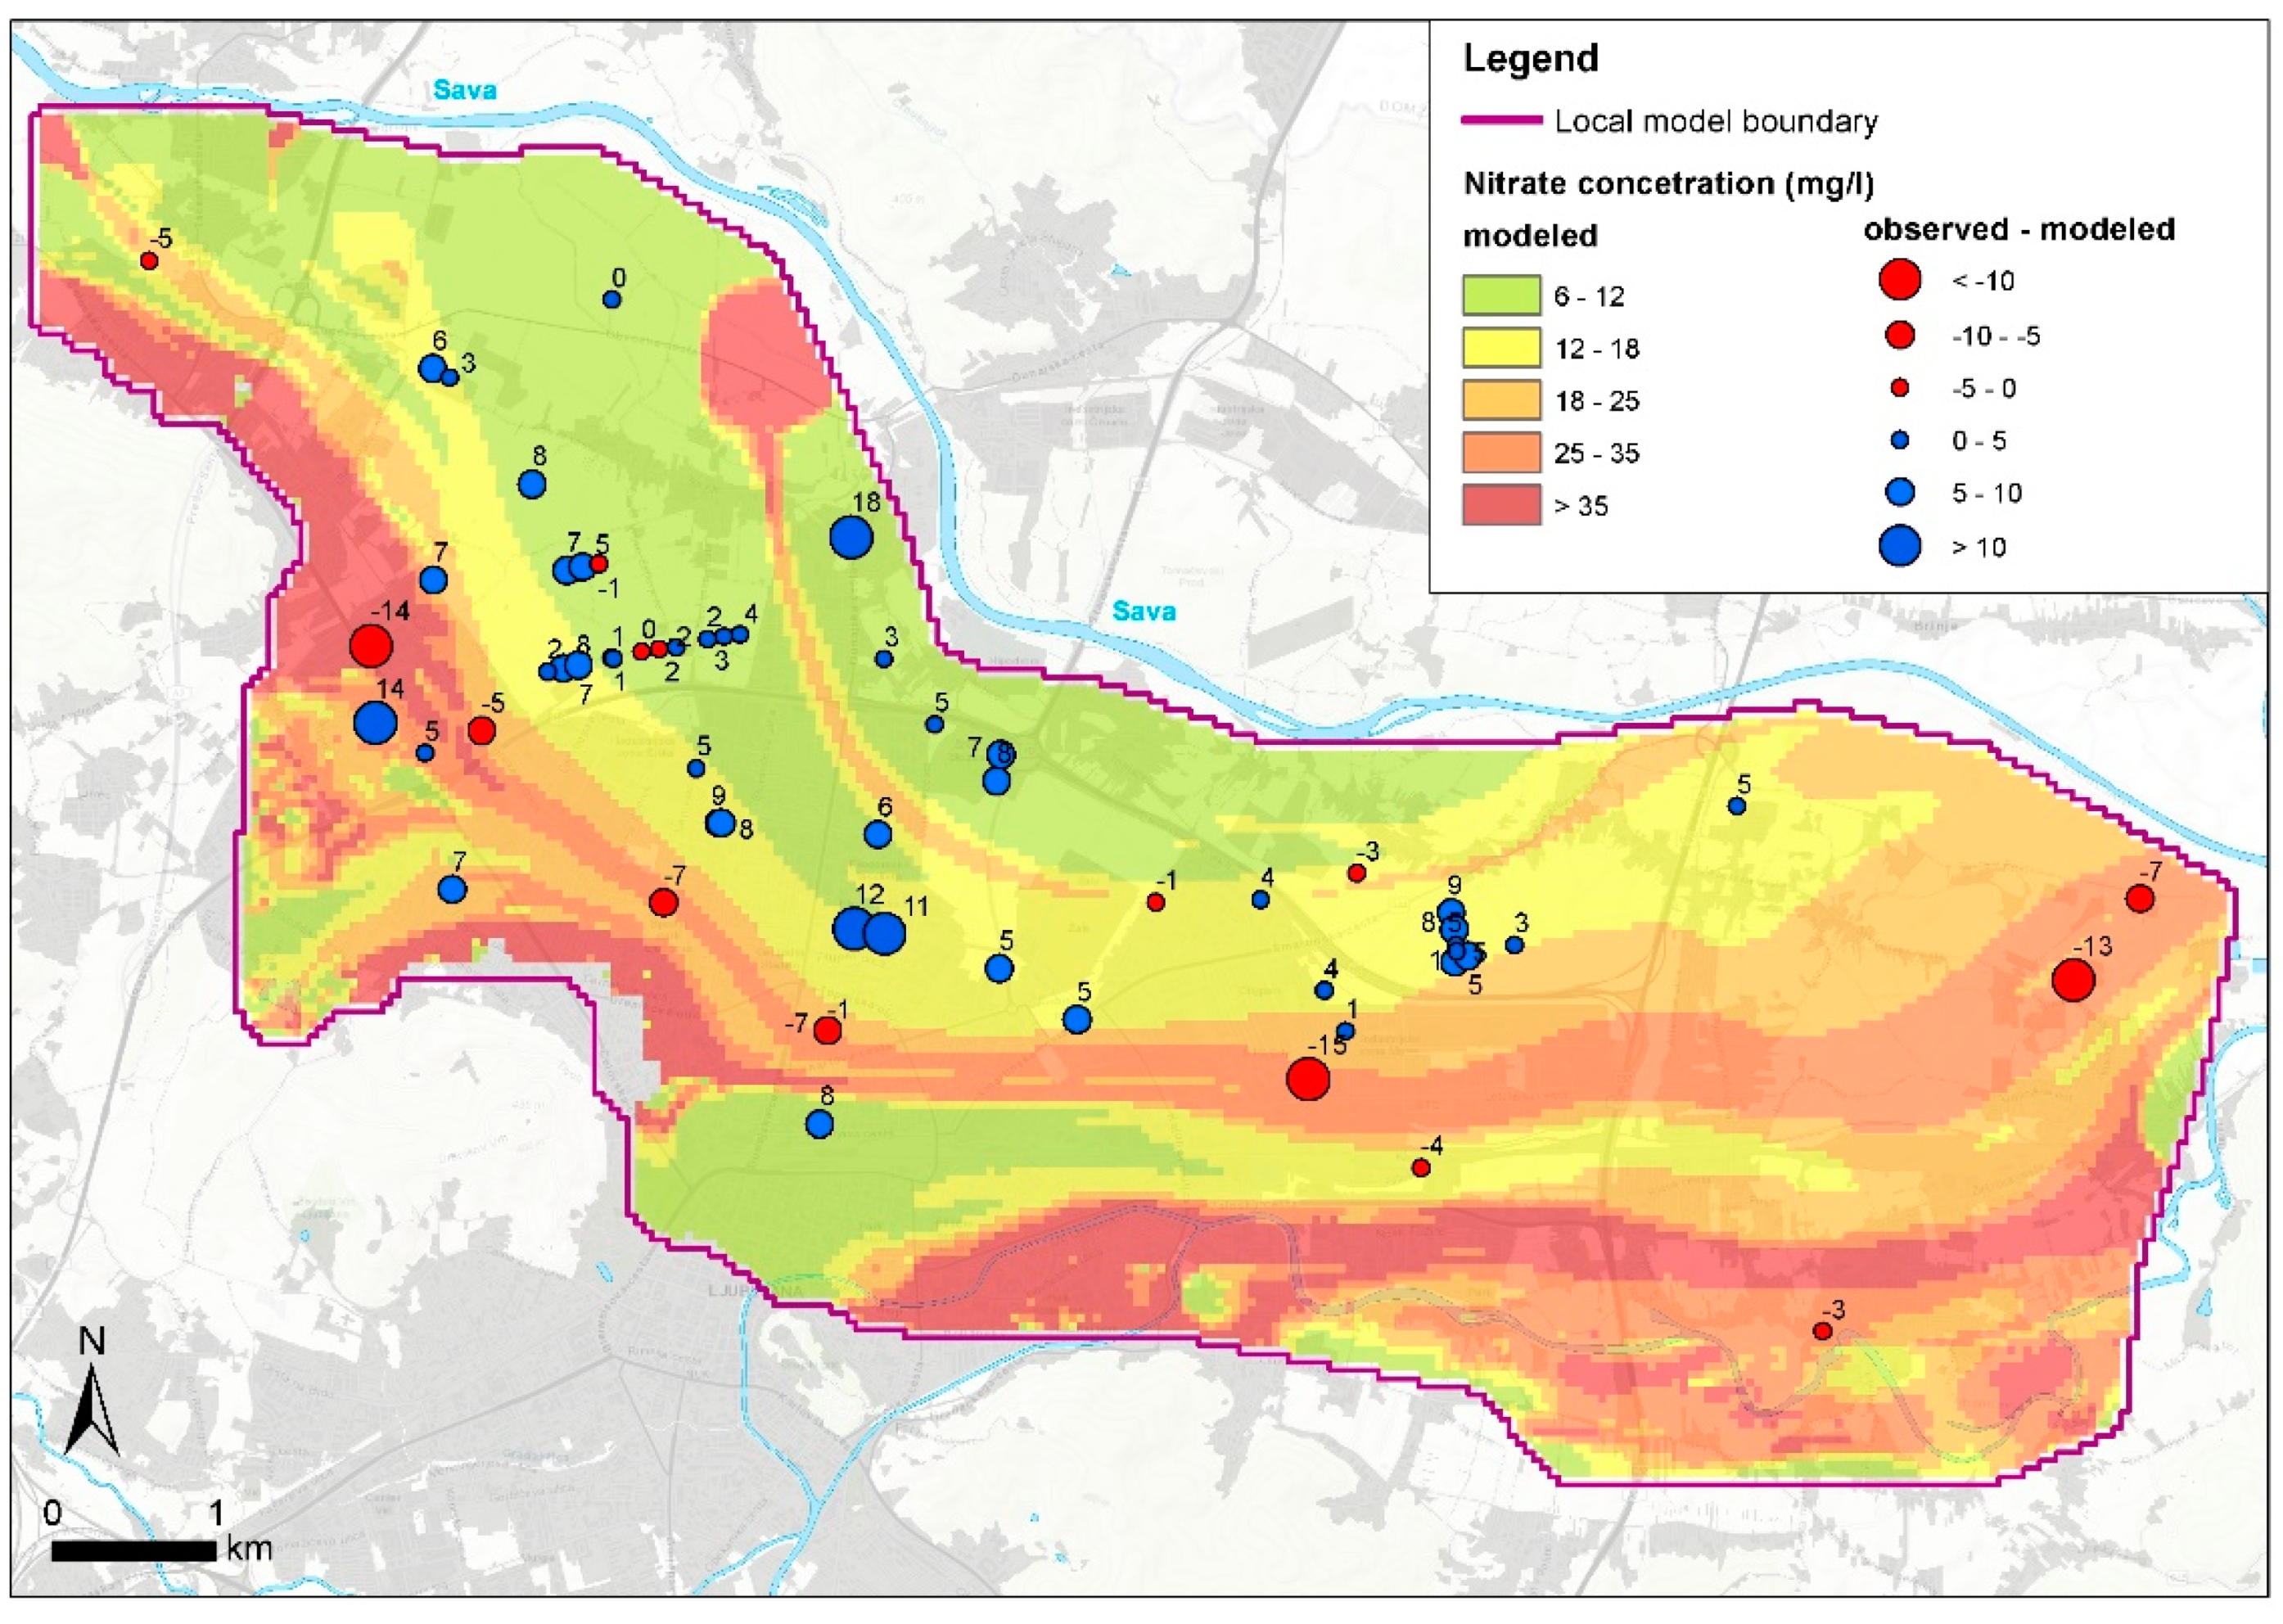
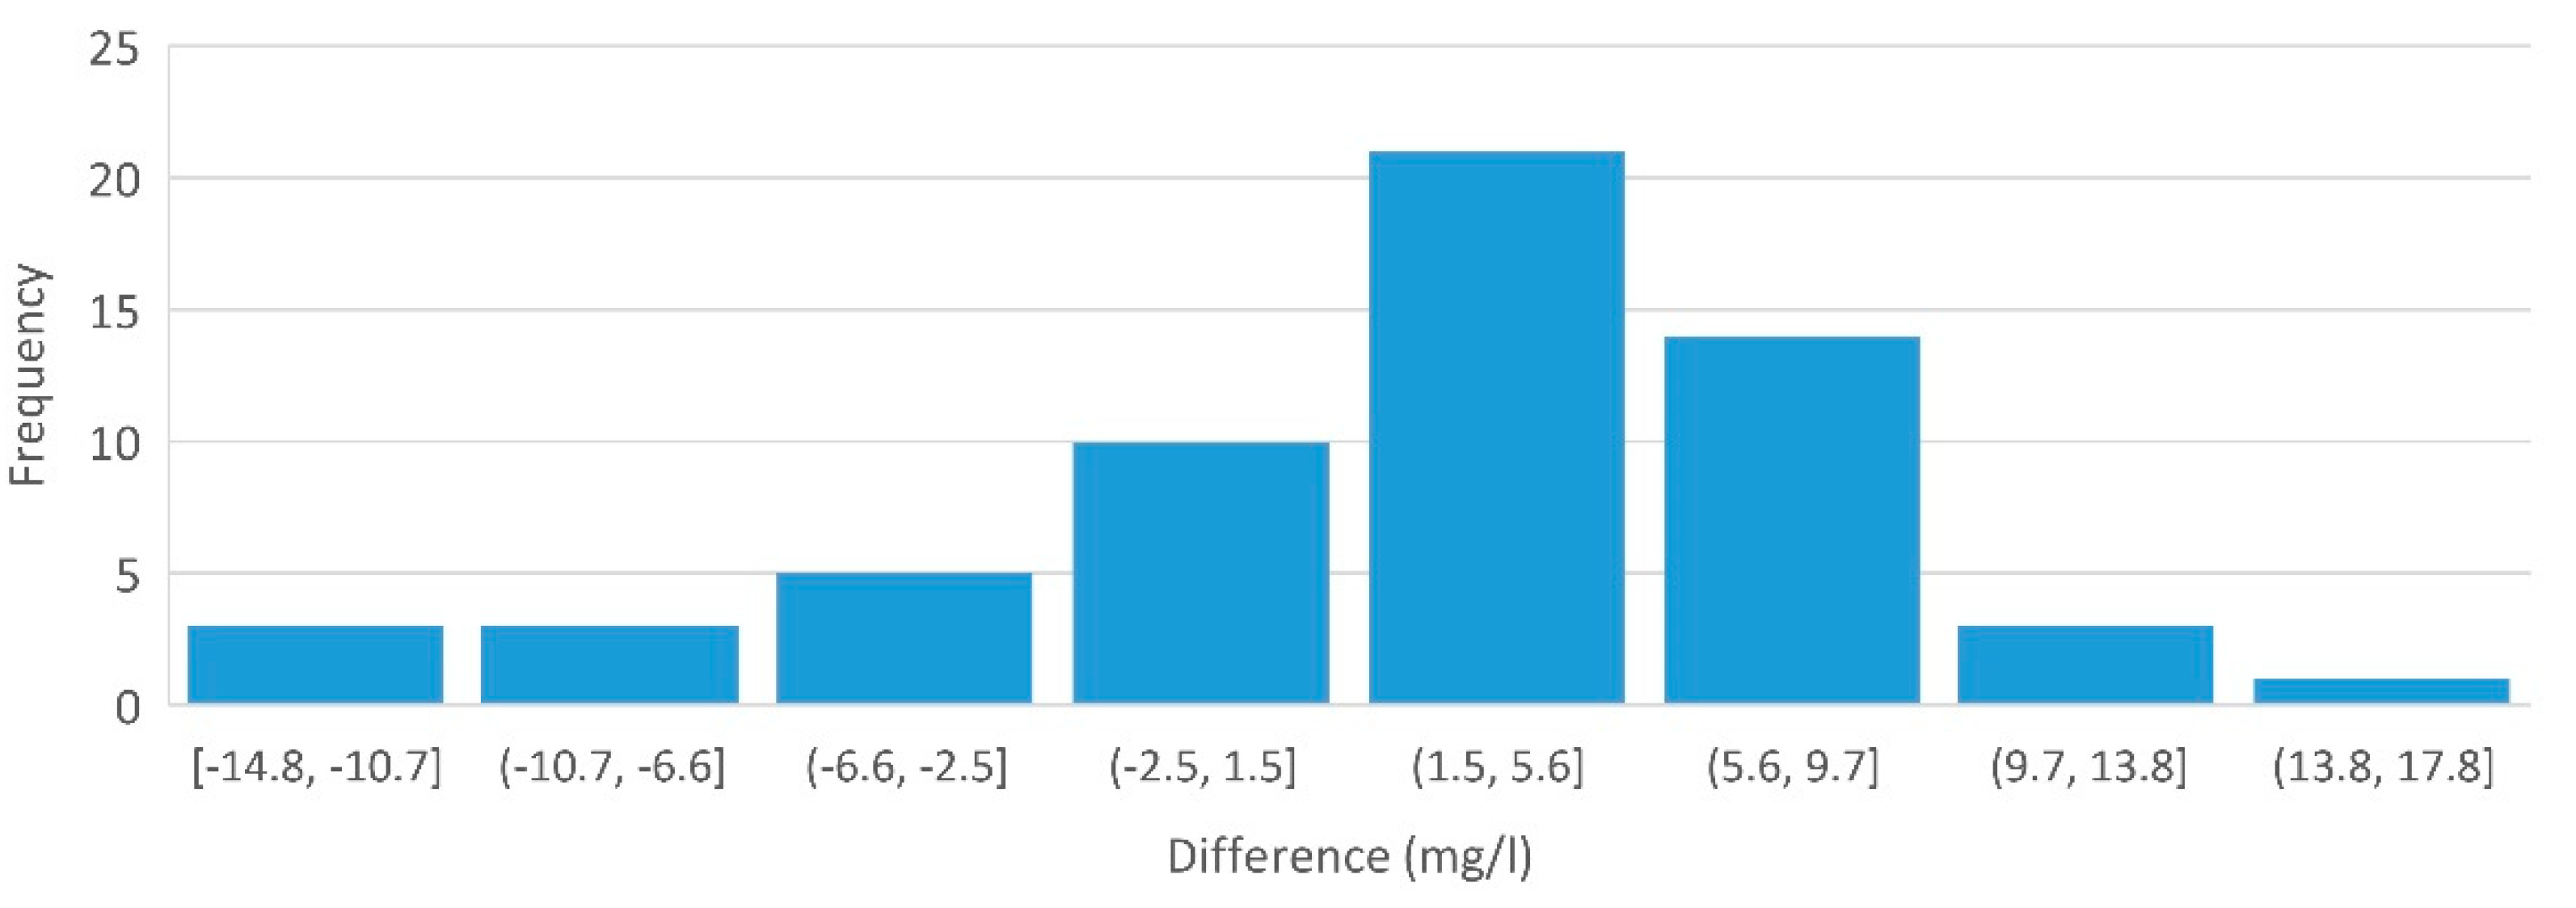
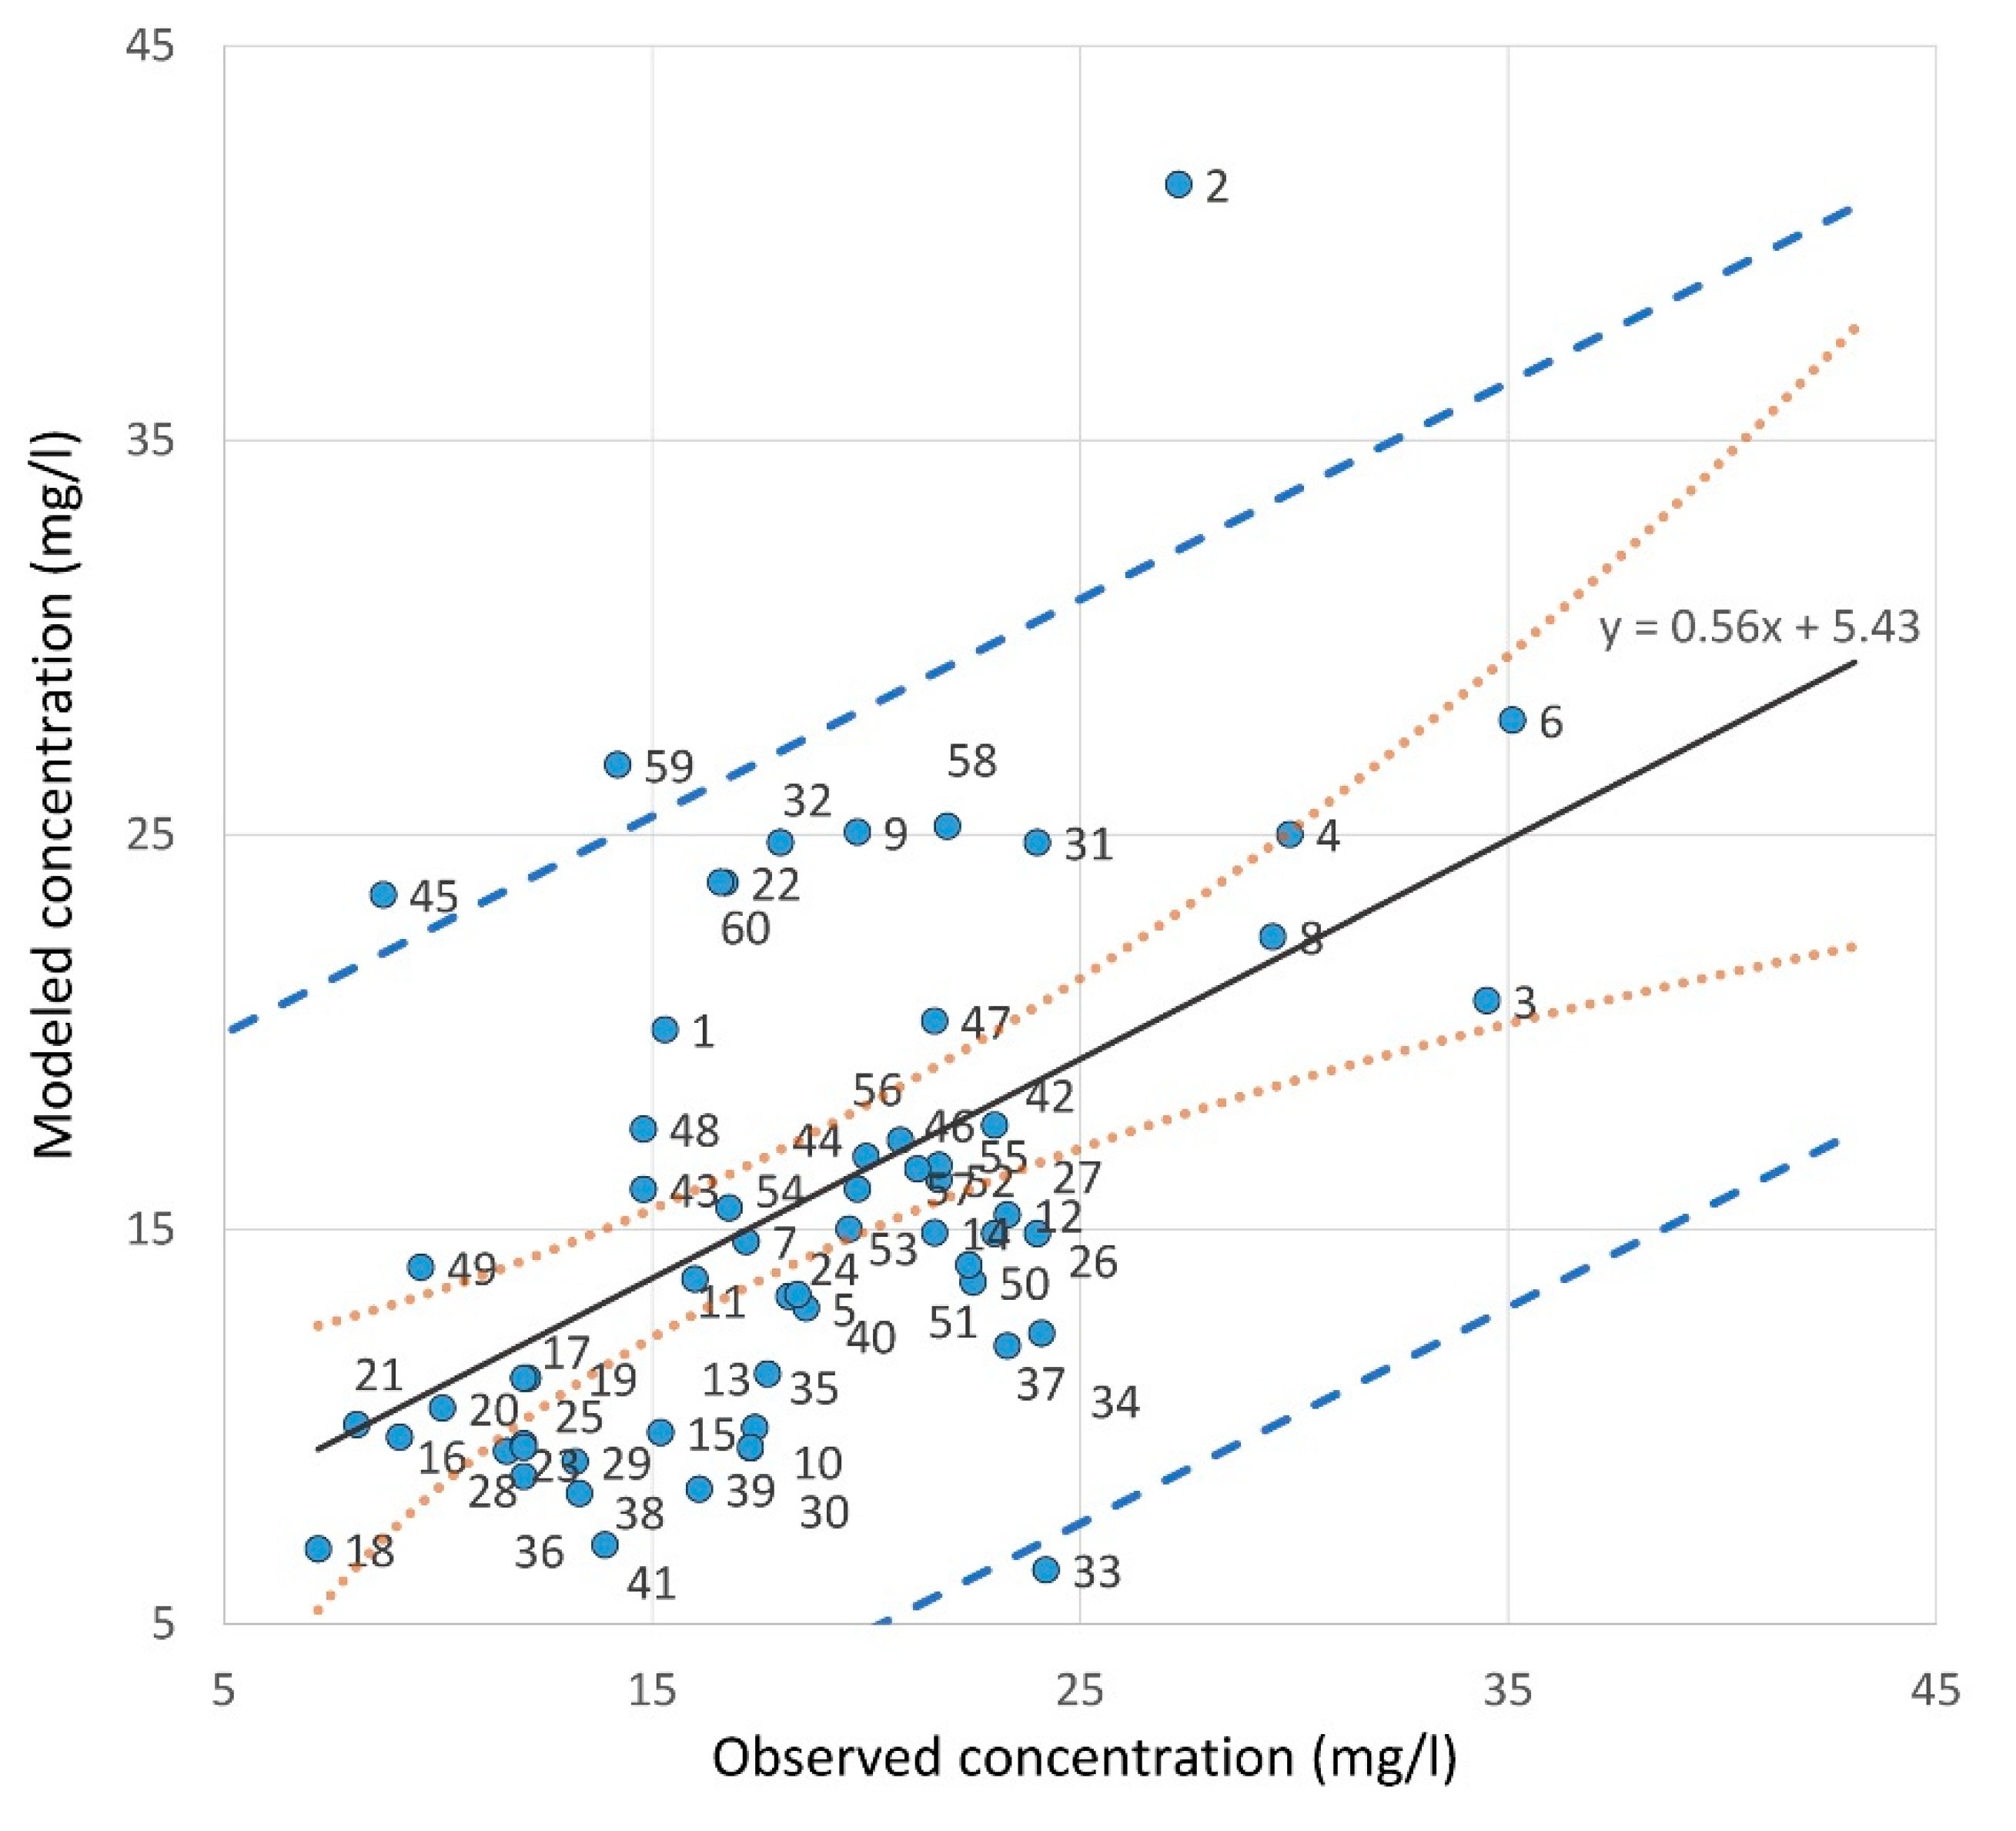
The average difference between the observed and modeled concentrations at the observation locations was found to be 2.7 mg/L (Table 4, Figure 9). The distribution of differences was left-skewed (Sk = −0.73, Figure 10). The correlation coefficient between the observed and modeled concentrations was 0.51 (Figure 11).
4. Discussion
The modeled spatial distribution of nitrate followed the groundwater flow pattern. It reflected the general characteristics of the observed concentrations, which are higher in the southeastern and central parts of the model area (Figure 8). In spite of higher total nitrogen load from agriculture, the highest nitrate concentrations (>25 mg/L) were observed in areas (obs 2, 3, 4, 6 and 8) with predominant impact from sewer system (Figure 8).
The model gives insight into the impacts of two contamination sources in the capture zones of abstraction wells that are used for drinking water supply. Nitrate concentrations in observation wells in the Šentvid (obs 5 and 7) and Kleče well fields (obs 11–17, 19, 20, 21, 23, 25, 28 and 29) were found to be relatively low (on average below 15 mg/L) and, according to the model, arise predominantly from agriculture (72% of anthropogenic impact). Nitrate concentrations in observation wells in the Hrastje well field (obs 50–56) were higher (on average above 20 mg/L), and the shares of nitrogen load from agriculture (47%) and the sewer system (53%) are comparable. These findings give a bigger picture of the impact of different nitrogen sources on groundwater quality in comparison to the local study, focused on a small part of the urban area [35].
On average, the modeled concentrations were found to be 2.7 mg/L lower than the observed concentrations (Table 4, Figure 9). The discrepancy is relatively low and gives a good estimate of the nitrogen mass balance in the study area. Overestimation of observed nitrate concentrations by a factor of 4.5 was reported in the case study solely by using the nitrogen mass balance estimate for infiltration water [22]. This emphasizes the important contribution of the integration of groundwater dynamics in modeling in order to reduce the uncertainty in the estimate of the nitrate concentration in groundwater.
The modeled concentrations were most evidently underestimated in the area of the highest transmissivity and groundwater discharge (Figure 2). This zone stretches from the northeastern part of the model area, in which the most intensive recharge from the Sava River occurs and further follows the groundwater flow path. This discrepancy could be attributed either to the overestimated groundwater discharge rates or to underestimated nitrogen load, which in this area arises mainly from agriculture. In the urbanized part of the study area, underestimated concentrations could be related to unknown non-agricultural sources of nitrogen [19]. On the contrary, the overestimated nitrate concentrations are mainly in the southern part of the model area. This zone stretches from the southeastern part of the model area, in which the highest concentrations were observed (obs 2, 3 and 4) and follows the groundwater flow path towards the southeast.
The differences between the modeled and observed nitrate concentrations are related to the uncertainties arising from different sources. The level of complexity of used models was adjusted to available data and knowledge. The selection of the models followed the principle as simple as possible, as complex as necessary [51,52]. The used estimates of nitrogen load were based on the limited available data and a simplified nitrogen mass balance model. The wastewater exfiltration model used characteristics of 2% of the sewer system and scales up these findings to the entire sewer system. Due to this generalization and the lack of observations and the complexity of exfiltration process [14], the quantification of impact of sewer leaking on groundwater quality is uncertain. The available quantification of nitrogen load (surpluses) from agriculture was based on literature and statistical data [41], and thus it did not consider site-specific agricultural practices and their changes over time.
The groundwater model is a mathematical representation of an aquifer that is highly productive, characterized by a saturated zone up to 70 m deep and a fast groundwater flow with up to 20 m/day. The simulated pollution plumes are narrow and fast progressing, thus difficult to observe [49]. The modeling of the nitrate concentration is based on simulated groundwater discharge and flow direction. These two processes in the aquifer are difficult to measure and the lack of available data limits the possibility of validating the groundwater transport model. Especially in the areas close to the boundaries of the model, in which the transmissivity of the aquifer (Figure 2) is low, modeled concentrations were found to be very high (Figure 8) and sensitive to the interpreted shape of the aquifer basement. It is assumed that in these areas, the uncertainty of the model is the highest.
Data on nitrate concentration in groundwater was acquired from three monitoring networks managed by the Slovenian Environmental Agency, the City of Ljubljana, and the water supply company JP VOKA SNAGA. The samples were taken from observation wells using withdrawal method. No multilevel sampling technique for collecting depth-specific groundwater samples was applied. Representative depth-specific groundwater sampling in unconsolidated and coarse-grained aquifers is difficult to obtain. In such aquifers, even the application of packers within a screened well does not assure representative depth-specific sampling, due to the high risk of vertical circulations in the annular space around the well screen or casing [53]. The available data on groundwater sampling were insufficient for characterization of vertical distribution of nitrate in the aquifer. Due to this, the median value of measurements (2013–2015) in each well was considered as a representative concentration of the whole groundwater column at the observation location. This fact led to the simplification of the model and the use of a single calculation layer, which limited the simulation of vertical stratification and interpretation of the site-specific vertical concentration distribution.
5. Conclusions
The presented modeling approach enabled relation and quantification of the impact of pressure from contamination sources on groundwater quality. Modeled spatial distribution of nitrate content in groundwater pointed out the leaky sewer system as the prevailing source of nitrogen load inducing locally high nitrate concentration (above 25 mg/L). Reconstruction of the part of the sewer system in the catchments of observation wells with high nitrate content was recognized as a priority measure for the improvement of groundwater quality. The developed model can be used as a supportive tool in the optimization of mitigation measures, providing the simulation of effects of different remediation scenarios in a cost–benefit analysis. This approach could be applied also to assess the efficiency of groundwater management plans and to analyze the contribution of the stakeholders’ activities to the improvement of groundwater quality.
Nitrate concentration in groundwater could be well explained by the known sources of nitrogen that approved the applied integrated mass balance and groundwater modeling concept. Application of this concept to other pollutants revealed a high share of unknown sources for several pollutants; among them, chromium (CrIV) was pointed out as the most threatening for the water supply [40]. Identification and remediation of unknown sources of pollutants whose content in groundwater is high, considering drinking water quality standards, or increases in time, is a priority for groundwater management and the assurance of safe drinking water supply for the City of Ljubljana.
Supplementary Materials
The following are available online at https://www.mdpi.com/2073-4441/12/4/1171/s1, Table S1: Median values of modeled and observed nitrate concentrations (2013–2015), Figure S1: The spatial distribution of the modeled nitrate concentration arising from the sewer system; Figure S2: The spatial distribution of the modeled nitrate concentration arising from agriculture.
Author Contributions
Conceptualization, M.J. and J.P.; methodology, J.P., S.P. and M.J.; investigation, J.P., S.P. and M.J.; data curation S.P., J.P. and M.J.; writing—original draft preparation, M.J.; writing—review and editing, M.J., J.P. and B.J.; project administration, J.P., B.J. and S.P.; funding acquisition, J.P., B.J. and M.J. All authors have read and agreed to the published version of the manuscript.
Funding
This research was funded by projects AMIIGA (Interreg Central Europe, No. CE32), INCOME (LIFE07, ENV/SLO/000725), IGCP 684 (UNESCO-IUGS), and by the Slovenian Research Agency (research core funding Groundwaters and Geochemistry (P1-0020)).
Acknowledgments
The authors wish to thank Petra Meglič and Dejan Šram for the help in cartography. The authors are very grateful to reviewers for very constructive reviews that significantly improved the manuscript.
Conflicts of Interest
The authors declare no conflict of interest.
References
- UN. World Urbanization Prospects 2018: Highlights; United Nations, Department of Economic and Social Affairs, Population Division (ST/ESA/SER.A/421); United Nations: New York, NY, USA, 2019. [Google Scholar]
- WBG. Climate Change Action Plan; World Bank Group: Washington, DC, USA, 2016. [Google Scholar]
- Howard, K.W.F. Sustainable cities and the groundwater governance challenge. Environ. Earth Sci. 2014. [Google Scholar] [CrossRef]
- Boukhemacha, M.A.; Gogu, C.R.; Serpescu, I.; Gaitanaru, D.; Bica, I. A hydrogeological conceptual approach to study urban groundwater flow in Bucharest city, Romania. Hydrogeol. J. 2015, 23, 437–450. [Google Scholar] [CrossRef]
- Diamond, M.L.; Hodge, E. Urban contaminant dynamics: From source to effect. Environ. Sci. Technol. 2007, 41, 3796–3805. [Google Scholar] [CrossRef] [PubMed] [Green Version]
- Gogu, C.R.; Campbell, D.; de Beer, J. PREFACE: The Urban Subsurface – from Geoscience and Engineering to Spatial Planning and Management. Procedia Eng. 2017, 209, 1–3. [Google Scholar] [CrossRef]
- Jago-on, K.A.B.; Kaneko, S.; Fujikura, R.; Fujiwara, A.; Imai, T.; Matsumoto, T.; Zhang, J.; Tanikawa, H.; Tanaka, K.; Lee, B.; et al. Urbanization and subsurface environmental issues: An attempt at DPSIR model application in Asian cities. Sci. Total Environ. 2009, 407, 3089–3104. [Google Scholar] [CrossRef]
- Bhaskar, A.S.; Welty, C.; Maxwell, R.M.; Miller, A.J. Untangling the effects of urban development on subsurface storage in Baltimore. Water Resour. Res. 2015, 51, 1158–1181. [Google Scholar] [CrossRef]
- Colombo, L.; Alberti, L.; Mazzon, P.; Formentin, G. Transient Flow and Transport Modelling of an Historical CHC Source in North-West Milano. Water 2019, 11, 1745. [Google Scholar] [CrossRef] [Green Version]
- Foster, S.S.D. The interdependence of groundwater and urbanisation in rapidly developing cities. Urban Water 2001, 3, 185–192. [Google Scholar] [CrossRef]
- Schirmer, M.; Reinstorf, F.; Leschik, S.; Musolff, A.; Krieg, R.; Strauch, G.; Molson, J.W.; Martienssen, M.; Schirmer, K. Mass fluxes of xenobiotics below cities: Challenges in urban hydrogeology. Environ. Earth Sci. 2011, 64, 607–617. [Google Scholar] [CrossRef]
- Klinger, J.; Wolf, L.; Hoetzl, H. Leaky sewers-measurements under operating conditions. In Proceedings of the 4th World Wide Workshop for Young Environmental Scientists (WWW-YES), Vitry sur Seine, France, 10–13 May 2005. [Google Scholar]
- Peche, A.; Graf, T.; Fuchs, L.; Neuweiler, I. Physically based modeling of stormwater pipe leakage in an urban catchment. J. Hydrol. 2019, 573, 778–793. [Google Scholar] [CrossRef]
- Wolf, L.; Klinger, J.; Held, I.; Hötzl, H. Integrating groundwater into urban water management. Water Sci. Technol. 2006, 54, 395–403. [Google Scholar] [CrossRef] [PubMed]
- Rutsch, M.; Rieckermann, J.; Cullmann, J.; Ellis, J.B.; Vollertsen, J.; Krebs, P. Towards a better understanding of sewer exfiltration. Water Res. 2008, 42, 2385–2394. [Google Scholar] [CrossRef] [PubMed]
- Uhan, J. Data-driven modelling of groundwater vulnerability to nitrate pollution in Slovenia (Podatkovno vodeno modeliranje ranljivosti podzemne vode na nitratno onesnaženje v Sloveniji). RMZ—Mater. Geoenviron. 2012, 59, 201–212. [Google Scholar]
- Mihorko, P.; Gacin, M. Environmental Indicators in Slovenia, Nitrates in Groundwater [VD05]; Slovenian Environment Agency: Ljubljana, Slovenia, 2019; p. 14. [Google Scholar]
- Andjelov, M.; Kunkel, R.; Uhan, J.; Wendland, F. Determination of nitrogen reduction levels necessary to reach groundwater quality targets in Slovenia. J. Environ. Sci. 2014, 26, 1806–1817. [Google Scholar] [CrossRef]
- Wakida, F.T.; Lerner, D.N. Non-agricultural sources of groundwater nitrate: A review and case study. Water Res. 2005, 39, 3–16. [Google Scholar] [CrossRef]
- Graham, J.P.; Polizzotto, M.L. Pit latrines and their impacts on groundwater quality: A systematic review. Environ. Health Perspect. 2013, 121, 521–530. [Google Scholar] [CrossRef] [Green Version]
- Koda, E.; Sieczka, A.; Osinski, P. Ammonium Concentration and Migration in Groundwater in the Vicinity of Waste Management Site Located in the Neighborhood of Protected Areas of Warsaw, Poland. Sustainability 2016, 8, 1253. [Google Scholar] [CrossRef] [Green Version]
- Kringel, R.; Rechenburg, A.; Kuitcha, D.; Fouepe, A.; Bellenberg, S.; Kengne, I.M.; Fomo, M.A. Mass balance of nitrogen and potassium in urban groundwater in Central Africa, Yaounde/Cameroon. Sci. Total Environ. 2016, 547, 382–395. [Google Scholar] [CrossRef] [Green Version]
- Soldatova, E.; Guseva, N.; Sun, Z.; Bychinsky, V.; Boeckx, P.; Gao, B. Sources and behaviour of nitrogen compounds in the shallow groundwater of agricultural areas (Poyang Lake basin, China). J. Contam. Hydrol. 2017, 202, 59–69. [Google Scholar] [CrossRef]
- Szabó, G.; Bessenyei, É.; Karancsi, G.; Balla, D.; Mester, T. Effects of nitrogen loading from domestic wastewater on groundwater quality. Water SA 2019, 45. [Google Scholar] [CrossRef] [Green Version]
- Zhang, H.; Hiscock, K.M. Modelling the effect of forest cover in mitigating nitrate contamination of groundwater: A case study of the Sherwood Sandstone aquifer in the East Midlands, UK. J. Hydrol. 2011, 399, 212–225. [Google Scholar] [CrossRef]
- Arauzo, M. Vulnerability of groundwater resources to nitrate pollution: A simple and effective procedure for delimiting Nitrate Vulnerable Zones. Sci. Total Environ. 2017, 575, 799–812. [Google Scholar] [CrossRef] [PubMed]
- Nolan, B.T.; Hitt, K.J. Vulnerability of Shallow Groundwater and Drinking-Water Wells to Nitrate in the United States. Environ. Sci. Technol. 2006, 40, 7834–7840. [Google Scholar] [CrossRef] [PubMed]
- Padilla, F.M.; Gallardo, M.; Manzano-Agugliaro, F. Global trends in nitrate leaching research in the 1960–2017 period. Sci. Total Environ. 2018, 643, 400–413. [Google Scholar] [CrossRef] [PubMed]
- Lalehzari, R.; Tabatabaei, S.H.; Kholghi, M. Simulation of nitrate transport and wastewater seepage in groundwater flow system. Int. J. Environ. Sci. Technol. 2013, 10, 1367–1376. [Google Scholar] [CrossRef] [Green Version]
- Podlasek, A.; Bujakowski, F.; Koda, E. The spread of nitrogen compounds in an active groundwater exchange zone within a valuable natural ecosystem. Ecol. Eng. 2020, 146, 105746. [Google Scholar] [CrossRef]
- Zuo, R.; Jin, S.; Chen, M.; Guan, X.; Wang, J.; Zhai, Y.; Teng, Y.; Guo, X. In-situ study of migration and transformation of nitrogen in groundwater based on continuous observations at a contaminated desert site. J. Contam. Hydrol. 2018, 211, 39–48. [Google Scholar] [CrossRef]
- Sieczka, A.; Bujakowski, F.; Koda, E. Modelling groundwater flow and nitrate transport: A case study of an area used for precision agriculture in the middle part of the Vistula River valley, Poland. Geologos 2018, 24, 225–235. [Google Scholar] [CrossRef] [Green Version]
- Valivand, F.; Katibeh, H. Prediction of Nitrate Distribution Process in the Groundwater via 3D Modeling. Environ. Model. Assess. 2020, 25, 187–201. [Google Scholar] [CrossRef]
- Bračič Železnik, B.; Jamnik, B. Javna oskrba s pitno vodo. In Podtalnica Ljubljanskega Polja; Rejec Brancelj, I., Smrekar, A., Kladnik, D., Eds.; Založba ZRC: Ljubljana, Slovenia, 2005; pp. 101–117. [Google Scholar]
- Vižintin, G.; Souvent, P.; Veselič, M.; ČenČur Curk, B. Determination of urban groundwater pollution in alluvial aquifer using linked process models considering urban water cycle. J. Hydrol. 2009, 377, 261–273. [Google Scholar] [CrossRef]
- Prestor, J.; Pestotnik, S.; Meglič, P.; Janža, M. Model of Environmental Pressures and Impacts; A.3.3 Final Report of INCOME Project (LIFE+ Programme); Geological Survey of Slovenia: Ljubljana, Slovenia, 2011. [Google Scholar]
- Prestor, J.; Pestotnik, S.; Meglič, P.; Janža, M. Načrtovanje zaščitnih ukrepov na podlagi modela obremenitev in vplivov na podzemno vodo Ljubljanskega polja. In Skrb za Pitno Vodo; Jamnik, B., Janža, M., Smrekar, A., Eds.; Skrb za pitno vodo: Ljubljana, Slovenia, 2014; Volume GEOGRAFIJA SLOVENIJE 31, pp. 79–93. [Google Scholar]
- Janža, M.; Meglič, P.; Prestor, J.; Jamnik, B.; Pestotnik, S.D. T2.2.3—Report on the Improved Transport and Surface-Groundwater Interactions Model, Version 2. Project AMIIGA (Interreg, Central Europe); Geological Survey of Slovenia: Ljubljana, Slovenia, 2019; pp. 15–22. [Google Scholar]
- Meglič, P.; Janža, M.; Prestor, J.; Pestotnik, S.; Jamnik, B.D. T2.2.7—Report on the Results of the Most Probable Scenarios Threatening Groundwater, Version 2. Project AMIIGA (Interreg, Central Europe); Geological Survey of Slovenia: Ljubljana, Slovenia, 2019. [Google Scholar]
- Pestotnik, S.; Prestor, J.; Meglič, P.; Janža, M.; Šram, D.D. T2.2.4—Report on Actualized Contaminants Mass Balance and Pressures-Impacts Model, Version 2. Project AMIIGA (Interreg, Central Europe); Geological Survey of Slovenia: Ljubljana, Slovenia, 2019; pp. 15–22. [Google Scholar]
- Pintar, M.; Sluga, G.; Bremec, U. Določitev Obremenitev iz Kmetijstva za Izbrane Prostorske Enote; Inštitut za vode Republike Slovenije: Ljubljana, Slovenia, 2005. [Google Scholar]
- EEA. Corine Land Cover 2012 Seamless Vector Data (Version 18); Agency, E.E., Ed.; EEA: Kopenhagen, Denmark, 2016. [Google Scholar]
- Janža, M.; Lapanje, A.; Šram, D.; Rajver, D.; Novak, M. Research of the geological and geothermal conditions for the assessment of the shallow geothermal potential in the area of Ljubljana, Slovenia. Geologija 2017, 60, 309–327. [Google Scholar] [CrossRef]
- Panjan, J. Količinske in Kakovostne Lastnosti Voda: Študijsko Gradivo; FGG, Inštitut za zdravstveno hidrotehniko: Ljubljana, Slovenia, 2004. [Google Scholar]
- Smrekar, A.; Bole, D.; Breg Valjavec, M.; Gabrovec, M.; Gašperič, P.; Ciglič, R.; Pavšek, M.; Topole, M. Register and Evaluation of the Active and the Potential Sources of Pollution, Project INCOME Action A.2.1 Report; Anton Melik Geographical Institute, ZRC SAZU: Ljubljana, Slovenia, 2010. [Google Scholar]
- Wolf, L.; Klinger, J.; Hoetzl, H.; Mohrlok, U. Quantifying Mass Fluxes from Urban Drainage Systems to the Urban Soil-Aquifer System (11 pp). J. Soils Sediments 2007, 7, 85–95. [Google Scholar] [CrossRef]
- MIKE SHE, Integrated Catchment Modelling. Available online: https://www.mikepoweredbydhi.com/products/mike-she (accessed on 6 April 2020).
- Janža, M. A decision support system for emergency response to groundwater resource pollution in an urban area (Ljubljana, Slovenia). Environ. Earth Sci. 2015, 73, 3763–3774. [Google Scholar] [CrossRef]
- Janža, M.; Prestor, J.; Urbanc, J.; Jamnik, B. TCE contamination plume spreading in highly productive aquifer of Ljubljansko polje. In Abstracts of the Contributions of the EGU General Assembly 2005; EGU: Vienna, Austria, 2005; Volume 7. [Google Scholar]
- Urbanc, J.; Jamnik, B. Distribution and origin of nitrates in the groundwater of Ljubljansko polje. Geologija 2007, 50, 467–475. [Google Scholar] [CrossRef]
- Brunetti, G.; Šimůnek, J.; Glöckler, D.; Stumpp, C. Handling model complexity with parsimony: Numerical analysis of the nitrogen turnover in a controlled aquifer model setup. J. Hydrol. 2020, 584. [Google Scholar] [CrossRef]
- Höge, M.; Wöhling, T.; Nowak, W. A Primer for Model Selection: The Decisive Role of Model Complexity. Water Resour. Res. 2018, 54, 1688–1715. [Google Scholar] [CrossRef]
- Ducommun, P.; Boutsiadou, X.; Hunkeler, D. Direct-push multilevel sampling system for unconsolidated aquifers. Hydrogeol. J. 2013, 21, 1901–1908. [Google Scholar] [CrossRef] [Green Version]
Figure 1.
Map of the study area showing observation locations, groundwater level isolines, model boundaries, artificial surfaces, and well fields.
Figure 1.
Map of the study area showing observation locations, groundwater level isolines, model boundaries, artificial surfaces, and well fields.

Figure 2.
The calibrated transmissivity of the aquifer.

Figure 3.
The flowchart of the workflow for the estimation of nitrogen (N) load from the sewer system (adapted after Pestotnik et al., 2019 [40]).
Figure 3.
The flowchart of the workflow for the estimation of nitrogen (N) load from the sewer system (adapted after Pestotnik et al., 2019 [40]).

Figure 4.
Concentration of total nitrogen at wastewater treatment plant (WWTP) presented with brown dots and 5 days moving average (brown line), discharge presented with blue dots and 5 days moving average (blue line), and rainfall high (gray line) measured at Ljubljana Bežigrad weather station (year 2008).

Figure 5.
Scheme showing the different degrees (10%, 50%, 100%) of fullness in sewer pipes.

Figure 6.
The spatial distribution of the estimated nitrogen load from the leaky sewer system (in kg/day per 50 m grid cell).
Figure 6.
The spatial distribution of the estimated nitrogen load from the leaky sewer system (in kg/day per 50 m grid cell).

Figure 7.
The spatial distribution of the estimated nitrogen load from agriculture (in kg/day per 50 m grid cell).
Figure 7.
The spatial distribution of the estimated nitrogen load from agriculture (in kg/day per 50 m grid cell).

Figure 8.
The spatial distribution of modeled compared to observed nitrate concentrations in groundwater.
Figure 8.
The spatial distribution of modeled compared to observed nitrate concentrations in groundwater.

Figure 9.
Spatial distribution of differences between the observed and the modeled nitrate concentrations in the groundwater in mg/L with red showing and overestimation by the model.
Figure 9.
Spatial distribution of differences between the observed and the modeled nitrate concentrations in the groundwater in mg/L with red showing and overestimation by the model.

Figure 10.
Histogram of differences between the observed and modeled nitrate concentrations at the observation locations.
Figure 10.
Histogram of differences between the observed and modeled nitrate concentrations at the observation locations.

Figure 11.
Scatterplot of observed and modeled nitrate concentrations at the observation locations, with fitted line (black line), 95% confidence band (light-brown dotted line), and 95% prediction band (blue dashed line).
Figure 11.
Scatterplot of observed and modeled nitrate concentrations at the observation locations, with fitted line (black line), 95% confidence band (light-brown dotted line), and 95% prediction band (blue dashed line).


Table 1.
Water balance components (modeling period 2013–2015).
| Water Balance Component | (m3/s) |
|---|---|
| Recharge from Sava River | +3.80 |
| Recharge from precipitation | +1.51 |
| Subsurface inflow | +0.27 |
| Exfiltration from water supply system | +0.16 |
| Abstraction from wells | −1.13 |
| Discharge to Sava River | −4.63 |
Table 2.
Estimated exfiltration and nitrogen load from pipelines of the entire sewer system [40].
Table 2.
Estimated exfiltration and nitrogen load from pipelines of the entire sewer system [40].
| Material | Time of Construction | Exfiltration (L/s/km) | Length (km) | Exfiltration Sum (L/s) | Nitrogen Load (ton/year) |
|---|---|---|---|---|---|
| <1975 | 0.34 | 277.24 | 95.20 | 121.07 | |
| Concrete | 1975–1995 | 0.23 | 255.00 | 58.80 | 74.78 |
| >1995 | 0.12 | 11.20 | 1.29 | 1.64 | |
| <1975 | 0.11 | 22.37 | 2.39 | 3.04 | |
| Plastic | 1975–1995 | 0.07 | 48.92 | 3.49 | 4.44 |
| >1995 | 0.04 | 186.22 | 6.65 | 8.45 | |
| Total | 800.93 | 167.82 | 213.42 |
Table 3.
Statistics for the estimated nitrogen load expressed in g/day per 50 m cell.
| N Source | No. of Cells | Mean (g/day) | Median (g/day) | Min (g/day) | Max (g/day) | SD (g/day) |
|---|---|---|---|---|---|---|
| Sewer system | 11,125 | 45.26 | 41.00 | 0.10 | 223.10 | 33.36 |
| Agriculture | 7936 | 51.75 | 43.59 | 0.07 | 118.63 | 29.43 |
Table 4.
Summary statistics for modeled and observed nitrate concentrations at observation locations (Table S1).
Table 4.
Summary statistics for modeled and observed nitrate concentrations at observation locations (Table S1).
| Statistics | Modeled Concentration (mg/L) | Observed Concentration (mg/L) | Difference ** (mg/L) | ||
|---|---|---|---|---|---|
| Agriculture | Sewer System | Total * | |||
| Mean | 4.15 | 5.48 | 15.63 | 18.36 | 2.73 |
| SD | 2.85 | 5.54 | 6.63 | 6.07 | 6.32 |
| Max | 14.79 | 26.09 | 41.49 | 35.10 | 17.83 |
| Min | 0.00 | 0.15 | 6.37 | 7.20 | −14.76 |
* Sum of the modeled impacts from the sewer system and agriculture with an assumed natural background of 6 mg/L. ** Difference between observed and modeled total concentrations.
© 2020 by the authors. Licensee MDPI, Basel, Switzerland. This article is an open access article distributed under the terms and conditions of the Creative Commons Attribution (CC BY) license (http://creativecommons.org/licenses/by/4.0/).
Share and Cite
MDPI and ACS Style
Janža, M.; Prestor, J.; Pestotnik, S.; Jamnik, B. Nitrogen Mass Balance and Pressure Impact Model Applied to an Urban Aquifer. Water 2020, 12, 1171. https://doi.org/10.3390/w12041171
AMA Style
Janža M, Prestor J, Pestotnik S, Jamnik B. Nitrogen Mass Balance and Pressure Impact Model Applied to an Urban Aquifer. Water. 2020; 12(4):1171. https://doi.org/10.3390/w12041171
Chicago/Turabian StyleJanža, Mitja, Joerg Prestor, Simona Pestotnik, and Brigita Jamnik. 2020. "Nitrogen Mass Balance and Pressure Impact Model Applied to an Urban Aquifer" Water 12, no. 4: 1171. https://doi.org/10.3390/w12041171
Note that from the first issue of 2016, this journal uses article numbers instead of page numbers. See further details here.