Linking the Recent Glacier Retreat and Depleting Streamflow Patterns with Land System Changes in Kashmir Himalaya, India


1
Geoinformatics Program, School of Earth and Environmental Sciences, University of Kashmir, Hazratbal Srinagar, 190006 Jammu and Kashmir, India
2
Department of Environmental Science, Nichols College, Dudley, MA 01571, USA
*
Author to whom correspondence should be addressed.
Water 2020, 12(4), 1168; https://doi.org/10.3390/w12041168
Submission received: 4 March 2020
/
Revised: 15 April 2020
/
Accepted: 16 April 2020
/
Published: 19 April 2020
(This article belongs to the Special Issue Glacier Watershed Responses to Climate Change)
Abstract
:This study reports the changes in glacier extent and streamflow similar to many Himalayan studies, but takes the unusual step of also linking these to downstream land use changes in Kashmir Valley. This study assessed changes in the area, snout, and equilibrium line altitude (ELA) of four parts of the Kolahoi Glacier using earth observation data from 1962 to 2018. Changes in the discharge of the two streams flowing out from Kolahoi Glacier into the Jhelum basin were also assessed between 1972 and 2018. Additionally, satellite data was used to track the downstream land system changes concerning agriculture, orchards, and built-up areas between 1980 and 2018. This analysis suggested a cumulative deglaciation of 23.6% at a rate of 0.42% per year from 1962 to 2018. The snout of two larger glaciers, G1 and G2, retreated at a rate of 18.3 m a−1 and 16.4 m a−1, respectively, from 1962 to 2018, although the rate of recession accelerated after 2000. Our analysis also suggested the upward shift of ELA by ≈120 m. The streamflows measured at five sites showed statistically significant depleting trends that have been a factor in forcing extensive land system changes downstream. Although the area under agriculture in Lidder watershed shrunk by 39%, there was a massive expansion of 176% and 476% in orchards and built-up areas, respectively, from 1980 to 2018. The conversion of irrigation-intensive agriculture lands (rice paddy) to less water-intensive orchards is attributed to economic considerations and depleting streamflow.
1. Introduction
Himalayan glaciers are in a continuous state of retreat since the 19th century in response to climatic change and anthropogenic activities [1,2,3] except in the Karakoram region where glaciers have been reported to be in a stable phase [4,5,6]. The ever increasing temperatures have resulted in the faster melting of cryosphere reserves in the region [7,8]. Although most of the studies consider climate to be the main controlling factor in glacier recession [9,10,11], many studies identify the influence of topography [12,13,14] and debris cover on glacier retreat [15,16]. The warming trends over the region have not only accelerated the glacier melt [17,18,19] but have also changed the form of precipitation [20,21] that has resulted in persistently negative glacier mass balances in the region [22,23].
The glacier recession in the Himalayan arc has not only impacted the streamflows but also resulted in the formation of proglacial lakes [24,25], which could be potential sites for occurrence of glacial lake outburst floods. Compared to other regions of high-mountain Asia, the glaciers in the Kashmir region are retreating at an accelerated pace [26]. The shrinking of the Himalayan cryosphere has been linked to decrease in the streamflows in the Himalayan Rivers [7,27,28,29], which could affect water availability downstream [30]. Studies suggest that the glacier recession in the Kashmir valley has already resulted in the depleted streamflows downstream [31,32]. The land system changes in the region [33,34,35,36] have been linked to depleting streamflows, economic considerations, and unplanned land transformation.
The use of remote sensing data for quantifying land system changes over the Kashmir region has been widely documented [37,38,39,40]. At the same time, there is substantial scientific literature detailing the glacier retreat prevalent over the region. A recent study indicated that the glaciers in the Ladakh region are retreating at 0.55% a−1 [41], whereas another study [42] reported few stable and advancing glaciers in the Zanskar region of Jammu and Kashmir. Similar retreat estimates have been put forth for the Zanskar region for the glacier area changes carried between 1989 and 2007 [43]. However, very conservative area changes (0.16% a−1) have been reported for the neighboring Suru basin [44] for the glacier area changes assessed for the 1977–2017 period. In another study carried out in the Lidder watershed of the Jhelum basin, the glaciers were reported to be shrinking at 0.51% a−1 [17]. Glacier mass change over the western Himalayas has accelerated from 0.33 to 0.5 m w.e. (water equivalent) per year between 1970–2000 and 2000–2010, respectively [45]. There are no studies to our knowledge that link the glacier recession and streamflow patterns with downstream land system changes. In this backdrop, this study assessed the changes in the extents of Kolahoi Glacier, the largest glacier in Kashmir Valley; discharge trends and associated land system changes between 1962 and 2018 using remote sensing imageries; and in situ streamflow data at the catchment scale. We assessed area, snout, and equilibrium line altitude (ELA) in the four parts of Kolahoi using a topographic map of 1962 and remote sensing data from 1979 to 2018. The land system changes in terms of changes in agriculture, orchards, and settlements were quantified from 1980 to 2018. Additionally, historical streamflow data at five sites (four in Lidder and one in Sind) were analyzed for trends in discharge in Lidder and Sind watershed. This was aimed to ascertain the impact glacier retreat and associated hydrological changes on the land system changes downstream.
2. Materials and Methods
2.1. Study Area Description
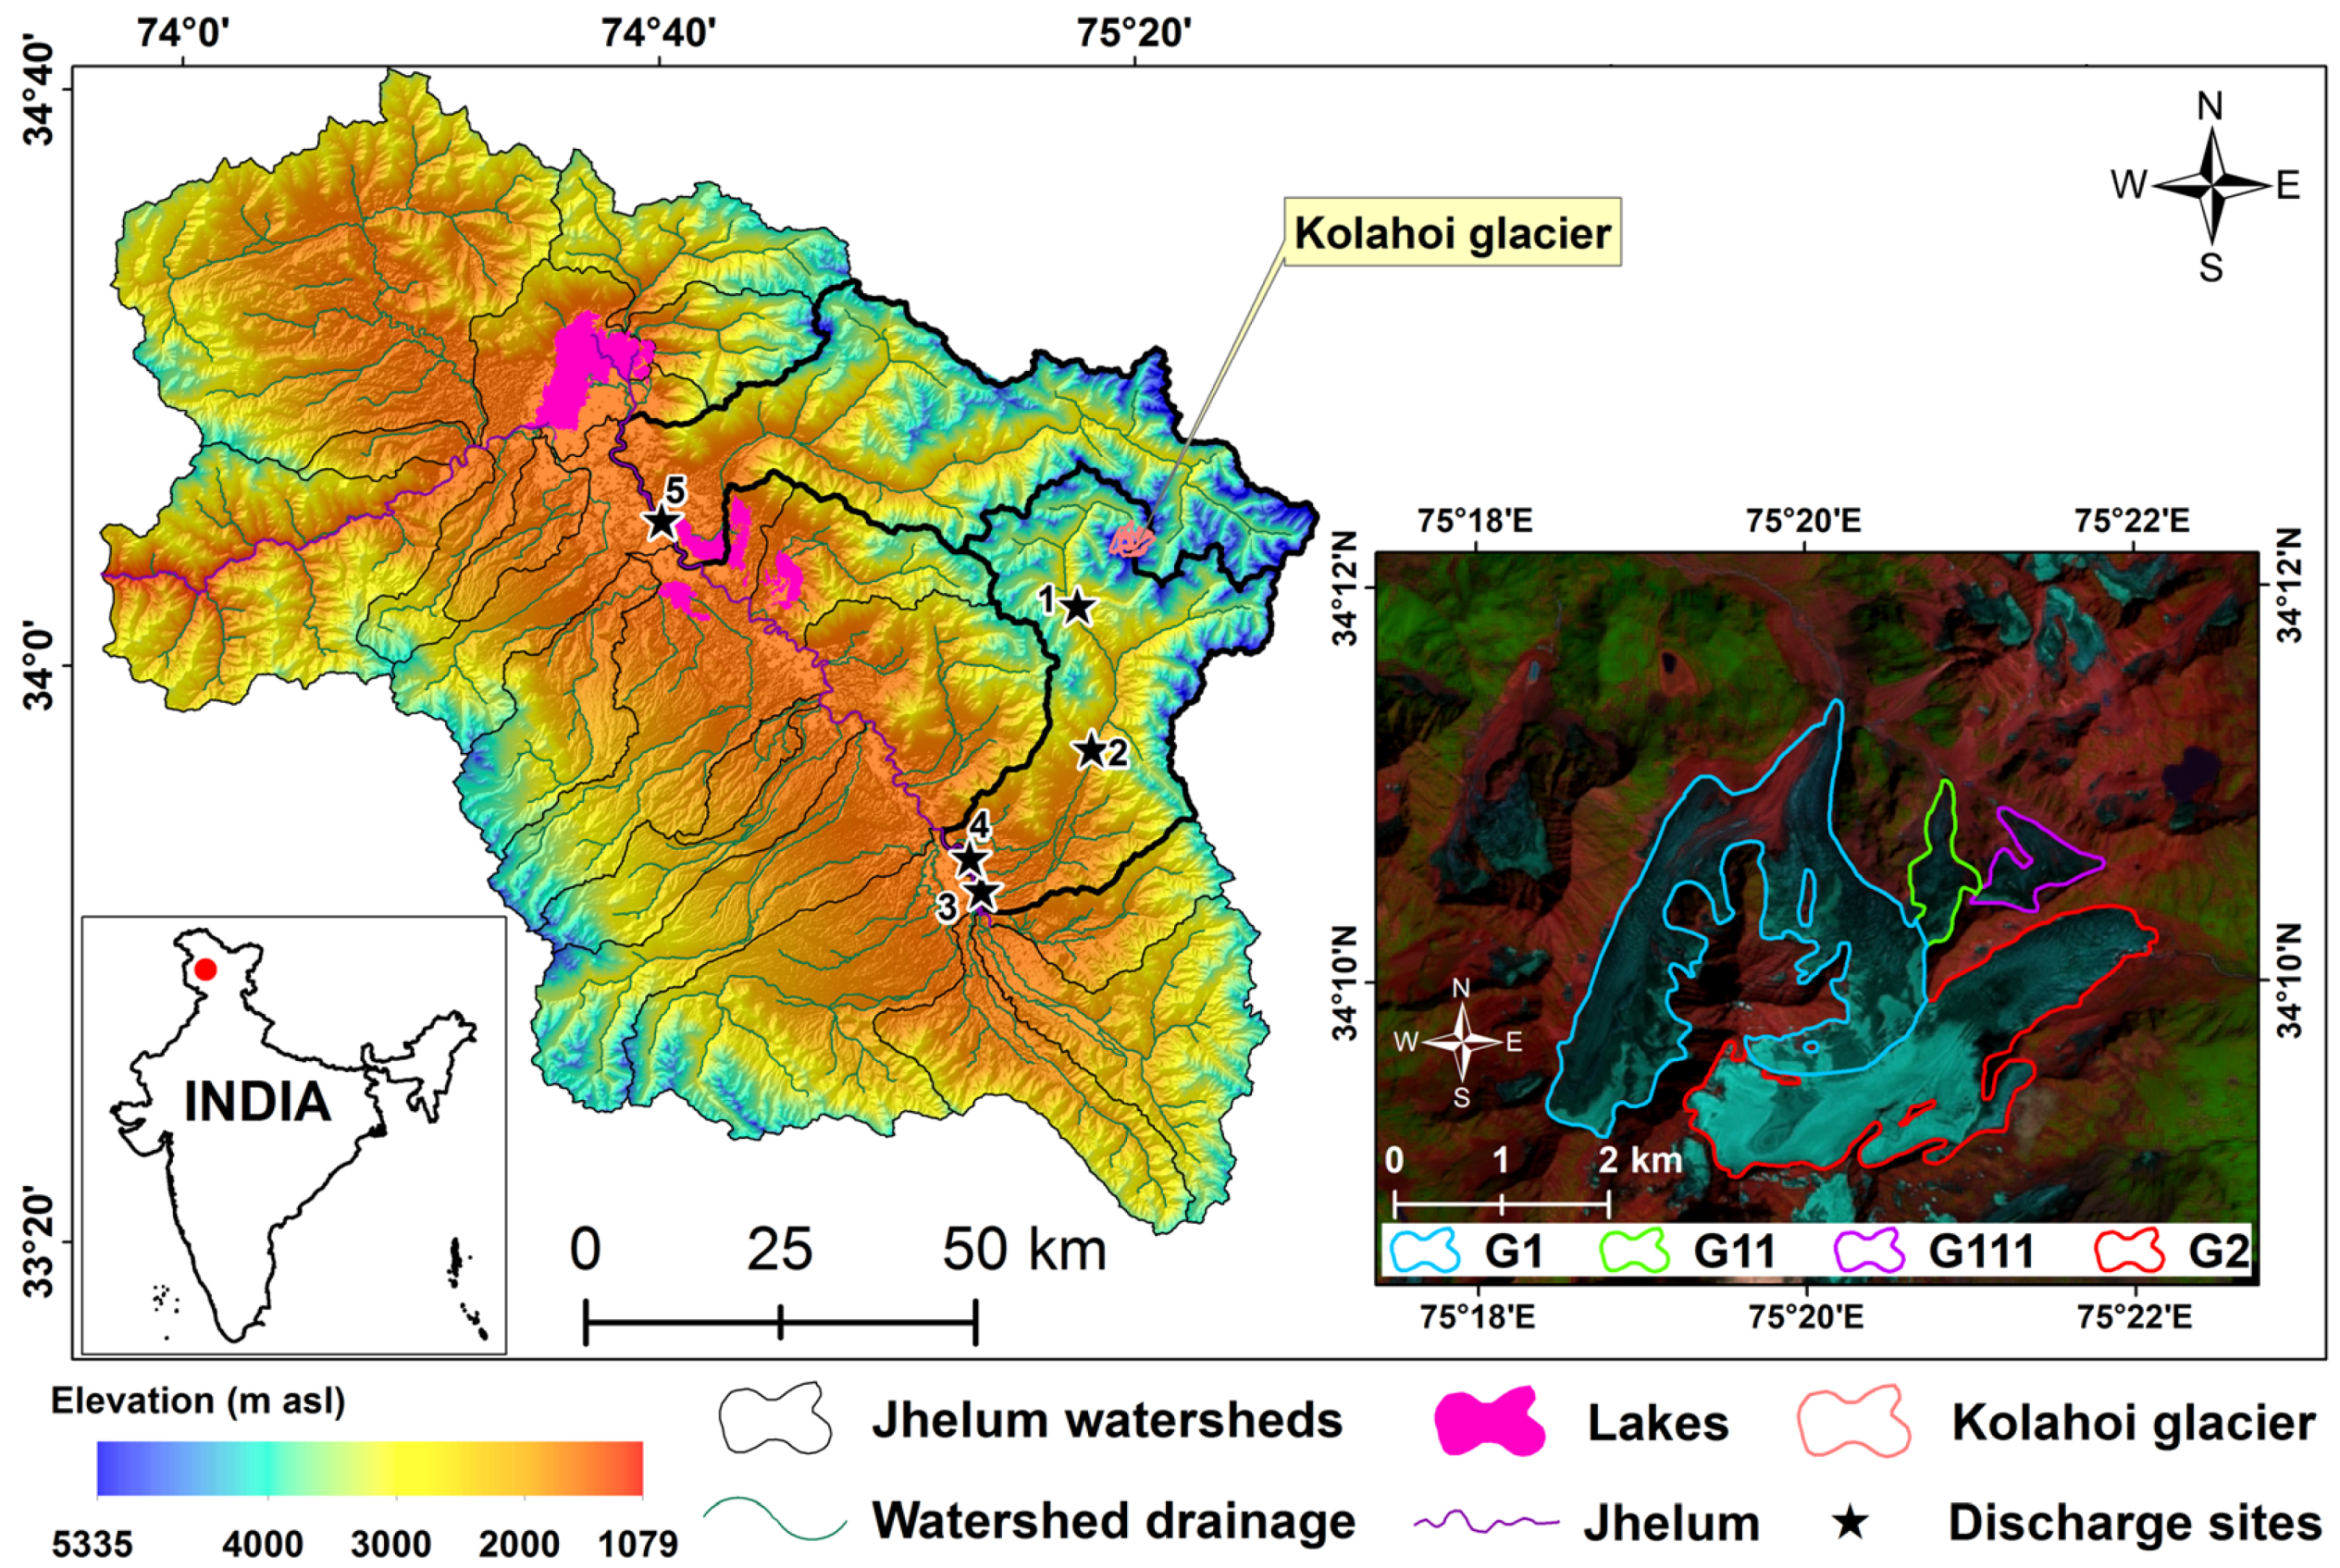
This study was carried out on Kolahoi Glacier, spread between Lidder and Sind watersheds, in the greater Himalayan mountain range of Kashmir valley, India (Table 1, Figure 1).
Both Lidder and Sind streams are major tributaries of Jhelum River and originate from the Kolahoi Glacier. The streams are being fed many other smaller glaciers and seasonal snow-packs [46]. The area falls in a temperate climate zone with four distinct seasons: spring, summer, autumn, and winter. The mean annual precipitation recorded at Pahalgam located at an elevation of 2150 m above mean sea level (asl) is 1240 mm. A dominant amount of this precipitation falls as snow during winter and spring from westerlies, whereas summer and autumn are relatively drier. The minimum temperature during winter can drop below −18 °C, whereas the maximum temperature can rise up to 30 °C during summer [47]. The topography of the Lidder watershed is hilly, covered by snow and glaciers or rock outcrop in higher reaches (>3600 m asl). Relatively mid-altitude reaches of the watershed are covered by alpine meadows (>3000 m asl) and dense evergreen coniferous forest (1600–3600 m asl), whereas the fertile alluvial plains (1580–2200 m asl) towards the south of watershed are dominated by agriculture, orchards, and settlements [48].
2.2. Datasets and Methods
A repository of data from multiple sources comprising satellite images, digital elevation models (DEMs), topographic map, ground truth, and ancillary records have been used to complete this study. The details of the datasets are provided as Supplementary Information (Table 2).
2.2.1. Quantifying Glacier Changes
This study assessed changes in the Kolahoi Glacier between 1962 and 2018. However, keeping in mind the recession of glacier and GLIMS (Global Land Ice Measurements from Space) definition that suggests that the ice divides define the hydrological boundaries of glaciers, changes in the spatial extents of four parts of the glacier (G1, G11, G111, G2) were assessed. The apparently connected units were separated in the accumulation zone using 3D information from ASTER DEM and Google Earth [49,50]. Although G1, G11, and G111 drain into Lidder, G2 drains into the Sind watershed of the Jhelum basin [51]. The changes in the overall area of Kolahoi Glacier and also its four parts were assessed using multi-date satellite data (1992–2018) and Survey of India Topographic map of 1962. Although the entire Landsat data archive is available as a georeferenced product, the topographic map was coregistered with satellite data using map-to-image georeferencing [52] in ERDAS Imagine 9.1. The ground control points, which consisted of permanent features such as bridges, mountain ridges, and prominent street crossings, were identified from both the topographic map and satellite data to ensure better geometric correction, achieving a root mean square (RMS) error of less than 1.00. This allowed co-registration of all the images and topographic map so that they could be draped over each other to precisely delineate glacier extents across timescales. Satellite data from the end of the ablation season, August to October, was used to delineate the glacier extent. Because clouds on the satellite data mask the surface features, we ensured cloud-free images for glacier delineation. Glacier boundaries were delineated using on-screen digitization at a 1:30,000 scale for 1962, 1992, 2000, 2013, and 2019 using standard false color composite band combination of 5-NIR:4-Red:3-Green for Landsat 8 OLI data and 4-NIR:3-Red:2-Green for Landsat TM Landsat ETM+ data. Additionally, 3D perspective and historical imagery from Google Earth helped in delineating areas that were influenced by terrain shadows. The snout retreat of Kolahoi Glacier was also mapped for 57 years from 1962 to 2019. Image enhancement techniques in Arc Map 10.1, histogram equalization and contrast stretch were also applied to the satellite data for better delineation of glacier extents [53]. Additionally, glacier boundaries delineated from 2013 and 2018 satellite data were also corrected using high-resolution Google Earth Imagery. The 2013 and 2018 outlines were converted into KML (Keyhole Markup Language) files and imported into Google Earth. Modifications to the KML files were made, wherever required, using high-resolution images and 3D terrain information from Google Earth.
The accuracy of glacier delineation is influenced by the spatial resolution (λ) of satellite data and error in georeferencing (ε) the satellite data [54] as
where EA is the uncertainty in the glacier area and n is the number of pixels along the boundary of the glacier polygon.
The uncertainties related to the changes in the glacier area (EAC) can be expressed [55] as
where EA1 and EA2 represent uncertainties in the glacier area between two time periods.
The uncertainties related to the changes in glacier snout (ESC) can be expressed as
where λ1 and λ2 represent the spatial resolution of images between two time periods.
Because the entire Landsat archive is available as an orthorectified product, the co-registration error between the images was found to be negligible and thus not influencing the uncertainties.
The changes in the equilibrium line altitude (ELA) representing the highest observed snowline at the end of the ablation season were observed using satellite data (1990 and 2018) and multi-source DEMs [56,57,58]. This involved delineation of snowline at the end of the ablation season from satellite data using manual digitization. The elevation values of those pixels were extracted from DEM of the snowline. This was completed using a module generating points at 30 m interval in Arc Map 10.1. The arithmetic mean of the extracted elevation values represented ELA.
2.2.2. Historical Sstreamflow Patterns
A time series of discharge data from four observation stations (1–4) along the length of the Lidder River from 1972 to 2018 were used in this analysis and were correlated with glacier changes. Additionally, discharge data from 1986 to 2017 of one station (5) having its contribution from the G2 glacier that drains into the Sindh tributary of Jhelum was also analyzed in this study (Figure 1). The historical streamflow data were procured from the Department of Irrigation and Flood Control, Srinagar. The statistical significance of discharge trends for all the four stations was also analyzed using the Mann–Kendall test (details in [59,60]) in Trend Software (available at https://toolkit.ewater.org.au/). It is pertinent that the Mann–Kendall test has been widely used for estimating the significance of trends in time series of hydrometeorological data across the mountain regions [61,62,63,64]. The Man–Kendall statistic, denoted by S, is computed as
where X represents observations of time series and n is length of time series.
For computing the Z statistic, it is imperative to assess the variance of S, V(S), as
where tm is the number of ties of extent m.
The standard test statistic Z is computed as
The positive Z values indicate increasing trend and vice versa. The testing of trends is performed at a specific significance level (a), in this case at 90% (a = 0.1) and 99% (a = 0.01). When |Z| > |Z1 − a/2|, the null hypothesis is rejected, indicating that a significant trend exists in the time series. At the significance level of 90% and 99%, the null hypothesis of no trend is rejected if |Z| > 1.645 and |Z| > 2.576, respectively.
The slope of the streamflow data was estimated using the Theil–Sen approach as
where b is the slope of the trend and Xl is the lth observation.
2.2.3. Downstream Land System Changes
The land system changes downstream were mapped using satellite data of 1980, 1992, 2005, 2013, and 2019. This study primarily looked at how the area under agriculture, orchards, and built-up areas changed between 1980 and 2018. These land-use types were delineated using on-screen digitization of satellite data in Arc Map 10.1 at a 1:10,000 scale. The accuracy of land use types delineated for 1980, 1992, 2005, and 2013 was ascertained from published data [48,65]. The accuracy of 2018 generated data was obtained utilizing the field survey data about land uses. The overall accuracy and land use-wise accuracy was computed using the following formula [66]:
where ρ is accuracy, n is the number of correctly classified samples, and N is the total samples taken.
Additionally, informal interviews were held with 142 residents to ascertain the possible causes of land system changes in the Lidder catchment. The interview was composed of two questions: (1) “Is the area experiencing any change in climate?” and (2) “Are the changes in the land system caused by climatic or economic considerations?”
3. Results
3.1. Glacier Area Changes
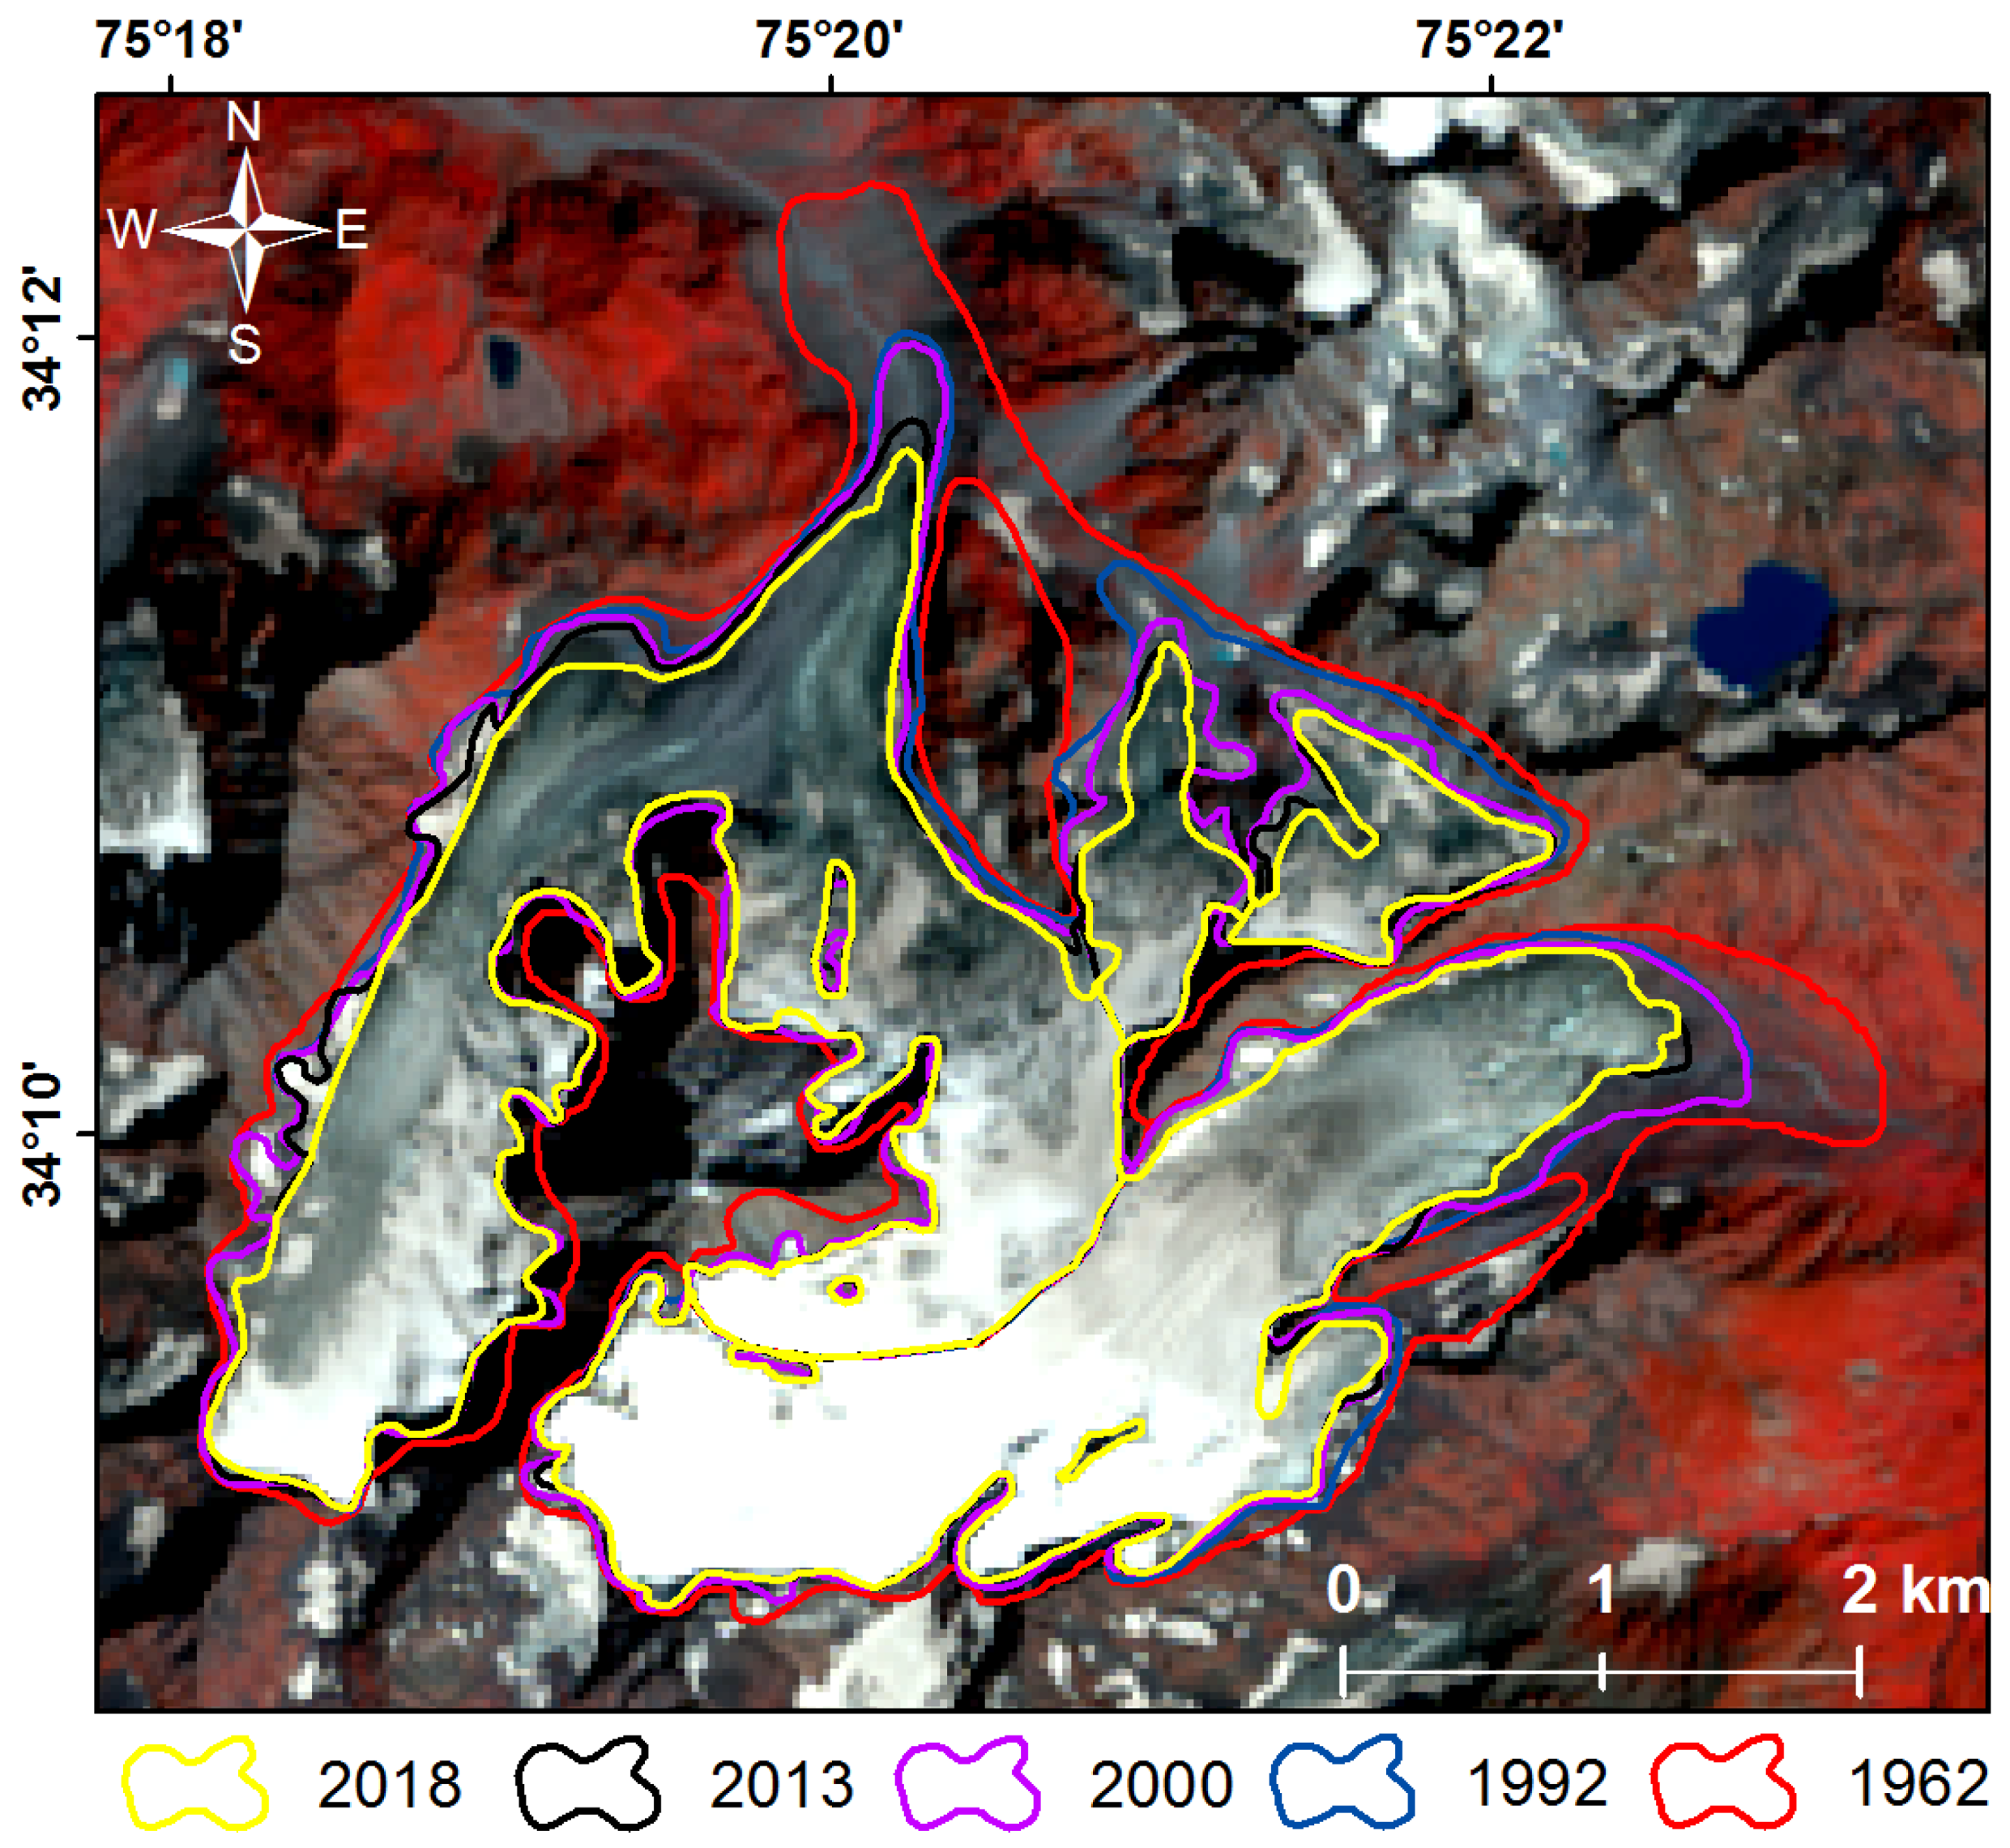
This analysis suggested that the Kolahoi Glacier was spread over an area of 10.5 ± 0.84 km2 in 2018. Analysis of 2018 satellite data suggests that the four parts of the Kolahoi Glacier are spread over 5.32 ± 0.43 km2 (G1), 0.5 ± 0.08 km2 (G11), 0.51 ± 0.08 km2 (G111), and 4.17 ± 0.31 km2, separately (Table 3). We assessed changes in the four parts of the glacier in terms of area, snout position, and ELA from 1962 to 2018. Our analysis indicated that the glacier lost 23.6% (3.41 km2) of its 1962 area (Figure 2). Although the glacier in 1962 was divided into two parts (G1 and G2 draining into Lidder and Sind watersheds, respectively), the deglaciation of G1 resulted in its further fragmentation into two parts—G1 (6.41 ± 0.5 km2) and G11 (1.85 ± 0.14 km2)—by 1990.
Between 1990 and 2000, the G11 part further fragmented into two parts: G11 (0.69 ± 0.07 km2) and G111 (0.72 ± 0.09 km2). The areas of G1, G11, G111, and G2 were 5.63 ± 0.46 km2, 0.53 ± 0.07 km2, 0.54 ± 0.09 km2, and 4.25 ± 0.3 km2, respectively, in 2013. By 2018, the G1, G11, G111, and G2 deglaciated to 5.32 ± 0.43 km2, 0.5 ± 0.08 km2, 0.51 ± 0.08 km2, and 4.17 ± 0.31 km2, respectively. The analysis indicated that the retreat rate of Kolahoi Glacier tripled from 0.26% per year to 0.76% per year between 1962 and 2000, and 2000 and 2018, respectively. G1 and G2 lost 27.57% and 16.36%, respectively, from 1962 to 2018, of their 1962 area. Our analysis indicated that G1 retreated at a relatively higher pace (0.49% per year) compared to G2 (0.29% per year). From 1962 to 2000, G1 and G2 lost an area at a rate of 0.33% per year and 0.12% per year, respectively. The retreat rate accelerated to 0.82% per year for G1 and 0.65% per year for G2 between 2000 and 2018.
3.2. Changes in Glacier Snout
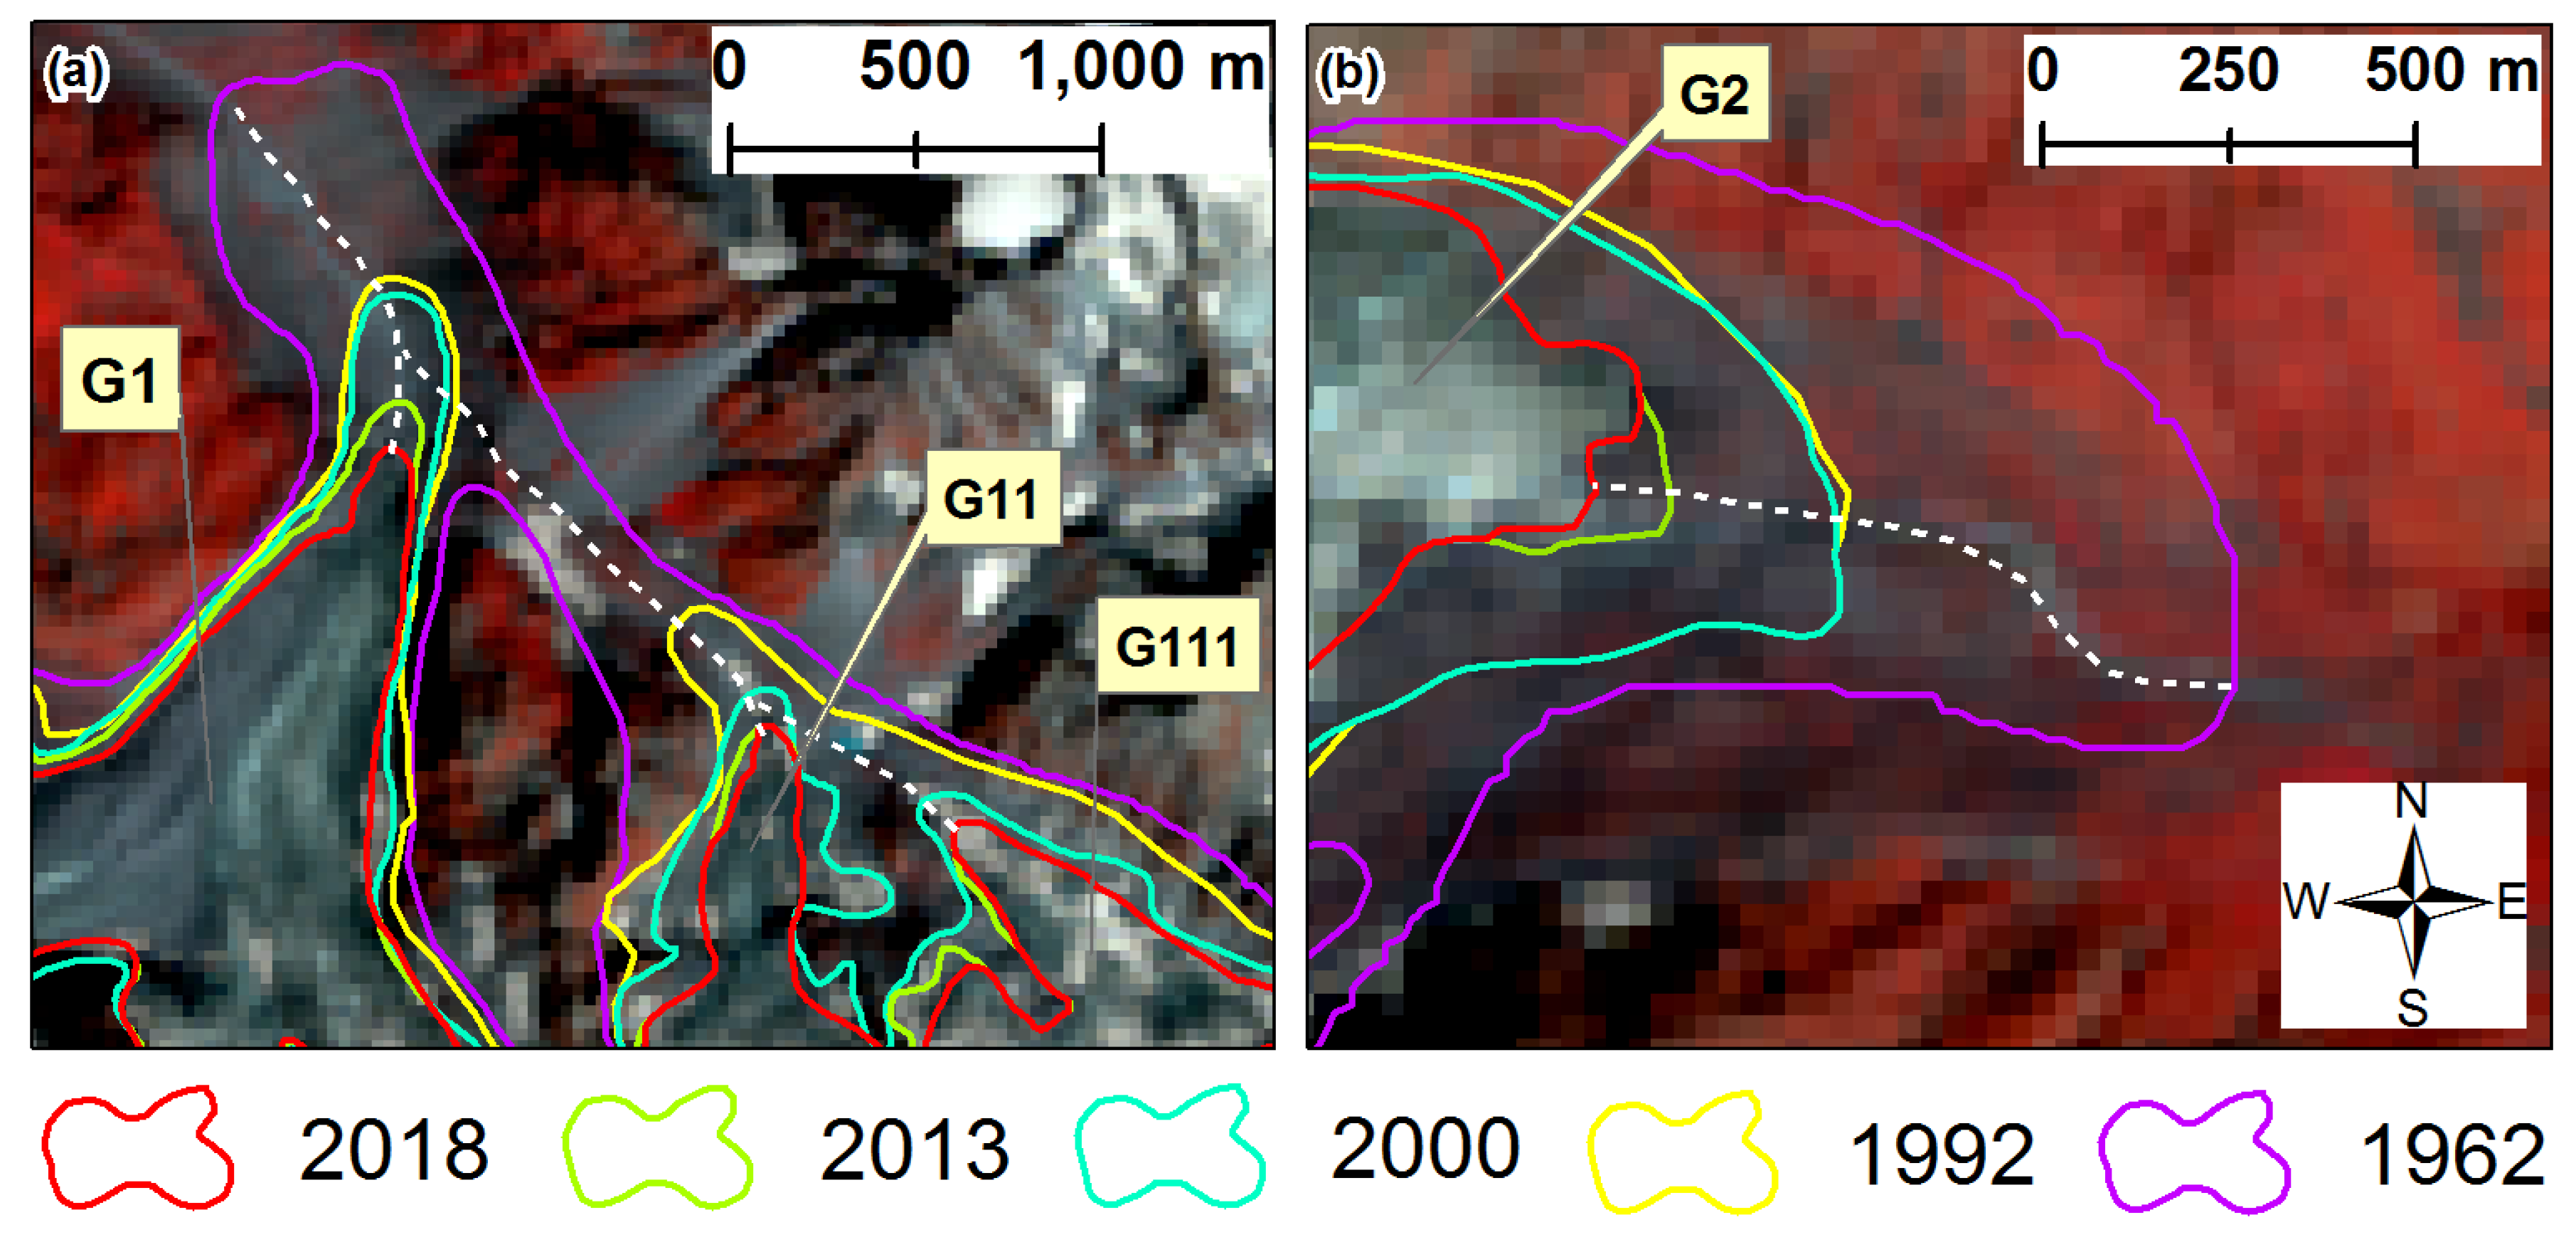
The analysis of multi-date satellite images indicated that the snouts of G1 and G2 retreated at a rate of 18.3 ± 0.69 m a−1 and 16.4 ± 0.69 m a−1, respectively, between 1962 and 2018 (Figure 3). However, the rate of retreat was variable across different periods. The snout of G1 and G2 retreated at 19.5 ± 1.4 m a−1 and 19.1 ± 1.4 m a−1, respectively, from 1962 to 1992. The snout recession decelerated during 1992–2000 to 6.1 ± 5.3 m a−1 (G1) and 2.8 ± 5.3 m a−1 (G2), indicating stability. The recession again picked up during 2000-2013 to 22.6 ± 3.2 m a−1 and 20.3 ± 3.2 m a−1 for G1 and G2, respectively. The highest rates of snout retreat at 24.4 ± 6 m a−1 for G1 and 27.1 ± 6 m a−1 for G2 were observed during 2013–2018. Although G11 formed in 1990, its snout retreated by 2200 ± 39 m at a rate of 39.28 ± 0.69 m a−1 between 1962 and 2018. Similarly the fragmentation of G11 resulted in the formation of G111 in 2000, whose snout retreated by 917 ± 42.4 m at a rate of 35.27 ± 1.6 m a−1 from 1992 to 2018.
3.3. Changes in ELA
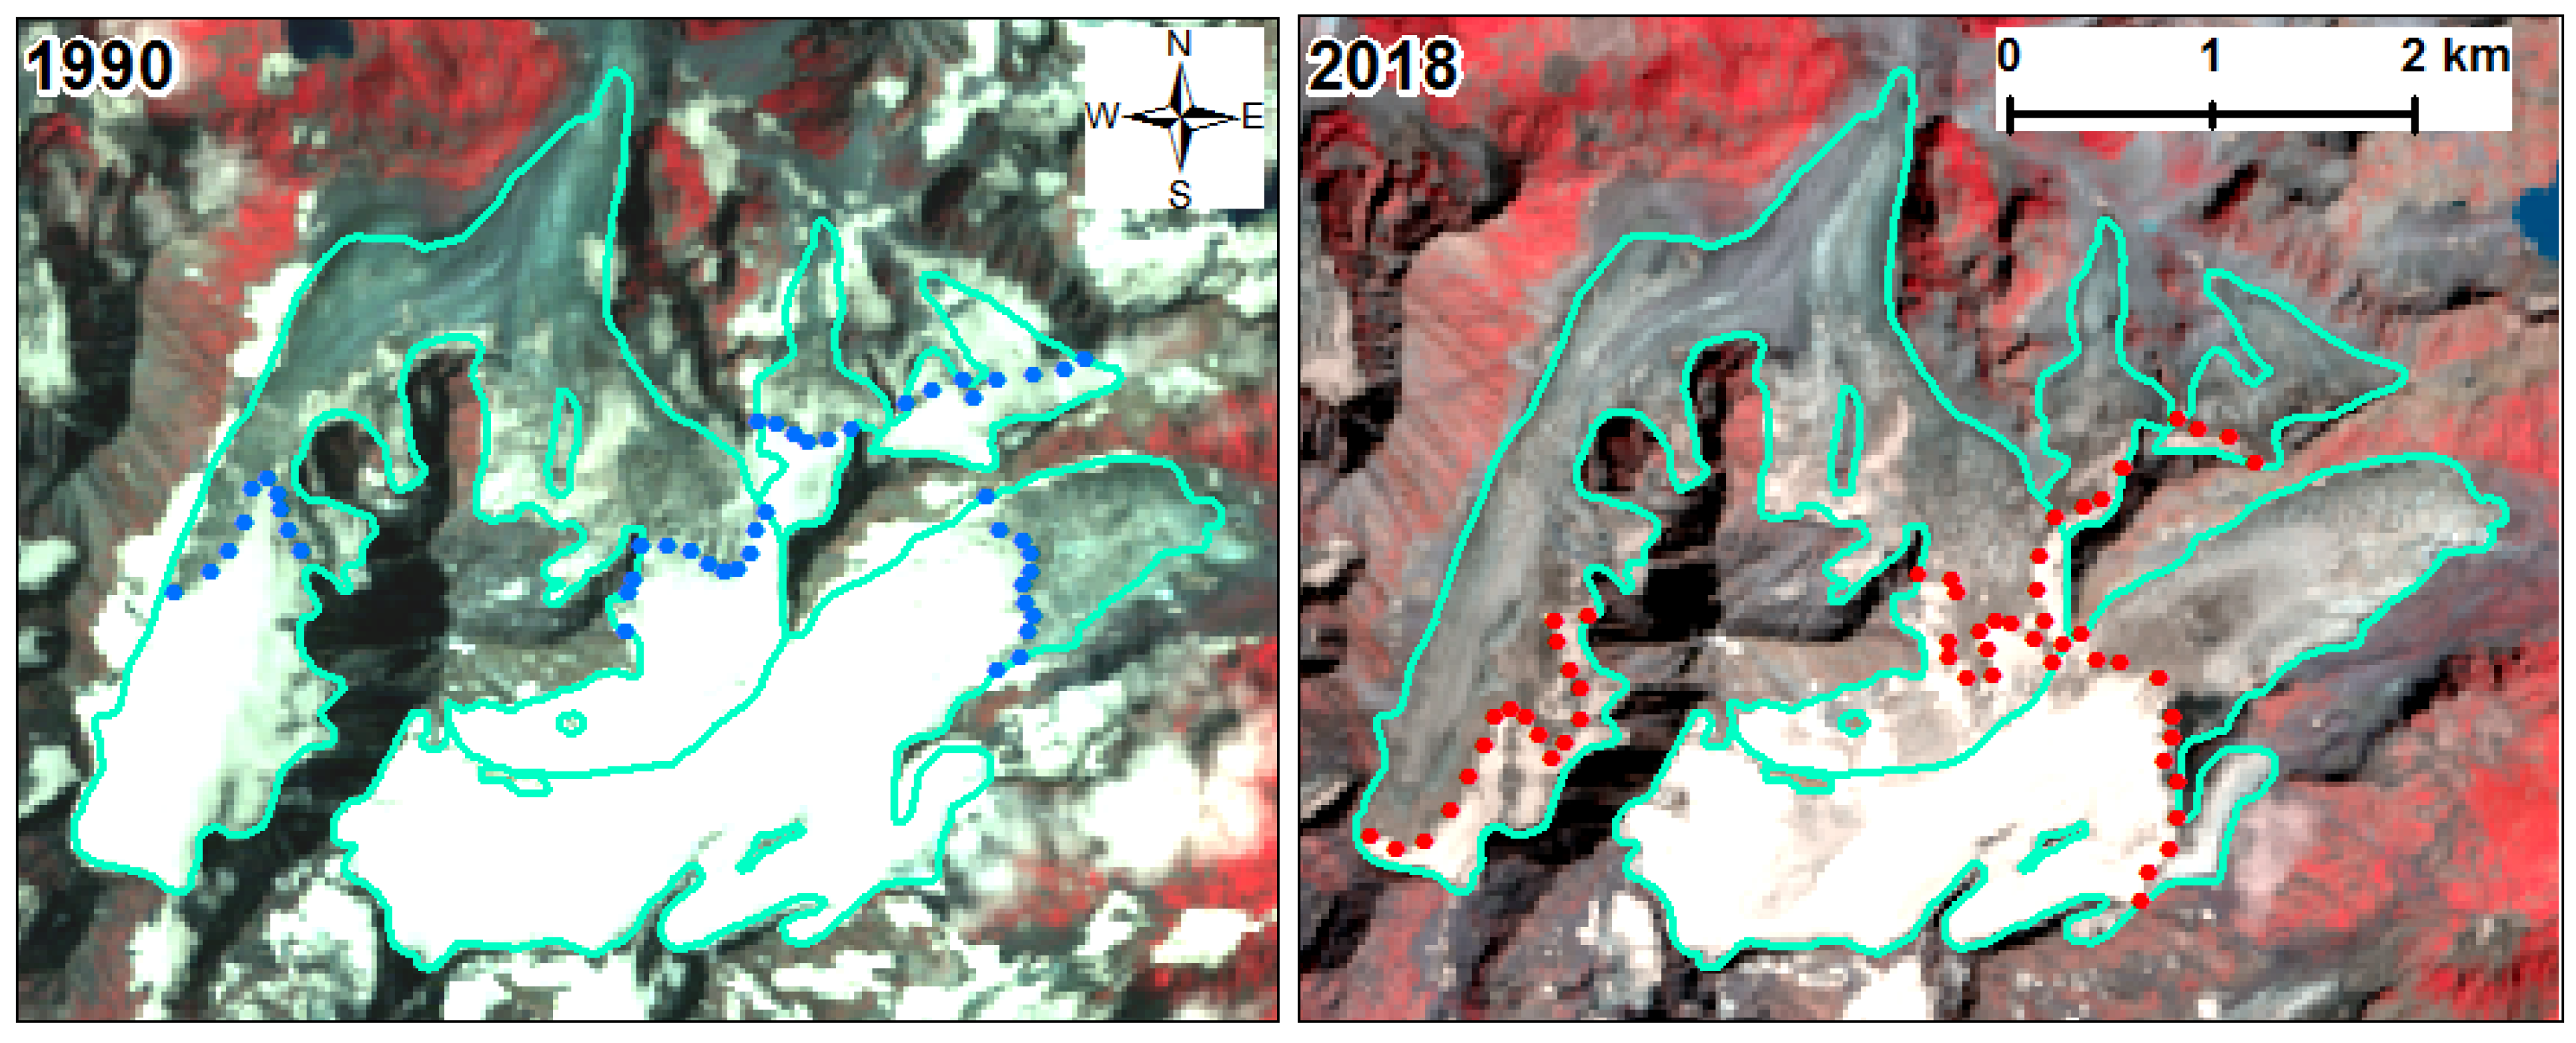
The ELA of all the four parts of the Kolahoi Glacier showed consistent signs of an upward shift from 1990 to 2018 (Figure 4). The ELA changes using satellite images and SRTM DEM indicated that the ELA of Kolahoi Glacier shifted upward by 120 m (4.6 m a−1) from 4420 m asl in 1990 to 4540 m asl in 2018. The ELA of G1, G11, G111, and G2 shifted by 88, 90, 103, and 194 m, respectively, during the same period. The analysis based on ALOS DEM indicated the ELA shift of 116 m (4.5 m a−1) from 4442 to 4539 m asl for the glacier. The ELA of G1, G11, G111, and G2 shifted by 80, 93, 102, and 190 m, respectively, from 1992 to 2018. The results from ASTER DEM and TanDEMx indicated a mean shift of 125 m (4.8 m a−1) and 137 m (5.3 m a−1) for the glacier between 1992 and 2018. The average shift of ELA based on all the four DEMs used for the purpose indicated that the ELA of the glacier shifted by 124 m. The satellite data analysis also indicated that the ELA of the larger parts G1 and G2 shifted by 85 and 200 m, respectively, at the rate of 3.7 m a−1 and 7.7 m a−1, respectively, from 1992 to 2018.
3.4. Streamflow Patterns
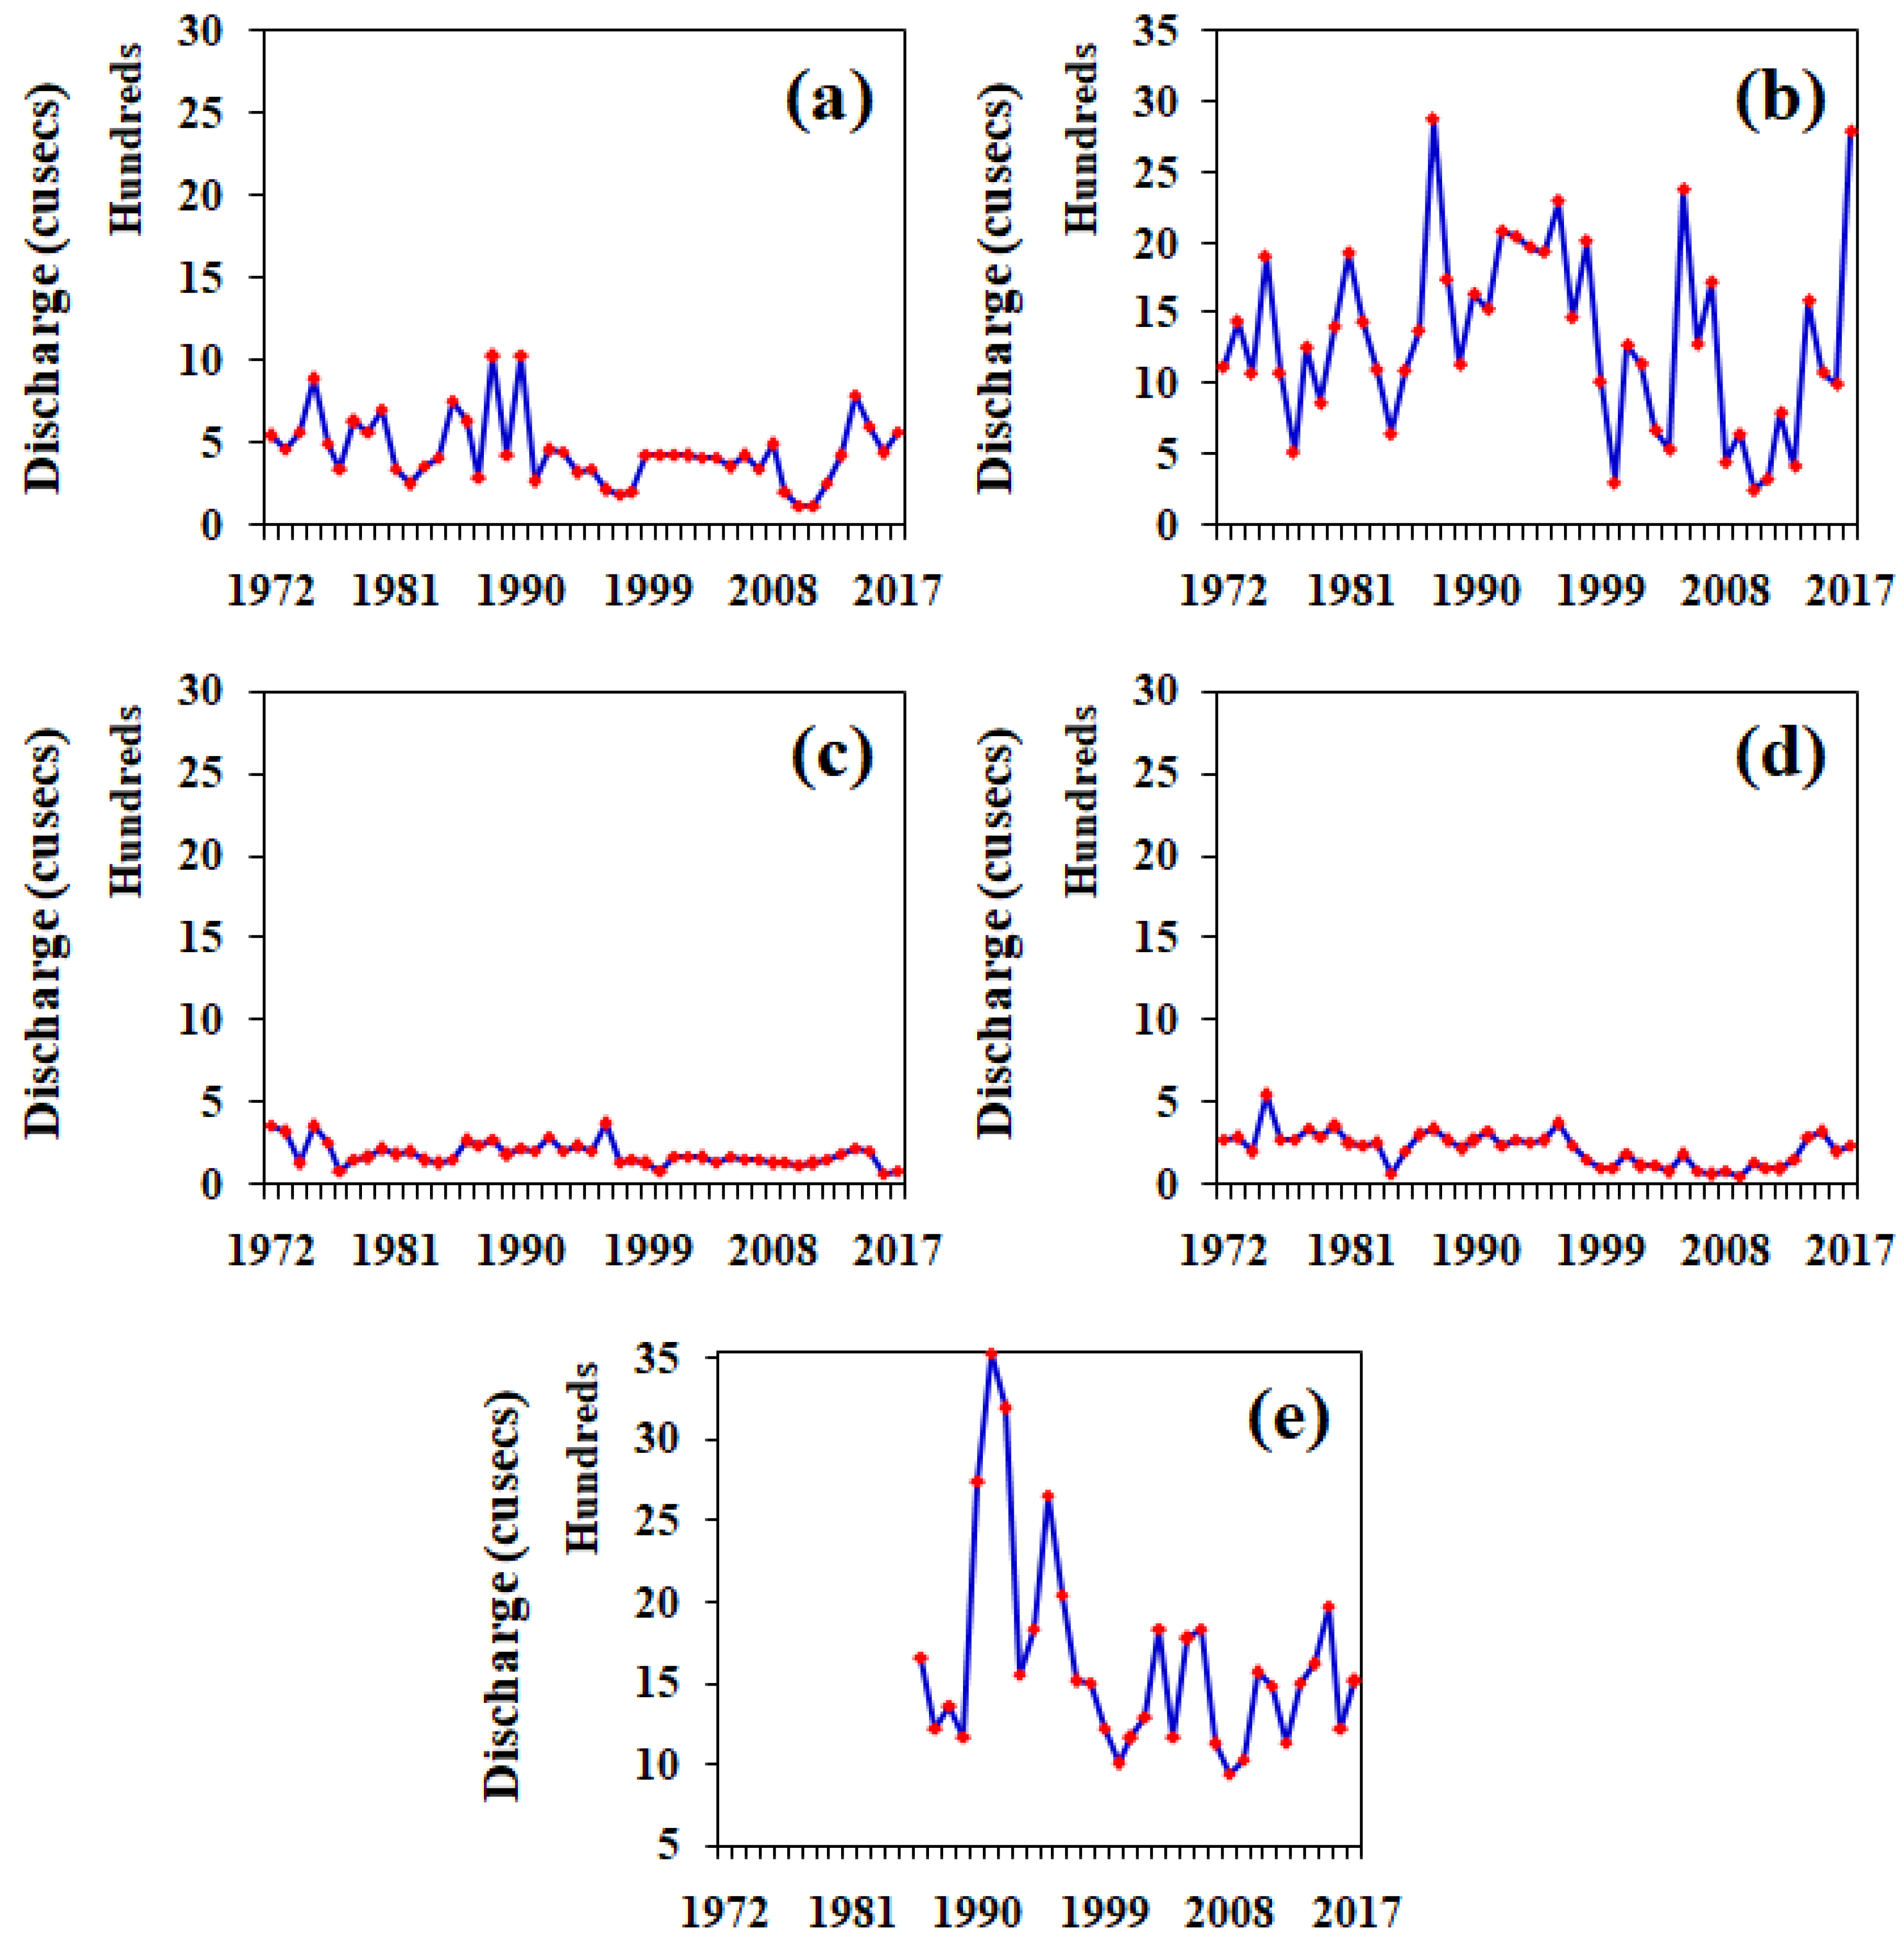
Although discharge data for four gauging sites were obtained for Lidder watershed, the long-term discharge data of one downstream site was available for Sindh watershed (Figure 1). The Aru station (ID-1) located at an elevation of 2436 m asl is the highest discharge observation site located ≈8 km downstream of G1. The analysis of time series of discharge data at Aru (Figure 5a) revealed that the discharge at Aru showed a statistically significant decrease in discharge during the observation period.
The annual discharge at Aru varied from 112 to 1031 cusecs with a mean annual discharge of 447 cusecs. It is pertinent to mention that 17 of the last 20 years of the observation period experienced below-average discharge at Aru. The analysis of time series of discharge data at Batakoot (ID-2), located at an elevation of 1919 m asl and 41 km downstream with respect to G1, indicated statistically insignificant depleting streamflows (Figure 5b). The annual discharge at Batakoot varied from 249 to 2879 cusecs, with an average annual discharge of 1320 cusecs. The higher streamflow at Batakoot compared to Aru is attributed to small tributaries pouring into the Lidder River. The recent streamflows indicated that 15 of the last 20 years of the observation period experienced below-average discharge at Batakoot. Discharge data of downstream station Gur (ID-3) located at an altitude of 1599 m asl and 68 km downstream of G1 snout indicated more pronounced statistically significant depleting streamflows during the observation period (Figure 5c). The annual discharge at this site varied from 59 to 366 cusecs, with an average annual discharge of 183 cusecs. Our analysis indicated that 18 of the last 20 years of the observation period at Gur experienced below-average discharge. Discharge data of another downstream station Kirkadal (ID-4) located at an altitude of 1592 m asl and 75 km downstream of G1 snout indicated statistically significant highest depleting streamflows in the Lidder watershed during the observation period (Figure 5d). The annual discharge at this site varied from 49 to 542 cusecs, with an average annual discharge of 215 cusecs. Our analysis indicated that 17 of the last 20 years of the observation period at Kirkadal experienced below-average discharge. Discharge data of the only downstream station, Narayanbagh (ID-5), located at an altitude of 1583 m asl and 98 km downstream of G2 snout, also indicated non-significant depleting streamflows in the Sindh watershed during the observation period from 1986 to 2017 (Figure 5e). The annual discharge at this site varied from 943 to 3528 cusecs, with an average annual discharge of 1633 cusecs. Our analysis indicated that 17 of the last 20 years of the observation period at Narayanbagh experienced below-average discharge. The details of the statistical trend analysis are provided in Table 4 below. Both S-score and Z-statistic for the gauging sites confirmed the statistically significant depleting streamflows, however, Theil–Sen slope indicated higher values for Batakoot and Narayanbagh, owing to the higher degree of variability in discharge as compared to other sites.
3.5. Quantifying Land System Changes
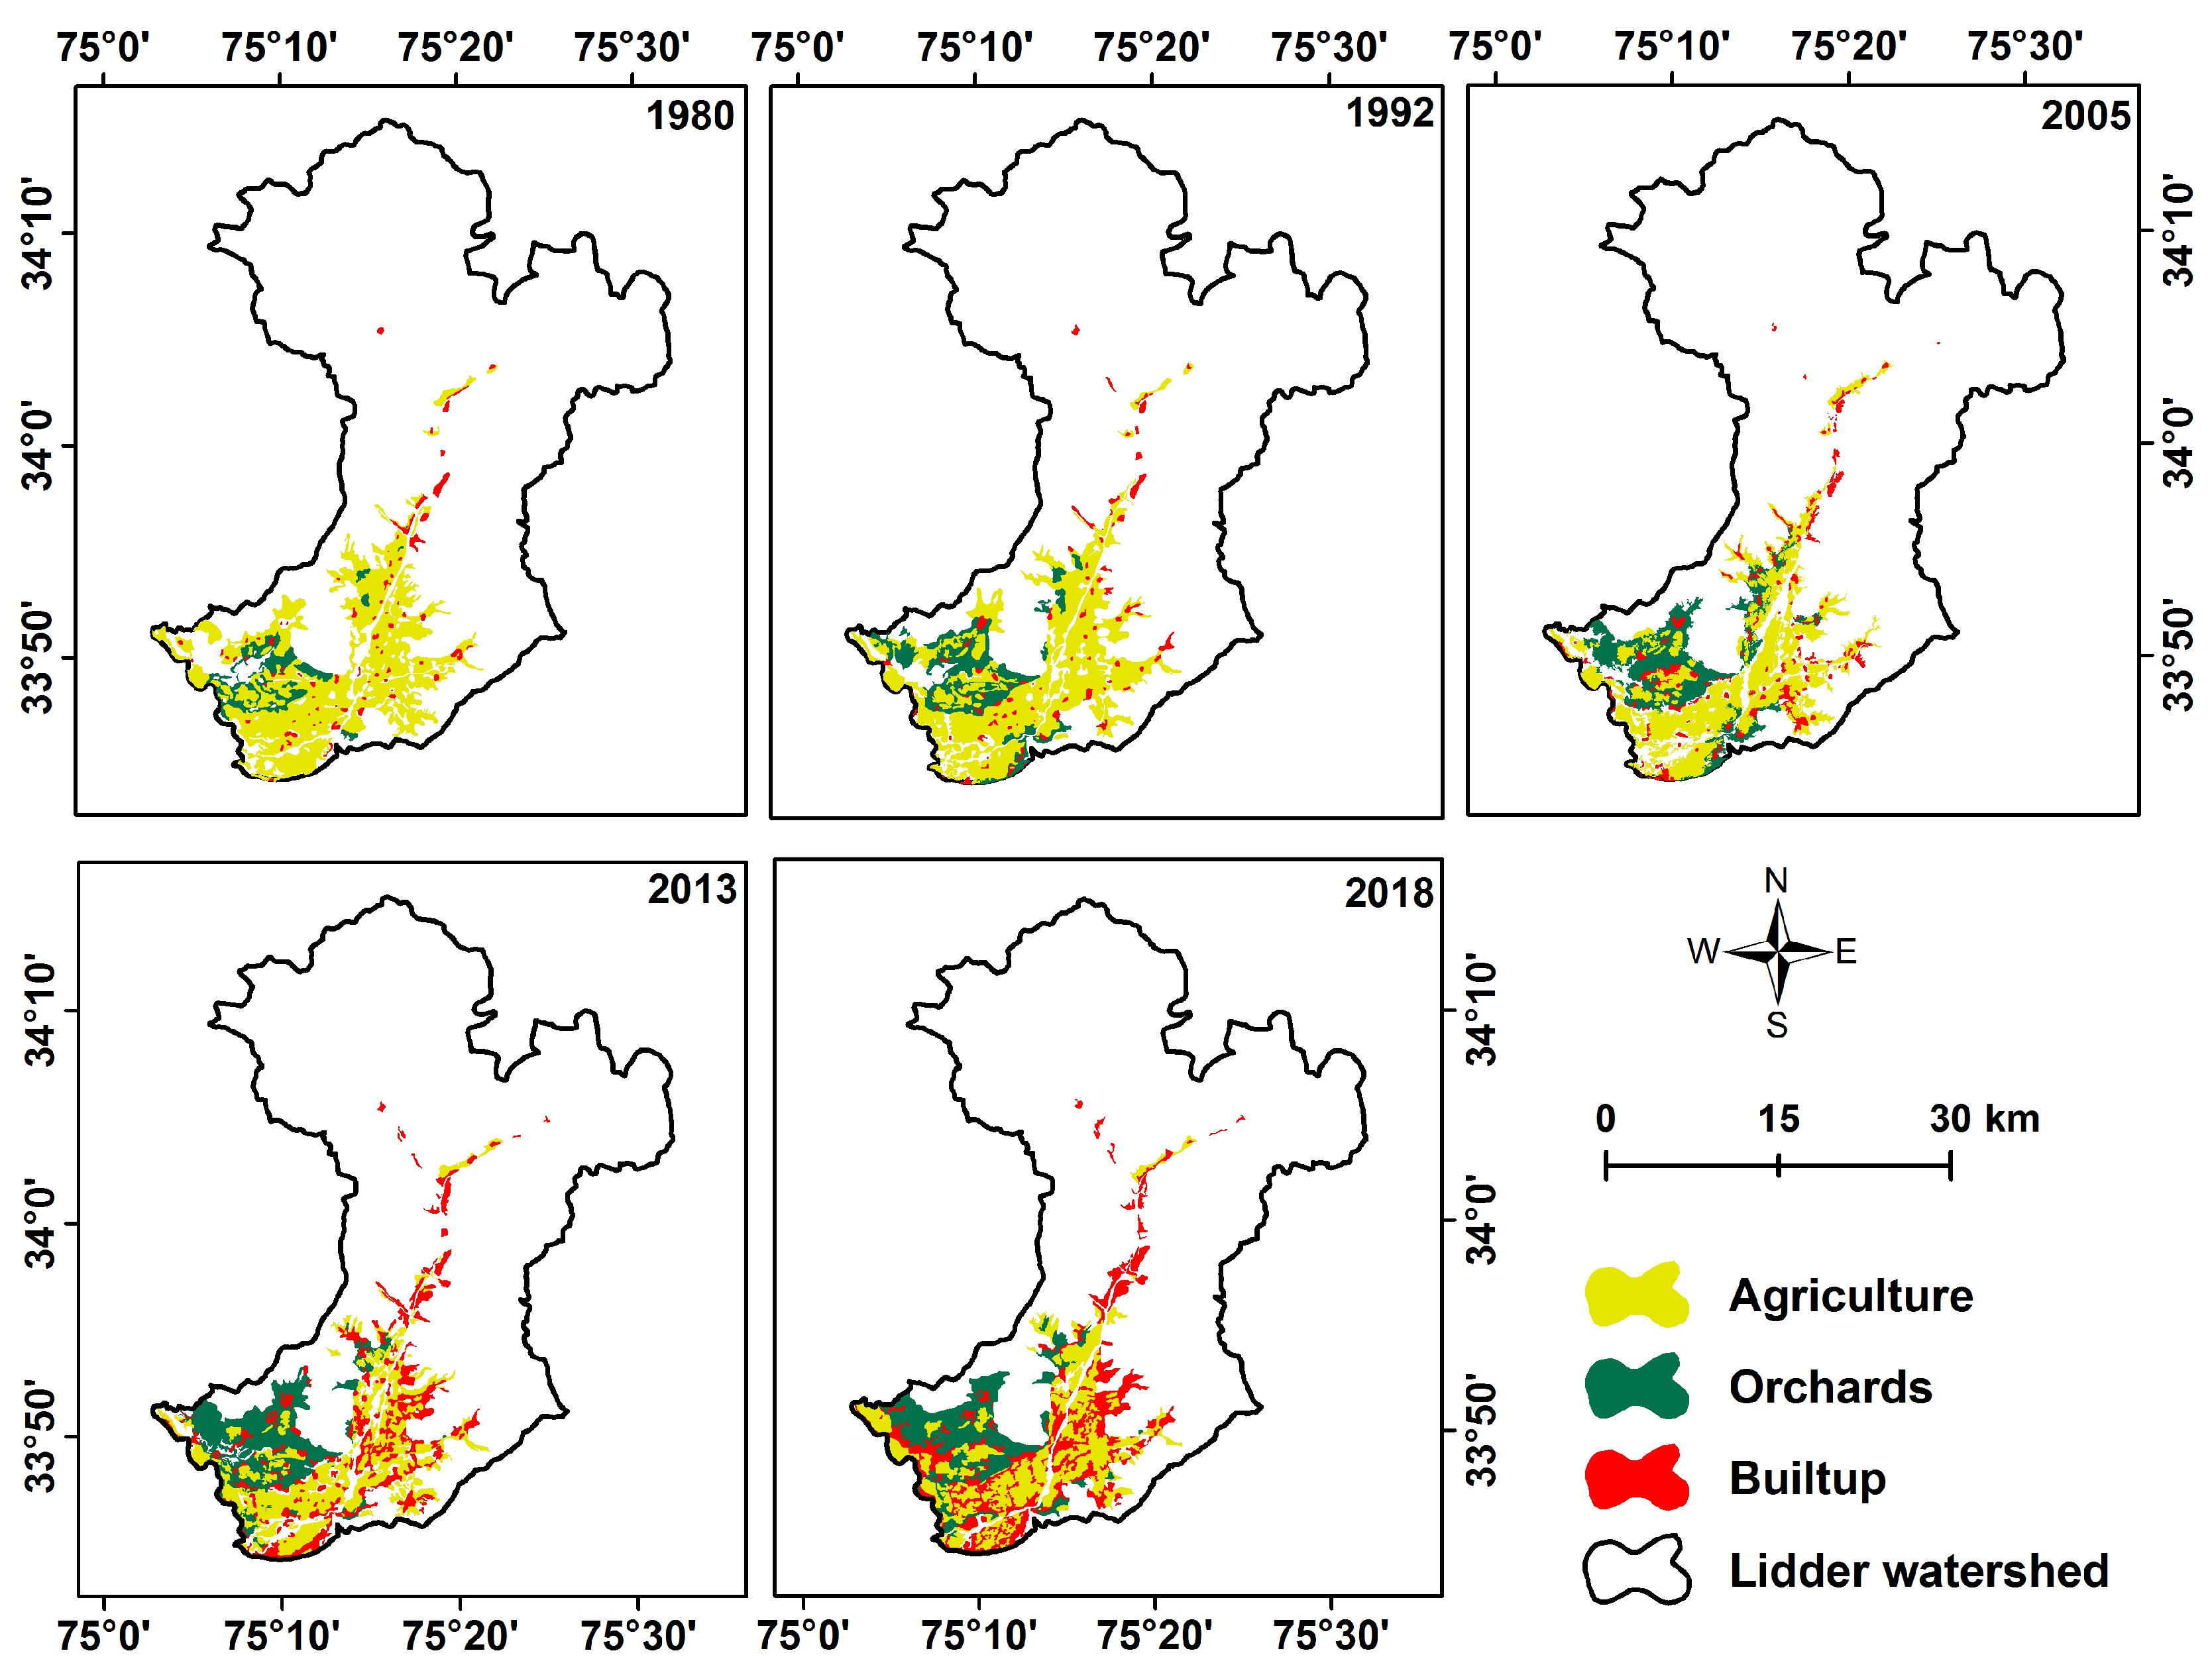
Our analysis indicated a decrease in the area under agriculture and a pronounced increase in the area orchards and built-up areas (Figure 6, Table 5). The area under agriculture shrunk by −39.03% (64.65 km2) at a rate of 1.03% per year between 1980 and 2018. However, the rate of loss was not uniform. The agriculture declined at 0.59% per year from 1980 to 1992. The loss accelerated to 1.36% per year and 1.79% per year from 1992 to 2005 and 2005 to 2013, respectively.
The area under agriculture has remained stable since 2013 in the Lidder watershed. The area under orchards and built-up areas indicated a massive increase during the same period. Orchard area increased by 176.88% (38.33 km2) at a rate of 4.65% per year, and the rate of increase in the orchard area slowed across the analysis period from 7.7% per year from 1980 to 1992, to 4.31% per year and 2.65% per year between 1992 and 2005, and 2005 and 2013, respectively. The rate of expansion of orchards further declined to 1.43% per year between 2013 and 2018. The built-up area expanded by 476.19% (62.81 km2) at a rate of 12.53% per year between 1980 and 2018. The rate of increase in the built-up area showed a persistent increase across different periods.
The built-up area increased by 2.12% per year between 1980 and 1992, and expanded at 6.43% per year from 1992 to 2005. However, the pace of increase escalated to 23.16% per year and 36.39% per year for the 2005–2013 and 2013–2018 periods, respectively.
The accuracy of 2018 delineated land use types was 90%, with built-up having the highest accuracy of 92.3% followed by orchard (90.9%) and agriculture (85.7%). The accuracy of older maps of 1980, 1992, 2005, and 2013 was computed by using the data from Rashid et al. (2010; 2017c). It was observed that the 1980 land cover map had an accuracy of 82%, whereas the accuracies for 1992, 2005, and 2013 maps were 85%, 87%, and 90%, respectively. The details of accuracy assessment are provided in Table 6. The location of field validation samples for agriculture, orchards, and built-up areas is provided in the Supplementary Materials section (Figures S1–S3).
4. Discussion
Kolahoi Glacier spread over 10.5 km2 is considered to be a single glacier [47,67,68,69]; however, a recent study [51] suggested that the glacier has two parts draining into two watersheds, Lidder and Sindh, of the larger Jhelum basin. The Randolph Glacier Inventory (https://www.glims.org/RGI/), on the other hand, indicates that the glacier has five parts. On the basis of GLIMS definition, this analysis, utilizing information from remotely sensed data and DEMs, suggests that the glacier has four parts (G1, G11, G111, and G2). The glacier G1 has fragmented into G1, G11, and G111, owing to glacier melt over the last five decades. Similar observations of glacier fragmentation have been reported across the Himalayas [70,71,72,73]. On the basis of the historical retreat rate of G11 (39 m a−1) and G2 (35 m a−1), the glaciers would vanish by 2056 and 2045, respectively. Given the exacerbated rate of melt of Kashmir Himalayan glaciers [26,74], the glaciers may perhaps vanish much earlier. A glacier cannot endure without an accumulation zone [75], and often glaciers that have an avalanche fed area can survive longer [76]. The analysis of the snout retreat of all the four parts of Kolahoi Glacier also indicated an accelerated retreat of the glacier across the analysis period. This could perhaps be attributed to the warming environment that increases ablation and [77,78] forces change in the form of precipitation [21,31,79] and potentially high ambient black carbon concentration, such as that observed near glaciers in the Kashmir region [80,81]. The accelerated rate of retreat of glaciers in northwest Himalaya has been very well documented in many recent studies [82,83,84].
The melt of Kolahoi Glacier has strongly impacted the streamflows of the two largest tributaries, Lidder and Sindh, draining into Jhelum. Our analysis of time series of streamflow data at five discharge stations from the 1970s to the present suggested depleting annual streamflows in the two watersheds of Jhelum basin, having their contribution from Kolahoi Glacier. Whereas Aru, Kirkadal, and Gur observed statistically significant depleting streamflows, Batakoot and Narayanbagh experienced a statistically insignificant decrease (Table 4). The statistically significant depleting streamflows have also been reported by earlier works [37,85] in the Kashmir region. The depleting streamflows do not appear to have severely affected the upstream stations (Aru and Batakoot). Although statistically significant depleting flows have been observed at Aru, the trends at Batakoot are statistically insignificant. This could be due to the presence of seasonal snow in high altitude regions for the most part of the year [86], as well as contribution from other smaller glaciers for Batakoot station. However, the consistently depleting streamflows have played a role in the significant land system changes in the downstream areas of Lidder watershed. This is manifested in the satellite data analysis focusing on changes in agriculture, orchards, and built-up areas in the watershed. The analysis indicated that area under irrigation intensive rice paddies shows persistent signs of decline, whereas areas under orchards and built-up areas are increasing at unprecedented rates. The massive land system changes in the Kashmir region concerning agricultural lands, orchards, and built-up areas have been documented in many studies [39,40,87]. Although few studies suggest that the depleting streamflows are a significant factor driving the land system changes in Kashmir [88,89], the changes are also perhaps taking place due to economic considerations, especially given the fact that the production from apple orchards fetches more income compared to irrigation-intensive agriculture [46,90,91,92,93]. The increase in the built-up area in Lidder watershed has not only resulted in shrinkage of land under agriculture but has perhaps also affected the hydrological connectivity, as a lot of smaller streams have dried due to land-filling and the associated expansion of built-up areas across Kashmir [94].
On the basis of the informal interviews with 142 people during field visits to the Lidder watershed in 2019, the majority 64% (91 people) attributed economic reasons for agriculture to orchard conversions, 30% (42 people) attributed the changes to depleting streamflows, while 6% (9 people) were clueless. There was unanimity among people that the area is experiencing climatic change. Our analysis suggests that although climatic change-induced streamflow depletion is possibly one of the causes of land system dynamics in Lidder watershed, the economic considerations perhaps play a much bigger role in forcing the massive unplanned land system changes in Lidder watershed. The depleting streamflows in the Kashmir region can massively impact water supply and demands, especially agriculture, hydropower, and domestic water use, given the changing climate prevalent over the region; however, it needs to be properly researched.
5. Conclusions
Kolahoi Glacier has rapidly receded due to climatic changes prevalent over the Kashmir region. The glacier has lost ≈23% area since 1962 and has fragmented into smaller parts. The snout retreat rates also suggest that the glacier has been in an imbalanced state between 1962 and 2018 and is not approaching equilibrium. The exacerbated snout retreat rates of the four parts of the glacier are driven by increasing warming that has impacted the snow accumulation on the glacier. The significant upward shift in the ELA of the glacier indicates an expansion of the ablation area that leads to a negative mass balance of the glacier. The loss of glacier area has exceeded the increase in the ablation area, translating into statistically significant depleted streamflows that have resulted in land system changes downstream. The negative glacier mass balance prevalent over the region will continue to drive the glacier recession and further decline in glacier runoff [95]. Further study can explain the differential rate of depleting streamflows among the gauging stations by streamflow partitioning using either isotopic signatures or assessing the water balance. The area under irrigation-intensive agriculture has shrunk by 39%, whereas the orchards have expanded by 177% from 1980 to 2017. On the basis of preliminary informal interviews, our analysis suggested that the land system changes are a cumulative effect of depleting streamflows and economic dividends from apple orchards. The consistently depleting streamflows will impact agricultural production, hydropower generation, and domestic water use in the region.
Supplementary Materials
The following are available online at https://www.mdpi.com/2073-4441/12/4/1168/s1, Figure S1: Validation samples for agriculture. Figure S2: Validation samples for built-up areas. Figure S3: Validation samples for orchards.
Author Contributions
Conceptualization, I.R. and M.P.; methodology, I.R., U.M., S.A., and M.P.; software, I.R., U.M., and S.A.; validation, U.M. and S.A.; formal analysis, I.R., U.M., and S.A.; investigation, I.R., U.M., S.A., and M.P.; resources, U.M. and S.A.; data curation, I.R. and M.P.; writing—original draft preparation, I.R.; writing—review and editing, M.P.; visualization, I.R., U.M. and S.A.; supervision, I.R. and M.P.; project administration, I.R. All authors have read and agreed to the published version of the manuscript.
Funding
This research received no external funding.
Acknowledgments
The authors express gratitude to United States Geological Survey (USGS) for freely hosting the Landsat satellite data used in this analysis. The authors also acknowledge the Irrigation and Flood Control Department, Kashmir, for providing the discharge data analyzed in this study. The authors also thank the Academic Editor and three anonymous reviewers for their comments and suggestions on the earlier version of the manuscript that greatly improved the content and structure of this manuscript.
Conflicts of Interest
The authors declare no conflict of interest.
References
- Bahuguna, I.M.; Kulkarni, A.V.; Nayak, S.; Rathore, B.P.; Negi, H.S.; Mathur, P. Himalayan glacier retreat using IRS 1C PAN stereo data. Int. J. Remote Sens. 2007, 28, 437–442. [Google Scholar] [CrossRef]
- Bhambri, R.; Bolch, T.; Chaujar, R.K.; Kulshreshtha, S.C. Glacier changes in the Garhwal Himalaya, India, from 1968 to 2006 based on remote sensing. J. Glaciol. 2011, 57, 543–556. [Google Scholar] [CrossRef] [Green Version]
- Farooq Azam, M.; Wagnon, P.; Berthier, E.; Vincent, C.; Fujita, K.; Kargel, J.S. Review of the status and mass changes of Himalayan-Karakoram glaciers. J. Glaciol. 2018, 64, 61–74. [Google Scholar] [CrossRef] [Green Version]
- Gardelle, J.; Berthier, E.; Arnaud, Y. Slight mass gain of Karakoram glaciers in the early twenty-first century. Nat. Geosci. 2012, 5, 322–325. [Google Scholar] [CrossRef]
- Minora, U.; Bocchiola, D.; D’Agata, C.; Maragno, D.; Mayer, C.; Lambrecht, A.; Vuillermoz, E.; Senese, A.; Compostella, C.; Smiraglia, C.; et al. Glacier area stability in the Central Karakoram National Park (Pakistan) in 2001–2010. Prog. Phys. Geogr. Earth Environ. 2016, 40, 629–660. [Google Scholar] [CrossRef]
- Farinotti, D.; Immerzeel, W.W.; de Kok, R.J.; Quincey, D.J.; Dehecq, A. Manifestations and mechanisms of the Karakoram glacier Anomaly. Nat. Geosci. 2020, 13, 8–16. [Google Scholar] [CrossRef]
- Immerzeel, W.W.; Van Beek, L.P.H.; Bierkens, M.F.P. Climate change will affect the asian water towers. Science 2010, 328, 1382–1385. [Google Scholar] [CrossRef]
- Bolch, T.; Kulkarni, A.; Kääb, A.; Huggel, C.; Paul, F.; Cogley, J.G.; Frey, H.; Kargel, J.S.; Fujita, K.; Scheel, M.; et al. The state and fate of himalayan glaciers. Science 2012, 336, 310–314. [Google Scholar] [CrossRef] [Green Version]
- Xu, J.; Grumbine, R.E.; Shrestha, A.; Eriksson, M.; Yang, X.; Wang, Y.U.N.; Wilkes, A. The Melting Himalayas: Cascading Effects of Climate Change on Water, Biodiversity, and Livelihoods. Conserv. Biol. 2009, 23, 520–530. [Google Scholar] [CrossRef]
- Khadka, D.; Babel, M.S.; Shrestha, S.; Tripathi, N.K. Climate change impact on glacier and snow melt and runoff in Tamakoshi basin in the Hindu Kush Himalayan (HKH) region. J. Hydrol. 2014, 511, 49–60. [Google Scholar] [CrossRef]
- Singh, S.; Kumar, R.; Bhardwaj, A.; Sam, L.; Shekhar, M.; Singh, A.; Kumar, R.; Gupta, A. Changing climate and glacio-hydrology in Indian Himalayan Region: A review. Wiley Interdiscip. Rev. Clim. Chang. 2016, 7, 393–410. [Google Scholar] [CrossRef] [Green Version]
- Pratt-Sitaula, B.; Burbank, D.W.; Heimsath, A.M.; Humphrey, N.F.; Oskin, M.; Putkonen, J. Topographic control of asynchronous glacial advances: A case study from Annapurna, Nepal. Geophys. Res. Lett. 2011, 38, L24502. [Google Scholar] [CrossRef] [Green Version]
- Racoviteanu, A.E.; Arnaud, Y.; Williams, M.W.; Manley, W.F. Spatial patterns in glacier characteristics and area changes from 1962 to 2006 in the Kanchenjunga–Sikkim area, eastern Himalaya. Cryosphere 2015, 9, 505–523. [Google Scholar] [CrossRef] [Green Version]
- Garg, P.K.; Shukla, A.; Jasrotia, A.S. Influence of topography on glacier changes in the central Himalaya, India. Glob. Planet. Change. 2017, 155, 196–212. [Google Scholar] [CrossRef]
- Scherler, D.; Bookhagen, B.; Strecker, M.R. Spatially variable response of Himalayan glaciers to climate change affected by debris cover. Nat. Geosci. 2011, 4, 156–159. [Google Scholar] [CrossRef]
- Shukla, A.; Qadir, J. Differential response of glaciers with varying debris cover extent: Evidence from changing glacier parameters. Int. J. Remote Sens. 2016, 37, 2453–2479. [Google Scholar] [CrossRef]
- Murtaza, K.O.; Romshoo, S.A. Recent Glacier Changes in the Kashmir Alpine Himalayas, India. Geocarto Int. 2017, 32, 188–205. [Google Scholar] [CrossRef]
- Kaushik, S.; Dharpure, J.K.; Joshi, P.K.; Ramanathan, A.; Singh, T. Climate change drives glacier retreat in Bhaga basin located in Himachal Pradesh, India. Geocarto Int. 2019, 1–20. [Google Scholar] [CrossRef]
- Shafiq, M.U.; Islam, Z.U.; Bhat, I.A.; Ahmed, P. Spatio-temporal behaviour of Nehnar Glacier from 1962 to 2017, Jhelum basin, Kashmir Himalayas, India. Phys. Geogr. 2020, 1–20. [Google Scholar] [CrossRef]
- Bhutiyani, M.R.; Kale, V.S.; Pawar, N.J. Climate change and the precipitation variations in the northwestern Himalaya: 1866–2006. Int. J. Climatol. 2009, 30, 535–548. [Google Scholar] [CrossRef]
- Dar, R.A.; Rashid, I.; Romshoo, S.A.; Marazi, A. Sustainability of winter tourism in a changing climate over Kashmir Himalaya. Environ. Monit. Assess. 2014, 186, 2549–2562. [Google Scholar] [CrossRef] [PubMed]
- Gardelle, J.; Berthier, E.; Arnaud, Y.; Kääb, A. Region-wide glacier mass balances over the Pamir-Karakoram-Himalaya during 1999–2011. Cryosphere 2013, 7, 1263–1286. [Google Scholar] [CrossRef] [Green Version]
- Brun, F.; Berthier, E.; Wagnon, P.; Kääb, A.; Treichler, D. A spatially resolved estimate of High Mountain Asia glacier mass balances from 2000 to 2016. Nat. Geosci. 2017, 10, 668–673. [Google Scholar] [CrossRef] [PubMed]
- Rashid, I.; Majeed, U. Recent recession and potential future lake formation on Drang Drung glacier, Zanskar Himalaya, as assessed with earth observation data and glacier modelling. Environ. Earth Sci. 2018, 77, 429. [Google Scholar] [CrossRef]
- Mir, R.A.; Jain, S.K.; Lohani, A.K.; Saraf, A.K. Glacier recession and glacial lake outburst flood studies in Zanskar basin, western Himalaya. J. Hydrol. 2018, 564, 376–396. [Google Scholar] [CrossRef]
- Kääb, A.; Berthier, E.; Nuth, C.; Gardelle, J.; Arnaud, Y. Contrasting patterns of early twenty-first-century glacier mass change in the Himalayas. Nature 2012, 488, 495–498. [Google Scholar] [CrossRef]
- Azmat, M.; Liaqat, U.W.; Qamar, M.U.; Awan, U.K. Impacts of changing climate and snow cover on the flow regime of Jhelum River, Western Himalayas. Reg. Environ. Chang. 2017, 17, 813–825. [Google Scholar] [CrossRef]
- Barnett, T.P.; Adam, J.C.; Lettenmaier, D.P. Potential impacts of a warming climate on water availability in snow-dominated regions. Nature 2005, 438, 303–309. [Google Scholar] [CrossRef]
- Immerzeel, W.W.; van Beek, L.P.H.; Konz, M.; Shrestha, A.B.; Bierkens, M.F.P. Hydrological response to climate change in a glacierized catchment in the Himalayas. Clim. Change 2012, 110, 721–736. [Google Scholar] [CrossRef] [Green Version]
- Kraaijenbrink, P.D.A.; Bierkens, M.F.P.; Lutz, A.F.; Immerzeel, W.W. Impact of a global temperature rise of 1.5 degrees Celsius on Asia’s glaciers. Nature 2017, 549, 257–260. [Google Scholar] [CrossRef]
- Romshoo, S.A.; Dar, R.A.; Rashid, I.; Marazi, A.; Ali, N.; Zaz, S.N. Implications of Shrinking Cryosphere Under Changing Climate on the Streamflows in the Lidder Catchment in the Upper Indus Basin, India. Arctic Antarct. Alp. Res. 2015, 47, 627–644. [Google Scholar] [CrossRef]
- Marazi, A.; Romshoo, S.A. Streamflow response to shrinking glaciers under changing climate in the Lidder Valley, Kashmir Himalayas. J. Mt. Sci. 2018, 15, 1241–1253. [Google Scholar] [CrossRef]
- Meer, M.S.; Mishra, A.K. Remote Sensing Application for Exploring Changes in Land-Use and Land-Cover Over a District in Northern India. J. Indian Soc. Remote Sens. 2020, 48, 525–534. [Google Scholar] [CrossRef]
- Joshi, P.K.; Rashid, H.; Roy, P.S. Landscape dynamics in Hokersar wetland, Jammu & Kashmir—An application of geospatial approach. J. Indian Soc. Remote Sens. 2002, 30, 1–5. [Google Scholar]
- Romshoo, S.A.; Ali, N.; Rashid, I. Geoinformatics for characterizing and understanding the spatio-temporal dynamics (1969 to 2008) of Hokersar wetland in Kashmir Himalayas. Int. J. Phys. Sci. 2011, 6, 1026–1038. [Google Scholar]
- Zaz, S.N.; Romshoo, S.A. Assessing the geoindicators of land degradation in the Kashmir Himalayan region, India. Nat. Hazards 2012, 64, 1219–1245. [Google Scholar] [CrossRef]
- Romshoo, S.A.; Rashid, I. Assessing the impacts of changing land cover and climate on Hokersar wetland in Indian Himalayas. Arab. J. Geosci. 2014, 7, 143–160. [Google Scholar] [CrossRef]
- Rashid, I.; Romshoo, S.A.; Amin, M.; Khanday, S.A.; Chauhan, P. Linking human-biophysical interactions with the trophic status of Dal Lake, Kashmir Himalaya, India. Limnologica 2017, 62, 84–96. [Google Scholar] [CrossRef]
- Rashid, I.; Aneaus, S. High-resolution earth observation data for assessing the impact of land system changes on wetland health in Kashmir Himalaya, India. Arab. J. Geosci. 2019, 12, 453. [Google Scholar] [CrossRef]
- Dar, S.A.; Bhat, S.U.; Aneaus, S.; Rashid, I. A geospatial approach for limnological characterization of Nigeen Lake, Kashmir Himalaya. Environ. Monit. Assess. 2020, 192, 121. [Google Scholar] [CrossRef]
- Chudley, T.R.; Miles, E.S.; Willis, I.C.; Chudley, T.R.; Miles, E.S.; Glacier, I.C.W.; Miles, E.S.; Willis, I.C. Glacier characteristics and retreat between 1991 and 2014 in the Ladakh Range, Jammu and Kashmir. Remote Sens. Lett. 2017, 8, 518–527. [Google Scholar] [CrossRef] [Green Version]
- Kamp, U.; Byrne, M.; Bolch, T. Glacier fluctuations between 1975 and 2008 in the Greater Himalaya Range of Zanskar, southern Ladakh. J. Mt. Sci. 2011, 8, 374–389. [Google Scholar] [CrossRef]
- Pandey, A.C.; Ghosh, S.; Nathawat, M.S. Evaluating patterns of temporal glacier changes in Greater Himalayan Range, Jammu and Kashmir, India. Geocarto Int. 2011, 26, 321–338. [Google Scholar] [CrossRef]
- Shukla, A.; Garg, S.; Kumar, V.; Mehta, M.; Shukla, U.K. Sensitivity of Glaciers in Part of the Suru Basin, Western Himalaya to Ongoing Climatic Perturbations. In Himalayan Weather and Climate and their Impact on the Environment; Springer International Publishing: New York, NY, USA, 2020; pp. 351–377. [Google Scholar]
- Bolch, T.; Shea, J.M.; Liu, S.; Azam, F.M.; Gao, Y.; Gruber, S.; Immerzeel, W.W.; Kulkarni, A.; Li, H.; Tahir, A.A.; et al. Status and Change of the Cryosphere in the Extended Hindu Kush Himalaya Region. In The Hindu Kush Himalaya Assessment; Springer International Publishing: New York, NY, USA, 2019; pp. 209–255. [Google Scholar]
- Rashid, I.; Romshoo, S.A. Impact of anthropogenic activities on water quality of Lidder River in Kashmir Himalayas. Environ. Monit. Assess. 2013, 185, 4705–4719. [Google Scholar] [CrossRef]
- Rashid, I.; Romshoo, S.A.; Abdullah, T. The recent deglaciation of Kolahoi valley in Kashmir Himalaya, India in response to the changing climate. J. Asian Earth Sci. 2017, 138, 38–50. [Google Scholar] [CrossRef]
- Rashid, I.; Romshoo, S.A.; Muslim, M.; Malik, A.H. Landscape level vegetation characterization of Lidder valley using geoinformatics. J. Himal. Ecol. Sustain. Dev. 2010, 6, 11–24. [Google Scholar]
- Zemp, M.; Roer, I.; Kääb, A.; Hoelzle, M.; Paul, F.; Haeberli, W. WGMS. Global Glacier Changes: Facts and Figures. United Nations Environment Programme, World Glacier Monitoring Service, Zűrich—Zurich Open Repository and Archive. 2008. Available online: https://www.zora.uzh.ch/id/eprint/4173/ (accessed on 28 February 2020).
- Racoviteanu, A.E.; Paul, F.; Raup, B.; Khalsa, S.J.S.; Armstrong, R. Challenges and recommendations in mapping of glacier parameters from space: Results of the 2008 global land ice measurements from space (GLIMS) workshop, Boulder, Colorado, USA. In Proceedings of the Annals of Glaciology; Cambridge University Press: Cambridge, UK, 2009; Volume 50, pp. 53–69. [Google Scholar]
- Mir, R.A. Recent changes of two parts of Kolahoi Glacier and its controlling factors in Kashmir basin, western Himalaya. Remote Sens. Appl. Soc. Environ. 2018, 11, 265–281. [Google Scholar] [CrossRef]
- Jensen, J.R. Remote Sensing of the Environment: An Earth Resource Perspective, 2nd ed.; Pearson Education: New Delhi, India, 2009. [Google Scholar]
- Lee, E.; Kim, S.; Kang, W.; Seo, D.; Paik, J. Contrast enhancement using dominant brightness level analysis and adaptive intensity transformation for remote sensing images. IEEE Geosci. Remote Sens. Lett. 2013, 10, 62–66. [Google Scholar] [CrossRef]
- Bolch, T.; Menounos, B.; Wheate, R. Landsat-based inventory of glaciers in western Canada, 1985–2005. Remote Sens. Environ. 2010, 114, 127–137. [Google Scholar] [CrossRef]
- Hall, D.K.; Bayr, K.J.; Schöner, W.; Bindschadler, R.A.; Chien, J.Y.L. Consideration of the errors inherent in mapping historical glacier positions in Austria from the ground and space (1893–2001). Remote Sens. Environ. 2003, 86, 566–577. [Google Scholar] [CrossRef]
- Rabatel, A.; Dedieu, J.P.; Vincent, C. Using remote-sensing data to determine equilibrium-line altitude and mass-balance time series: Validation on three French glaciers, 1994–2002. J. Glaciol. 2005, 51, 539–546. [Google Scholar] [CrossRef] [Green Version]
- Barandun, M.; Huss, M.; Usubaliev, R.; Azisov, E.; Berthier, E.; Kääb, A.; Bolch, T.; Hoelzle, M. Multi-decadal mass balance series of three Kyrgyz glaciers inferred from modelling constrained with repeated snow line observations. Cryosphere 2018, 12, 1899–1919. [Google Scholar] [CrossRef] [Green Version]
- Pelto, M. Exceptionally High 2018 Equilibrium Line Altitude on Taku Glacier, Alaska. Remote Sens. 2019, 11, 2378. [Google Scholar] [CrossRef] [Green Version]
- Yue, S.; Pilon, P.; Cavadias, G. Power of the Mann-Kendall and Spearman’s rho tests for detecting monotonic trends in hydrological series. J. Hydrol. 2002, 259, 254–271. [Google Scholar] [CrossRef]
- Yue, S.; Wang, C.Y. The Mann-Kendall test modified by effective sample size to detect trend in serially correlated hydrological series. Water Resour. Manag. 2004, 18, 201–218. [Google Scholar] [CrossRef]
- Kumar, V.; Jain, S.K. Trends in seasonal and annual rainfall and rainy days in Kashmir Valley in the last century. Quat. Int. 2010, 212, 64–69. [Google Scholar] [CrossRef]
- Gocic, M.; Trajkovic, S. Analysis of precipitation and drought data in Serbia over the period 1980–2010. J. Hydrol. 2013, 494, 32–42. [Google Scholar] [CrossRef]
- Xie, H.; Zhu, X. Reference evapotranspiration trends and their sensitivity to climatic change on the Tibetan Plateau (1970–2009). Hydrol. Process. 2013, 27, 3685–3693. [Google Scholar] [CrossRef]
- Mushtaq, F.; Nee Lala, M.G. Assessment of climatic variability in the catchments of Himalayan Lake, Jammu & Kashmir. Geocarto Int. 2017, 32, 1090–1104. [Google Scholar]
- Rashid, I.; Bhat, M.A.; Romshoo, S.A. Assessing changes in the above ground biomass and carbon stocks of Lidder valley, Kashmir. Geocarto Int. 2017, 6049, 1–18. [Google Scholar] [CrossRef]
- Rashid, I.; Romshoo, S.A.; Vijayalakshmi, T. Geospatial modelling approach for identifying disturbance regimes and biodiversity rich areas in North Western Himalayas, India. Biodivers. Conserv. 2013, 22, 2537–2566. [Google Scholar]
- Ahmad, N.; Hashimi, N.H. Glacial history of Kolahoi glacer, Kashmir, India. J. Glaciol. 1974, 13, 279–283. [Google Scholar]
- Shukla, A.; Ali, I. A hierarchical knowledge-based classification for glacier terrain mapping: A case study from Kolahoi Glacier, Kashmir Himalaya. Ann. Glaciol. 2016, 57, 1–10. [Google Scholar]
- Shukla, A.; Ali, I.; Hasan, N.; Romshoo, S.A. Dimensional changes in the Kolahoi glacier from 1857 to 2014. Environ. Monit. Assess. 2016, 189, 5. [Google Scholar] [PubMed]
- Kulkarni, A.V.; Bahuguna, I.M.; Rathore, B.P.; Singh, S.K.; Randhawa, S.S.; Sood, R.K.; Dhar, S. Glacial retreat in Himalaya using Indian Remote Sensing satellite data. Curr. Sci. 2007, 92, 69–74. [Google Scholar]
- Kulkarni, A.V.; Rathore, B.P.; Singh, S.K.; Bahuguna, I.M. Understanding changes in the Himalayan cryosphere using remote sensing techniques. Int. J. Remote Sens. 2011, 32, 601–615. [Google Scholar]
- Brahmbhatt, R.M.; Bahuguna, I.M.; Rathore, B.P.; Kulkarni, A.V.; Shah, R.D.; Rajawat, A.S.; Kargel, J.S. Significance of glacio-morphological factors in glacier retreat: A case study of part of Chenab basin, Himalaya. J. Mt. Sci. 2017, 14, 128–141. [Google Scholar]
- Das, S.; Sharma, M.C. Glacier changes between 1971 and 2016 in the Jankar Chhu Watershed, Lahaul Himalaya, India. J. Glaciol. 2019, 65, 13–28. [Google Scholar]
- Bolch, T. Past and Future Glacier Changes in the Indus River Basin. In Indus River Basin; Elsevier: Amsterdam, The Netherlands, 2019; pp. 85–97. [Google Scholar]
- Pelto, M. How Unusual Was 2015 in the 1984–2015 Period of the North Cascade Glacier Annual Mass Balance? Water 2018, 10, 543. [Google Scholar]
- Hoffman, M.J.; Fountain, A.G.; Liston, G.E. Surface energy balance and melt thresholds over 11 years at Taylor Glacier, Antarctica. J. Geophys. Res. 2008, 113, F04014. [Google Scholar]
- Rashid, I.; Romshoo, S.A.; Chaturvedi, R.K.; Ravindranath, N.H.; Sukumar, R.; Jayaraman, M.; Lakshmi, T.V.; Sharma, J. Projected climate change impacts on vegetation distribution over Kashmir Himalayas. Clim. Change 2015, 132, 601–613. [Google Scholar]
- Zaz, S.N.; Romshoo, S.A.; Krishnamoorthy, R.T.; Viswanadhapalli, Y. Analyses of temperature and precipitation in the Indian Jammu and Kashmir region for the 1980–2016 period: Implications for remote influence and extreme events. Atmos. Chem. Phys. 2019, 19, 15–37. [Google Scholar]
- Smith, T.; Bookhagen, B. Changes in seasonal snow water equivalent distribution in high mountain Asia (1987 to 2009). Sci. Adv. 2018, 4, e1701550. [Google Scholar] [PubMed] [Green Version]
- Ramanathan, V.; Carmichael, G. Global and regional climate changes due to black carbon. Nat. Geosci. 2008, 1, 221–227. [Google Scholar]
- Sarangi, C.; Qian, Y.; Rittger, K.; Bormann, K.J.; Liu, Y.; Wang, H.; Wan, H.; Lin, G.; Painter, T.H. Impact of light-absorbing particles on snow albedo darkening and associated radiative forcing over high-mountain Asia: High-resolution WRF-Chem modeling and new satellite observations. Atmos. Chem. Phys. 2019, 19, 7105–7128. [Google Scholar]
- Raj, K.; Govindha, B.; Rao, V.V.; Kumar, K.V.; Diwakar, P.G. Alarming recession of glaciers in Bhilangna basin, Garhwal Himalaya, from 1965 to 2014 analysed from Corona and Cartosat data. Geomat. Nat. Hazards Risk 2017, 8, 1424–1439. [Google Scholar]
- Jain, S.K.; Mir, R.A. Glacier and glacial lake classification for change detection studies using satellite data: A case study from Baspa basin, western Himalaya. Geocarto Int. 2019, 34, 391–414. [Google Scholar]
- Mal, S.; Mehta, M.; Singh, R.B.; Schickhoff, U.; Bisht, M.P.S. Recession and Morphological Changes of the Debris-Covered Milam Glacier in Gori Ganga Valley, Central Himalaya, India, Derived From Satellite Data. Front. Environ. Sci. 2019, 7, 42. [Google Scholar]
- Mushtaq, F.; Lala, M.G.N. Assessment of hydrological response as a function of LULC change and climatic variability in the catchment of the Wular Lake, J&K, using geospatial technique. Environ. Earth Sci. 2017, 76, 1–19. [Google Scholar]
- Shafiq, M.u.; Ahmed, P.; Islam, Z.u.; Joshi, P.K.; Bhat, W.A. Snow cover area change and its relations with climatic variability in Kashmir Himalayas, India. Geocarto Int. 2019, 34, 688–702. [Google Scholar]
- Rather, M.I.; Rashid, I.; Shahi, N.; Murtaza, K.O.; Hassan, K.; Yousuf, A.R.; Romshoo, S.A.; Shah, I.Y. Massive land system changes impact water quality of the Jhelum River in Kashmir Himalaya. Environ. Monit. Assess. 2016, 188, 185. [Google Scholar] [CrossRef] [PubMed]
- Showqi, I.; Rashid, I.; Romshoo, S.A. Land use land cover dynamics as a function of changing demography and hydrology. GeoJournal 2014, 79, 297–307. [Google Scholar] [CrossRef]
- Mushtaq, F.; Pandey, A.C. Assessment of land use/land cover dynamics vis-à-vis hydrometeorological variability in Wular Lake environs Kashmir Valley, India using multitemporal satellite data. Arab. J. Geosci. 2014, 7, 4707–4715. [Google Scholar] [CrossRef]
- Rasool, R.; Shafiq, M.; Ahmed, P.; Ahmad, P. An analysis of climatic and human induced determinants of agricultural land use changes in Shupiyan area of Jammu and Kashmir state, India. GeoJournal 2018, 83, 49–60. [Google Scholar] [CrossRef]
- Batool, N.; Shah, S.A.; Dar, S.N.; Skinder, S. Rainfall variability and dynamics of cropping pattern in Kashmir Himalayas: A case study of climate change and agriculture. SN Appl. Sci. 2019, 1, 1–9. [Google Scholar] [CrossRef] [Green Version]
- Khursheed, V.; Taufique, M. Spatial analysis of horticulture efficiency and fruit production concentration in Kashmir Valley. GeoJournal 2019, 1–9. [Google Scholar] [CrossRef]
- Lone, S.A.; Mayer, I.A. Geo-spatial analysis of land use/land cover change and its impact on the food security in District Anantnag of Kashmir Valley. GeoJournal 2019, 84, 785–794. [Google Scholar] [CrossRef]
- Hussain, Q.A.; Pandit, A.K. Macroinvertebrates in streams: A review of some ecological factors. Int. J. Fish. Aquac. 2012, 4, 114–123. [Google Scholar]
- Huss, M.; Hock, R. Global-scale hydrological response to future glacier mass loss. Nat. Clim. Chang. 2018, 8, 135–140. [Google Scholar] [CrossRef] [Green Version]
Figure 1.
Location of the study area: Red dot in the India map indicates Kashmir valley. The boundaries of Lidder and Sind watersheds are outlined black on the digital elevation model (DEM; represented in blue–red symbology) of Kashmir valley. Stars indicate discharge gauging stations; 1—Aru, 2—Batakoot, 3—Gur, 4—Kirkadal, and 5—Narayanbagh. The map on the right shows four parts of Kolahoi Glacier and its environs draped onto a pan-sharpened Landsat 8 OLI False Color Composite image (band: 7-SWIR, 5-NIR, 4-Red).

Figure 2.
Recession of Kolahoi Glacier between 1962 and 2018.

Figure 3.
Snout changes of four parts of Kolahoi Glacier between 1962 and 2018. (a) Snout retreat of G1, G11 and G111 (b) Snout retreat of G2.
Figure 3.
Snout changes of four parts of Kolahoi Glacier between 1962 and 2018. (a) Snout retreat of G1, G11 and G111 (b) Snout retreat of G2.

Figure 4.
Upward shift of equilibrium line altitude of Kolahoi Glacier between 1990 and 2018.

Figure 5.
Annual average discharge of two watersheds, Lidder and Sind, fed by Kolahoi Glacier. (a) Aru, (b) Batakoot, (c) Gur, (d) Kirkadal, and (e) Narayanbagh.
Figure 5.
Annual average discharge of two watersheds, Lidder and Sind, fed by Kolahoi Glacier. (a) Aru, (b) Batakoot, (c) Gur, (d) Kirkadal, and (e) Narayanbagh.

Figure 6.
Downstream land-use changes in Lidder watershed between 1980 and 2018.


Table 1.
Characteristics of the Lidder and Sind watersheds.
| Characteristic | Lidder | Sind |
|---|---|---|
| Latitude | 33.73°–34.26° N | 34.12°–34.45° N |
| Longitude | 75.08°–75.54° E | 74.60°–75.6° E |
| Minimum elevation | 1585 m asl | 1570 m asl |
| Mean elevation | 3060 m asl | 3200 m asl |
| Maximum elevation | 5300 m asl | 5400 m asl |
| Area | ≈1230 km2 | ≈1560 km2 |
Table 2.
Details of the datasets used in this study.
| Dataset | Path/Row | Acquisition/Release Date | Spatial Resolution |
|---|---|---|---|
| A. Satellite Data | |||
| Landsat Multi-Spectral Scanner (MSS) | 160/36 | 18 September 1980 | 60 m |
| Landsat Thematic Mapper (TM) | 149/36 | 7 August 1990 | 30 m |
| 149/36 | 24 October 1992 | 30 m | |
| Linear Imaging Self-Scanning Sensor | 92/46 | 19 October 2005 | 23.5 m |
| 92/47 | 19 October 2005 | 23.5 m | |
| 93/46 | 24 October 2005 | 23.5 m | |
| Landsat Enhanced Thematic Mapper+ (ETM+) | 149/36 | 27 August 2000 | 30 m |
| Landsat 8 Operational Land Imager | 149/36 | 25 October 2013 | 30 m |
| 148/36 | 29 September 2018 | 30 m | |
| High-resolution Basemap imagery | ESRI Arc Map 10.1 | 27 September 2018 | ≈1 m |
| B. Topographic data | |||
| Survey of India Topographic map | 43N/8 | 1962 | 1:50,000 scale |
| Shuttle Radar Topography Mission (SRTM) DEM | N34E075 | 2000 | 30 m |
| Advanced Land Observing Satellite ALOS) DEM | N34E075 | 2006–2011 | 30 m |
| Advanced Spaceborne Thermal Emission and Reflection Radiometer (ASTER) GDEM v2 | N34E075 | 2012 | 30 m |
| TerraSAR-X add-on for Digital Elevation Measurement (TanDEMx) | N34E075 | 2011–2014 | 30 m |
| C. Discharge data | - | 1972–2018 | Point data |
| D. Ground Truth data (GPS validation) | - | 2017–2018 | Point data |
| E. Interviews | - | 2017–2018 | Point data |
Table 3.
Changes in the glacier-wise and cumulative area of Kolahoi Glacier from 1962 to 2018.
| Glacier Area (km2) | |||||
|---|---|---|---|---|---|
| Year | G1 | G2 | G11 | G111 | Total |
| 1962 | 8.74 | 4.99 | NA | NA | 13.73 |
| 1992 | 6.411 | 4.89 | 1.85 | NA | 13.16 |
| 2000 | 6.211 | 4.76 | 0.69 | 0.72 | 12.38 |
| 2013 | 5.633 | 4.25 | 0.53 | 0.54 | 10.96 |
| 2018 | 5.316 | 4.17 | 0.5 | 0.51 | 10.49 |
Table 4.
Significance of trends in streamflows in Lidder and Sind watersheds.
| Gauging Station | S-Score | Z-Statistic | Trend | Theil–Sen Slope |
|---|---|---|---|---|
| Aru | −191 | −1.80 | Significant (at a < 0.1) | −3.93 |
| Batakoot | −91 | −0.85 | Insignificant (at a = 0.1) | −6.19 |
| Gur | −291 | −2.75 | Significant (at a < 0.01) | −2.39 |
| Kirkadal | −389 | −3.67 | Significant (at a < 0.01) | −4.36 |
| Narayanbagh | −92 | −1.48 | Insignificant (at a = 0.1) | −12.66 |
Table 5.
Area changes in land use between 1980 and 2018.
| Land Use Type | Area (km2) | ||||||
|---|---|---|---|---|---|---|---|
| 1980 | 1992 | 2005 | 2013 | 2018 | Area Change | % Change | |
| Agriculture | 165.65 | 153.9 | 124.66 | 101 | 101 | −64.65 | −39.03 |
| Orchard | 21.67 | 41.7 | 53.85 | 58.45 | 60 | 38.33 | 176.88 |
| Built-up | 13.19 | 16.54 | 27.56 | 52 | 76 | 62.81 | 476.19 |
Table 6.
Accuracy assessment of land use maps of 1980, 1992, 2005, 2013, and 2018.
| Year | Land Use Types | Overall Accuracy | |||
|---|---|---|---|---|---|
| AG | BU | OR | |||
| 2018 | n | 24 | 36 | 30 | 90% |
| N | 28 | 39 | 33 | ||
| ρ | 85.71 | 92.3 | 90.91 | ||
| 2013 | n | 18 | 17 | 18 | 83.33% |
| N | 20 | 20 | 20 | ||
| ρ | 90 | 85 | 90 | ||
| 2005 | n | 17 | 18 | 19 | 90% |
| N | 20 | 20 | 20 | ||
| ρ | 85 | 90 | 95 | ||
| 1992 | n | 18 | 18 | 16 | 86.66% |
| N | 20 | 20 | 20 | ||
| ρ | 90 | 90 | 80 | ||
| 1980 | n | 16 | 17 | 17 | 83.33% |
| N | 20 | 20 | 20 | ||
| ρ | 80 | 85 | 85 | ||
© 2020 by the authors. Licensee MDPI, Basel, Switzerland. This article is an open access article distributed under the terms and conditions of the Creative Commons Attribution (CC BY) license (http://creativecommons.org/licenses/by/4.0/).
Share and Cite
MDPI and ACS Style
Rashid, I.; Majeed, U.; Aneaus, S.; Pelto, M. Linking the Recent Glacier Retreat and Depleting Streamflow Patterns with Land System Changes in Kashmir Himalaya, India. Water 2020, 12, 1168. https://doi.org/10.3390/w12041168
AMA Style
Rashid I, Majeed U, Aneaus S, Pelto M. Linking the Recent Glacier Retreat and Depleting Streamflow Patterns with Land System Changes in Kashmir Himalaya, India. Water. 2020; 12(4):1168. https://doi.org/10.3390/w12041168
Chicago/Turabian StyleRashid, Irfan, Ulfat Majeed, Sheikh Aneaus, and Mauri Pelto. 2020. "Linking the Recent Glacier Retreat and Depleting Streamflow Patterns with Land System Changes in Kashmir Himalaya, India" Water 12, no. 4: 1168. https://doi.org/10.3390/w12041168
Note that from the first issue of 2016, this journal uses article numbers instead of page numbers. See further details here.