Article

Seasonal Succession of Phytoplankton Functional Groups and Driving Factors of Cyanobacterial Blooms in a Subtropical Reservoir in South China

1
School of Environmental Sciences and Engineering, Sun Yat-sen University, Guangzhou 510275, China
2
South China Institute of Environmental Science, Ministry of Ecology and Environment, Guangzhou 510345, China
3
The Swire Institute of Marine Science and School of Biological Sciences, The University of Hong Kong, Pokfulam, Hong Kong, China
*
Authors to whom correspondence should be addressed.
Water 2020, 12(4), 1167; https://doi.org/10.3390/w12041167
Submission received: 12 March 2020 / Revised: 9 April 2020 / Accepted: 16 April 2020 / Published: 19 April 2020
(This article belongs to the Special Issue Advancing Knowledge on Cyanobacterial Blooms in Freshwaters)

Abstract

:
Freshwater phytoplankton communities can be classified into a variety of functional groups that are based on physiological, morphological, and ecological characteristics. This classification method was used to study the temporal and spatial changes in the phytoplankton communities of Gaozhou Reservoir, which is a large municipal water source in South China. Between January 2015 and December 2017, a total of 155 taxa of phytoplankton that belong to seven phyla were identified. The phytoplankton communities were classified into 28 functional groups, nine of which were considered to be representative functional groups (relative biomass > 10%). Phytoplankton species richness was greater in the summer and autumn than in the winter and spring; cyanobacterial blooms occurred in the spring. The seasonal succession of phytoplankton functional groups was characterized by the occurrence of functional groups P (Staurastrum sp. and Closterium acerosum) and Y (Cryptomonas ovata and Cryptomonas erosa) in the winter and spring, and functional groups NA (Cosmarium sp. and Staurodesmus sp.) and P (Staurastrum sp. and Closterium acerosum) in the summer and autumn. The temperature, nitrogen, and phosphorus levels were the main factors driving seasonal changes in the phytoplankton communities of Gaozhou Reservoir. The functional group M (Microcystis aeruginosa) dominated the community during the cyanobacterial blooms in spring 2016, with the maximum algal cell density of 3.12 × 10⁸ cells L−1. Relatively low temperature (20.8 °C), high concentrations of phosphorus (0.080–0.110 mg L−1), suitable hydrological and hydrodynamic conditions (e.g., relatively long retention time), and relatively closed geographic location in the reservoir were the key factors that stimulated the cyanobacterial blooms during the early stages.

1. Introduction

Phytoplankton, as primary producers in aquatic ecosystems, are important for the maintenance of a stable aquatic environment [1,2], and they strongly affect the total productivity of aquatic ecosystems [3]. Phytoplankton are particularly sensitive to physical, chemical, and biological changes in the aquatic environment [4], and increases in nutrient availability often lead to severe phytoplankton proliferation [5]. Once blooms form, aquatic ecosystem services, such as drinking water quality, fisheries, and landscape, become damaged [6]. The process of bloom formation has a destructive effect on phytoplankton community structure, due to the dominance of certain phytoplankton species [7]. Changes in the composition and structure of the phytoplankton community (e.g., species composition, diversity index, community structure, and quantitative distribution) can be used to evaluate the eutrophication status of reservoirs [8]. Thus, these metrics represent important indicators of the environmental quality of aquatic ecosystems [9].
Reynolds et al. [10] and Padisák et al. 2009 [11] proposed functional groups to describe both phytoplankton community structure and the changes to that structure. The species of phytoplankton from specific habitats with similar sensitivities are classified into the same functional group; in total 31 functional groups were devised for freshwater phytoplankton [12]. Phytoplankton functional groups have been used to study the effects of changes in aquatic ecology on the physiological, morphological, and ecological characteristics of phytoplankton in various rivers, lakes, and reservoirs worldwide [13,14,15,16]. Studies have shown that phytoplankton functional groups H, X1, LO, and S1 are the most representative during the rainy and dry seasons in semi-arid reservoirs in Brazil [17], while phytoplankton functional groups LM, P, T, and Y exhibit strong seasonal variation in Erhai Lake, Yunnan, China [18]. The application of phytoplankton functional group classification methods in aquatic ecosystems provides key data that reflect the dynamics of phytoplankton communities [19,20].
There are many methods for assessing the nutritional status of aquatic environments. The assessment of eutrophication in aquatic ecosystems is essentially a multivariate comprehensive decision-making process for aquatic ecosystems [21,22,23]. Based on the EU Water Framework Directive [19], Padisák et al. developed the Q index method, based on the taxonomy of the phytoplankton functional groups, to evaluate the ecological status of different types of water bodies [24]. Phytoplankton functional groups and Q index evaluation methods have been widely used in phytoplankton related research studies [17,25]. In addition, the comprehensive trophic level index (TLI (Σ)) has been widely used for evaluating eutrophication in reservoirs [26,27]. TLI (Σ) index, which is based on water quality parameters, provides a continuous value that represents the trophic state of a reservoir. Continuous numerical changes provide a basis that can be used to investigate the mechanisms underlying eutrophication [26]. In this study, two evaluation methods, Q index and TLI (Σ) index, were used to study phytoplankton community succession and the factors driving succession in a reservoir in southern China (i.e., Gaozhou Reservoir).
Gaozhou Reservoir is a large artificial reservoir in western Guangdong, China, with an annual water supply of 50 billion cubic meters. This reservoir is located in the monsoon region of China, between the northern tropics and southern subtropics. The climate in this region is warm, with abundant sunshine and rainfall. However, rainfall is unevenly distributed and it changes substantially with season. The rainfall in the spring and summer is usually twice that in autumn and winter [28,29]. In recent years, pollution originating from domestic sewage and agricultural non-point sources has increased in the catchment areas of Gaozhou Reservoir, resulting in serious eutrophication and cyanobacterial blooms [30,31]. Cyanobacterial blooms have been recorded four times since 2009 (in 2010, 2011, 2013, and 2016) [32,33], threatening the water quality security of the reservoir. Although many studies have investigated the seasonal succession of phytoplankton functional groups in rivers and lakes, the seasonal succession of phytoplankton functional groups in drinking water reservoirs, as well as the associated cyanobacterial blooms, remain largely unstudied.
The objectives of this study were (1) to identify the phytoplankton composition in the reservoir; (2) to determine the phytoplankton functional groups and their seasonal succession; (3) to analyze the driving factors for the occurrence of cyanobacterial blooms; and, (4) to understand and assess the status of the aquatic environment in the reservoir, while using the phytoplankton functional group classification method, as well as the Q index and the TLI (Σ) index. The study provides basic and useful data regarding seasonal succession of phytoplankton communities and environmental determinants of algal species and abundance, which can be effectively used to develop strategies for the management of cyanobacterial blooms in the reservoir.

2. Materials and Methods

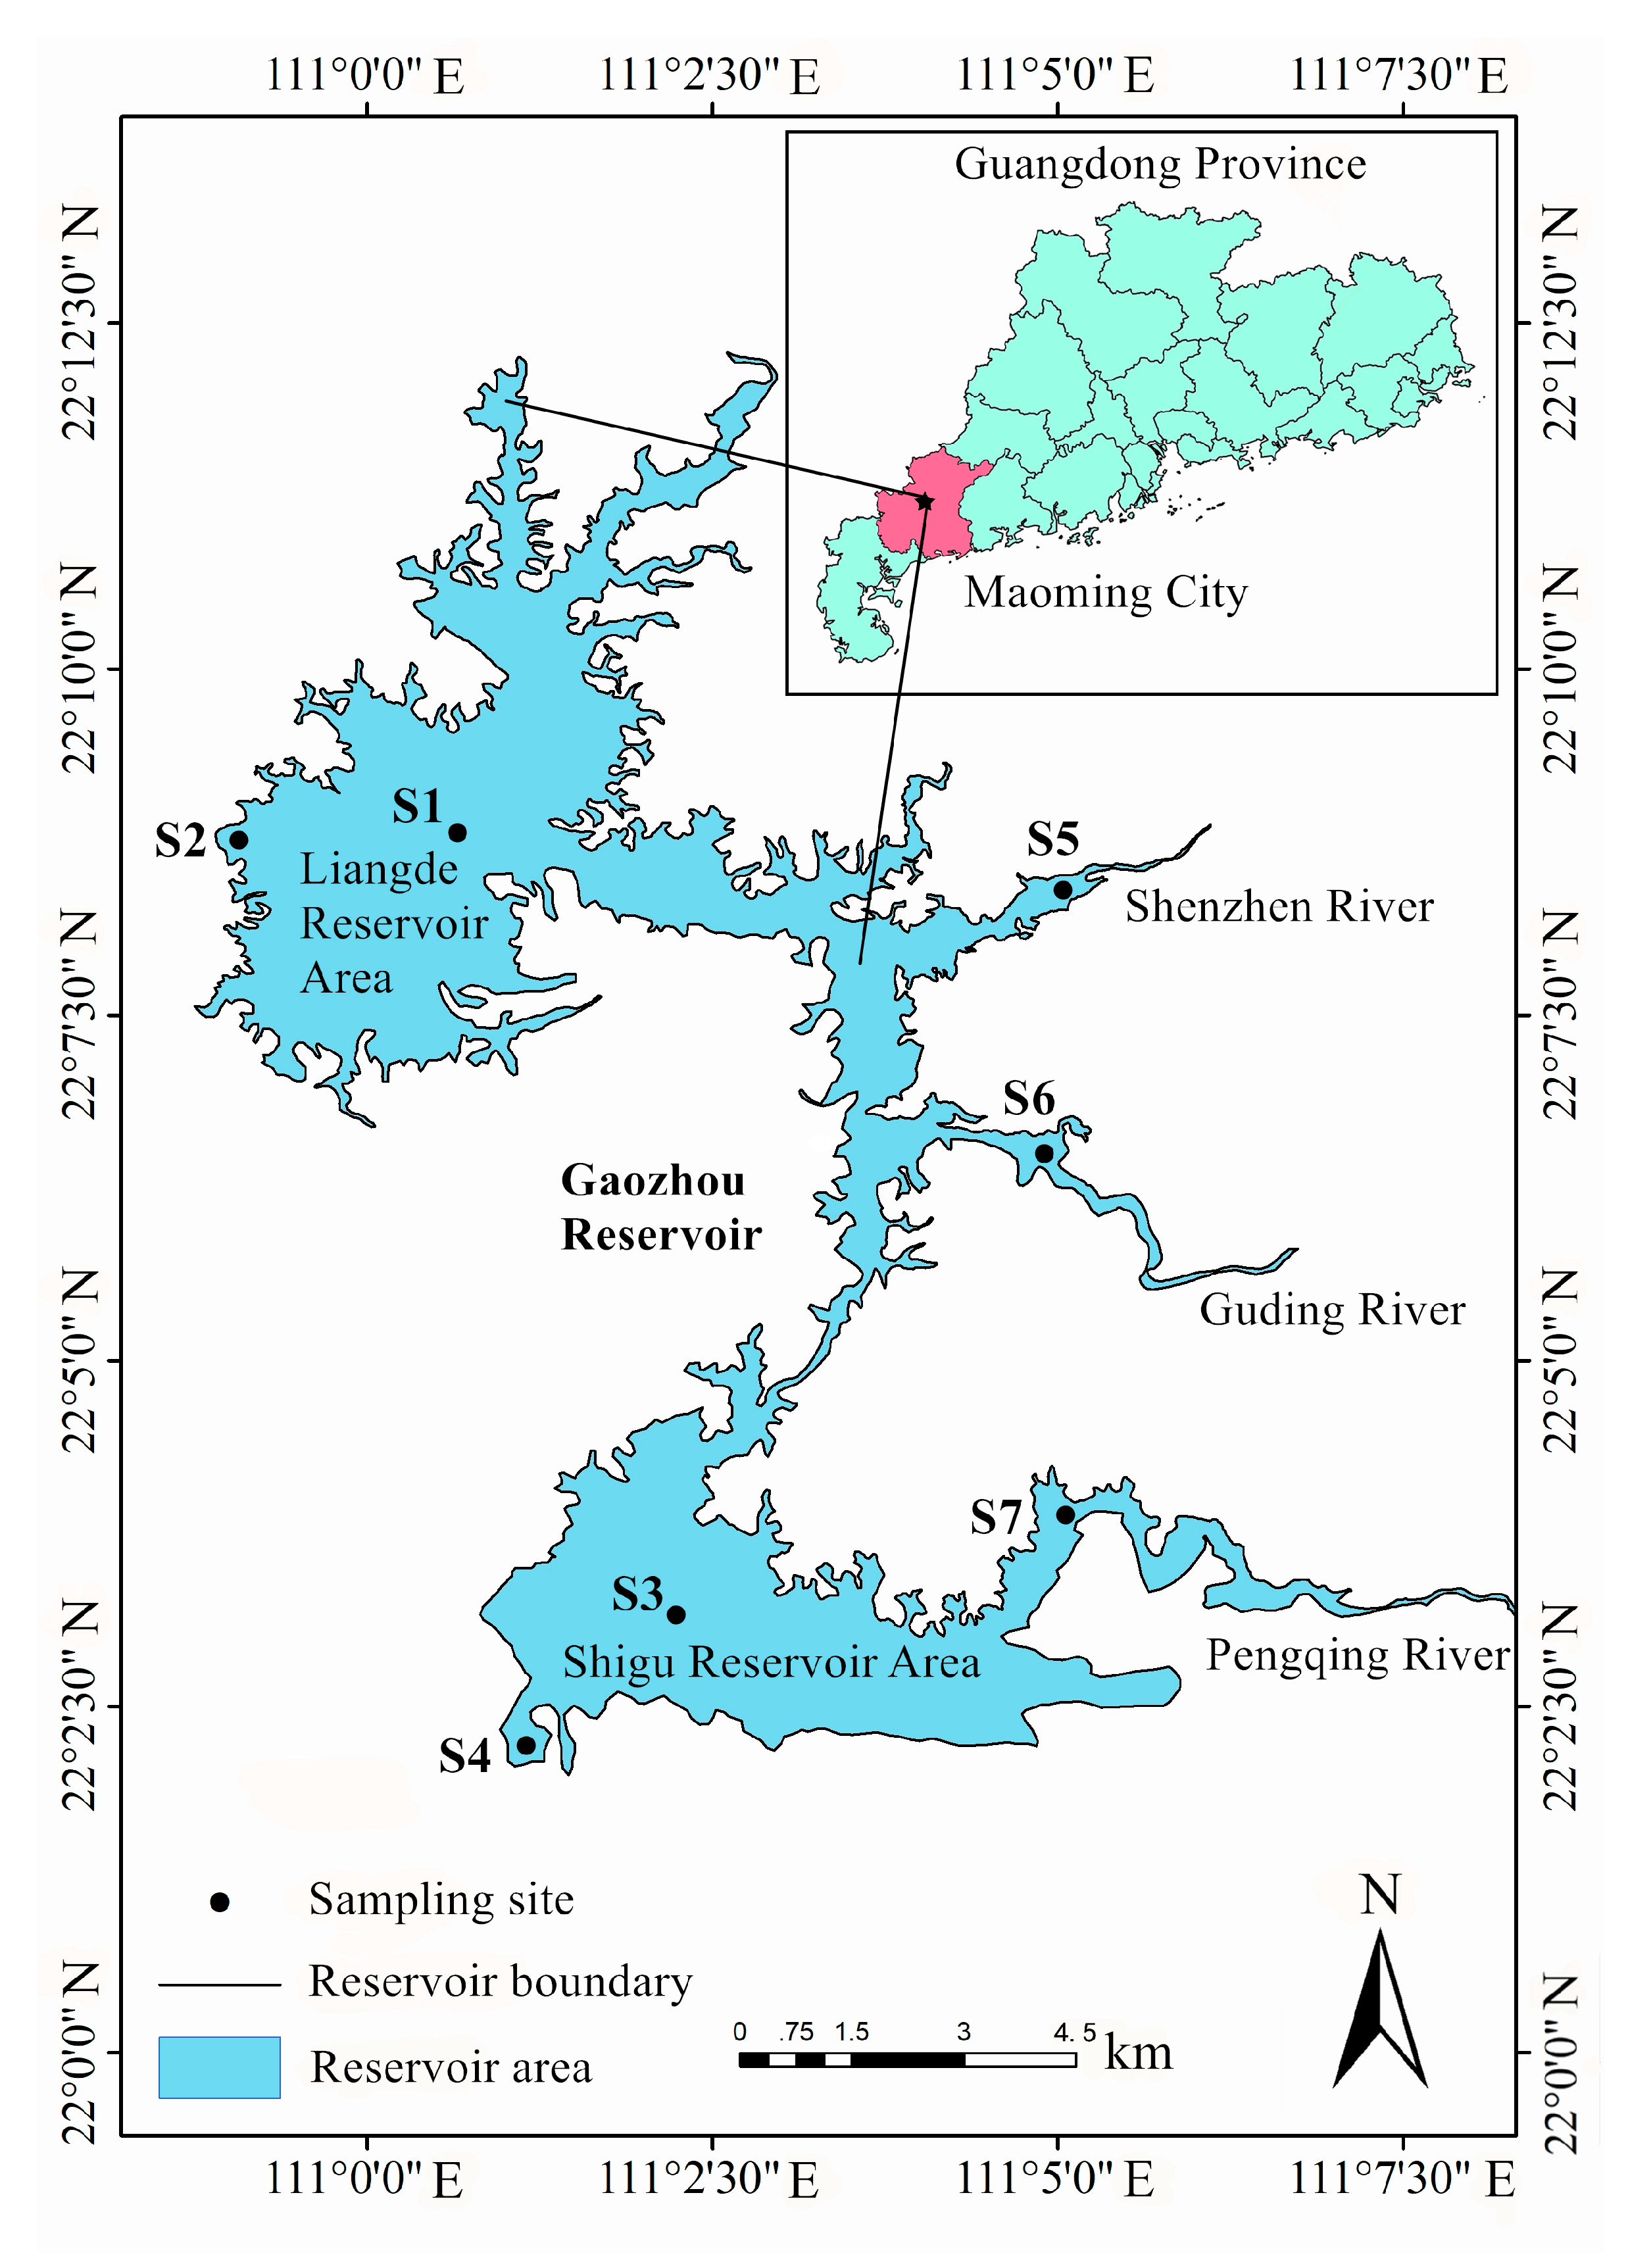
2.1. Study Period and Site Description

The Gaozhou Reservoir is located in Maoming City, Guangdong Province, China. This region has a subtropical climate. The reservoir has a canyon shape, with a storage capacity of 1.15 × 10⁹ cubic meters and a catchment area of 1022 km2 [34]. The water retention time (WRT) in the Gaozhou reservoir was about 451 days [34]. Three rivers (the Shenzhen River, the Pengqing River, and the Guding River) feed into the rain collection area of the two sub-areas of the reservoir: the Liangde and Shigu areas (Figure 1).
The water samples were collected at seven sites in the Gaozhou Reservoir (Figure 1) in January, April, July, and November of 2015, 2016 and 2017 (12 sampling events with 84 samples in total). Sites S1 and S2 were located in the Liangde reservoir district; sites S3 and S4 were located in the Shigu reservoir district; and, sites S5, S6, and S7 were located at the entrances of the Shenzhen River, the Guding River, and the Pengqing River, respectively.

2.2. Sample Analysis

A portable Professional Plus Multiparameter Instrument (Pro Plus, YSI, USA) was used to measure the water temperature (WT), pH, dissolved oxygen (DO), and electrical conductivity (EC). Samples (5 L each) were taken at 0.5 m water depth at each site. The measurements of water quality parameters were performed according to the Chinese National Standard Method [35] (similar to those of the American Public Health Association [36]). The total nitrogen (TN), total phosphorus (TP), permanganate index (CODMn), and suspended solids (SS) were measured with unfiltered water, while nitrate (NO3-N) and ammonium (NH4-N) were measured with filtered water. The chlorophyll-a concentrations were determined after extraction with acetone [35,37].
At each site, a phytoplankton net (No.25, Beijing Purity Instrument) was dragged at 0.5 m water depth for five minutes. Subsequently, a 25-mL filtered water sample was collected, fixed by adding 1 mL of formalin solution, and then inspected using the eyepiece visual field counting method under a microscope. At each site, an additional 1 L water sample was collected at 0.5 m water depth and 10 mL of Lugol’s solution was added on site in order to fix the sample. After sedimentation for 24 h, the water sample was concentrated to 30 mL, and then examined under a microscope to quantify cell densities [38]. Phytoplankton biomass was calculated according to the method that was described by Hillebrand et al. [39], while assuming that 1 mm3 equals 1 mg [40].

2.3. Data Analysis

The European Water Framework Directive (European Parliament and Council, 2000) developed a Q index evaluation method that is based on the interactions between functional groups and environmental characteristics [41]. The Q index primarily uses the composition of functional groups and phytoplankton biomass to characterize the eutrophic state of the water body, and it reflects aquatic ecological health status [11]. The Q index is calculated, as follows:
Q   = i = 1 n ( n i N ×   F i )   ,
where N is the total biomass; n is the number of functional groups; ni is the biomass of the i-th functional group; and, Fi is the value of the i-th functional group [24].
We assigned an F value that ranges from 0 to 5, with higher values for the more-pristine assemblages in the reservoir, and lower values for assemblages that are typical of less-pristine conditions. Following Reynolds et al. [10], species representing > 10% of the total biomass were considered to be representative functional groups (i.e., the functional groups that made a substantial contribution to total biomass).
The Q index was divided into five levels: the values 0–1, 1–2, 2–3, 3–4, and 4–5 correspond to bad, tolerable, medium, good, and excellent, respectively [24]. Smaller Q values indicated a higher degree of eutrophication.
We used chlorophyll a (Chla), TP, TN, transparency (SD), and the CODMn to calculate the Comprehensive Trophic Level Index (TLI (Σ)), which was used to evaluate the eutrophication status of Gaozhou Reservoir [27,42]:
TLI   ( Σ ) = j = 1 m W j × TLI   ( j ) ,
where TLI (Σ) is the comprehensive trophic level index; TLI (j) is the nutrition status index representing the jth parameter; and, Wj is the relevant weight of the nutrition status index of the jth parameter.
In order to calculate the nutritional status index of each individual item, we used the following formulas:
TLI (Chl a) = 10 × (2.5 + 1.086 ln (Chl-a)),
TLI (TP) = 10 × (9.436 + 1.624 ln (TP)),
TLI (TN) = 10 × (5.453 + 1.694 ln (TN)),
TLI (SD) = 10 × (5.118 − 1.940 ln (SD)),
TLI (CODMn) = 10 × (0.109 + 2.661 ln (CODMn)).
Here, Chla is expressed in mg m-3; SD is expressed in m; and, all other variables are expressed in mg L−1.
The values of the TLI (Σ) index were divided into six levels: oligotrophic (0–30), mesotrophic (30–50), light-eutrophic (50–60), mid-eutrophic (60–70), high-eutrophic (70–80), and hyper-eutrophic (>80) [23,43].
One-way analysis of variance (one-way ANOVA) was used to compare the difference of environmental factors among seasons. We took three samplings of each sampling site as three replicates for each season. Redundancy analysis (RDA) was used to reveal the contribution of 13 environmental factors to variations of nine representative functional groups of phytoplankton for each season. Statistical analysis was performed while using the SPSS 19.0 statistical package software (IBM, Armonk, NY, USA), and RDA analysis was analyzed using the Canoco 5.04 software.

3. Results

3.1. Phytoplankton Dynamics

In total, 155 phytoplankton taxa were identified across all of the samples collected from the Gaozhou Reservoir between January 2015 and December 2017. These taxa included cyanobacteria, diatoms, chlorophytes, dinoflagellates, cryptophytes, euglenophytes, and chrysophytes. There were 103, 109, 126, and 120 taxa in samples collected in the winter, spring, summer, and autumn, respectively; species richness in the summer and autumn was greater than that in the winter and spring (Table 1).
The phytoplankton taxa in the reservoir fell into 28 of the 31 groups previously described: M, S1, SN, H1, H2, X1, X2, X3, Y, LM, LO, K, TC, E, D, C, B, A, MP, W1, W2, WO, G, J, F, T, NA, and P (Table 2). Here, nine groups were considered to be representative functional groups (marked with "a" in Table 2).
During the study period, the average densities of algal cells in the winter, spring, summer, and autumn were 5.42 × 10⁶ cells L−1, 29.7 × 10⁶ cells L−1, 13.2 × 10⁶ cells L−1, and 11.3 × 10⁶ cells L−1, respectively. The density of algal cells was highest in the spring, followed by the summer, autumn, and winter (Figure 2). In the spring of 2016, cyanobacterial blooms occurred at S3 and S4, where S3 is near the water supply outlet of the reservoir. The algal cell densities at S3 and S4 reached a maximum of 3.12 × 10⁸ cells L−1 and 1.51 × 10⁸ cells L−1, respectively.
In total, 18 representative functional groups were identified in the winter and spring, and 20 were identified in the summer and autumn (Figure 2). The functional groups P (Staurastrum sp. and Closterium acerosum) and Y (Cryptomonas ovata and Cryptomonas erosa) were the dominant phytoplankton taxa in the winter and spring. Functional group X2 (Chroomonas acuta) was more abundant in the winter, while functional group M (Microcystis aeruginosa) grew faster in the spring. Functional groups NA (Cosmarium sp. and Staurodesmus sp.) and P (Staurastrum sp. and Closterium acerosum) dominated the communities in the summer and autumn. In spring 2016, the community at site S3 was dominated by functional group M (Microcystis aeruginosa), comprising 98.5% of the total biomass, while the community at site S4 was dominated by both functional group M (Microcystis aeruginosa) and functional group P (Melosira varians), comprising, respectively, 86.4% and 12.1% of the total biomass.

3.2. Variations in Environmental Factors

The average WTs in the winter, spring, summer, and autumn were 20.8 °C, 28.0 °C, 31.2 °C, and 26.5 °C, respectively. The pH was 8.63 in the summer, which was significantly higher than that in all other seasons (p < 0.05). However, there were no significant differences in pH among the samples that were collected during the other seasons. DO and EC were highest in the spring, measuring 10.03 mg L−1 and 66.1 μs cm−1, respectively. These values were significantly higher than those that were measured during the other three seasons (p < 0.05). Across all samples, the TN concentrations ranged from 0.20 mg L−1 to 2.60 mg L−1, with an average of 0.66 mg L−1. The TN concentrations of the spring samples (average: 0.94 mg L−1; maximum: 1.15 mg L−1) were significantly higher than those of the other three seasons (p < 0.05). Across all of the samples, the TP concentrations ranged from 0.008 mg L−1 to 0.110 mg L−1, with an average of 0.025 mg L−1. The average TP concentration was the highest in the spring of 2016 (0.056 mg L−1), but there was no significant difference in TP concentration between spring and each of the other three seasons. Throughout the survey period, the ratio of nitrogen concentration to phosphorus concentration at each sampling site was greater than 16, and this value did not differ significantly among seasons. Seasonal rainfall was 50–1116 mm, with the most rain falling in the summer, followed by the spring, autumn, and winter (Table 3).
Among all of the environmental factors, measured during the survey period, TP was most strongly affected by season. The average TP in spring of 2016 was 0.056 mg L−1. TP values at S3 and S4 were higher (0.080 mg L−1 and 0.110 mg L−1) than those at other sites, and these values were 4–5 times greater than those in spring 2015 and 2017 (Figure 3).

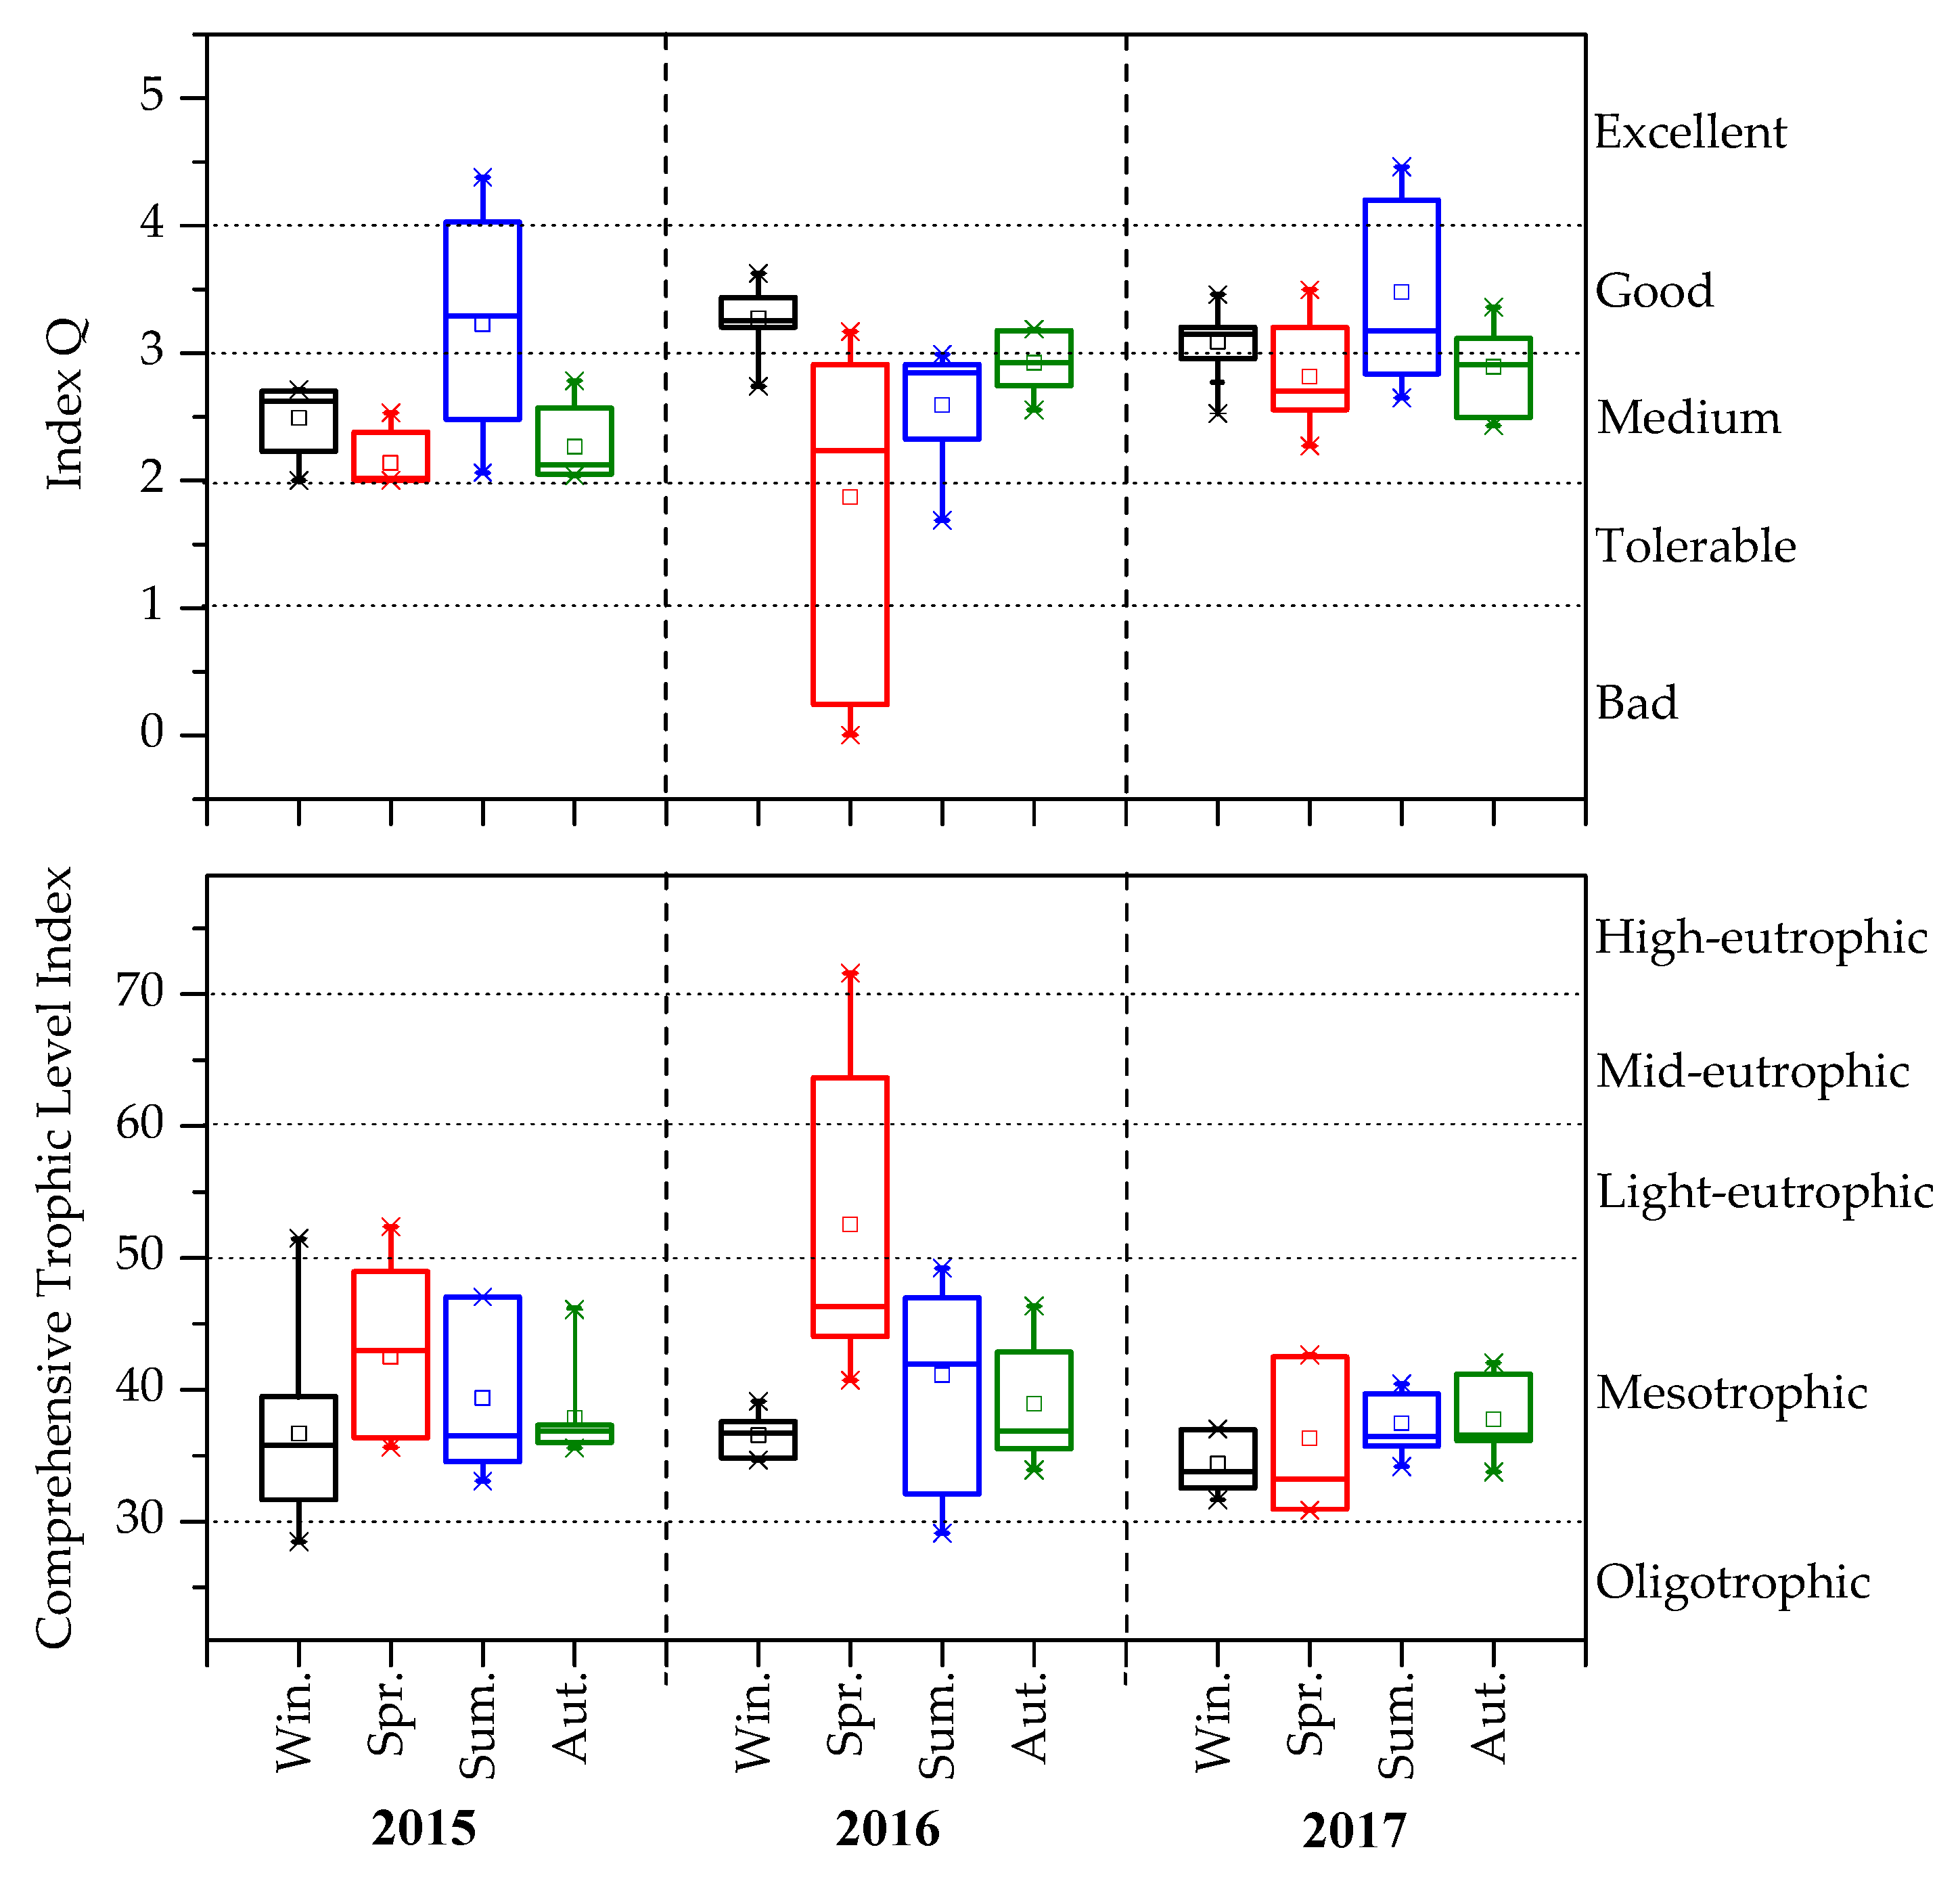
3.3. Changes in Q and TLI (Σ)

The average Q index across all of samples from 2015 to 2017 was 1.87–3.48 (Figure 4), indicating that the water quality of the reservoir was primarily good and medium. However, water quality in spring of 2016 was obviously bad. The average TLI (Σ) index for all samples from 2015 to 2017 was 34.4–52.6 (Figure 4), implying that water quality was lightly eutrophic. The average TLI (Σ) index was substantially lower in the samples that were collected in the spring of 2016, as compared to those collected in other seasons.
The Q index and the TLI (Σ) index were especially abnormal in the spring of 2016, coinciding with local cyanobacterial blooms. The TLI (Σ) indexes of the samples from sites S3 and S4 were 63.7 and 71.6, respectively, while the Q indexes were 0.21 and 0.24, respectively. The degree of eutrophication in the water of the reservoir was abnormally high.

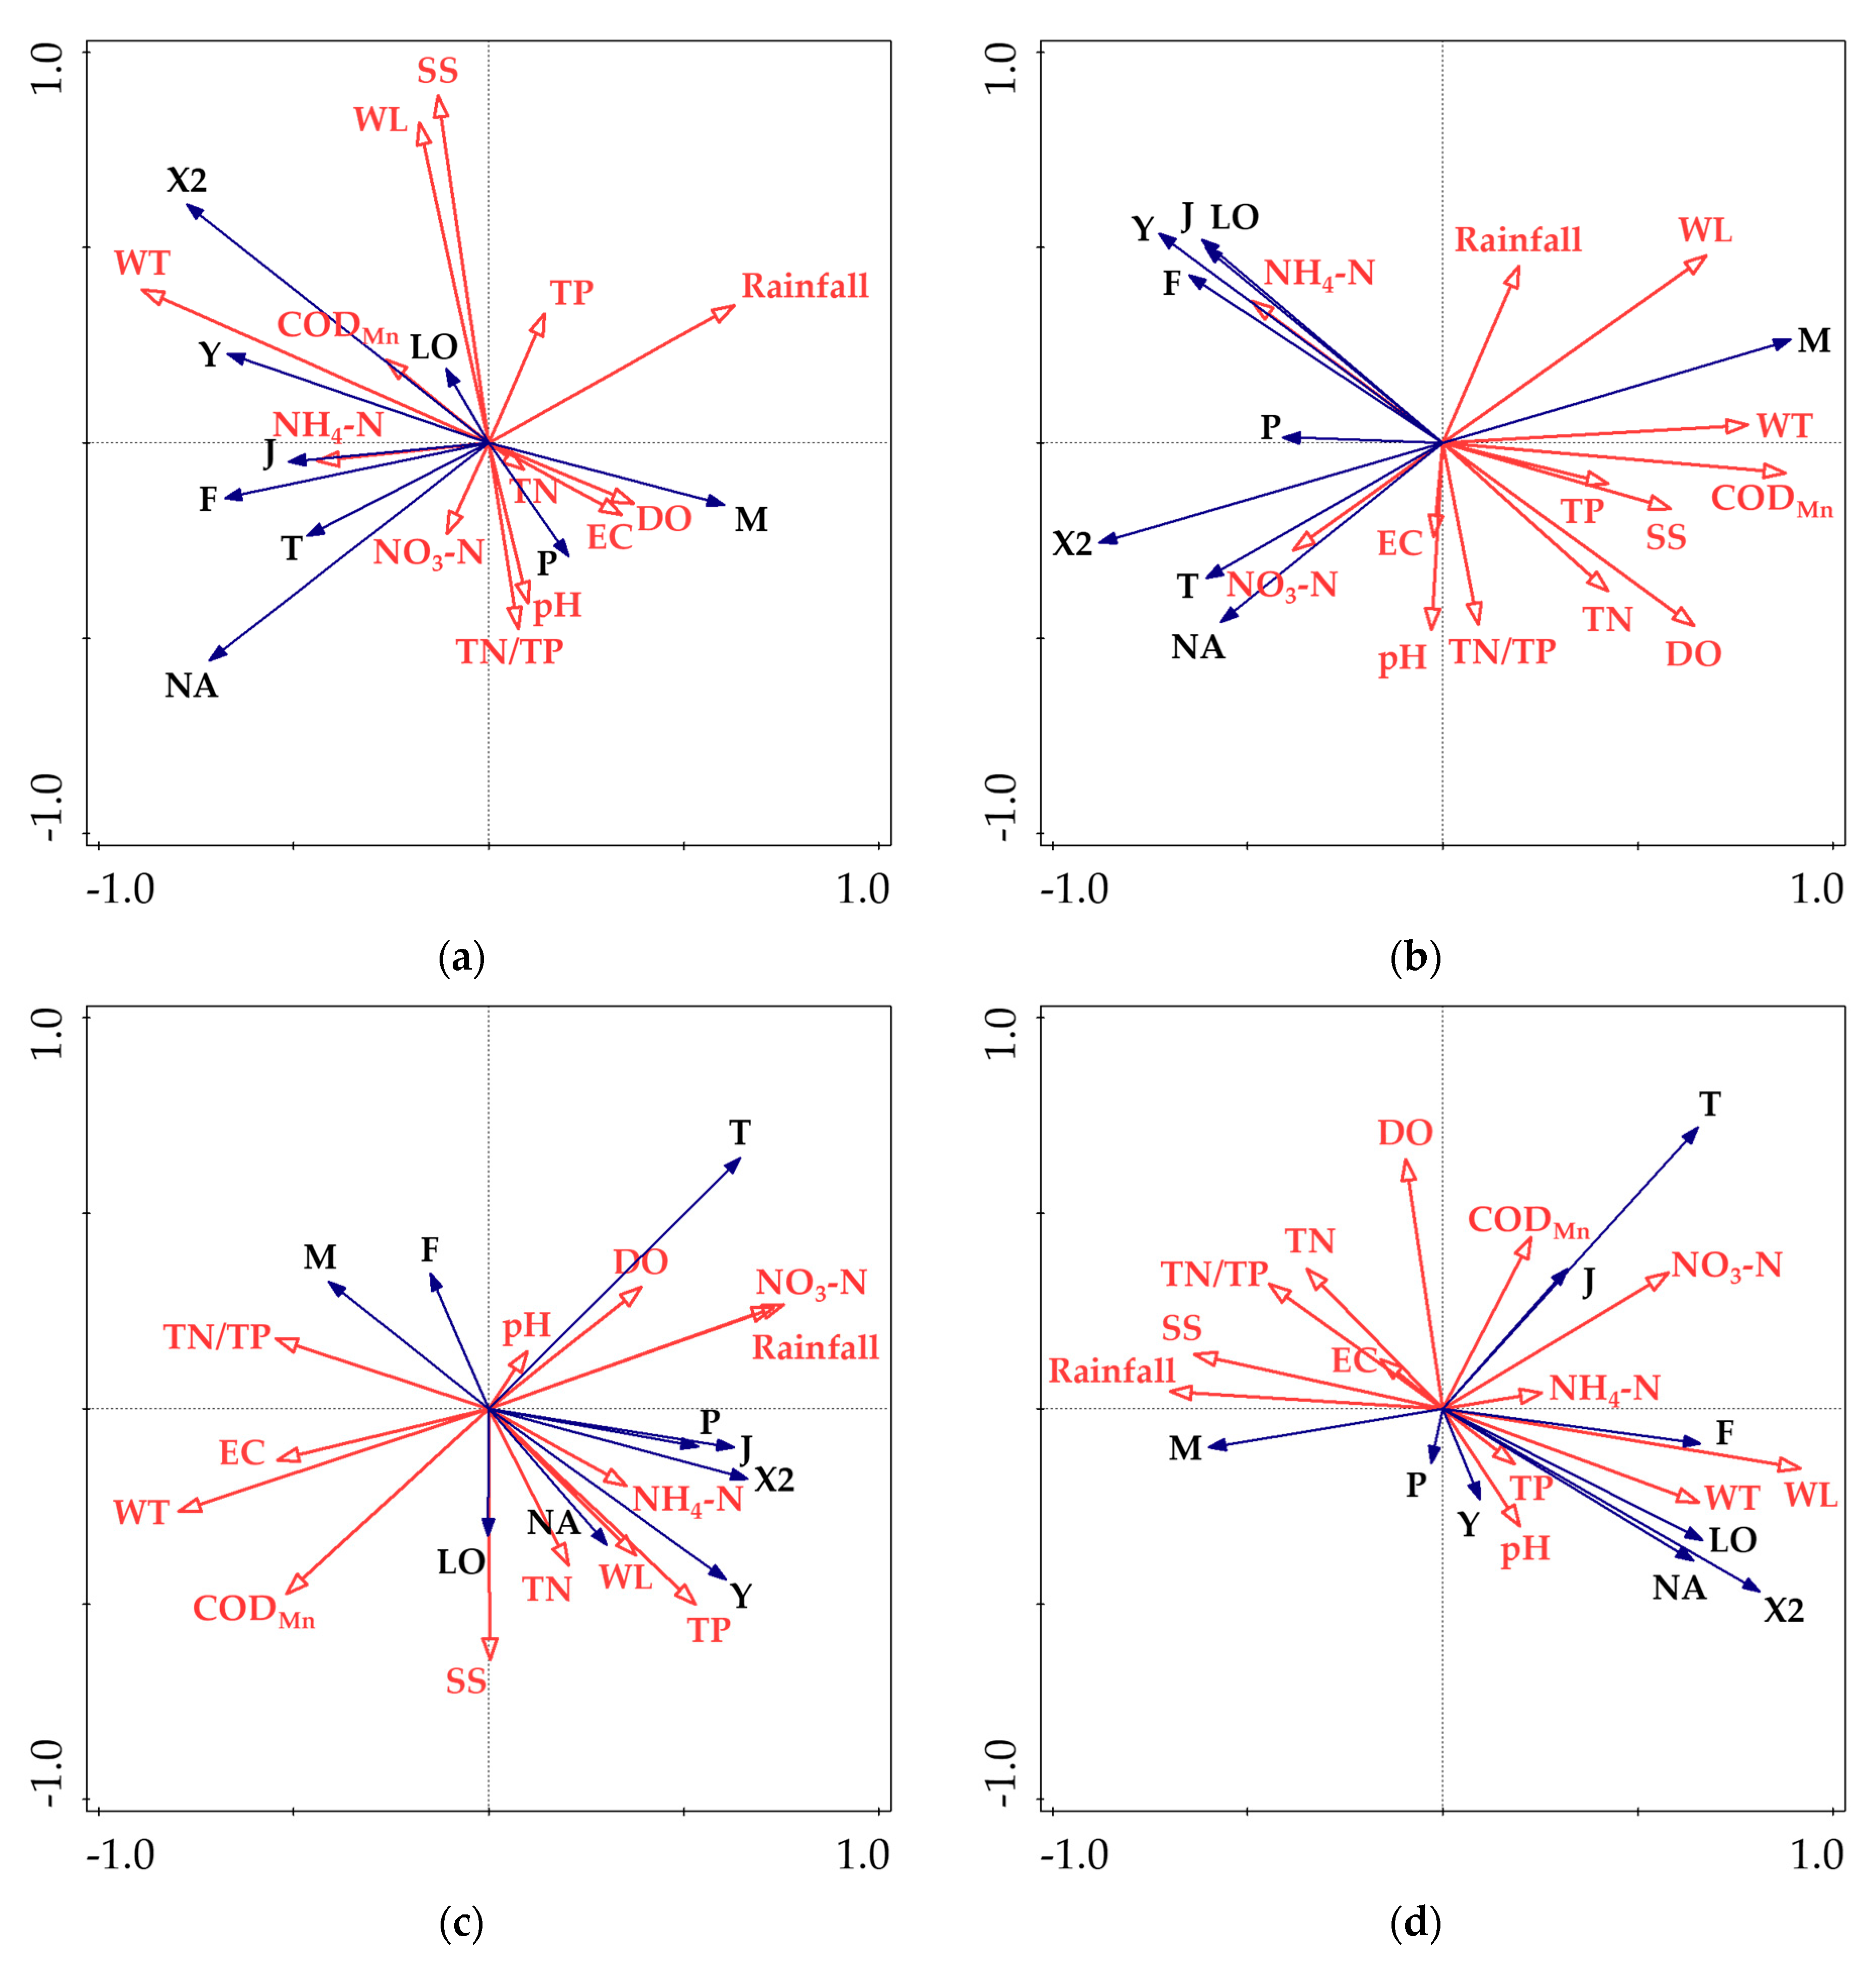
3.4. Redundancy Analysis

In this study, the functional groups with greater than 10% relative biomass were defined as the dominant functional groups. Nine groups were identified in Gaozhou Reservoir: M, X2, Y, LO, J, F, T, NA, and P (Table 2). Figure 5 shows the results of the RDA, based on dominant functional groups and major environmental factors.
WT, nitrogen, and phosphorus were the most important environmental factors affecting the phytoplankton functional groups (Figure 5). However, the influencing factors were different in different seasons. In the winter, WT and CODMn were positively associated with groups X2 and Y, but they were negatively associated with group M (Figure 5a). In the spring, WT was the main environmental factor affecting group M (Figure 5b). In the summer, TP, TN, and NH4-N were the main environmental factors affecting groups Y and NA (Figure 5c). In the autumn, WT, pH, and TP were the main environmental factors affecting groups X2 and NA (Figure 5d). The redundant environmental factors differed among seasons. The redundant environmental factors were TP and rainfall in the winter; CODMn, DO, and TN in the spring; WT, CODMn, and EC in the summer; and, TN, rainfall, and EC in the autumn.

4. Discussion

4.1. Phytoplankton Seasonal Dynamics

We found that phytoplankton species richness in Gaozhou Reservoir was greater in the summer and autumn than in the winter and spring. Generally, the mechanisms regulating the changes in phytoplankton communities are complex [44,45]. For example, the nutrient resources of aquatic ecosystems strongly affect ecosystem diversity [46]. Species are season-specific, which is a basic manifestation of phytoplankton adaptations to natural environments [10,47].
Functional groups P (Staurastrum sp. and Closterium acerosum) and Y (Cryptomonas ovata and Cryptomonas erosa) prefer weaker light intensity [10,11]. Light intensity is greater in the summer and autumn, but weaker in the winter and spring, as the Gaozhou Reservoir is located in the subtropics. Therefore, functional groups P and Y dominated the communities during the winter and spring [16,48,49]. Similarly, functional group X2 (Chroomonas acuta), which tolerates low temperatures [50], grew faster in the winter and spring.
The functional groups NA and P were dominant in the summer and autumn, when the nitrogen concentrations in Gaozhou Reservoir were lower than in the winter and spring. Cosmarium sp. and Staurodesmus sp. were the dominant taxa in the aquatic environment when the nutrient levels were low to moderate [11].
Functional group M had clear advantages at sites S3 and S4 in spring 2016, when cyanobacterial blooms were occurring at these two sites. Functional group P had strong advantages at most of the sampling sites in the winter and autumn of 2015, and functional group H2 dominated the community in the summer and autumn of 2016.

4.2. Environmental Driving Factors

Our results were consistent with previous studies that reported that temperature and nutrient availability strongly influenced phytoplankton species and biomass in aquatic ecosystems [51,52]. For example, the RDA results showed that WT was highly correlated with different functional groups in the winter as compared to the spring. WT was correlated with functional groups Y and X2 in the winter; with functional group M in the spring; and, with functional groups F, LO, X2, and NA in the autumn. In the winter and spring, NO3-N was highly correlated with the functional group F, and NH4-N was highly correlated with the functional groups T and NA. In the summer, NH4-N and TP affected additional functional groups, including Y, NA, X2, P, and J. TP affected the functional groups NA and X2 in the summer and autumn.
In winter, environmental parameters, including TP, rainfall, and SS, were located in the first quadrant (Figure 5a), but no functional groups were located in this quadrant, which indicated that these parameters had no direct impact on the functional groups. In the spring, quadrant II had no functional groups (Figure 5b), but several parameters, including TP, TN, and DO, were observed in this quadrant. There were no functional groups in quadrant III in the summer, and the environmental factors in this quadrant were WT, CODMn, and EC (Figure 5c). There were no functional groups in quadrant IV in the autumn, and the environmental factors in this quadrant were TN, DO, rainfall, and EC (Figure 5d). This seasonal difference in environmental factors among quadrants indicated that the redundancy of environmental factors differed among seasons, and the relationship between environmental factors and functional groups also fluctuated seasonally. For example, the environmental factors that were positively affected in the winter were redundant variables, which included TP. This suggested that the constraints associated with other factors (such as WT) would limit the occurrence and development of functional groups, even if TP were suitable. In the summer, the negatively affected environmental factors were also redundant variables, including WT. Obviously, water temperature is the highest in the summer and, thus, WT no longer acts as a restrictive environmental condition to limit the development of functional groups. Under these conditions, the environmental factors affecting the phytoplankton community structure are nitrogen and phosphorus nutrient levels.

4.3. Analysis of Cyanobacterial Blooms

Phytoplankton blooms are a comprehensive manifestation of the long-term aquatic ecological risks that are associated with a regional water environment [5,53]. The cyanobacterium Microcystis aeruginosa is induced at low temperatures and is dormant at high temperatures [54,55]. Guo et al. (2016) found that M. aeruginosa was induced at 15 °C, grew well at 19 °C, and entered dormancy at 31 °C in Dianchi Lake, China [55]. In Gaozhou Reservoir, the M. aeruginosa bloom occurred after the WT increased from 20.8 °C in winter 2016 to 28.0 °C in spring 2016; M. aeruginosa entered dormancy in the summer of 2016 at 31.2 °C. In addition, the reservoir also experienced blooms in the spring seasons of 2009, 2010, and 2013. The environmental conditions before the blooms had several similarities, such as low temperatures in the winter and increasing temperatures in the spring [32]. The Gaozhou Reservoir is rainy in the spring and, thus, nutrient concentrations in the reservoir increase due to the input of rainwater runoff. Previous studies recorded high concentrations of phosphorus at sampling sites S3 and S4 in the spring of 2016; these high levels of phosphorus were associated with the rainfall and the hydrodynamic conditions at these two sites. Sampling sites S3 and S4 are located in the bay of the Reservoir. The Gaozhou reservoir has a relatively long hydraulic retention time (approximately 451 days). In this study, S3 and S4 were two sites with serious cyanobacterial bloom. S4 site was around by the shoreside of the reservoir and closer to the dam, while S3 site might be affected by S4 site, due to the short distance between the two sites. Hence, the areas with cyanobacterial bloom were relatively closed, with lower flow velocity and less water exchange when compared to other areas of the reservoir [34]. These conditions may result in higher concentrations of phosphorus at these sites, which may induce cyanobacterial blooms. In addition, the prevailing winds blew many phytoplankton cells into the reservoir bay, resulting in a higher density of phytoplankton cells in this area when compared to surrounding locations. Therefore, environmental conditions and changes increased the aggregation of cyanobacterial cells at sites S3 and S4.

4.4. Environmental Implications

Here, data and analysis suggested that the low temperatures in Gaozhou Reservoir in the winter and spring, coupled with the dramatic difference in temperature between the winter and spring, resulted in the rapid growth of Microcystis aeruginosa. In addition, the high concentrations of phosphorus in the reservoir in the spring might have provided sufficient nutrients in order support the explosive proliferation of cyanobacteria. Finally, the specific hydrodynamic conditions of the water body might have inhibited dispersion, allowing for the growing cyanobacterial cells to further aggregate.

5. Conclusions

This study demonstrated that there was seasonal succession of phytoplankton species and functional groups in the Gaozhou Reservoir. The phytoplankton diversity was higher in the summer and autumn than in the winter and spring. Functional groups P (Staurastrum sp. and Closterium acerosum) and Y (Cryptomonas ovata and Cryptomonas erosa) were dominant in the winter and spring, while functional groups NA (Cosmarium sp. and Staurodesmus sp.) and P (Staurastrum sp. and Closterium acerosum) were dominant in summer and autumn. The temperature, nitrogen, and phosphorus levels were the important factors that were associated with the seasonal changes in phytoplankton community structure in the reservoir. The key factors leading to the blooms of Microcystis aeruginosa were temperature and phosphorus levels. The low temperatures in the winter of 2016 and the high concentrations of phosphorus in the spring of 2016, together with the favorable rainfall and hydrodynamic conditions in the reservoir, were the major factors triggering the phytoplankton blooms.

Author Contributions

Conceptualization, L.Y., X.Z. and B.X.; data curation, L.Y., R.L. and T.G.; investigation, L.Y., R.L. and T.G.; methodology, L.Y., X.Z. and T.G.; validation, B.X., G.-J.Z., S.L. and C.L.; writing—Original draft, L.Y., X.Z., G.-J.Z., B.X. and S.L.; writing—Review and editing, L.Y., B.X., G.-J.Z. and X.Z. All authors have read and agreed to the published version of the manuscript.

Funding

This work was funded by the Key-Area Research and Development Program of Guangdong Province (2019B110205004), National Natural Science Foundation of China (41977353, 41401115), the International Science & Technology Cooperation Program of Guangzhou (201704030110) and the Special Fund of Chinese Central Government for Basic Scientific Research Operations in Commonweal Research Institutes (PM-zx703-201602-048, PM-zx097-201904-131).

Acknowledgments

We thank Kunying Li and Yanhui Feng for water sample collection and analysis.

Conflicts of Interest

The authors declare no conflict of interest.

References

  1. Wilken, S.; Soares, M.; Urrutia-Cordero, P.; Ratcovich, J.; Ekvall, M.K.; Donk, E.V.; Hansson, L.A. Primary producers or consumers? Increasing phytoplankton bacterivory along a gradient of lake warming and browning: Increasing phytoplankton bacterivory. Limnol. Oceanogr. 2018, 63, S142–S155. [Google Scholar] [CrossRef] [Green Version]
  2. Zhao, X.; Drakare, S.; Johnson, R.K. Use of taxon-specific models of phytoplankton assemblage composition and biomass for detecting impact. Ecol. Indic. 2019, 97, 447–456. [Google Scholar] [CrossRef]
  3. Santana, R.M.D.C.; Dolbeth, M.; de Lucena Barbosa, J.E.; Patrício, J. Narrowing the gap: Phytoplankton functional diversity in two disturbed tropical estuaries. Ecol. Indic. 2018, 86, 81–93. [Google Scholar] [CrossRef]
  4. Dong, X.; Li, B.; He, F.; Gu, Y.; Sun, M.; Zhang, H.; Tan, L.; Xiao, W.; Liu, S.; Cai, Q. Flow directionality, mountain barriers and functional traits determine diatom metacommunity structuring of high mountain streams. Sci. Rep. 2016, 6, 24711. [Google Scholar] [CrossRef] [PubMed] [Green Version]
  5. Chirico, N.; António, D.C.; Pozzoli, L.; Marinov, D.; Malagó, A.; Sanseverino, I.; Beghi, A.; Genoni, P.; Dobricic, S.; Lettieri, T. Cyanobacterial Blooms in Lake Varese: Analysis and Characterization over Ten Years of Observations. Water 2020, 12, 675. [Google Scholar] [CrossRef] [Green Version]
  6. Michalak, A.M. Study role of climate change in extreme threats to water quality. Nature 2016, 535, 349–350. [Google Scholar] [CrossRef] [PubMed]
  7. Kozak, A.; Budzyńska, A.; Dondajewska-Pielka, R.; Kowalczewska-Madura, K.; Gołdyn, R. Functional Groups of Phytoplankton and Their Relationship with Environmental Factors in the Restored Uzarzewskie Lake. Water 2020, 12, 313. [Google Scholar] [CrossRef] [Green Version]
  8. Liu, X.; Qian, K.; Chen, Y.; Gao, J. A comparison of factors influencing the summer phytoplankton biomass in China’s three largest freshwater lakes: Poyang, Dongting, and Taihu. Hydrobiologia 2017, 792, 283–302. [Google Scholar] [CrossRef]
  9. Biggs, J.; von Fumetti, S.; Kelly-Quinn, M. The importance of small waterbodies for biodiversity and ecosystem services: Implications for policy makers. Hydrobiologia 2017, 793, 3–39. [Google Scholar] [CrossRef]
  10. Reynolds, C.S.; Huszar, V.; Kruk, C.; Naselliflores, L.; Melo, S. Towards a functional classification of the freshwater phytoplankton. J. Plankton Res. 2002, 24, 417–428. [Google Scholar] [CrossRef]
  11. Padisák, J.; Crossetti, L.O.; Naselli-Flores, L. Use and misuse in the application of the phytoplankton functional classification: A critical review with updates. Hydrobiologia 2009, 621, 1–19. [Google Scholar] [CrossRef]
  12. Costa, L.S.; Huszar, V.L.M.; Ovalle, A.R. Phytoplankton Functional Groups in a Tropical Estuary: Hydrological Control and Nutrient Limitation. Estuar. Coast. 2009, 32, 508–521. [Google Scholar] [CrossRef]
  13. Kruk, C.; Devercelli, M.; Huszar, V.L.M.; Hernández, E.; Beamud, G.; Diaz, M.; Silva, L.H.S.; Segura, A.M. Classification of Reynolds phytoplankton functional groups using individual traits and machine learning techniques. Freshw. Biol. 2017, 62, 1681–1692. [Google Scholar] [CrossRef]
  14. Rodrigues, L.C.; Pivato, B.M.; Vieira, L.C.G.; Bovo-Scomparin, V.M.; Bortolini, J.C.; Pineda, A.; Train, S. Use of phytoplankton functional groups as a model of spatial and temporal patterns in reservoirs: A case study in a reservoir of central Brazil. Hydrobiologia 2018, 805, 147–161. [Google Scholar] [CrossRef]
  15. Becker, V.; Huszar, V.L.M.; Crossetti, L.O. Responses of phytoplankton functional groups to the mixing regime in a deep subtropical reservoir. Hydrobiologia 2009, 628, 137–151. [Google Scholar] [CrossRef]
  16. Becker, V.; Caputo, L.; Ordóñez, J.; Marcé, R.; Armengol, J.; Crossetti, L.O.; Huszar, V.L.M. Driving factors of the phytoplankton functional groups in a deep Mediterranean reservoir. Water Res. 2010, 44, 3345–3354. [Google Scholar] [CrossRef]
  17. Souza, M.D.C.D.; Crossetti, L.O.; Becker, V. Effects of temperature increase and nutrient enrichment on phytoplankton functional groups in a Brazilian semi-arid reservoir. Acta Limnol. Bras. 2018, 30, e215. [Google Scholar] [CrossRef] [Green Version]
  18. Cao, J.; Hou, Z.; Li, Z.; Chu, Z.; Yang, P.; Zheng, B. Succession of phytoplankton functional groups and their driving factors in a subtropical plateau lake. Sci. Total Environ. 2018, 631, 1127–1137. [Google Scholar] [CrossRef]
  19. Santana, L.M.; Crossetti, L.O.; Ferragut, C. Ecological status assessment of tropical reservoirs through the assemblage index of phytoplankton functional groups. Braz. J. Bot. 2017, 40, 695–704. [Google Scholar] [CrossRef]
  20. Cupertino, A.; Gücker, B.; Von Rückert, G.; Figueredo, C.C. Phytoplankton assemblage composition as an environmental indicator in routine lentic monitoring: Taxonomic versus functional groups. Ecol. Indic. 2019, 101, 522–532. [Google Scholar] [CrossRef]
  21. Cai, Q.; Liu, J.; King, L. A comprehensive model for assessing lake eutrophication. Chin. J. Appl. Ecol. 2002, 13, 1674–1678. [Google Scholar]
  22. Trolle, D.; Spigel, B.; Hamilton, D.P.; Norton, N.; Sutherland, D.; Plew, D.; Allan, M.G. Application of a Three-Dimensional Water Quality Model as a Decision Support Tool for the Management of Land-Use Changes in the Catchment of an Oligotrophic Lake. Environ. Manag. 2014, 54, 479–493. [Google Scholar] [CrossRef] [PubMed]
  23. Huo, S.; Ma, C.; Xi, B.; Su, J.; Zan, F.; Ji, D.; He, Z. Establishing eutrophication assessment standards for four lake regions, China. J. Environ. Sci. China 2013, 25, 2014–2022. [Google Scholar] [CrossRef]
  24. Padisák, J.; Borics, G.; Grigorszky, I.; Soróczki-Pintér, É. Use of Phytoplankton Assemblages for Monitoring Ecological Status of Lakes within the Water Framework Directive: The Assemblage Index. Hydrobiologia 2006, 553, 1–14. [Google Scholar] [CrossRef]
  25. Yang, C.; Nan, J.; Li, J. Driving Factors and Dynamics of Phytoplankton Community and Functional Groups in an Estuary Reservoir in the Yangtze River, China. Water 2019, 11, 1184. [Google Scholar] [CrossRef] [Green Version]
  26. Lu, X.; Song, S.; Lu, Y.; Wang, T.; Liu, Z.; Li, Q.; Zhang, M.; Suriyanarayanan, S.; Jenkins, A. Response of the phytoplankton community to water quality in a local alpine glacial lake of Xinjiang Tianchi, China: Potential drivers and management implications. Environ. Sci. Process. Impacts 2017, 19, 1300–1311. [Google Scholar] [CrossRef] [Green Version]
  27. Zhang, J.; Ni, W.; Luo, Y.; Jan Stevenson, R.; Qi, J. Response of freshwater algae to water quality in Qinshan Lake within Taihu Watershed, China. Phys. Chem. Earth Parts A/B/C 2011, 36, 360–365. [Google Scholar] [CrossRef]
  28. Yao, L.; Zhao, X.; Ma, Q.; Liang, R.; Xia, B.; Zhuo, Q. Nitrogen and Phosphorous Adsorption Characteristics of Suspended Solids Input into a Drinking Water Reservoir via Typhoon Heavy Rainfall. Environ. Sci. 2018, 39, 3622–3630. [Google Scholar]
  29. Yao, L.; Zhao, X.; Ma, Q.; Liang, R.; Xia, B.; Gou, T. Simulation of the impact of typhoon-induced suspended solids precipitation on water quality in a reservoir for drinking water. Ecol. Environ. Sci. 2018, 27, 1900–1907. [Google Scholar]
  30. Xu, Y.; Gu, J.; Yang, Y.; Xiao, L. Seasonal dynamics of phytoplankton morphological characters and driving factors in tropical reservoirs: A case study from Gaozhou Reservoir. J. Lake Sci. 2019, 31, 825–836. [Google Scholar]
  31. Li, S.; Han, Z.; Xu, Z.; Zhao, X.; Yao, L.; Wei, D.; Zhang, J.; Hu, F. Study on the Structure of Phytoplankton Community and Its Relationships with Environmental Factors in Gaozhou reservoir. J. Hydroecology 2013, 34, 16–24. [Google Scholar]
  32. Yao, L.; Zhao, X.; Zhou, G.; Wanyan, H.; Cai, L.; Hu, G.; Xu, Z. Preliminary regulating factors of spring cyanobacterial bloom in Gaozhou Reservoir, Guangdong Province. J. Lake Sci. 2011, 23, 534–540. [Google Scholar]
  33. Ma, T.; Huang, Y. Characteristics change of nitrogen and phosphorus nutrients and water strategies in Gaozhou Reservoir. Ecol. Sci. 2015, 34, 31–37. [Google Scholar]
  34. Xiao, L.; Hu, R.; Peng, L.; Lei, L.; Feng, Y.; Han, B. Dissimilarity of phytoplankton assemblages in two connected tropical reservoirs: Effects of water transportation and environmental filtering. Hydrobiologia 2016, 764, 127–138. [Google Scholar] [CrossRef]
  35. The State Environmental Protection Administration. Water and Wastewater Monitoring and Analysis Method, 4th ed.; China Environmental Science Press: Beijing, China, 2002. [Google Scholar]
  36. Rice, E.W.; Baird, R.B.; Eaton, A.D.; Clesceri, L.S. Standard Methods for the Examination of Water and Wastewater; American Public Health Association: Washington, DC, USA, 2012; Volume 10. [Google Scholar]
  37. Zeng, Q.; Qin, L.; Bao, L.; Li, Y.; Li, X. Critical nutrient thresholds needed to control eutrophication and synergistic interactions between phosphorus and different nitrogen sources. Environ. Sci. Pollut. Res. 2016, 23, 21008–21019. [Google Scholar] [CrossRef]
  38. Lund, J.W.G.; Kipling, C.; Cren, E.D.L. The inverted microscope method of estimating algal numbers and the statistical basis of estimations by counting. Hydrobiol 1958, 11, 143–170. [Google Scholar] [CrossRef]
  39. Hillebrand, H.; Du Rselen, C.; Kirschtel, D.; Zohary, U.P.A.T. Biovolume calculation for pelagic and benthic microalgae. J. Phycol. 1999, 35, 403–424. [Google Scholar] [CrossRef]
  40. Wetzel, R.G.; Likens, G.E. Limnological Analyses, 3rd ed.; Springer: Berlin/Heidelberg, Germany, 2000. [Google Scholar]
  41. Nixdorf, B.; Rektins, A.; Mischke, U. Standards and Thresholds of the EU Water Framework Directive (WFD)—Phytoplankton and Lakes. In Standards and Thresholds for Impact Assessment; Springer: Berlin/Heidelberg, Germany, 2008; pp. 301–314. [Google Scholar]
  42. Tu, Q.; Jin, X. The Standard Methods in Lake Eutrophication Investigation, 2nd ed.; China Environmental Science Press: Beijing, China, 1990. [Google Scholar]
  43. Zheng, B.; Xu, Q.; Zhu, Y. Primary study on enacting the lake nutrient control standard. Environ.Sci. 2009, 30, 2497–2501. [Google Scholar] [CrossRef]
  44. Lenard, T.; Ejankowski, W.; Poniewozik, M. Responses of Phytoplankton Communities in Selected Eutrophic Lakes to Variable Weather Conditions. Water 2019, 11, 1207. [Google Scholar] [CrossRef] [Green Version]
  45. Dai, J.; Wu, S.; Wu, X.; Xue, W.; Yang, Q.; Zhu, S.; Wang, F.; Chen, D. Effects of Water Diversion from Yangtze River to Lake Taihu on the Phytoplankton Habitat of the Wangyu River Channel. Water 2018, 10, 759. [Google Scholar] [CrossRef] [Green Version]
  46. Hardikar, R.; Haridevi, C.K.; Chowdhury, M.; Shinde, N.; Ram, A.; Rokade, M.A.; Rakesh, P.S. Seasonal distribution of phytoplankton and its association with physico-chemical parameters in coastal waters of Malvan, west coast of India. Environ. Monit. Assess. 2017, 189, 151. [Google Scholar] [CrossRef] [PubMed]
  47. Huang, G.; Wang, X.; Chen, Y.; Xu, L.; Xu, D. Seasonal succession of phytoplankton functional groups in a reservoir in central China. Fundam. Appl. Limnol. /Arch. Für Hydrobiol. 2018, 192, 1–14. [Google Scholar] [CrossRef]
  48. Yu, H.; Wu, J.; Ma, C.; Qin, X. Seasonal dynamics of phytoplankton functional groups and its relationship with the environment in river: A case study in northeast China. J. Freshw. Ecol. 2012, 27, 429–441. [Google Scholar] [CrossRef]
  49. Lv, J.; Wu, H.; Chen, M. Effects of nitrogen and phosphorus on phytoplankton composition and biomass in 15 subtropical, urban shallow lakes in Wuhan, China. Limnologica 2011, 41, 48–56. [Google Scholar] [CrossRef] [Green Version]
  50. Tian, C.; Hao, D.; Pei, H.; Doblin, M.A.; Ren, Y.; Wei, J.; Feng, Y. Phytoplankton Functional Groups Variation and Influencing Factors in a Shallow Temperate Lake. Water Environ. Res. 2018, 90, 510–519. [Google Scholar] [CrossRef] [PubMed]
  51. Xiao, L.; Wang, T.; Hu, R.; Han, B.; Wang, S.; Qian, X.; Padisák, J. Succession of phytoplankton functional groups regulated by monsoonal hydrology in a large canyon-shaped reservoir. Water Res. 2011, 45, 5099–5109. [Google Scholar] [CrossRef]
  52. Yang, J.; Wang, F.; Lv, J.; Liu, Q.; Nan, F.; Liu, X.; Xu, L.; Xie, S.; Feng, J. Interactive effects of temperature and nutrients on the phytoplankton community in an urban river in China. Environ. Monit. Assess. 2019, 191, 688. [Google Scholar] [CrossRef]
  53. Jiang, Z.; Du, P.; Liao, Y.; Liu, Q.; Chen, Q.; Shou, L.; Zeng, J.; Chen, J. Oyster farming control on phytoplankton bloom promoted by thermal discharge from a power plant in a eutrophic, semi-enclosed bay. Water Res. 2019, 159, 1–9. [Google Scholar] [CrossRef]
  54. Shang, L.; Feng, M.; Liu, F.; Xu, X.; Ke, F.; Chen, X.; Li, W. The establishment of preliminary safety threshold values for cyanobacteria based on periodic variations in different microcystin congeners in Lake Chaohu, China. Environ. Sci. Proc. Imp. 2015, 17, 728–739. [Google Scholar] [CrossRef]
  55. Guo, W.; Liu, Q.; Peng, X.; Liu, C. Principle of Vernalization in Microcystis aeruginosa in Dianchi Lake and Improvement of Gene Model on Controlling the Vernalization. Ecol. Environ. Sci. 2016, 25, 2028–2034. [Google Scholar]
Figure 1. of the Gaozhou Reservoir and of the sampling sites in the reservoir.
Water 12 01167 g001
Figure 2. Composition and abundance of the representative functional groups of phytoplankton in Gaozhou Reservoir from 2015 to 2017. (a) abundance in winter; (b) relative biomass in winter; (c) abundance in spring; (d) relative biomass in spring; (e) abundance in summer; (f) relative biomass in summer; (g) abundance in autumn; and (h) relative biomass in autumn.
Water 12 01167 g002
Figure 3. Seasonal changes in total phosphorus (TP) at different sampling sites in Gaozhou Reservoir from 2015 to 2017.
Water 12 01167 g003
Figure 4. Evaluation of the ecological status of Gaozhou Reservoir from 2015 to 2017 based on the Q and TLI(Σ) indexes.
Water 12 01167 g004
Figure 5. Redundancy analysis of the representative functional groups of phytoplankton and the environmental factors in Gaozhou Reservoir. (a) winter; (b) spring; (c) summer; and, (d) autumn.
Water 12 01167 g005
Table 1. Species of phytoplankton and their respective proportion (%) in different seasons in the Gaozhou Reservoir.
WinterSpringSummerAutumnAll seasons
TaxaProportionTaxaProportionTaxaProportionTaxaProportionTaxaProportion
Cyanobacteria109.71%1513.76%1915.08%1512.50%2012.90%
Cryptophytes43.88%43.67%43.17%43.33%42.58%
Dinoflagellates43.88%54.59%53.97%54.17%53.23%
Chrysophytes10.97%10.92%10.79%10.83%10.65%
Diatoms2625.24%2623.85%2923.02%2823.33%3019.35%
Euglenophytes21.94%32.75%32.38%32.50%31.94%
Chlorophytes5654.37%5550.46%6551.59%6453.33%9259.35%
Total taxa103100%109100%126100%120100%155100%
Table 2. Main phytoplankton taxa, functional groups, and respective F factors in the samples collected from the Gaozhou Reservoir from 2015 to 2017.
Functional GroupsPhytoplankton SpeciesTaxonomic GroupF Factor
MMicrocystis aeruginosa aCyanobacteria0
S1Pseudanabaena sp.Cyanobacteria0
SNCylindrospermopsis raciborskiiCyanobacteria0
H1Aphanizomenon flos-aquaeCyanobacteria0
H2Dolichospermum circinaleCyanobacteria2.0
X1Ankistrodesmus falcatus, Monoraphidium sp.Chlorophytes3.5
X2Chroomonas acutaaCryptophytes5.0
X3Schroederia sp.Chlorophytes5.0
YCryptomonas ovataa, Cryptomonas erosaa,Cryptophytes3.0
Gymnodinium aeruginosumaDinoflagellates
LMCeratium hirundinellaDinoflagellates4.0
LOPeridiniopsis borgei aDinoflagellates4.0
Chroococcus sp., Merismopedia glaucaCyanobacteria
KAphanocapsa sp.Cyanobacteria0
TCGloeocapsa punctataCyanobacteria4.0
EDinobryon divergensChrysophytes5.0
DSynedra acus, Nitzschia sublinearisDiatoms2.0
CCyclotella meneghiniana, Cymbella perpusilla, Navicula sp., Diploneis sp.Diatoms3.0
BCyclotella bodanicaDiatoms4.0
ARhizosolenia sp., Attheya zachariasiDiatoms4.0
MPAchnanthes exigua, Cocconeis placentulaDiatoms4.0
W1Euglena sp., Phacus sp.Euglenophytes0
W2Trachelomonas sp.Euglenophytes1.0
WOChlamydomonas globosaChlorophytes0
GEudorina elegans, Pandorina morumChlorophytes2.0
JTetraëdron trigonum a, Pediastrum duplex var. gracillimum,
Scenedesmus sp., Chodatella sp., Crucigenia sp., Coelastrum sp.
Chlorophytes2.0
FHaematococcus pluvialis, Planktosphaeria gelotinosa, Quadrigula chodatii, Elakatothrix gelatinosa a, Selenastrum dibraianum, Kirchneriella lunaris, Oocystis lacustisChlorophytes5.0
TMougeotia gracillima aChlorophytes5.0
NACosmarium sp. a, Staurodesmus sp. a, Euastrum sp.,Chlorophytes3.0
PStaurastrum sp. a, Closterium acerosum aChlorophytes2.0
Melosira varians a, Fragilaria sp. aDiatoms
a Descriptor species (>10% of the total biomass).
Table 3. Mean and range (Min–Max) of environmental factors in the Gaozhou Reservoir for each season from 2015 to 2017.
WinterSpingSummerAutumn
MeanRangeMeanRangeMeanRangeMeanRange
WT (°C)20.817.8–23.928.022.9–32.231.228.8–33.326.524.8–27.8
pH7.336.73–8.367.326.29–8.338.638.10–9.287.616.84–8.93
DO (mg L−1)8.116.12–10.7110.038.14–14.388.787.74–9.907.405.54–9.25
EC (μs cm−1)58.754.4–67.066.159.8–88.358.853.1–64.756.953.8–60.9
SS (mg L−1)2.10.3–5.29.02.0–59.03.51.4–8.02.51.4–5.0
TN (mg L−1)0.580.37–0.950.940.36–2.600.580.20–1.060.560.38–0.85
NH4–N (mg L−1)0.0640.028–0.1540.0690.013–0.1350.0600.027–0.1780.0550.029–0.097
NO3–N (mg L−1)0.350.19–0.680.380.08–0.850.220.08–0.620.250.12–0.49
TP (mg L−1)0.0230.008–0.0710.0350.010–0.1100.0220.009–0.0400.0220.009–0.048
CODMn (mg L−1)1.90.8–4.23.30.6–12.22.21.4–3.51.91.2–2.8
Chla (mg m−3)8.93.1–36.325.85.2–193.316.84.4–53.814.86.8–32.4
WL (m)60.660.3–61.361.060.4–61.860.760.4–61.260.760.2–61.2
Rainfall (mm)23950–428504428–684888633–1116337210–517
WT: water temperature; DO: dissolved oxygen; EC: electrical conductivity; SS: suspended solid; TN: total nitrogen; NH4-N: ammonium nitrogen; NO3-N: nitrate nitrogen; TP: total phosphorus; CODMn: permanganate index; Chla: chlorophyll a concentration; WL: water level.

