Article

Fatigue Life Study of Francis Pump under Reverse Generation Condition Based on Fluid Solid Coupling

1
College of Energy and Electrical Engineering, Hohai University, Nanjing 210098, China
2
Technological Institute of Merida, Technological Avenue, Merida 97118, Mexico
3
College of Water Conservancy and Hydropower Engineering, Hohai University, Nanjing 210098, China
4
Management Division of Qinhuai River Hydraulic Engineering of Jiangsu Province, Nanjing 210001, China
*
Author to whom correspondence should be addressed.
Water 2020, 12(4), 1162; https://doi.org/10.3390/w12041162
Submission received: 10 March 2020 / Revised: 15 April 2020 / Accepted: 17 April 2020 / Published: 18 April 2020
(This article belongs to the Section Hydraulics and Hydrodynamics)

Abstract

:
In non-design conditions, severe hydraulic instability can affect the stability of a pump station and even shorten its service life. A Francis pump station in the South-to-North Water Transfer Project was examined to carry out a numerical simulation of the entire flow passage using a bidirectional fluid–solid method for static and fatigue life. Due to the inlet setting, reverse power generation exhibited a more distorted flow pattern that resulted in higher energy loss than the pump condition. The radial force acting on the blades in reverse power generation was 39.1% higher. Runner stress was mainly concentrated at the leading edge and blade edge. The maximum stress in reverse power generation was 35.7 MPa, which was about 28.5% higher than in the pump condition. While the maximum deformation was 0.035 mm, almost 94.4% more severe than in the pump condition, mainly concentrated at the leading edge. Based on the fatigue analysis, a minimum safety factor obtained numerically was 8.238 in the pump condition and 6.343 in the reverse power condition, respectively. The safety factors satisfy the safety standard of the runner material and meet requirements of safety and stability in the reverse power generation condition.

1. Introduction

Pumping stations are commonly used in engineering applications to pump water from one reservoir to another, including the drainage, flood control, water diversion and irrigation projects [1,2]. However, in non-flood periods, water resources of the pump stations are often wasted. Hence, due to the recent implemented energy policies in China, several pumping stations are also designed to store and utilize the potential energy (height difference) of water to drive pumps and generate electricity to maximize the utilization efficiency of water resources [3,4,5]. This measure is low-cost and clean, which not only increases the income for the pump project company, but also provides the urgently needed electric energy for the society. At present, the evaluation of the benefit of pumping station at home and abroad have been mainly carried out from the perspective of technical and economic indicators, social impact, environmental impact [6,7,8,9], etc., while research on the service life and numerical modeling of the unit is relatively scarce.
During the reverse operation of pumps, a runner runs under non-design conditions for a long time, and the pressure shows severe fluctuations, which usually results in pump blade abrasion and cavitation [10]. This phenomenon may induce mechanical vibration, and even mechanical failure in some cases. Therefore, it is of great significance to study the force and deformation of the runner blade to check the fatigue life of the pump in reverse conditions.
In recent years, a significant number of researchers have studied the force and deformation of the runner blades of pumps and turbines based on the numerical methods. Particularly, Fluid–structure interaction (FSI) theory has been widely used to analyze flow-induced vibration and to evaluate the effects of fatigue on the lifetime of hydraulic machinery [11,12,13,14]. Based on the fluid–solid coupling theory, three-dimensional turbulent flow fields in centrifugal pump with long-mid-short blade complex impeller have been calculated and analyzed numerically by Cui [15]. From the numerical results, the relative velocity and pressure distributions in the flow part were obtained and the variation amplitude of total pressure was bigger than that of static pressure on the interface of volute and impeller. Wang carried out the numerical simulation of the impeller coupled system, with one-way fluid–structure interaction method on the CAE co-simulation platform, in order to accurately calculate the stress and deformation of the stamping and welding impeller in the flow field [16]. The fluid–solid coupling technique was adopted by Chen to solve the fluid and solid coupling equation and analyze the blade stress in reactor coolant pump of a 300 MWe nuclear power plant in China [17]. As to the hydrostatic mechanical seal in reactor coolant pumps, an analytical fluid–solid strong-interaction model has been proposed by Liao to study the mechanisms and performances of the mechanical seals in reactor coolant pumps [18]. Likewise, in order to study the influence of impeller blade thickness on the performance of stainless steel multistage centrifugal pump, the whole flow field of stainless steel multistage centrifugal pump with different blade thickness were calculated based on ANSYS Fluent [19]. Zhang et al. [20] predicted the rotor stress at different operating points of the reactor coolant pump and Kan et al. [21] analyzed the Francis turbine’s runner deformation and stress distribution.
In order to improve the accuracy of numerical simulation and consider the interaction between structure field and flow field, the two-way fluid–structure interaction simulation was employed albeit with the increased computing resources. Li Wei et al. [22] used ANSYS to study the impeller rotor of Francis pump and compared the deformation and dynamic stress distribution of impeller blade, before and after fluid–solid coupling. Shi Weidong et al. [23] solved the internal flow field and impeller structure response of axial-flow pump by two-way sequential fluid solid coupling. Then the deformation and dynamic stress distribution law of impeller blade was studied under fluid solid coupling. In the same way, Zheng Xiaobo et al. [24] used CFX and ANSYS APDL to solve the fluid and solid domains of tubular turbines and analyzed the effects of unidirectional and bidirectional coupling on structural stress and strain. Wu Guangkuan et al. [25] carried out numerical simulation of Francis turbine under four different working conditions and put forward crack control methods according to the stress distribution.
In addition to the aforementioned force and deformation studies, research on the fatigue damage and fatigue life of pumps—especially runner blades—is of great importance to the service life of these pumping stations. Fatigue and cracks often occur to large hydraulic turbines, which seriously affect the safety and stability of the operation of hydraulic power stations [26]. Wang Shaobo et al. [27] collected and analyzed research results concerning fatigue life of Francis turbine runners from the aspects of load spectrum, runner material and the estimation methods. Moreover, the computing method of dynamic stress of runner and obtaining the corrosion-fatigue characteristics of material of runner were discussed for the study of fatigue life. Carpinteri [28] studied the fatigue cracks of the Francis turbine runner and simulated the crack propagation by using the stress-intensity factor (SIF) values obtained from finite element analyses. The fatigue damage and life of the pump blades are affected by the alternating stress, average stress, surface condition of blade, corrosion medium and so on [29,30,31]. When the pump generates electricity in reverse condition, the water flow has a direct impact on the runner blades. The runner bears fluctuating cyclic hydraulic loading during rotation under the non-design conditions and the fatigue life of the runner is greatly affected by the water flow [32]. Similar to the Francis turbine runner, the pump blades also endure the complicated working conditions, hence, it is important to conduct the fatigue analysis and estimate the fatigue life of pump blades, especially under reverse power generation.
In this paper, the bidirectional fluid structure coupling method is employed to study the stress and deformation distribution of the runner at a pumping station of South-to-North Water Diversion Project under the condition of reverse power generation. The numerical simulation of the whole flow channel of water pump is carried out and the stress distribution and deformation of the pump blades under forward and reverse power generation conditions are compared. Moreover, the theoretical and numerical calculation of the fatigue strength are conducted, and the fatigue life of the runner is preliminarily estimated in order to study how to improve the service life of the pumping station. The research definitely provides a reference for the safe and stable operation of pump station in reverse power generation.
The remainder of the paper is organized as follows: First, the numerical modeling of a Francis pump in the South-to-North Water Transfer Project is introduced together with the experimental comparison of external characteristics of the pump in Section 2. Section 3 deliberates the numerical simulation of the pump based on the two-way fluid–structure coupling method. The numerical results and discussion are detailed in Section 4. The stress distribution and deformation of the pump blade under forward and reverse power generation conditions are compared and the estimation of fatigue life is carried out. Final concluding remarks are given in Section 5.

2. Model Establishment and Experiments

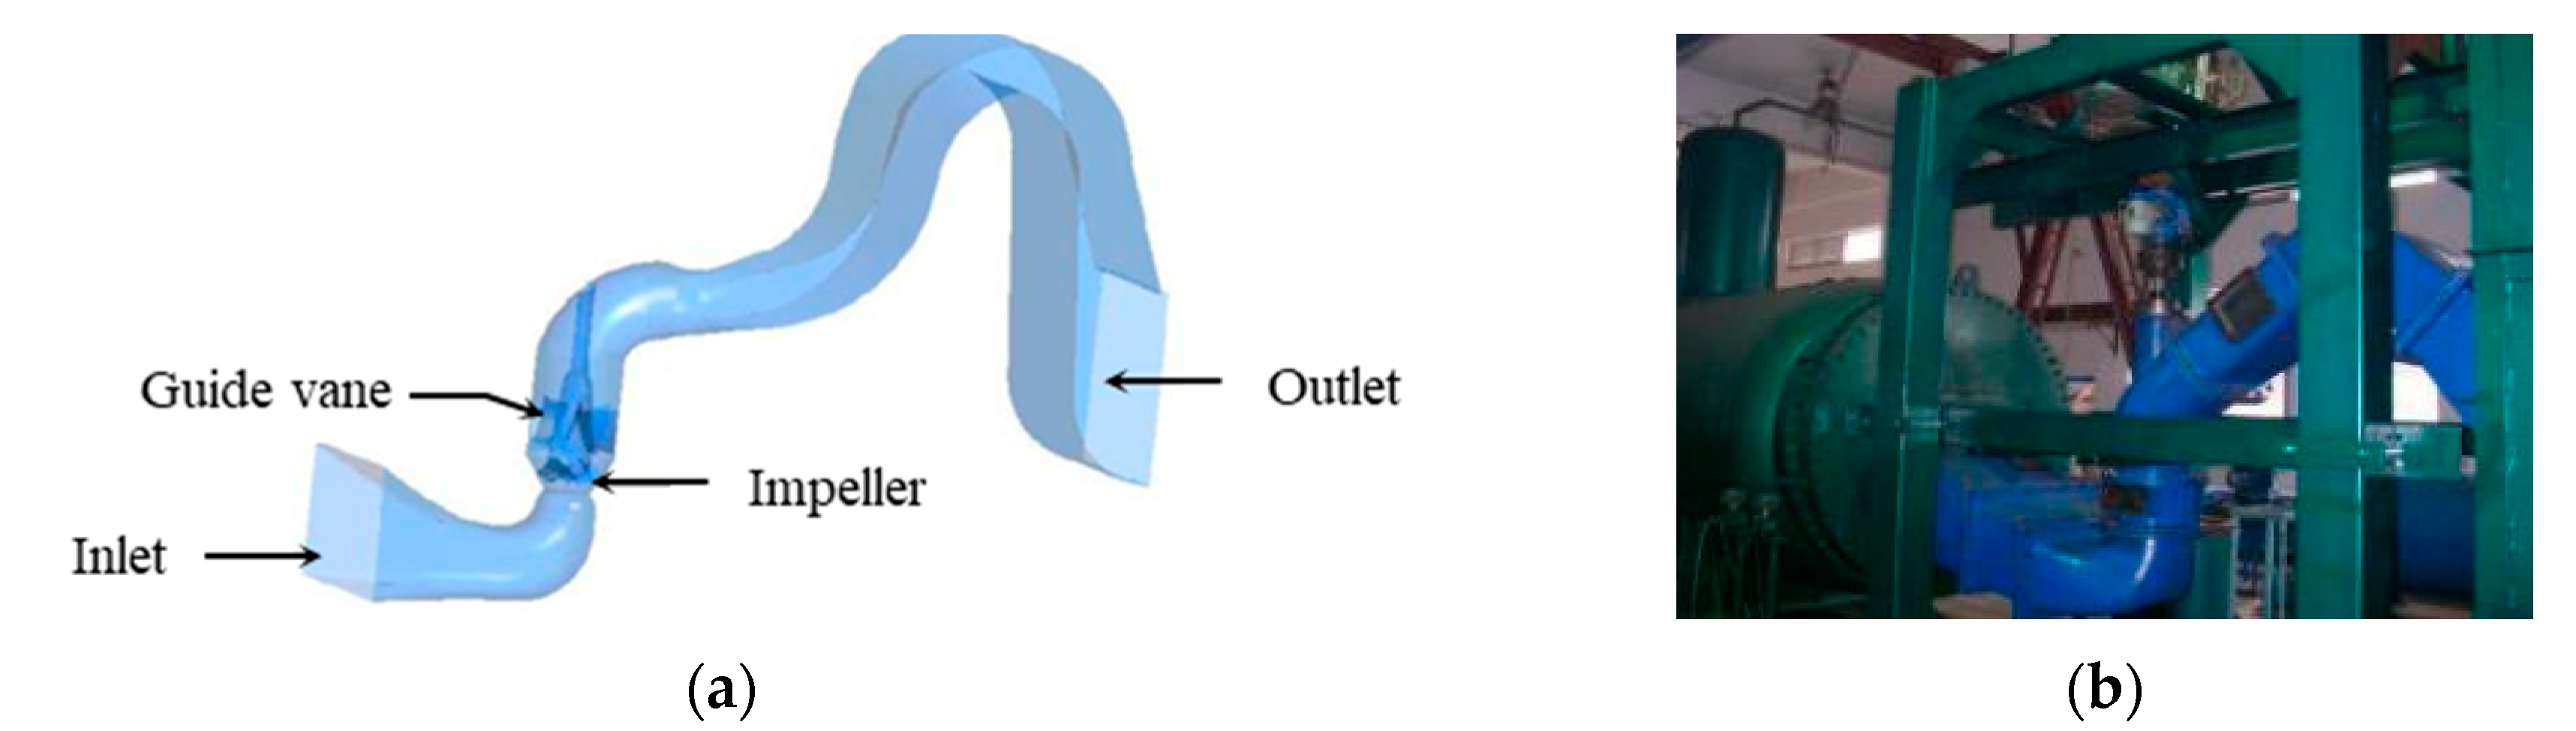
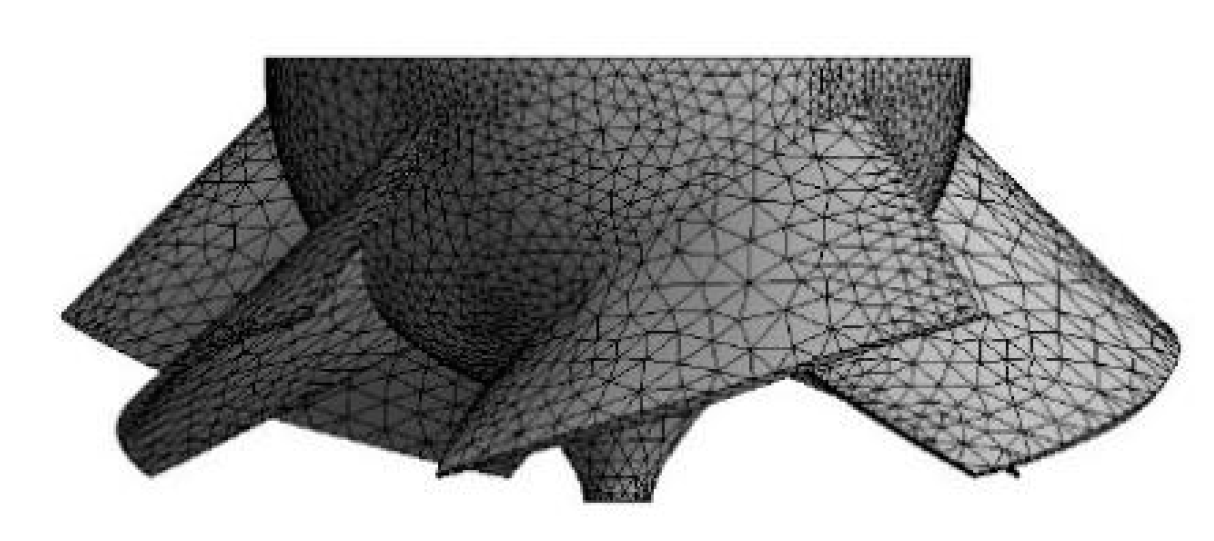
2.1. Modeling and Meshing

The whole flow passage of a Francis pump used in the South-to-North Water Transfer Project was evaluated under pump and reverse power generation conditions. The whole flow passage included the intake passage, runner, guide vane and outlet passage [33]. The flow direction of the pump has an included angle with the axis. The parameters of the pump were as follows: the diameter of runner was 3.7 m. The number of blades was 5. The inlet guide vane was characterized by 7 vanes. The design flow rate, Q, was 11.3 m3/s. The design head, H, was 7.8 m. The specific speed, ns = 657. An unstructured and hexahedral mesh was used with the ANSYS ICEM CFD, considering the irregular shape of the runner and guide vane area. The number of elements was 5,523,376, and of nodes, 950,675. The mesh quality was controlled by the skewness, which should be less than 0.4 [34]. The numerical model under the pump condition and the experimental site of the Francis pump employed are presented in Figure 1a,b.

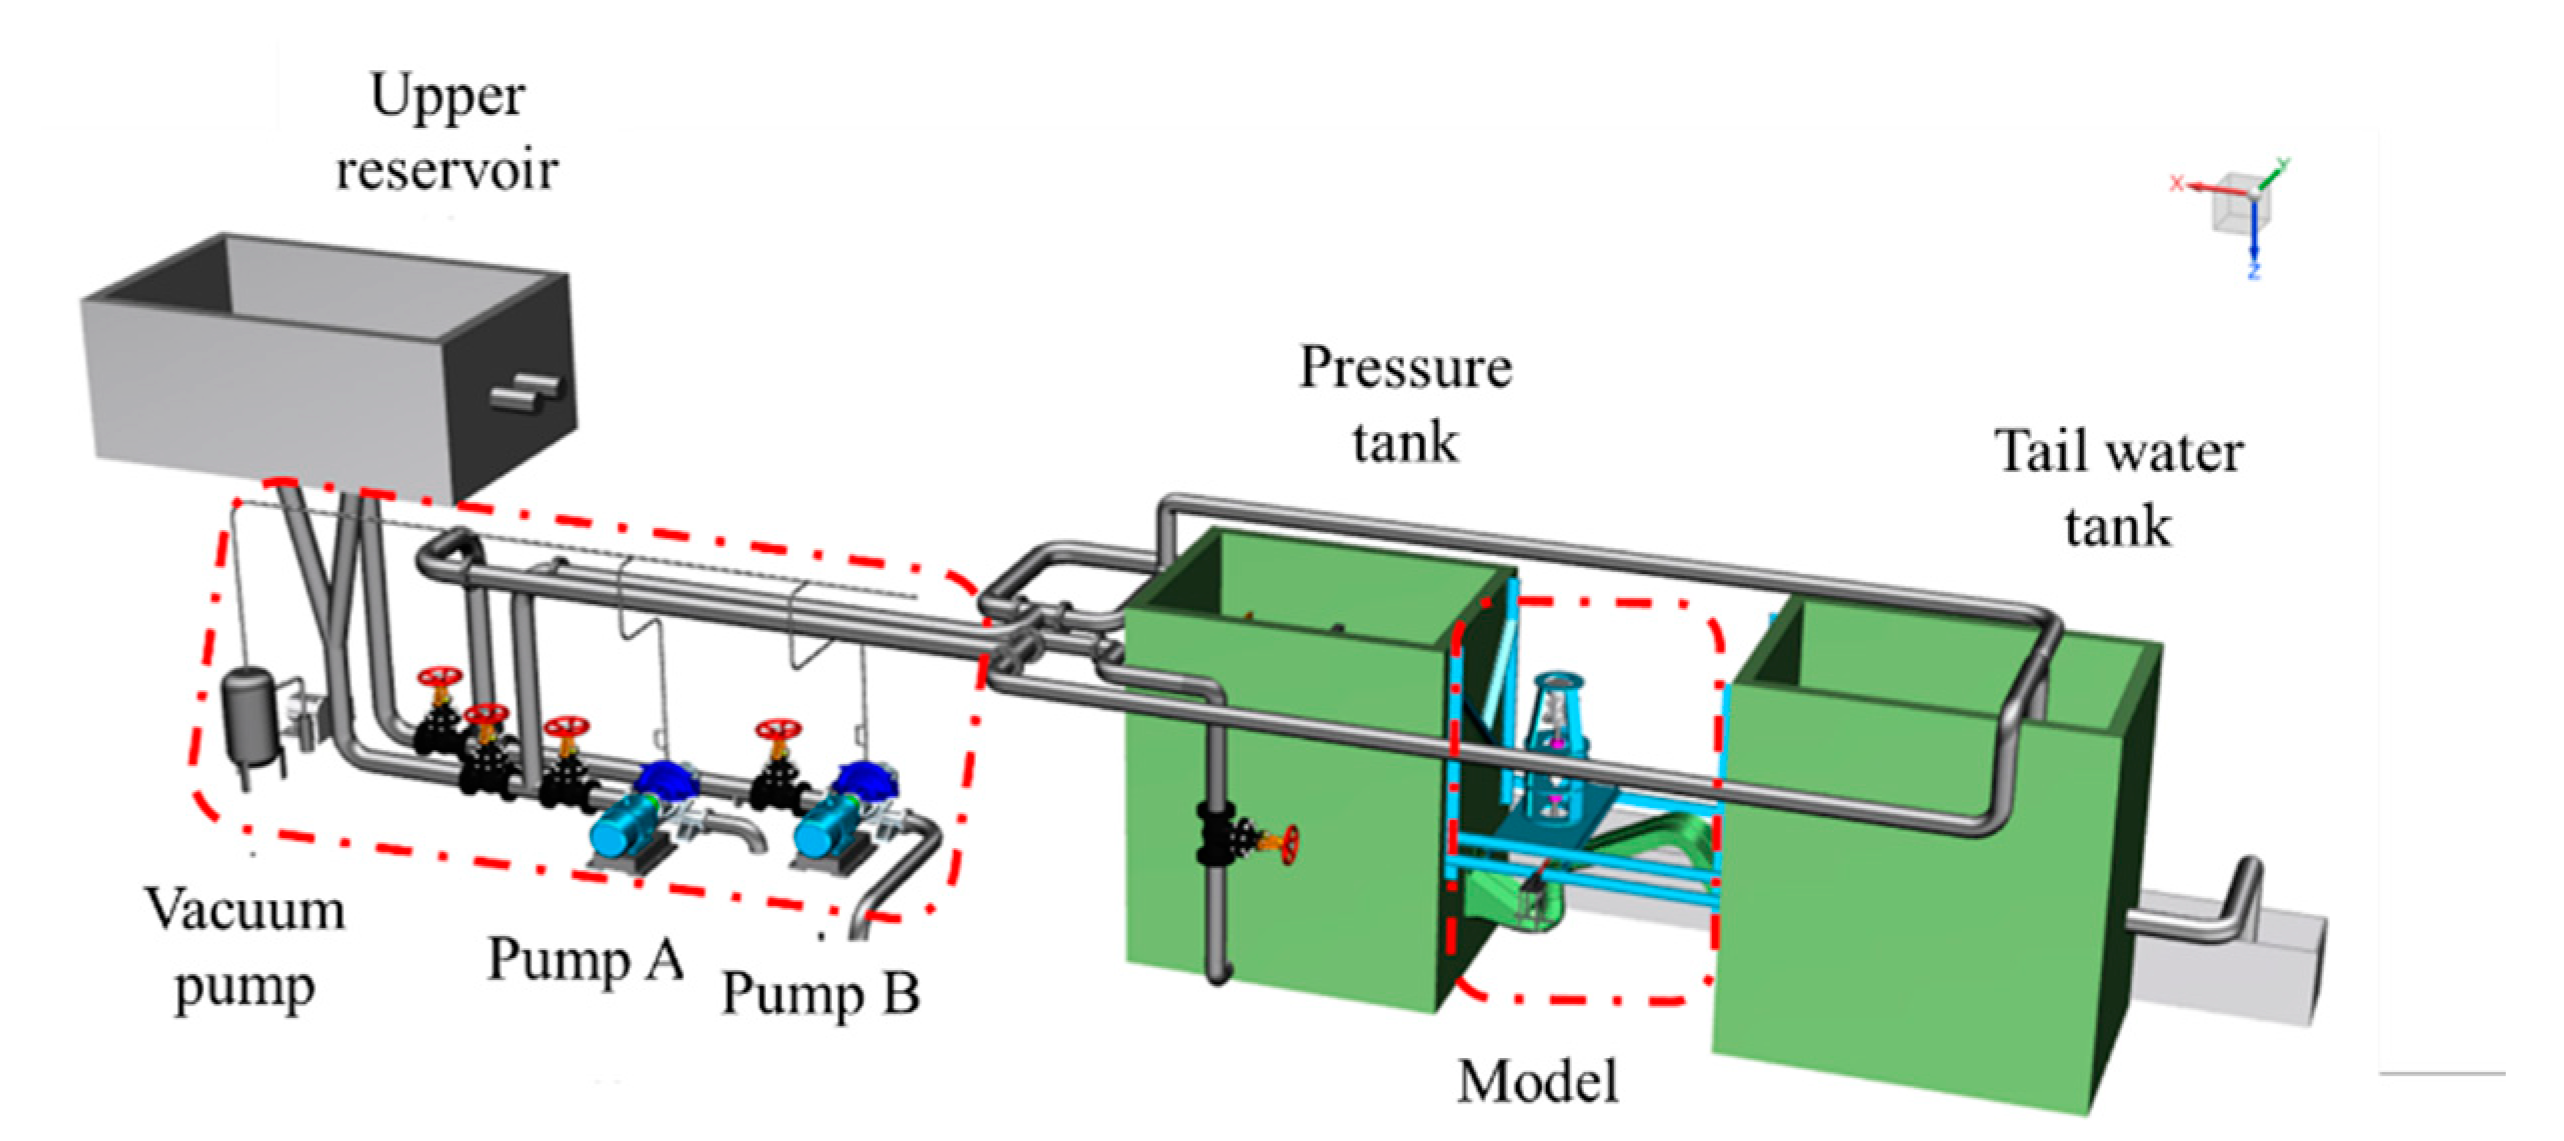
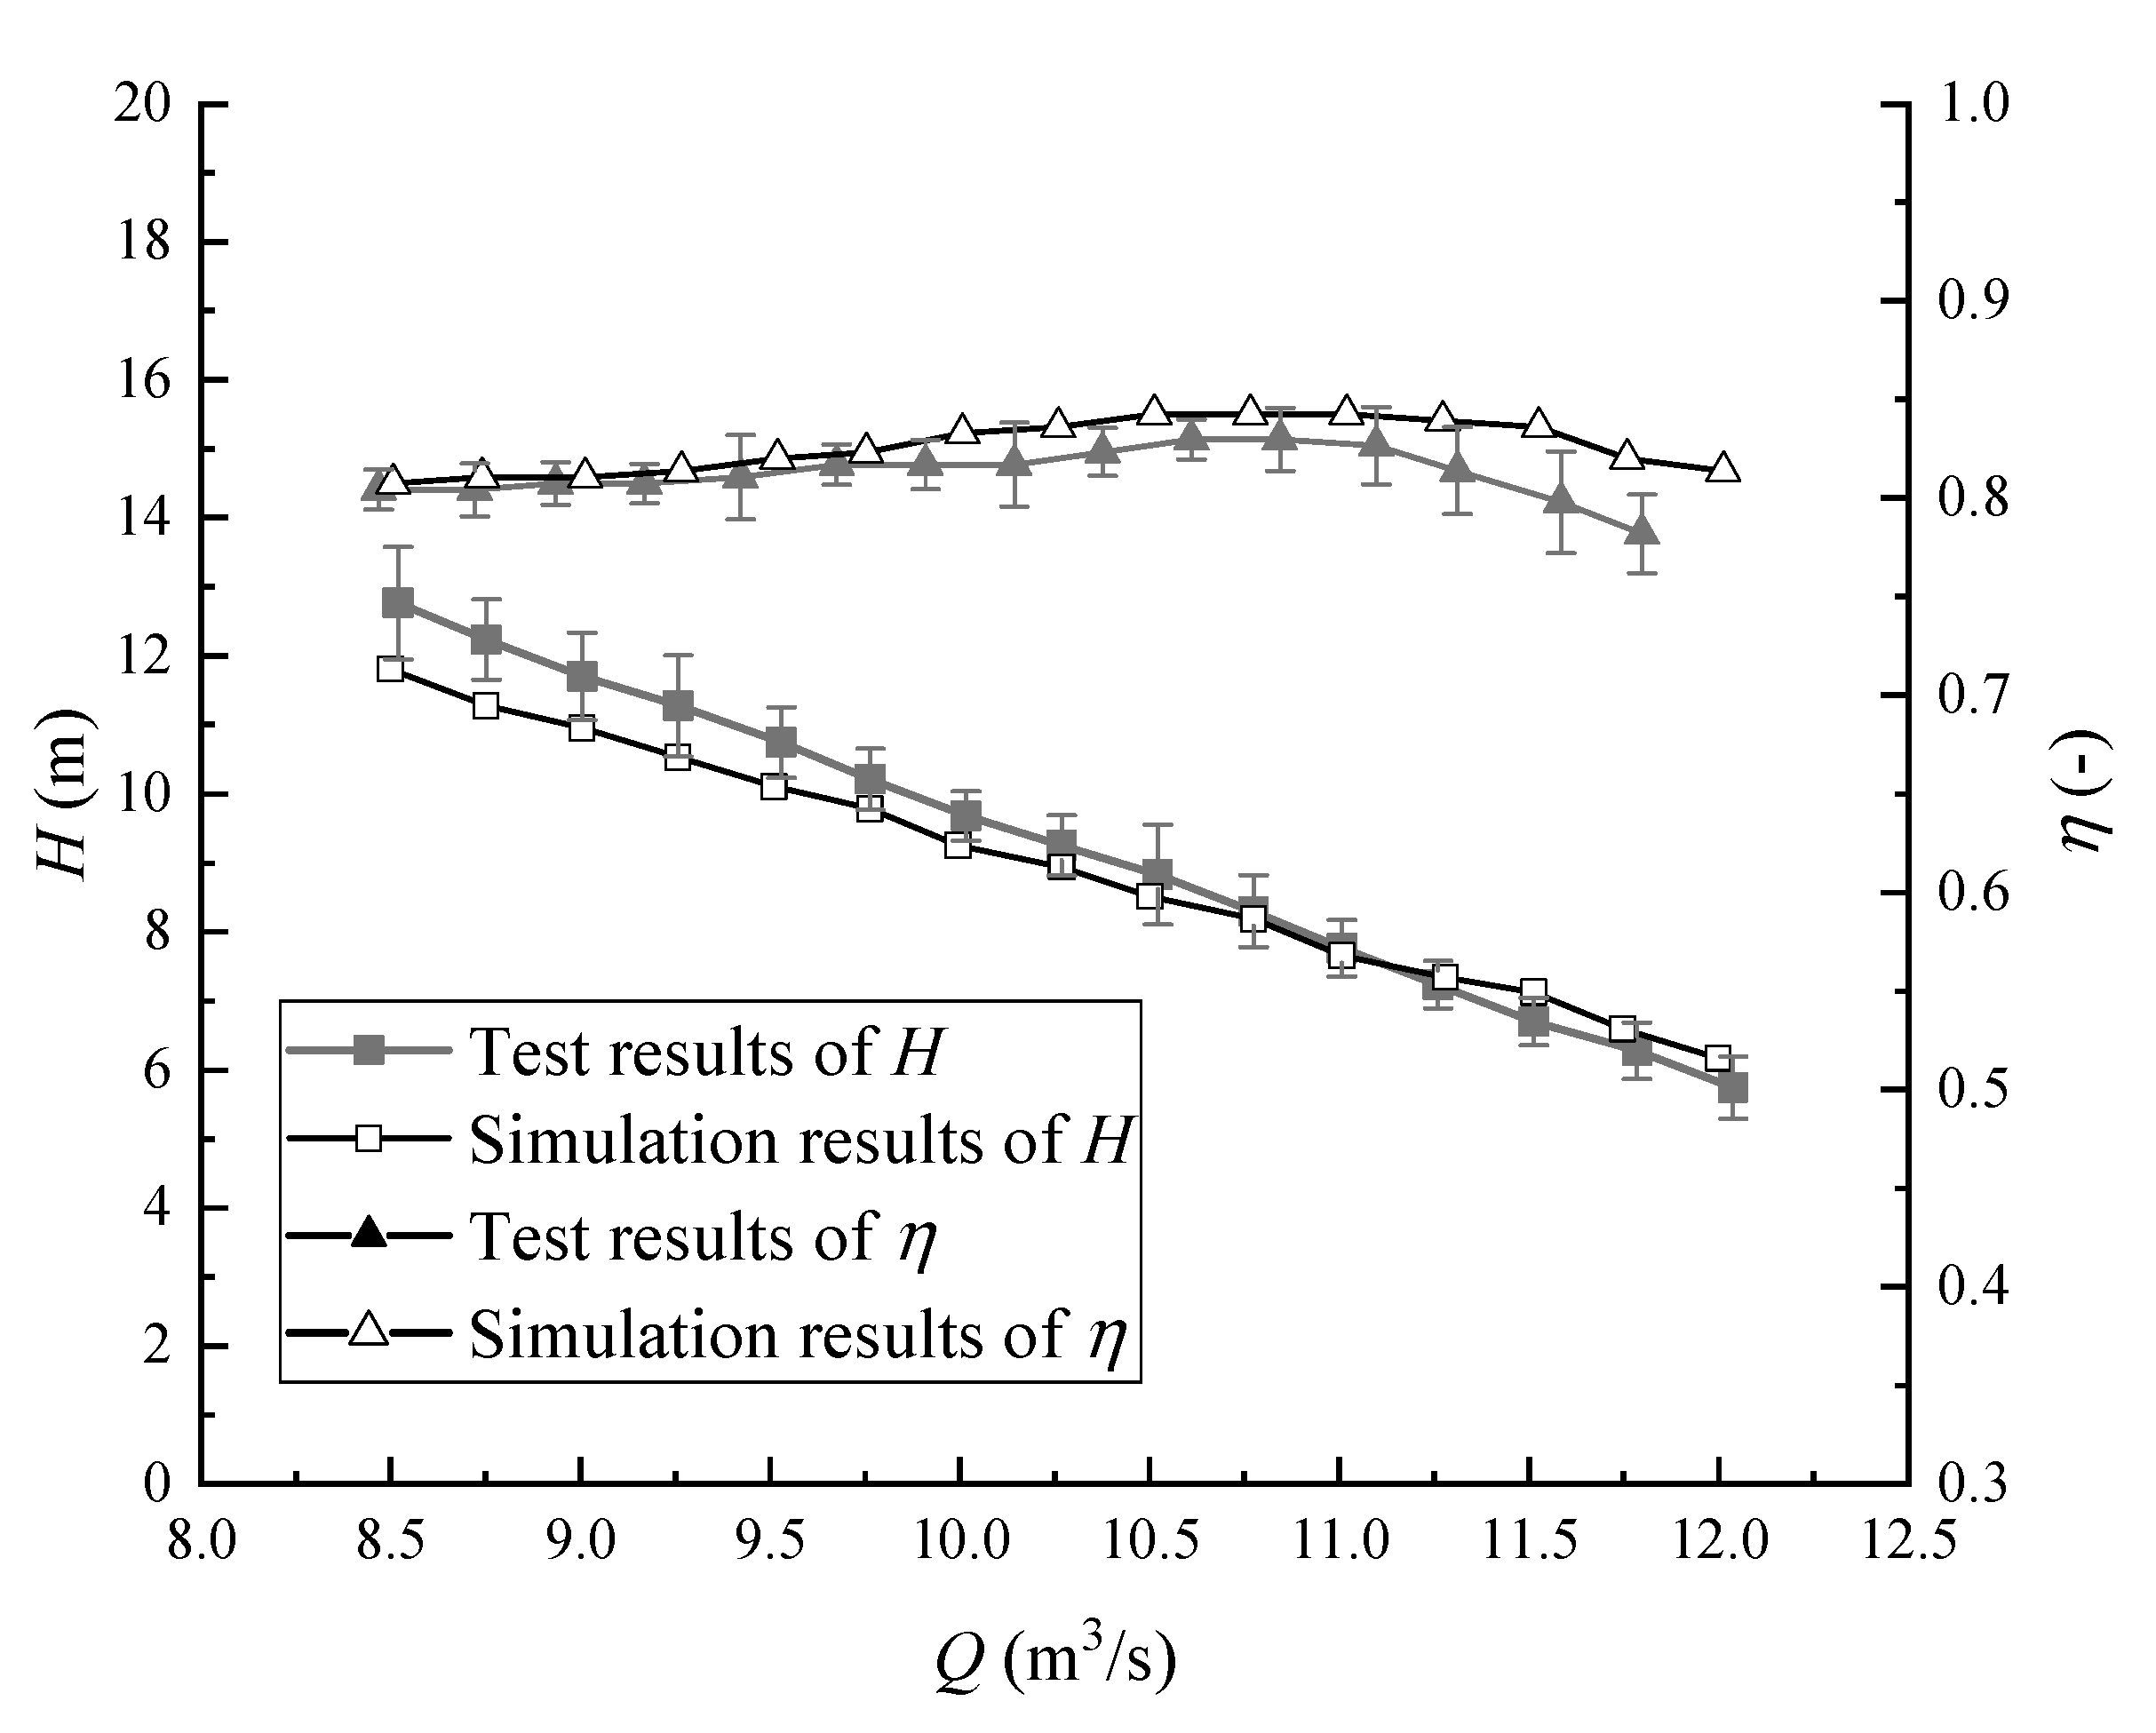
2.2. External Characteristics of the Francis Pump

The pump experiments were carried out on the Multi-functional Hydraulic Machinery test bench of Hohai University [35]. The accuracy and operation stability of the test parameters meet the relevant requirements of the International Electro technical Commission (IEC 60193). The system error of the measuring instrument was ±0.374%, the random error of the measuring parameters was ±0.315% and the maximum relative error of the efficiency of the remeasuring device was 0.190%. The test rig consists of three parts: circulating hydraulic system, unit model section and computer measurement and control system. The diagram of the test bench is detailed in Figure 2. The clearance between the blade and the runner chamber was 1.2 mm, in both the numerical model and the field experiment. The diameter of the model runner was 300 mm. According to the similarity law, the corresponding model speed can be calculated from the prototype runner speed. During the experiment, by constantly changing the flow rate (Q, m3/s), the head H (m) changed and the corresponding efficiency of the test model ( η ) was obtained in both pump and turbine generator.
A comparative numerical simulation study on the maximum efficiency point under the pump condition was conducted to obtain the characteristics of the Francis pumping station. The design rotational speed was 250 r/min for the pump condition. Figure 3 shows the characteristics of the pump condition. It can be easily seen that the distribution trends of the test and simulation results were consistent. Moreover, the head, H had a linear descending trend with the flow rate, Q and the mathematical equation can be obtained as H = −2Q + 29.5 while the efficiency slightly increased and reached a peak of 85% at Q = 11 m3/s and dropped subsequently. The prediction errors of the head and the efficiency were less than 5%, thus validating the accuracy of the method [36].

3. Numerical Simulation Method

3.1. The Governing Equations

Two modules in ANSYS, including Transient structural and CFX, were selected to proceed the bidirectional fluid–structure coupling analysis of the pump. The static pressure and deformation information was transferred to each other during the simulation. The transient dynamic analysis of solid structure was carried out, and the unsteady calculation of flow field was conducted with the steady calculation results as the initial field. Since the mesh deforms in the fluid calculation, the dynamic mesh technology was used to solve the transient simulation. The solution time and the time step of the structure field and fluid field analysis were consistent, and the time step was set as 0.001 s. Because of the periodicity of water flow impact on the runner, the distribution of stress and deformation was observed at different times, and it was found that the distribution was consistent. Hence, the final simulation time was selected as 0.8 s (two cycles). The convergence target of the flow field residual was 10−4, and the coupling convergence standard was 10−3. The governing equations for numerical simulation of the internal fluids in reverse power generation condition can be found in Equations (1) and (2),
x j ( u j ) = 0
( ρ · u j ) t + ( ρ · u j · u i ) x j = P x j + τ i j x i + s i j
where, u i and u j are velocity components in different directions separately (m/s), t is the time (s), p is the pressure (N/m2), ρ is the density (kg/m3), τ i j is the shear stress (N/m2) and sij is the additional source term (N/m2). The elastic structural equation of the runner blades [37], then becomes Equation (3),
M u ¨ + C u ˙ + K u = F
where, M is the mass matrix (kg), C is the damping matrix (N·s/m), K is the stiffness (N/m), u is the displacement vector of nodes (m), u ˙ is the speed vector (m/s), u ¨ is the acceleration vector (m/s2) and F is the force on nodes (N).
The equivalent stress can be obtained based on the von-Mises theory as
σ ε = 1 2 [ ( σ 1 σ 2 ) 2 + ( σ 1 σ 3 ) 2 + ( σ 3 σ 2 ) 2 ]
where, σ ε is the equivalent stress of each node (Pa), σ 1 , σ 2 and σ 3 are the first, second and third principal stresses, respectively (Pa).

3.2. Settings of Structural Field

The three-dimensional model of the runner was built by using ANSYS preprocessing module, DesignModeler (ANSYS, Pittsburgh, PA, USA). The mesh of the runner was controlled by the hybrid grids and the mesh number was 52,307. Since the surface of the whole runner blades was the interface of the fluid–solid coupling, the mesh of the blades was refined by Automatic, in order to ensure the stability of pressure and deformation transmission. The final grid diagram of the runner blades is shown in Figure 4. Sufficient constraints were needed during the finite element static simulation, in order to prevent the rigid displacement. Hence, the structural field constraints were set, after verifying the independence of the solid field mesh. Fixed constraints were added at the bottom of the hub—and cylindrical constraints, at the spindle—to create a coupling surface for the entire runner blades. In addition to the hydraulic force, the structure was also subject to the gravity of the runner itself and the centrifugal force, therefore the gravity constraints were set in this study. The centrifugal force was applied by the structural rotation. The rotational speed was chosen as 150 r/min at the maximum efficiency for the reverse generation condition after the numerical simulations with the speed of 150 r/min, 200 r/min and 250 r/min, etc. The material of the runner was stainless steel and the mechanical properties are detailed in Table 1.

3.3. Settings of Flow Field

The time average N–S equation was adopted in the numerical simulation and the K-ε equation was the turbulence model for the flow. The second-order upwind scheme was used to solve the pressure velocity coupling problem by SIMPLEC algorithm. The interface between the runner and guide vane was set as a “transient rotor–stator model” to simulate the flow field changes during the relative transient rotation of the runner, with the front and rear fixed guide vanes. The runner blade was set as Ansys Multifield, which transmits pressure and receives the deformation to the coupling surface of the solid part. Under the pump condition, the inlet boundary of the computational domain was the mass flow rate and flow direction. The outlet boundary was the standard atmospheric pressure; the reference pressure was set to 0. The boundary conditions of the pump under the reverse power generation condition were the inlet and outlet pressure.

4. Analysis of the Numerical Results

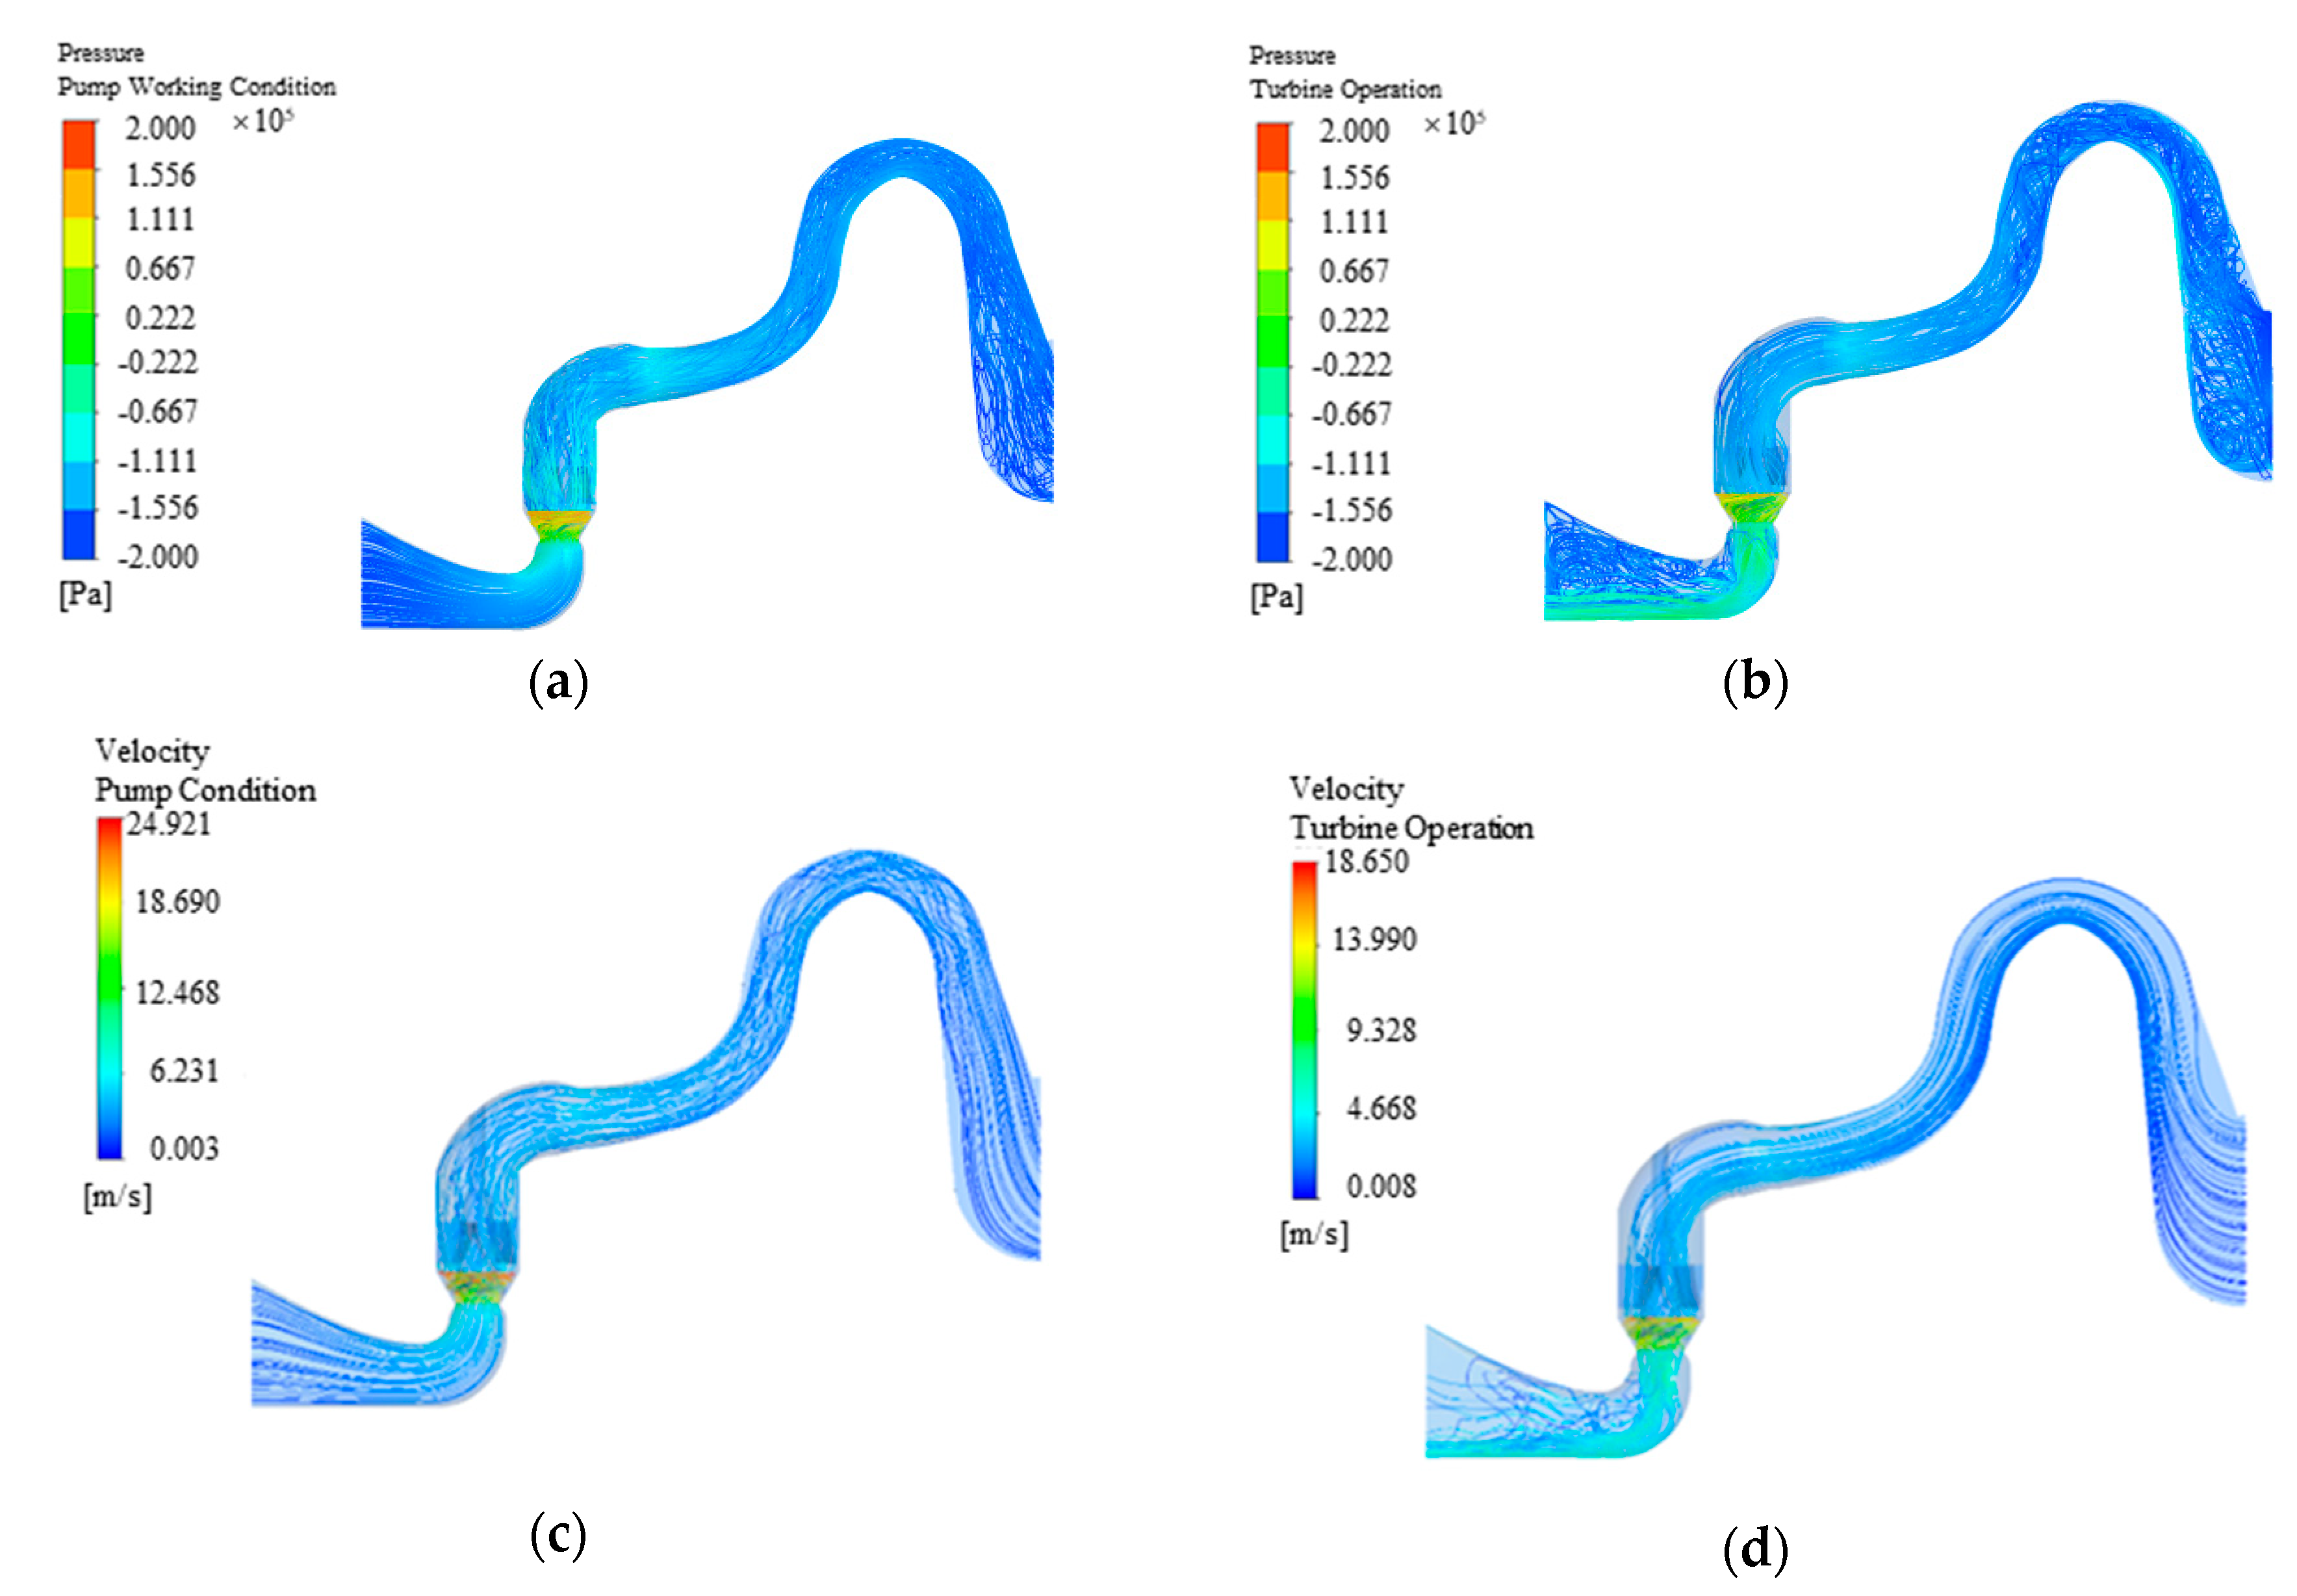
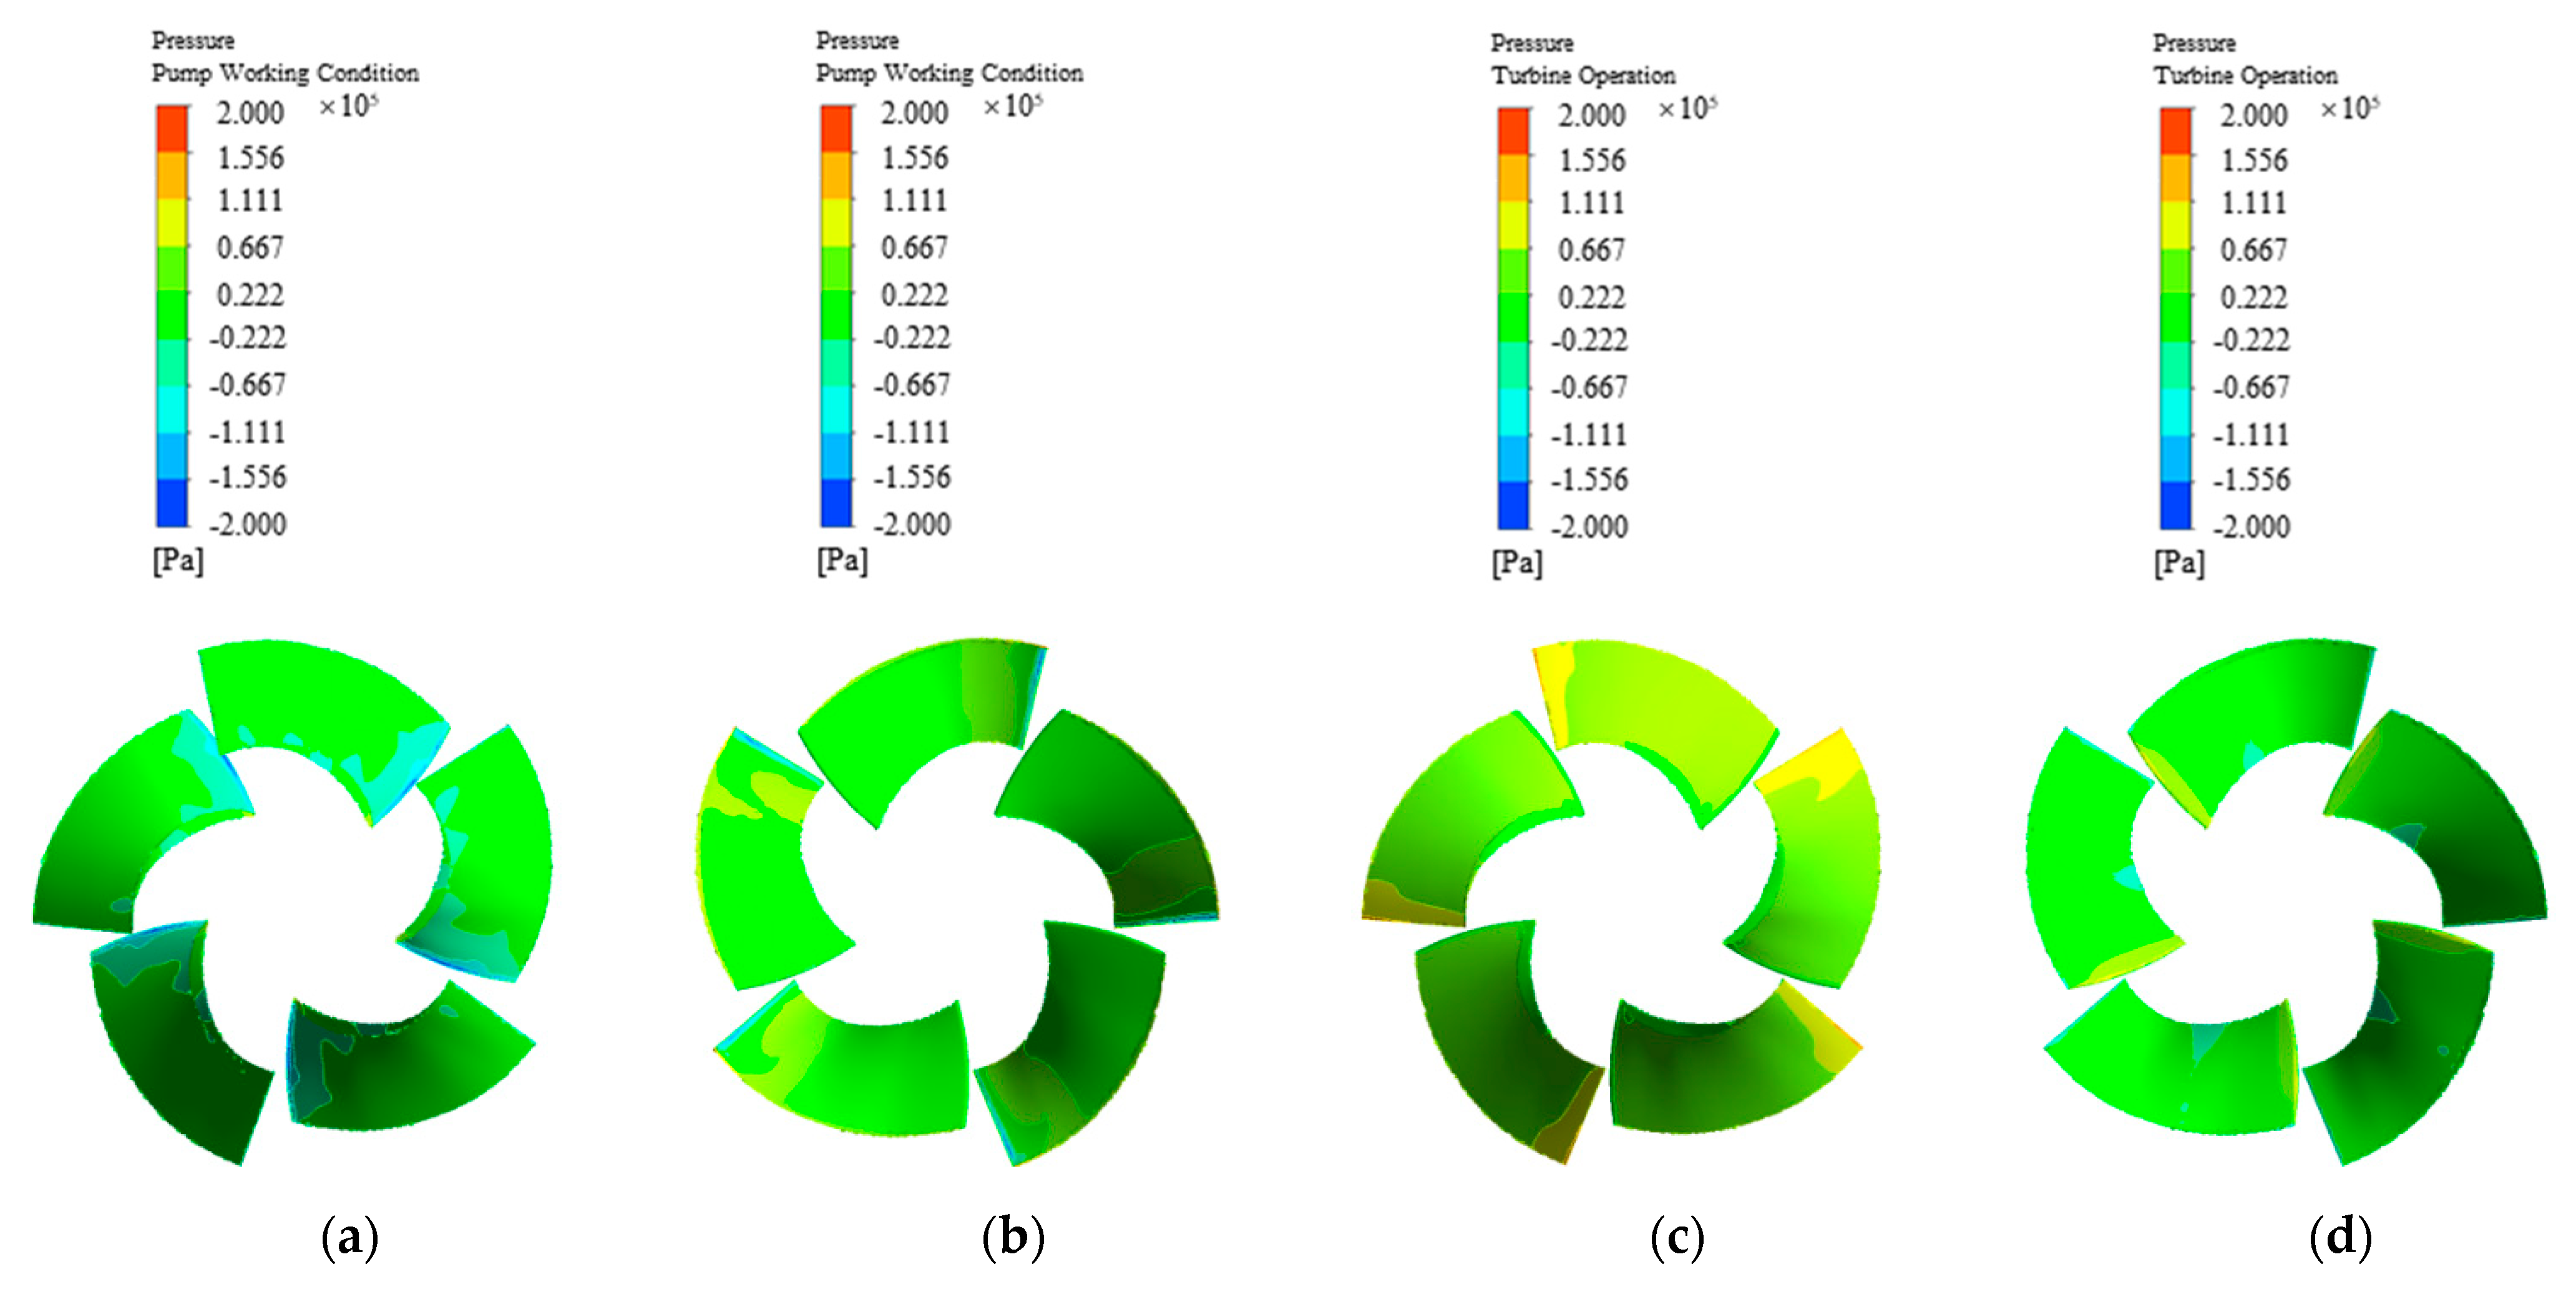
4.1. Comparison of the Streamline Graph and Blade Pressure Cloud Chart

The streamline graphs of pressure and velocity under pump and reverse condition are shown in Figure 5. As observed in the pump condition, the flow entered from the inlet of the channel and was sucked into the runner. As a result, the flow was accelerated, as well as more uniform after passing through the guide vane. Because of the reasonable arrangement of the runner, no obvious vortex and flow randomness can be observed in the whole passage. In comparison to the pump condition, the streamline of the reverse operation was better and its pressure distribution, before the runner, was more uniform. However, the flow leaving the guide vane was seriously affected by the rotation of the runner, resulting in an increase of the velocity. Because of the small gap at the edge of the runner, the flow was forced to change seriously, resulting in a higher velocity at the outer part of the runner. The water leaving the runner displayed a certain disorder. The reasons were the boundary conditions, rotor–stator interaction between the guide vane and the runner and the geometric structure of the intake passage of the pump. From the obtained results, the speed of the whole water flow was faster in reverse than in the pump condition, despite the speed distribution law of the water flow passing through the runner was the same. However, because this passage was designed as a water pump, when the water pump reverses to generate electricity, the water flow will vortex when it comes out of the passage, resulting in a certain amount of energy loss [38].
Figure 6 presents the schematic diagram of the suction and pressure surfaces of the runner blades under the two operating conditions. As seen, under the pump condition, the pressure on the pressure side increased from the leading edge to the trailing edge; the rule of the pressure on the suction surface was the opposite. However, the pressure difference between the suction and pressure surface of the blade was prolonged more for reverse power condition than for pump condition, as a result of the strong rotor–stator interaction of the flow leaving the guide vane, thus increasing the instability of the blade rotation. A comparison of the two modes revealed that the tips suffered a pressure drop in pump condition and a pressure rise in the generation condition.

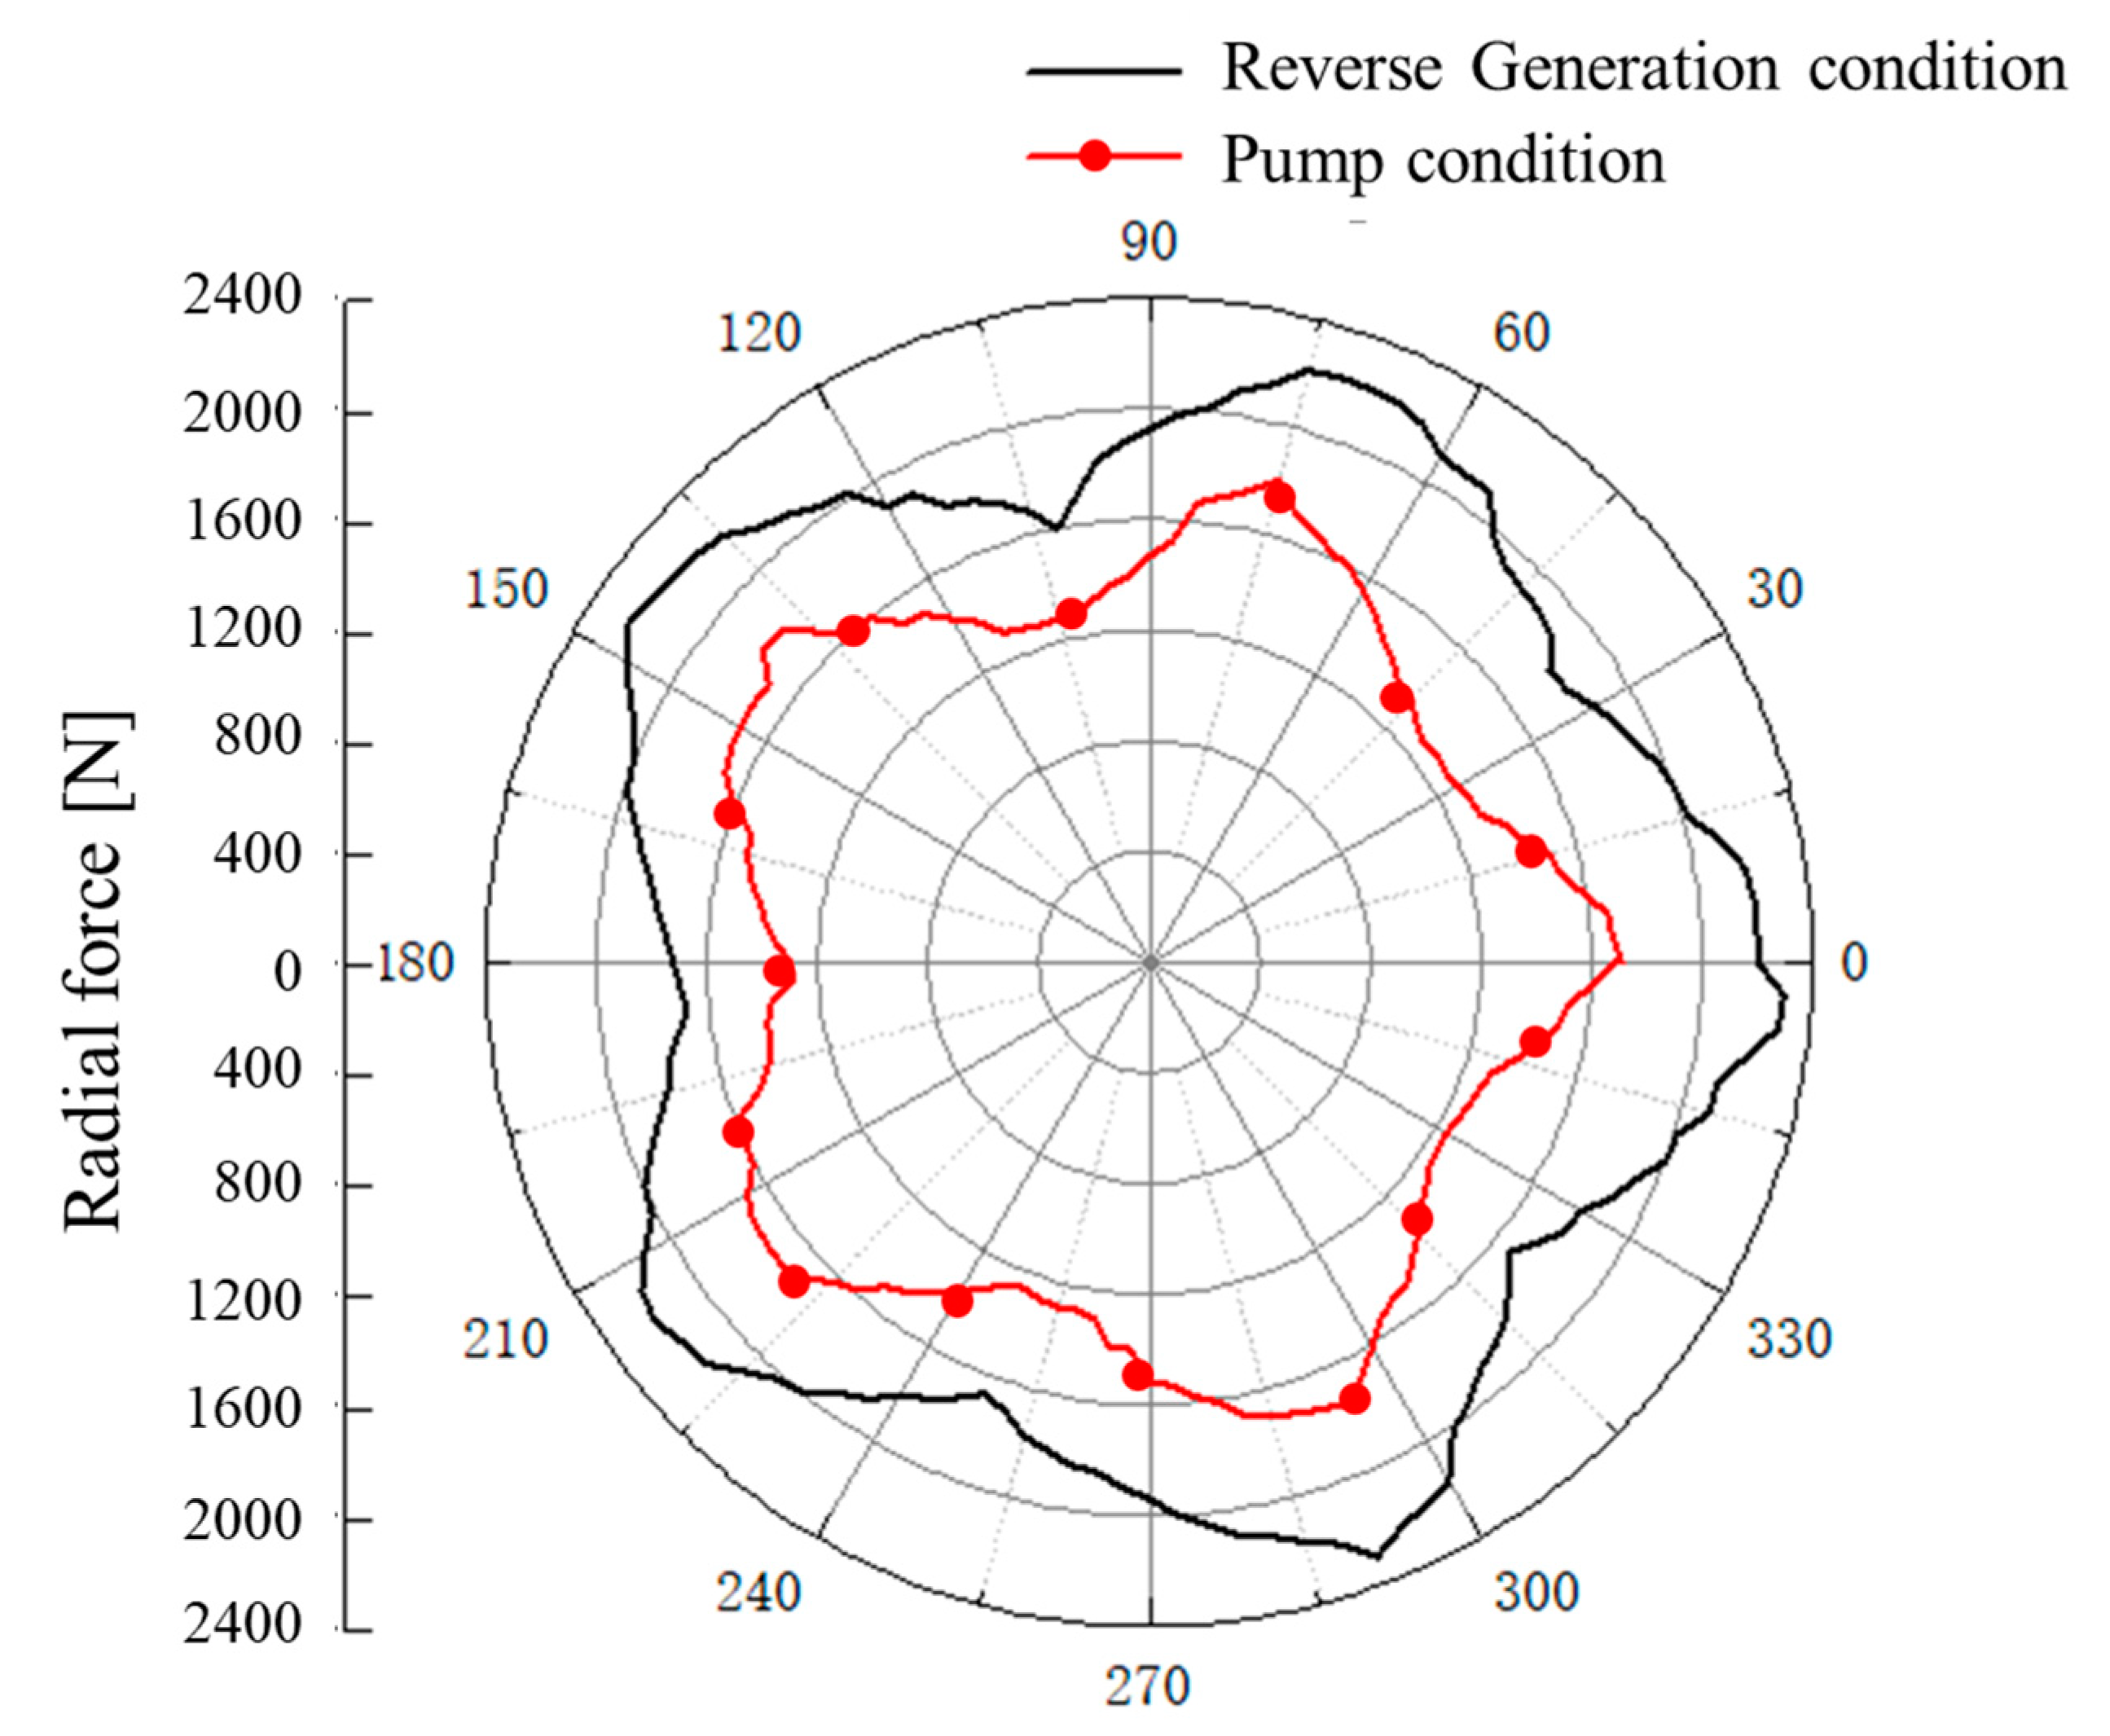
4.2. Force Analysis of the Blades

In the power generation condition, the runner was mainly subjected to both the axial and radial hydraulic thrust. The first was caused by the difference of water pressure between the high- and low-pressure side. Whereas the second was caused by the influence of the axial disturbance of the inlet flow and the dynamic and static interference between the guide vane and runner, thus, resulting in an asymmetrical flow, prior to the runner. In order to further study the force on the runner under the reverse power generation condition, the radial and axial water thrust on the runner were analyzed numerically and considering the serious fluctuate of the radial force, 180 monitoring points were preset around the runner. The radial force was expressed by the root mean square
F = 1 180 i = 1 180 F i 2
where, F i is the instantaneous force with the unit of N.
The forces according to the type of force and direction under the reverse power generation condition and pump condition were listed in Table 2. It can be easily seen that the forces in the X direction and Y direction were greater in the reverse condition than those in the pump condition. An implication of this was the nonuniformity of the water leaving the runner in the reverse mode, causing the pressure difference between the high and low pressure to be smaller than that observed in the pump condition. The force diagram in polar coordinates can be found in Figure 7 for two conditions and the black line represents the radial force under reverse power generation condition and red line for the pump condition separately. It can be seen that with the rotation of the runner, there were 5 peaks of the radial resultant force (at 80, 140, 220, 290, 355 degrees), corresponding to the number of runner blades. When the pump operated in reverse power generation condition, the flow had a greater effect on the impeller; the radial resultant force of the blades in all directions together with the amplitude (from wave crest to trough) was greater than that of the pump condition, which was about 39.1% larger. A larger force meant higher instability of the water flow and the increase of the radial swing of the pump unit in the reverse generation condition.

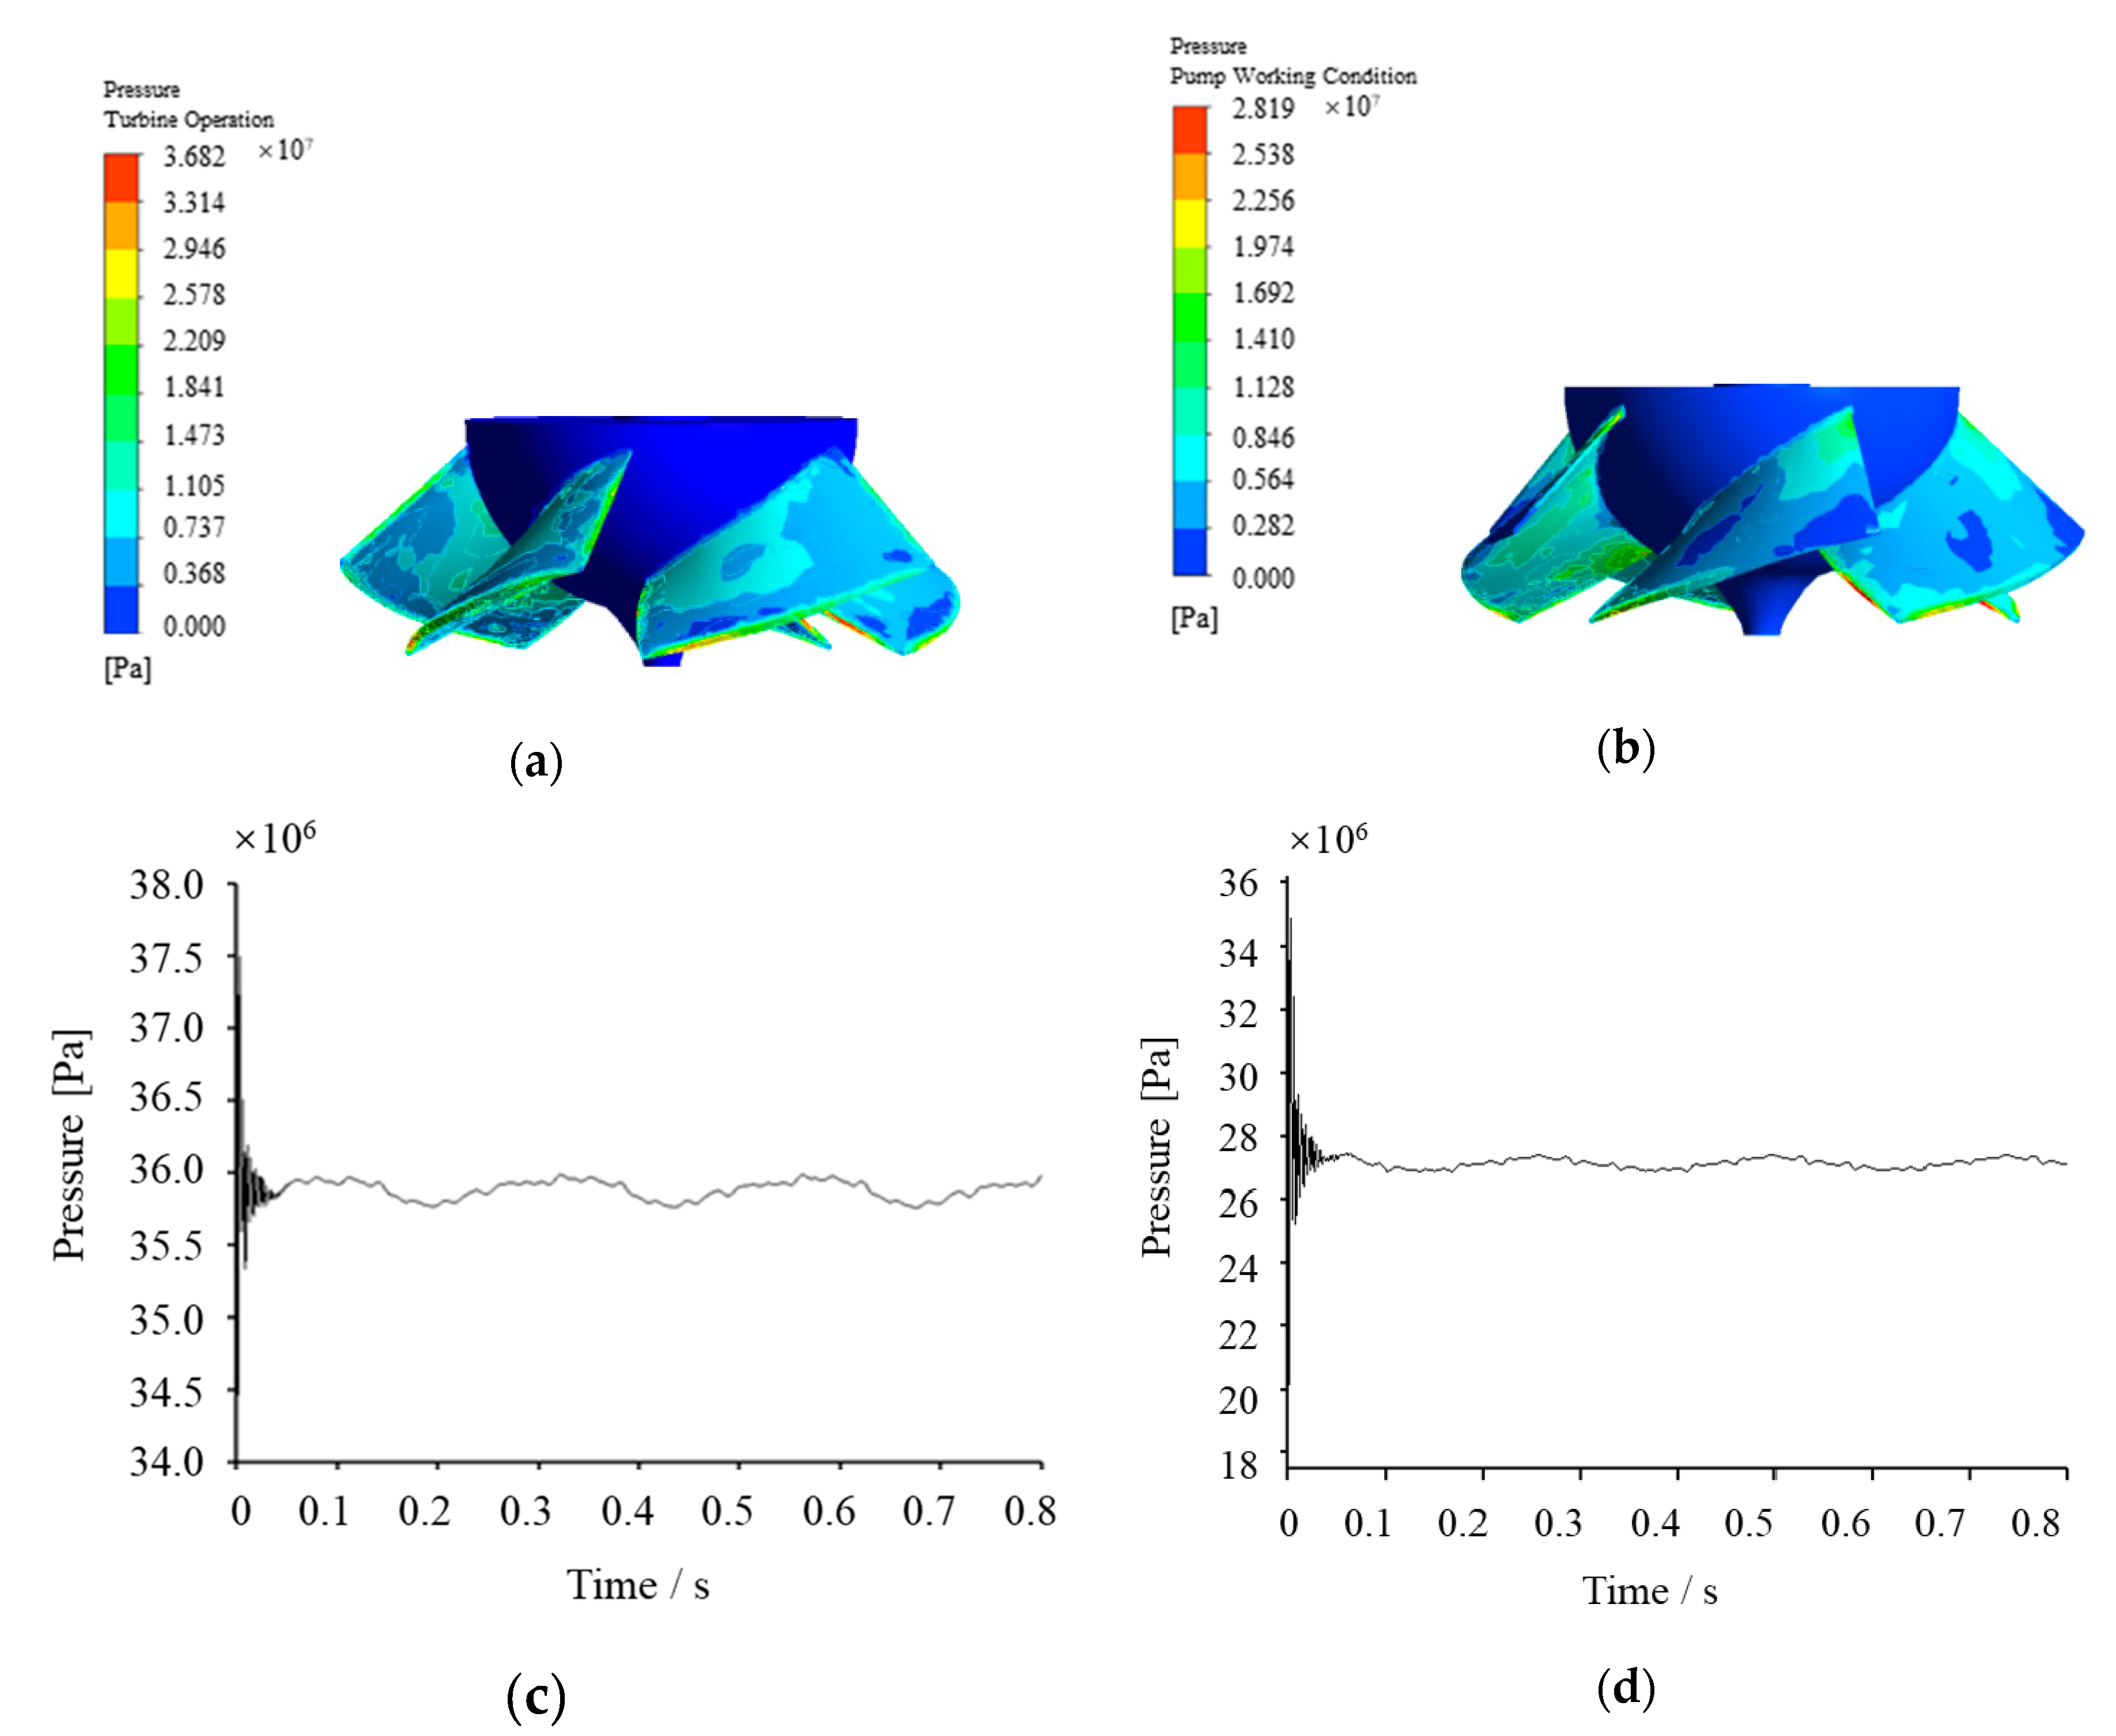
4.3. Stress Analysis of the Runner

Based on the bidirectional fluid structure coupling analysis, the stress and deformation distribution of the blades are studied in this section. Due to the periodic fluctuation of water flow with time, the water unsteadiness was the main factor of the periodic vibration to the components of the runner, leading to changes first in the structural field characteristics, and as a consequence, to the flow pattern. In all cases, the distribution rules of the pressure on the blade surface and the solid equivalent stress at different times were similar, albeit with numerical differences. Therefore, the equivalent stress distribution and deformation results of the blades with fluid structure coupling at 0.8 s were selected for analysis.
In comparison to the pump condition, the runner was impacted by the periodic water flow for a long time and despite the pressure value was within the limit range of the material strength, issues related to fatigue were important, and thus, it was necessary to analyze the dynamic stress acting on the runner blade. The pressure distribution on the blade surface was loaded into the structure for finite element calculation, to obtain the corresponding stress distribution of the blade, under hydraulic excitation. The blade stress diagram under pump condition and reverse power generation condition is shown in Figure 8.
According to Figure 8a, the stress concentration occurred at the root of the blade pressure and suction surfaces. The low-pressure area appeared at the leading edge of the suction surface, and the high-pressure area appeared at the leading edge of the pressure surface. Both pressures decreased gradually from the leading edge to the trailing edge. When the runner retransmitted the electricity, the leading edge of the blade was greatly impacted by the water flow, resulting in the obvious variation of pressure gradient on the suction surface and pressure surface at the leading edge of the blade. The maximum stress was about 35.7 MPa, appeared at the leading edge the blade which exhibited a dangerous section.
In order to further study the distribution law of the blade stress, the variation law of the maximum stress was analyzed across the blade sections. As shown in Figure 8c, the stress amplitude was larger in the first 0.5 s of the simulation; the difference of amplitude was over 1.0 MPa. Subsequently, the change of stress amplitude tended to be gentle. The stress values fluctuated around 35.7 MPa with the periodic impact of water flow on the runner.
As shown in Figure 8b, the stress of the blade under pump condition mainly concentrated on the trailing edge where connecting the blade and hub and the leading edge of the blade. The maximum stress was 27.8 MPa which had slight fluctuations due to the rotation of the runner. Compared with Figure 8c,d, the flow changed sharply in the inlet and outlet passages under the reverse power generation condition, which had a greater impact on the runner blades; the maximum stress value of the runner was larger than that of the pump condition. The maximum stress on the runner was 1.3 times as much, compared with the pump condition.

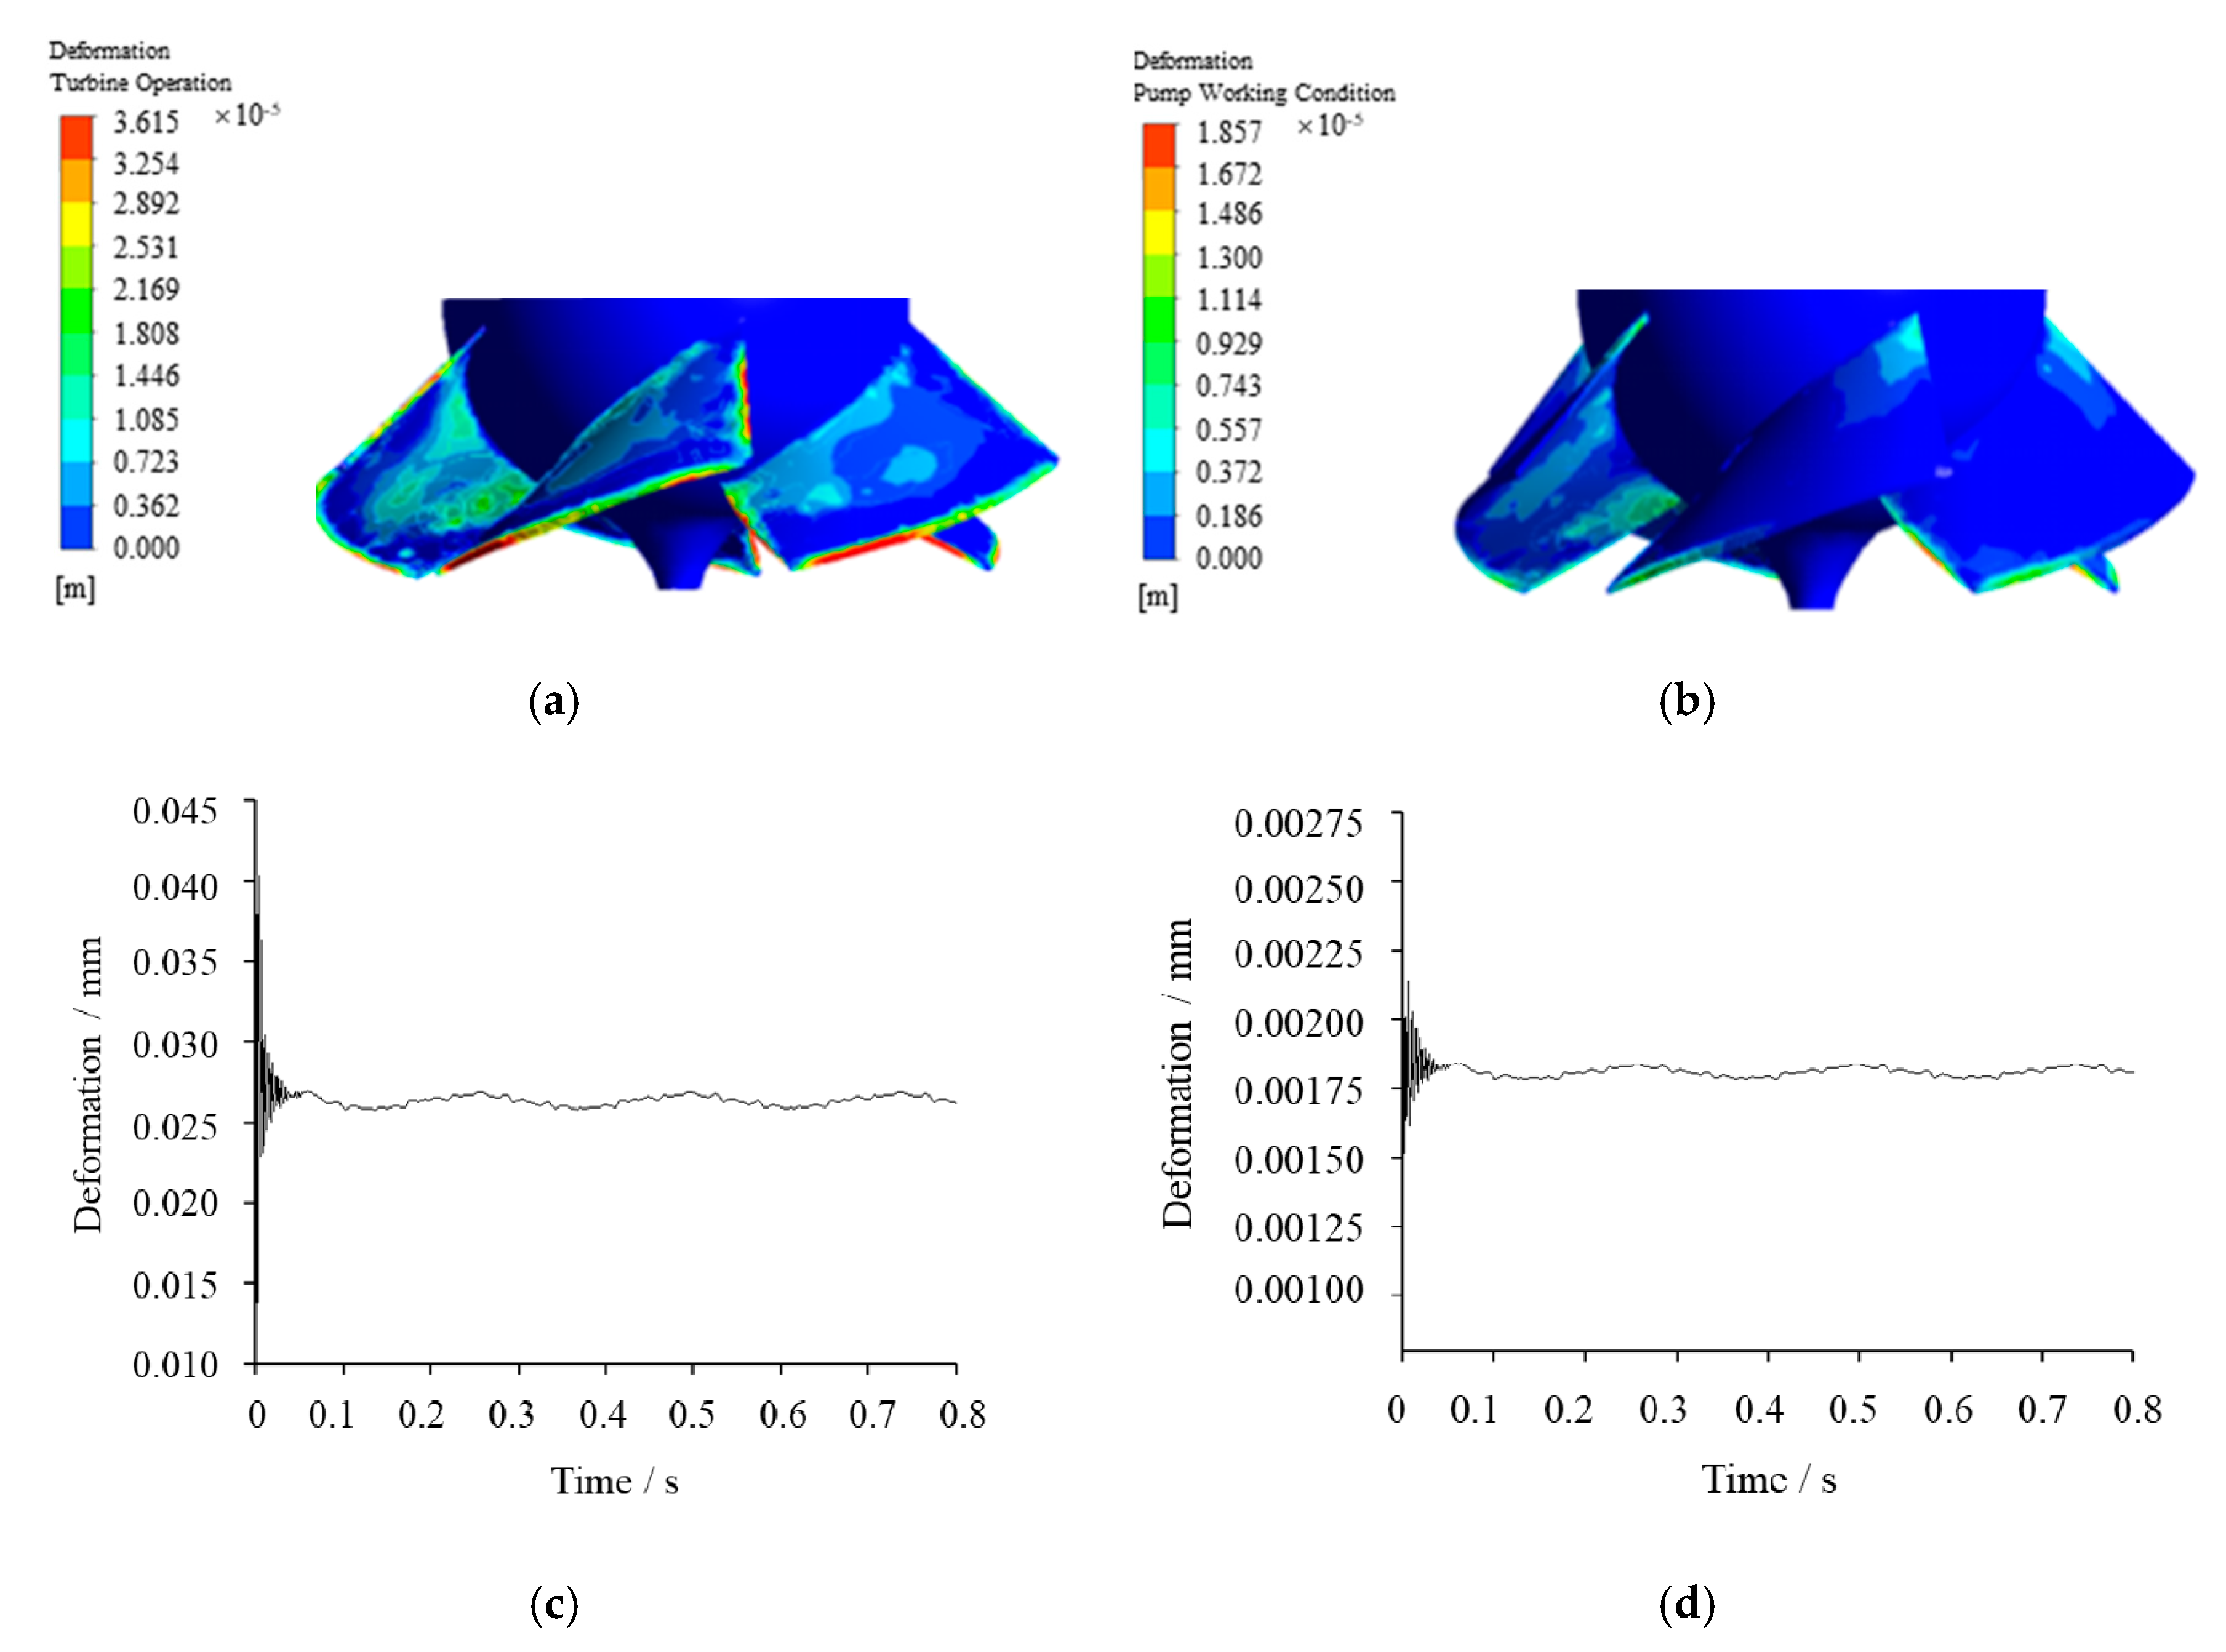
4.4. Deformation Analysis of the Runner

The total deformation of the runner under reverse power generation and pump conditions is shown in Figure 9. It can be seen from Figure 9 that the clearance between the blade tip and the wall was small, and hence, the change of the flow pattern in the area was more intense, resulting in the large pressure on the blade tip. Taken together, the total deformation of the blade decreased stepwise from the blade tip to the hub center. The maximum deformation was 0.035 mm. While, the structure and flow impact near the hub were relatively stable, the flow velocity was smaller than at the edge. The deformation was within the designed limits. To obtain the detailed information, the total deformation distribution of the blade at each time step was studied by using the bidirectional fluid–solid coupling simulation, as shown in Figure 9c,d.
Because of the strong interaction between the flow field and structure field, the deformation amplitude of the runner was extremely large in the first 0.5 s of the simulation. Later, the maximum deformation fluctuated around 0.027 mm in the reverse and 0.018 mm in the pump condition, respectively.
As expected, the maximum deformation of runner under pump condition mainly concentrated on the leading edge of the blade.

4.5. Estimation of Fatigue Life

4.5.1. Theoretical Calculation of Fatigue Life

The runner was the key component of reverse power generation and it was important to carry out the strength analysis according to the basic mechanical properties of runner materials. Afterwards, the safety factor and fatigue life of the runner were calculated to check the condition of the runner under two working conditions. The structural material of the pump runner used was stainless steel and the ultimate fatigue strength was σ 1 = 210 MPa, where the subscript −1 represents the stress ratio. In reverse power generation, the runner rotated under the pulsating cyclic load and it was easy to cause fatigue failure of runner components, which belonged to the high cycle fatigue.
Equation (6) was employed for strength check,
n σ = σ 1 K σ ε σ β σ a + φ σ σ m n
where, K σ = 1.3 is the effective stress concentration factor. ε σ = 0.9 is the size factor. β = 0.85 is the surface quality factor. φ σ = 0.1 is the sensitive factor of material to the stress cycle asymmetry. And n = 1.5 is the allowable safety factor.
According to the results of stress analysis, the stress at the junction of the runner and hub can be defined with the maximum stress, σ max and the minimum stress, σ min , as
Stress   radio :   R = σ min σ max
Average   stress :   σ m = σ max + σ min 2
Stress   amplitude :   σ a = σ max σ min 2
In pump condition, the maximum stress is σ max = 27.8 MPa and the minimum stress is σ min = 0 MPa, hence, the theoretical safety factor for the runner is calculated as n σ = 8.396. In the reverse condition, σ max = 35.7 MPa, σ min = 0 MPa and   n σ = 6.538 . For both conditions, the calculated theoretical safety factors n σ were larger than the allowable safety factor n, within the safety factor range of the runner.

4.5.2. Numerical Calculation of Fatigue Life

Fatigue tools was employed to calculate the fatigue life of the runner under two working conditions with Workbench Software. The median S-N curve with the reliability of 95% was adopted, as shown in Equation (10).
log N = 13.4984 5.149 log S
Pulsating cyclic load was considered, and the load ratio varied with time from 0 to 1 according to a sinusoidal curve. Goodman was chosen as the model to estimate the fatigue life of blades. The cloud charts of the fatigue life and safety factor of the runner are illustrated in Figure 10.
The overall load cycles of the runner reached 1 × 10 7 under both the pump and reverse working conditions which met the requirements of the fatigue life. Due to the non-design flow characteristics, the value of the reverse generation condition was 82.0% smaller than the pump condition. The minimum safety factors of the runner appearing at the root were 8.238 in pump condition, and 6.343 in reverse condition, corresponding to the theoretical calculation of 8.396 and 6.538, respectively. Hence, the numerical calculation was only 3.0% different from the theoretical calculation. In both cases, the runner material was within the safe limit.

5. Conclusions

The aim of the investigation was to analyze and compare the mechanical behavior of a Francis turbine under pump and reverse generation conditions. Numerical simulations of the turbine and flow were conducted using a bidirectional solid–fluid coupling CFD method, compared with the site experiments. According to the obtained results, the design restriction of the pump inlet and outlet passage produced severe static and dynamic interference between the runner and guide vane. The streamline was worse in the reverse power condition than in the pump condition. Vortices were observed around this area, contributing to a loss of energy. The radial resultant force in reverse mode was 39.1% larger than in the pump condition, and the asymmetry of the flow field was more noticeable as well.
During the reverse operation, the effect of the turbine on the runner was enhanced due to the increase nonuniformity of water flow. The stress mainly concentrated on the leading edge of the blades and gradually diffused to the edge of the blade. The maximum stress appeared at the junction of the blade and the hub and it fluctuated around 35.7 MPa affected by the periodic impact of water flow. The blade deformation decreased stepwise from tip to hub; the maximum deformation was about 0.027 mm.
The stress and deformation of the runner in reverse power generation were larger than in the pump operation. The theoretical safety factor was 6.538 in pump condition, and 6.34 in reverse condition. The number of load cycles for the overall fatigue life of the runner reached 1 × 10 7 . Compared with the pump condition, the number of load cycles in the reverse generation condition was 82.0% smaller and the safety factor was 23.0% smaller, within the safety range of the material. In order to avoid the damage of the runner caused by the stress concentration and ensure the safety and stability of water pump in reverse power generation, it is necessary to increase either the thickness of the blade at the hub and edge or the connection between the arc transition blade and the hub.

Author Contributions

Conceptualization, X.C. and C.L.; methodology, Y.Z. (Ying Zhou); software, C.L.; validation, Y.Z. (Yuquan Zhang) and Y.Z. (Ying Zhou); formal analysis, X.C.; investigation, E.F.R. and X.C.; resources, Y.Z. (Yuan Zheng); data curation, X.C. and J.X.; writing—original draft preparation, Y.Z. (Yuquan Zhang) and E.F.R.; writing—review and editing, X.C.; visualization, X.C.; supervision, Y.Z. (Yuan Zheng); project administration, T.J.; funding acquisition, X.C., Y.Z. (Yuquan Zhang) and Y.Z. (Yuan Zheng). All authors have read and agreed to the published version of the manuscript.

Funding

This research was funded by the National Natural Science Foundation of China (Nos. 51809083, 51979086); Fundamental Research Funds for the Central Universities (Grant No. 2018B05614); the Natural Science Foundation of Jiangsu Province (No. BK20180504) and the Water Conservancy Science & Technology Project of Jiangsu Province (2018026).

Conflicts of Interest

The authors declare no conflict of interest.

References

  1. Zhang, H.; Chen, D.; Wu, C.; Wang, X.; Leed, J.; Jung, K. Dynamic modeling and dynamical analysis of pump-turbines in S-shaped regions during runaway operation. Energy Convers. Manag. 2017, 138, 375–382. [Google Scholar] [CrossRef] [Green Version]
  2. Li, D.Y.; Wang, H.J.; Xiang, G.M.; Gong, R.; Wei, X.; Liu, Z. Unsteady simulation and analysis for hump characteristics of a pump turbine model. Renew. Energy 2015, 77, 32–42. [Google Scholar]
  3. Zuo, Z.; Fan, H.; Liu, S.; Wu, Y.L. S-shaped characteristics on the performance curves of pump-turbines in turbine mode—A review. Renew. Sustain. Energy Rev. 2016, 60, 836–851. [Google Scholar] [CrossRef]
  4. Höller, S.; Benigni, H.; Jaberg, H. Numerical and Experimental Investigation of the 4-Quadrant Behavior of Different Mixed Flow Diffuser Pumps. Int. J. Turbomach. Propuls. Power 2019, 4, 3. [Google Scholar] [CrossRef] [Green Version]
  5. Giovanna, C.; Jean-Bernard, H.; Giorgio, P.; Olivier, T.; Guido, A. Unstable behaviour of pump-turbines and its effects on power regulation capacity of pumped-hydro energy storage plants. Renew. Sustain. Energy Rev. 2018, 94, 399–409. [Google Scholar]
  6. Muhammetoglu, A.; Karadirek, I.E.; Ozen, O.; Habib, M. Full-Scale PAT Application for Energy Production and Pressure Reduction in a Water Distribution Network. J. Water Resour. Plan. Manag. 2017, 143, 04017040. [Google Scholar] [CrossRef]
  7. Stefanizzi, M.; Capurso, T.; Balacco, G.; Binetti, M.; Marco, T.; Camporeale, S. Pump as turbine for throttling energy recovery in Water Distribution Networks. Aip Conf. Proc. 2019, 2191, 20142. [Google Scholar] [CrossRef]
  8. Stefanizzi, M.; Capurso, T.; Balacco, G.; Marco, T.; Binetti, M.; Piccinni, A.F.; Fortunato, B.; Camporeale, S. Preliminary assessment of a pump used as turbine in a water distribution network for the recovery of throttling energy. In Proceedings of the 12th European Conference on Turbomachinery Fluid dynamics & Thermodynamics, Stockholm, Sweden, 3–7 April 2017. [Google Scholar]
  9. Monteiro, L.; Delgado, J.; Covas, D.I.C. Improved Assessment of Energy Recovery Potential in Water Supply Systems with High Demand Variation. Water 2018, 10, 773. [Google Scholar] [CrossRef] [Green Version]
  10. Celebioglu, K.; Altintas, B.; Aradag, S.; Tascioglu, Y. Numerical research of cavitation on Francis turbine runners. Int. J. Hydrogen Energy 2017, 42, 17771–17781. [Google Scholar] [CrossRef]
  11. Hübner, B.; Weber, W.; Seidel, U. The role of fluid-structure interaction for safety and life time prediction in hydraulic machinery. Iop Conf. Ser. Earth Environ. Sci. 2016, 49, 072007. [Google Scholar] [CrossRef] [Green Version]
  12. Chen, Z.; Singh, P.M.; Choi, Y.D. The effect of runner blade loading on the performance and internal flow of a Francis hydro turbine model. J. Mech. Sci. Technol. 2016, 30, 1617–1623. [Google Scholar] [CrossRef]
  13. Negru, R.; Muntean, S.; Marsavina, L.; Susan-Resiga, R.; Pasca, N. Computation of stress distribution in a Francis turbine runner induced by fluid flow. Comput. Mater. Sci. 2012, 64, 253–259. [Google Scholar] [CrossRef]
  14. Zhang, F.; Zheng, Y.; Yang, C.; Jin, X.L.; Ding, L. Stress Analysis of Tubular Turbine Based on Fluid-Structure Coupling. Appl. Mech. Mater. 2012, 190–191, 1261–1265. [Google Scholar] [CrossRef]
  15. Cui, B.L.; Lin, Y.G.; Jin, Y.Z. Numerical Simulation of Flow in Centrifugal Pump with Complex Impeller. J. Therm. Sci. 2013, 20, 47–52. [Google Scholar] [CrossRef]
  16. Wang, Y.; Wang, H.; Zhang, X. Strength analysis on stamping and welding impeller in centrifugal pump based on fluid structure interaction theorem. Trans. Csae 2011, 27, 131–136. [Google Scholar]
  17. Chen, X. Blade Stress of the Reactor Coolant Pump of 300 MWe Nuclear Power Plant in China Based on Fluid-solid Coupling Method. J. Mech. Eng. 2010, 46, 111–115. [Google Scholar] [CrossRef]
  18. Liao, C.; Huang, W.; Suo, S.; Liu, X.; Wang, Y. Fluid-solid strong-interaction model of mechanical seals in reactor coolant pumps. Sci. China Ser. E Technol. Sci. 2011, 54, 2339–2348. [Google Scholar] [CrossRef]
  19. Wang, C.; Shi, W.; Si, Q.; Zhou, L. Numerical calculation and finite element calculation on impeller of stainless steel multistage centrifugal pump. J. Vibroeng. 2014, 16, 1723–1734. [Google Scholar]
  20. Zhang, J.; Zhu, Y. Stress analysis of the canned nuclear coolant pump based on FSI. In Proceedings of the 2014 22nd International Conference on Nuclear Engineering, Prague, Czech Republic, 7–11 July 2014. [Google Scholar]
  21. Kan, K.; Zheng, Y.; Zhang, X.; Yang, C.; Zhang, Y. Numerical study on unidirectional fluid-solid coupling of Francis turbine runner. Adv. Mech. Eng. 2015, 7, 1–14. [Google Scholar] [CrossRef]
  22. Li, W.; Yang, Y.; Shi, W. Mechanical properties of mixed-flow pump impeller based on bidirectional fluid-structure interaction. J. Agric. Mach. 2015, 46, 82–88. [Google Scholar]
  23. Shi, W.; Xu, Y.; Zhang, Q. Analysis of the structural strength of a multistage submersible pump based on fluid solid coupling. J. Agric. Mach. 2013, 44, 70–73. [Google Scholar]
  24. Zheng, X.; Wang, L.; Weng, K. Dynamic characteristics analysis of tubular turbine based on bidirectional fluid solid coupling. Acta Agro Eng. 2016, 32, 78–83. [Google Scholar]
  25. Wu, G.; Luo, X.; Feng, J. Analysis of cracks in Francis Runner Blades Based on transient fluid solid coupling. J. Agric. Eng. 2015, 31, 92–98. [Google Scholar]
  26. Xiao, R.; Wang, F.; Gui, Z. Fatigue cracks analysis and improvement scheme of the Francis turbine runner blades. J. Hydraul. Eng. 2011, 42, 970–974. [Google Scholar]
  27. Wang, S.; Wang, Z.; Kong, D. Research on the fatigue life of a Francis turbine runner. J. Hydroelectr. Eng. 2006, 25, 135–138. [Google Scholar]
  28. Carpinteri, A.; Ronchei, C.; Scorza, D.; Vantadori, S. Fracture mechanics based approach to fatigue analysis of welded joints. Eng. Fail. Anal. 2015, 49, 67678. [Google Scholar] [CrossRef]
  29. Huang, X.; Chamberland-Lauzon, J.; Oram, C.; Klopfer, A.; Ruchonnet, N. Fatigue analyses of the prototype Francis runners based on site measurements and simulations. Iop Conf. Ser. Earth Environ. Sci. 2014, 22, 012014. [Google Scholar] [CrossRef] [Green Version]
  30. Seidel, U.; Mende, C.; Hübner, B.; Weber, W.; Otto, A. Dynamic loads in Francis runners and their impact on fatigue life. Iop Conf. Ser. Earth Environ. Sci. 2014, 22, 032054. [Google Scholar] [CrossRef] [Green Version]
  31. Egusquiza, E.; Valero, C.; Presas, A.; Huang, X.; Guardo, A.; Seidel, U. Analysis of the dynamic response of pump-turbine impellers. Influence of the rotor. Mech. Syst. Signal Process. 2015, 68, 330–341. [Google Scholar] [CrossRef]
  32. Meng, F.; Li, Y.; Shao, Y.; Pei, J.; Chen, J. Numerical calculation of effect of fluid-structure interaction on flow field in pumping stations with two way passages. China Rural Water Hydropower 2017, 1, 175–179. [Google Scholar]
  33. Liu, H.; Xu, H.; Wu, X. Strength analysis of guide vane centrifugal pump based on fluid solid coupling. J. Vib. Shock 2013, 32, 27–30. [Google Scholar]
  34. Zhang, Y.; Liu, S.; Wu, S. Fluid solid coupling calculation of axial flow turbine runner. J. Eng. Thermophys. 2008, 29, 1673–1675. [Google Scholar]
  35. Zhang, Y.; Xu, Y.; Zheng, Y.; Fernandez-Rodriguez, E.; Sun, A.; Yang, C.; Wang, J. Multiobjective Optimization Design and Experimental Investigation on the Axial Flow Pump with Orthogonal Test Approach. Complexity 2019, 2019, 1467565. [Google Scholar] [CrossRef] [Green Version]
  36. Zhao, X.; Xiao, Y.; Wang, Z.; Luo, H.; Soo-Hwang, A.; Yao, Y.; Fan, H. Numerical analysis of non-axisymmetric flow characteristic for a pump-turbine impeller at pump off-design condition. Renew. Energy 2017, 115, 1075–1085. [Google Scholar]
  37. Zhang, Y.; Li, C.; Xu, Y.; Tang, Q.; Zheng, Y.; Liu, H.; Fernandez-Rodriguez, E. Study on Propellers Distribution and Flow Field in the Oxidation Ditch Based on Two-Phase CFD Model. Water 2019, 11, 2506. [Google Scholar] [CrossRef] [Green Version]
  38. Capurso, T.; Stefanizzi, M.; Pascazio, G.; Ranaldo, S.; Camporeale, S.; Fortunato, B.; Marco, T. Slip Factor Correction in 1-D Performance Prediction Model for PaTs. Water 2019, 11, 565. [Google Scholar] [CrossRef] [Green Version]
Figure 1. Overall flow channel and test bench diagram under the pump condition. (a) numerical model; (b) experimental site.
Water 12 01162 g001
Figure 2. Diagram of the test bench.
Water 12 01162 g002
Figure 3. Comparison of external characteristics of mixed-flow pump under pump condition.
Water 12 01162 g003
Figure 4. Mesh of the runner.
Water 12 01162 g004
Figure 5. Streamline graph. (a) Pressure in pump condition; (b) pressure in reverse power generation condition; (c) velocity in pump condition; (d) velocity in reverse power condition.
Water 12 01162 g005
Figure 6. Blade pressure distribution. (a) Suction surface for pump condition; (b) pressure surface for pump condition; (c) pressure surface for reverse generation condition; (d) suction surface for reverse generation condition.
Water 12 01162 g006
Figure 7. Radial force of the runner in the polar coordinates.
Water 12 01162 g007
Figure 8. Maximum stress change diagram of runner. (a) Stress distribution of reverse power generation; (b) stress distribution of pump condition; (c) maximum stress change in reverse power generation; (d) maximum stress change in pump condition.
Water 12 01162 g008
Figure 9. Maximum deformation change of the runner. (a) Deformation distribution diagram of reverse power generation; (b) deformation distribution diagram of pump condition; (c) maximum deformation change in reverse power generation; (d) maximum deformation of pump condition.
Water 12 01162 g009
Figure 10. Fatigue life analysis under pump and reverse generation conditions. (a) Fatigue life under pump condition; (b) safety factor under pump condition; (c) fatigue life under reverse power generation; (d) safety factor under reverse power generation.
Water 12 01162 g010
Table 1. Material properties of the runner.
Density (kg/m3)Young’s Modulus (GPa)Poisson’s Ratio (-)Yield Strength (MPa)
77302030.291550
Table 2. Force under two working conditions.
ConditionX-Direction Radial Force (N)Y-Direction Radial Force (N)Radial Resultant Force (N)Axial Force (N)
Pump condition1226.2700.11412.088,679.7
Reverse power generation condition1762.5866.21963.967,654.7

