Article

Methodology for Energy Optimization in Wastewater Treatment Plants. Phase II: Reduction of Air Requirements and Redesign of the Biological Aeration Installation

by
Ana Belén Lozano Avilés
1,*,
Francisco Del Cerro Velázquez
2,* and
Mercedes Llorens Pascual Del Riquelme
3,*
1
Water Department, VECTORIS, S.L., 30100 Espinardo, Murcia, Spain
2
Department of Electromagnetism and Electronics, Faculty of Chemistry, Campus of Espinardo, 5, 30100 Espinardo, Murcia, Spain
3
Department of Chemical Engineering, Faculty of Chemistry, Campus of Espinardo, 5, 30100 Espinardo, Murcia, Spain
*
Authors to whom correspondence should be addressed.
Water 2020, 12(4), 1143; https://doi.org/10.3390/w12041143
Submission received: 28 February 2020 / Revised: 3 April 2020 / Accepted: 12 April 2020 / Published: 16 April 2020
(This article belongs to the Special Issue Design, Operation and Economics of Wastewater Treatment Plant)

Abstract

:
Phase I of the proposed energy optimization methodology showed how the selection of best management criteria for the biological aeration process, and the guarantee of its control at the wastewater treatment plant (WWTP) in San Pedro del Pinatar (Murcia, Spain) produced reductions of around 20% in energy consumption by considerably reducing the oxygen needs of the microorganisms in the biological system. This manuscript focused on phase II of this methodology, which describes the tools that can be used to detect and correct deviations in the optimal operating points of the aeration equipment and the intrinsic deficiencies in the installation, in order to achieve optimization of the oxygen needs by the microorganisms and improve the efficiency of their transfer from the gas phase to the liquid phase. The objectives pursued were: (i) to minimize the need for aeration, (ii) to reduce the pressure losses in the installation, (iii) to optimize the air supply pressures to avoid excessive energy consumption for the same airflow, and (iv) to optimize the control strategy for the actual working conditions. The use of flow modeling and simulation techniques, the measurement and calculation of air transfer efficiency through the use of off-gas hoods, and the redesign of the aeration facility at the San Pedro del Pinatar WWTP were crucial, and allowed for reductions in energy consumption in Phase II of more than 20%.

1. Introduction

Energy costs account for more than a third of operating costs in the wastewater treatment plant (WWTP) of San Pedro del Pinatar in Murcia, Spain. This WWTP incorporates an integrated system of an activated sludge biological reactor with ultrafiltration membranes that allows not only a guaranteed quality of the effluent but also a significant reduction in the volume of the reactor. The plant was built over the previous facility on a site approximately 9000 m2 in size, located on the border of the San Pedro del Pinatar Regional Salt Marsh and Dune Park, and was designed to treat a flow of 20,000 m3/day of wastewater, with the aim of serving a population of 130,000 inhabitants. The most important energy consumption occurs in the biological process. The consumption of the aeration stage is approximately 68% of the energy consumption of the biological process and 53% of the operating consumption of the membrane biological reactor MBR [1]. Therefore, special attention must be paid to achieving maximum efficiency in the aeration system in field conditions to minimize operating costs at this WWTP.
The first phase of energy optimization of the aeration stage in WWTPs consists of adjusting the concentration of suspended solids in the mixed liquor in the biological reactor to minimize the oxygen requirements so that microorganisms correctly purify the wastewater, and the sludge is stabilized [1]. The second optimization phase aims at minimizing the airflow injected into the system so that microorganisms have access to the necessary amount of oxygen to obtain the maximum oxygen transfer efficiency (OTE) from the aeration system under field conditions.
The gaseous dispersion of oxygen in the mixed liquor of the biological reactor is achieved mainly through agitation, which breaks large bubbles into small bubbles, thus promoting the transfer of gas to the liquid mass [2]. The most commonly used impellers are radial flow impellers, which are the main energy-consuming component of a gas dispersion unit. To reduce energy consumption during aeration and agitation, engineers often combine liquid-gas dispersion (used in radial flow impellers) with a mixture (used in axial flow impellers) to construct an efficient gas-liquid reaction system [3]. The input power required for the gas dispersion impeller typically represents between 40% and 70% of the input power of an entire agitation system [4]. Therefore, there is an urgent need to verify its cleanliness and integrity, and replace it if necessary, with a more efficient impeller technology to improve the gas dispersion process and energy-saving [5,6,7,8].
In the specific case of using air diffusers, these tend to deteriorate and become clogged, thus increasing energy consumption as a result of the loss of efficiency and increased pressure drop. The loss of efficiency translates into an increase in the flow of air required to reach the same concentration of dissolved oxygen and, therefore, an increase in energy cost. Similarly, an increase in pressure loss means an increase in service pressure, which irremediably implies an increase in energy expenditure. It is common to find energy consumption between 10% and 35% higher than it should be if the diffusers were in optimal conditions [9]. This is fundamental in the wastewater treatment plant of the San Pedro del Pinatar, in which energy cost is very high.
While advances in aeration system control have reduced operating costs, the monitoring of the oxygen transfer efficiency of the aeration system is not generally considered [10,11,12]. Currently, diffuser efficiency management is based almost exclusively on periodic replacement or repair actions according to pre-established deadlines. Correct monitoring of process variables makes it possible to quantify the energy impact of the physical state of the diffusers and establish an optimum frequency for cleaning or replacement operations. It also allows the detection of leaks and areas of low aeration, as well as the analysis of the efficiency of oxygen transfer for different operating strategies. In addition, knowing in situ the spatial and temporal distribution of efficiency along the aerobic zone and under real operating conditions is fundamental for planning a future renovation, modification, or extension of the aeration system.
This manuscript proposes a precise, versatile and simple methodology, that allows estimating potential savings in WWTP aeration systems, based on the continuous monitoring and control of fundamental process parameters (a measure of oxygen transfer with off-gas hood, airline pressure, water quality requirements) and conducting the studies based on computational fluid dynamics (CFD), that allow evaluation of the flow distribution inside the reactor, detect points that can be improved in the installation, and the advanced detection of anomalies in the process (e.g., dead volume, no mixture, and short-circuiting) [13,14,15,16,17,18]. This is crucial to achieve the energy objectives and contribute, at the local and national levels, to meeting the 2030 objectives set by the United Nations for Sustainable Development (SDG) [19], the European Energy Strategy 2020 and the European Energy Strategy 2030 [20,21].

2. Methods and Materials

2.1. Presentation of the Activated Sludge Aeration System at the San Pedro del Pinatar WWTP

The biological treatment installed at the San Pedro del Pinatar WWTP consists of an activated sludge biological reactor with prolonged aeration followed by a biological reactor with membranes. The biological treatment has two plug flow reactors, with a unit volume of 8015 m3 and dimensions of 25 m × 58 m with a depth of approximately 5.7 m. It is divided into four zones:
  • 1st anoxic chamber without diffusers and with submerged agitation.
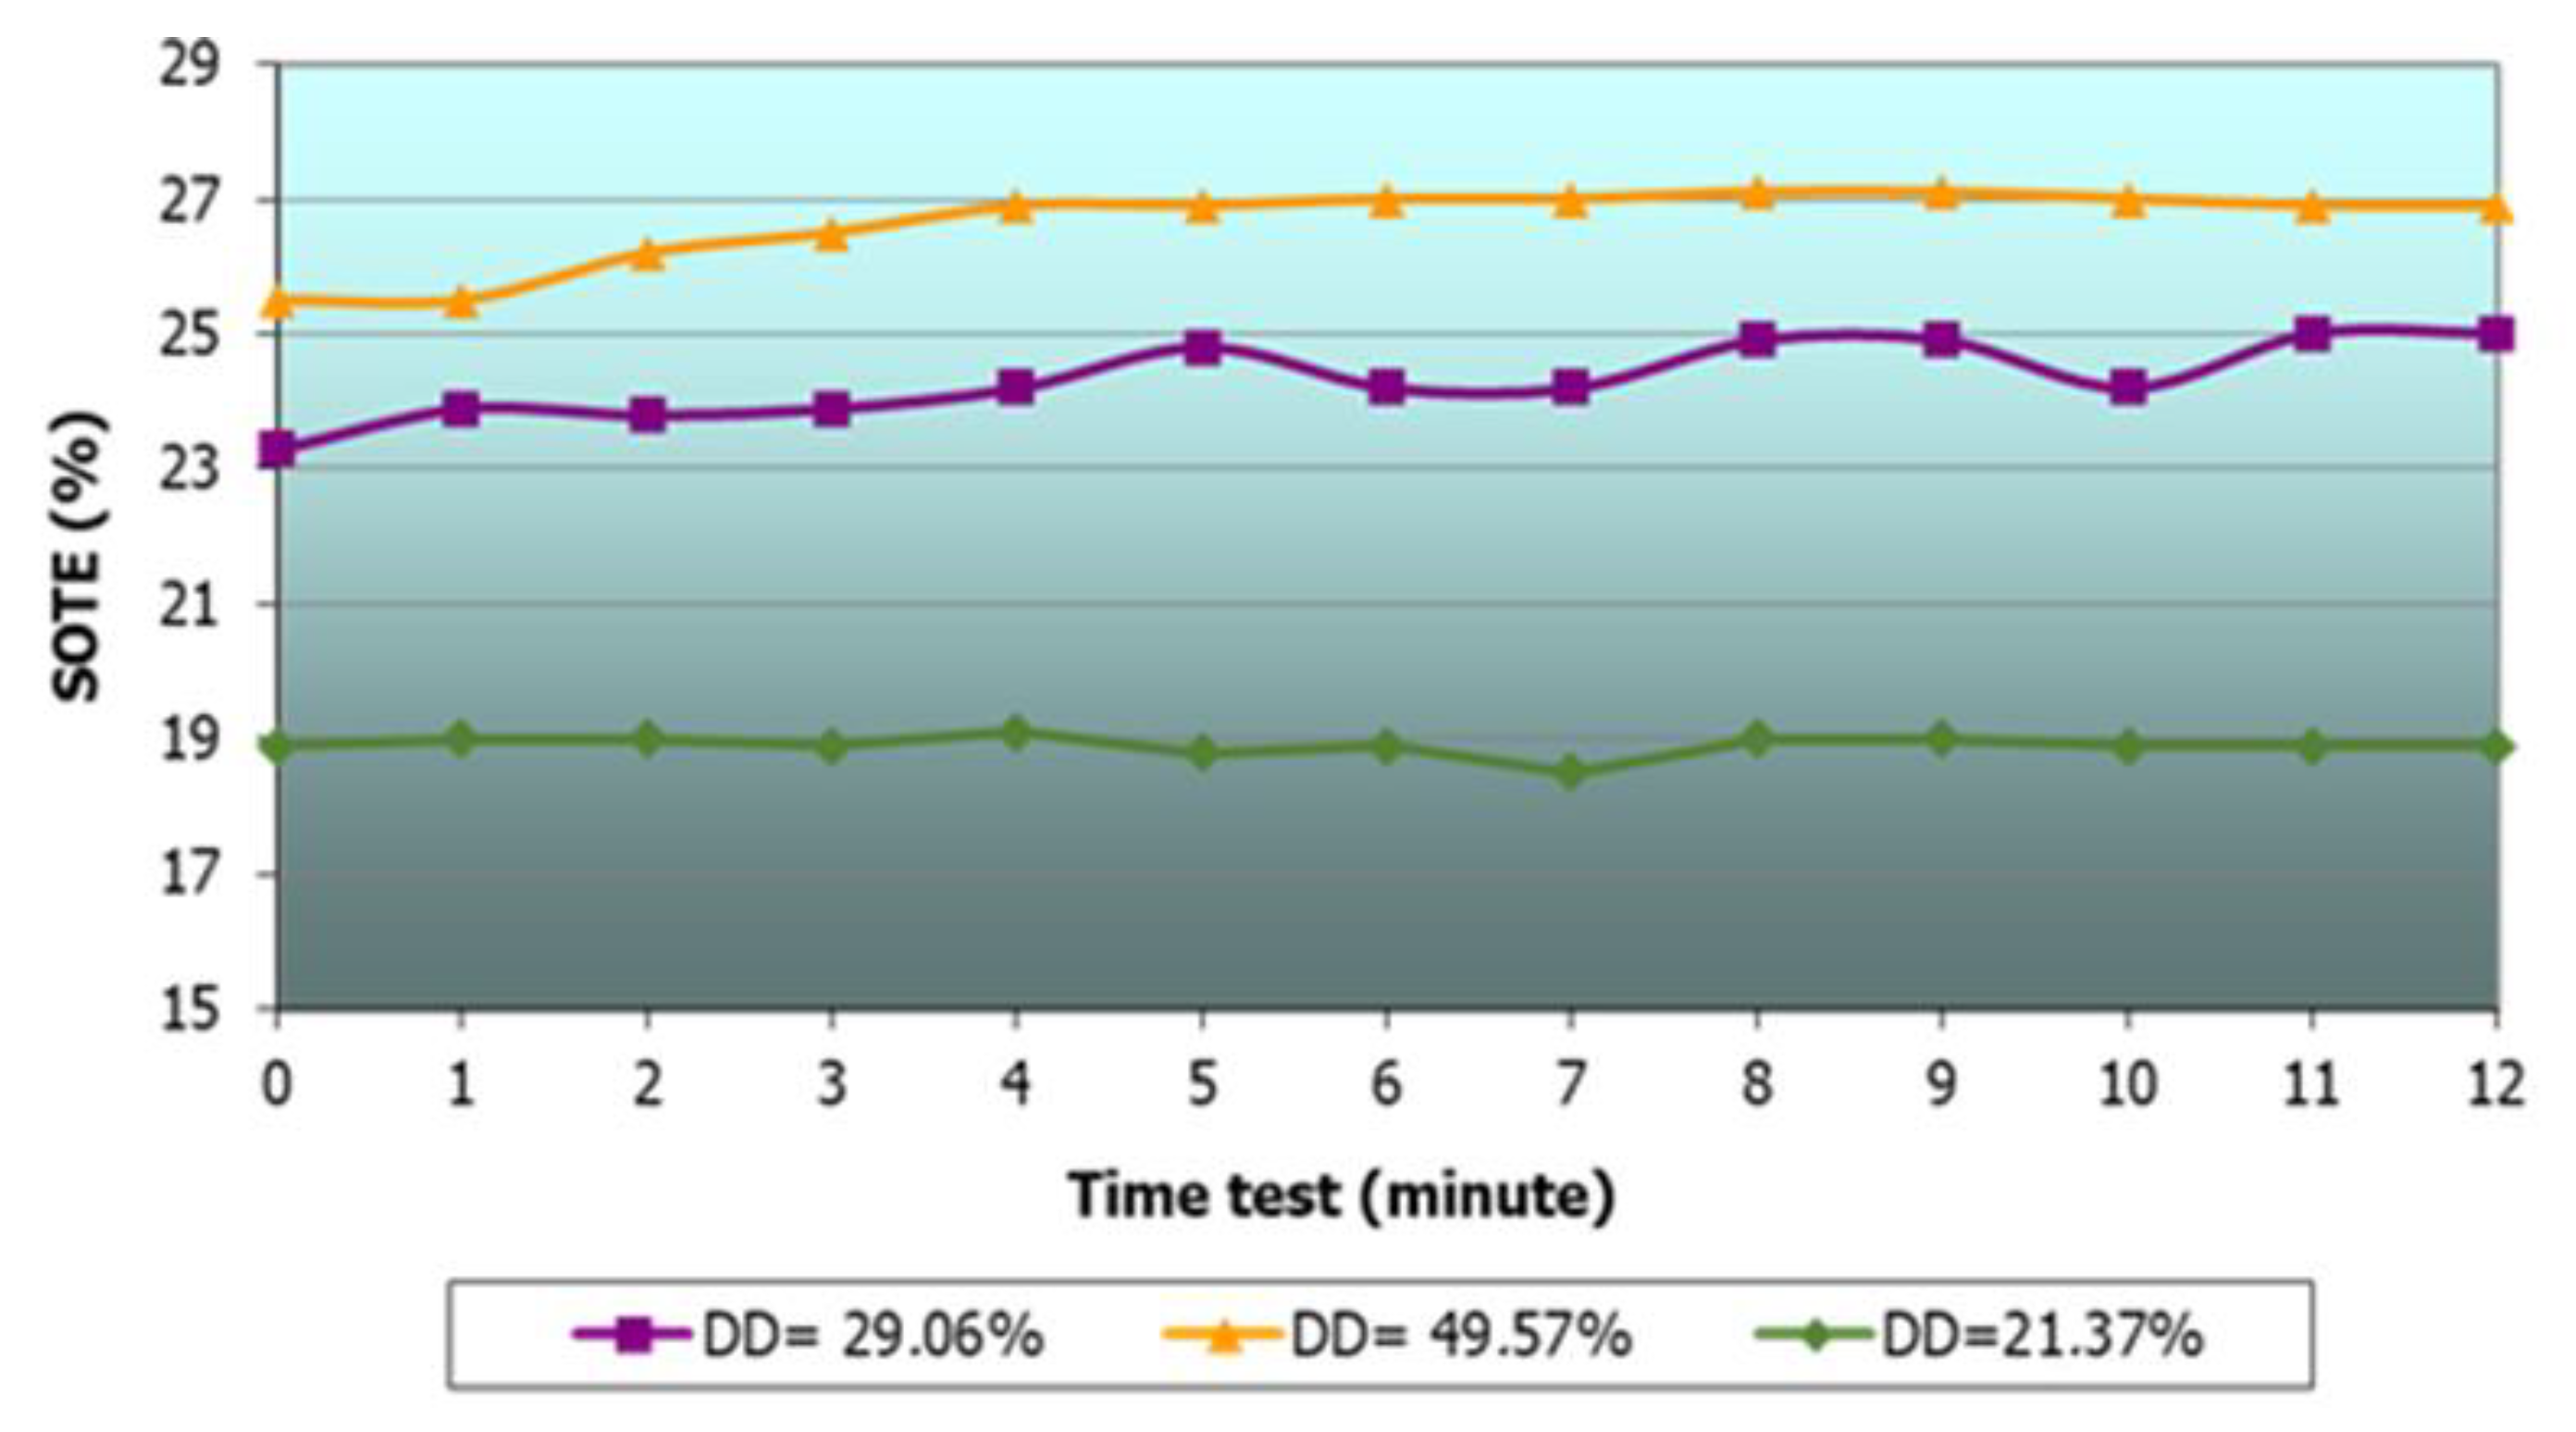
  • 2nd oxic chamber without submerged agitation, aeration, and diffuser density of 49.57%.
  • 3rd oxic chamber with submerged agitation, aeration, and diffuser density of 29.06%.
  • 4th oxic chamber with agitation, aeration, and diffuser density of 21.37%.
The air is produced by trilobular rotary piston blowers with a 110-kW motor and is distributed to each of the reactors by a total of 1404 fine bubble diffusers installed per line, type TFB-Flygt Sanitaire® by Xylem Inc. (Madrid, Spain), and made in Ethylene Propylene Diene type M (EPDM) with a diameter of 9". The operating cycles of the aeration equipment were based on start/stop aeration cycles regulated by an oxygen setpoint, provided by a probe installed in the biological reactor and a basic Proportional, Integral, and Derivative (PID) control.
The biological degradation process also has a polyvinyl difluoride (PVDF) hollow fiber membrane treatment system with a total installed membrane area of 1516 m2, which provides excellent quality effluent without the need for subsequent water disinfection. The membrane bioreactor (MBR) has five trilobular rotary piston blowers with a 75 kW motor, to clean the membrane surface, and to maintain the proper concentration in both the biological reactor and the membrane chamber, the system has five 37 kW submerged pumps for external recirculation of the mixed liquor from the membrane chamber to the anoxic chamber of the biological reactor.
Although the San Pedro del Pinatar WWTP was designed to treat a flow rate of 20,000 m3/day, until the end of its commissioning in 2009, the flow rate values and the pollutant load received, expressed in kg/day of the biological oxygen demand (BOD5), chemical oxygen demand (COD), total suspended solids (TSS), total nitrogen (TN), and total phosphorus (TP), were lower than those expected in the design. These parameters have a significant influence on the electricity consumption of the installation, being around 1.03 kW/m3 before the development of the optimization methodology and starting from a value of approximately 0.83 kW/m3 in the second phase [1]. A first analysis of the installation and its operation indicated that to optimize the OTE, it was necessary to act on:
  • Non-homogeneous aeration over the entire surface of the biological reactor.
  • The preferential paths detected into the biological reactor.
  • The deficiencies in agitation and mixing inside the biological reactor.
  • The deterioration and obsolescence of the diffusers.
  • The high pressure drops in the air line.
  • The lack of adjustment of the oxygen concentration in the different oxic chambers of the biological reactor.
  • The need to renew and redesign pumping and aeration equipment that does not meet real needs.

2.2. Tests for the Energy Optimization of a Biological Treatment Process

The methodology followed for the energy optimization of the biological aeration stage covered all levels (process, equipment, and control) [22,23,24] and it was based mainly on the stages shown in Figure 1:
Where:
  • Qinfluent is the inlet flow of wastewater to the biological reactor;
  • SOTE is the oxygen transfer efficiency at standard conditions of pressure and temperature;
  • ΔP is the pressure drop in air line;
  • Qair is the flow of air injected into the biological reactor.
The objective of Phase II was to reduce as much as possible the amount of air that must be supplied to the biological reactor to obtain the oxygen required by the bacteria, i.e., to increase the efficiency of oxygen transfer. This led to a reduction in the energy requirement for the aeration stage, with some equipment having to be redesigned to meet current needs. Each of the steps followed in this optimization phase is detailed below.

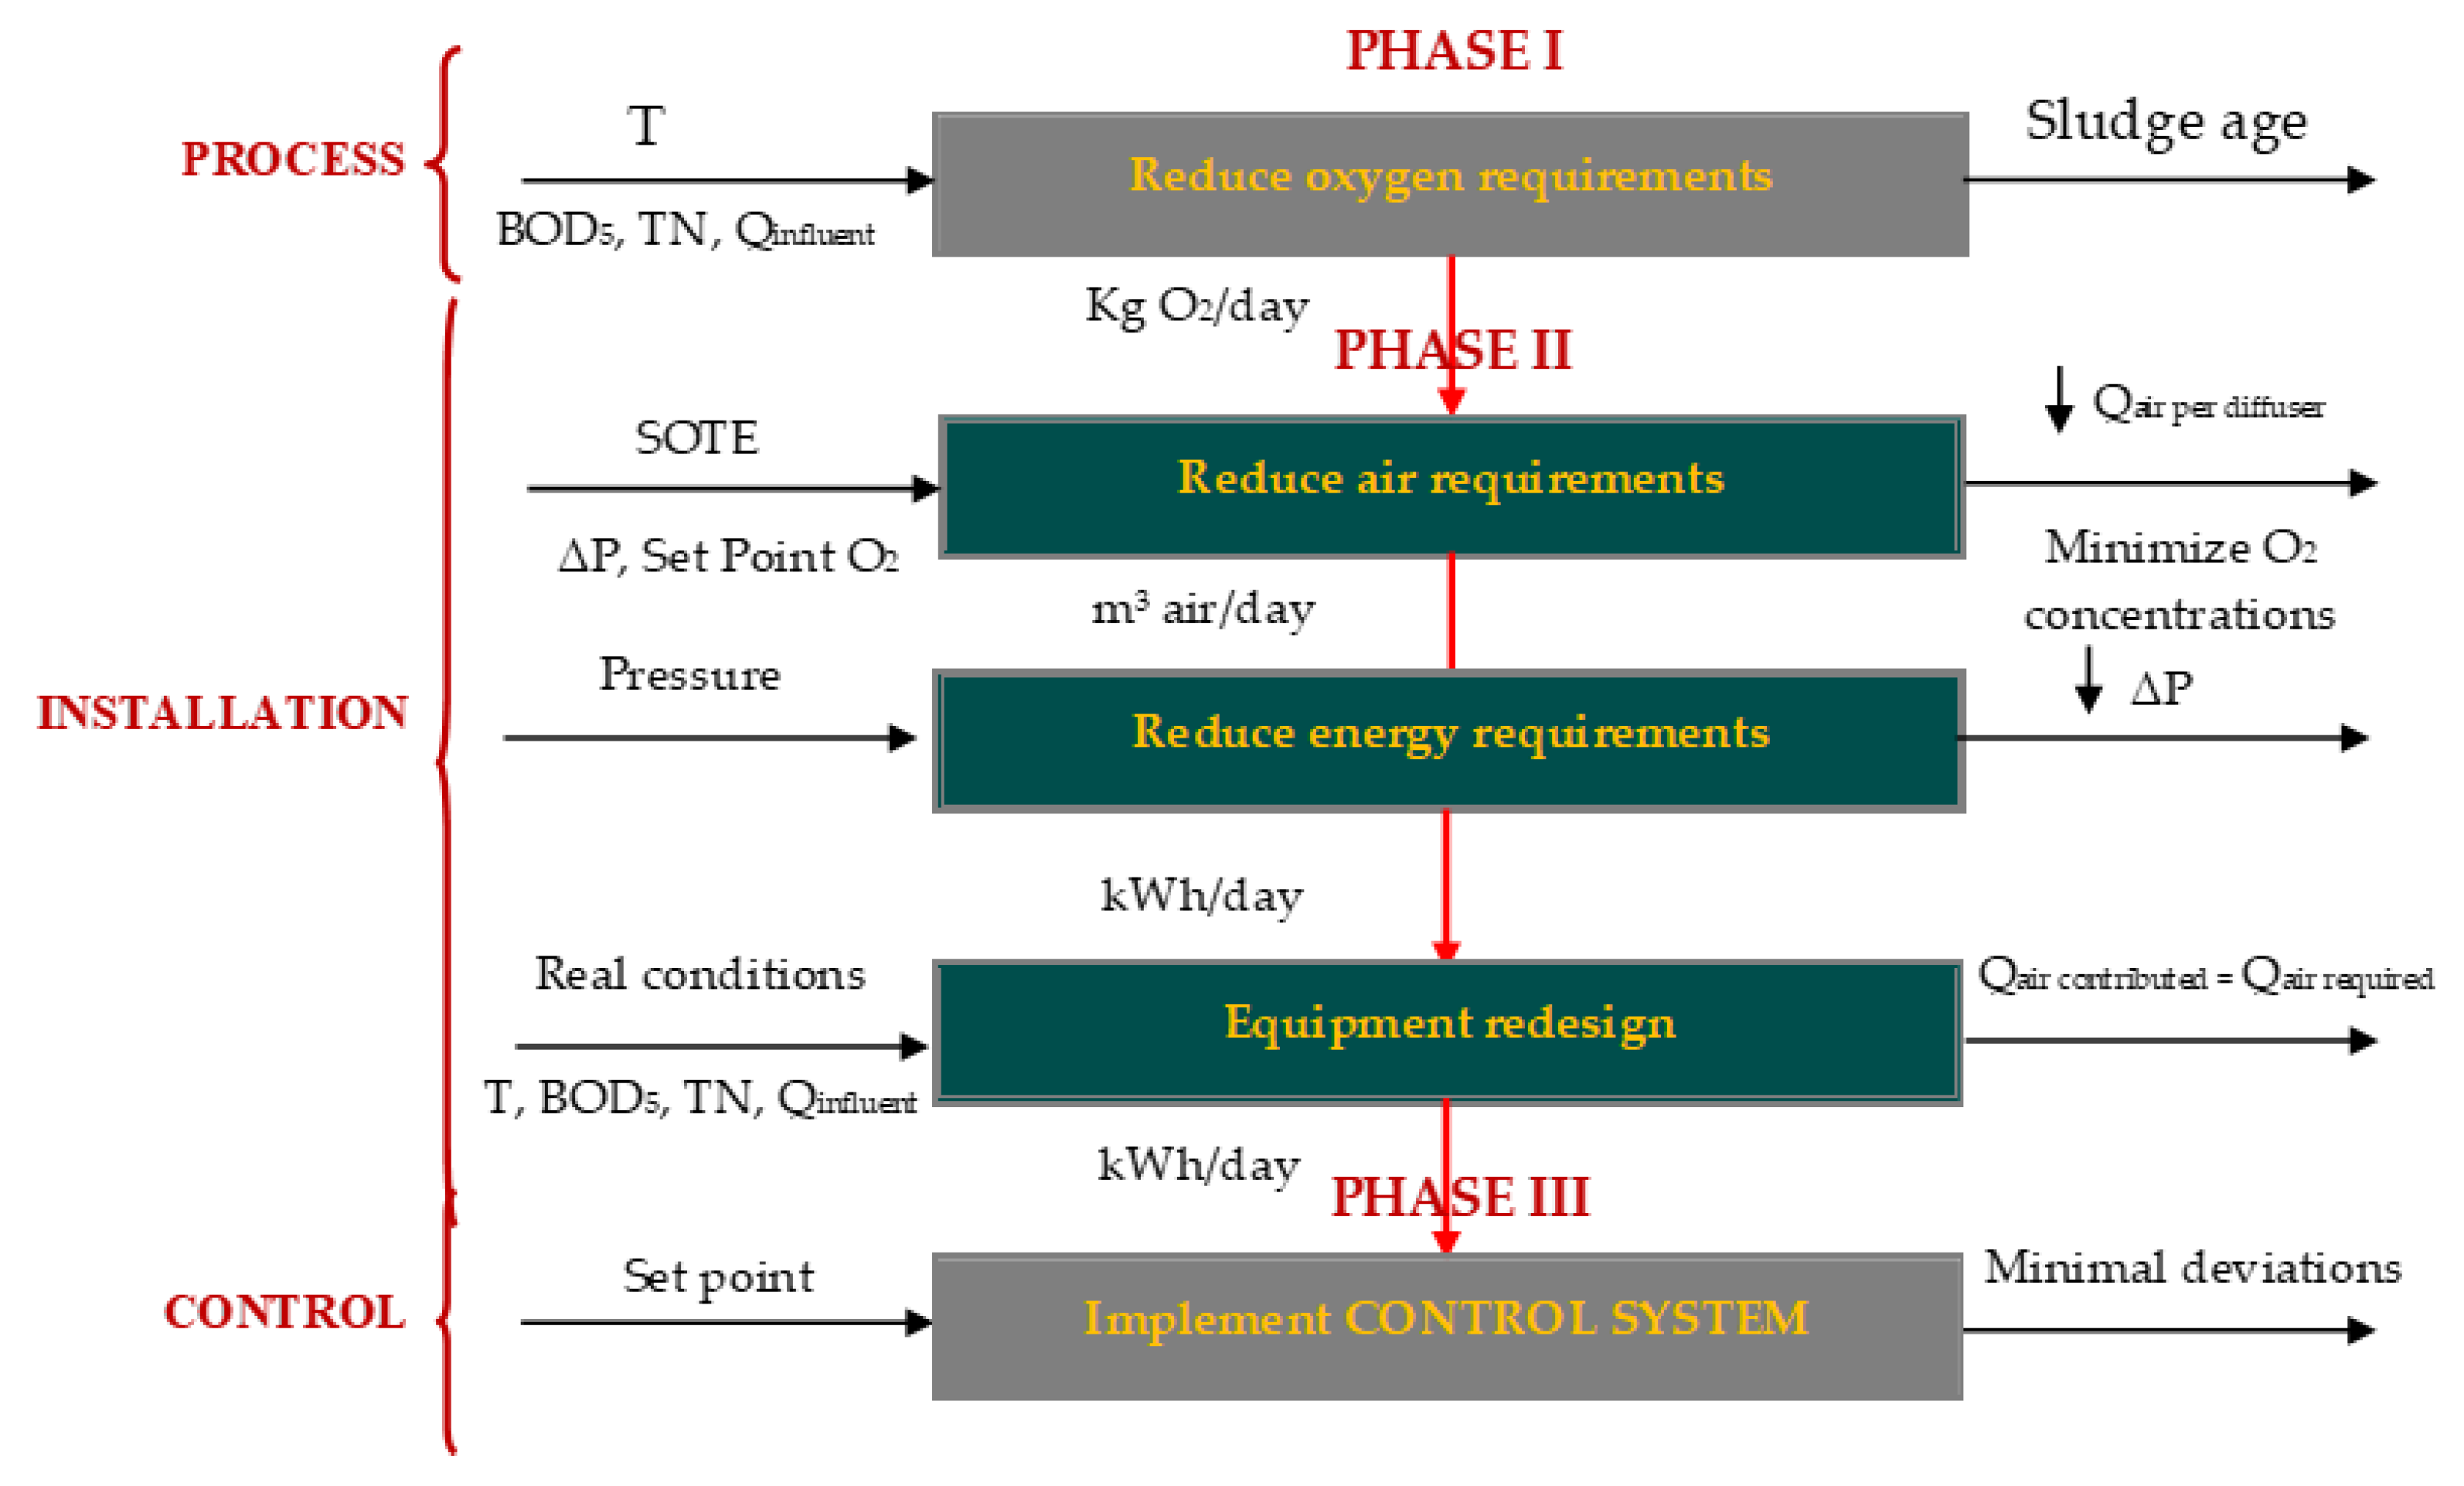
2.2.1. Step 1. Reduce Air Requirements

The primary parameter to be controlled was the oxygen concentration in the biological reactors, whose influence on the transfer is justified by the following equation (1):
T T O   =   K L   ×   A V   ×   ( C S     C L )   =   K L   ×   α   ×   ( C S C L )
where TTO is the oxygen transfer rate, KL is the mass transfer coefficient in the liquid phase, CS is the dissolved oxygen concentration in the reactor, CL is the oxygen saturation concentration in field conditions, and the A/V ratio is the specific surface, usually represented by α.
To achieve a high value of KL × α, the following tests were performed:
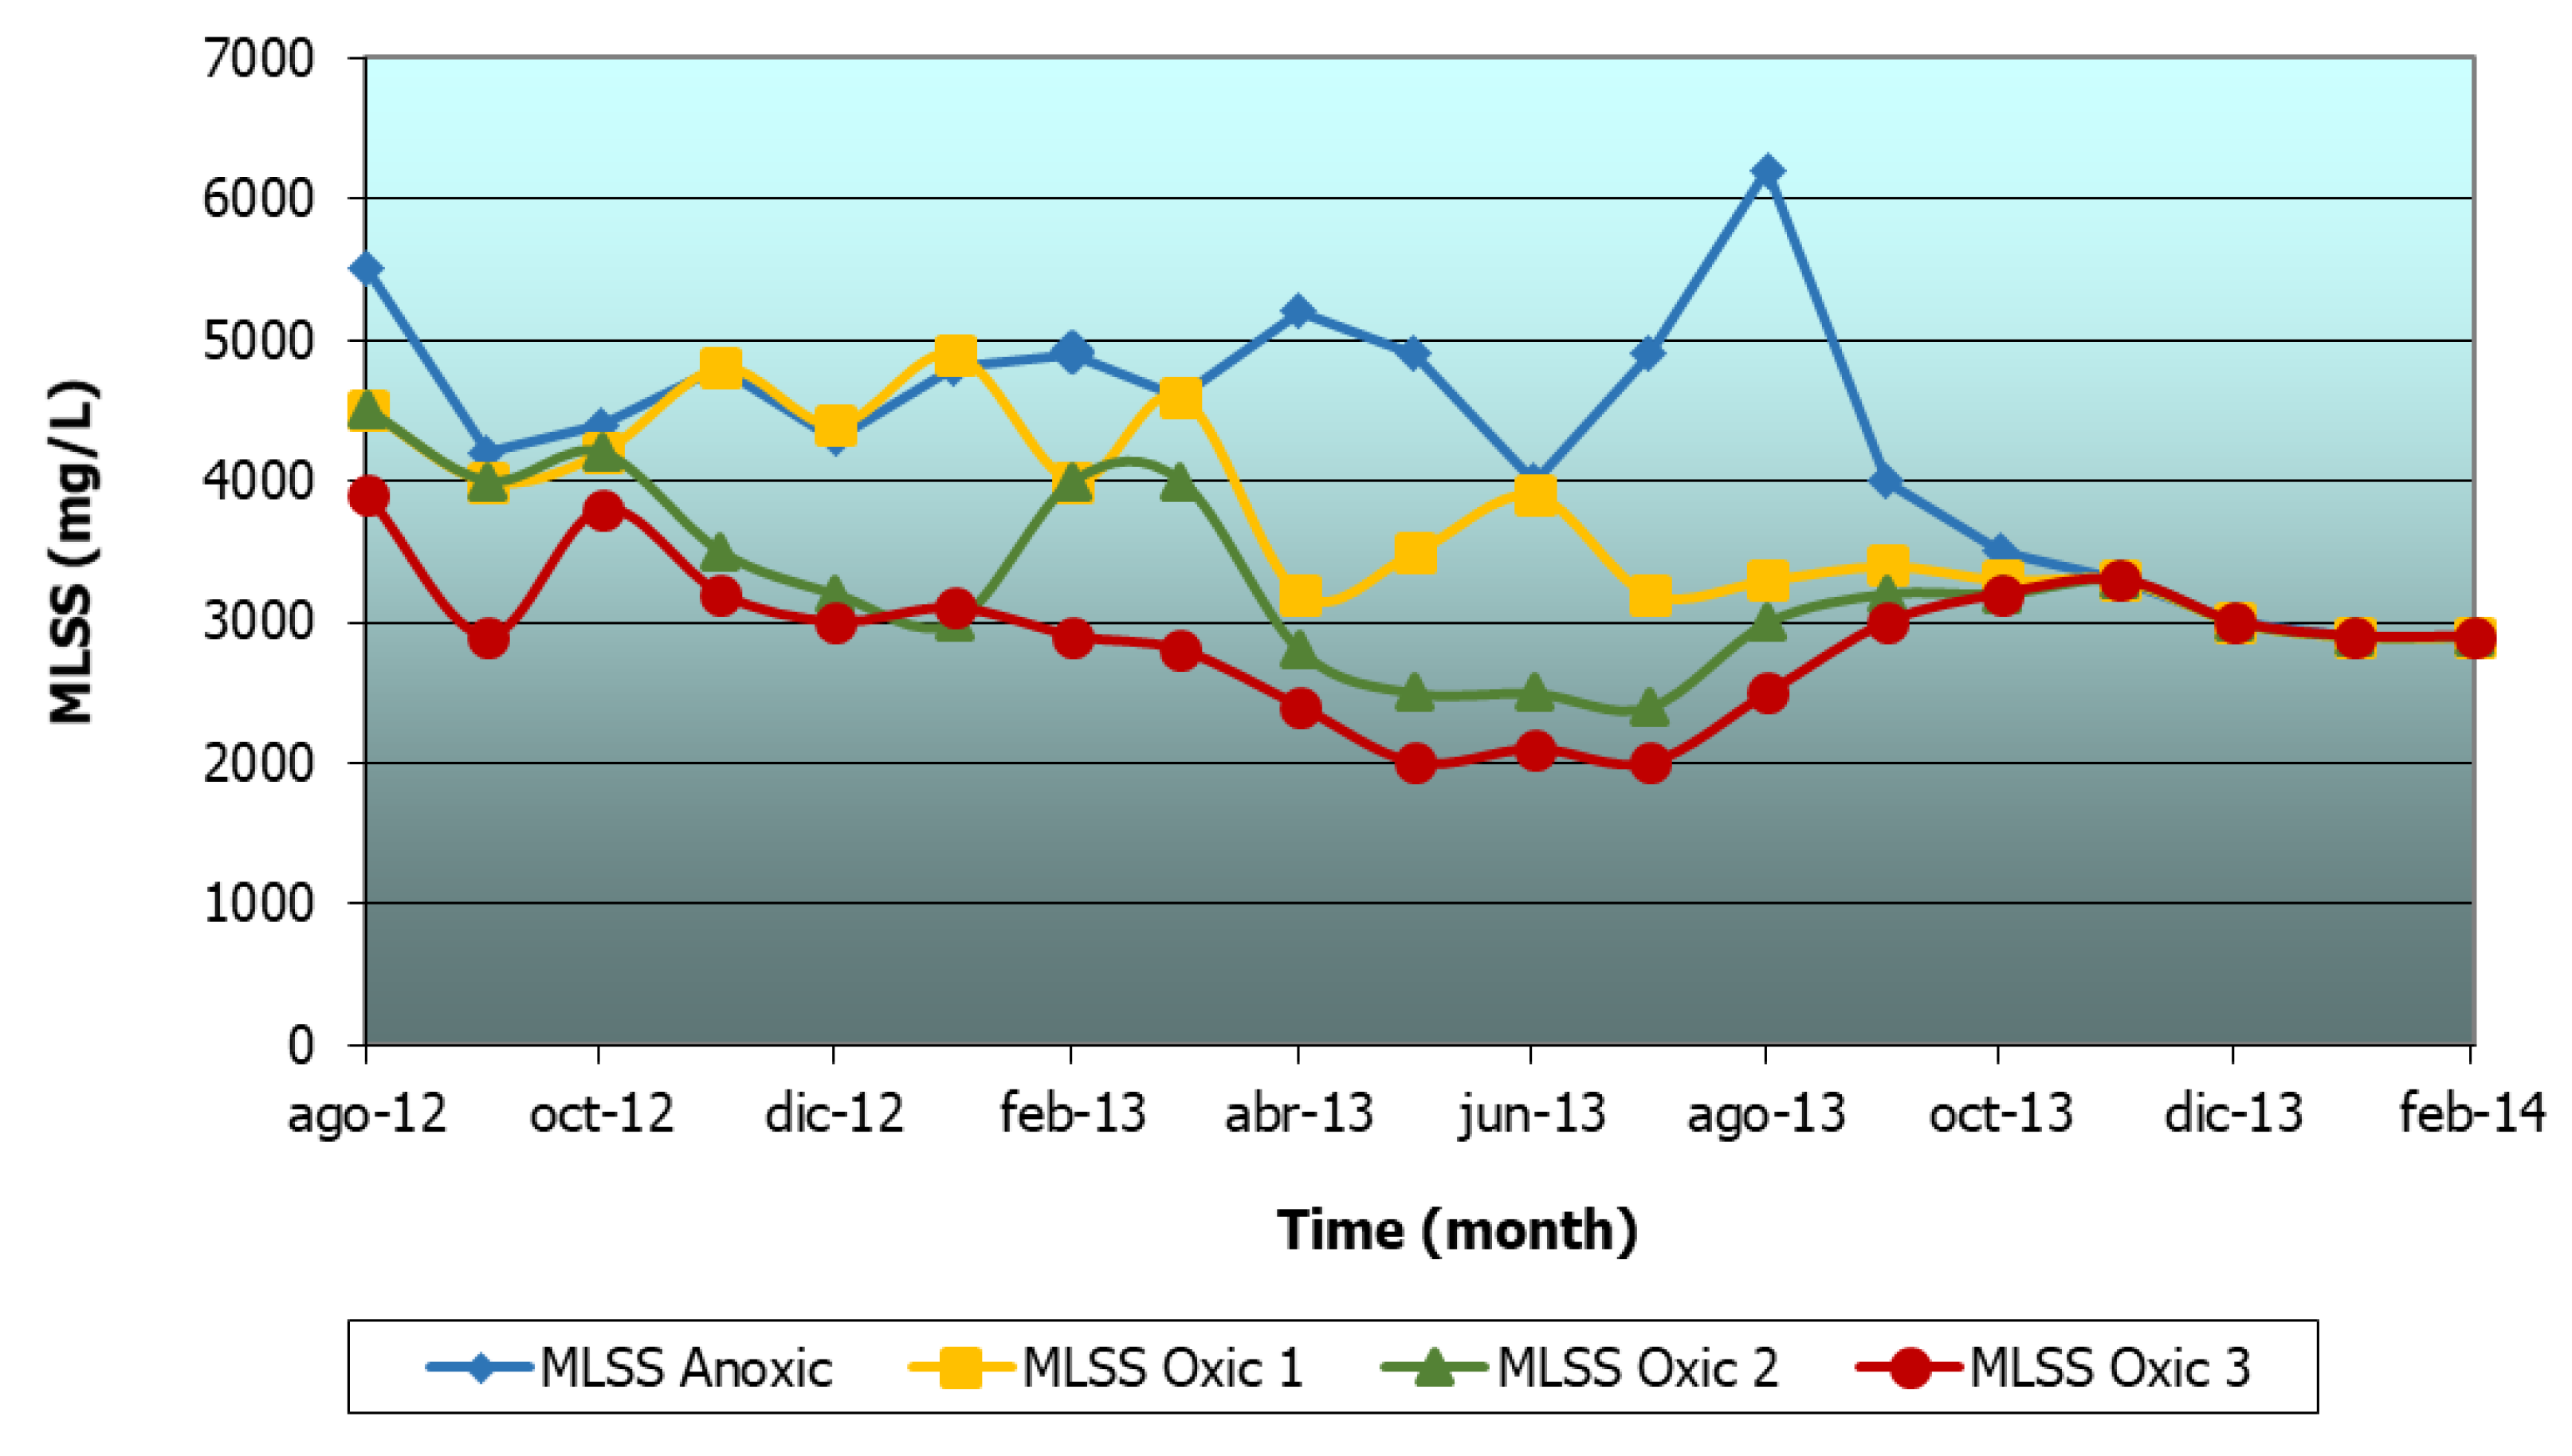
Test to select the best-operating conditions it developed in phase I [1], which consisted of working with a minimum sludge retention time (SRT) or a low concentration of solids in the suspension in the mixed liquor (MLSS).
Tests to regulate the airflow injected by the diffusers.
The main objective of any aeration system is to transfer the oxygen into the liquor mixture so that this dissolved oxygen can be used by the microorganisms. Therefore, another parameter that directly influences the efficiency of the transfer is the air flow fed to each diffuser (Nm3/h). Therefore, in the next step, an attempt was made to adjust the airflow through the diffusers to reduce the coarse air bubbles and increase their retention time within the reactor.
To select the best Qair/Qdiffuser flow ratio, the specific performance curves given by the manufacturer for the installed diffusers were used (Figure 2). Taking into account the installation data (reactor dimensions, diffuser immersion height, number of diffusers, etc.), these curves gave us the optimal range of air injection flows per diffuser when comparing the results obtained in the oxygen transfer efficiency parameter and in the air line pressure drop parameter for the different scenarios of the blower operation at the WWTP (Table 1).
➢ Tests to determine the age and condition of the air-injection components.
The oxygen transfer rate also depends on the type of diffuser, its immersion in the biological reactor, the density of the installed diffusers, its age, etc. Since the diffusers are already installed in the WWTP, and we have selected the optimal airflow fed to each diffuser (Nm3/h), the following tests focused on the study of the age and the state of degradation of the diffusers, the distribution of the airflows within the biological reactor, and the pressure drop in the air network.
The aging of the diffusers has a critical effect on the efficiency of oxygen transfer in standard conditions expressed as a percentage, so that their periodic study allows us to determine their influence on the efficiency of aeration and the suitable moment for replacing the diffusers, obtaining an optimization of the costs associated with the aeration stage.
For the measurement of the oxygen transfer in the biological reactor in the different tests, the off-gas method was used. This method follows the American Society of Civil Engineers ASCE 18-1996 (“Standard Guidelines for In-Process Oxygen Transfer Testing”) [25] and ATV-M 209 (“Measuring Oxygen Transfer under Process Conditions”) [26].
The off-gas method is based on the calculation of aeration parameters using mass balances. The fundamental principle is the measurement of both the oxygen in the air leaving the biological reactor, and the oxygen in the air supplied to the reactor. The comparison of the outgoing air (Off-gas) with the supplied air allows the calculation of the oxygen transfer.
The test consists of collecting the off-gas from the surface of the aeration tank by means of an off-gas hood. The hood has a specific surface that is kept floating in the biological reactor and is connected to an oxygen analyzer [27,28,29,30,31]. This device performs continuous measurement of temperature, pressure, flow, as well as the oxygen content of the air leaving the tank and the ambient air, making the necessary corrections in the humidity and CO2 content of the two gases.
With this equipment, measurements were made and the oxygen transfer efficiency under plant and process water (OTEpw) operating conditions could be calculated using the ASCE 18-1996 method [25], which takes into account the mole fractions of oxygen entering and leaving the biological reactor with respect to nitrogen and the inert fractions of the gas, according to equation (2):
O T E p w = M a s s   O x y g e n   I n p u t M a s s   O x y g e n   O f f g a s M a s s   O x y g e n   O f f × 100 = M R i M R e M R i × 100
MRi and MRe are the molar oxygen fractions with respect to nitrogen and inert inputs and outputs calculated from equations (3) and (4):
M R i = Y i 1 Y i Y C D i Y W i  
M R i = Y e 1 Y e Y C D e Y W e
where:
  • Yi and Ye represent the molar fractions of oxygen (O2) at the inlet and outlet, respectively.
  • YCDi and YCDe are the molar fractions of carbon dioxide (CO2) at the inlet and outlet, respectively.
  • YWi and YWe represent the molar water vapor fractions at the inlet and outlet, respectively.
Once the oxygen transfer yields under process conditions were obtained, the standardization of these values to reference conditions (zero dissolved oxygen, temperature 20 °C and atmospheric pressure 1 atm) allowed their comparison with the oxygen transfer yields in clean water under identical conditions to obtain the value of the parameter KL × α, which is entered into equation (1).
This parameter includes the effect of mixed liquor characteristics on oxygen transfer (α) and the possible loss of diffuser efficiency due to clogging, aging and deterioration (KL).
Finally, the standard oxygen transfer efficiency (SOTEpw) was obtained from equation (5), taking into account the calculated OTE values and correction factors affecting the liquor mixture and the ambient pressure, expressed as:
S O T E p w = S O T E c w × K L × α = O T E p w ( % ) ×   C o 20 ( τ   ×   β   ×   Ω   ×   C o 20 C ) ×   θ ( T 20 )
Being the correction factors:
  • β is a function of the salinity of the process water;
  • Ω is a function of environmental atmospheric pressure;
  • τ is a function of the process temperature.
For the development of the experience, off-gas analysis equipment was available for the continuous measurement of the mole fraction of O2 and CO2 in both ambient air and off-gas, the temperature, and dissolved oxygen concentration of the activated sludge, and the temperature, pressure, and flow of the extracted gas. The hood was installed at various points on the biological reactor to obtain a better representation of the state of the diffuser grids.
With this equipment, different experiences were carried out [32]:
a. The study of the influence of the operating frequency of the blowers or different airflows through the diffusers.
The real values of the SOTE parameter measured with the hood method in the San Pedro del Pinatar WWTP biological reactor, at the minimum blower operating frequency (33 Hz), and at the maximum frequency (50 Hz), were compared with the theoretical SOTE values obtained from the diffuser performance curves provided by the manufacturers (Figure 2a,b).
b. Study of the agitation influence during aeration.
The SOTE measurements by means of the off-gas hood were made by varying the operation mode of the agitators during biological aeration according to:
  • With the agitation running continuously during the operation of the aeration blower (mode 1),
  • With an alternating operation of the agitation (mode 2)
  • With the submersible mixers stopped during the entire biological aeration phase (mode 3)
c. Study of the influence of the density of diffusers.
In this test, during SOTE measurement with the off-gas hood installed in the biological reactor, we modified the number or density of the diffusers through which a fixed airflow provided by the blower at a 33 Hz regime flows.
  • Keeping only the air inlet line of the oxic chamber 2 open (DD = 49.57%);
  • Keeping only the air inlet line of oxic chamber 3 open (DD = 29.06%);
  • Keeping only the air inlet line of the oxic chamber 4 open (DD = 21.37%).
d. Study of the influence of cleaning diffusers with formic acid.
Another aspect that causes an increase in energy consumption associated with the aeration process is the drop-in pressure produced in the air distribution network due to the fouling of the diffusers. To minimize this effect, a test was carried out that consisted mainly of periodically checking the air-line pressure at the different working flows of the blowers (Table 1), provided by the digital probes installed. The aim was to determine the rate of contamination of the diffusers and to carry out appropriate maintenance management (chemical cleaning, replacement, etc.).
➢ Hydraulic tests to know the flow distribution inside the biological reactor.
The next step in the experimental development carried out at the San Pedro del Pinatar WWTP was to evaluate the internal behavior of the currents in the biological reactor, in order to eliminate any interference in the aeration process that could damage the nitrification-denitrification processes [33].
Focusing the study on the anoxic chamber, due to its impact on the purification process of the San Pedro WWTP, a strong preferential path of the currents at the entrance to this chamber was detected, which causes an uneven distribution of the concentrations of suspended solids in the mixed liquor (MLSS) throughout the reactor. Figure 3 shows the representation of the MLSS concentration determined periodically in the WWTP laboratory.
In order to know what was happening inside the anoxic chamber, a series of experimental tests and studies based on computational fluid dynamics (CFD) were carried out using the Ansys v13.0 software as a simulation tool. These tests were focused on studying the hydrodynamics (the study of current lines and of velocity isovolumes) and the study of residence time distribution (RTD) [34,35,36,37,38,39,40,41].
Three CFD studies were conducted:
a. Study of current lines.
The study of current lines and flow rates of water and air, arises from the application of the hydraulic model in the CFD developed, for which this scheme was followed:
(1)
The geometry of the domain of the modeled fluid was defined, using the CAD computer-aided drawing software.
(2)
This geometry was divided into uniform cells of adequate size to obtain the necessary calculation precision.
(3)
The boundary conditions of the fluid domain that could affect the simulation were established. In order to make the model as close as possible to reality.
(4)
The specific equations for the calculation were defined according to the needs.
(5)
The simulation phase was started by establishing an initial solution for each cell and each variable, a value estimated on the basis of experience. From that point, the simulation began to solve the equations in an iterative way until a sufficiently adjusted final solution was obtained.
(6)
The last stage consisted in the visualization of the simulation and analysis of the results.
b. Study of velocity isovolumes.
From this study, the volume of the biological reactor with circulation speeds below a certain value was estimated. It was generally considered that velocities below 0.3 m/s could cause sedimentation problems, so in each simulation, the volume of the biological reactor with an absolute velocity below 0.3 m/s was calculated. However, given the nature of the solids in the mixed liquor, with very low sedimentation rates, and the uncertainty about the minimum velocity value needed to keep the solids in suspension, the volume with an absolute velocity below 0.15 m/s and 0.05 m/s was also calculated, in order to have a lower reference and to quantify the areas of reduced velocity.
c. Study of residence time.
At this point in the experiment, it was interesting to study the distribution of the average residence time of a set of representative current lines in order to quantify the "quality" of the geometry and conditions numerically. To this end, in all the simulations carried out, a particle without mass or friction was injected into each input cell, and the trace described by the particle was recorded through the fluid medium to the output. For each trace, the time, in seconds, that each particle took to exit was calculated, and since the number of traces analyzed was sufficiently numerous, the distribution of residence times obtained was considered representative of the behavior of the fluid. In this study, the number of traces analyzed by the model was between 440 and 530.
For each of the studies, five different simulations were carried out, varying the following parameters between each of them:
Case 1: Real operating conditions of the anoxic chamber.
Case 2: Reduction of the operating frequency of the submersible mixers located inside the anoxic chamber.
Case 3: Modification of the geometry of the water entry point into the anoxic chamber and of the arrangement and thrust of the agitators.
Case 4: The same geometry is used as in case 3, but adding a deflector along the outlet chute.
Case 5: Modification of the operating frequency of the submersible mixers located inside the anoxic chamber, maintaining the arrangement and thrust of the mixers fixed in case 4.

2.2.2. Step 2. Reduce Energy Requirements in the Biological Process

The tests consisted of detecting load losses in the network of pipes and air injection elements.
Once we have optimized the air requirements of the microorganisms, the next step to achieve energy optimization in the biological aeration stage was to reduce the pressure drop in the aeration system. Since the energy consumption increases proportionally with the working pressure, in this section, efforts were focused on estimating the total pressure loss in the air line until it was injected into the biological reactor, adding up the pressure loss in the pipes, the meters of the water column, the pressure loss caused by the diffuser and by the grid, etc.
The calculation of the pressure loss in pipes and fittings was made using standardized calculation tables according to the characteristics of the material. For plastic pipes, the Hazen-Williams formula was used, and for metal pipes, the Scobey formula. The calculation of pressure loss in pipes and air branches turned out to be a tedious task since this variable depends on several factors; those related to the fluid, such as the airspeed inside the pipes, viscosity, density, etc., and the factors related to the pipe, such as the length of the pipes, the section, the surface roughness of the inner wall, the injection element, etc.
For this reason, to facilitate the work and to keep under control at all times the increase in pressure drop in the air distribution network [32,42], high-precision digital pressure probes were installed in each of the air distribution lines downstream of the different chambers of the biological reactor, in addition to those already installed along the air injection pipe from the blowers.

2.2.3. Step 3. Equipment Redesign

Tests conducted to reduce air and energy requirements in the biological process showed the presence of deficiencies in the aeration system of the San Pedro del Pinatar wastewater treatment plant, and this section develops the improvements that were necessary to resolve them, including the redesign of the aeration equipment and the installation. The stages for the selection of the equipment have been followed:
1st: Actual aeration requirements were calculated for the actual values of flow and organic load entering the WWTP (Table 2).
Oxygen requirements were obtained from the calculation recommendations of ATV 131-2000 [43] for average plant operating conditions (Table 3 and Table 4).
2nd: Once the required oxygen flow and the working point of the aeration equipment were established, the new aeration equipment was dimensioned, and different technologies available in the market that could also contribute to an advantage in the maintenance operation were evaluated [44]. Table 5 shows the average consumption of the different blowers according to the power of the installed motor and shows the consumption according to the power absorbed by the motor.

3. Results and Discussion

3.1. Step 1. Reduce air requirements

3.1.1. Results of Tests to Select the Best Operating Conditions

This first point was dealt with in the optimization phase I [1], which consisted of selecting the best-operating conditions for the biological reactor or the optimum values for the MLSS. As can be seen from equation (1), the transfer is maximum for CL = 0 and is zero when the saturation concentration in the reactor is reached under field conditions. Therefore, reducing the setpoint concentration from 2 mg/L to 1 mg/L allowed us to increase transfer efficiency by more than 5% and reduce energy requirements by more than 5% [45,46,47]. In addition to contributing to the increase in oxygen transfer rate by:
  • Increase in KL × α due to the reduction in liquid viscosity [48,49,50,51,52,53,54] and the lower content of organic substances [6], which substantially affect the composition of the mixed liquor in the biological reactor and, therefore, the oxygen transferred [55,56,57].
  • Reduce the oxygen concentration required in biological reactors. Experimental studies by Henkel et al. [51] and Cornel et al. [58] have shown that the values of α decrease significantly as the concentrations of volatile suspended solids in the mixed liquor (MLVSS) increase, resulting in an approximately linear relationship between the two.

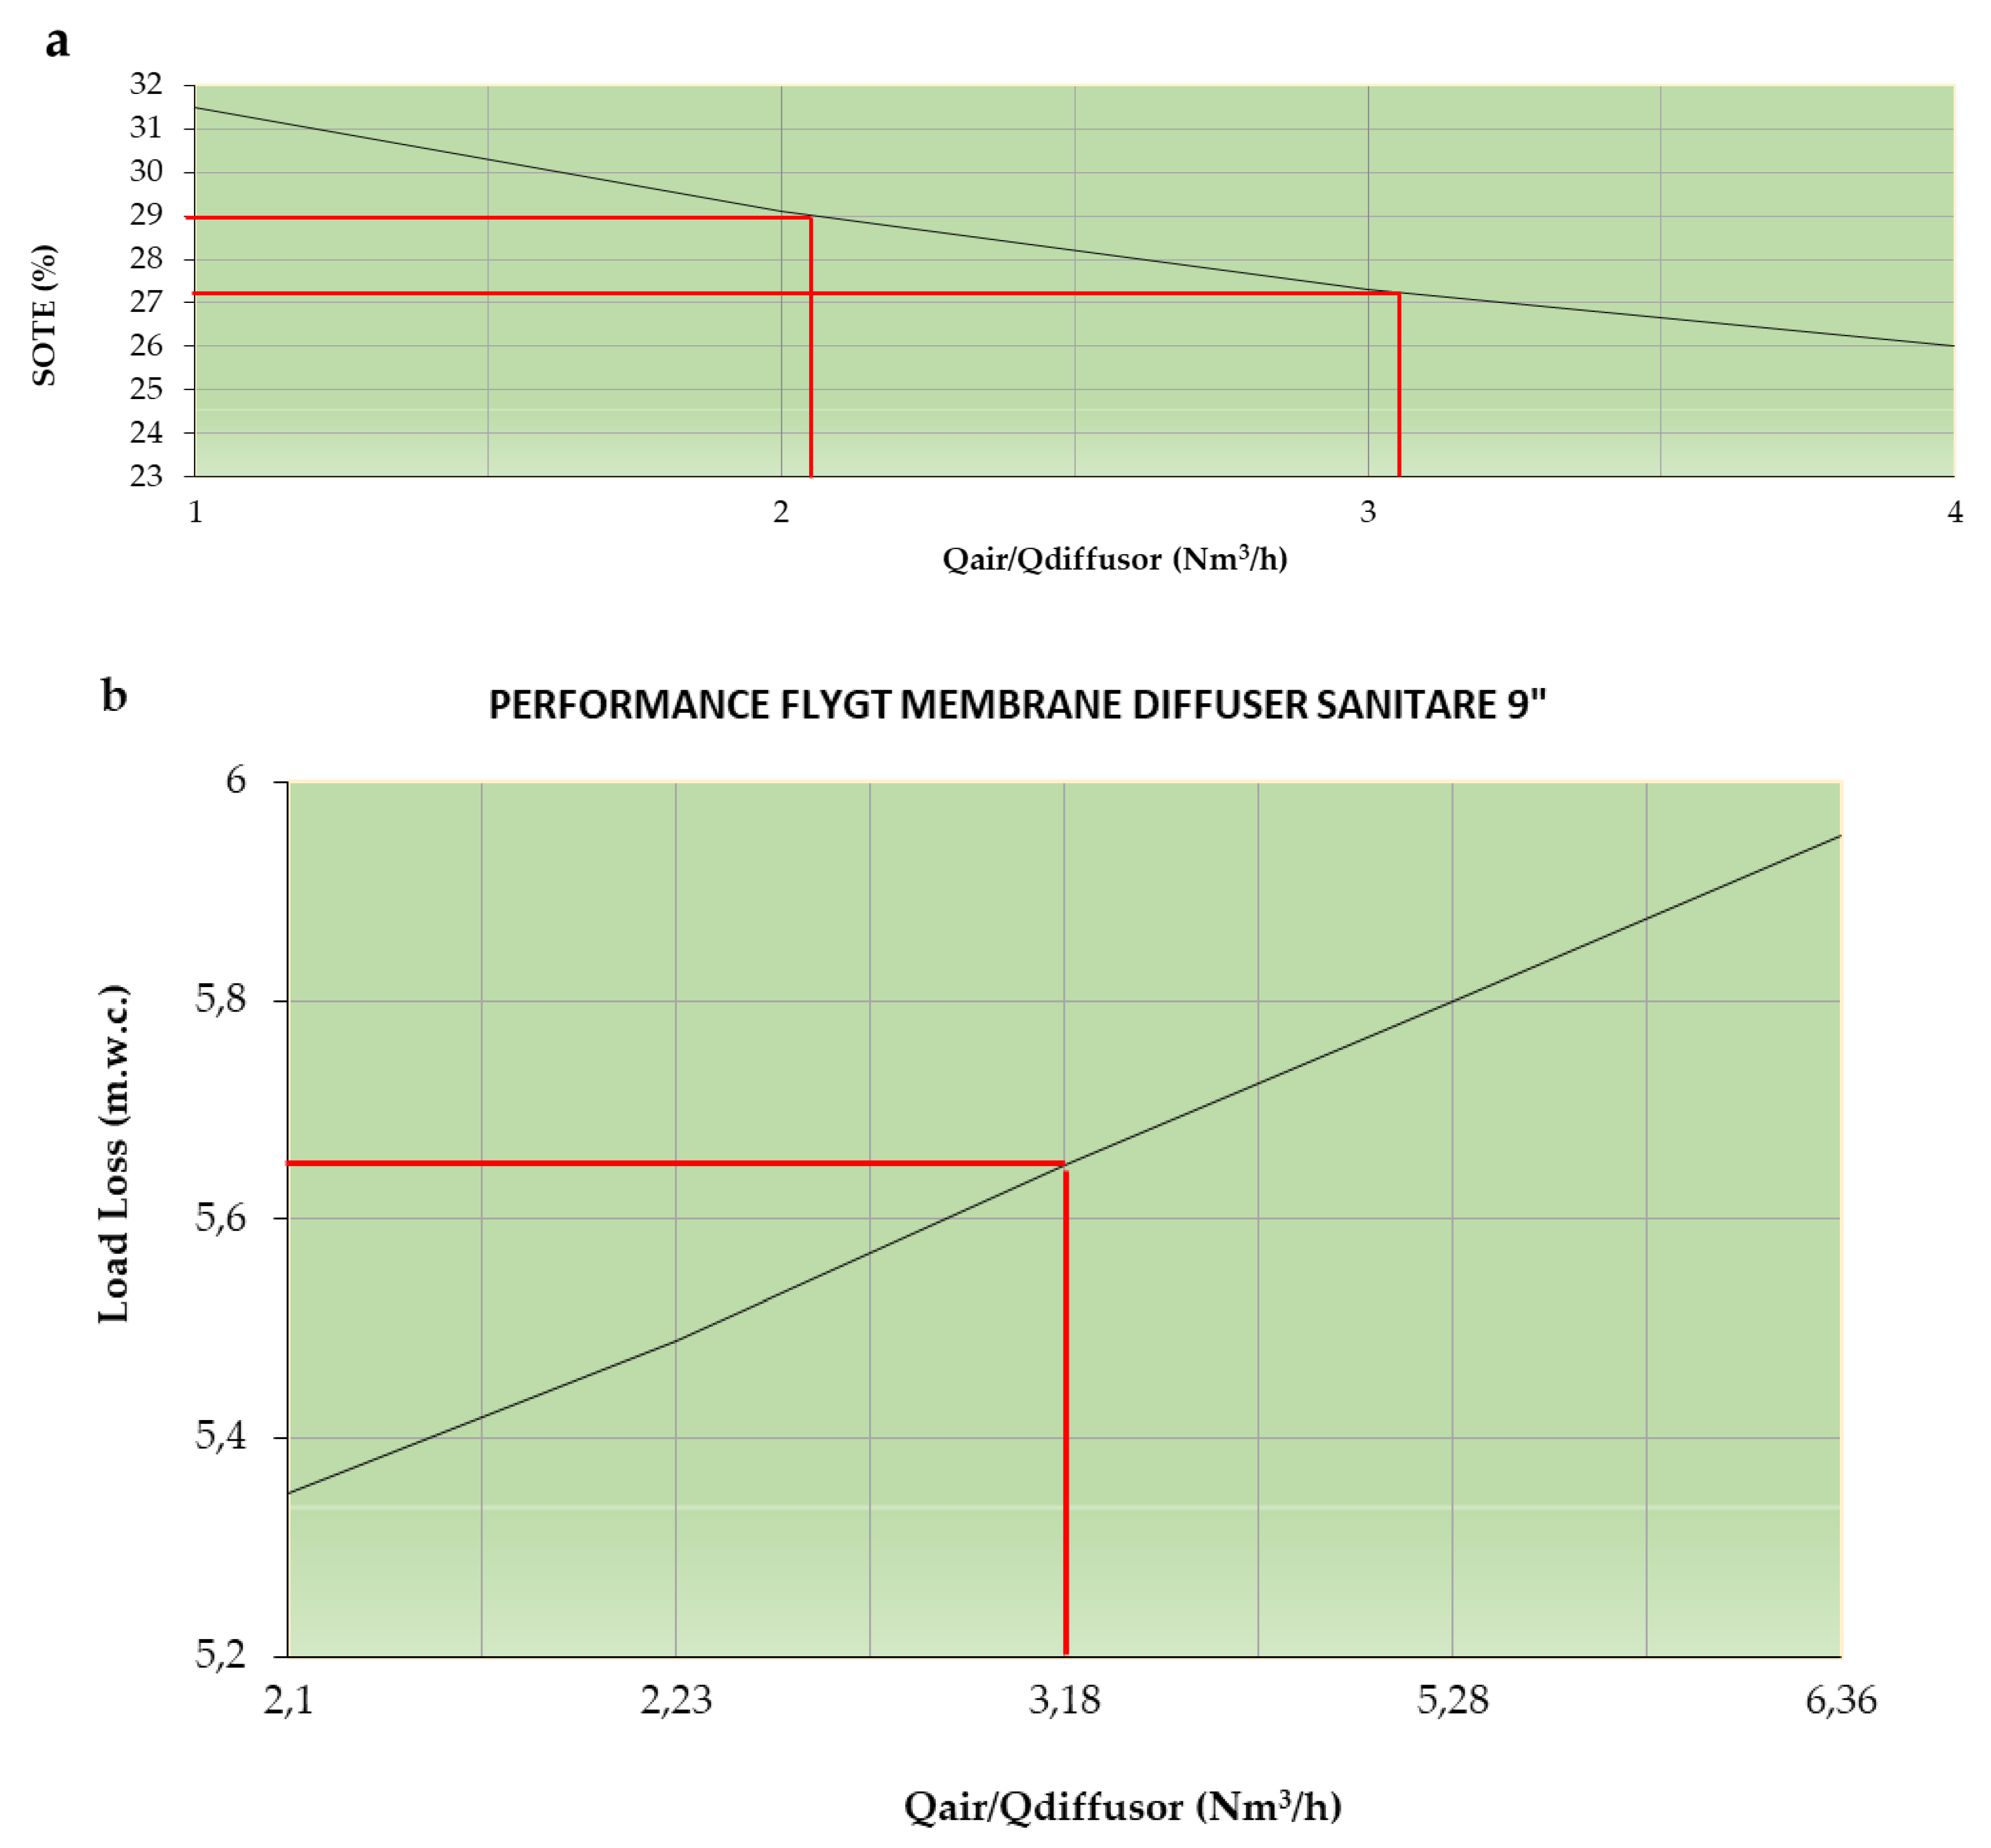
3.1.2. Results of Tests to Regulate the Airflow Injected through the Diffusers

The SOTE results obtained for a blower operating at 33 Hz and 50 Hz, corresponding to the first two blower operating scenarios according to Table 1, are compared with a biological reactor in operation. According to these data, if the blower is operated at 33 Hz instead of 50 Hz, there is a 6.21% increase in oxygen transfer efficiency, obtained from Figure 2a. As the amount of oxygen transferred increases by 6.21%, the flow of air to be supplied will be reduced by 6.21%, and in addition, there will be a decrease in the consumption of electrical energy necessary to supply the kg of O2 required for wastewater treatment.
The air diffusion elements installed in the biological reactor of the San Pedro del Pinatar WWTP are diffusers with old EPDM membrane technology, with non-flat performance curves, so that small upward fluctuations in the flow that has just been fed to each diffuser cause the generation of thicker bubbles and an increase in pressure drop, decreasing the SOTE value. Therefore, it is important to work with blowers at the lowest possible frequency, which will have lower flow per diffuser and higher transfer efficiency.
In addition to an increase in oxygen transfer efficiency, working with lower airflows will cause a decrease in the pressure drop, obtained from Figure 2b. The change from working with a single biological reactor fed by a 50 Hz blower to working with a 33 Hz blower reduces the overall system pressure drop by 5.31%. The aeration consumption is reduced by 5.31%, which in no case can be negligible when a serious optimization study of an aeration system is carried out. The aeration energy consumption of the biological reactor decreased by more than 11.52% when a 33 Hz blower was used instead of a 50 Hz blower.

3.1.3. Results of Tests to Determine the Age and Condition of Air-Injection Components

According to the information available from the installation, the membranes of the diffusers had never been replaced, and to determine the age and condition of the diffusers, three different types of experiments were carried out using the measurements provided by the gas extraction hood installed in the biological reactor of the San Pedro del Pinatar WWTP, described in the section on materials and methods.
a. Study of the influence of the operating frequency of the blowers.
The results obtained from the real SOTE parameter by using the off-gas hood in the biological reactor of the San Pedro del Pinatar WWTP, at the minimum operating frequency of the blower (33 Hz) and at the maximum frequency (50 Hz), regarding the theoretical SOTE values obtained from the diffuser performance curves provided by the manufacturers (Figure 2), show that the actual SOTE values are much lower than the theoretical yields that would be obtained according to the yield curve. For minimum frequencies, there is a loss of yield in the transfer of oxygen of more than 18% and for maximum frequencies, more than 21%.
It is essential to carry out the periodic measurement of the SOTE parameters in the biological reactor for the decision to replace the diffuser membranes or to predict their anomalous operating status.
The results obtained lead us to consider replacing the old diffuser membranes with standard EPDM technology with those of advanced Silver Series II high-efficiency formula.
b. Study of the agitation influence during aeration.
The SOTE measurements obtained by varying the agitator operation mode during biological aeration show that the lowest SOTE values occur when both agitators in the oxic chamber are operating, with an average 5% decrease in the SOTE value with respect to the absence of agitation (mode 3) in Figure 4.
The movement of the fluid caused by the agitation of the water during aeration in the biological reactor causes the dispersion of bubbles or an increase in the slip effect, making the oxygen bubbles not as readily available or assimilable by bacteria, reducing the oxygen residence time in the biological reactor and reducing the SOTE. Therefore, the need to modify the operation of the agitators located in the biological reactor is detected, limiting their start-up only when the biological aeration stops. In this way, we avoid the sedimentation of the biological bed, the appearance of dead spaces, and preferential paths within the reactor.
c. Study of the influence of the density of diffusers.
The SOTE values measured with the off-gas hood installed in the biological reactor as a function of the number or density of diffusers through which a fixed airflow flows are shown in Figure 5.
As can be seen in Figure 5, the density of the diffusers drastically influences the efficiency of oxygen transfer, with losses of up to 30% in the SOTE value when working with diffuser densities of 21.37% compared to densities of 49.57%. The reduction in airflow per diffuser, as it has a greater density of diffusers influences the convection currents generated by aeration, decreasing the ascent speed of the air bubbles and increasing the contact time between the phases, so that the oxygen transfer efficiency increases.
d. Study of the influence of cleaning diffusers with formic acid.
The control of the daily pressure in the air line as a tool to predict the fouling in the diffusers, led us to the chemical cleaning of the diffusers with formic acid in order to reduce the pressure in the line.
If we observe the initial measurements of SOTE, of 19%, obtained by means of the off-gas hood method for air flow rates provided by a blower operating at 33 Hz, and the measurements obtained after performing chemical clean with the inline injection of formic acid, we have an increase of more than 20% in the value of the SOTE measured after performing two chemical cleans. A third cleaning does not translate into a substantial increase in the SOTE, so this could be avoided, reducing the cost associated with chemical reagents, in addition to its consumption that could prematurely damage the membranes.
Proper control of the diffusion of the diffusers can result in energy savings and an improvement in the associated oxygen transfer of almost 10% with the performance of chemical cleaning.

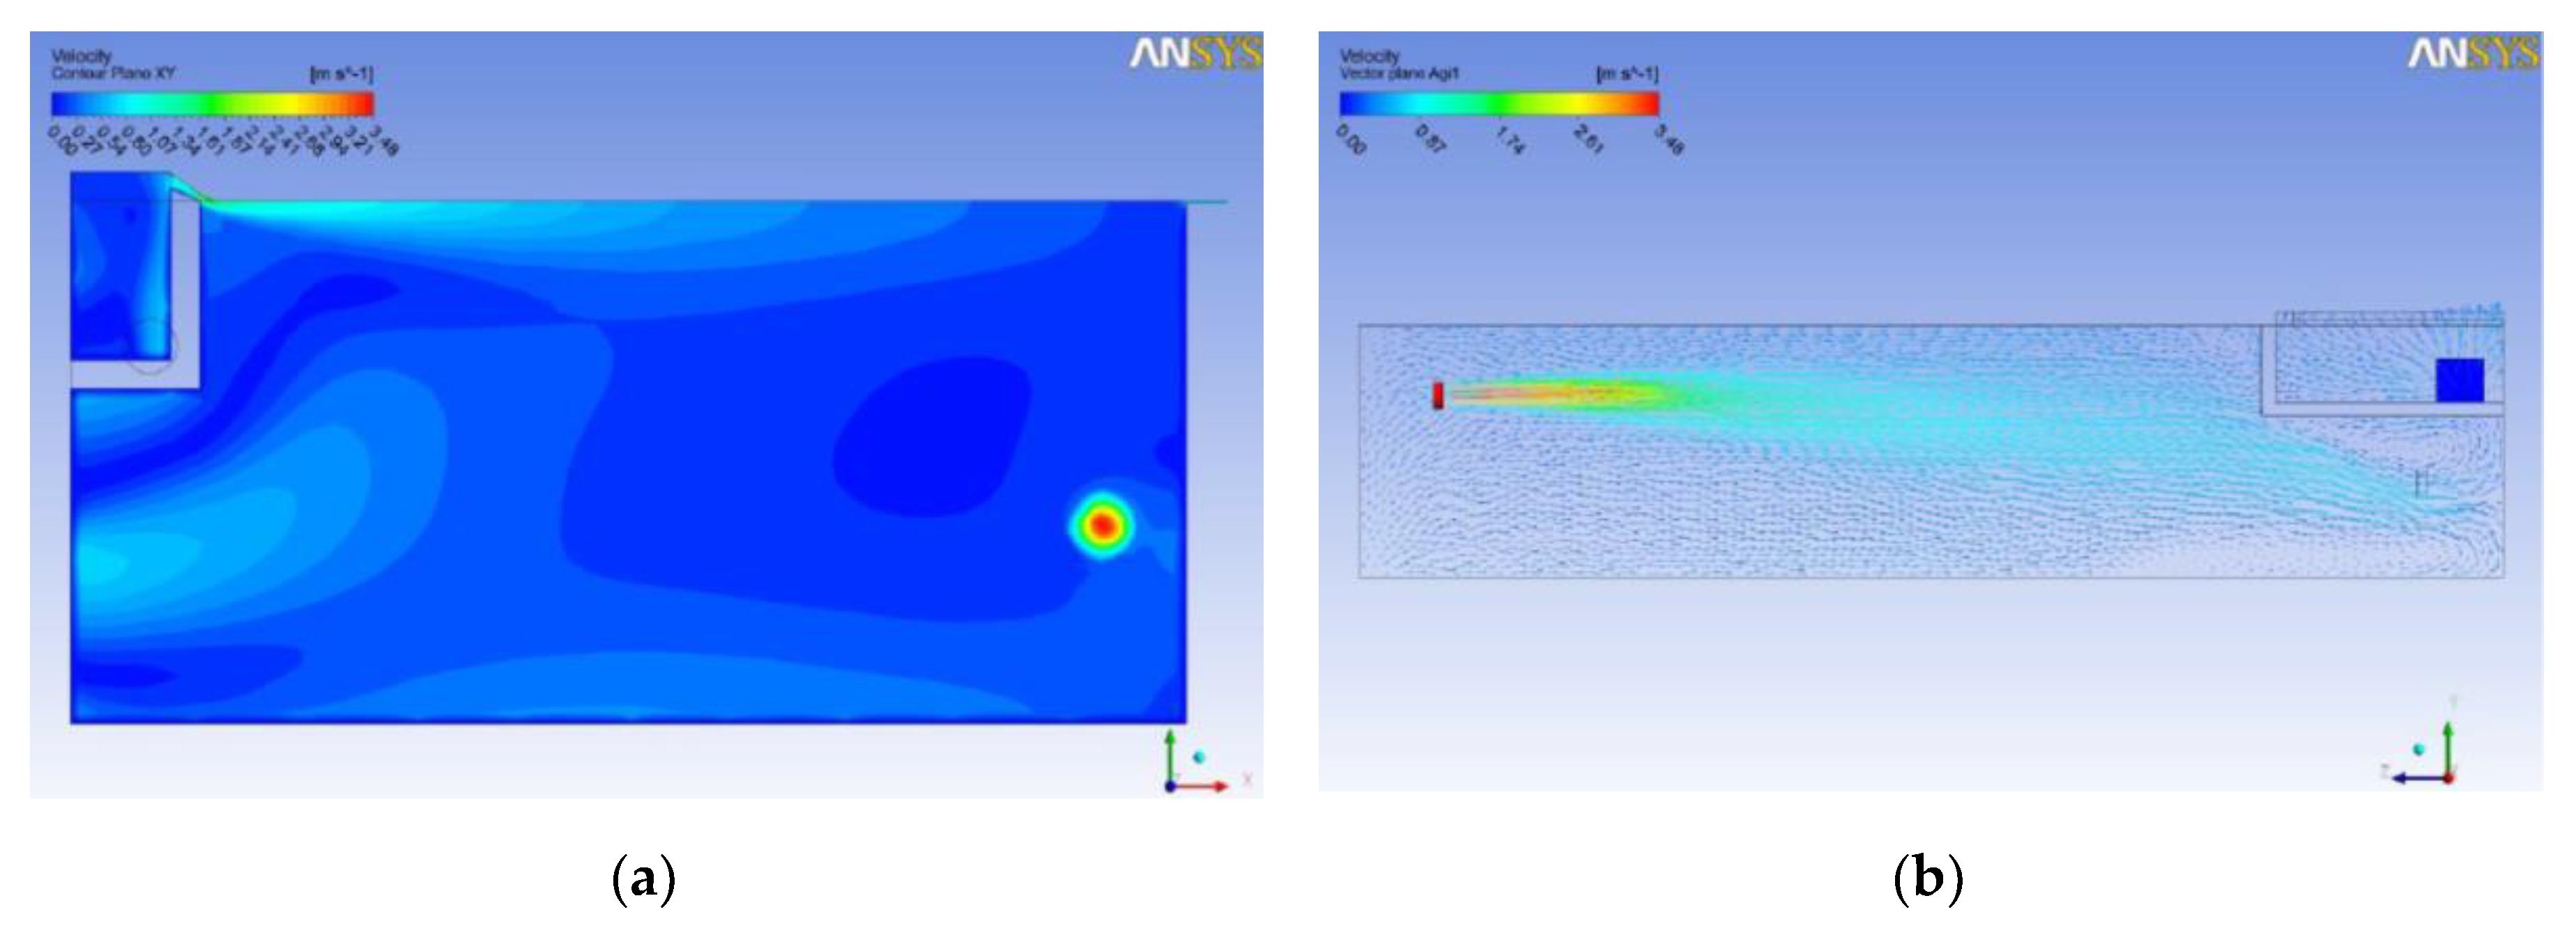
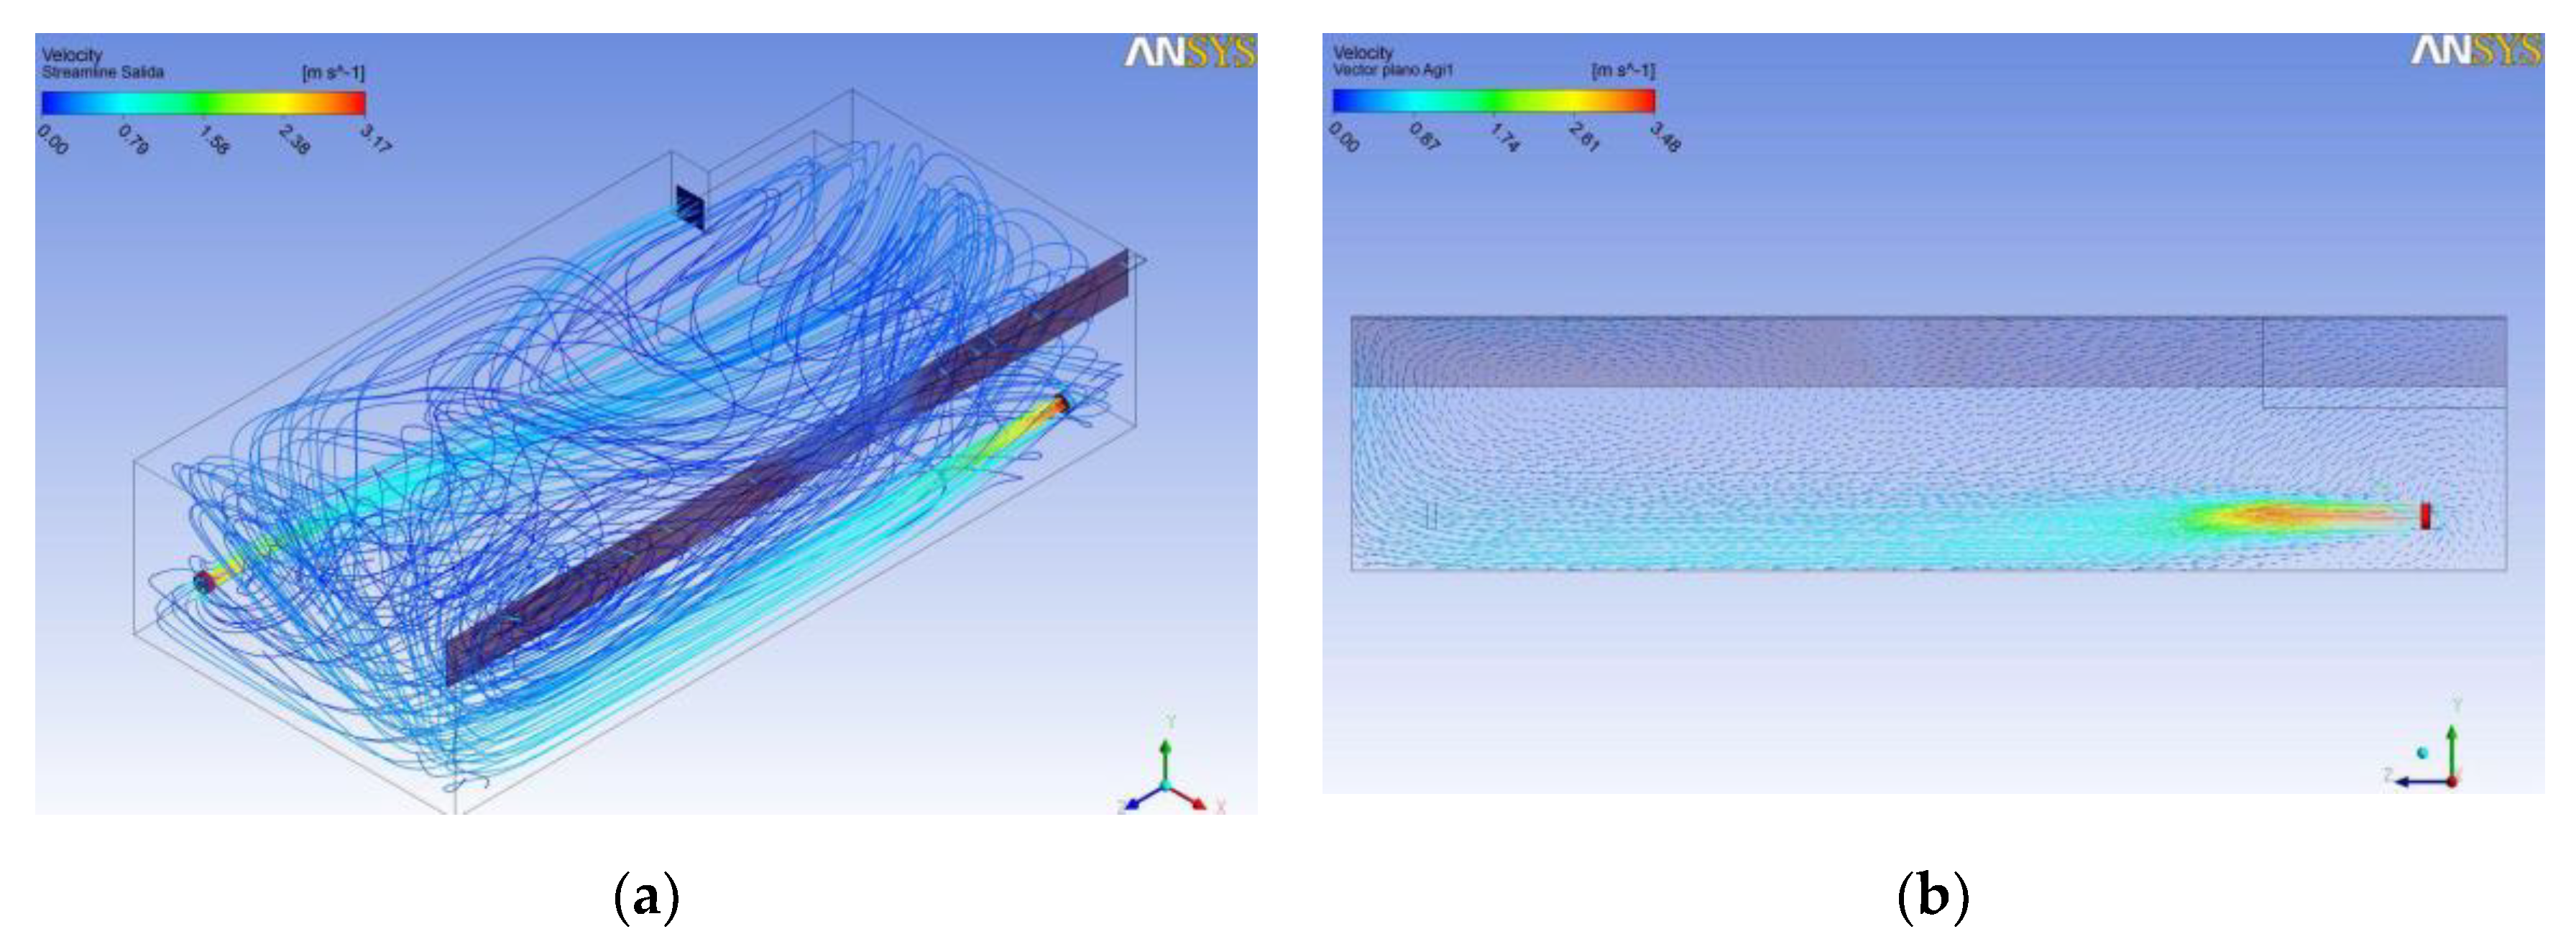
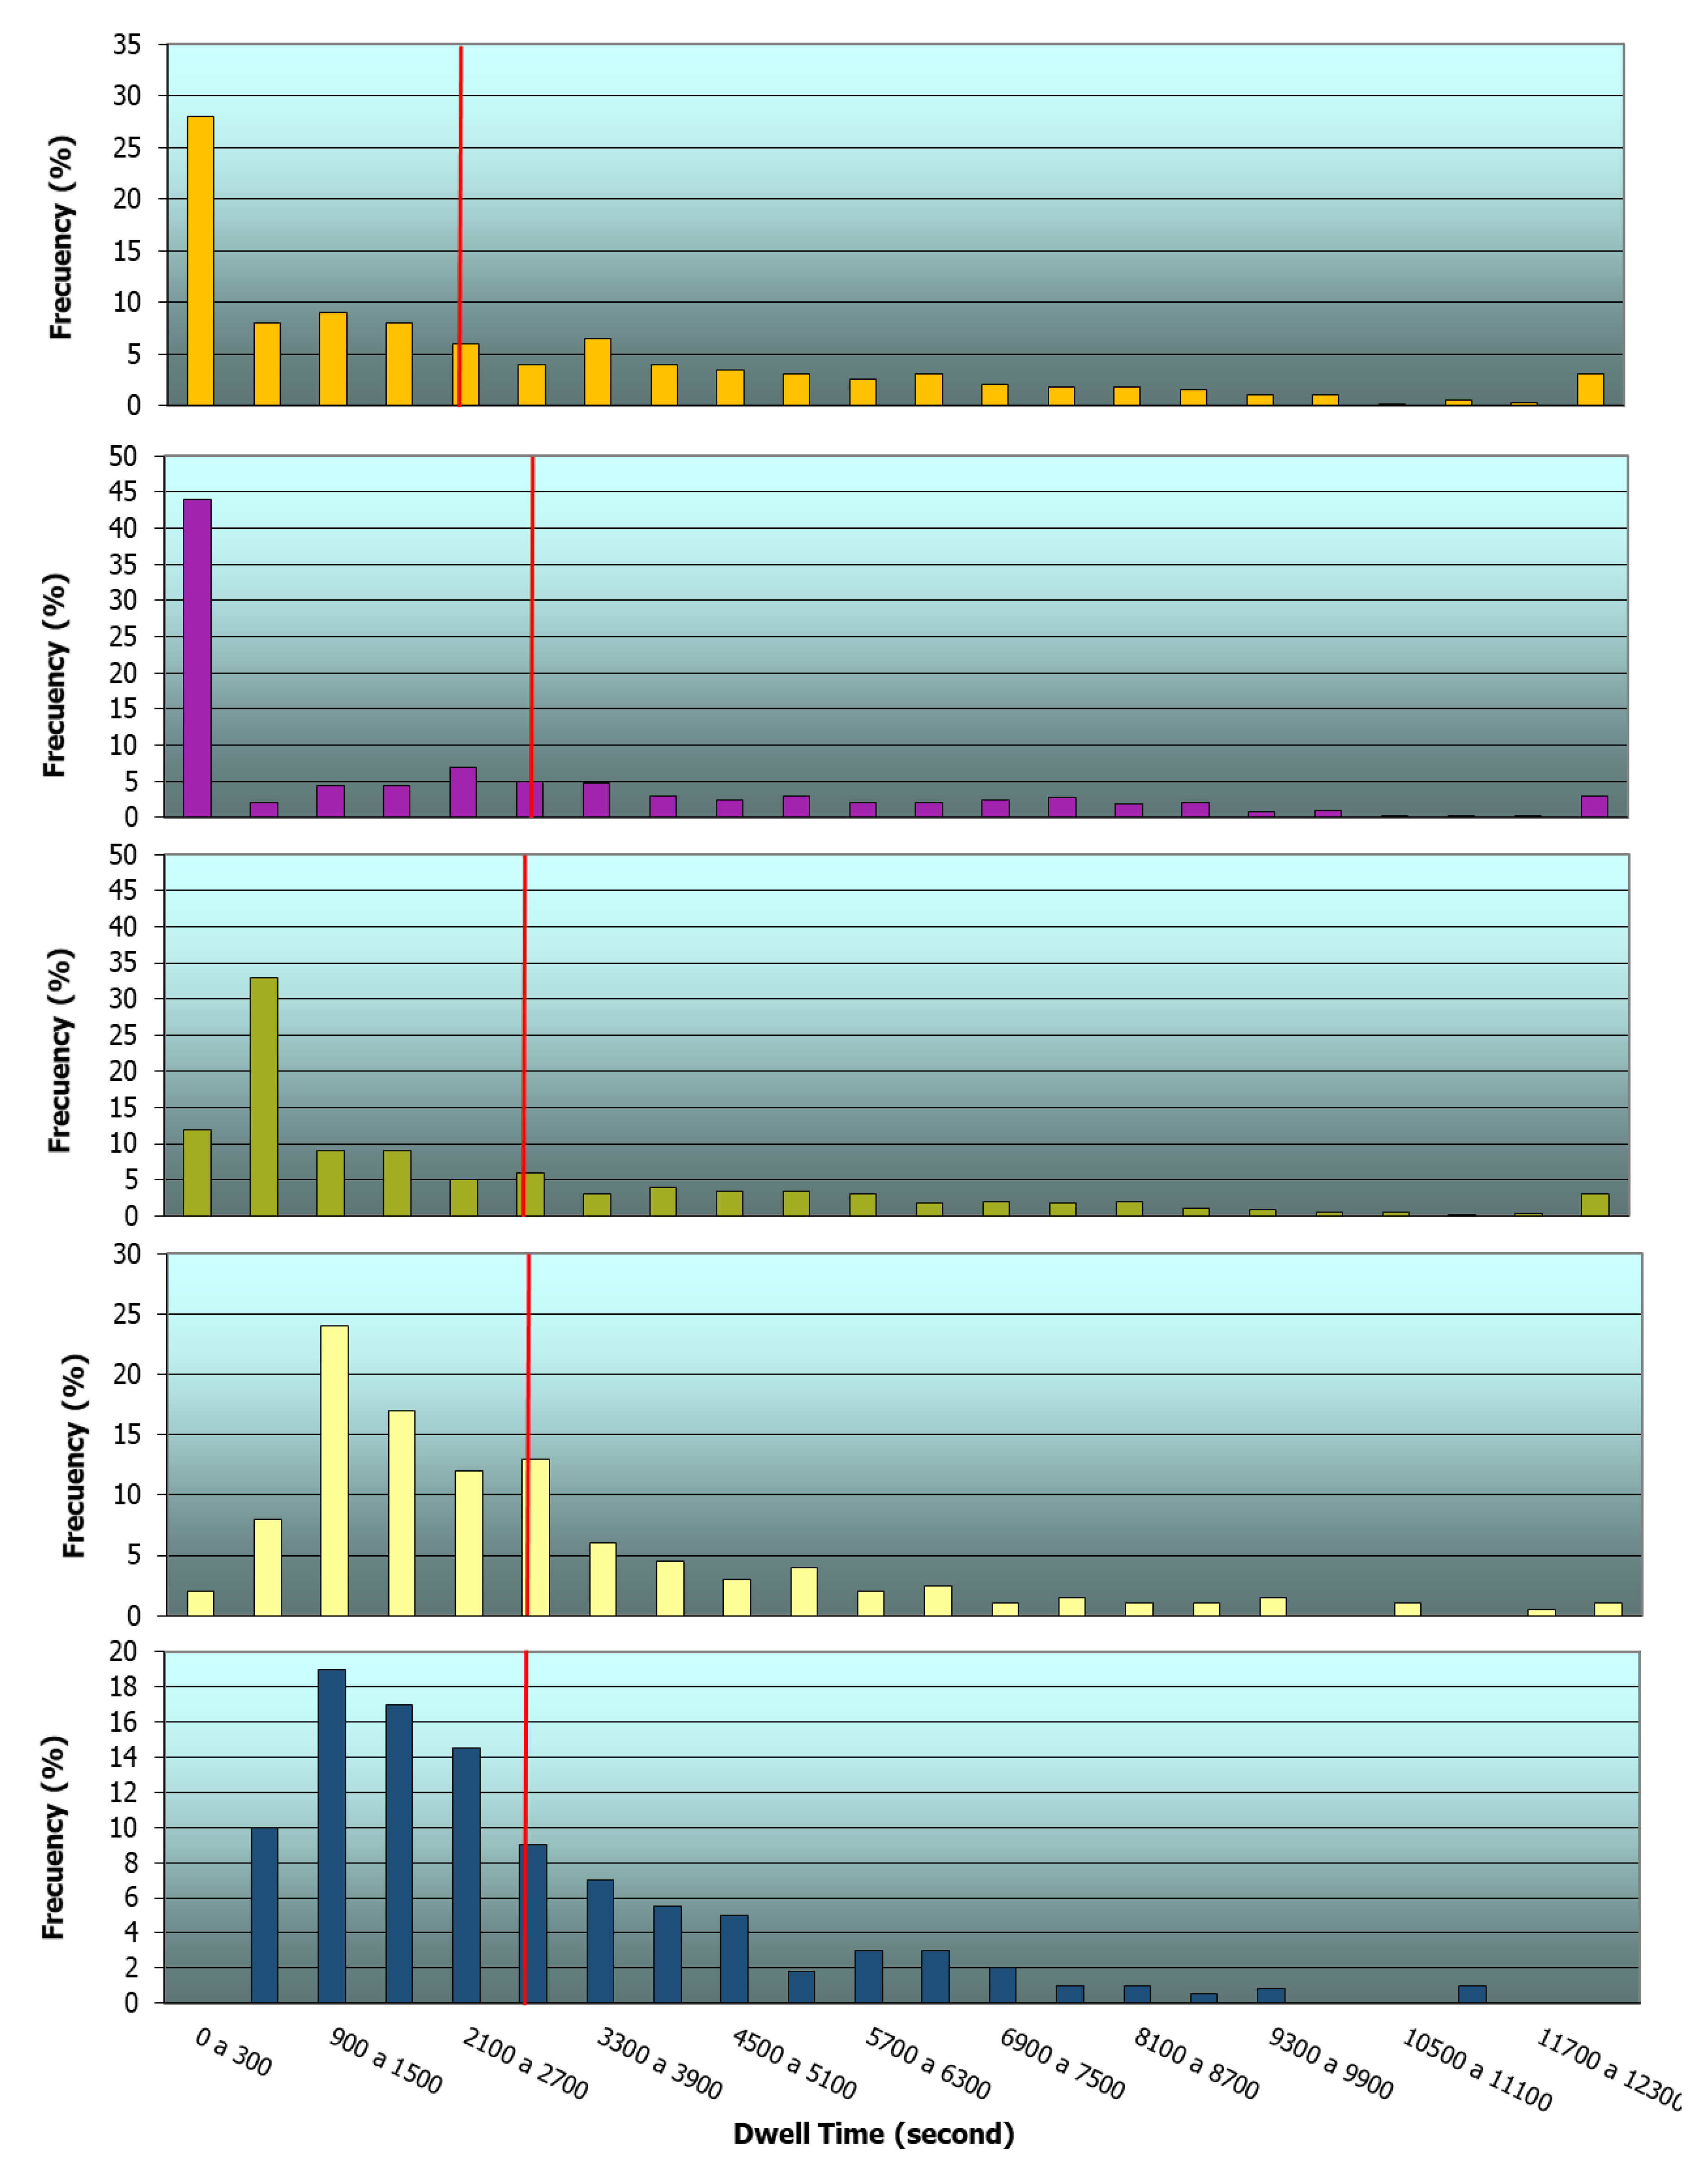
3.1.4. Results of the Hydraulic Tests to Know the Behavior of the Flows Inside the Biological Reactor

a. Study of current lines
Case 1: Front entry of the water through a window with agitation at maximum frequency. The behavior of the flow in real operating conditions, as expected, was very chaotic due to the effect of the agitators, creating a rotation of water with higher speeds at the periphery of the chamber and decreasing speeds towards the central zone [59] (Figure 6).
Case 2: The operating speed of the agitators was reduced to 40 Hz, and the flow behavior was very similar, decreasing the speeds as a consequence of the lower thrust, however, the effect of the preferential path on the surface was accentuated as a consequence of the lower level of agitation in the anoxic chamber.
Case 3: In the simulation, the geometry was changed, and the water was introduced through the side of the entrance box, the flow was even more chaotic. Due to the effect of the agitator 2, a new central current corresponding to the clockwise rotation of the current lines coming from the inlet was generated. Having changed the entrance, the surface preferential current established in cases 1 and 2 was no longer observed.
However, the elevated position of the other agitator located in this chamber (called agitator 1) caused an acceleration of the current lines in an upward direction in the final part of the outlet chute, which greatly favored the rapid exit of the current lines in that area.
Case 4: To counteract the effects detected in case 3, the level of agitator 1 had been lowered and a deflector had been placed along the output lip. This eliminated any possibility of a preferential path between entry and exit (Figure 7).
Case 5: If the situation of the previous case was maintained but the operating frequency of the agitators was reduced to 40 Hz, the flow behavior was very similar to case 4, decreasing the speeds as a consequence of the lower thrust.
b. Study of velocity isovolumes
On the basis of this study, the volume of the biological reactor with circulation speeds of less than 0.3 m/s, less than 0.15 m/s and 0.05 m/s were estimated [59], obtaining Table 6:
Table 6 shows that the percentage of the reactor with low speeds is higher than would be expected given the level of agitation in the chamber, a problem that increases as the frequency of the agitator operation decreases.
c. Study of residence time
The results obtained for the five cases studied were the following [59] (Figure 8):
Case 1: 29% of the residence times were between 0 and 300 s, which was a clear indication of a significant short circuit between input and output. This fact is related to what was observed in the study of the current lines.
Case 2: As already seen in the study of the current lines, in the second graph of Figure 8, the surface short circuit becomes more evident. 44% of the residence times were between 0 and 300 s, and there was a slight increase in the maximum and minimum residence time.
Case 3: There were important differences with respect to cases 1 and 2. Firstly, the percentage of residence times below 300 s decreased significantly from 29% in case 1 to 12% in case 3. The maximum and minimum values were closer to the average, and therefore, the residence time of the camera improved.
Case 4: A clear improvement in residence times was observed with respect to the previous cases. The percentage of residence times of less than 900 s had decreased sharply, and that of less than 300 s was close to zero. The highest percentage of residence times was found to be between 900 and 1500 s. This value was still relatively far from the average value but was much better than in the previous cases.
Case 5: There had been a slight improvement in the residence times with respect to case 4. The percentage of residence times between 300 and 900 s had increased and that of less than 300 s had decreased to zero. The percentages for the three intervals between 900 and 2700 s had become very similar. The range of time values had become even shorter, as demonstrated by the maximum and minimum values.
The experimental models obtained together with the existing theoretical models provided us with a deep knowledge of the behavior of the fluids inside the reactor and allowed us to analyze and modify the hydrodynamics and the shape of the RTD curve by introducing changes inside the reactor [34] and predicting the results obtained without having to implement them in the reality of the installation [35,36,37]. The results obtained indicated several aspects subject to improvement that could contribute to energy reduction: Changing the flow of input into the biological reactor to avoid preferential paths and reduce the frequency of operation of the agitators

3.2. Step 2. Reduce Energy Requirements in the Biological Process

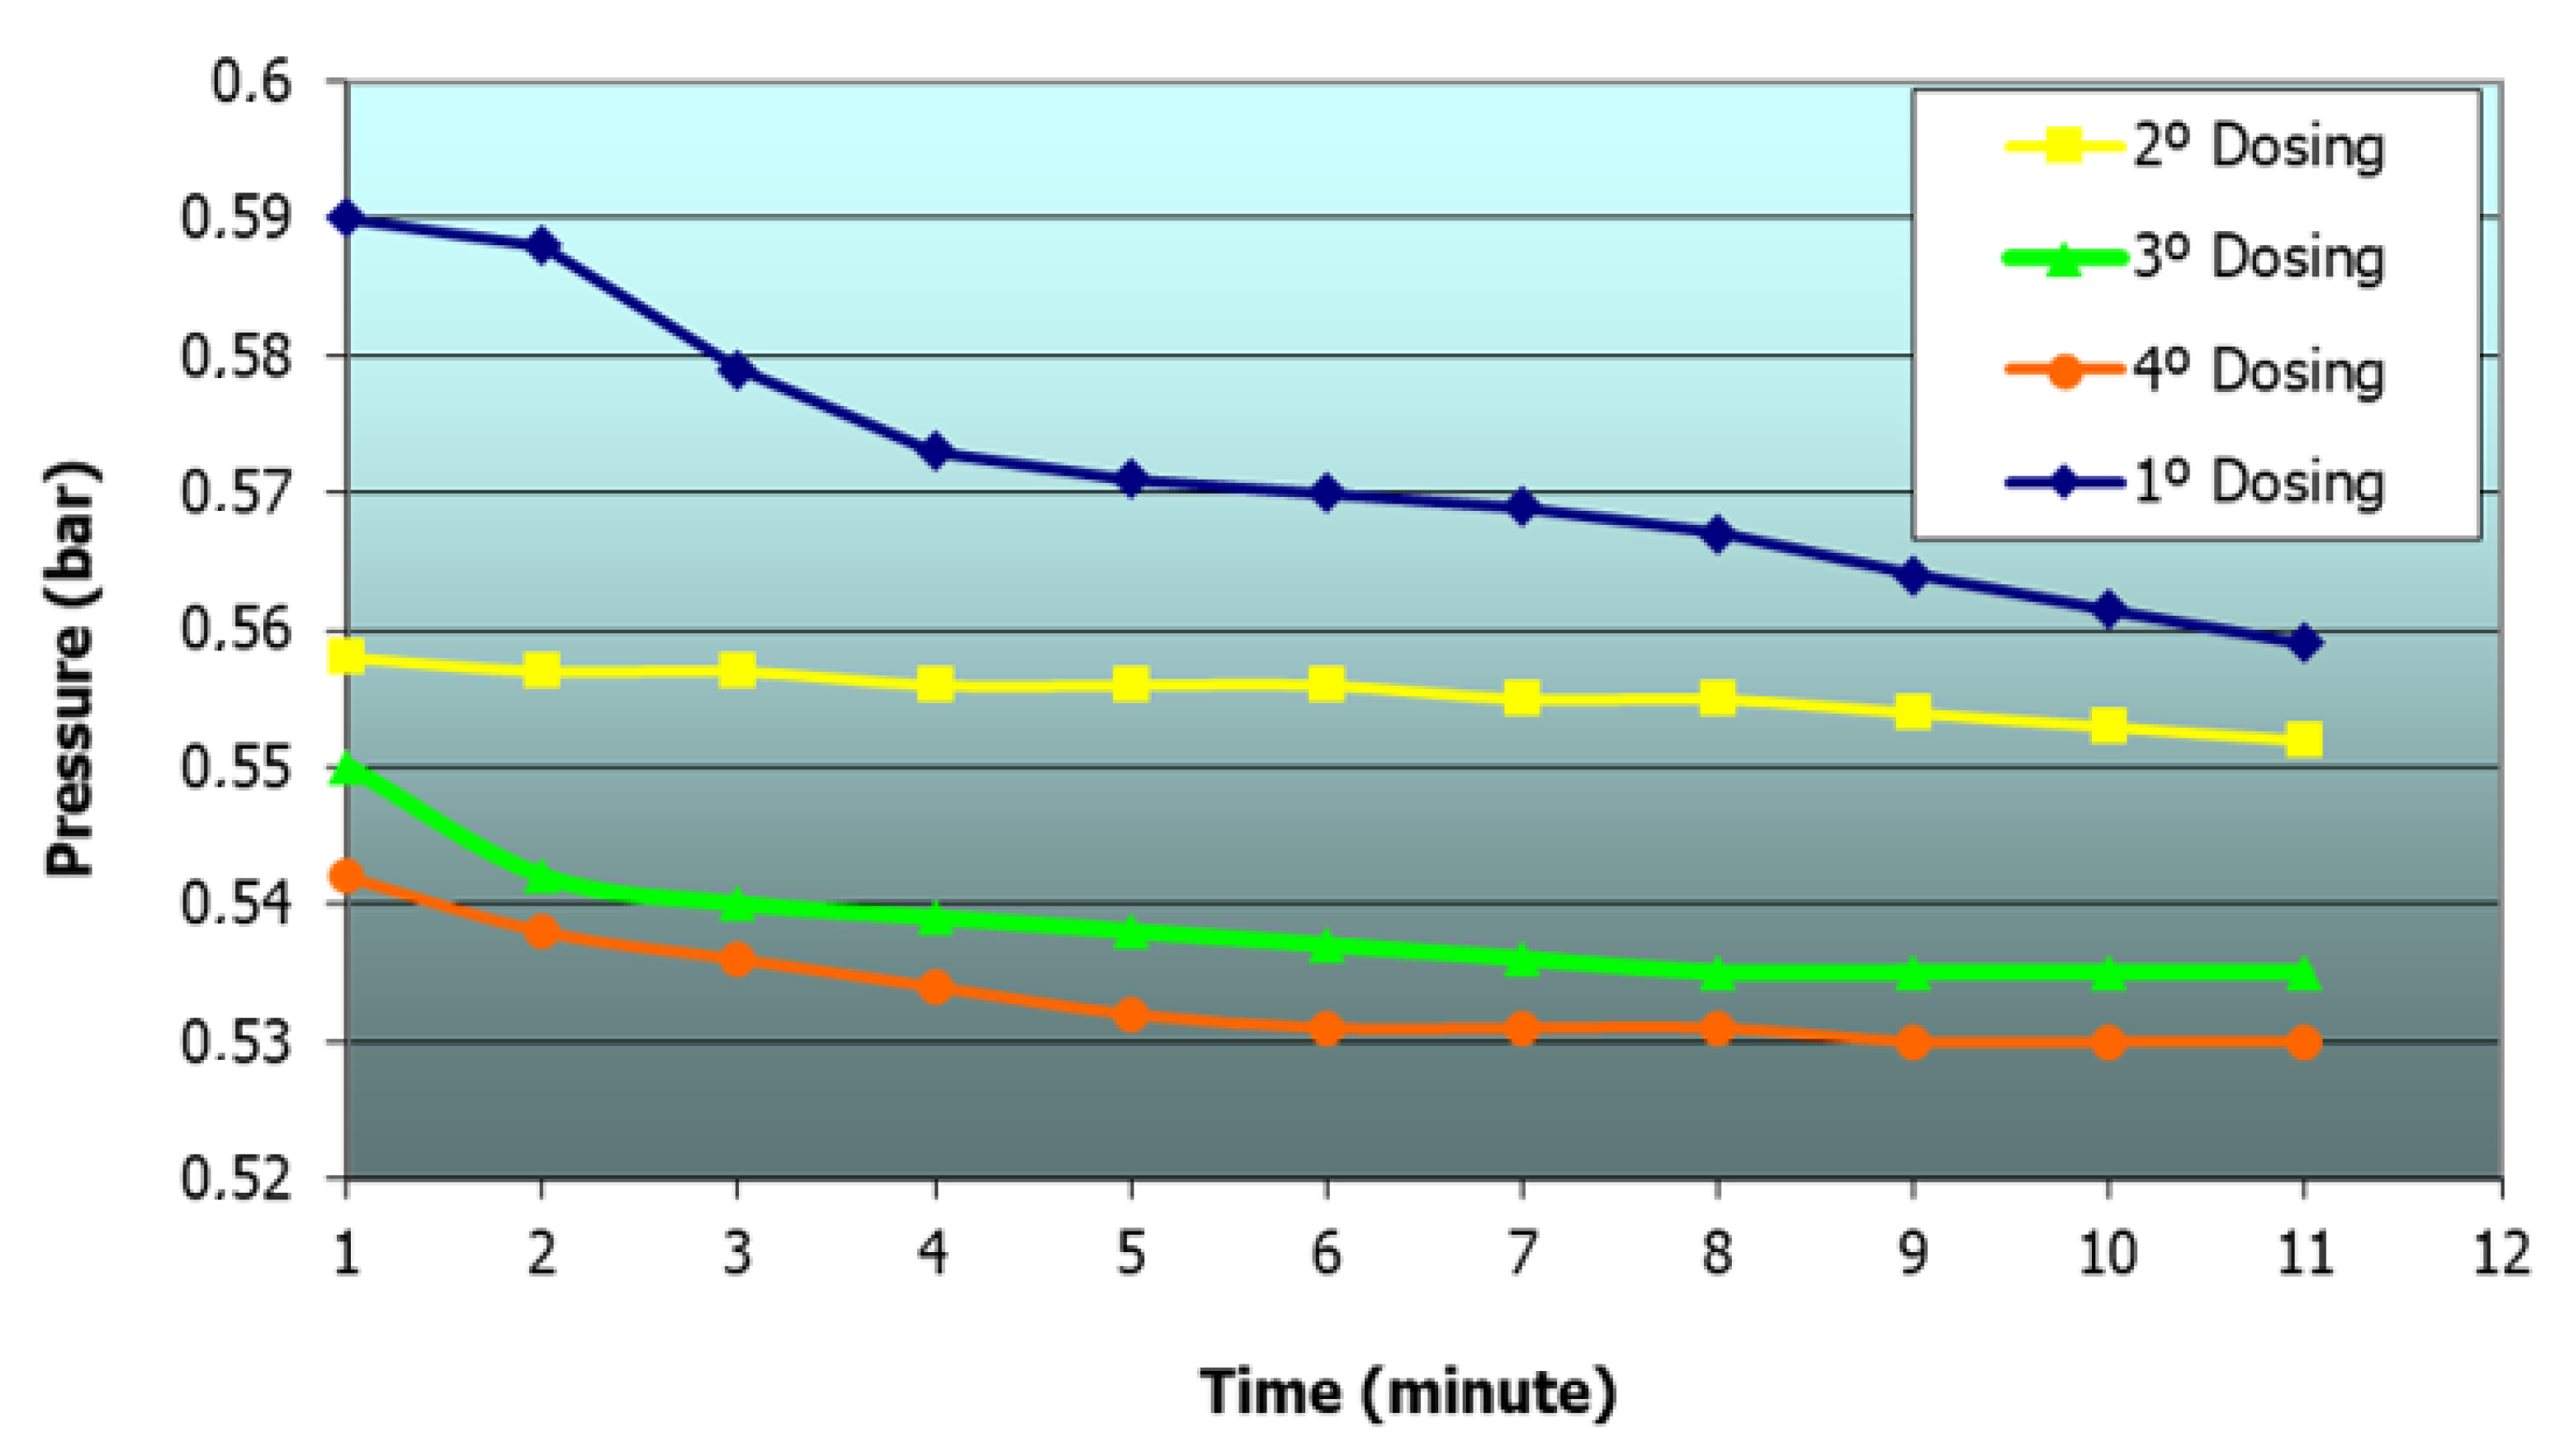
Results of the Tests for the Pressure Drop Detection in the Network of Pipes and Air Injection Elements

The periodic reading of the pressure in the air line in the initial conditions, as a function of the airflow injected, was in the range of pressures between 0.56–0.6 bar. Taking into account the height of the immersion of the diffusers of 4.8 m and the pressure losses in the pipe and branches calculated from tables, the expected line pressure should not exceed 0.53 bar, so the presence of energy loss was evident, due to pressure losses in the air line.
The first action proposed to reduce pressure losses along the air line was to carry out periodic chemical cleaning with formic acid and mechanical cleaning of the aeration diffusers [32], obtaining reductions in a pressure loss of 5% for a single chemical cleaning and 10% for repeated acid dosing (Figure 9), and a reduction in energy consumption of up to 7.6% (Figure 10).
The results obtained indicated the importance of implementing a pressure drop control system in the aeration line, with cleaning reagent dosing for the diffusers.

3.3. Step 3. Equipment Redesign

The next step in the methodology followed for the optimization of energy was the development of a series of improvements to the installation to resolve the deficiencies detected, which consisted of:
  • The optimization of the operating conditions in the biological reactor, with considerable reductions in the concentration of solids in the biological reactor and, therefore, the concentration of solids in the membrane chamber of the MBR system, favored the reduction of the mixed liquor recirculation coefficient at the reactor inlet by half, with a 50% reduction in the pumped flow. This allowed us to replace one of the existing 37 kW drive units with a 22 kW one, to adapt the unit to the new conditions and work at the optimum point of its efficiency curve [60,61,62].
  • Replace the deteriorated diffusion membranes, with standard EPDM technology, with advanced formula diffusers of high-efficiency Silver Series II. This replacement increased the SOTE value by up to 3%, with specific reductions in the total injected airflow of about 12% [63].
  • Enable a side entry into the biological reactor, equipped with a control gate, which eliminated the preferential path in the reactor anoxic chamber and improved the internal distribution of flows in the chamber [61,62].
  • Optimize the distribution of the flows along the biological reactor, for this purpose:
    • Agitators were installed in the No. 2 oxic chamber of both reactors. The new agitation equipment installed is of permanent magnetization and improved hydraulics to increase its efficiency in terms of thrust (N/kWh). That is, to provide the same thrust (measured in Newtons) with much less power and, therefore, with lower energy consumption.
    • The operating cycles of the agitators were modified. The aim is to achieve homogenization of the mixed liquor by avoiding the disturbances produced by the agitators in the aeration that lead to over-consumption.
    • An automatic control system for pressure loss in the air line was incorporated into the biological reactor with a continuous cleaning system for the diffusers by automatically dosing formic acid into the air line.
  • A new air production equipment model ZS55 by ATLAS COPCO® (Nacka, Sweden) oil-free positive displacement screw technology was installed, which, combined with the existing blowers, provided a nominal airflow sufficient to fully cover the oxygen requirements of the process under minimum, medium, and maximum flow, and contaminant load conditions. The new screw blower provided energy savings of up to 30% and maximum reliability by operating in the best-performance range (80–100%) and reductions in maintenance costs due to lower vibration, lower heat dissipation, etc. [64].
  • As an overall optimization measure, an advanced control system was developed and implemented for the management of the activated sludge biological aeration stage and the membrane biological reactor aeration stage, specific for the San Pedro del Pinatar WWTP, but extrapolated to any type of WWTP, which integrated all the fundamental variables measured automatically in the biological reactor (MLSS, oxygen concentration, SOTE, airline pressure, control parameters of the treated water quality, etc.) whose signals are collected in the plant PLC [65,66,67]. This control system is developed in phase III of the proposed methodology to achieve energy optimization of the aeration stage in the WWTP.

3.4. Result of the Study on WWTP Final Energy Consumption

At the beginning of this study, the average specific energy consumption of San Pedro del Pinatar WWTP was around 1.03 kW/m3 [1]. After the first optimization phase of the proposed methodology, energy consumption decreases to values around 0.83 kW/m3 [1], and at the end of the second optimization phase, the energy consumption reached values around 0.67 kW/m3.

4. Conclusions

Although the conclusions have been developed with the results, in the following lines, a brief summary of them is established.
The control of the parameters that directly influence the rate of SOTE in the biological reactor and the use of advanced flow modeling techniques that detect and correct deficiencies in the distribution and mixing of fluids can reduce the airflow supplied to the reactor by more than 3 %. This efficiency is obtained by:
replacing deteriorated diffusers with more efficient injection technologies,
adjusting the airflow injected in each diffuser to the optimum established in performance tables,
reducing the pressure losses in the aeration line, by adjusting the flows and working pressures, and automatic elimination of the existing incrustations,
modifying the water entry point into the biological reactor, and installing agitation equipment in chambers lacking them, which allows eliminating preferential paths and dead zones, and
reducing the external recirculation coefficient.
The important reductions achieved in the airflow required the incorporation of new aeration equipment adapted to the real needs. It offered energy savings of around 33%, as well as a reduction in maintenance costs and an increase in the reliability of the aeration installation. The selected technology, 55 kW positive displacement screw blower, combined with the rest of the existing blowers in the installation, with 110 kW power, made it possible to fully cover the oxygen needs required under minimum, average, and maximum conditions of flow and inlet load to the WWTP.
The significant reductions achieved in the average specific energy consumption of the San Pedro del Pinatar WWTP in the different optimization phases have allowed us to achieve a reduction of more than 35% in the overall energy consumption of the facility and more than 20% specifically in the optimization phase described in this article. If we consider an average energy price of 0.11 euros/kWh and an average flow treated at the WWTP of 7000 m3/day, the savings in operating costs are almost 104,000 euros/year and the reduction in CO2 emissions is about 950 kg/year. These are very interesting results from the point of view of the importance of energy efficiency for the optimization of operating costs, the contribution to European energy policy in which it is intended to promote energy efficiency and energy savings, and in the framework of achieving compliance with the Sustainable Development Objectives.

Author Contributions

Conceptualization, A.B.L.A., M.L.P.D.R. and F.D.C.V.; methodology, A.B.L.A., M.L.P.D.R. and F.D.C.V.; validation, M.L.P.D.R. and F.D.C.V.; formal analysis, A.B.L.A., M.L.P.D.R. and F.D.C.V.; investigation, A.B.L.A., M.L.P.D.R. and F.D.C.V.; resources, M.L.P.D.R. and F.D.C.V.; data curation, A.B.L.A., M.L.P.D.R. and F.D.C.V.; writing—original draft preparation, A.B.L.A. and M.L.P.D.R.; writing—review and editing, M.L.P.D.R. and F.D.C.V.; visualization, M.L.P.D.R. and F.D.C.V.; supervision, M.L.P.D.R. and F.D.C.V. All authors have read and agreed to the published version of the manuscript.

Funding

This research received no external funding.

Acknowledgments

My sincere thanks to the members of the Public Water Sanitation Organization of the Region of Murcia (WSERM), and especially to Pedro J. Simón Andreu, technical director of WSERM and industrial engineer, for allowing the use of all the information obtained from the trials for the optimization of the WWTP of San Pedro del Pinatar carried out during my plant management, which has been crucial for the preparation of the article.

Conflicts of Interest

The authors declare no conflict of interest.

References

  1. Lozano, A.B.; del Cerro, F.; Llorens, M. Methodology for Energy Optimization in Wastewater Treatment Plants. Phase I: Control of the Best Operating Conditions. Sustainability 2019, 11, 3919. [Google Scholar] [CrossRef] [Green Version]
  2. Bakker, A.; Smith, J.M.; Myers, K.J. How to disperse gases in liquids. Chem. Eng. 1994, 101, 98–102. [Google Scholar]
  3. Gogate, P.R.; Beenackers, A.A.; Pandit, A.B. Multiple-impeller systems with a special emphasis onbioreactors: A critical review. Biochem. Eng. J. 2000, 6, 109–144. [Google Scholar] [CrossRef]
  4. Rosso, D.; Stenstrom, M.K.; Larson, L.E. Aeration of large-scale municipal wastewater treatment plants: State of the art. Water Sci. Technol. 2008, 57, 973–978. [Google Scholar] [CrossRef]
  5. Zhiyong, Z.; Dongdong, S.; Jing, L.; Xiaobei, Z.; Minjie, G. Improving oxygen transfer efficiency by developing a novel energy-saving impeller. Chem. Eng. Res. Des. 2018, 130, 199–207. [Google Scholar] [CrossRef]
  6. Rosso, D.; Stenstrom, M.K. Surfactant effects on α-factors in aeration systems. Water Res. 2006, 40, 1397–1404. [Google Scholar] [CrossRef] [PubMed]
  7. Henkel, J.; Cornel, P.; Wagner, M. Oxygen transfer in activated sludge—New insights and potentials for cost saving. Water Sci. Technol. 2011, 63, 3034–3038. [Google Scholar] [CrossRef] [PubMed]
  8. Åmand, L.; Olsson, G.; Carlsson, B. Aeration control—A review. Water Sci. Technol. 2013, 67, 2374–2398. [Google Scholar] [CrossRef] [PubMed] [Green Version]
  9. Tchobanoglous, G.; David Stensel, H.; Tsuchihashi, R.; Burton, F.; Metcalf & Eddy, Inc. Wastewater Engineering: Treatment and Resource Recovery; McGraw-Hill: Penn Plaza, NY, USA, 2013. [Google Scholar]
  10. Irizar, I.; Beltrán, S.; Urchegui, G.; Izko, G.; Fernández, O.; Maiza, M. Lessons learnt from the application of advanced controllers in the Mekolalde WWTP: Good simulation practices in control. Water Sci. Technol. 2014, 69, 1289–1297. [Google Scholar] [CrossRef] [PubMed]
  11. Olsson, G. Measurement and control in chemical and environmental engineering. In Proceedings of the International Scandinavian Congress on Chemical Engineering (Kem-Tek 3), Copenhagen, Denmark, 28–30 January 1974. [Google Scholar]
  12. Rancaño, A. Energy optimization of sludge treatment at Ceutí WWTP: Aeration control by means of an adaptive predictive expert control system (ADEX). In Proceedings of the V Technical Conference on Sanitation and Purification, Water Sanitation Organization of the Region of Murcia (WSERM), Murcia, Spain, 25–26 November 2009; pp. 1–59. Available online: http://www.esamur.com/historico (accessed on 20 July 2018).
  13. Le Moullec, Y.; Gentric, C.; Potier, O.; Leclerc, J.P. CFD simulation of the hydrodynamics and reactions in an activated sludge channel reactor of wastewater treatment. Chem. Eng. Sci. 2010, 65, 492–498. [Google Scholar] [CrossRef]
  14. Gresch, M.; Braun, D.; Gujer, W. Using reactive tracers to detect flow field anomalies in water treatment reactors. Water Res. 2011, 45, 1984–1994. [Google Scholar] [CrossRef] [PubMed]
  15. Glover, G.C.; Printemps, C.; Essemiani, K.; Meinhold, J. Modelling of water treatment plants-How far shall we go with sophisticated modeling tools? Water Sci. Technol. 2006, 53, 79–89. [Google Scholar] [CrossRef] [PubMed]
  16. Essemiani, K.; Vermande, S.; Marsal, S.; Phan, L.; Meinhold, J. Optimization of WWWTP units using CFD —A tool grown for real scale application. In Proceedings of the 2nd IWA Leading-Edge Conference on Water and Wastewater Treatment Technologies, Prague, Czech Republic, 1–4 June 2004. [Google Scholar]
  17. Samstag, R.W.; Ducoste, J.J.; Griborio, A.; Nopens, I.; Batstone, D.J.; Wicks, J.D.; Saunders, S.; Wicklein, E.A.; Kenny, G.; Laurent, J. CFD for wastewater treatment: An overview. Water Sci. Technol. 2016, 74, 549–563. [Google Scholar] [CrossRef] [PubMed]
  18. Wicklein, E.; Batstone, D.J.; Ducoste, J.; Laurent, J.; Griborio, A.; Wicks, J.; Saunders, S.; Samstag, R.; Potier, O.; Nopens, I. Good modelling practice in applying computational fluid dynamics for WWTP modelling. Water Sci. Technol. 2016, 73, 969–982. [Google Scholar] [CrossRef]
  19. United Nations Organization (UNO). Transforming Our World: The 2030 Agenda for Sustainable Development; A/RES/70/1; UNO: New York, NY, USA, 2015; pp. 1–41. Available online: https://sustainabledevelopment.un.org/content/documents/21252030%20Agenda%20for%20Sustainable%20Development%20web.pdf (accessed on 26 November 2018).
  20. Energy Strategy 2020. Available online: https://ec.europa.eu/energy/en/topics/energy-strategy-and-energy-union/2020-energy-strategy (accessed on 20 June 2018).
  21. Energy Strategy 2030. Available online: https://ec.europa.eu/energy/en/topics/energy-strategy-and-energy-union/2030-energy-strategy (accessed on 20 June 2018).
  22. Wang, H.; Yang, Y.; Keller, A.; Li, X.; Feng, S.; Dong, Y.-N. Comparative analysis of energy intensity and carbon emissions in wastewater treatment in USA, Germany, China and South Africa. Appl. Energy 2016, 184, 873–881. [Google Scholar] [CrossRef] [Green Version]
  23. Gil, M. Dynamic model of active sludge processes. Int. J. Numer. Methods Calc. Des. Eng. 1990, 6, 387–395. [Google Scholar]
  24. Simón Andreu, P.; Lardín, C.; Moreno, B.; Ponsoda, J.M.; Rancaño, A. Energy optimization of sludge treatment of the WWTP of Ceutí: Part I: Selection of operating conditions. Water Technol. 2010, 322, 54–63. [Google Scholar]
  25. American Society of Civil Engineers (ASCE). Standard Guidelines for in-Process Oxygen Transfer Testing (ASCE18) and Standards ASCE19; American Society of Civil Engineers: New York, NY, USA, 1996. [Google Scholar]
  26. German Association for the water environment. Standard ATV-M209 E. Measurement of the oxygen transfer in activated sludge aeration tanks with clean water and mixed liquor. In German ATV Rules and Standards; Publishing Company of ATV-DWA: Hennef, Germany, 1996. [Google Scholar]
  27. Rosso, D.; Iranpour, R.; Stenstrom, M. Fifteen years of off-gas transfer efficiency measurements on fine-pore aerators: Key role of sludge age and normalized air flux. Water Environ. Res. 2005, 77, 266–273. [Google Scholar] [CrossRef]
  28. Schuchardt, A.; Libra, J.A.; Sahlmann, C.; Wiesmann, U.; Gnirss, R. Evaluation of oxygen transfer efficiency under process conditions using the dynamic off-gas method. Environ. Technol. 2007, 28, 479–489. [Google Scholar] [CrossRef]
  29. Simón Andreu, P.; Lardín Mifsut, C.; Sanchez Betrán, A.V.; González Herrero, R.; Morales Gómez, J.; Gambín Manzano, J.M.; Marçal Gaitx, A. Comparative study of oxygen transfer in different aeration systems in WWTPs in the Region of Murcia. Water Technol. 2016, 21, 58–62. [Google Scholar]
  30. Simón Andreu, P.; Lardín Mifsut, C.; del Cacho Sanz, C.; García Yuste, M. Oxygen transfer: Rapid assessment of the efficiency of aeration systems. Water Technol. 2015, 15, 92–101. [Google Scholar]
  31. Beltrán Calaff, S.; Lizarralde Aguirrezabal, I.; Ayesa Iturrate, E.; Gorriti Cabrejas, J.; Ortega Conde, F.; de la Sota, A.; Villanueva del Casal, J.M. Estimation of the potential for savings in the aeration systems of the WWTPs by measuring the transfer of oxygen. Water Technol. 2014, 9, 64–72. [Google Scholar]
  32. Simón Andreu, P.; Lardín, C.; Abellan, M.; Ponsoda, J.M. Formic acid cleaning of membrane diffusers for aeration of an active sludge process. Water Technol. 2009, 311, 2–9. [Google Scholar]
  33. Van Haandel, A.; Van der Lubbe, J. Handbook of Biological Wastewater Treatment: Design and Optimization of Activated Sludge Systems, 2nd ed.; IWA Publishing: London, UK, 2012. [Google Scholar]
  34. Brannock, M. Computational Fluid Dynamics Tools for the Design of Mixed Anoxic Wastewater Treatment Vessels. Ph.D. Thesis, University of Queensland, Brisbane, Australia, 2003. [Google Scholar]
  35. Dudley, J. Process testing of aerators in oxidation ditches. Water Res. 1995, 29, 2217–2219. [Google Scholar] [CrossRef]
  36. Le Moullec, Y.; Potier, O.; Gentric, C.; Leclerc, J.P. Activated sludge pilot plant: Comparison between experimental and predicted concentration profiles using three different modelling approaches. Water Res. 2011, 45, 3085–3097. [Google Scholar] [CrossRef] [PubMed]
  37. Simón Andreu, P.P.; Lardín Mifsut, C.; Abellán Soler, M. Energy optimization in WWTPs in the Region of Murcia. Civ. Eng. 2012, 168, 93–112. Available online: http://hispagua.cedex.es/sites/default/files/hispagua_articulo/Ingcivil/P-093-112.pdf (accessed on 1 January 2019).
  38. Burrows, L.J.; Stokes, A.J.; West, J.R.; Forster, C.F.; Martin, A.D. Evaluation of different analytical methods for tracer studies in aeration lanes of activated sludge plants. Water Res. 1999, 33, 367–374. [Google Scholar] [CrossRef]
  39. Brannock, M.; Wang, Y.; Leslie, G. Mixing characterization of full-scale membrane bioreactors: CFD modelling with experimental validation. Water Res. 2010, 44, 3181–3191. [Google Scholar] [CrossRef]
  40. Howes, T.; Brannock, M.W.D.; Corre, G. Development of simplified flow models from CFD simulations. In Proceedings of the Third International Conference on CFD in the Minerals and Process Industries, Melbourne, Australia, 10–12 December 2003; Schwarz, P., Ed.; CSIRO: Canberra, Australia, 2003; pp. 1–6. [Google Scholar]
  41. Climent, J.; Basiero, L.; Martínez-Cuenca, R.; Berlanga, J.G.; Julián-López, B.; Chiva, S. Biological reactor retrofitting using CFD-ASM modelling. Chem. Eng. J. 2018, 348, 1–14. [Google Scholar] [CrossRef]
  42. Martín Sanchez, J.M.; Rodellar, J. Adaptive Predictive Control: From the Concepts to plant optimization. In Prentice-Hall International Series in Systems and Control Engineering; Prentice Hall: Upper Saddle River, NJ, USA, 1996. [Google Scholar]
  43. German Association for Water, Wastewater and Waste. Standard ATV-DVWK-A 131E Dimensioning of Single-Stage Activated Sludge Plants. In ATV-DVWK Rules and Standards; DVPW: Berlin, Germany, 2000. [Google Scholar]
  44. Castell, D.; García Ventoso, M.; Tormos Fibla, I.; Ferrer, C.; Morenilla, J.J.; Bernacer, I.; Basiero, A. Energy Optimization of the Aeration System of a WWTP. Comparative Analysis of Two Technologies. Water Technol. 2011, 327, 2–8. Available online: http://www.sitra.es/sites/default/files/Optimizaci%C3%B3n_energ%C3%A9tica_del_sistema_de_aireaci%C3%B3n_de_una_EDAR_TECNOLOG%C3%8DA_DEL_AGUA_MAR_2011.pdf (accessed on 23 July 2018).
  45. Malia Baró, J.; Pérez, C.; Marín Sanchez, J.M. Optimization of the biological process in a wastewater treatment plant. In Proceedings of the I Seminar on Advanced Industrial Control Applications. Organized by the Industrial Applications Society of the IEEE (IAS), Madrid, Spain, 19–20 October 2005; pp. 127–155. [Google Scholar]
  46. Tchobanoglous, G.; Burton, F.L.; Stensel, H.D.; Metcalf & Eddy Inc. Wastewater Engineering: Treatment and Reuse, 4th ed.; McGraw-Hill Education: New York, NY, USA, 2004. [Google Scholar]
  47. Grady, C.P.L.; Daigger, G.T.; Love, N.G. Biological Wastewater Treatment, 3rd ed.; IWA Publishing: London, UK, 2011. [Google Scholar]
  48. Oprina, G.; Bunea, F.; Pincovschi, I.; Mandrea, L. Aspects of hydrodynamics and mass transfer in diffused aeration systems. Environ. Eng. Manag. J. 2010, 9, 565–572. [Google Scholar] [CrossRef]
  49. Krampe, J.; Krauth, K. Oxygen transfer into activated sludge with high MLSS concentrations. Water Sci. Technol. 2003, 47, 297–303. [Google Scholar] [CrossRef]
  50. Germain, E.; Nelles, F.; Drews, A.; Pearce, P.; Kraume, M.; Reid, E.; Judd, S.J.; Stephenson, T. Biomass effects on oxygen transfer in membrane bioreactors. Water Res. 2007, 41, 1038–1044. [Google Scholar] [CrossRef] [PubMed] [Green Version]
  51. Henkel, J.; Cornel, P.; Wagner, M. Free water content and sludge retention time: Impact on oxygen transfer in activated sludge. Environ. Sci. Technol. 2009, 43, 8561–8565. [Google Scholar] [CrossRef]
  52. Henkel, J.; Lemac, M.; Wagner, M.; Cornel, P. Oxygen transfer in membrane bioreactors treating synthetic greywater. Water Res. 2009, 43, 1711–1719. [Google Scholar] [CrossRef] [PubMed]
  53. Fan, H.; Qi, L.; Liu, G.-H.; Zhang, Y.; Chen, X.; Wang, H. Promotion and inhibition of oxygen transfer under fine bubble aeration by activated sludge. Water Environ. J. 2014, 28, 434–441. [Google Scholar] [CrossRef]
  54. Fan, H.; Qi, L.; Liu, G.-h.; Zhang, Y.; Chen, X.; Wang, H. Aeration optimization through operation at low dissolved oxygen concentrations: Evaluation of oxygen mass transfer ynamics in different activated sludge systems. Water Environ. J. 2017, 55, 224–235. [Google Scholar] [CrossRef]
  55. Raszka, A.; Chorvatova, M.; Wanner, J. The role and significance of extracellular polymers in activated sludge. Part I: Literature review. Acta Hydrochim. Hydrobiol. 2006, 34, 411–424. [Google Scholar] [CrossRef]
  56. Mena, P.C.; Ruzicka, M.C.; Rocha, F.A.; Teixeira, J.A.; Drahos, J. Effect of solids on homogeneous-heterogeneous flow regime transition in bubble columns. Chem. Eng. Sci. 2005, 60, 6013–6026. [Google Scholar] [CrossRef] [Green Version]
  57. Henkel, J.; Siembidalösch, B.; Wagner, M. Floc volume effects in suspensions and its relevance for wastewater engineering. Environ. Sci. Technol. 2011, 45, 8788–8793. [Google Scholar] [CrossRef]
  58. Cornel, P.; Wagner, M.; Krause, S. Investigation of oxygen transfer rates in full scale membrane bioreactors. Water Sci. Technol. 2003, 47, 313–319. [Google Scholar] [CrossRef] [PubMed]
  59. Gómez López, A. Hydraulic Flow Modelling to Improve Energy Efficiency in the Wastewater Treatment Plant Project. In Proceedings of the V Technical Conference on Sanitation and Purification; Water Sanitation Organization of the Region of Murcia (WSERM), Murcia, Spain, 25–26 November 2009; pp. 1–43. Available online: http://www.esamur.com/historico (accessed on 20 July 2018).
  60. Lozano, A.B.; Del Cerro, F. Energy Optimization on the Aeration of Aerobic Bioreactors: Analysis of the Biological Process, Equipment Resizing, and Implementation of a Real-Time Control System Based on the Ammonium/Nitrate Measurement (AN-ISE); Final Degree Work; Department of Chemical Engineering, University of Murcia: Murcia, Spain, 2014. [Google Scholar]
  61. Chisti, Y. Pneumatically Agitated Bioreactors in Industrial and Environmental Bioprocessing: Hydrodynamics, Hydraulics, and Transport Phenomena. Am. Soc. Mech. Eng. 1998, 51, 33–112. Available online: https://appliedmechanicsreviews.asmedigitalcollection.asme.org/article.aspx?articleid=1396214 (accessed on 20 March 2019). [CrossRef]
  62. Matas, E.; Rancaño, A.; Carpes, G. Importance of the Control of Recirculation over Energy Optimization in an WWTP; EMASESA Metropolitan Poster: Sevilla, Spain, 2009. [Google Scholar]
  63. Xylem. Sistemas de Aireación de Alta Eficiencia por Burbujas Finas de Sanitaire. Available online: https://docplayer.es/14438856-Sistemas-de-aireacion-de-alta-eficiciencia-por-burbujas-fina-de.html (accessed on 15 July 2019).
  64. Morenilla, J.J. Control systems and optimization of energy consumption in WWTP XXV. In Course on Wastewater Treatment and Operation of Wastewater Treatment Plants; CEDEX: Madrid, Spain, 2007; Volume 3, p. 34. [Google Scholar]
  65. Manesis, S.A.; Sapidis, D.J.; King, E. Intelligent control of wastewater treatment plants. Artif. Intell. Eng. 1998, 12, 275–281. [Google Scholar] [CrossRef]
  66. Guerrero, J.; Guisasola, A.; Vilanova, R.; Baeza, J.A. Improving the performance of a WWTP control system by model-based setpoint optimization. Environ. Model. Softw. 2011, 26, 492–497. [Google Scholar] [CrossRef]
  67. Turon, C.; Giró, J.; Ripoll, F.; Clara, P.; Freixó, A. Advanced and intelligent control for energy saving in the biological elimination of nutrients. Chem. Eng. 2011, 490, 90–95. [Google Scholar]
Figure 1. Stages included in the energy optimization of an aeration system.
Water 12 01143 g001
Figure 2. (a) Performance curve and (b) pressure drop curve of standard EPDM Sanitare 9" diffuser for the working ranges.
Water 12 01143 g002
Figure 3. Evolution of MLSS in the different chambers of the biological reactor.
Water 12 01143 g003
Figure 4. Evolution of the SOTE according to the number of agitators in operation.
Water 12 01143 g004
Figure 5. Evolution of SOTE as a function of diffuser density.
Water 12 01143 g005
Figure 6. (a) and (b) simulated speed lines under real operating conditions.
Water 12 01143 g006
Figure 7. (a) Image of simulated flow lines and (b) simulated speed lines under real operating conditions.
Water 12 01143 g007
Figure 8. Distribution of residence times for cases 1, 2, 3, 4, and 5.
Water 12 01143 g008
Figure 9. Effect of the cleaning of diffusers on the decrease of pressure in the manifold.
Water 12 01143 g009
Figure 10. Effect of the cleaning of diffusers on the reduction of energy consumption.
Water 12 01143 g010
Table 1. Operation scenarios of the aeration blowers.
SituationNO. of Working BlowersOperating Frequency (Hz)Total Air Flow Rate (Nm3/h)Flow Rate per Diffuser Qair/Qdiffusor (Nm3/h)
11332088.92.10
21503165.03.18
3250 + 335253.95.28
4250 + 506330.06.36
Table 2. Design values of flow and organic load and actual process values.
DESIGN VALUESACTUAL AVERAGE VALUES
Q (m3/day)BOD5
(kg O2/day)
TKN
(kg N/day)
Q
(m3/day)
BOD5
(kg O2/day)
TSS
(kg/day)
TKN
(kg N/day)
20,0008000120075789021091288
Note: Q is the inlet flow of wastewater, BOD5 is biological oxygen demand, TKN is total Kjeldahl nitrogen and TSS is total suspended solids.
Table 3. Calculation of the actual oxygen requirements.
T (°C)Q (Nm3/day)BOD5
(kg O2/day)
TSS (kg/day)TKN (kg/day)Sludge Age (days)O2 (kg O2/day)
2089021288252
Table 4. Oxygen flow provided by the installed blowers and real needs of oxygen in the WWTP.
O2
(kg O2/day)
Operation HoursO2
(kg O2/day)
SOTE pw (%)Q (Nm3/h)Q Nominal (Nm3/h)% Excess
21972492262028316564
Table 5. Dependence of the consumption on the installed power and on the power absorbed by the engine.
TechnologyAerator ModelΔP Work (mbar)Q Air Blower (Nm3/h)Installed Power (kW)Average Consumption (%)Absorbed Power (kW)Average Consumption (%)
Lobular (Model current)MPR-SEM 40TR590316511010070.48100
Magnetic LevitationABS HST 2500-1-L59031347568.1848.5368.86
ScrewATLAS COPCO ZS555902340555047.6767.63
HybridAERZEN D75L5902618555042.6160.45
Table 6. Reactor volume with speed less than a certain value and its percentage with respect to the total volume.
Casev < 0.3 m/sv < 0.15 m/sv < 0.05 m/s
11110 m366.6%428 m325.7%44 m32.7%
21335 m380.1%787 m347.2%100 m36.0%
31349 m381.4%842 m350.8%123 m37.4%
41353 m381.7%751 m345.4%79 m34.8%
51476 m389.1%1022 m361.7%263 m316.0%

