Article

Multivariate Statistical Analysis of Hydrochemical Data and Stable Isotopes of Groundwater Contaminated with Nitrate at Huay Sai Royal Development Study Center and Adjacent Areas in Phetchaburi Province, Thailand

by
Srilert Chotpantarat
1,2,3,*,
Tewanopparit Parkchai
4 and
Wanlapa Wisitthammasri
5
1
Department of Geology, Faculty of Science, Chulalongkorn University, Phayathai Road, Pathumwan, Bangkok 10330, Thailand
2
Research Program of Toxic Substance Management in the Mining Industry, Center of Excellence on Hazardous Substance Management (HSM), Chulalongkorn University, Bangkok 10330, Thailand
3
Research Unit of Green Mining (GMM), Chulalongkorn University, Bangkok 10330, Thailand
4
Inter-Department of Environmental Science, Graduate School, Chulalongkorn University, Bangkok 10330, Thailand
5
International Postgraduate Programs in Environmental Management, Graduate School, Chulalongkorn University, Bangkok 10330, Thailand
*
Author to whom correspondence should be addressed.
Water 2020, 12(4), 1127; https://doi.org/10.3390/w12041127
Submission received: 22 November 2019 / Revised: 8 April 2020 / Accepted: 9 April 2020 / Published: 15 April 2020
(This article belongs to the Special Issue Environmental Fate of Contaminants in the Aquatic Environment)

Abstract

:
Due to the continuous expansion in agriculture production and industry for many years, groundwater usage has been increasing, with a decrease in groundwater levels in many cases. In addition, in some areas, groundwater quality has degraded due to agrochemical contamination from agricultural areas. The aims of this research pertains to aquifers as follows: (1) to evaluate hydrochemical characteristics of groundwater using multivariate statistical analysis, including principal component analysis (PCA) and hierarchical cluster analysis (HCA), and (2) to integrate the stable isotopes 18O and 2H with hydrochemical data to evaluate the origin of the groundwater and indirectly identify the pollution sources of groundwater contaminated with nitrate (NO3). Water samples were collected from 60 groundwater wells with different hydrogeological characteristics and land use types in both the rainy season (in October) and the summer seasons (in February) in the Cha Am district of Phetchaburi Province. The groundwater was separated into 3 types: Ca-Na-Cl, Ca-Na-HCO3-Cl, and Na-Cl. Two groundwater wells (no. 19 and 41), which were located southeast and southwest of the study area, had relatively high NO3 concentrations (47 mg/L NO3 and 50 mg/L NO3, respectively) that were higher than the groundwater quality standards. These two wells corresponded to the second group that was exposed by HCA. The PCA results revealed the influence of seawater intrusion. Furthermore, multivariate statistical analysis (PC 2) revealed that the NO3 that is mainly released from potassium nitrate (KNO3), for example, during pineapple cultivation, directly contaminated the groundwater system.

1. Introduction

Due to an increase in population and agricultural products and the expansion of industries, surface water is typically employed for consumption, agriculture, and industrial development, but there is not enough [1,2]. Thus, groundwater resources are increasingly utilized, which causes a decline in groundwater storage. The contamination from agricultural activities and industrial areas is the main cause of the degradation in groundwater quality for consumption [3].
The 10th national economic and social development plan (2007–2011) reported that the maximum amount of imported fertilizer and agrochemicals in 2011 was approximately 164 thousand metric tons [4]. The cumulating amount of fertilizer and agrochemicals in the soils of agriculture areas has created environmental problems, e.g., contaminants the water resources and public health risks [5,6]. Standards of nitrate (NO3) and sulfate (SO42−) detected in groundwater were attributed to the high usage of chemical fertilizers [7,8]. Land use types and soil characteristics are contributing factors of different sources of NO3 in groundwater resources [9,10]. The consumption of high amounts of NO3 affects babies younger than four months, who develop methemoglobinemia or blue-baby syndrome [11], which poses a high risk for adults to develop gastrointestinal cancer or bladder cancer [12].
The Huai Sai Royal Development Project in Cha Am of Phetchaburi Province was established by King Bhumibol (Rama IX) serve as a model of developing the degraded land in western Thailand. Due to forest invasion and the long-term misuse of chemicals fertile areas have become arid, and the loss of ecological balance prevented further use of areas for agricultural purposes. When the environment has recovered, the community expanded, and the number of agriculture activities increased. Although the ecology has been restored, the area still experienced drought because of its rain shadow area. Thus, groundwater became an important resource for consumption and agricultural activities [13].
A study by Spalding et al. [14] diagnosed the sources of NO3 contamination in groundwater on Cheju Island, where leachates from fertilizers in citrus groves and human or animal waste were detected in the Seogwipo municipal area. The levels of NO3 are related to regional environmental factors, especially soil characteristics (well-drained) and the depth of groundwater (NO3 levels decrease with depth) [15,16]. The increase in population and expansion of farm lands threatens the groundwater quality in the Nandong Underground river system (NURS) in the southeast Yunan Province in China, as observed by the relationship among NO3, Cl and SO42− [8]. Intensive agricultural areas have been developed in the past few decades with a high amount of groundwater withdrawal, which is likely cause groundwater contamination. As previously mentioned, these activities are based on the research assumption that human activities are important for controlling the amount of NO3 in the groundwater system. The integration of hydrogeological and hydrochemical characteristics (including stable isotopes) with a multivariate statistical analysis was capable of identifying the NO3 source.
The purpose of the study is to evaluate the hydrochemical characteristics of groundwater using multivariate statistical analysis, including principal component analysis (PCA) and hierarchical cluster analysis (HCA). Moreover, the stable isotopes δ18O and δ2H were integrated with hydrochemical data to evaluate the origin of groundwater and indirectly identify the sources of groundwater that are contaminated with NO3. The results from this study can be further employed to estimate an appropriate guideline for the conservation and reduction of NO3 contaminated groundwater into an unconsolidated aquifer with intensively agricultural areas.

2. Materials and Methods
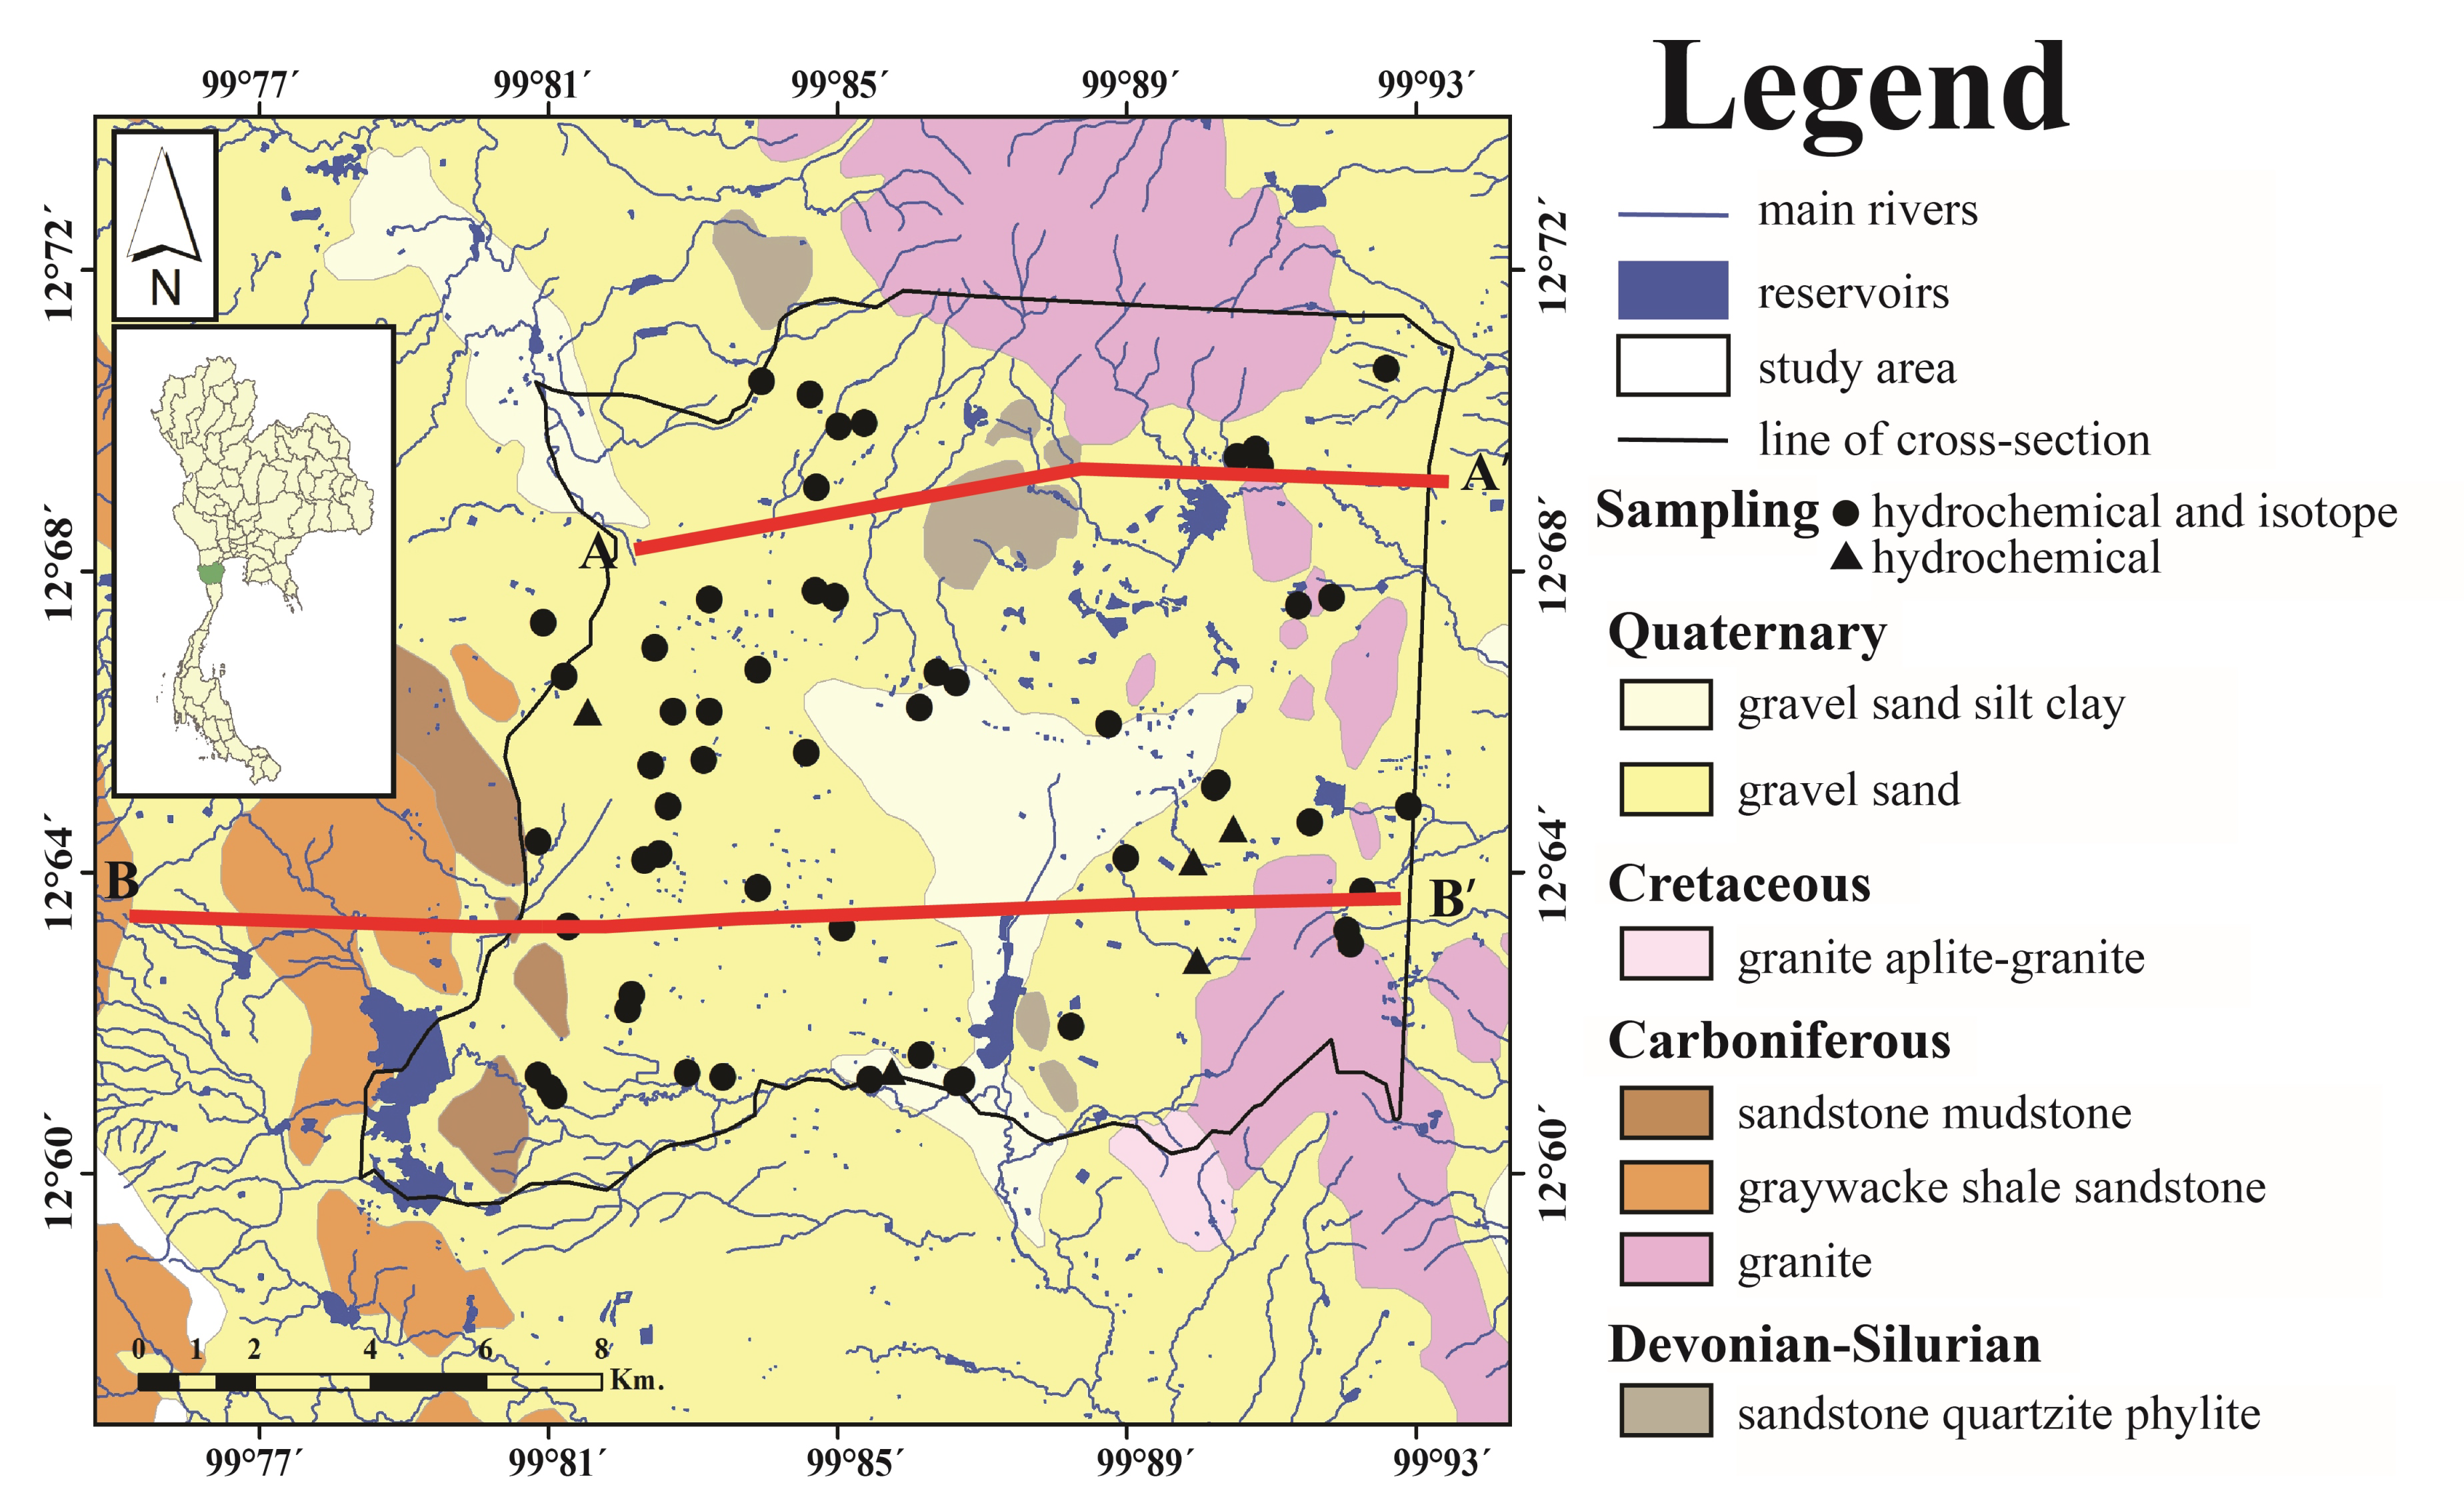
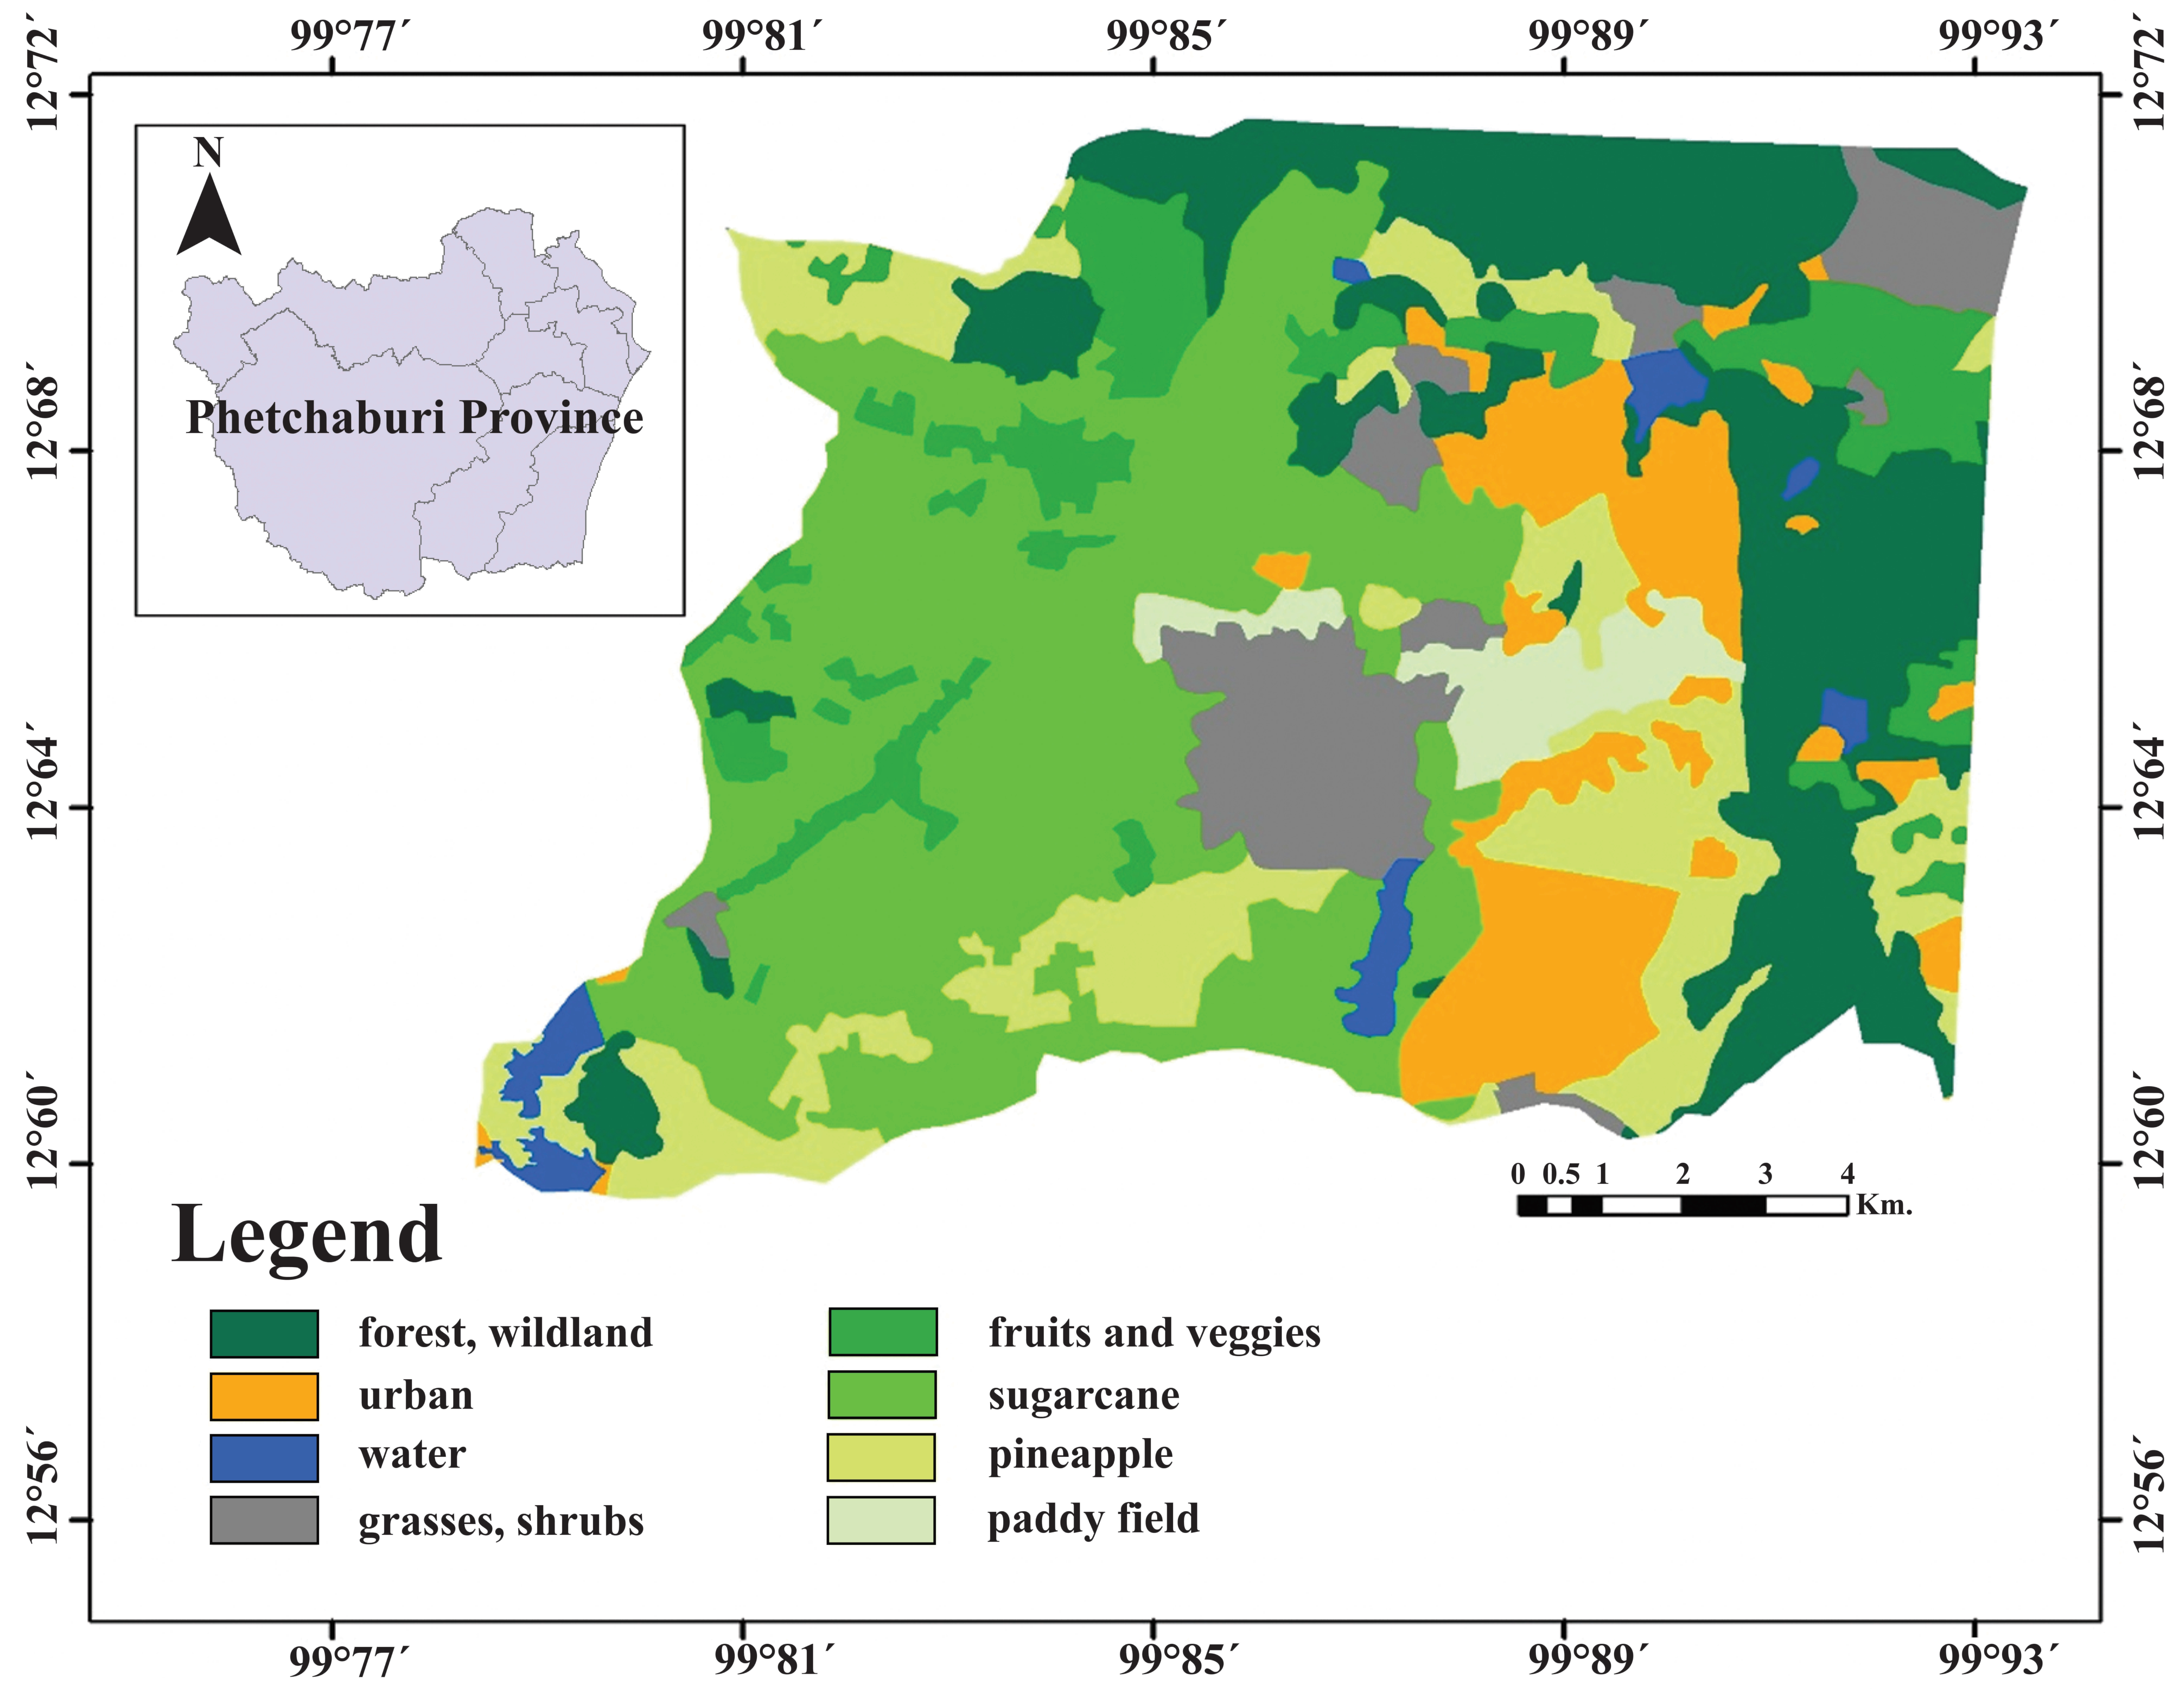
2.1. Study Area

The study area is located at The Huai Sai royal development in Sam Phraya sub district, Cha Am district, and Phetchaburi Province, which is located between latitude 12°37′ N to 14°45′ N and longitude 99°46′ E to 99°55′ E. The area is approximately 205 km2 (Figure 1) which covered 3 subdistricts: Sam Phraya, Huai Sai Nuea and Rai Mai Phatthana. The topography was a high mountain in the east and north. The highest area was located on Hok Sabu mountain approximately 513 m above mean sea level (amsl). The central area was a plain with a slope down to the east coast. The river plain was located around a stream. The altitude ranged from approximately less than 30 m to 70–100 m (amsl). Six irrigation reservoirs exist, including Hup Kaphong (Phu Wai), Huai Tapaet, Khao Krapuk, Huai Sai, Huai Mai Tai and Thung Kham, which is the largest reservoir. The total capacity of the reservoirs was 18.7 million m3 [13]. The high groundwater recharge potential area is located east of the Huai Sai Royal Development Project [17]. The groundwater mainly flew from the south-western area to the north-eastern area [18]. The climate was similar to the climate in central Thailand but the study area was rather dry because it was located behind the Tenasserim or Tanah Sari Hill. The annual rainfall, which was obtained from the Thai Meteorological Department (TMD) [19], ranged from 954.6 mm to 983.4 mm. with an average rainfall of 969.0 mm. The average temperature ranged from 21.6–33.5 °C. Geology of the study area reveals terrace deposits on the undulating and foothill slope and alluvial deposits in the floodplains. Carboniferous granite was detected in the north and southeast, and quartz sandstone with shale and Devonian-Silurian siltstone was detected in a small area in the north and south. Furthermore, arkose sandstone was detected in southwest in the Khao Chao and Kaeng Krachan formation.
The majority of groundwater was located in the quaternary floodplain deposit aquifer (Qfd), which consists of unconsolidated sediments, such as gravel and sand with a thickness of approximately 30–40 m and average groundwater depth of 2.5–4.5 m [18]. Groundwater was detected in Permian-carboniferous metasedimentary rocks (PCms) at the bottom of unconsolidated sediments, and northwest and southwest of the study area with a water depth of 100 m. Groundwater was detected in Cretaceous granite (Gr) in the north and east, which is a groundwater aquifer placed between an unconsolidated aquifer and a metasedimentary aquifer, as shown in Figure 2 and Figure 3. Soil characteristics were classified into sandy loam, fine loam and silty clay. The high slope area was in the north and southeast. The area is mainly covered by agricultural areas (~58.98%) as shown in Figure 4, including a sugar cane field in the east, a pineapple field in the southeast and southwest, and a paddy in the central area. The other area included a forest, town, government area, and water.

2.2. Groundwater Sampling Method

The groundwater samples were collected from 60 locations (refer to Figure 1) in the rainy season. The depth of the groundwater wells ranged from 20–140 m. Each groundwater sample would be stored in a 1 L bottle and kept at temperature lower than 4°C before anion analysis in laboratory. The samples for cation analysis were filtered immediately using a 0.45-um MF-Millipore membrane and kept in a 210 mL HDPE bottle with nitric acid added for pH < 2. The 55 groundwater samples would be kept in 120 mL sepia bottles for 18O and 2H isotope analysis. Other parameters include the groundwater level, which was measured using electric tape, temperature, which was measured using the Hach sensION 6 portable meter (Hach company, Loveland, CO, USA), and electrical conductivity (EC) and total dissolved solid (TDS), which were measured using the Hach sensION 5 portable meter (Hach Company, Loveland, CO, USA). These parameters were measured in the field in rainy and summer seasons.

2.3. Laboratory Analysis

The groundwater samples were filtered with 0.22 μm filter paper and then analyzed to estimate Ca2+, Mg2+, Na+, and K+ with an atomic absorption spectrometer (AAS, Perkin Elmer, Norwalk, CT, USA). The detection limit of a cation is 0.02 mg/L. Alkalinity (CO32− + HCO3)was measured with the titration method with indicator solutions (Phenolphthalein, methyl red and bromocresol green), and Cl, SO42−, Br, and NO3 were measured with ion chromatography. The detection limits of Cl, SO42−, Br, and NO3 are 0.098 mg/L, 0.195 mg/L, 0.156 mg/L and 0.195 mg/L, respectively. To determine the recharge and discharge areas, the 18O and 2H isotope were analyzed with cavity ring-down spectroscopy. After chemical analysis, each parameter was calculated for ion equilibrium to test the accuracy. If the accuracy was greater than 10%, interpretation of these parameters would not be out feasible.

2.4. Statistical Analysis

All variables were standardized by z-scores to eliminate the difference in their variances. Statistical analysis is a suitable method for investigating about variables relationship. IBM SPSS Statistics 22.0 utilized either bivariate analysis or multivariate analysis. Fourteen parameters temperature, pH, ORP, EC, Na+, K+, Ca2+, Mg2+, Cl, SO42−, Br, NO3, alkalinity, and TDS of the samples were employed to perform the correlation matrix and principal component analysis (PCA) within the data set and explain the associated processes that influence the groundwater chemistry of the area. The groundwater chemistry obtained by a similar process was grouped using the same factors. Moreover, a hierarchical cluster analysis (HCA), using the linkage between groups method with the squared Euclidean distance, was employed to establish the relation among the spatial distribution of groundwater chemistry in the groundwater wells.

3. Results

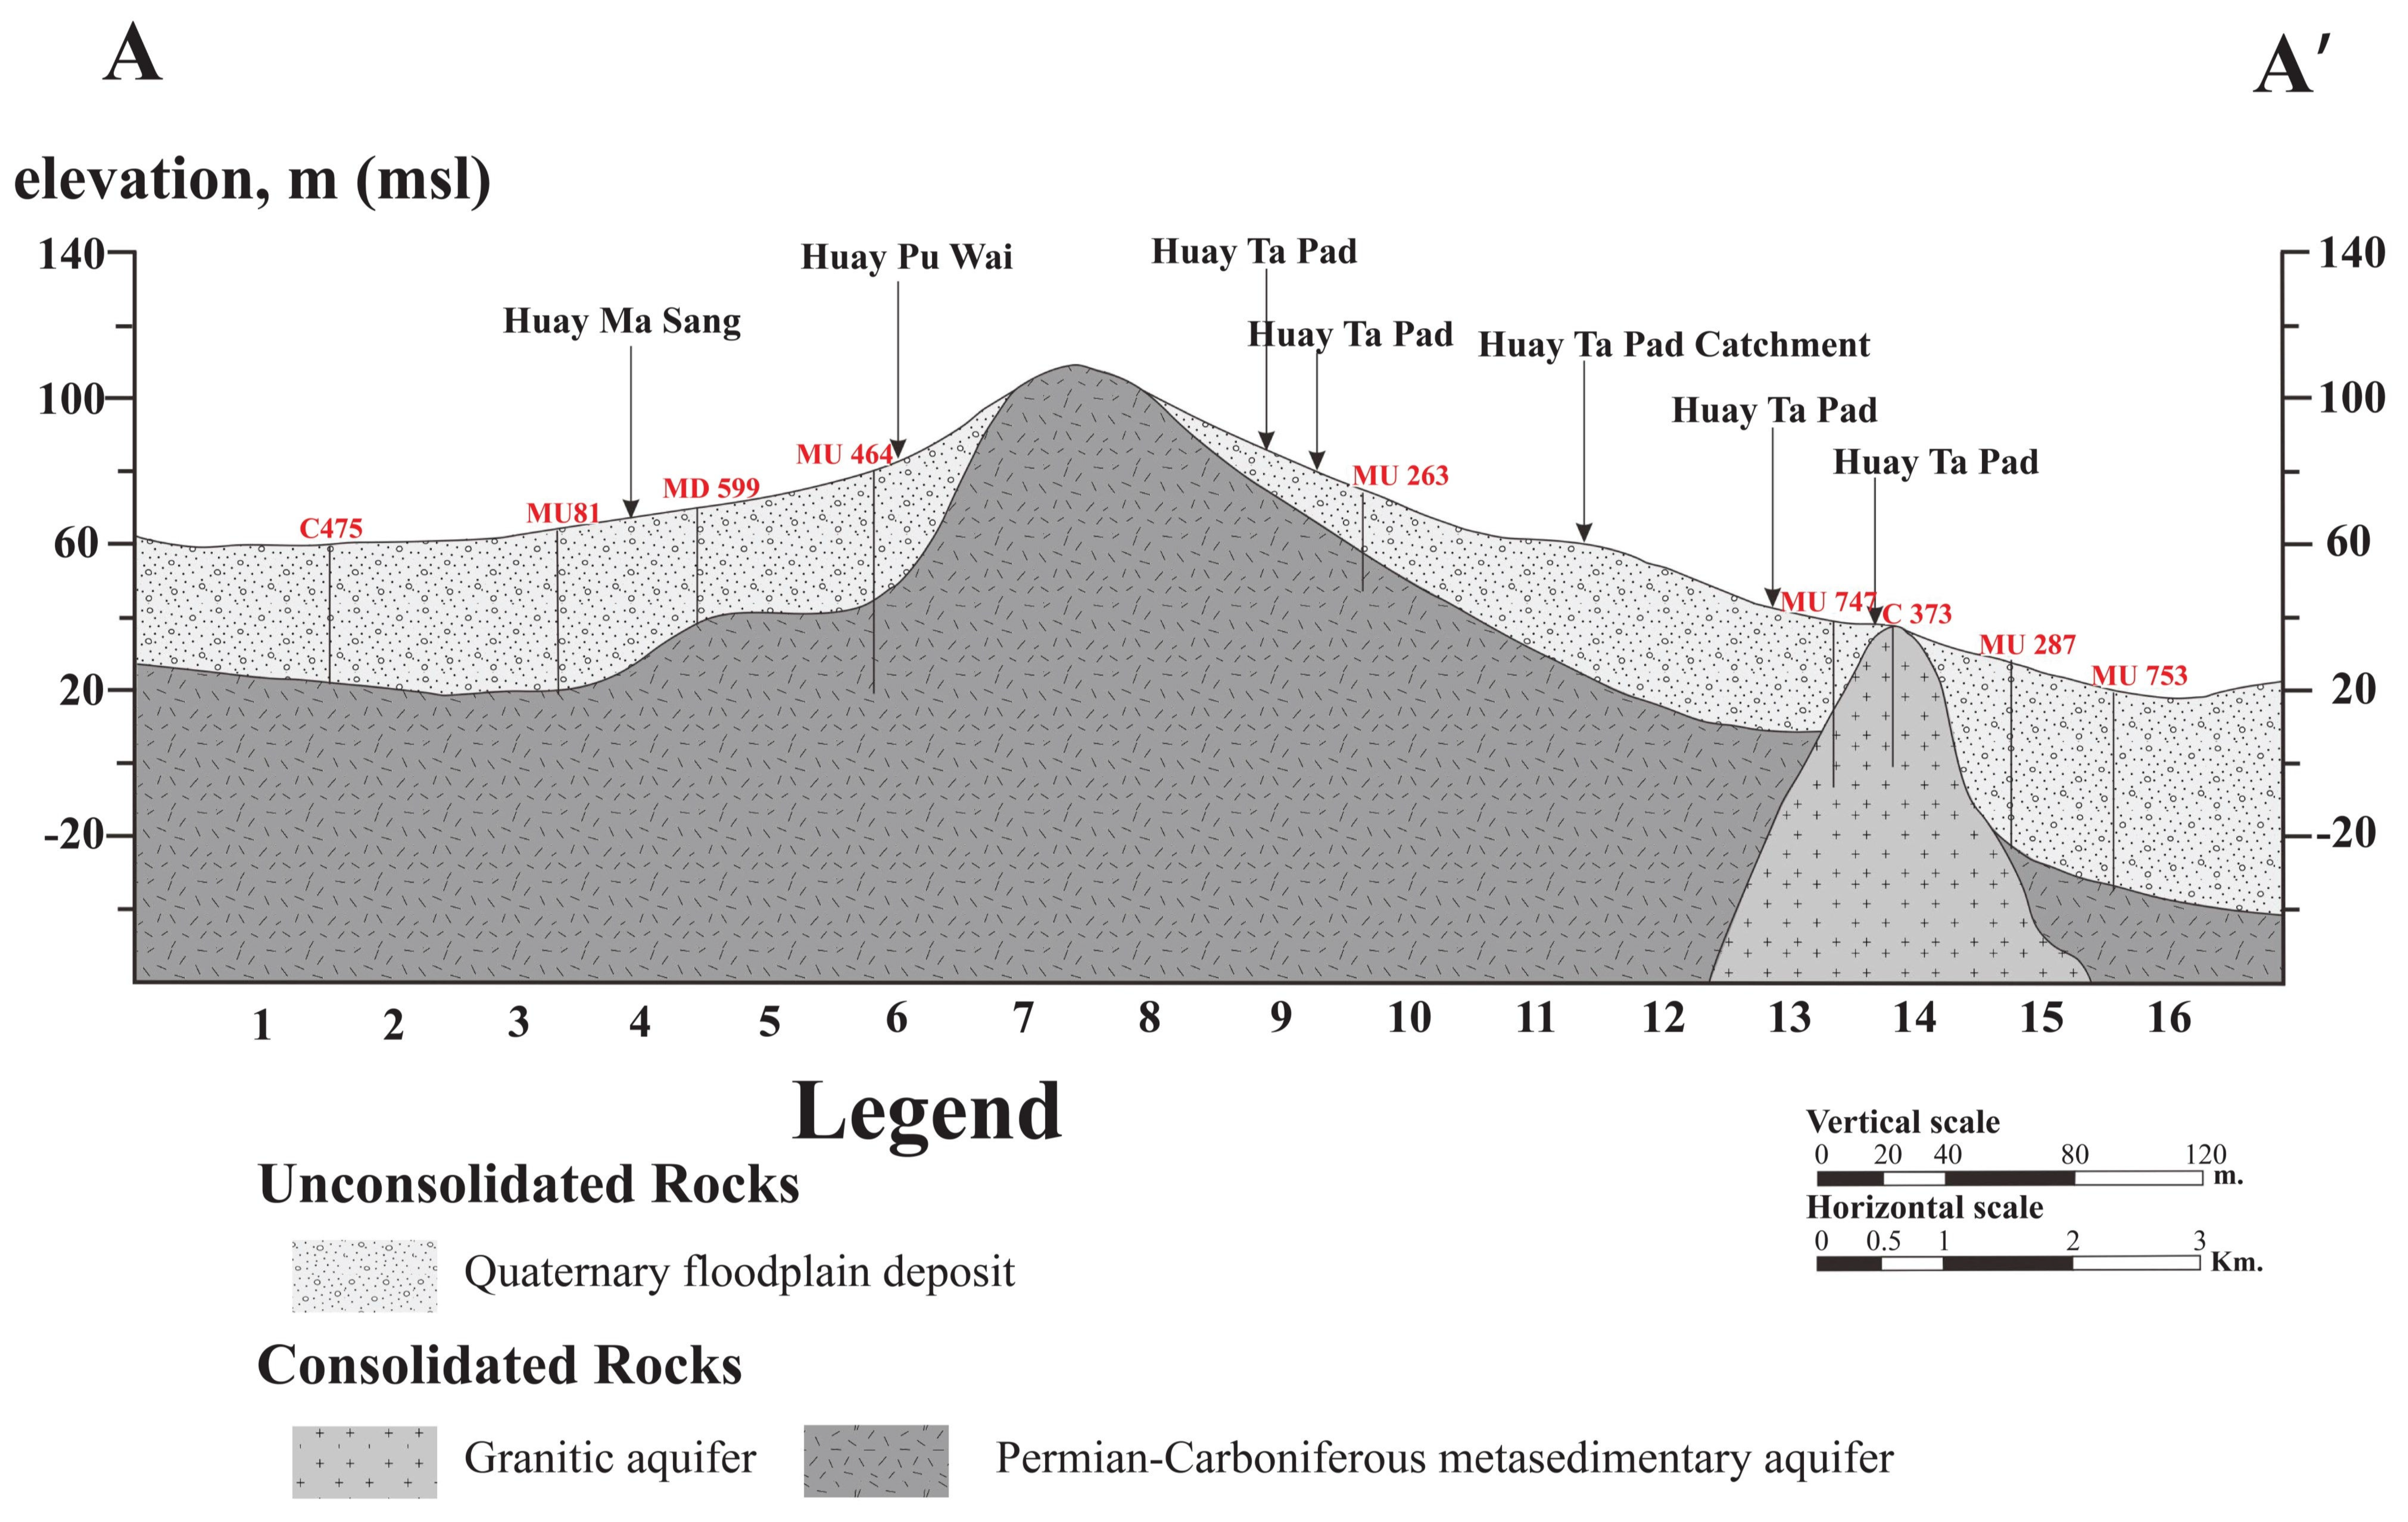
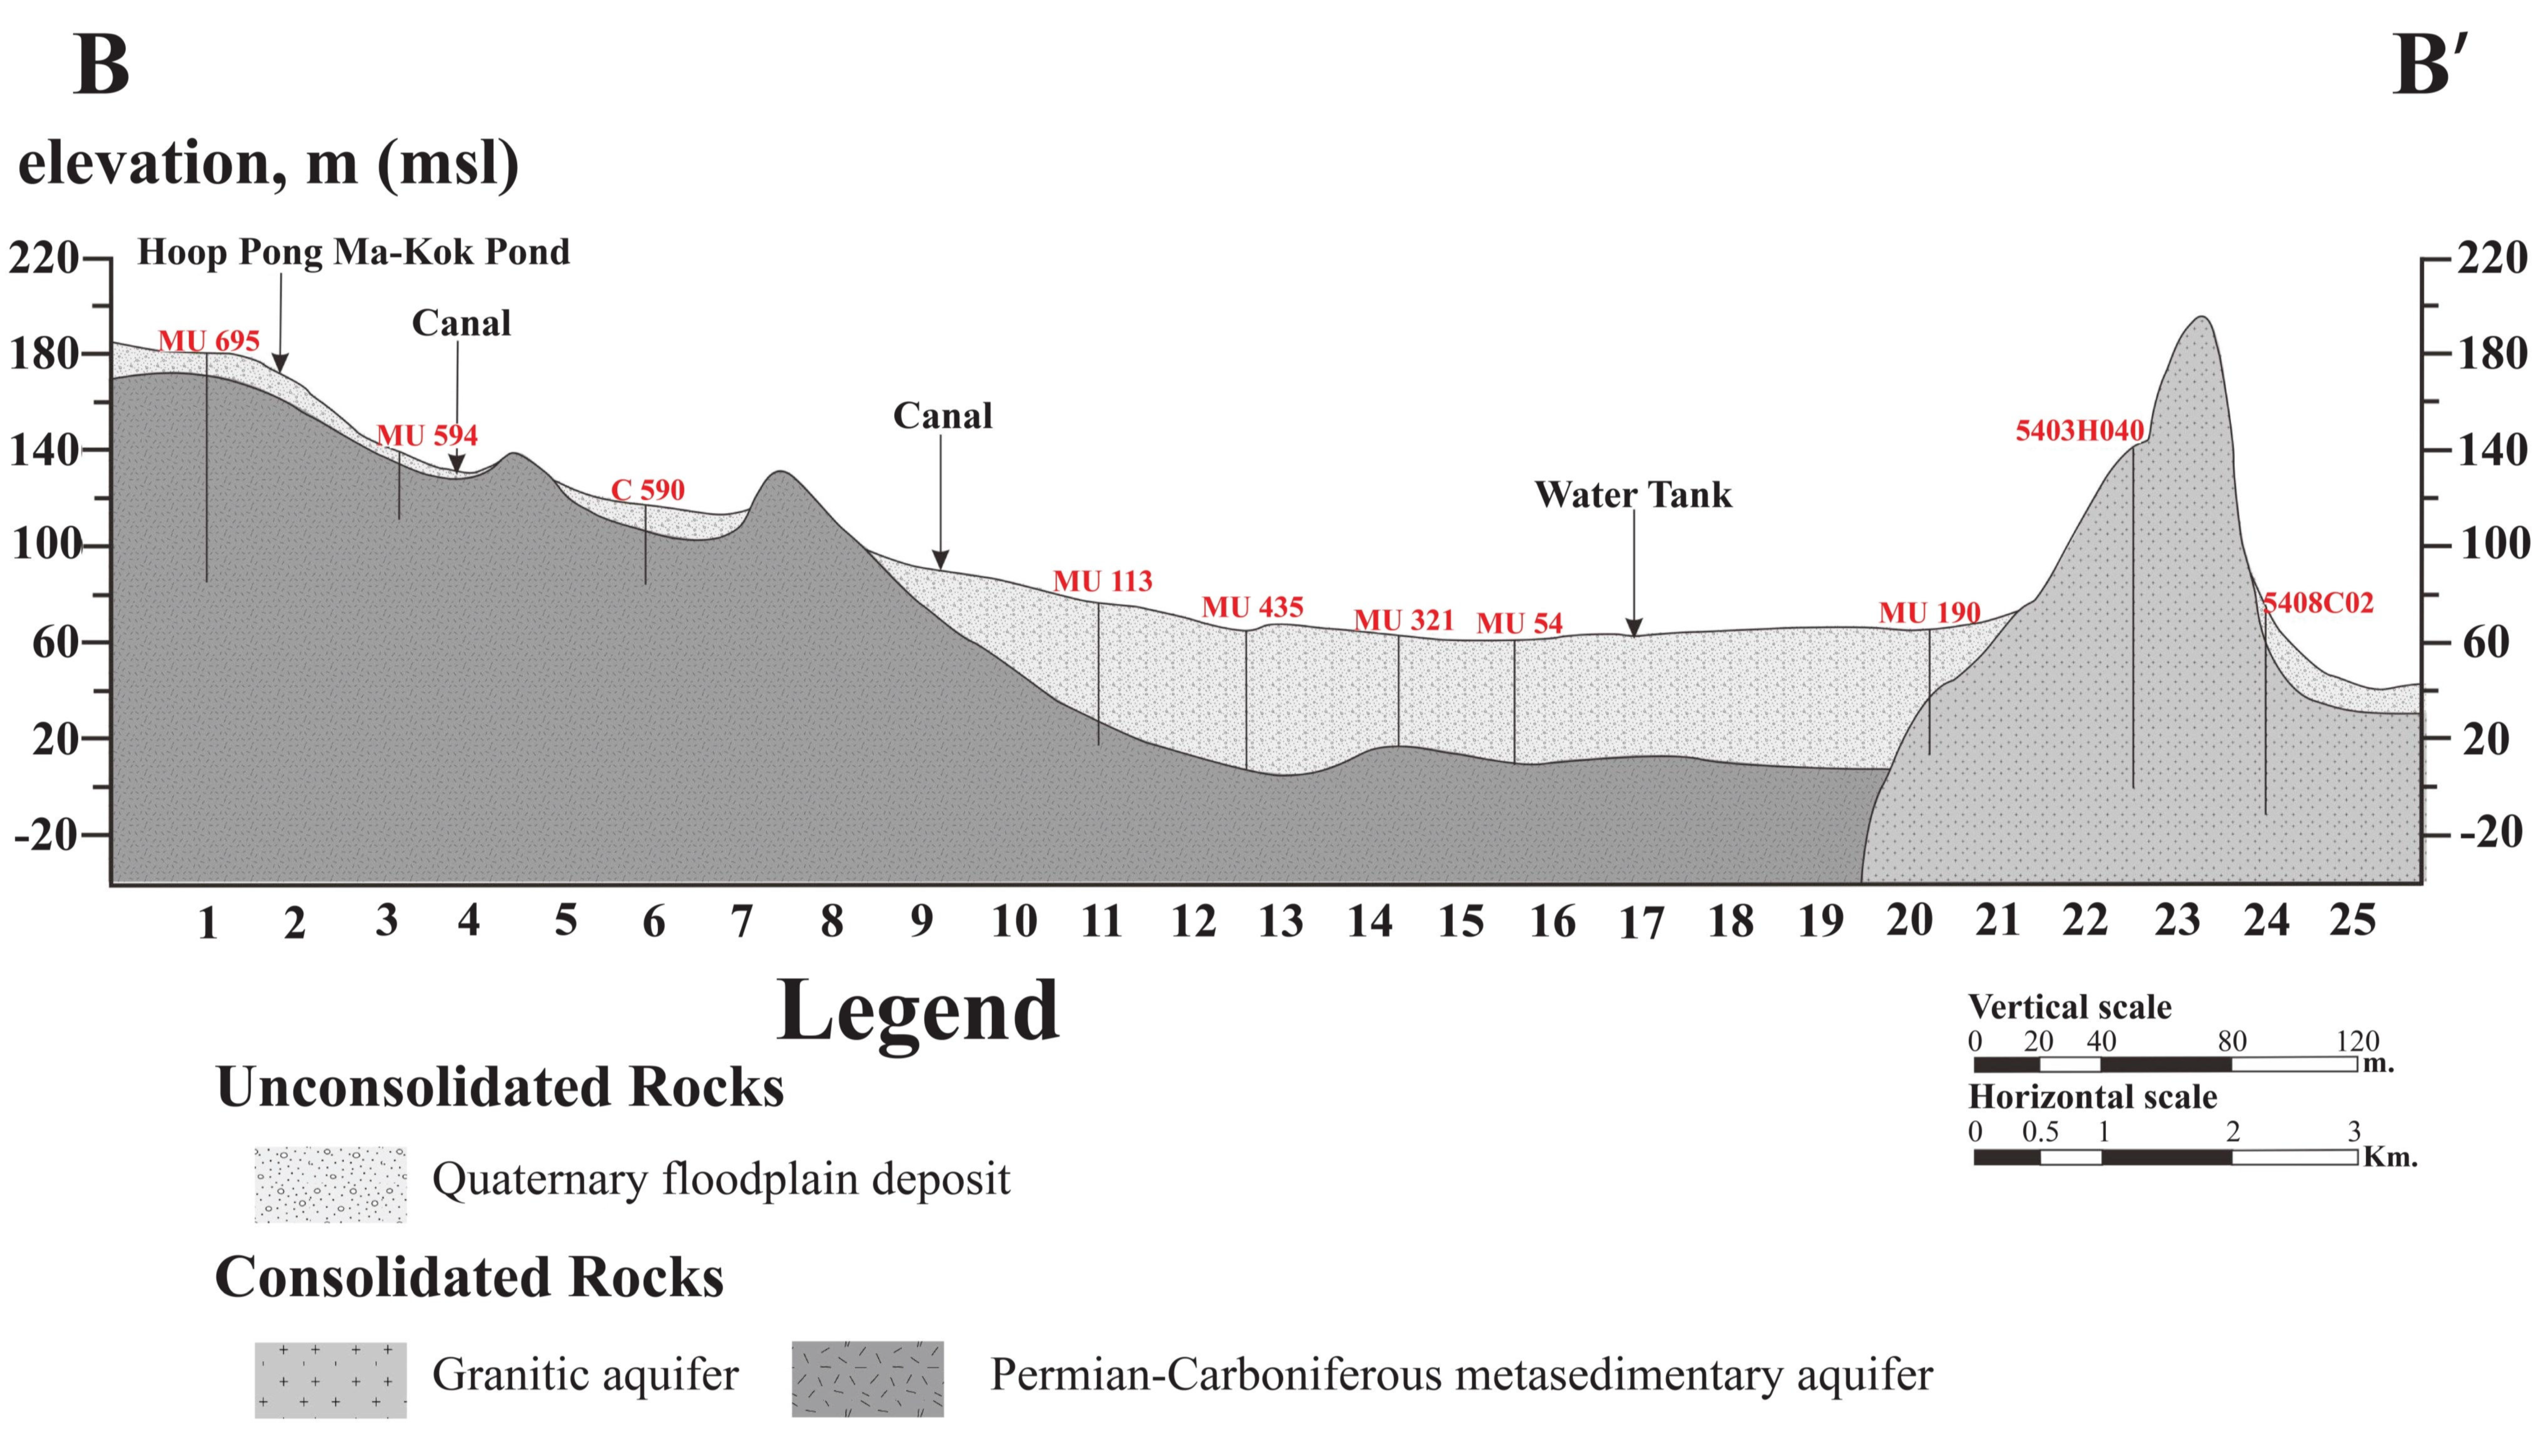
3.1. Groundwater Flow and Hydrogeochemical Characteristics

The water level from 30 wells showed that the direction of groundwater flow was mainly from west to east and southwest to northeast [18]. The groundwater level ranged from 15.33 to 135.85 m (amsl), and from 30.00 to 125.40 m (amsl) in the rainy season and summer season, respectively (Supplementary Tables S1 and S2). Some areas, such as the northwest and southwest experienced different flow directions due to intensive pumping for residential consumption.
According to ion equilibrium, a comparison of between the cations and anions in each groundwater sample revealed that 5 groundwater samples had values greater than 10% of ion balance error. Thus, only 60 groundwater wells would be selected for use in further sections. The results of the analysis are shown as Table 1 and Table 2. The average pH value in the rainy season was close to the average pH values in the summer season, which were 7.20 and 7.50, respectively. These values are in the same range as values obtained in a study by Magesh et al., 2013 [21]. The pH range was 7.3–8.4, which indicates slight alkalinity. The highest pH was measured in the central area of Huai Sai Nuea and Rai Mai Phatthana Sub-district.
In general, the amount of Ca2+ (less than 100 mg/L), magnesium (Mg2+) (less than 40 mg/L), sodium (Na+) (less than 20 mg/L) and potassium (K+) (less than 10 mg/L) is obtained from a natural decay process, which depends on the composition of rocks in the area [22]. A comparison of the average concentration of all ions in groundwater in the rainy season indicated that Cl had an average concentration of 144.06 mg/L and the highest value at well no. 47. The second highest value was Na+ with an average concentration of 123.74 mg/L at well no. 47. Calcium (Ca2+) had an average concentration of 81.05 mg/L with the highest concentration at well no.51. The Ca2+ concentrations and Mg2+ concentrations range from 20–480 mg/L and 3.64–354.78 mg/L, respectively, and are probably derived from the leaching of carbonate minerals [21]. Potassium had a concentration between 1.73 and 57.93 mg/L with the highest value at well no. 19. Magnesium had a concentration from 0.3–99.86 mg/L with the highest at the Banpong Keng Phattana multipurpose center southwest of Rai Mai Phatthana Sub-district (well no.25). Sulfate had an average concentration between 0.04 and 202.2 mg/L with the highest concentration at well no.52 in the plant research region. The water type of groundwater in the rainy season was specified by the hydrogeochemical components, as shown in Figure 5. Seven types of groundwater including Ca-Na-Cl, Ca-Na-HCO3-Cl and Na-Cl were detected in 33.33%, 21.67% and 15.00% of the total samples, respectively, and Ca-Cl, Ca-HCO3-Cl, (Ca-Cl)+(Ca-Na-Cl) and (Ca-Na-Cl)+(Ca-Na-HCO3-Cl) were detected in 5.00% of the total samples. As shown in Figure 5, Ca-Na-HCO3 was detected in the samples from well no.1 and well no. 7, while Na-HCO3 was detected in well no. 29.
An analysis of the NO3 concentrations in both seasons revealed that most of the NO3 had a lower value than the standard of water for consumption (45 mg/L NO3). Well no. 19 and well no. 41 in the west and southwest had concentration of NO3 of 46.85 mg/L and 49.74 mg/L, respectively, which exceeded the standard as shown in Figure 6. The majority of the groundwater wells had a high concentration of NO3 during the rainy season, except in the western and southwestern groundwater wells. The northwest and northeast areas exhibited an increase in NO3 during the rainy season, while in the summer, these areas had a lower value NO3 that ranged from below the detection limit to 6.07 mg/L, which was the highest concentration of NO3 at well no. 45.

3.2. Multivariate Analysis

A statistical analysis was performed to obtain the hydrochemical parameters in groundwater and establish their relationships. This study applied three statistical techniques: the correlation matrix, principal components analysis (PCA) and hierarchical cluster analysis (HCA) [23,24,25]. The correlation matrix was determined with 0.01 significance, as shown in Table 3. The results showed that EC was strongly related to TDS (0.879) and moderately related to Na+ (0.689) and Cl (0.630). Chloride had a moderate relationship with TDS (0.726) and Br (0.864). Sodium had a moderate relationship with TDS (0.802), Cl (0.671), Br (0.705) and alkalinity (0.715). Calcium and Mg2+ presented a low positive correlation (0.161), which differed from the results of a study by Belkhiri et al. [26] that showed a strong correlation (0.76), which indicates a common source. Moreover, an excellent positive correlation between Cl and Na+ (0.671) suggested the dissolution of chloride salts and halite, which release equal concentrations into the aqueous phase.
Before using factor analysis, Kaiser Meyer Olkin (KMO) had to be determined for the appropriateness of the data. The results specified that KMO was greater than 1; so a factor analysis was capable. PCA was employed to distribute the factors into 5 groups, as shown in Table 4, with a cumulative variance of 78.16. The HCA is a method that can be applied to determine the spatial distribution of data. This study applied the Ward linkage method, which can divide the groundwater wells into four groups, as shown in Figure 7. The first group consisted of 50 wells located in the east, west and central section of the study area that had an average NO3 concentration of 3.95 mg/L, which was less than that of the second group, as shown in Figure 8. The second group consisted of two wells, well no.19 and well no.41 in the southeast and southwest section of the study area and had an average NO3 concentration of 48.30 mg/L. The third group consisted of seven wells located in the central, southwest, and northwest sections of the study area and had an average NO3 concentration of 3.55 mg/L, which was similar to the first group. The last group only included well no. 47 because the EC, TDS, Na+, Cl, Br, and alkalinity of this well were higher than those of other wells and only 1.91 mg/L of NO3 was detected.

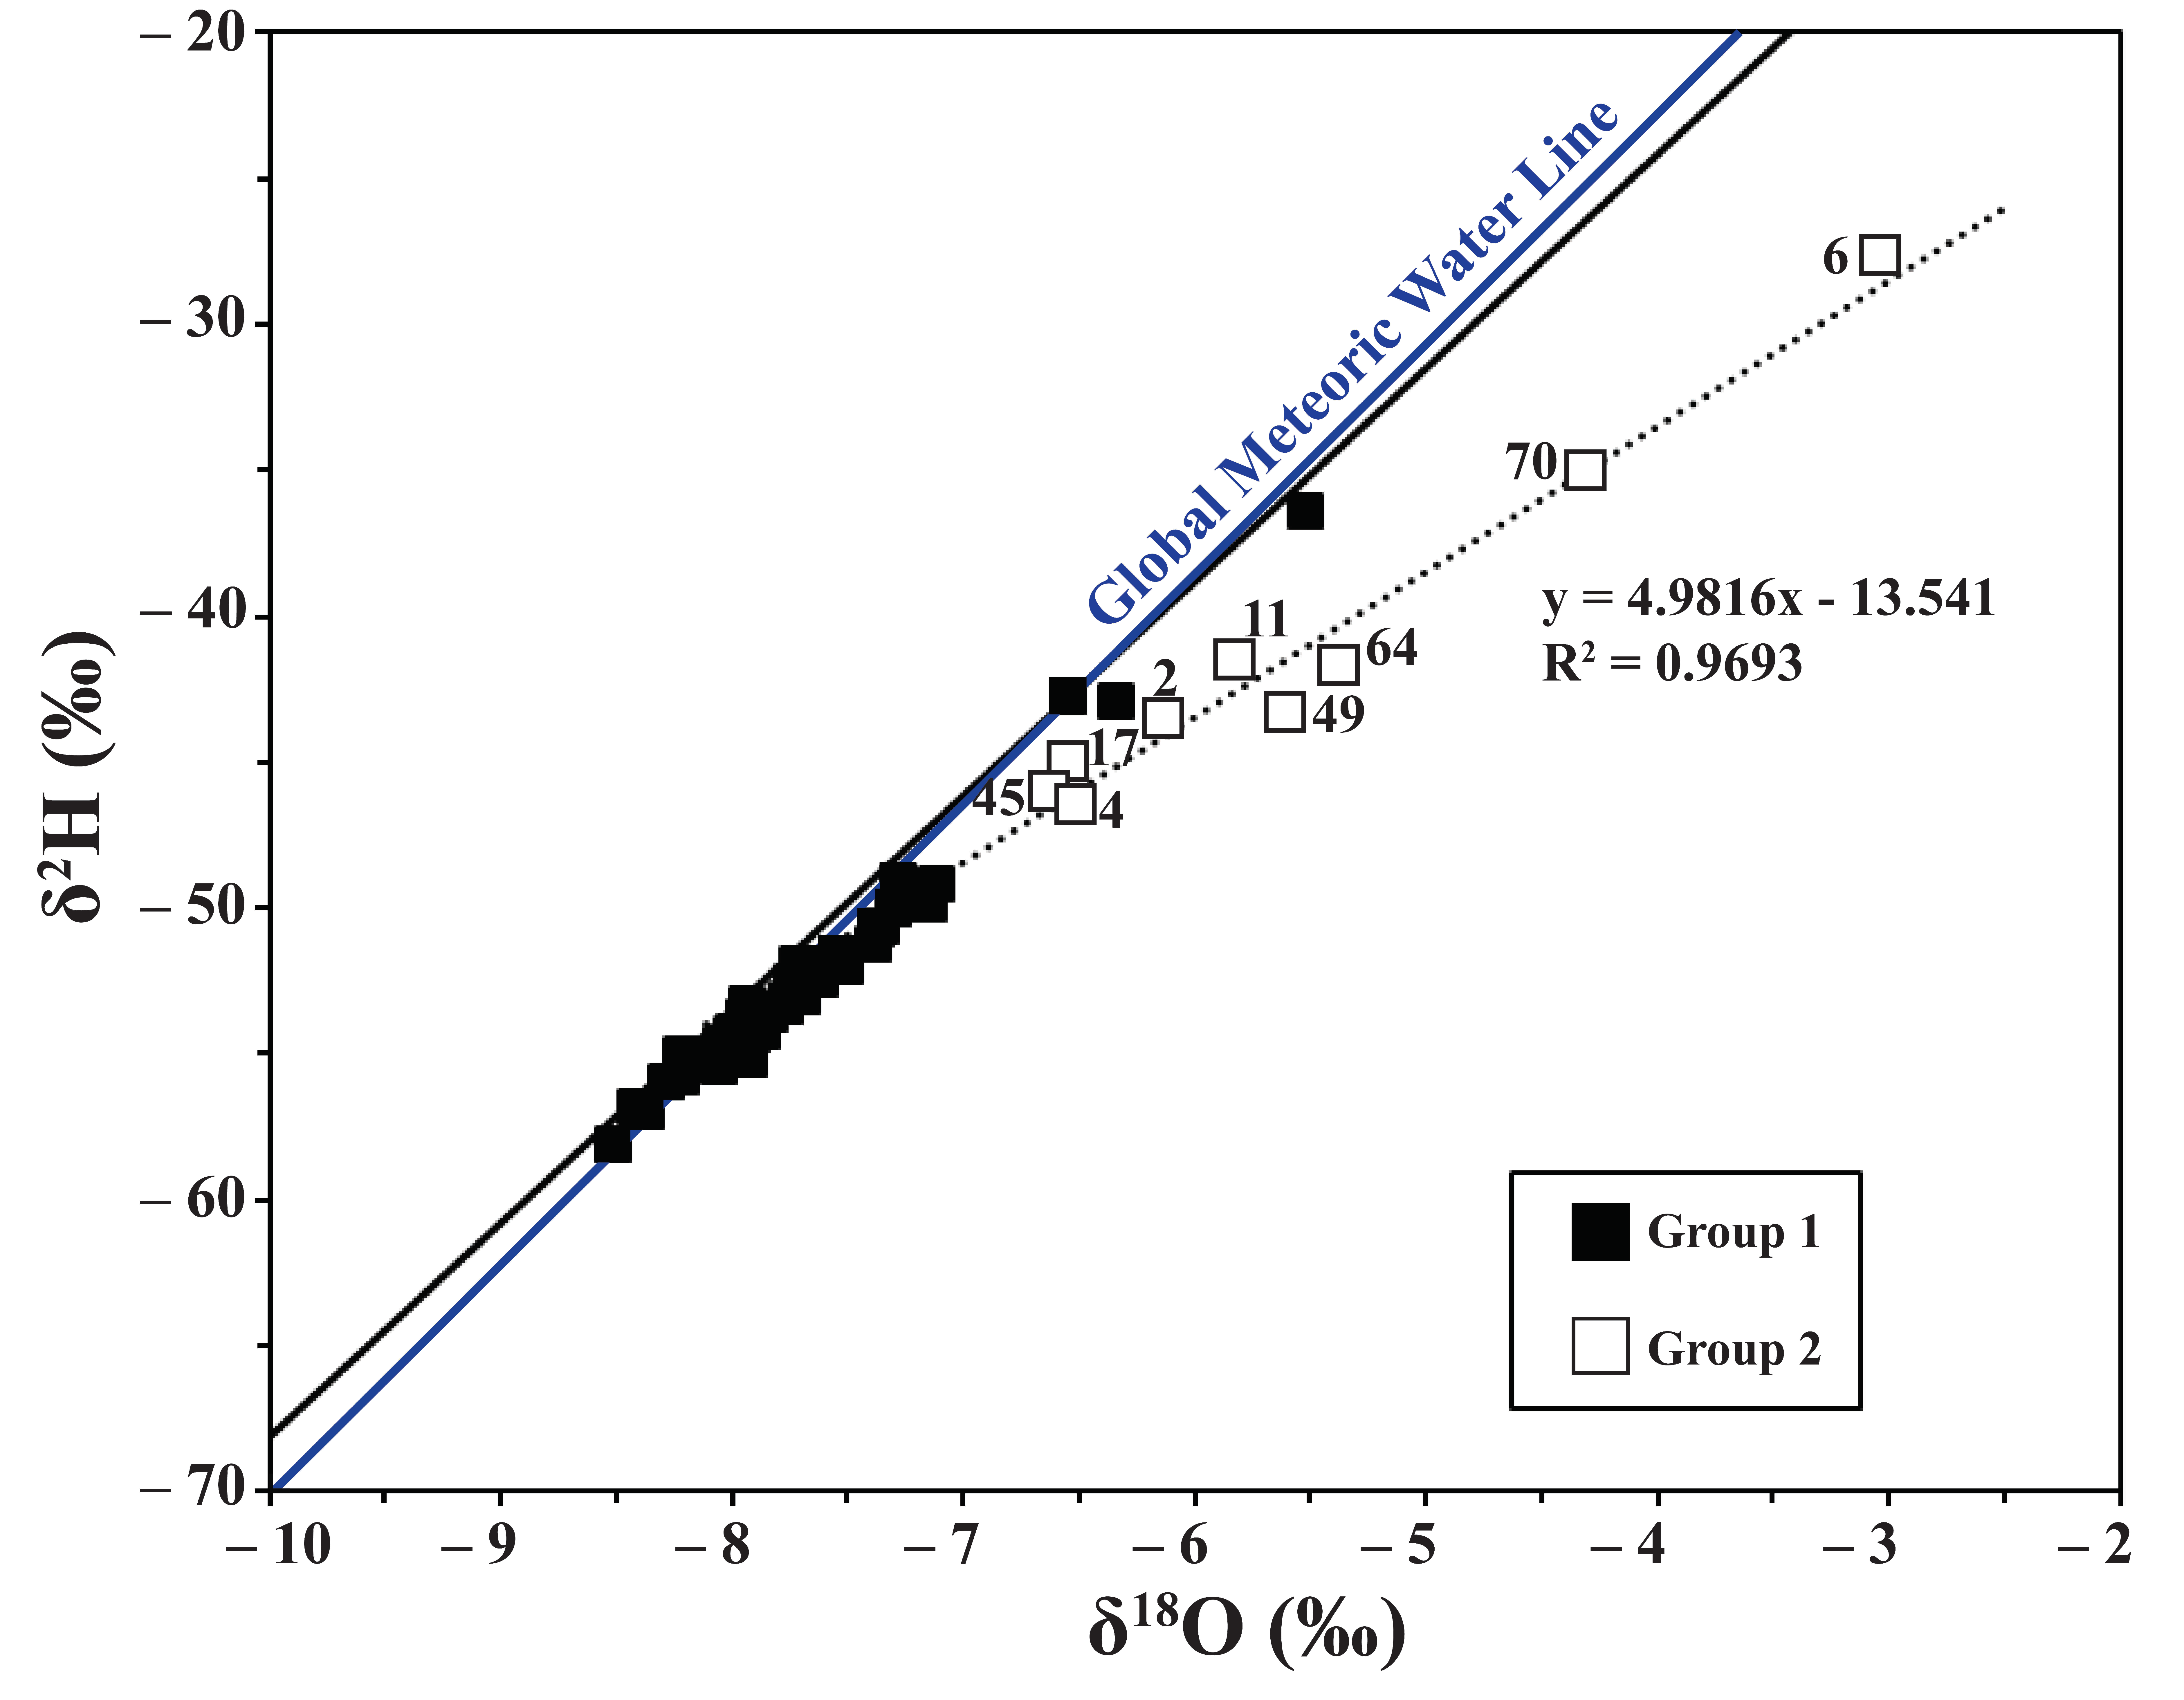
3.3. Stable Isotope of Groundwater (δ18O, δ2H)

Stable isotope was analyzed around the rainfall catchment area and surface water infiltrated to the groundwater area, which showed the different ratios of isotopes. The results showed that δ18O ranged between −8.52‰ to −3.02‰ with an average of −7.35 ± 1.04‰, and 2H ranged between −58.02‰ to −27.80‰ with an average of −50.58 ± 5.90‰. When comparing the analyzed data to Bangkok Local Meteoric Water Line (BKK LMWL) [28], as shown in Figure 9, the data could be divided into two groups. The first group of isotopes were similar to BKK LMWL, which suggested that the locations of the wells were recharged directly from rainfall and distributed in the central, eastern, and western areas (Supplementary Figure S1).

4. Discussion

4.1. Hydrogeochemical Processes That Affect Groundwater Chemistry

The analysis of groundwater quality with aquifer types indicated that the types of groundwater did not differ, and showed that alluvial deposits originated from rock weathering of the study area. However, groundwater in a granitic aquifer showed high amounts of Cl, which indicates that the types of groundwater mainly consisted of Ca-Cl, Ca-Na-Cl, and Na-Cl [28]. The hydrochemical data for the weathered granite aquifer in Chucheon, Korea were Ca-HCO3 and Ca-Cl(NO3+SO4). The Ca-Cl(NO3+SO4) type showed higher NO3-N concentrations in the western part of the area, where residents, farmland, livestock and barns exist. A gentle slopes area also exists [16]. Basalt has the main ion such as Ca2+, Mg2+ and bicarbonate (HCO3), which are derived from weathering of dolomite, calcite and silicate minerals. The granite has the main ion such as Na+, Mg2+ and chloride (Cl), which originate from weathering of albite and orthoclase [28]. The origin of Ca2+ suggested its origin by the dissolution of basic and intermediate silicate minerals, while Na+ was dissolved from acidic silicate minerals. An increase in concentration of Cl and NO3 was observed in samples collected from residential and agricultural areas [29,30]. For this reason, the Cl concentration in the study area was influenced by human activities and the dissolution of local rocks. In addition, these results were affected by the seawater due to the proximity to the coast. The sulfate concentration in a study by Magesh et al. [21] ranges from 13 to 499 mg/L. A possible source is gypsum-bearing carbonate sedimentary rocks, and the majority of the sampling stations had concentrations of Cl and HCO3 greater than SO42. The average concentration of alkalinity in groundwater was 84.63 mg/L with the highest value at well no. 47. The results indicated that concentrations of bicarbonate were higher than the concentrations of carbonate obtained from the reactions of soil CO2 with dissolution of silicate minerals [21,31].
A statistical analysis to determine the different NO3 concentrations in both seasons by the t-test revealed a significant difference (p < 0.05). In addition, a boxplot diagram (Figure 10) shows the distribution of data and distinguishes two samples. Sabseree [32] showed that the average and 90 percentile concentration of NO3 in the rainy season was greater than those in the summer season. In the rainy season, the groundwater wells showed an anomaly of NO3 in well no. 19, 41, 45, and 48 with 46.85, 49.74, 22.44, and 16.55 mg/L NO3, respectively, and in summer for well no. 41 and 45 with 3.93 mg/L and 6.07 mg/L NO3, respectively. The distribution of the NO3 concentrations did not correspond to the groundwater flow direction. Thus, other factors affect the NO3 contamination in groundwater, for example, the concentration of NO3 in irrigation water was 12.37 mg/L [33]. A study by Hosono et al. [34] discovered that NO3 concentrations of >30 mg/L were transported via livestock farms, which are widely distributed around the recharge area, and detected NO3 concentrations of 62.40 mg/L in the septic system of a construction site. Furthermore, the excessive amount of fertilizer in cultivated land affected the quantities of NO3 of 38.92 mg/L in Quaternary strata [8].
Locations of groundwater wells to evaluate NO3 contamination sources were determined from the NO3 concentration in the rainy and summer seasons. Based on a study by Kolpin et al. [35], the average NO3 concentrations must be greater than 2 mg/L, which implies that they were affected by human activities [36,37,38]. In addition, the locations were selected from the Pesticide DRASTIC (Depth to water, Recharge, Aquifer media, Soil media, Topography, Impact of vadose zone media, and hydraulic Conductivity) [39,40] vulnerability mapping to NO3 [3]. The results revealed 16 interesting wells as follows: well nos. 04, 08, 09, 10, 23, 24, 25, 27, 32, 41, 44, 45, 49, 52, 58, and 64. The mixing curve relationship, i.e., the relation of the NO3-Cl ratio and concentration of Cl (mol/L), was employed to identify three NO3 sources, such as agriculture, waste-water and nature [41]. The chloride concentration in precipitation is 0.5 mg/L [42] and that in unpolluted waters are often below 10 mg/L and sometimes below 1 mg/L [43]. The aquifer prone to seawater intrusion have chloride concentrations range from 5 to 460 mg/L [44], whereas the average chloride levels in contaminated wells is approximately 141 mg/L [45]. The results in Figure 11 show that the majority of groundwater wells were in the mixing curve. This finding implied that the NO3 contamination was derived from three sources in different ratios. Except for well no. 08, 25 and 41, which tend to be affected by waste water because the results were beyond the mixing curve border and deviated to the wastewater source [46,47]. The change in the NO3 concentration from the rainy season to the summer season derived from physical, chemical, and biological processes (i.e., nitrification and/or denitrification processes) that occurred in soil and could not be clearly specified. Similar to the previous study [48], the land use types cause the NO3 contamination in groundwater [49,50,51,52,53].
The NO3 concentrations in different agricultural areas (including urban areas) throughout most of the study area (i.e., sugar cane and pineapple fields, fruit orchards and pastures), which reveals the general use of chemical fertilizers, as shown in boxplot (Figure 12). The boxplot showed an increasing trend for the NO3 concentration in groundwater in pineapple fields. Based on the different land use types, the NO3 concentration in groundwater during the rainy season showed the following the descending trend: pineapples ~ urban > orchard > sugarcane (Figure 12a). In the summer season, the descending trend is expressed as follows: pineapples > urban~orchard > sugarcane (Figure 12b). Moreover, during the rainy season, the variations in the NO3 concentrations in groundwater in pineapple fields were significantly greater than those during the summer season.

4.2. Multivariate Analysis

PCA1 had a factor loading of 5.11 with a total variance of 36.50% including EC, Na+, Cl, Br, TDS and alkalinity. Similar to the study of Cloutier et al. [54] the relationship among Na+, Cl, and Br, which is related to groundwater mixing with Champlain Sea water and solute diffusion from the marine clay aquitard. PCA2 had a factor loading of 1.87 and a total variance of 13.36%, including K+ and NO3. This finding implied that the chemical fertilizer (KNO3) might contaminate the groundwater. The strong correlation between NO3 and K+ probably suggested a common source that is related to the anthropogenic pollution of domestic and agricultural activities. The high K+ detected in the paddy fields during the cultivation period can be attributed to the use of chemical fertilizers [55]. PCA3 had a factor loading of 1.58 and total variance of 11.30% including pH, SO42− and negative for Mg2+. This finding appears to be indicative of the natural processes and water-rock interaction. In addition, the dissolution of carbonate minerals and atmosphere and soil CO2 gases depends on the amount of organic matter and activity of microbes) may be supply HCO3 to groundwater [56]. PCA4 had a factor loading of 1.34 and total variance of 9.55%, including ORP and Ca2+. The temperature was separated as a single group (PCA5). Furthermore, based on the HCA analysis, similarly, the study of Al-ahmadi and El-Fiky [30] determined that one sample presented an anomalous high salinity, which indicates an area of extensive agricultural and irrigation practice. As mentioned, the results of HCA corresponded to the NO3 contamination in the groundwater.
The study area was near a coastal area, and the majority of wells were located in the alluvial deposits in the floodplains (Qfd) (refer to Figure 2 and Figure 3). Thus, groundwater would be easily intruded by sea water. The evidence was the relationship among Ca2+, SO42− and Mg2+, as indicated by the PCA. The results were obtained from the evaporation of sea water [56]. A high concentration of Na+ and Cl in groundwater as the main component ions of sea water caused high values of EC in some groundwater samples. A positive correlation of chloride with TDS and EC indicates the salinity [57,58]. Thus, the quality of the groundwater in this area needs to be carefully checked for future usage. In addition, the Na+ in the groundwater may have derived from granite weathering [59]. Some areas were located in limestone formations and generally consisted of calcite and dolomite. Thus, Ca2+ and Mg2+ were highly detected in groundwater. For examples, at well no. 25, which was located southwest of the area, where far from this well approximately 10 km west is the Ratburi group, which consists of limestone and dolomitic limestone [60]. The amount of Ca2+ and Mg2+ is 71.13 and 99.86 mg/L, respectively (refer to Figure 1). The relationship between K+ and NO3 showed that the use of potassium nitrate (KNO3) fertilizer in a pineapple field would cause a contamination of NO3 in groundwater. For examples, at well no. 41, which is located in the pineapple field, a high amount of NO3 of 49.74 and 3.93 mg/L was detected in the rainy and summer seasons, respectively.

4.3. Stable Isotope of Groundwater (δ18O, δ2H)

The majority of groundwater wells in the second group had high NO3 concentrations, which corresponds to a high permeability of the area. Thus, leachable contaminants can easily leach from the ground surface to groundwater and eventually cause high NO3 concentrations in soil and groundwater. The second group included 11 wells that were distributed mostly around the northwest, central and east areas near the coast. The isotope from this group deviated from BKK LMWL and was close to the evaporation line. The groundwater group was assumed to be affected from the evaporation process. Because these wells were in the unconfined aquifer (Qfd), shallower than the first group, they had a higher evaporation rate. The 1:1 relationship of Na+ and Cl was found at well no. 02 and 17 which were in the northeast part of the study area, indicating the interaction with surface water [4] with seawater intrusion [61]. The equation generated from isotope data of the second group was shown as δ2H = 4.9816 δ18O − 13.541.

5. Conclusions

An investigation was conducted to identify the hydrochemical characteristics of sixty groundwater wells with different hydrogeological characteristics and land use types in the rainy and summer seasons in the Cha Am district of Phetchaburi Province in Thailand. The integration of hydrogeological characteristics and a multivariate statistical analysis of hydrochemical data with stable isotope (δ18O and δ2H) results was able to evaluate the source of groundwater and identify groundwater pollution. Leachate of commercial fertilizer from agricultural areas and wastewater from residential areas have been responsible for NO3 contamination in groundwater, particularly in the rainy season. This study revealed that a combination of multivariate statistical analysis of hydrochemical facies and stable isotopes (δ18O and δ2H) can be employed to identify the sources of groundwater contamination, especially NO3 contamination and seawater intrusion for different land use types and hydrogeological characteristics. According to the results, appropriate guidelines for groundwater usage in terms of groundwater quality and remediation efforts in this area can be further proposed. The variations in the NO3 concentrations between the rainy and the summer season might be caused by the denitrification process. However, this occurrence could not be clearly stated. Therefore, the implementation of nitrogen isotopes, using δ15N and δ18O of NO3, should be applied to directly identify the sources of NO3 and reveal mechanisms of nitrification and/or denitrification in the subsurface environment.

Supplementary Materials

The following are available online at https://www.mdpi.com/2073-4441/12/4/1127/s1, Figure S1: Locations of groundwater wells that were distributed by isotope data ( δ 18O, δ 2H), Table S1: The measured field parameters of groundwater samples in the both season, Table S2: The hydrogeochemical and isotopic of groundwater samples in the rainy season (* NO3 concentration in the summer season).

Author Contributions

Conceptualization S.C.; methodology, S.C.; software, W.W. and T.P.; validation S.C. and W.W.; formal analysis, S.C., W.W. and T.P.; investigation, T.P.; resources, S.C.; data curation, S.C. and W.W.; writing—original draft preparation, S.C. and W.W.; writing—review and editing, S.C.; visualization, W.W.; supervision, S.C.; project administration, S.C.; funding acquisition, S.C. All authors have read and agreed to the published version of the manuscript.

Funding

This research was funded by Grant for Research: Government Budget, Chulalongkorn University, Grant for Research: Government Budget, Chulalongkorn University grant number GBA-60-0027-23-006-1, the Grant for International Research Integration: Chula Research Scholar, Ratchadaphiseksomphot Endowment Fund grant number GCURS-59-06-79-01, the Second Century Fund (C2F), Chulalongkorn University, and The APC was partially funded by Ratchadaphiseksomphot Endowment Fund, Chulalongkorn University.

Acknowledgments

This study was success because of the collaboration of many departments. Authors would like to thank the Ratchadaphiseksomphot Endowment Fund, Chulalongkorn University for funding the Research Unit. Authors also thanks to geology department, faculty of science, Chulalongkorn University and Thailand institute of nuclear technology for supporting field survey facilities and laboratory.

Conflicts of Interest

The authors declare no conflict of interest.

References

  1. Fraiture, C.D.; Wichelns, D. Satisfying future water demands for agriculture. Agric. Water Manag. 2010, 97, 502–511. [Google Scholar] [CrossRef]
  2. Khodran, H.; Al-Zahrani, A.l.; Baig, M.B. Water in the Kingdom of Saudi Arabia: Sustainable management options. J. Anim. Plant Sci. 2011, 21, 601–604. [Google Scholar]
  3. Aiuppa, A.; Bellomo, S.; Brusca, L.; D’Alessandro, W.; Federio, C. Natural and anthropogenic factors affecting groundwater quality of an active volcano (Mt. Etna, Italy). Appl. Geochem. 2003, 18, 863–882. [Google Scholar] [CrossRef]
  4. Department of Agriculture. Report of Polluted Situation of Thailand; Department of Agriculture, Ministry of Natural Resources and Environment: Bangkok, Thailand, 2017. (In Thai)
  5. Shindo, J.; Okamoto, K.; Kawashima, H. Prediction of the environmental effects of excess nitrogen caused by increasing food demand with rapid economic growth in eastern Asian countries. Ecol. Model. 2006, 193, 703–720. [Google Scholar] [CrossRef]
  6. Scanlon, B.R.; Jolly, I.; Sophocleous, M.; Zhang, L. Global impacts of conversions from natural to agricultural ecosystems on water resources: Quantity versus quality. Water Resour. Res. 2007, 43, 1–18. [Google Scholar] [CrossRef] [Green Version]
  7. Aravena, R.; Auge, M.; Bucich, N.; Nagy, M.I. Evalution of the origin of groundwater nitrate in the city La Plata, Argentina, using isotope technique. In Proceedings of the Hydrogeology and Land Use Management, XXIX IAH Congress, Bratislava, Slovakia, 6–10 September 1999. [Google Scholar]
  8. Jiang, Y.; Wu, Y.; Groves, C.; Yuan, D.; Kambesis, P. Natural and anthropogenic factors affecting the groundwater quality in the Nandong karst underground river system in Yunan, China. J. Contam. Hydrol. 2009, 109, 49–61. [Google Scholar] [CrossRef]
  9. William, A.; Johnson, J.; Lund, L.; Kabala, Z. Spatial and temporal variations in nitrate contamination of a rural aquifer, California. J. Environ. Qual. 1998, 27, 1147–1157. [Google Scholar] [CrossRef]
  10. Lockhart, K.M.; King, A.M.; Harter, T. Identifying sources of groundwater nitrate contamination in a large alluvial groundwater basin with highly diversified intensive agricultural production. J. Contam. Hydrol. 2013, 151, 140–154. [Google Scholar] [CrossRef]
  11. Greer, F.R.; Shannon, M. Infant methemoglobinemia: The role of dietary nitrate in food and water. Pediatrics 2005, 116, 784–786. [Google Scholar] [CrossRef] [Green Version]
  12. Townsend, A.R.; Howarth, R.W.; Bazzaz, F.A.; Booth, M.S.; Cleveland, C.C.; Collinge, S.K.; Dobson, A.P.; Epstein, P.R.; Holland, E.A.; Keeney, D.R.; et al. Human health effects of a changing global nitrogen cycle. Front. Ecol. Environ. 2003, 1, 240–246. [Google Scholar] [CrossRef]
  13. Chaijan, C. Evaluation of Water Demand in Huay Sai Royal Development Study Center and Adjacent Areas, Amphoe Cha-Am, Changwat Phetchaburi. Bachelor’s Thesis, Chulalongkorn University, Bangkok, Thailand, 2012. (In Thai). [Google Scholar]
  14. Spalding, R.F.; U, Z.K.; Hyun, S.W.; Martin, G.E.; Burbach, M.E.; Yang, S.I.I.; Kim, M.; Exner, M.E.; Song, S.J. Source Identification of Nitrate on Cheju Island, South Korea. Nutr. Cycl. Agroecosyst. 2001, 61, 237–246. [Google Scholar] [CrossRef] [Green Version]
  15. Spalding, R.F.; Exner, M.E. Occurrence of nitrate in groundwater-A review. J. Environ. Qual. 1993, 22, 392–402. [Google Scholar] [CrossRef]
  16. Kaown, D.; Koh, D.C.; Mayer, B.; Lee, K.K. Identification of nitrate and sulfate sources in groundwater using dual stable isotope approaches for an agricultural area with different land use (Chuncheon, mid-eastern Korea). Agric. Ecosyst. Environ. 2009, 132, 223–231. [Google Scholar] [CrossRef]
  17. Mungdee, S. Evaluation of Groundwater Recharge Potential Using GIS Technique in Huay Sai Royal Development Study Center and Adjacent Areas, Amphoe Cha-Am, Changwat Phetchaburi. Bachelor’s Thesis, Chulalongkorn University, Bangkok, Thailand, 2012. (In Thai). [Google Scholar]
  18. Konkul, J.; Rojborwornwittaya, W.; Chotpantarat, S. Hydrogeologic characteristics and groundwater potentiality mapping using potential surface analysis in Huay Sai area, Phetchaburi province. Geosci. J. 2014, 18, 89–103. [Google Scholar] [CrossRef]
  19. Thailand Meteorological Department (TMD). The Climate of Thailand; Thai Meteorological Department: Bangkok, Thailand, 2012.
  20. Land Development Department (LDD). Land Use Map of Phetchaburi Province 2009; Ministry of Agriculture and Cooperatives: Bangkok, Thailand, 2009. (In Thai)
  21. Magesh, N.S.; Krishnakumar, S.; Chandrasekar, N.; Soundranayagam, J.P. Groundwater quality assessment using WQI and GIS techniques, Dindigul district, Tamil Nadu, India. Arab. J. Geosci. 2013, 6, 4179–4189. [Google Scholar] [CrossRef]
  22. Waleeittikul, A. Hydrogeochemical Characteristics of Aquifers in Huay Sai Royal Development Study Center and Adjacent Areas, Amphoe Cha-Am, Changwat Phetchaburi. Bachelor’s Thesis, Chulalongkorn University, Bangkok, Thailand, 2013. (In Thai). [Google Scholar]
  23. Mohapatra, P.K.; Vijay, R.; Pujari, P.R.; Sundaray, S.K.; Mohanty, B.P. Determination of processes affecting groundwater quality in the coastal aquifer beneath Puri city, India: A multivariate statistical approach. Water Sci. Technol. 2011, 64, 809–817. [Google Scholar] [CrossRef]
  24. Thivya, C.S.; Thilagavathi, R.; Prasanna, M.V.; Singaraja, C.; Adithya, V.S.; Nepolian, M. A multivariate statistical approach to identify the spatio-temporal variation of geochemical process in a hard rock aquifer. Environ. Monit. Assess. 2015, 187, 15. [Google Scholar] [CrossRef]
  25. Kim, H.S.; Park, S.R. Hydrogeochemical Characteristics of Groundwater Highly Polluted with Nitrate in an Agricultural Area of Hongseong, Korea. Water 2016, 8, 345. [Google Scholar] [CrossRef] [Green Version]
  26. Belkhiri, L.; Boudoukha, A.; Mouni, L. A multivariate Statistical Analysis of Groundwater Chemistry Data. Int. J. Environ. Res. 2011, 5, 537–544. [Google Scholar]
  27. Kaiser, H.F. The varimax criterion for analytic rotation in factor analysis. Psychometrika 1958, 23, 187–200. [Google Scholar] [CrossRef]
  28. IAEA/WMO. Global Network of Isotopes in Precipitation. The GNIP Database. Available online: http://www-naweb.iaea.org/napc/ih/index.html (accessed on 15 July 2017).
  29. Sonkahmble, S.; Sahya, A.; Mondal, N.C.; Harikumar, P. Appraisal and evolution of hydrochemical processes from proximity basalt and granite areas of Deccan Volcanic Province (DVP) in India. J. Hydrol. 2012, 438, 181–193. [Google Scholar] [CrossRef]
  30. Al-ahmadi, M.E.; EI-Fiky, A.A. Hydrogeochemical evaluation of shallow alluvial aquifer of Wadi Marwani, western Saudi Arabia. J. King Saud Univ. Sci. 2009, 21, 179–190. [Google Scholar] [CrossRef] [Green Version]
  31. Bhardwaj, V.; Singh, D.S.; Singh, A.K. Water quality of the Chhoti Gandak River using principal component analysis, Ganga Plain, India. J. Earth Syst. Sci. 2010, 119, 117–127. [Google Scholar] [CrossRef] [Green Version]
  32. Sabseree, J. Learning about Box Plot. Quality 2010, 16, 35–37. (In Thai) [Google Scholar]
  33. Mousavi, S.R.; Balali-Mood, M.; Riahi-Zanjani, B.; Sadeghi, M. Determination of cyanide and nitrate concentrations in drinking, irrigation, and wastewaters. J. Res. Med. Sci. 2013, 18, 65–69. [Google Scholar]
  34. Hosono, T.; Tokunaga, T.; Kagabu, M.; Nakata, H.; Orishikida, T.; Lin, I.T.; Shimada, J. The use of δ15N and δ18O tracers with an understanding of groundwater flow dynamics for evaluating the origins and attenuation mechanisms of nitrate pollution. Water Res. 2013, 47, 2661–2675. [Google Scholar] [CrossRef]
  35. Kolpin, D.; Burkart, M.; Goolsby, D. Nitrate in groundwater of the midwestern United States: A regional on relations to land use and soil properties. In Proceedings of the Impact of Land-Use Change on Nutrient Loads from Diffuse Sources, IUGG 99 Symposium HS03, Birmingham, UK, 15 July 1999. [Google Scholar]
  36. Madison, R.J.; Brunett, J.O. Overview of the Occurrences of Nitrate in Groundwater of the United States; U.S. Geological Survey Water Supply Paper 2275; U.S. Geological Survey: Washington, DC, USA, 1985; pp. 93–105.
  37. Choi, W.J.; Han, G.H.; Lee, S.M.; Lee, G.T.; Yoon, K.S.; Choi, S.M.; Ro, H.M. Impact of land-use types on nitrate concentration and δ15N in unconfined groundwater in rural areas of Korea. Agric. Ecosyst. Environ. 2017, 120, 259–268. [Google Scholar] [CrossRef]
  38. Koh, D.C.; Ko, K.S.; Kim, Y.; Lee, S.G.; Chang, H.W. Effect of agricultural land use on the chemistry of groundwater from basaltic aquifer, Jeju Island, South Korea. Hydrogeol. J. 2007, 5, 727–743. [Google Scholar] [CrossRef]
  39. Aller, L.; Bennett, T.; Lehr, J.H.; Petty, R.J. DRASTIC: A Standardized System for Evaluating Groundwater Pollution Potential Using Hydrogeologic Settings; U.S.-EPA/600/2-85/018; EPA: Washington, DC, USA, 1987.
  40. Alam, F.; Umar, R.; Ahmed, S.; Dar, F.A. A new model (DRASTIC-LU) for evaluating groundwater vulnerability in parts of central Ganga Plain, India. Arab. J. Geosci. 2014, 7, 927–937. [Google Scholar] [CrossRef]
  41. Parkchai, T. Factors and Mechanisms in Groundwater Contamination from Nitrate at Huay Sai Royal Development Study Center and Adjacent Areas in Phetchaburi Province. Master’s Thesis, Chulalongkorn University, Bangkok, Thailand, 2015. (In Thai). [Google Scholar]
  42. Zhang, Y.; Zhou, A.; Zhou, J.; Liu, C.; Cai, H.; Liu, Y.; Xu, W. Evaluating the Sources and Fate of Nitrate in the Alluvial Aquifers in the Shijiazhuang Rural and Suburban Area, China: Hydrochemical and Multi-Isotopic Approaches. Water 2015, 7, 1515–1537. [Google Scholar] [CrossRef] [Green Version]
  43. Liu, Y.; Yamanaka, T. Tracing groundwater recharge sources in a mountain-plain transitional area using stable isotopes and hydrochemistry. J. Hydrol. 2012, 464, 116–126. [Google Scholar] [CrossRef] [Green Version]
  44. Department of National Health and Welfare (Canada). Guideline for Canadian Drinking Water Quality; Supporting Documentation; CRC Press: Ottawa, ON, Canada, 1978.
  45. Phelan, D.J. Water Levels, Chloride Concentrations, and Pumpage in the Coastal Aquifers of Delaware and Maryland; USGS Water Resources Investigations Report 87 4229; Dialog Abstract No. 602039; CRC Press: Washington, DC, USA; U.S. Geological Survey: Washington, DC, USA, 1987.
  46. Morales, E.C. Chemical quality of deep well waters in Cavite, Philippines. Water Qual. Bull. 1987, 12, 43–45. [Google Scholar]
  47. Tang, C.; Chen, J.; Shen, Y. Long-term effect of wastewater irrigation on nitrate in groundwater in the North China Plain, Wastewater Re-use and Groundwater Quality. In Proceedings of the IUGG2003 Symposium HS04, Sapporo, Japan, 3–11 July 2003. [Google Scholar]
  48. Gu, B.; Ge, Y.; Chang, S.X.; Luo, W.D.; Chang, J. Nitrate in groundwater of China: Sources and driving forces. Glob. Environ. Chang. 2013, 23, 1112–1121. [Google Scholar] [CrossRef]
  49. Fenech, C.; Rock, L.; Nolan, K.; Tobin, J.; Morrissey, A. The potential for a suite of isotope and chemical markers to differentiate sources of nitrate contamination: A review. Water Res. 2012, 46, 2023–2041. [Google Scholar] [CrossRef]
  50. Chotpantarat, S.; Boonkaewwan, S. Impacts of land-use changes on watershed discharge and water quality in a large intensive agricultural area in Thailand. Hydrol. Sci. J. 2018, 63, 1386–1407. [Google Scholar] [CrossRef]
  51. Ratchawang, S.; Chotpantarat, S. The leaching potential of pesticide in Song Phi Nong district, Suphan Buri province, Thailand. Environ. Asia 2019, 12, 112–120. [Google Scholar]
  52. Sonthiphand, P.; Ruangroengkulrith, S.; Mhuantong, W.; Charoensawan, V.; Chotpantarat, S.; Boonkaewwan, S. Metagenomic insights into microbial diversity in a groundwater basin impacted by a variety of anthropogenic activities. Environ. Sci. Pollut. Res. 2019, 26, 26765–26781. [Google Scholar] [CrossRef]
  53. Ratchawang, S.; Chotpantarat, S. Nitrate contamination in groundwater in sugarcane field, Suphan Buri province, Thailand. Int. J. Recent Technol. Eng. 2019, 8, 239–242. [Google Scholar]
  54. Cloutier, V.; Lefebvre, R.; Therrien, R.; Savard, M.M. Multivariate statistical analysis of geochemical data as indicative of the hydrogeochemical evolution of groundwater in a sedimentary rock aquifer system. J. Hydrol. 2008, 353, 294–313. [Google Scholar] [CrossRef]
  55. Li, J.; Li, F.; Liu, Q.; Suzuki, Y. Nitrate pollution and its transfer in surface water and groundwater in irrigated areas: A case study of the Piedmont of South Taihang Mountains, China. Environ. Sci. Process. Impacts 2014, 16, 2764–2773. [Google Scholar] [CrossRef]
  56. Timofeeff, M.N.; Lowenstein, T.K.; Da Silva, M.A.M.; Harris, N.B. Secular variation in the major-ion chemistry of seawater: Evidence from fluid inclusions in Cretaceous halites. Geochim. Cosmochim. Acta 2006, 70, 1977–1994. [Google Scholar] [CrossRef]
  57. Sameer, V.Y.; Hampannavar, U.S.; Purandara, B.K. Assessment of chloride concentration in groundwater: A case study for Belgaum City. Int. J. Environ. Sci. 2011, 2, 271–280. [Google Scholar]
  58. Janardhana Raju, N.; Ram, P.; Dey, S. Groundwater Quality in the Lower Varuna River Basin, Varanasi District, Uttar Pradesh. J. Geol. Soc. India 2009, 73, 178–192. [Google Scholar] [CrossRef]
  59. Momeni, A.A.; Khanlari, G.R.; Heidari, M.; Sepahi, A.A.; Bazvand, E. New engineering geological weathering classifications for granitoid rocks. Eng. Geol. 2015, 185, 43–51. [Google Scholar] [CrossRef]
  60. Department of Mineral Resources (DMR). The Classification of Geology and Mineral Resources in Phetchaburi District, Thailand; CRC Press: Boca Raton, FL, USA, 2008. (In Thai)
  61. Sae-Ju, J.; Chotpantarat, S.; Thitimakorn, T. Hydrochemical, geophysical and multivariate statistical investigation of the seawater intrusion in the coastal aquifer at Phetchaburi Province. Thail. J. Asian Earth Sci. 2020, 191, 140165. [Google Scholar] [CrossRef]
Figure 1. Geological map of the study area.
Water 12 01127 g001
Figure 2. Hydrogeologic cross-section of section A-A’ (modified from [18]).
Water 12 01127 g002
Figure 3. Hydrogeologic cross-section of section B-B’ (modified from [18]).
Water 12 01127 g003
Figure 4. Agriculture areas in the study area [20].
Water 12 01127 g004
Figure 5. Piper diagram of groundwater in the rainy season.
Water 12 01127 g005
Figure 6. NO3 concentrations in both rainy and summer seasons of study area at Cha Am district, Phetchaburi province.
Water 12 01127 g006
Figure 7. Dendrogram from hierarchical cluster analysis (HCA).
Water 12 01127 g007
Figure 8. Locations of groundwater wells that were distributed by HCA; red points are HCA1, yellow points are HCA2, black points are HCA3 and green point is HCA4.
Water 12 01127 g008
Figure 9. Isotopes of δ2H and δ18O of groundwater compared with Bangkok Local Meteoric Water Line (BKK LMWL).
Water 12 01127 g009
Figure 10. Box plot showing NO3 concentrations at 90 percentile in both seasons.
Water 12 01127 g010
Figure 11. Nitrate-Chloride ratio and chloride concentration in rainy season (modified from [35]).
Water 12 01127 g011
Figure 12. Box plot of NO3 concentrations in different land use types in (a) rainy season and (b) summer season.
Water 12 01127 g012
Table 1. Summary of statistic of measured field parameters in 60 groundwater samples.
SeasonsStatisticSurface Elevation (m, amsl)pHEC (µS/cm)Temp (°C)ORP (mV)TDS (mg/L)
RainyMin21.06.32.024.9−175.01.3
Max130.08.04270.037.7171.12430.0
Average63.287.21203.128.526.0693.6
25%54.007.01022.526.8−50.2581.0
Median59.007.21241.028.554.5665.0
75%69.007.31335.029.4101.8749.0
SummerMin20.06.7153.525.0−297.996.4
Max140.09.24450.032.0251.12490.0
Average62.17.51027.928.9102.2587.3
25%47.637.1554.028.038.7340.5
Median54.57.4824.029.0145.9494.0
75%67.67.71279.030.0185.3687.0
Table 2. Summary of statistic of concentrations of dissolved components measured in 60 groundwater samples.
SeasonStatisticCa2+ (mg/L)Mg2+ (mg/L)Na+ (mg/L)K+ (mg/L)HCO3 (mg/L)CO32− (mg/L)NO3 (mg/L)SO42− (mg/L)Cl (mg/L)Br (mg/L)
RainyMin3.90.316.92.210.02.00.030.212.50.4
Max227.059.0685.234.2212.018.049.7202.2528.18.8
Average86.729.6144.010.386.87.86.0227.0149.23.1
25%46.520.385.86.365.04.00.64.381.52.6
Median76.830.7106.37.986.06.02.911.8143.62.9
75%112.443.1171.711.6103.010.06.124.9175.63.5
Table 3. Results of correlation matrix analysis using Pearson’s correlation coefficient (R2). Bold letter for R2 > 0.5.
VariablesTpHORPECNa+K+Ca2+Mg2+AlkalinityClSO42−TDSBrNO3
T1.000
pH0.1761.000
ORP−0.1510.0241.000
EC0.039−0.011−0.1151.000
Na+−0.1940.167−0.0640.6891.000
K+0.0440.1090.0330.2240.2131.000
Ca2+−0.108−0.0420.3360.0960.130−0.0321.000
Mg2+−0.044−0.3010.0800.3710.0870.0350.1611.000
alkalinity−0.172−0.0150.0000.7120.7150.0310.3030.4421.000
Cl−0.0360.113−0.0450.6300.6710.2810.3130.2690.5261.000
SO42−0.2090.1780.1030.0800.3670.0220.292−0.1510.3020.5231.000
TDS−0.0770.024−0.1400.8790.8020.2530.1630.3700.7180.7260.1411.000
Br−0.1650.000−0.0880.7370.7050.1540.2670.4670.7390.8640.3640.7791.000
NO3−0.0760.0090.2950.0330.1490.5340.007−0.112−0.0200.2040.2890.0270.0781.000
Table 4. Results of principal component analysis by Varimax with Kaiser Normalization [27]. Bold letter for R2 > 0.5.
Component
12345
T−0.076−0.0020.069−0.0570.885
pH0.0730.0200.7260.0160.392
ORP−0.1730.253−0.0680.768−0.065
EC0.8780.083−0.165−0.0930.142
Na+0.8430.1180.230−0.067−0.168
K+0.1920.847−0.023−0.0800.162
Ca2+0.230−0.1440.0330.801−0.028
Mg2+0.416−0.075−0.7080.2380.098
alkalinity0.834−0.124−0.0980.166−0.126
Cl0.8310.1810.1930.177−0.019
SO42−0.3240.0780.6010.328−0.401
TDS0.9280.081−0.098−0.0800.042
Br0.9150.025−0.0430.114−0.107
NO30.0100.8650.1260.167−0.177

