Removal of Aquatic Cadmium Ions Using Thiourea Modified Poplar Biochar


1
College of Chemical Engineering, Huaqiao University, Xiamen 361021, China
2
Low Carbon Energy Institute, China University of Mining and Technology, Xuzhou 221008, China
*
Authors to whom correspondence should be addressed.
Water 2020, 12(4), 1117; https://doi.org/10.3390/w12041117
Submission received: 13 March 2020
/
Revised: 11 April 2020
/
Accepted: 11 April 2020
/
Published: 14 April 2020
(This article belongs to the Special Issue Adsorbents for Water and Wastewater Treatment and Resource Recovery)
Abstract
:Removal of aquatic cadmium ions using biochar is a low-cost method, but the results are usually not satisfactory. Modified biochar, which can be a low-cost and efficient material, is urgently required for Cd-polluted water and soil remediation. Herein, poplar bark (SB) and poplar sawdust (MB) were used as raw materials to prepare modified biochar, which is rich in N- and S- containing groups, i.e., TSBC-600 and TMBC-600, using a co-pyrolysis method with thiourea. The adsorption characteristics of Cd2+ in simulated wastewater were explored. The results indicated that the modification optimized the surface structure of biochar, Cd2+ adsorption process by both TSBC-600 and TMBC-600 was mainly influenced by the initial pH, biochar dosage, and contact time, sthe TSBC-600 showed a higher adsorption capacity compared to TMBC-600 under different conditions. The Langmuir adsorption isotherm model and pseudo-second-order kinetic model were more consistent with the adsorption behavior of TSBC-600 and TMBC-600 to Cd2+, the maximum adsorption capacity of TSBC-600 and TMBC-600 calculated by the Langmuir adsorption isotherm model was 19.998 mg/g and 9.631 mg/g, respectively. The modification method for introducing N and S into biochar by the co-pyrolysis of biomass and thiourea enhanced the removal rate of aquatic cadmium ions by biochar.
1. Introduction
Cadmium (Cd) has extreme biological toxicity, long half-life, and low elimination efficiency [1]. It is one of the “ten chemicals of major public health concern” listed by the World Health Organization [2]. Cd can readily cause damage to the internal organs and systems of the human body, and is the most toxic transition metal element that poses global human health risks [3]. In 2014, the fraction of points that exceeded the standard quantity of Cd in cultivated land in China was 7% [4], and the area of farmland polluted by Cd reached 20 million hectares, which was mainly caused by irrigation due to industrial wastewater [5]. With the improvement in food safety standards and environmental awareness of the public, the prevention of Cd contamination of the food chain has become a common concern [6].
Irrigation using wastewater is the main source of Cd pollution in farmland soil [7]. Therefore, eliminating Cd from wastewater is the most effective remediation method [8]. Currently, the methods for the removal of Cd2+ in wastewater are mainly chemical precipitation, ion exchange, membrane separation, coagulation, and adsorption [9]. Among them, the adsorption method is widely used due to the low energy consumption, high removal rate, and simple operation. Biochar is a type of carbon-rich porous material [10], which is accessible by high-temperature conversion of biomass in anoxic or anaerobic environments. It has been widely used in sewage treatment. Li et al. used vinegar-residue biochar to adsorb Cd2+ in water, while the maximum adsorption capacity for Cd2+ was only 2.91 mg/g [11]. Yakkala et al. prepared Buffal weed biochar to adsorb Cd2+ and Pb2+ in water, and the adsorption capacity was 11.63 mg/g and 333.33 mg/g, respectively [12]. Jing et al. prepared biochar to adsorb Cd2+ in soil, and the adsorption capacity was 5.00 mg/g [13]. Although biochar can adsorb cadmium ion to some extent, it is limited by the surface pore structure and functional groups, and the single biochar adsorption capacity is very limited [14]. To maximize the adsorption of biochar, modification by doping becomes an important method to optimize the pore structure of biochar and increase the functional groups and specific adsorption sites. Currently, the main methods include chemical modification of the surface, co-pyrolysis, and catalytic esterification [15,16,17]. Previous studies have shown that the type of modifier, as well as the modification method can affect the quality of the modified biochar [18,19,20]. Ma et al. synthesized modified biochar rich in -NH2 by cross-linking using polyethyleneimine as the modifier, and the maximum adsorption capacity of the modified biochar to Cr6+ was 435 mg/g, much higher than the 23.09 mg/g before modification [21]. Park et al. prepared sulfur-modified biochar by the co-pyrolysis of sulfur and wood chips at 600 °C; after impregnation, the maximum adsorption capacity of the modified biochar for mercury was 107.5 mg/g, which was higher than that of the raw materials by 86%. This modification method enables sulfur to be doped into the biochar structure in the form of groups and enhanced the specific adsorption capacity of biochar [22]. At present, sulfur and nitrogen-modified biochar are the most common technologies, which have several disadvantages such as low practicability, low utilization of modifiers, and one modifier that can only be completed via modification [23].
Therefore, the specific objectives of this study are: (1) to prepare biochar with stable performance, rich functions, strong adsorption capacity, and multiple modifications as one step pyrolysis; (2) to compare the microstructure and physical characteristics of raw biochar and modified biochar by multiple techniques; (3) to evaluate the adsorption characteristics of thiourea-modified biochar on cadmium ions under different conditions, and experimental data were investigated with isotherm model and kinetic sorption model. The main aims of this study include understanding the role of the modified biochar produced from co-pyrolysed thiourea in the removal of Cd2+, and providing technical support for its application in environmental remediation.
2. Materials and Methods
2.1. Preparation of Thiourea Modified Biochar
The collected sawdust and bark (from Wenchang Campus of China University of Mining and Technology, Xuzhou, Jiangsu, China) were thoroughly washed with deionized water and dried in an oven at 60 °C for 24 h. The biomass raw material and thiourea were weighed at a mass ratio of 1:1, respectively, and placed in a tubular furnace under an argon atmosphere after even mixing. The furnace was heated up to 300 to 700 °C at a heating rate of 5 °C/min and kept at the same temperature for 2 h to prepare thiourea-modified biochar (denoted as TSBC-600 and TMBC-600, where T stands for the pyrolysis temperature). The samples were crushed, passed through a 60-mesh sieve, and stored for future use (preparation is shown in Figure S1).
For comparison, unmodified biochar materials (MBC-600, SBC-600) were prepared by heating to 600 °C at 5 °C/min in an argon atmosphere without adding thiourea.
2.2. Physicochemical Properties and Structural Characterization of Biochar
Deionized water and biochar were mixed at a mass ratio of 20:1, and the pH value of the aqueous solution was measured with a pH meter to determine the acidity and basicity of the biochar. The ash content was measured by the combustion method [24]. The specific surface area and pore size distribution of biochar were investigated using N2-isothermal adsorption and desorption experiments. The specific surface area of the material was calculated using the Brauner-Emmett-Teller (BET) equation, and the pore size distribution of the materials was determined by using the Density functional theory (DFT) model.
Field emission scanning electron microscope/energy-dispersive X-ray spectroscopy (SEM-EDX) (FEI QuantaTM 250, FEI, Boston, MA, USA) was used to observe the surface morphology; Fourier transform infrared spectroscopy (FTIR) (VERTEX 80V, Bruker, Karlsruhe, Germany) was used to characterize the surface properties of biochar. Typically, approximately 0.02 g of the dry sample was thoroughly mixed with KBr and pressed into semi-transparent pellets using a manual hydraulic press, and all spectra were acquired with a resolution of 2 cm−1 for 28 scans, over a wavenumber range between 400 and 4000 cm−1. X-ray photoelectron spectroscopy (XPS) (ESCALAB 250Xi, Thermo Fisher, Boston, MA, USA) was used to characterize the chemical state of the biomass carbon material, and the binding energy values were all calibrated based on the hydrocarbon contamination using the C 1s peak at 284.8 eV.
2.3. Batch Adsorption Experiment
2.3.1. Determining the Relationship between Pyrolysis Temperature and Biochar Adsorption Performance
An amount of 0.02 g of the modified biochar prepared at five different temperatures was placed into a centrifuge tube, 20 mL of 10 mg/L Cd2+ solution was added and then shaken well. The mixture was oscillated at 25 °C for 24 h. Finally, the optimal pyrolysis temperature of biochar was determined.
2.3.2. Determining the Relationship between pH and the Amount of Cd2+ Adsorbed by Biochar
Amounts of 0.01 mol/L HCl and 0.01 mol/L NaOH were used to modulate the pH of 20 mL of 10 mg/L Cd2+ solution to 2, 3, 4, 5, 6, and 7 for minimizing the effect of Cd-chloride hydrolysis, then weremplaced one hour and there was no observed precipitation by the transillumination test, and then 0.02 g modified biochar were added. The mixture was mixed well and oscillated at 25 °C for 24 h.
2.3.3. Determination of the Relationship between the Dosage and the Capacity of Cd2+ Adsorbed by Biochar
The concentration of modified biochar was controlled to be 1, 2, 3, 4, 5, 6, 7, 8, 9, 10 g/L, respectively. The pH of the TMBC solution and TSBC solution was modulated to be 7, respectively. The initial concentration of Cd2+ in each solution was 10 mg/L. Finally, the optimal dose of biochar was determined.
2.3.4. Adsorption Kinetics
0.10 g of TMBC-600 was added into a 50 mL centrifuge tube, and subsequently, 20 mL of 100 mg/L Cd2+ solution was added. The pH was adjusted to be 7, and the samples were taken after oscillation for 5, 10, 30, 60, 120, 240, 360, 720, and 1440 min, respectively. For TSBC-600, the mass was 0.08 g, and the other procedures were the same as those of TMBC-600.
The adsorption kinetic equation can reflect the change in the adsorption capacity of the adsorbent to the solute as a function of time, i.e., the speed of the adsorption rate [25]. In this study, the more commonly used pseudo-first-order and pseudo-second-order kinetic model equations were used to fit the adsorption data.
Adsorption capacity:
pseudo-first-order kinetic model equation:
pseudo-second-order kinetic model equation:
where t is the adsorption time (min); C0 is the initial concentration of Cd2+ in the solution (mg/L); Ce is concentration of Cd2+ in the solution when the adsorption reaches equilibrium (mg/L); Ct is the concentration of Cd2+ in the solution at t (mg/L); V is the volume of the solution participation in the adsorption reaction (L); m is the mass of the added biochar (g); qe is the equilibrium adsorption capacity for biochar when the adsorption reaches equilibrium(mg/g); qt is the adsorption capacity for biochar at t (mg/g); k1 is the rate constant of the pseudo-first-order kinetic equation (min−1); k2 is the rate constant of the pseudo-first-order kinetic equation (g/mg/min).
2.3.5. Isothermal Adsorption
An amount of 0.10 g of TMBC-600 was added into a 50 mL centrifuge tube, and then 20 mL of 5, 10, 30, 100, 250, and 500 mg/L Cd2+ solution was added, respectively. The pH was adjusted to be 7 and subsequently oscillated for 24 h at room temperature. For TSBC, the mass was 0.08 g, and the other procedures were the same as those of TMBC-600.
In this study, Langmuir and Freundlich isothermal adsorption models were used to analyze the adsorption of the two modified biochars. For the Langmuir model, it is assumed that the surface of the adsorbent has the same adsorption active sites and that the adsorption occurs in the monolayer [26].
Langmuir equation:
Freundlich equation:
where Qm is the maximum adsorption capacity (mg/g); KL (L/g) is the affinity constant of the interaction between the adsorbate and the adsorbent; Ce is the concentration of the adsorbate when the adsorption reaches equilibrium (mg/L); Kf is the Freundlich adsorption capacity parameter; n is the empirical parameter of the adsorption strength (determined by the heterogeneity of the material).
3. Results
3.1. Effects of Modification on the Physicochemical Properties of Biochar
The physicochemical properties of biochar before and after modification are shown in Table 1. It can be seen from Table 1 that the biochar is alkaline due to the release of alkaline salts during the pyrolysis, and the pH of the biochar is increased after modification. This indicates that the change in pH and the ash content are positively correlated, as the ash of biochar contains K, Ca, Na, Mg, S, and other elements. These elements are attached to the surface of the biochar in the form of oxides and carbonates, and are alkaline in solution [27]. In addition, these inorganic components can co-precipitate with cadmium ions to remove [28]. The N2 adsorption was carried out for the TMBC-600 and TSBC-600 (Figure S2). TMBC-600 and TSBC-600 exhibit reversible type I isotherm, a microporous filling at low P/P0 and a H4 typed hysteresis loop within intermediate and high P/P0, indicating the coexistence of both micropores and meso-/macropores in TMBC-600 and TSBC-600 [29]. From the DFT pore width distribution, TMBC-600 demonstrates low micropores and abundant mesopores, and TSBC-600 shows more micropores. Compared with the samples before modification, the BET specific surface area of TMBC-600 and TSBC-600 increased by 3.08 m2/g and 2.93 m2/g, respectively, and the internal pore diameter increased by 0.17% and 1.48%, indicating that the surface and pore structure of the modified biochar has changed significantly. This is because, during the slow pyrolysis process, the steam generated by the modifier at high temperature penetrates the internal structure of the raw biochar, dredging the pores in it. This is consistent with the research results reported by O’Connor et al. [16].
3.2. Effect of Modification on Morphology and Structure of Biochar
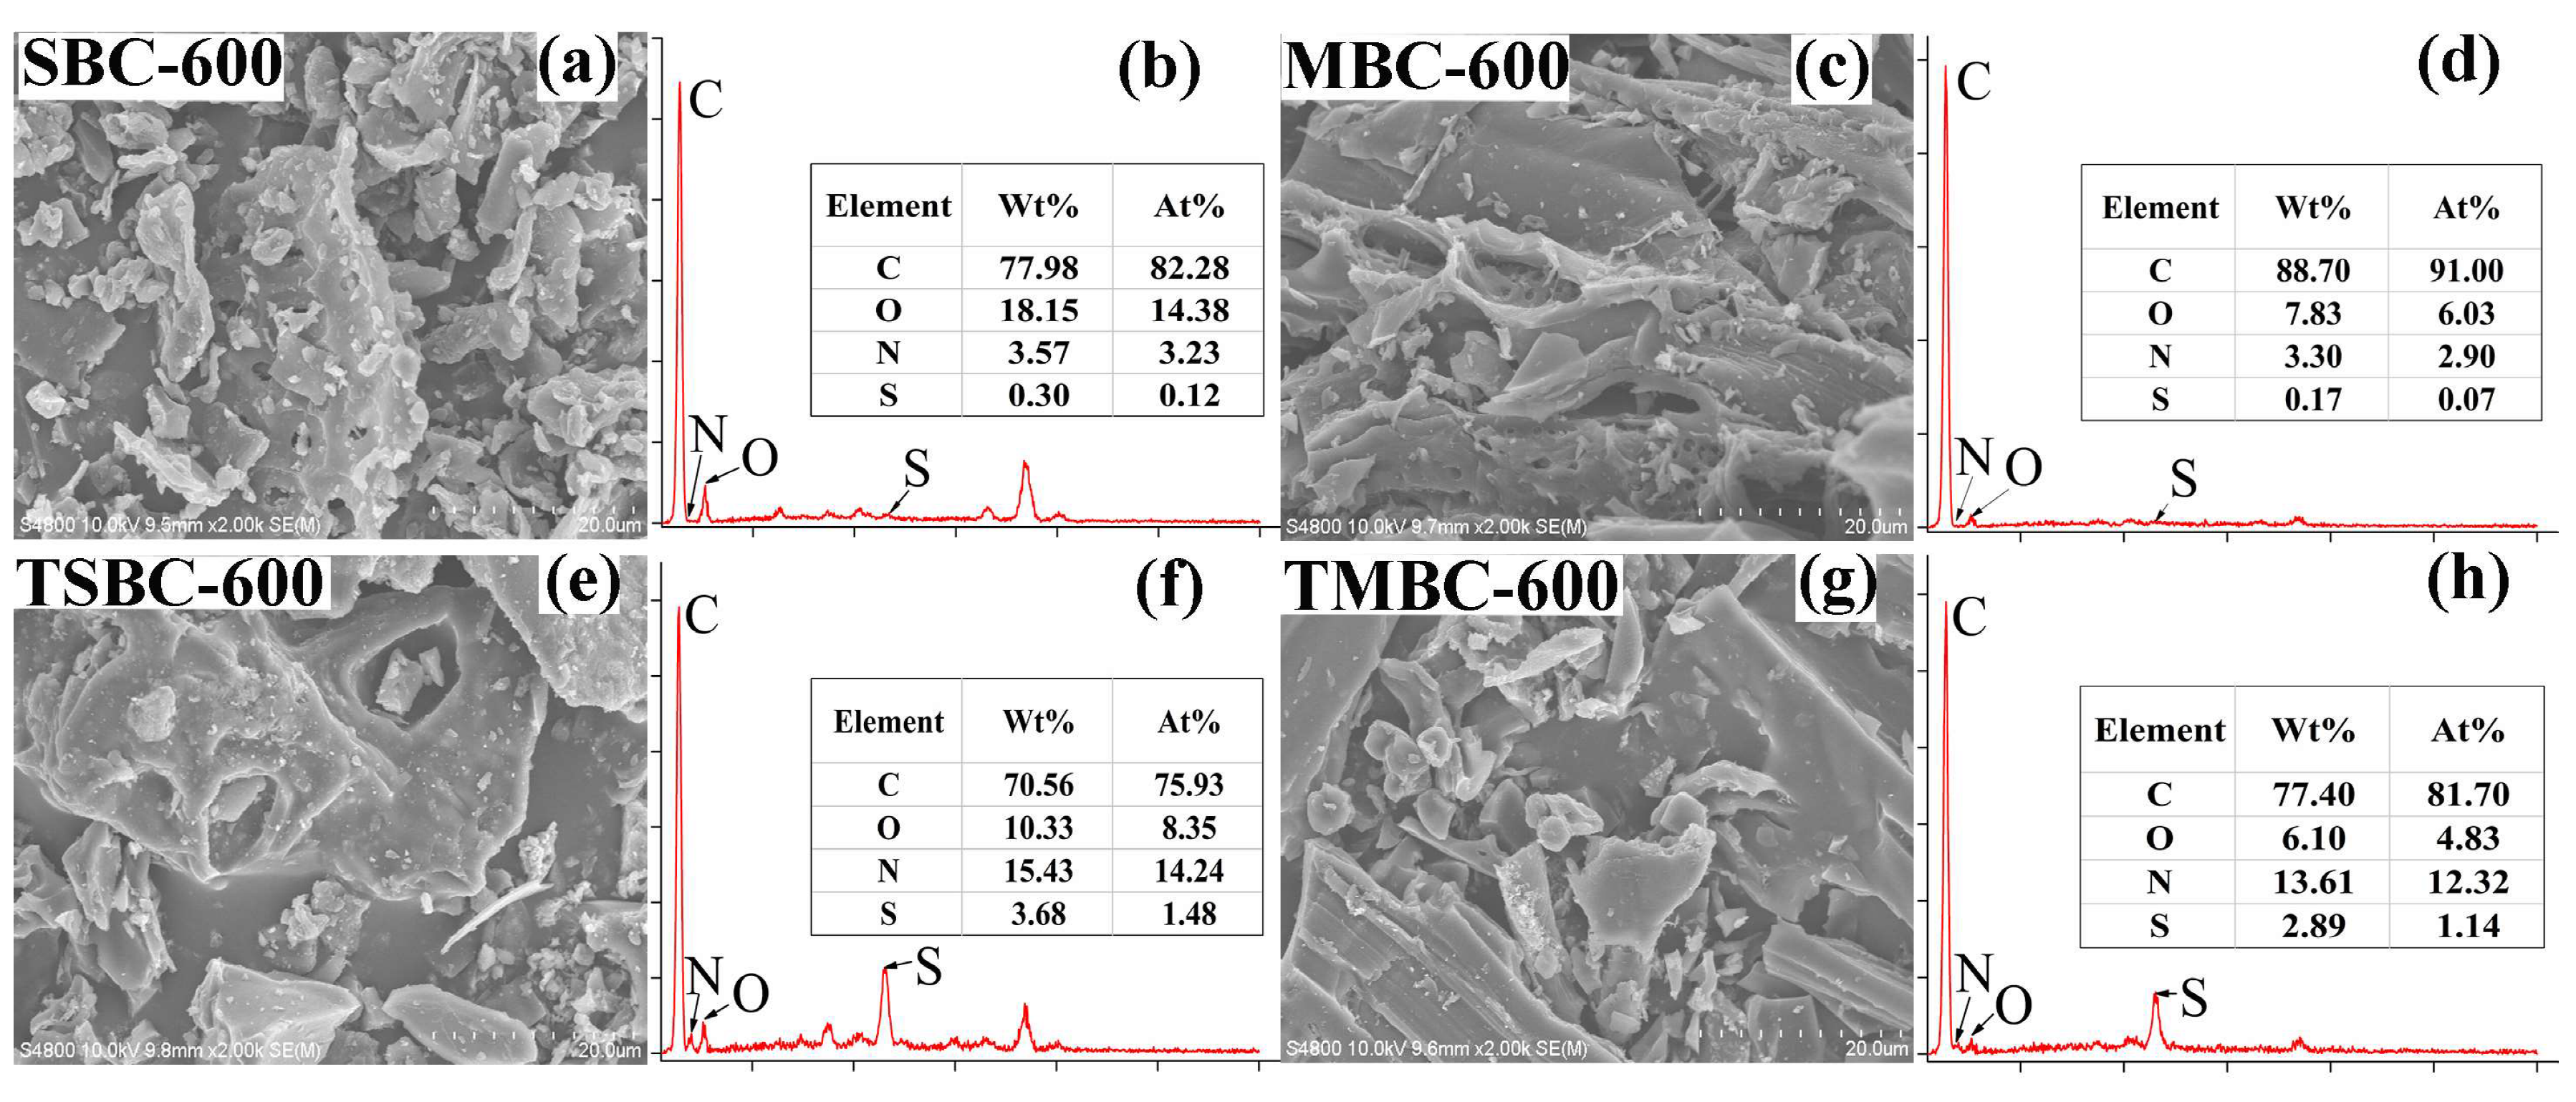
Figure 1 shows the SEM-EDS images of two materials before and after modification. From Figure 1, it is observed that before the modification, both SBC-600 and MBC-600 have a lamellar structure, which is more regularly arranged. The internal and external structures are well-formed and the surface is rough. The lamellar stack structure is obvious with an obvious pore structure. As proposed by Wu et al. [30] also, after modification, the granular and block structure of TSBC-600 and TMBC-600 increased, presumably due to the introduction of sulfur-containing groups that increased the number of biochar particles and the surface became smooth. Part of the pore structure was blocked, the impurities on the biochar surface reduced, and the outline of the structure was clear. EDS analysis indicated that the nitrogen content of the TSBC-600 increased from 3.57% to 15.43%, and the sulfur content increased from 0.30% to 3.68%; the nitrogen content of the TMBC-600 increased from 3.30% to 13.61%, and the sulfur content increased from 0.17% to 2.89%, which fully confirmed that N and S were successfully doped into the biochar during the modification process.
3.3. Effects of Modification on Functional Groups on the Biochar Surface
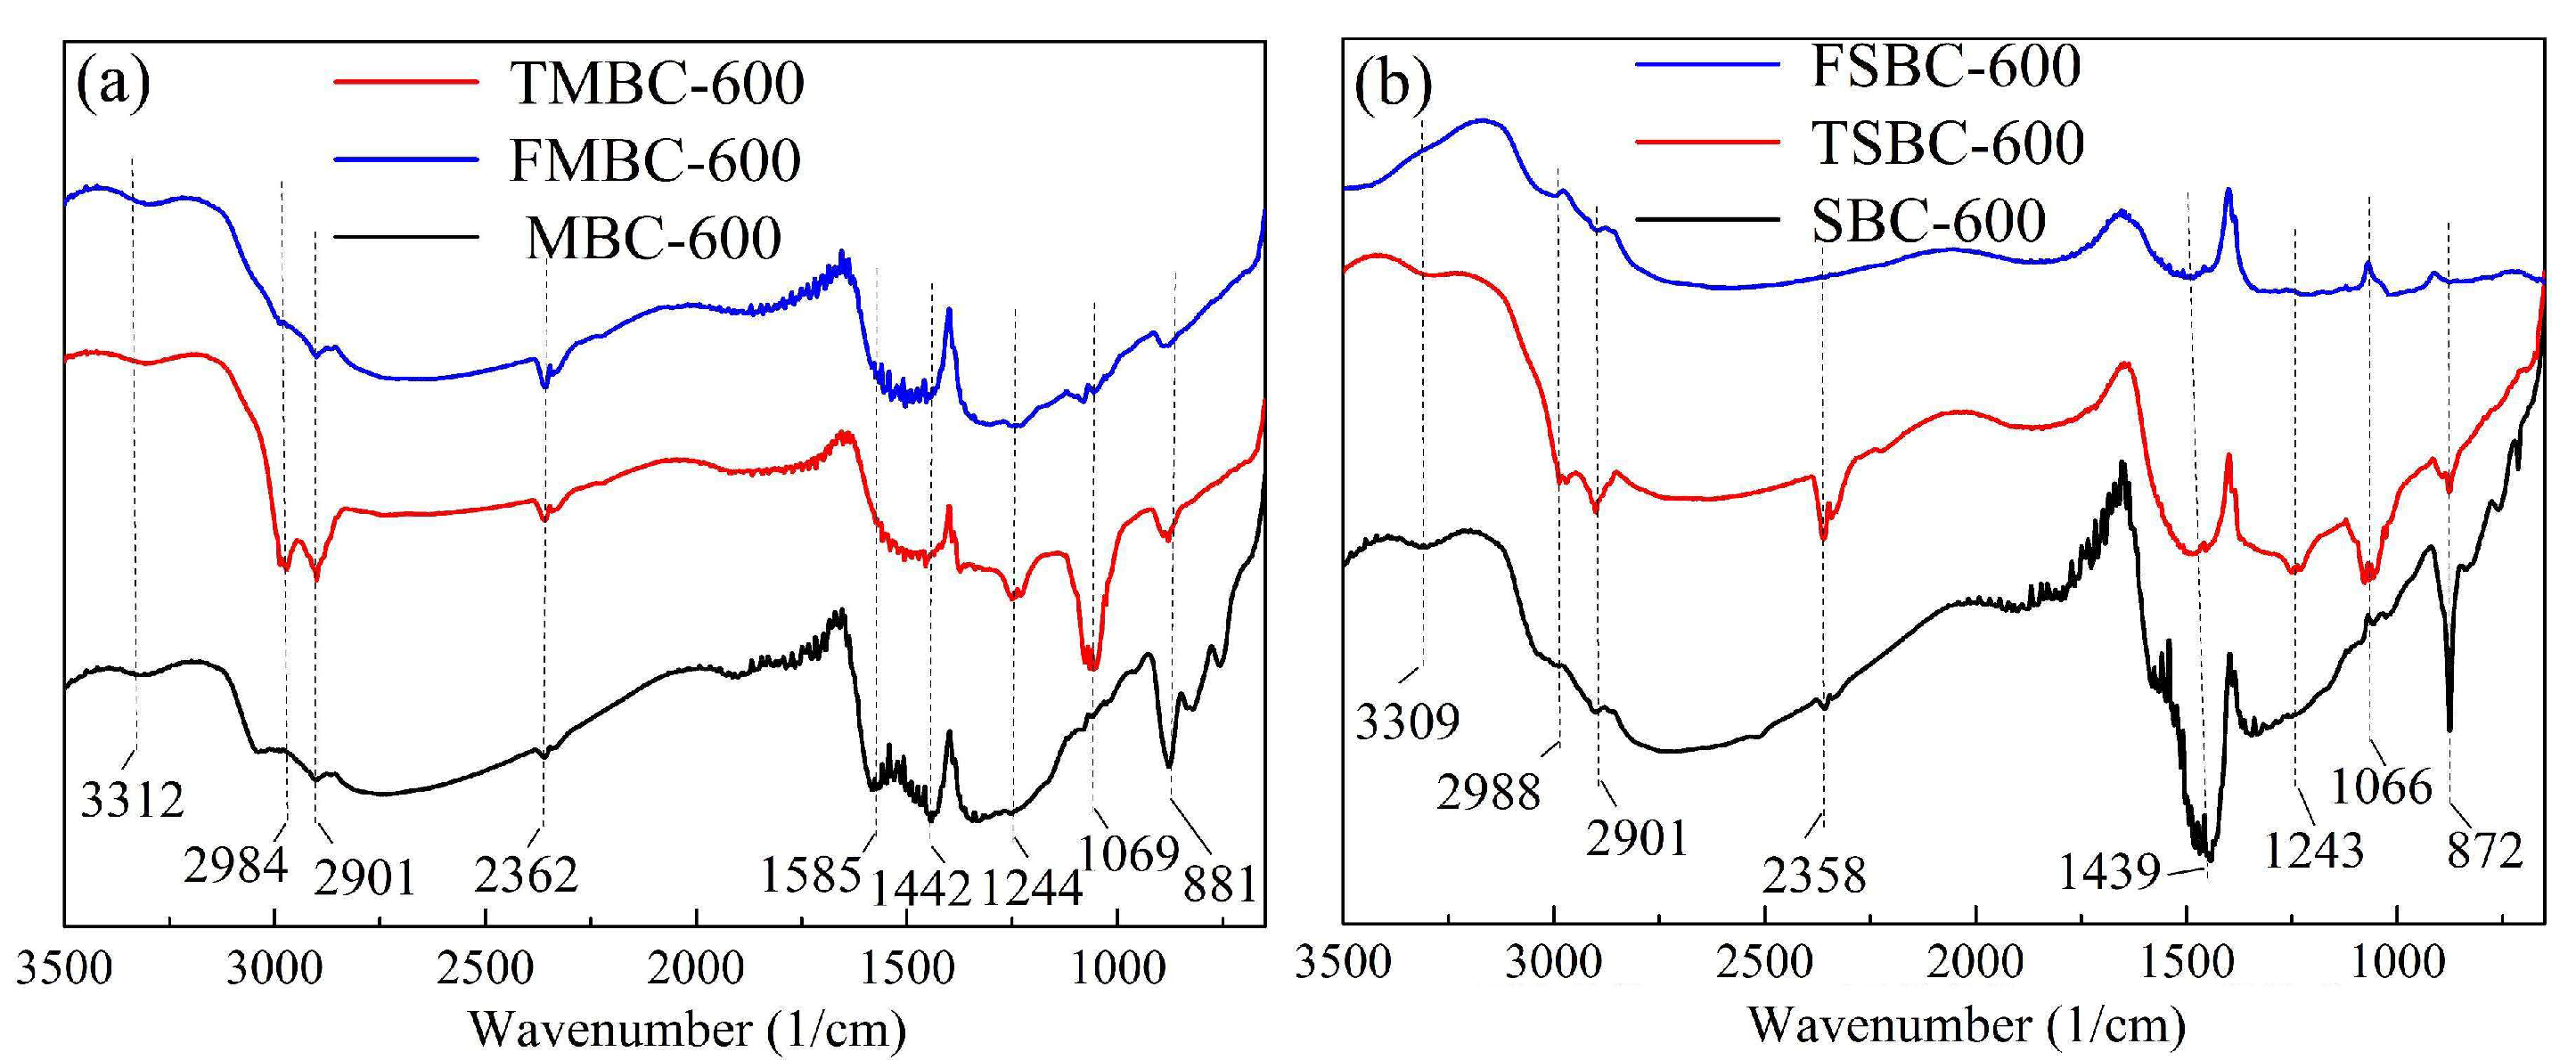
The FTIR spectra of the two biochars (TMBC-600 and TSBC-600) before and after modification and before and after adsorption are shown in Figure 2. From Figure 2, the absorption peak at approximately 3300 cm−1 is assigned to the stretching vibration of -OH [31], and the strong absorption peaks appearing near 2988 cm−1 at TMBC-600 and TSBC-600 are the stretching vibration of -NH2 [32], indicating that the nitrogen in thiourea participated in the amination of the surface of the biochar during the modification process. The absorption peak at 2901 cm−1 was assigned to the stretching vibration of -CH2 or -CH [33]. The characteristic peak appearing at 2358 cm−1 after modification may be caused by the stretching vibration of the -C≡N triple bond, and the two strong absorption peaks, i.e., 1066 cm−1 and 1244 cm−1 appearing in the frequency band of 1050–1250 cm−1 are the stretching vibration absorption peaks of C-S and C=S [30], respectively, indicating the presence of sulfurization during the modification of biochar. The characteristic absorption peak at 1439 cm−1 is attributed to the stretching vibration of C-N [34], and the absorption peak at 1585 cm−1 may be the absorption characteristic peak of C=N or C=O [14]. Generally, C-H stretching vibrational absorption peaks of methyl and methylene appear in the vicinity of 2960 cm−1, and the adsorption frequency of methylene will shift to the low-frequency region and the absorption intensity will become weaker after the introduction of the S atoms [35]. The peak at 2901 cm−1 evidences this and confirms that the S-containing groups were involved in the modification. The absorption peak in the 1400–1600 cm−1 band shifted after the reaction and the peak intensity weakened, indicating that Cd2+ and the functional group on the surface of the biochar were bound to the adsorption site by complexation [36]. The characteristic peaks of -NH2 and sulfur-containing groups weakened after the adsorption reaction, indicating that the newly introduced functional groups participated in the adsorption of Cd2+.
3.4. XPS Analysis of Biochar before and after Modification
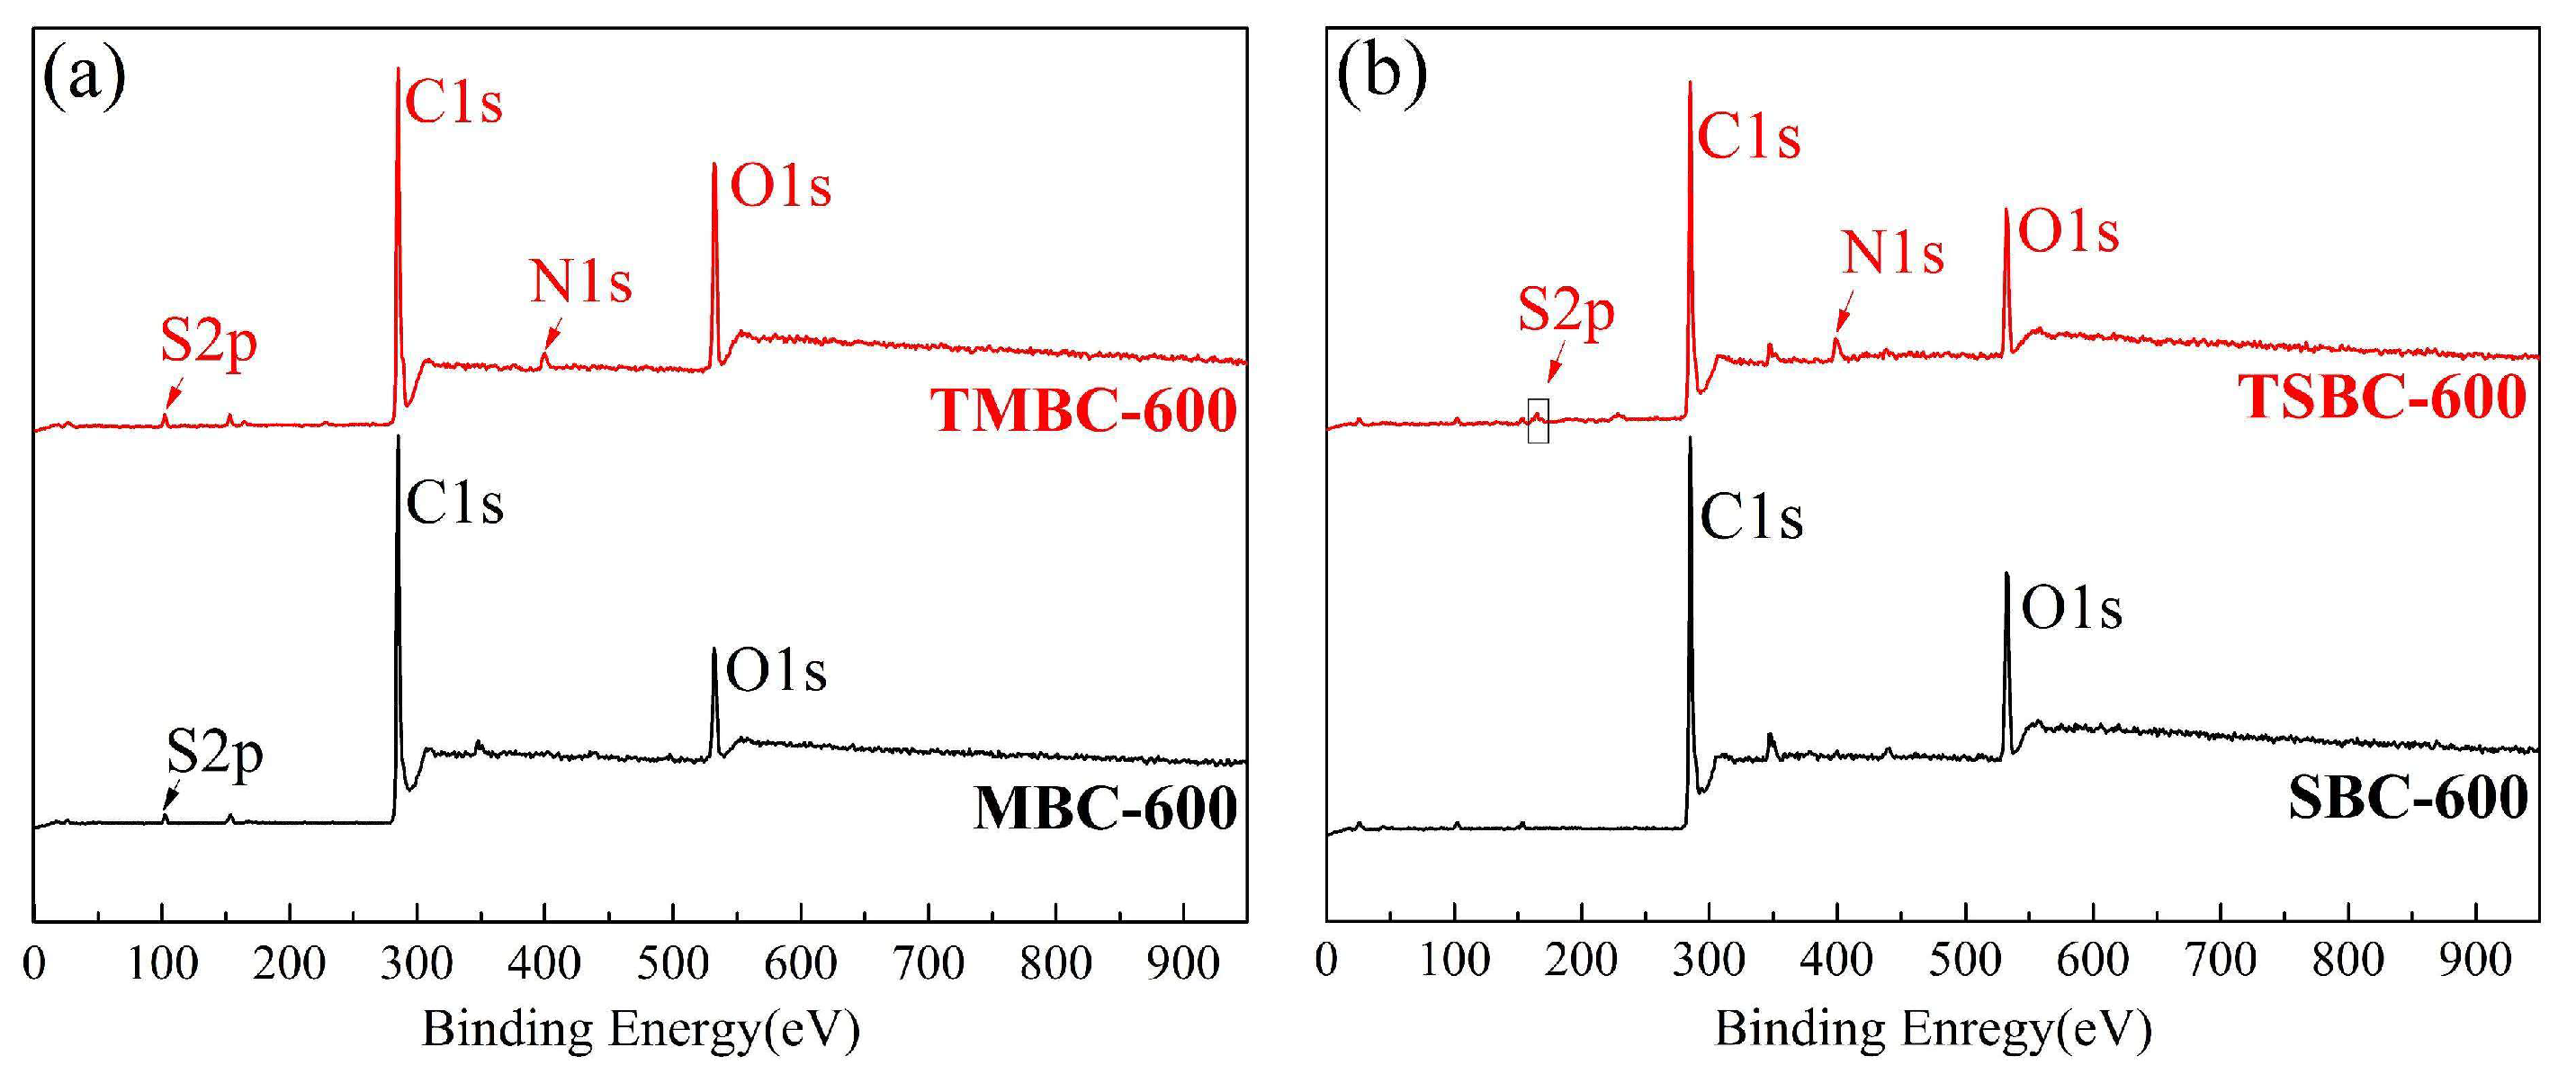
To further verify whether this modification method successfully doped N and S into the biochar carbon lattice, X-ray photoelectron spectroscopy analysis was used to analyze the change in the binding energy of C, N, and S in the biochar before and after modification. Figure 3a shows the XPS survey spectrum of MBC-600 and TMBC-600, in which the nitrogen content increased by 1.43% and the sulfur content increased by 2.03%. Figure 3b shows the XPS survey spectrum of SBC-600 and TSBC-600, in which the nitrogen content increased by 6.53% and the sulfur content increased by 3.39%. After modification, the extent of doping with N and S has improved significantly. The change in the mass fraction of the surface element is closely related to the functional group type and quantity of biochar before and after modification, which indicates that the modified material has better electrochemical performance [37]. Figure S3 (A1) and (A2) show the C 1s spectra of the two materials before and after modi3fication, in which the carbon was present in three forms, i.e., C-C (284.7 eV), C-O/C-N/C-S (286.2 eV), and C=O (288.6 eV) [38]. It can be seen from (A1) that, after the modification, the content of the three types of carbon in TMBC-600 changed significantly, while TSBC-600 in (A2) has not changed much. The changes in C-N and C-S indicate that N and S substitute C and become part of the carbon skeleton in the form of structural nitrogen and structural sulfur [39]. Figure S3 (B1) and (B2) show the N 1s spectra of the materials before and after modification. The nitrogen is mainly present in four forms, i.e., N-6 (pyridine nitrogen, 398.5 eV), N-5 (pyrrole nitrogen, 399.5 eV), and N-Q (graphite nitrogen, 400.7 eV) and NOx (nitrogen oxide, 402.2 eV) [40,41]. The N 1s spectra of MBC-600 and SBC-600 in (A1) and (A2) show that the nitrogen content of unmodified biochar is very small. Compared with MBC-600 and SBC-600, the number of different forms of nitrogen in TMBC-600 and TSBC-600 increased significantly and mainly existed in the form of pyridine nitrogen and graphite nitrogen, indicating that the nitrogen atom was successfully introduced into the carbon lattice and formed a bond with the carbon atom. The number of pyridine nitrogen was higher than that of graphite nitrogen, which has been confirmed in studies with thiourea as an additional doped nitrogen source [15]. Pyridine nitrogen can promote the coordination of metal ions, and thus, is more favorable for the removal of metal ions [42]. Figure S3 (C1) is the S 2p spectrum of MBC-600 and TMBC-600. It can be seen from the figure that the sulfur content of MBC-600 is small, while that in TMBC-600 is significantly increased, existing mainly in three forms, i.e., C=S (163.9 eV), C-S (165.1 eV), and S(=O)2 (168.3 eV). Figure S3 (C2) is the S 2p spectrum of SBC-600 and TSBC-600. Compared with SBC-600, the sulfur content of TSBC-600 is significantly increased, and the sulfur exists in five main forms, i.e., C=S (163.9 eV), C-S (165.1 eV), S(=O)2 (168.3 eV), Sul S (sulfide sulfur, 161.8 eV), and S(-II) (160.6 eV) [35,43]. This confirms that the sulfur was successfully doped into the biochar carbon skeleton structure after modification. The doping of N and S elements has given biochar materials some specific properties, such as easier electrochemical reaction and adsorption.
3.5. Adsorption Experiment Results
3.5.1. Effect of Pyrolysis Temperature on Cd2+ Adsorption by Modified Biochar
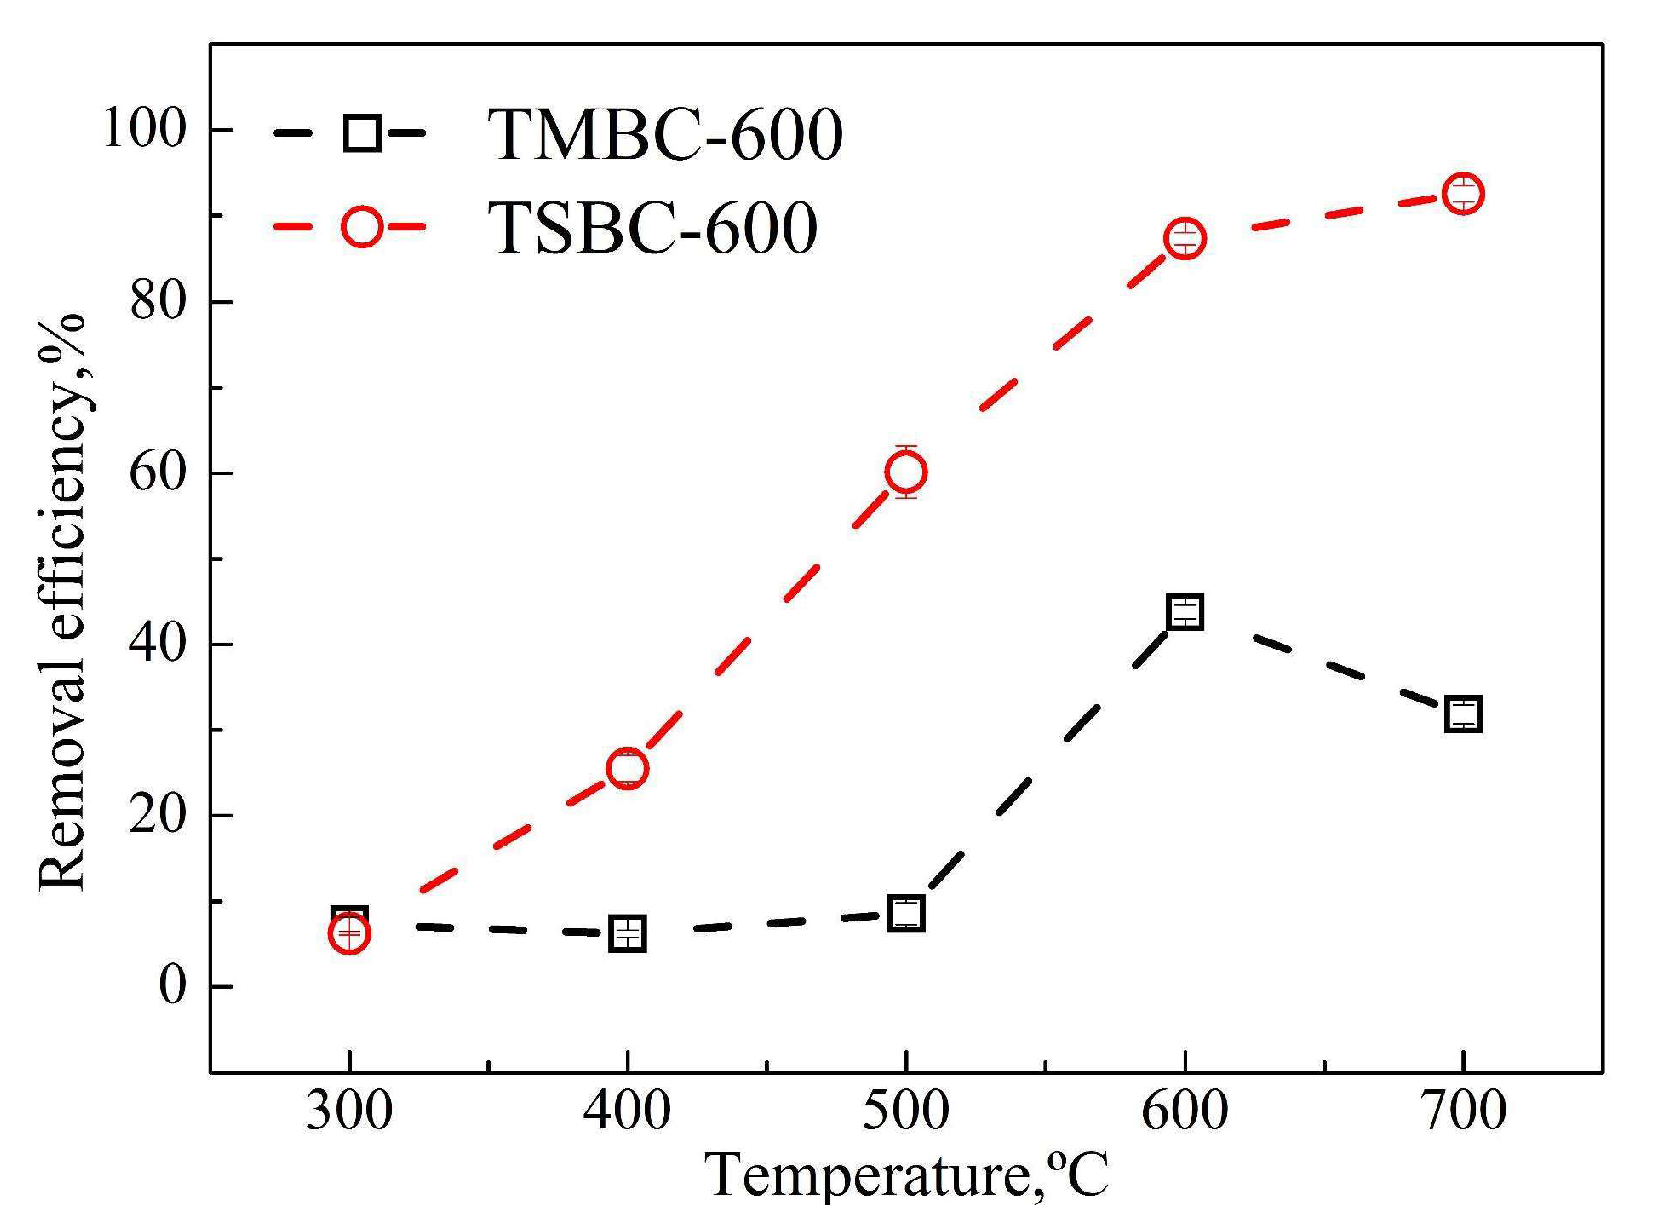
Cd2+ was removed by modified biochar at different pyrolysis temperatures and the results are shown in Figure 4. It can be seen from Figure 4 that when the dosage of biochar is 1 g/L and the initial pH of the solution is 7, the removal rate of Cd2+ by TSBC increases as the pyrolysis temperature increases. The removal rate of Cd2+ by TMBC in the range of 300–600 °C showed an upward trend, and the removal rate decreased above 600 °C. The removal rate of Cd2+ by TSBC was higher than that of TMBC. The removal rate of TMBC-600 and TSBC-600 were the highest at 43.83% and 87.29%, respectively. The removal rate associated with TMBC-600 increased by 36.53% compared with TMBC-300, and that of TSBC-600 increased by 81.07% compared with TSBC-300. Considering the energy consumption and raw material utilization in the process of preparing biochar, biochar was prepared at a pyrolysis temperature of 600 °C in this study.
3.5.2. Effect of Initial pH on Cd2+ Adsorption by Biochar
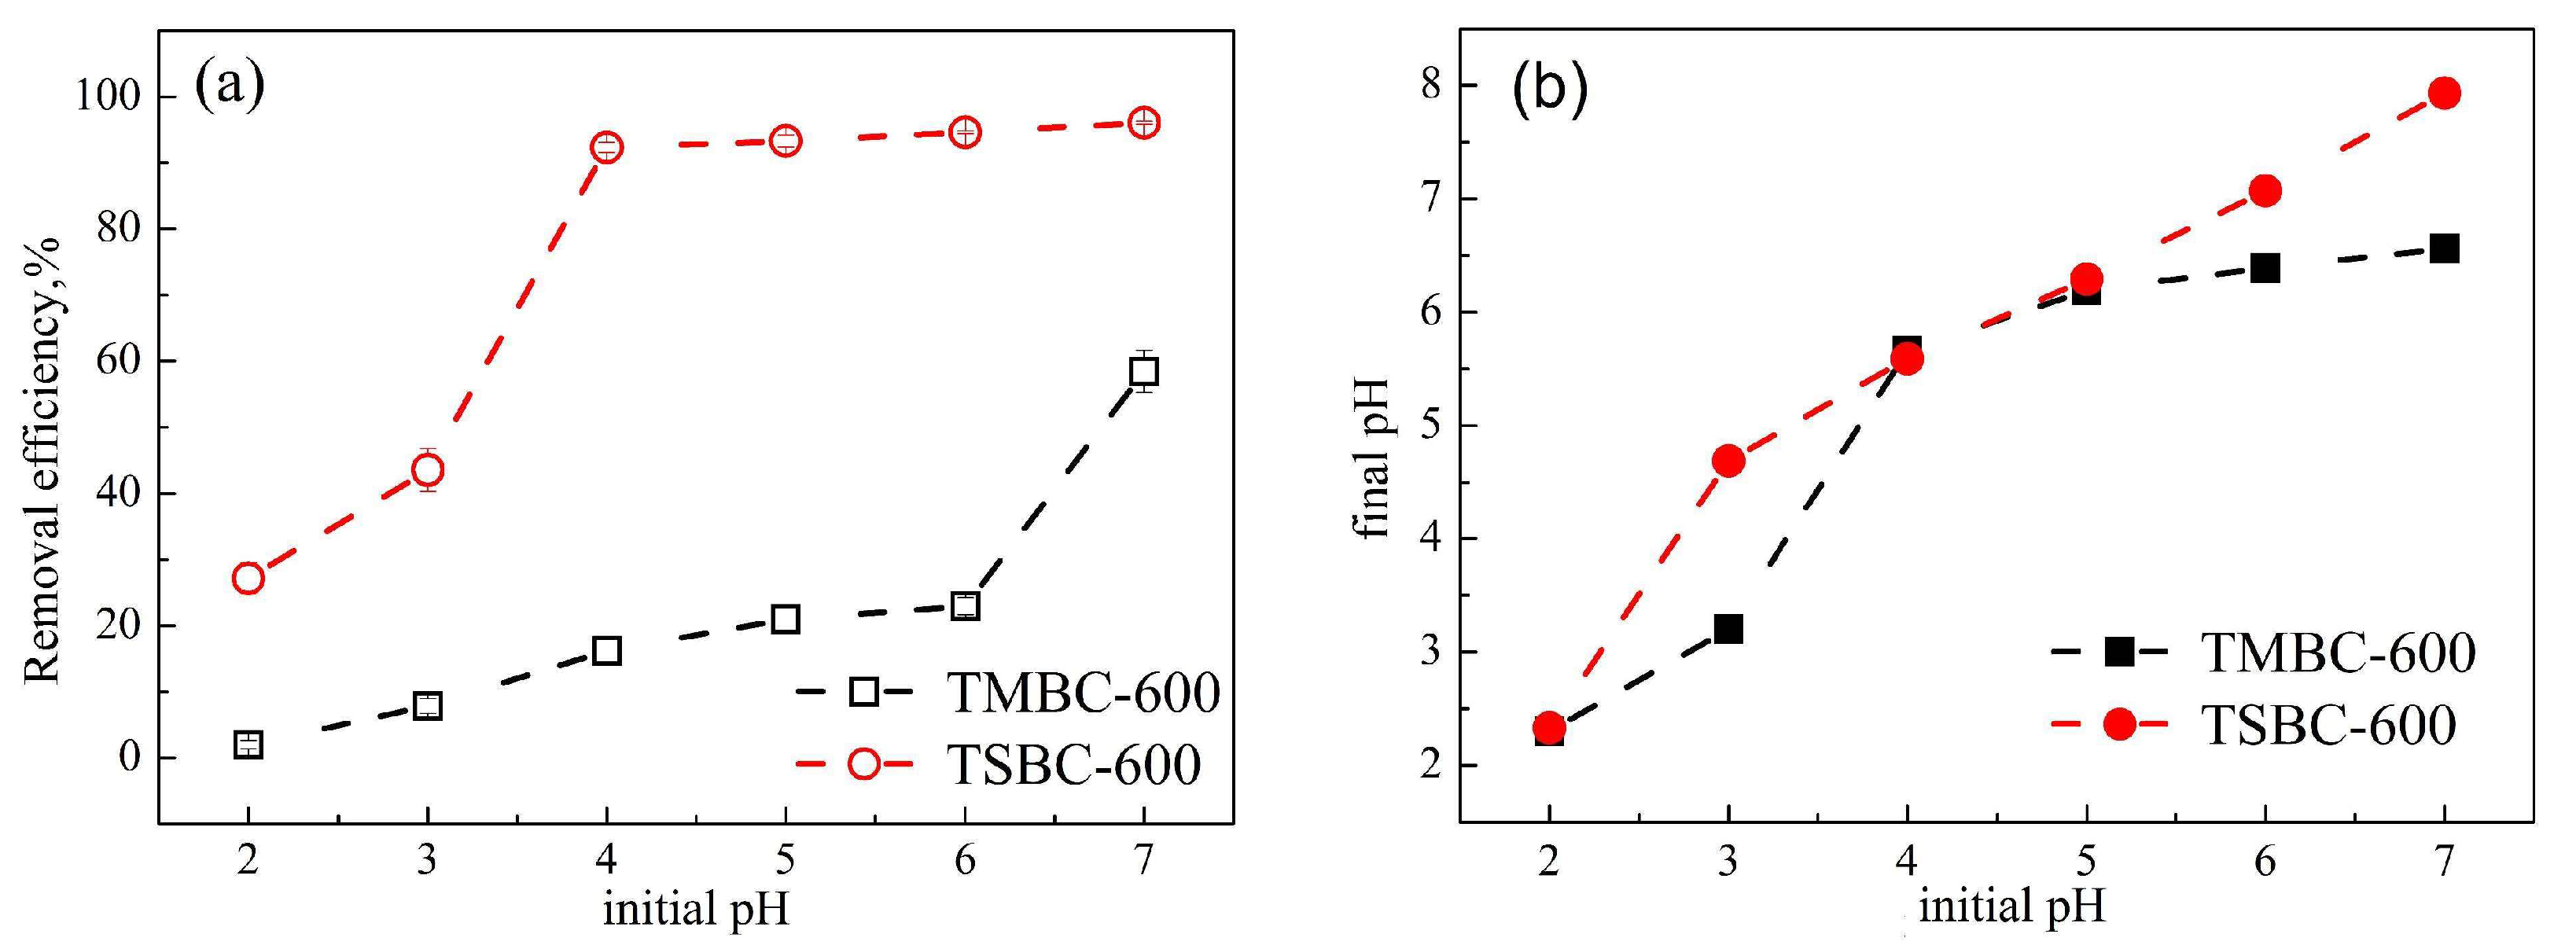
As shown in Figure 5, when the dosage of modified biochar was 1 g/L and the initial concentration of Cd2+ is 10 mg/L, as the pH increases, the removal rate of Cd2+ by both the biochars increase. Under strongly acidic conditions, the removal rate of Cd2+ by TSBC-600 is higher and that of TMBC-600 is lower. When the pH is in the range of 4–7 and 6–7, respectively, the adsorption of TSBC-600 and TMBC-600 is better, and the adsorption efficiency of TSBC-600 was higher than that of TMBC-600. When the pH was 4–7, the removal rate of Cd2+ in the solution can reach 93%; when pH = 7, the removal rate of Cd2+ by TSBC-600 became the highest, which was 96.05%. For TMBC-600, when the pH was at 2–6, the removal rate of Cd2+ increased slowly. When pH = 7, TMBC-600 had the highest removal rate of Cd2+, which was 58.41%. Due to the difference in biomass materials, the alkalinity of the two modified biochars differed significantly. From Figure 6, it can be seen that the equilibrium pH of the biochar solution has increased to varying degrees after Cd2+ adsorption. The equilibrium pH of TSBC-600 was higher than TMBC-600, indicating that the basicity of TSBC-600 is greater, which is consistent with the pH measurement results in 2.1.
Experiments have shown that TSBC-600 has good acid resistance. In the set pH range, TSBC-600 showed a strong removal rate of Cd2+, which might be related to the role of the nitrogen-sulfur functional groups and cadmium ions. This has important implications for the research on the removal of cadmium in typical acidic wastewater such as mining wastewater.
3.5.3. Effect of Dosage of Biochar on Cd2+ Adsorption
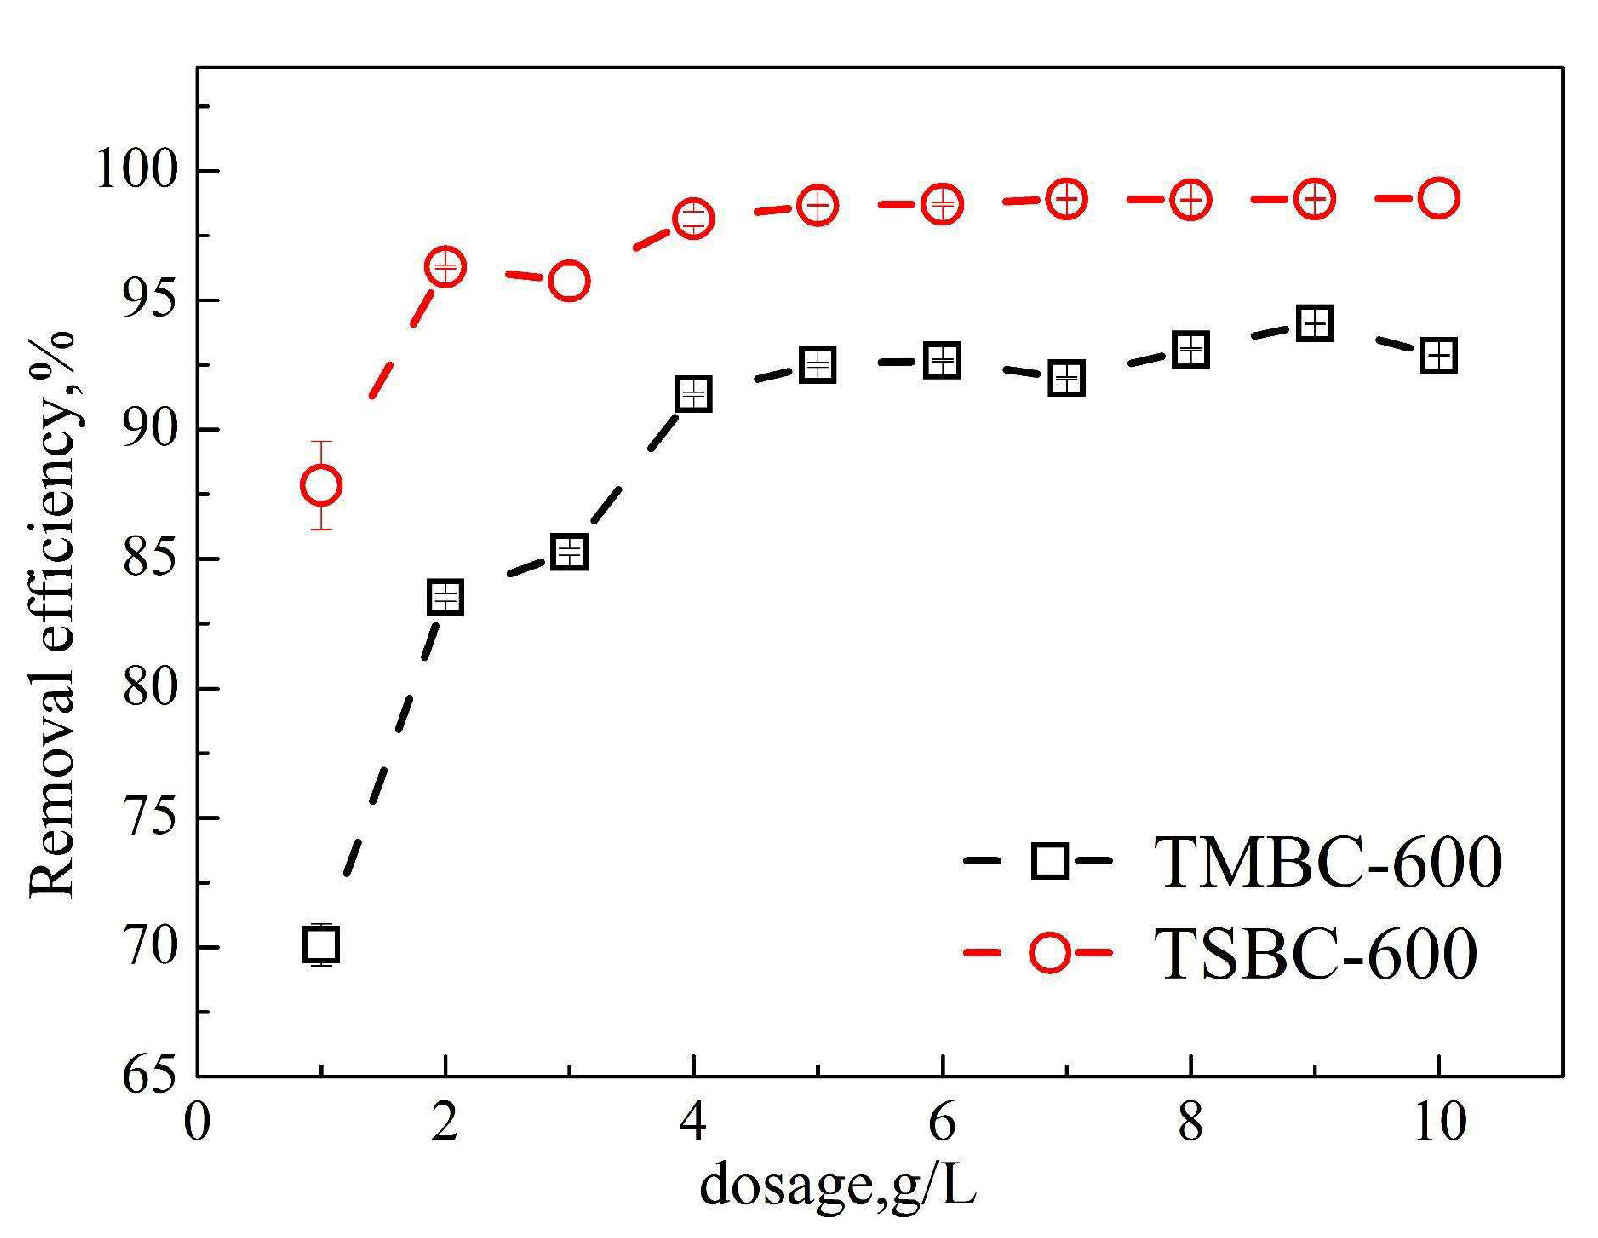
It can be seen from Figure 6 that as the initial pH of the solution was 7, and the initial c (Cd2+) of the solution was 10 mg/L, the removal rate of Cd2+ increased with the increase in the two kinds of biochar. When the dosage of TMBC-600 and TSBC-600 was 5 g/L and 4 g/L, the adsorption of Cd2+ by biochar reached saturation, and the removal rate reached 92.50% and 98.15%, respectively. As the dosage was increased continuously, the removal rate of Cd2+ did not vary much. This is possibly because the binding of cadmium ions to the limited adsorption sites on the surface of biochar reaches saturation when the dosage is small. With the increase in the dosage, the remaining cadmium ions in the solution bind to the new adsorption sites. Finally, the adsorption reached equilibrium, and further increase in dosage had little effect on the removal rate.
3.5.4. Analysis of Adsorption Kinetics
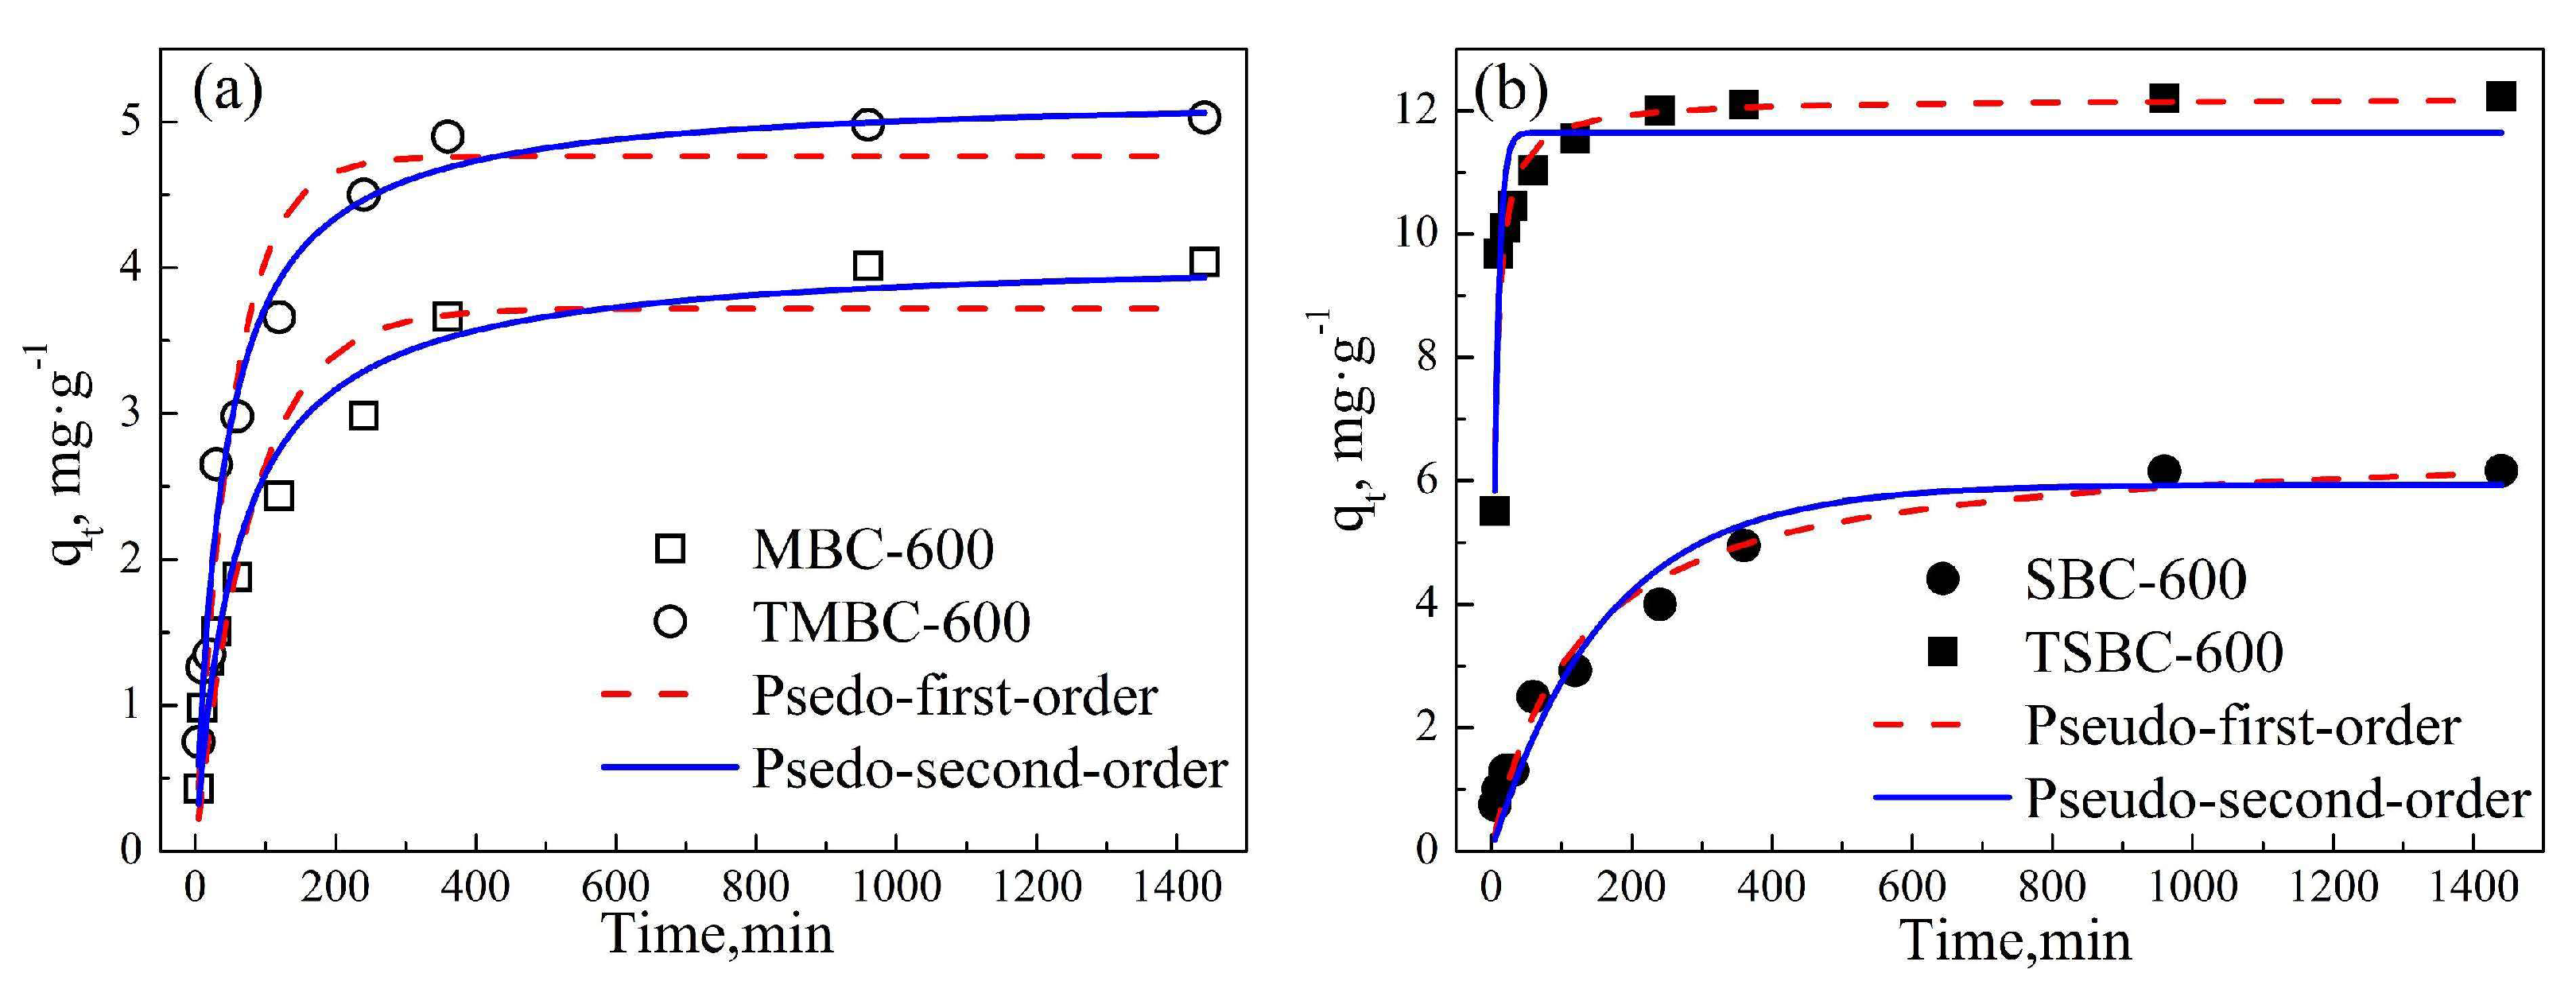
The adsorption capacity of Cd2+ by biochar as a function of time is shown in Figure 7. As shown in Figure 7, the adsorption capacity of TSBC-600, SBC-600, TMBC-600, and MBC-600 all increase with the increase of the adsorption time, and eventually reach equilibrium. TSBC-600, SBC-600, TMBC-600, and MBC-600 reached adsorption equilibrium at 240, 960, 360, and 960 min, respectively. In the initial stage of adsorption, the adsorption efficiency of each biochar is high and it gradually decreases with the increase in adsorption time. This is because there are more sites on the biochar surface that can bind to Cd2+ at the beginning of adsorption, and Cd2+ can be quickly adsorbed by the biochar. At this time, there is no competitive adsorption. As the adsorption time increases, the effective adsorption sites on the surface of the biochar gradually decrease, and Cd2+ needs to diffuse into the inside of porous medium. At this time, the mass transfer rate becomes slower, and the competitive adsorption becomes more and more obvious [44]. TSBC-600 showed a higher adsorption rate in the initial stages of adsorption, indicating that the surface of TSBC-600 has more binding sites.
3.5.5. Analysis of Isothermal Adsorption
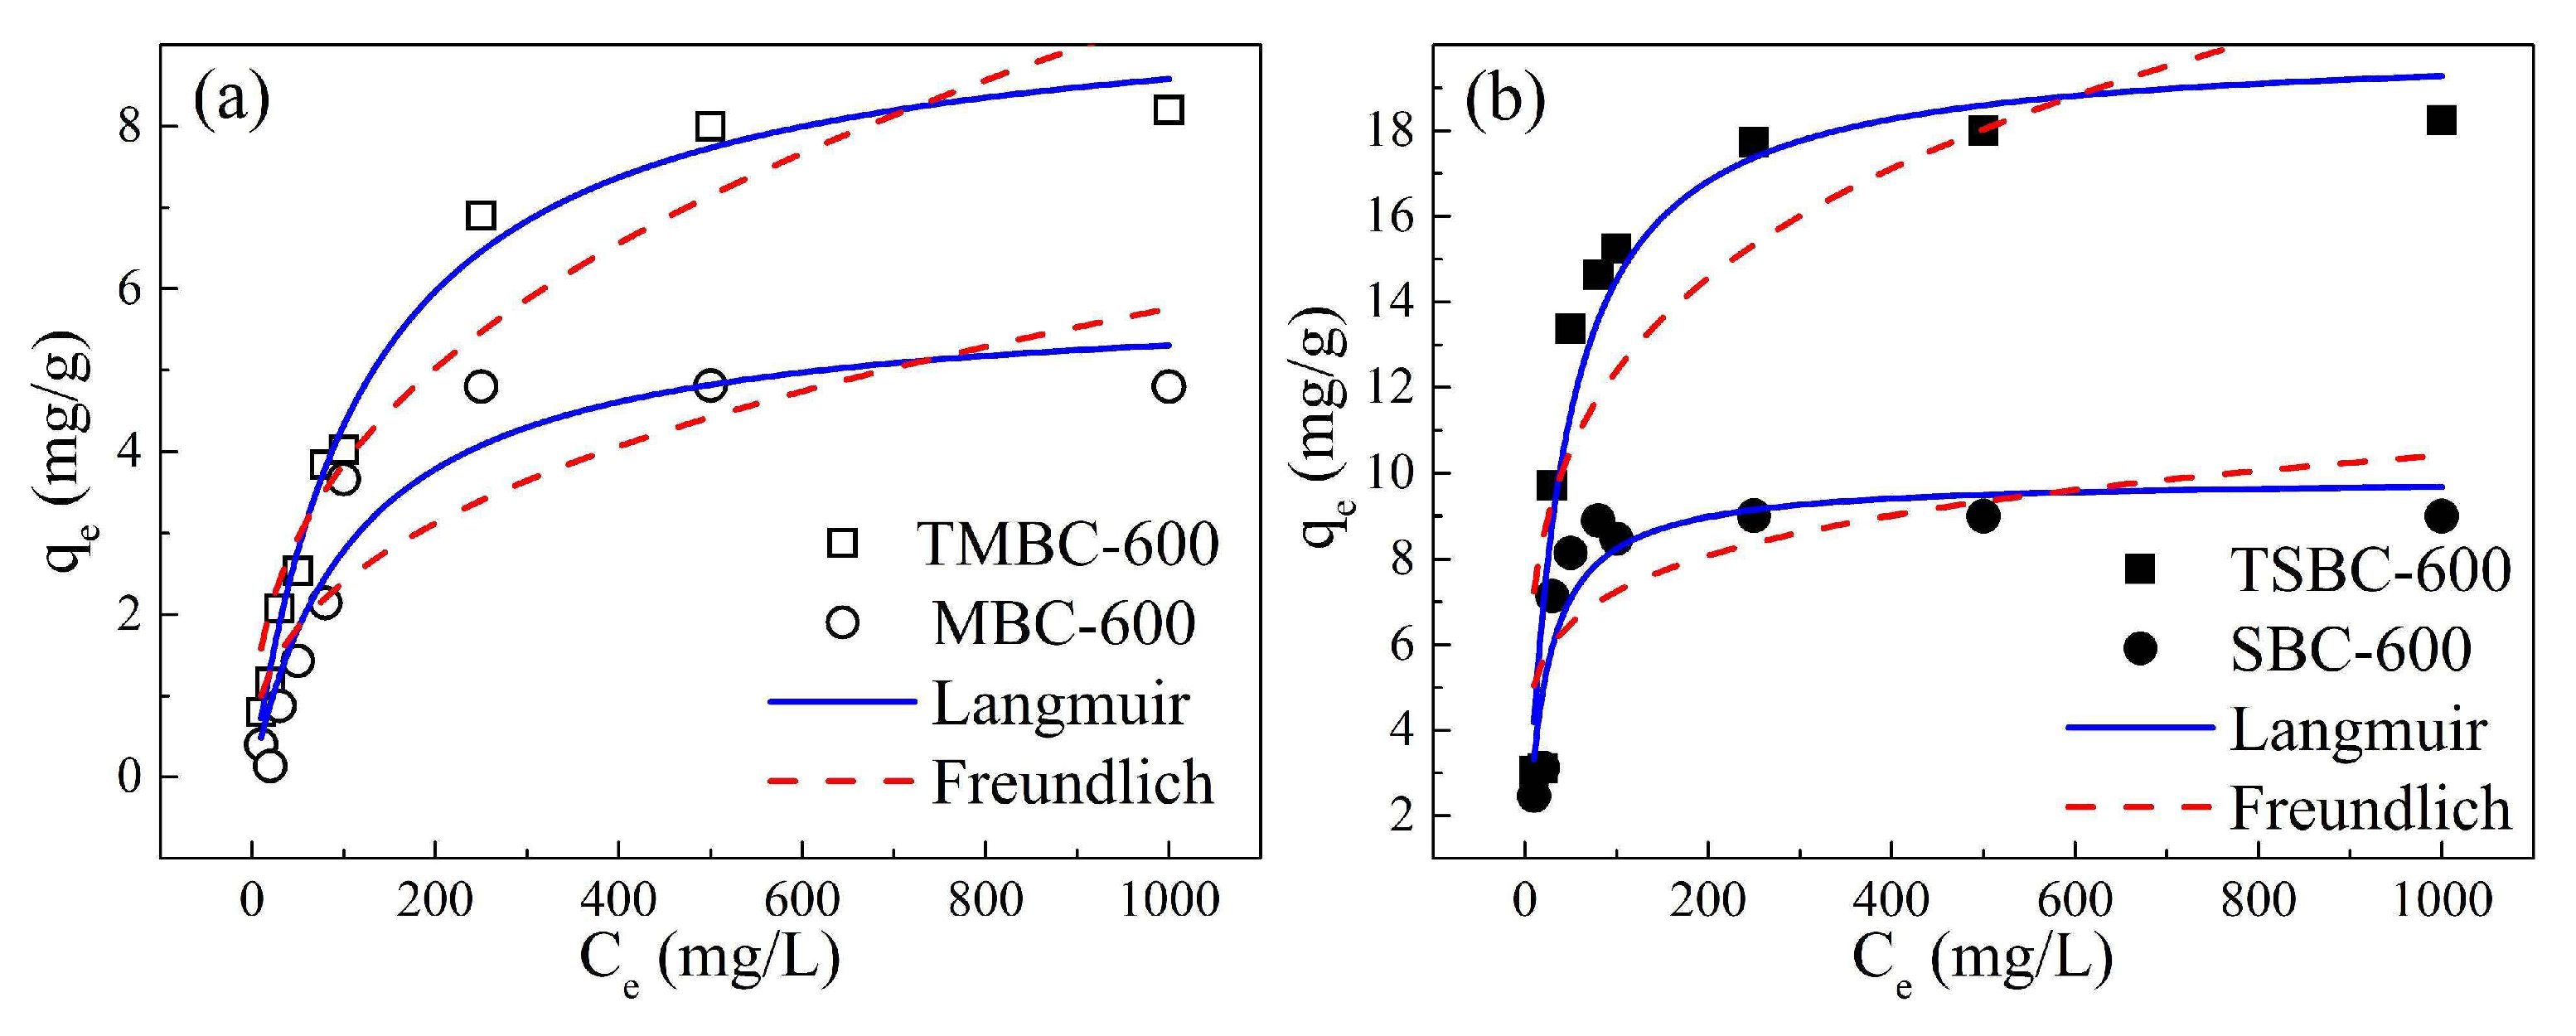
The adsorption isotherm can reflect the affinity of the adsorbate for the adsorbent and can be used to describe the interaction between the adsorbate and the adsorbent [45]. The adsorption isotherms of Cd2+ solutions after adding biochar with different initial concentrations are shown in Figure 8. The adsorption capacity of TSBC-600, SBC-600, TMBC-600, and MBC-600 all increased with the initial concentration of Cd2+ and eventually reached equilibrium. At low concentrations of Cd2+, biochar showed a higher adsorption rate, and then gradually flattened as the concentration increased. It can be seen from Figure 8 that the adsorption capacity of the four types of biochar is TSBC-600 > SBC-600 > TMBC-600 > MBC-600, among which TSBC-600 has the strongest adsorption capacity.
4. Discussion
4.1. Effects of Pyrolysis Temperature, Dosage, and Initial pH on Cd2+ Removal
Biomass pyrolysis is a fairly complex thermochemical reaction process, in which temperature is a key factor that determines the performance of biochar [46]. The effect of modified biochar prepared at different pyrolysis temperatures on the removal rate of Cd2+ in aqueous solution is shown in Figure 4. When the initial concentration of Cd2+ in the solution was 10 mg/L, TMBC and TSBC had a high removal rate of Cd2+ at 600 °C. This is because, as the temperature increases, the moisture and volatile matter of the biomass is gradually released, and a large number of pore structures are formed on the biochar surface, the specific surface area increases, and the number of adsorption sites on the surface increases [47]. The reason for the lower growth may be that the introduction of sulfur and nitrogen enhances the ability of primary biochar to adsorb Cd2+. At the same pyrolysis temperature, the difference in adsorption capacity between TMBC-600 and TSBC is remarkable. This may be because MB has volatile components up to 81.1% volatile components and its structure is loose. When the temperature is relatively low, organic solids in MB did not fully decompose and generate abundant biomass oil [48]. When the temperature was relatively high, the high temperature destroyed the pore structure of the biochar, which caused the TMBC pore structure to collapse, and the adsorption sites on the biochar surface decreased [49].
The dosage of adsorbent added is one of the important parameters that determine the adsorption capacity of the adsorbent for Cd2+. The removal rate of TMBC-600 and TSBC-600 for Cd2+ in aqueous solution is shown in Figure 6. When the initial Cd2+ concentration of the solution was 10 mg/L, the dosage of TMBC-600 and TSBC-600 increased from 1 g/L to 10 g/L, and the removal rates of Cd2+ by TMBC and TSBC increased from 70.1% to 94.1% and from 87.8% to 99.0%, respectively. When the dosage increased to 4 g/L, the increase in removal rate did not vary much, similar results also appeared during the adsorption of transition metal element by sugarcane biochar and sulfurized biochar [22,50,51].
The initial pH of the solution is an important factor that affects the adsorption process. Cd-chloride hydrolysis have resulted in sacrificial dissolution of adsorbent and cannot be ignored, therefore, the neutralization method was used to minimize the effect of Cd-chloride hydrolysis on adsorption, so as to ensure that the adsorption of Cd2+ only affected by the initial pH of solution. Changes in pH can affect the surface charge of the adsorbent and the degree of ionization of the adsorbed cadmium ions [52]. The effect of initial pH on the adsorption of Cd2+ by modified biochar is shown in Figure 5. When the initial Cd2+ concentration is 20 mg/L and the amount of modified biochar is 1 g/L, TSBC-600 can still remove 93% of the Cd2+ in the solution at low pH, and TMBC-600 can obtain a removal rate of approximately 60%. In the same situation, Tang et al. found that the removal rate of Cd2+ by single amino-modified biochar was only 28%, and the removal rate of Cd2+ by single thiol-modified biochar was 48% [34]. Li et al. reported that when the dosage of nitrogen-added biochar was 8 g/L, the removal rate of Cd2+ could reach 98% at pH 4.0 [53]. Compared with single sulfur modification and nitrogen modification, the thiourea-modified biochar materials examined in this study have a higher tolerance to pH. The modified biochar mainly achieves the removal of Cd2+ through the specific binding of nitrogen and sulfur groups with Cd2+ and the non-specific complexation or ion exchange of oxygen-containing functional groups such as hydroxyl and carboxyl groups on the surface of biochar with Cd2+. When the content of H+ in the solution increases, a large amount of H+ will dissociate the functional groups that are beneficial to the adsorption of Cd2+ [54,55], thereby reducing the removal rate of Cd2+. Meanwhile, H+ preferentially occupies the adsorption sites when competing with Cd2+, causing a decrease in the number of sites bound to Cd2+. In addition, the lower the pH of the solution, the higher the density of positive charges on the surface of biochar, and the stronger the mutual electrostatic repulsion between the positively charged metal cations and the surface of biochar [56,57,58], which will reduce the removal rate of Cd2+.
4.2. Adsorption Kinetics of Cd2+ Adsorbed by Biochar before and after Modification
The pseudo-first-order kinetic equation and pseudo-second-order kinetic equation were used to fit the biochar adsorption kinetic data, and the fitting parameters are shown in Table 2. It can be seen from Table 2 that the R2 values fitted by the pseudo-second-order kinetic equation are greater than those fitted by the pseudo-first-order kinetic equation, indicating that the adsorption rate of biochar are mainly controlled by the chemisorption mechanism, and Cd2+ adsorbed on the surface of biochar via the interaction with biochar, such as that shared by the electron-electron pairs, ion exchange, and surface complexation [59]. The adsorption process mainly includes external liquid film diffusion, surface adsorption, and intra-particle diffusion. The relationship between the equilibrium adsorption capacity of biochar for Cd2+ is TSBC-600 > SBC-600 > TMBC-600 > MBC-600. The adsorption of modified biochar was enhanced, indicating the important role of N- and S- containing groups on the adsorption of Cd2+. Comparing the adsorption rate constant k2 of the four biochars, 0.0184 (TSBC-600) > 0.0049 (TMBC-600) > 0.0042 (MBC-600) > 0.0013 (SBC-600), indicating that the adsorption rate of TSBC-600 is faster, which is consistent with the analysis of k1 in the pseudo-first order kinetic equation. This demonstrates that the affinity of SB to thiourea is greater than that of MB. In summary, thiourea-modified biochar can effectively increase the adsorption rate of Cd2+ by biochar.
4.3. Isothermal Adsorption Curves before and after Biochar Modification
According to the shape of the isotherms, the isotherms of the four types of biochar can be designated as type I isotherms as per the BDDT (Brunauer Deming Deming Teller) classification [60]. Therefore, the commonly used Langmuir and Freundlich equations are used for fitting. The detailed fitting parameters and correlation coefficients are listed in Table 3. By comparing the R2 fit using the two models, it is found that the Langmuir equation is more suitable than the Freundlich equation. This indicates that the adsorption of Cd2+ by the four biochars is monolayer adsorption. The functional groups on the absorbent surface are the main adsorption sites during the adsorption process, and the process takes place under the electrostatic attraction and hydrogen bonding [61]. There was no interaction between the homogeneity of the adsorbent surface and adsorption sites. The maximum adsorption capacity Qm calculated by the Langmuir equation is not significantly different from the actual adsorption amount qe. The maximum adsorption capacity of each biochar is TSBC-600 (19.998 mg/g) > SBC-600 (9.880 mg/g) > TMBC-600 (9.631 mg/g) > MBC-600 (5.898 mg/g). The adsorption capacity of thiourea modified TSBC-600 and TMBC-600 increased by 2.02 and 1.63 times, respectively. The adsorption capacities reported by other different adsorbents varied greatly among previous studies (Table S1). The adsorption capacity of TSBC-600 and TMBC-600 is nearly five times than biochar through pyrolysis with thiourea impregnation [15], the reason for this differentiation may be different activation of raw biochar in one-step co-pyrolysis. Moreover, the different feedstock and modifier made the variation of different surface characteristics, minerals, and functional groups of biochar.
For the separation factor RL (RL = 1/(1 + RLC0), when RL > 1, the adsorption is unfavorable; when 0 < RL < 1, the adsorption is favorable; when RL = 1, the adsorption is linear [62]. In the Langmuir model, the RL of biochar for Cd2+ is between zero and one, indicating that the adsorption behavior of biochar to Cd2+ is favorable. Similarly, the value of n in the Freundlich model can also confirm this viewpoint. The value of n is related to the properties of the adsorption material and the adsorption system. The larger the value of n, the better the adsorption performance of the material. When 0.1 < 1/n < 0.5, it means that the adsorption is easier to perform; when 1/n > 2, it means that the adsorption is difficult to carry out [53]. The 1/n values of the four biochars are all in the range of 0.1–0.5, which indicates that the N and S groups on the surface of the biochar have a higher modification efficiency. This demonstrates that the full adsorption process is preferential adsorption. The adsorption performance is relatively good, and the adsorption process is non-linear isothermal adsorption. The adsorption of Cd2+ by the four biochars is completed by a variety of mechanisms [14,50,63].
5. Conclusions
In this study, an N, S modified biochar was prepared by the co-pyrolysis of thiourea and poplar bark (SB) or poplar sawdust (MB), and used for the removal of aquatic cadmium ions. The results showed that the performance of thiourea-modified biochar was stable. The introduction of S and N optimized the surface structure of biochar, which was beneficial for enhancing the adsorption efficiency of biochar for Cd2+. The optimal modification temperature of TSBC and TMBC was 600 °C, and the optimal reaction dosage of TSBC-600 and TMBC-600 was 4 g/L and 5 g/L, respectively. The optimal reaction pH was 7. Langmuir model and the pseudo-second-order kinetic model can explain the adsorption behavior of TSBC-600 and TMBC-600 with regard to Cd2+. The adsorption behavior of TSBC-600 and TMBC-600 to Cd2+ was mainly chemical adsorption, which can be attributed to the surface functional groups. The maximum adsorption capacity of TSBC-600 and TMBC-600 calculated by the Langmuir model was 19.998 mg/g and 9.631 mg/g, respectively. These results indicated that the thiourea-modified biochar has strong adsorption capacity and good acid resistance, which is promising in the remediation of Cd-polluted water.
Supplementary Materials
The following are available online at https://www.mdpi.com/2073-4441/12/4/1117/s1: Figure S1: Schematic of the preparation of modified biochar, Figure S2: N2 adsorption/desorption isotherms and pore size distribution of TSBC-600 (a) and TMBC-600 (b), Figure S3: High-resolution spectrum of C 1s (A1,A2), N 1s (B1,B2), S 2p (C1,C2) for MBC-600, SBC-600, TMBC-600 and TSBC-600, Table S1: Comparison of metal ion sorption capacity (mg/g) of different adsorbents.
Author Contributions
Conceptualization, F.C. and H.L.; methodology, F.C.; validation, R.Y., G.H., and F.C.; formal analysis, Y.Z.; investigation, Y.Z., H.L., R.Y., G.H., and F.C.; resources, Y.Z. and H.L.; writing—original draft preparation, Y.Z.; writing—review and editing, R.Y., G.H., and F.C.; supervision, F.C.; project administration, F.C.; funding acquisition, F.C. All authors contributed critical revisions during the editing process. All authors have read and agreed to the published version of the manuscript.
Funding
This research was funded by the National Natural Science Foundation of China (51974313, 41907405) and the Natural Science Foundation of Jiangsu Province (BK20180641).
Acknowledgments
The authors would like to thank Mapletrans English Service for providing English language, grammar, punctuation, and spelling help during the preparation of this manuscript.
Conflicts of Interest
The authors declare no conflicts of interest.
References
- Jin, Z.; Deng, S.; Wen, Y.; Jin, Y.; Pan, L.; Zhang, Y.; Black, T.; Jones, K.C.; Zhang, H.; Zhang, D. Application of Simplicillium chinense for Cd and Pb biosorption and enhancing heavy metal phytoremediation of soils. Sci. Total Environ. 2019, 697, 134148. [Google Scholar] [CrossRef] [PubMed]
- World Health Organization. Ten Chemicals of Major Public Health Concern; World Health Organization: Geneva, Switzerland, 2010; pp. 1–4. [Google Scholar]
- Asara, Y.; Marchal, J.; Carrasco, E.; Boulaiz, H.; Solinas, G.; Bandiera, P.; Garcia, M.; Farace, C.; Montella, A.; Madeddu, R. Cadmium modifies the cell cycle and apoptotic profiles of human breast cancer cells treated with 5-fluorouracil. Int. J. Mol. Sci. 2013, 14, 16600–16616. [Google Scholar] [CrossRef] [PubMed]
- Shen, Z.; Zhang, J.; Hou, D.; Tsang, D.C.; Ok, Y.S.; Alessi, D.S. Synthesis of MgO-coated corncob biochar and its application in lead stabilization in a soil washing residue. Environ. Int. 2019, 122, 357–362. [Google Scholar] [CrossRef] [PubMed]
- Liu, N.; Huang, X.; Sun, L.; Li, S.; Chen, Y.; Cao, X.; Wang, W.; Dai, J.; Rinnan, R. Screening stably low cadmium and moderately high micronutrients wheat cultivars under three different agricultural environments of China. Chemosphere 2020, 241, 125065. [Google Scholar] [CrossRef] [PubMed]
- Zeng, S.; Ma, J.; Yang, Y.; Zhang, S.; Liu, G.J.; Chen, F. Spatial assessment of farmland soil pollution and its potential human health risks in China. Sci. Total Environ. 2019, 687, 642–653. [Google Scholar] [CrossRef] [PubMed]
- Feizi, M.; Jalali, M.; Antoniadis, V.; Shaheen, S.M.; Ok, Y.S.; Rinklebe, J. Geo-and nano-materials affect the mono-metal and competitive sorption of Cd, Cu, Ni, and Zn in a sewage sludge-treated alkaline soil. J. Hazard. Mater. 2019, 379, 120567. [Google Scholar] [CrossRef]
- Li, H.; Xiong, J.; Zhang, G.; Liang, A.; Long, J.; Xiao, T.; Chen, Y.; Zhang, P.; Liao, D.; Lin, L. Enhanced thallium (I) removal from wastewater using hypochlorite oxidation coupled with magnetite-based biochar adsorption. Sci. Total Environ. 2020, 698, 134166. [Google Scholar] [CrossRef]
- Peng, H.; Gao, P.; Chu, G.; Pan, B.; Peng, J.; Xing, B. Enhanced adsorption of Cu(II) and Cd(II) by phosphoric acid-modified biochars. Environ. Pollut. 2017, 229, 846–853. [Google Scholar] [CrossRef]
- Rajendran, M.; Shi, L.; Wu, C.; Li, W.; An, W.; Liu, Z.; Xue, S. Effect of sulfur and sulfur-iron modified biochar on cadmium availability and transfer in the soil-rice system. Chemosphere 2019, 222, 314–322. [Google Scholar] [CrossRef]
- Li, Y.; Pei, G.; Qiao, X.; Zhu, Y.; Li, H. Remediation of cadmium contaminated water and soil using vinegar residue biochar. Environ. Sci. Pollut. Res. Int. 2018, 25, 15754–15764. [Google Scholar] [CrossRef]
- Yakkala, K.; Yu, M.-R.; Roh, H.; Yang, J.-K.; Chang, Y.-Y. Buffalo weed (Ambrosia trifida L. var. trifida) biochar for cadmium (II) and lead (II) adsorption in single and mixed system. Desalin. Water Treat. 2013, 51, 7732–7745. [Google Scholar] [CrossRef]
- Jing, F.; Chen, C.; Chen, X.; Liu, W.; Wen, X.; Hu, S.; Yang, Z.; Guo, B.; Xu, Y.; Yu, Q. Effects of wheat straw derived biochar on cadmium availability in a paddy soil and its accumulation in rice. Environ. Pollut. 2019, 257, 113592. [Google Scholar] [CrossRef] [PubMed]
- Zhu, L.; Tong, L.; Zhao, N.; Wang, X.; Yang, X.; Lv, Y. Key factors and microscopic mechanisms controlling adsorption of cadmium by surface oxidized and aminated biochars. J. Hazard. Mater. 2020, 382, 121002. [Google Scholar] [CrossRef] [PubMed]
- Gholami, L.; Rahimi, G.; Khademi Jolgeh Nezhad, A. Effect of thiourea-modified biochar on adsorption and fractionation of cadmium and lead in contaminated acidic soil. Int. J. Phytoremed. 2019, 22, 468–481. [Google Scholar] [CrossRef]
- O’Connor, D.; Peng, T.; Li, G.; Wang, S.; Duan, L.; Mulder, J.; Cornelissen, G.; Cheng, Z.; Yang, S.; Hou, D. Sulfur-modified rice husk biochar: A green method for the remediation of mercury contaminated soil. Sci. Total Environ. 2018, 621, 819–826. [Google Scholar] [CrossRef]
- Zhang, Y.; Fan, J.; Fu, M.; Ok, Y.S.; Hou, Y.; Cai, C. Adsorption antagonism and synergy of arsenate(V) and cadmium(II) onto Fe-modified rice straw biochars. Environ. Geochem. Health 2019, 41, 1755–1766. [Google Scholar] [CrossRef]
- Zhang, R.-L.; Xu, J.; Gao, L.; Wang, Z.; Wang, B.; Qin, S.-Y. Performance and Mechanism for Fluoride Removal in Groundwater with Calcium Modified Biochar from Peanut Shell. Sci. Adv. Mater. 2020, 12, 492–501. [Google Scholar] [CrossRef]
- Li, Z.; Sun, Y.; Yang, Y.; Han, Y.; Wang, T.; Chen, J.; Tsang, D.C. Biochar-supported nanoscale zero-valent iron as an efficient catalyst for organic degradation in groundwater. J. Hazard. Mater. 2020, 383, 121240. [Google Scholar] [CrossRef]
- Shi, S.; Yang, J.; Liang, S.; Li, M.; Gan, Q.; Xiao, K.; Hu, J. Enhanced Cr (VI) removal from acidic solutions using biochar modified by Fe3O4@ SiO2-NH2 particles. Sci. Total Environ. 2018, 628, 499–508. [Google Scholar] [CrossRef] [PubMed]
- Ma, Y.; Liu, W.J.; Zhang, N.; Li, Y.S.; Jiang, H.; Sheng, G.P. Polyethylenimine modified biochar adsorbent for hexavalent chromium removal from the aqueous solution. Bioresour. Technol. 2014, 169, 403–408. [Google Scholar] [CrossRef] [PubMed]
- Park, J.H.; Wang, J.J.; Zhou, B.; Mikhael, J.E.R.; DeLaune, R.D. Removing mercury from aqueous solution using sulfurized biochar and associated mechanisms. Environ. Pollut. 2019, 244, 627–635. [Google Scholar] [CrossRef] [PubMed]
- Liu, W.J.; Jiang, H.; Yu, H.Q. Development of Biochar-Based Functional Materials: Toward a Sustainable Platform Carbon Material. Chem. Rev. 2015, 115, 12251–12285. [Google Scholar] [CrossRef] [PubMed]
- Leksungnoen, P.; Wisawapipat, W.; Ketrot, D.; Aramrak, S.; Nookabkaew, S.; Rangkadilok, N.; Satayavivad, J. Biochar and ash derived from silicon-rich rice husk decrease inorganic arsenic species in rice grain. Sci. Total Environ. 2019, 684, 360–370. [Google Scholar] [CrossRef] [PubMed]
- Wei, Y.; Wei, S.; Liu, C.; Chen, T.; Tang, Y.; Ma, J.; Yin, K.; Luo, S. Efficient removal of arsenic from groundwater using iron oxide nanoneedle array-decorated biochar fibers with high Fe utilization and fast adsorption kinetics. Water Res. 2019, 167, 115107. [Google Scholar] [CrossRef] [PubMed]
- Zhao, D.; Yang, X.; Zhang, H.; Chen, C.; Wang, X. Effect of environmental conditions on Pb (II) adsorption on β-MnO2. Chem. Eng. J. 2010, 164, 49–55. [Google Scholar] [CrossRef]
- Gondek, K.; Mierzwa-Hersztek, M.; Kopeć, M.; Mróz, T. The Influence of Biochar Enriched with Magnesium and Sulfur on the Amount of Perennial Ryegrass Biomass and Selected Chemical Properties and Biological of Sandy Soil. Commun. Soil. Sci. Plan Anal. 2018, 49, 1257–1265. [Google Scholar] [CrossRef]
- Liu, Q.; Fang, Z.; Liu, Y.; Liu, Y.; Xu, Y.; Ruan, X.; Zhang, X.; Cao, W. Phosphorus speciation and bioavailability of sewage sludge derived biochar amended with CaO. Waste Manag. 2019, 87, 71–77. [Google Scholar] [CrossRef]
- Gao, Z.; Chen, C.; Chang, J.; Chen, L.; Wang, P.; Wu, D.; Xu, F.; Jiang, K. Porous Co3S4@Ni3S4 heterostructure arrays electrode with vertical electrons and ions channels for efficient hybrid supercapacitor. Chem. Eng. J. 2018, 343, 572–582. [Google Scholar] [CrossRef]
- Wu, C.; Shi, L.; Xue, S.; Li, W.; Jiang, X.; Rajendran, M.; Qian, Z. Effect of sulfur-iron modified biochar on the available cadmium and bacterial community structure in contaminated soils. Sci. Total Environ. 2019, 647, 1158–1168. [Google Scholar] [CrossRef]
- Huang, Y.; Lee, X.; Grattieri, M.; Yuan, M.; Cai, R.; Macazo, F.C.; Minteer, S.D. Modified biochar for phosphate adsorption in environmentally relevant conditions. Chem. Eng. J. 2020, 380, 122375. [Google Scholar] [CrossRef]
- Yang, G.X.; Jiang, H. Amino modification of biochar for enhanced adsorption of copper ions from synthetic wastewater. Water Res. 2014, 48, 396–405. [Google Scholar] [CrossRef] [PubMed]
- Amin, M.T.; Alazba, A.A.; Shafiq, M. Removal of Copper and Lead using Banana Biochar in Batch Adsorption Systems: Isotherms and Kinetic Studies. Arab. J. Sci. Eng. 2017, 43, 5711–5722. [Google Scholar] [CrossRef]
- Tang, N.; Niu, C.G.; Li, X.T.; Liang, C.; Guo, H.; Lin, L.S.; Zheng, C.W.; Zeng, G.M. Efficient removal of Cd(2+) and Pb(2+) from aqueous solution with amino- and thiol-functionalized activated carbon: Isotherm and kinetics modeling. Sci. Total Environ. 2018, 635, 1331–1344. [Google Scholar] [CrossRef] [PubMed]
- Lyu, H.; Tang, J.; Huang, Y.; Gai, L.; Zeng, E.Y.; Liber, K.; Gong, Y. Removal of hexavalent chromium from aqueous solutions by a novel biochar supported nanoscale iron sulfide composite. Chem. Eng. J. 2017, 322, 516–524. [Google Scholar] [CrossRef]
- Wu, H.; Wei, W.; Xu, C.; Meng, Y.; Bai, W.; Yang, W.; Lin, A. Polyethylene glycol-stabilized nano zero-valent iron supported by biochar for highly efficient removal of Cr (VI). Ecotox. Environ. Saf. 2020, 188, 109902. [Google Scholar] [CrossRef]
- Liu, L.; Fan, S. Removal of cadmium in aqueous solution using wheat straw biochar: Effect of minerals and mechanism. Environ. Sci. Pollut. Res. 2018, 25, 8688–8700. [Google Scholar] [CrossRef]
- You, F.; Dalal, R.; Huang, L. Biochar and biomass organic amendments shaped different dominance of lithoautotrophs and organoheterotrophs in microbial communities colonizing neutral copper(Cu)-molybdenum(Mo)-gold(Au) tailings. Geoderma 2018, 309, 100–110. [Google Scholar] [CrossRef]
- Chang, Y.; Zhang, G.; Han, B.; Li, H.; Hu, C.; Pang, Y.; Chang, Z.; Sun, X. Polymer dehalogenation-enabled fast fabrication of N, S-codoped carbon materials for superior supercapacitor and deionization applications. ACS Appl. Mater. Interfaces 2017, 9, 29753–29759. [Google Scholar] [CrossRef]
- Mian, M.M.; Liu, G.; Yousaf, B.; Fu, B.; Ullah, H.; Ali, M.U.; Abbas, Q.; Mujtaba Munir, M.A.; Ruijia, L. Simultaneous functionalization and magnetization of biochar via NH3 ambiance pyrolysis for efficient removal of Cr (VI). Chemosphere 2018, 208, 712–721. [Google Scholar] [CrossRef]
- Song, H.; Liu, Z.; Gai, H.; Wang, Y.; Qiao, L.; Zhong, C.; Yin, X.; Xiao, M. Nitrogen-Dopped Ordered Mesoporous Carbon Anchored Pd Nanoparticles for Solvent Free Selective Oxidation of Benzyl Alcohol to Benzaldehyde by Using O2. Front. Chem. 2019, 7, 458. [Google Scholar] [CrossRef]
- Wu, Z.; Chen, X.; Yuan, B.; Fu, M.-L. A facile foaming-polymerization strategy to prepare 3D MnO2 modified biochar-based porous hydrogels for efficient removal of Cd (II) and Pb (II). Chemosphere 2020, 239, 124745. [Google Scholar] [CrossRef] [PubMed]
- Wei, Y.; Yan, Y.; Zou, Y.; Shi, M.; Deng, Q.; Zhao, N.; Wang, J.; You, C.; Yang, R.; Xu, Y. Sulfonated polyaniline coated bamboo-derived biochar/sulfur cathode for Li-S batteries with excellent dual conductivity and polysulfides affinity. Electrochim. Acta 2019, 310, 45–57. [Google Scholar] [CrossRef]
- Mohan, D.; Pittman Jr, C.U.; Bricka, M.; Smith, F.; Yancey, B.; Mohammad, J.; Steele, P.H.; Alexandre-Franco, M.F.; Gómez-Serrano, V.; Gong, H. Sorption of arsenic, cadmium, and lead by chars produced from fast pyrolysis of wood and bark during bio-oil production. J. Colloid Interface Sci. 2007, 310, 57–73. [Google Scholar] [CrossRef] [PubMed]
- Xia, Y.; Yang, T.; Zhu, N.; Li, D.; Chen, Z.; Lang, Q.; Liu, Z.; Jiao, W. Enhanced adsorption of Pb(II) onto modified hydrochar: Modeling and mechanism analysis. Bioresour. Technol. 2019, 288, 121593. [Google Scholar] [CrossRef]
- Mahdi, Z.; El Hanandeh, A.; Yu, Q. Influence of pyrolysis conditions on surface characteristics and methylene blue adsorption of biochar derived from date seed biomass. Waste Biomass Valorization 2017, 8, 2061–2073. [Google Scholar] [CrossRef]
- Hernandez-Soriano, M.C.; Kerré, B.; Kopittke, P.M.; Horemans, B.; Smolders, E. Biochar affects carbon composition and stability in soil: A combined spectroscopy-microscopy study. Sci. Rep. 2016, 6, 25127. [Google Scholar] [CrossRef]
- Lai, F.; Chang, Y.; Huang, H.; Wu, G.; Xiong, J.; Pan, Z.; Zhou, C. Liquefaction of sewage sludge in ethanol-water mixed solvents for bio-oil and biochar products. Energy 2018, 148, 629–641. [Google Scholar] [CrossRef]
- Zhang, X.; Zhang, P.; Yuan, X.; Li, Y.; Han, L. Effect of pyrolysis temperature and correlation analysis on the yield and physicochemical properties of crop residue biochar. Bioresour. Technol. 2020, 296, 122318. [Google Scholar] [CrossRef]
- Cui, X.; Fang, S.; Yao, Y.; Li, T.; Ni, Q.; Yang, X.; He, Z. Potential mechanisms of cadmium removal from aqueous solution by Canna indica derived biochar. Sci. Total Environ. 2016, 562, 517–525. [Google Scholar] [CrossRef]
- Park, J.H.; Ok, Y.S.; Kim, S.H.; Cho, J.S.; Heo, J.S.; Delaune, R.D.; Seo, D.C. Competitive adsorption of heavy metals onto sesame straw biochar in aqueous solutions. Chemosphere 2016, 142, 77–83. [Google Scholar] [CrossRef]
- Huang, P.; Ge, C.; Feng, D.; Yu, H.; Luo, J.; Li, J.; Strong, P.; Sarmah, A.K.; Bolan, N.S.; Wang, H. Effects of metal ions and pH on ofloxacin sorption to cassava residue-derived biochar. Sci. Total Environ. 2018, 616, 1384–1391. [Google Scholar] [CrossRef] [PubMed]
- Li, D.; Yang, R.; Luo, H.; Liu, S.; Liu, Y.; Peng, O.; Tie, B. Effect of adsorption of cadmium from aqueous solution by hexadecyl trimethyl ammonium bromide modified biochar. Chin. J. Environ. Eng. 2019, 13, 1809–1821. [Google Scholar]
- Enders, A.; Hanley, K.; Whitman, T.; Joseph, S.; Lehmann, J. Characterization of biochars to evaluate recalcitrance and agronomic performance. Bioresour. Technol. 2012, 114, 644–653. [Google Scholar] [CrossRef] [PubMed]
- Lam, Y.Y.; Lau, S.S.; Wong, J.W. Removal of Cd (II) from aqueous solutions using plant-derived biochar: Kinetics, isotherm and characterization. Bioresour. Technol. Rep. 2019, 8, 100323. [Google Scholar] [CrossRef]
- Cui, H.-J.; Wang, M.K.; Fu, M.-L.; Ci, E. Enhancing phosphorus availability in phosphorus-fertilized zones by reducing phosphate adsorbed on ferrihydrite using rice straw-derived biochar. J. Soil Sediment 2011, 11, 1135. [Google Scholar] [CrossRef]
- Jiang, T.-Y.; Jiang, J.; Xu, R.-K.; Li, Z. Adsorption of Pb (II) on variable charge soils amended with rice-straw derived biochar. Chemosphere 2012, 89, 249–256. [Google Scholar] [CrossRef]
- Yin, W.; Zhao, C.; Xu, J. Enhanced adsorption of Cd (II) from aqueous solution by a shrimp bran modified Typha orientalis biochar. Environ. Sci. Pollut. Res. 2019, 26, 37092–37100. [Google Scholar] [CrossRef]
- Wang, S.; Guo, W.; Gao, F.; Yang, R. Characterization and Pb (II) removal potential of corn straw-and municipal sludge-derived biochars. R. Soc. Open Sci. 2017, 4, 170402. [Google Scholar] [CrossRef] [Green Version]
- Caurie, M. The derivation of the GAB adsorption equation from the BDDT adsorption theory. Int. J. Food Sci. Technol. 2006, 41, 173–179. [Google Scholar] [CrossRef]
- Yao, L.; Zhao, Z.; Zhao, L.; Zhang, Z.; Shi, M.; Xu, M.M. Evaluation of Adsorption of Cadmium onto Ferrihydrite-Humic Acid Coprecipitation. Sci. Adv. Mater. 2019, 11, 1232–1240. [Google Scholar] [CrossRef]
- Ao, H.; Cao, W.; Hong, Y.; Wu, J.; Wei, L. Adsorption of Sulfate Ion from Water by Zirconium Oxide-Modified Biochar Derived from Pomelo Peel. Sci. Total Environ. 2019, 135092. [Google Scholar] [CrossRef] [PubMed]
- Chen, F.; Luo, Z.; Liu, G.; Yang, Y.; Zhang, S.; Ma, J. Remediation of electronic waste polluted soil using a combination of persulfate oxidation and chemical washing. J. Environ. Manag. 2017, 204, 170–178. [Google Scholar] [CrossRef] [PubMed]
Figure 1.
SEM image (a,c,e,g) and EDS spectrum (b,d,f,h) of MBC-600, SBC-600, TMBC-600 and TSBC-600.
Figure 1.
SEM image (a,c,e,g) and EDS spectrum (b,d,f,h) of MBC-600, SBC-600, TMBC-600 and TSBC-600.

Figure 2.
FTIR spectra of MBC-600, TMBC-600 and FMBC-600 (after Cd2+ adsorption) (a), and SBC-600, TSBC-600 and FSBC-600 (after Cd2+ adsorption) (b), (F stands for adsorption reaction).
Figure 2.
FTIR spectra of MBC-600, TMBC-600 and FMBC-600 (after Cd2+ adsorption) (a), and SBC-600, TSBC-600 and FSBC-600 (after Cd2+ adsorption) (b), (F stands for adsorption reaction).

Figure 3.
XPS spectra of MBC-600, SBC-600, TMBC-600 and TSBC-600 (a,b).

Figure 4.
Effect of different pyrolysis temperatures on Cd2+ adsorption by TMBC-600 and TSBC-600.

Figure 5.
Effect of different pH on Cd2+ removal efficiency by TMBC-600 and TSBC-600 (a), comparison between the initial and final pH after the reaction (b).
Figure 5.
Effect of different pH on Cd2+ removal efficiency by TMBC-600 and TSBC-600 (a), comparison between the initial and final pH after the reaction (b).

Figure 6.
Effect of different dosage on adsorption of Cd2+ by TMBC-600 and TSBC-600.

Figure 7.
Fitting curves of the kinetics of TMBC-600 and MBC-600 (a) and TSBC-600 and SBC-600 (b) (C0 = 100 mg/L, pH = 7, doageTMBC-600 = 5 g/L and doageTSBC-600 = 4 g/L, 25 °C).
Figure 7.
Fitting curves of the kinetics of TMBC-600 and MBC-600 (a) and TSBC-600 and SBC-600 (b) (C0 = 100 mg/L, pH = 7, doageTMBC-600 = 5 g/L and doageTSBC-600 = 4 g/L, 25 °C).

Figure 8.
Fitting curves of isothermal adsorption of TMBC-600 and MBC-600 (a) and TSBC-600 and SBC-600 (b) (pH = 7, doageTMBC-600 = 5 g/L and doageTSBC-600 = 4 g/L, 25 °C).
Figure 8.
Fitting curves of isothermal adsorption of TMBC-600 and MBC-600 (a) and TSBC-600 and SBC-600 (b) (pH = 7, doageTMBC-600 = 5 g/L and doageTSBC-600 = 4 g/L, 25 °C).


Table 1.
Physicochemical properties of MBC-600, SBC-600, TMBC-600, and TSBC-600. BET, Brauner-Emmett-Teller.
Table 1.
Physicochemical properties of MBC-600, SBC-600, TMBC-600, and TSBC-600. BET, Brauner-Emmett-Teller.
| Samples | Yield (%) | Ash (%) | pH | BET Surface Area (m2/g) | Average Pore Diameter (nm) |
|---|---|---|---|---|---|
| MBC-600 | 24.26 | 46.75 | 7.07 | 2.46 | 4.66 |
| SBC-600 | 31.42 | 41.68 | 9.92 | 2.77 | 1.94 |
| TMBC-600 | — | 57.46 | 8.94 | 5.54 | 4.83 |
| TSBC-600 | — | 47.71 | 10.85 | 5.70 | 3.42 |
Notes: MBC-600, poplar sawdust biochar; SBC-600, poplar bark biochar; TMBC-600, thiourea modified poplar sawdust biochar; TSBC-600, thiourea modified Poplar bark biochar.
Table 2.
Adsorption kinetic parameters of MBC-600, SBC-600, TMBC-600, and TSBC-600 (C0 = 100 mg/L, pH = 7, doageTMBC-600 = 5 g/L and doageTSBC-600 = 4 g/L, 25 °C).
Table 2.
Adsorption kinetic parameters of MBC-600, SBC-600, TMBC-600, and TSBC-600 (C0 = 100 mg/L, pH = 7, doageTMBC-600 = 5 g/L and doageTSBC-600 = 4 g/L, 25 °C).
| Samples | Pseudo First Order | Pseudo Second Order | ||||
|---|---|---|---|---|---|---|
| Qe (mg/g) | k1 (1/min) | R2 | Qe (mg/g) | k2 (g/mg/min) | R2 | |
| TSBC-600 | 11.65 | 0.1391 | 0.88 | 12.19 | 0.0184 | 0.92 |
| SBC-600 | 5.93 | 0.0062 | 0.94 | 6.63 | 0.0013 | 0.97 |
| TMBC-600 | 4.76 | 0.0189 | 0.94 | 5.20 | 0.0049 | 0.98 |
| MBC-600 | 3.72 | 0.0124 | 0.90 | 4.09 | 0.0042 | 0.96 |
Note: Qm is the maximum adsorption capacity; k1 is the rate constant of the pseudo-first-order kinetic equation; k2 is the rate constant of the pseudo-first-order kinetic equation.
Table 3.
The fitting parameters for isothermal adsorption of MBC-600, SBC-600, TMBC-600, and TSBC-600 (pH = 7, doageTMBC-600 = 5 g/L and doageTSBC-600 = 4 g/L, 25 °C).
Table 3.
The fitting parameters for isothermal adsorption of MBC-600, SBC-600, TMBC-600, and TSBC-600 (pH = 7, doageTMBC-600 = 5 g/L and doageTSBC-600 = 4 g/L, 25 °C).
| Samples | Langmuir Model | Freundlich Model | ||||
|---|---|---|---|---|---|---|
| Qm (mg/g) | KL (L/mg) | R2 | KF (L/g) | 1/n | R2 | |
| TSBC-600 | 19.998 | 0.026 | 0.91 | 4.230 | 0.233 | 0.70 |
| SBC-600 | 9.880 | 0.050 | 0.83 | 3.506 | 0.158 | 0.55 |
| TMBC-600 | 9.631 | 0.008 | 0.99 | 0.652 | 0.385 | 0.90 |
| MBC-600 | 5.898 | 0.009 | 0.91 | 0.417 | 0.380 | 0.78 |
Notes: Qm is the maximum adsorption capacity; KL is the affinity constant of the interaction between the adsorbate and the adsorbent; Kf is the Freundlich adsorption capacity parameter; n is the empirical parameter of the adsorption strength.
© 2020 by the authors. Licensee MDPI, Basel, Switzerland. This article is an open access article distributed under the terms and conditions of the Creative Commons Attribution (CC BY) license (http://creativecommons.org/licenses/by/4.0/).
Share and Cite
MDPI and ACS Style
Zhu, Y.; Liang, H.; Yu, R.; Hu, G.; Chen, F. Removal of Aquatic Cadmium Ions Using Thiourea Modified Poplar Biochar. Water 2020, 12, 1117. https://doi.org/10.3390/w12041117
AMA Style
Zhu Y, Liang H, Yu R, Hu G, Chen F. Removal of Aquatic Cadmium Ions Using Thiourea Modified Poplar Biochar. Water. 2020; 12(4):1117. https://doi.org/10.3390/w12041117
Chicago/Turabian StyleZhu, Yanfeng, Huageng Liang, Ruilian Yu, Gongren Hu, and Fu Chen. 2020. "Removal of Aquatic Cadmium Ions Using Thiourea Modified Poplar Biochar" Water 12, no. 4: 1117. https://doi.org/10.3390/w12041117
Note that from the first issue of 2016, this journal uses article numbers instead of page numbers. See further details here.