Numerical Investigation of a High-Speed Electrical Submersible Pump with Different End Clearances


1
National Research Center of Pumps, Jiangsu University, Zhenjiang 212013, China
2
School of Mechanical Engineering, Nantong University, Nantong 226000, China
3
School of Mechanical Engineering, Hefei University of Technology, Hefei 230009, China
*
Authors to whom correspondence should be addressed.
Water 2020, 12(4), 1116; https://doi.org/10.3390/w12041116
Submission received: 18 March 2020
/
Revised: 9 April 2020
/
Accepted: 10 April 2020
/
Published: 14 April 2020
(This article belongs to the Special Issue Hydraulic Dynamic Calculation and Simulation)
Abstract
:The end clearance of the impeller is one of the most important structural parameters in the hydraulic design of a high-speed electrical submersible pump (ESP). In this paper, an ESP with a rotating speed of 6000 r/min was taken as the research object. Numerical calculations were carried out for five different end clearance conditions of 0.1 mm, 0.3 mm, 0.6 mm, 0.9 mm, and 1.2 mm, respectively, to obtain the performance and internal flow field under different situation. The simulation results were verified by the pump performance experiment. It showed that the increase of the end clearance led to a decrease of the head and efficiency of the electrical submersible pump. Through the analysis of the internal flow field, it was found that the existence of the end clearance reduced the flow rate and caused free pre-whirl. With the increase of the end clearance, the phenomenon of de-flow in the diffuser passage was aggravated, which further reduced the performance of the electrical submersible pump. Finally, the reasonable recommended value of the end clearance was given, which facilitated the optimization design and engineering application of the high-speed ESP.
1. Introduction
Electrical submersible pump (ESP) is a specific multistage centrifugal pump working underwater. The pump and motor are located in the well, and the motor drives the pump to rotate to generate centrifugal force lifting the water or oil in the well to the ground. It is widely used in farmland irrigation and oil exploitation [1,2]. Due to the special working environment, ESP has high requirements for pump structure, performance, and stability. In the recent decades, a lot of scholars have devoted themselves to the improvement of ESP performance. They have proposed abundant performance optimization methods including orthogonal optimization [3,4,5], numerical calculation [6,7,8,9], and neural network genetic algorithm [10,11] for the structural parameters like the angle of installation, the number of blades, and the wrap angle of the blade.
The impeller and diffuser are the vital hydraulic components determining the performance of the ESP. Unlike the onshore pump, due to the limitation of the well diameter, the ESP can only reach the head requirement of several hundred meters by increasing the number of the impeller. Generally, the ESP contains dozens of impellers and diffusers. The installation of the impeller in ESP includes the fixed impeller and floating impeller. The floating impeller can move axially, while the fixed impeller is fixed on the pump shaft, which can neither move axially nor rely on the thrust pad of the diffuser. When the transport medium contains sediments, floating impeller in ESP will easily cause serious wear at the impeller inlet, which will affect the service life and stability [12,13]. Therefore, most enterprises adopt a fixed installation, which will result in end clearance at the impeller inlet. There are complex gaps in the ESP because of too many impellers, which will cause leakage flow, gap vortex, and other complex turbulent structures, and affect the performance of the ESP. At present, in the research process of multistage ESP, it was found that the three-stage structure was adopted to study, which can not only obtain good results but also reduce the calculation time and resources needed in the research process [14,15,16].
Many studies have been carried out on the complex clearance in the pump [17,18]. Hsu et al. [19] found that the inlet eddy current dramatically influences the dynamic characteristics of the impeller rotation through the study of the unsteady force caused by the leakage at the tip of impeller. San Andres et al. [20] studied the effects of six different ring seals on multistage ESP leakage and the experimental results revealed the best characteristics of certain annular seal configurations. Gao et al. [21] studied the effects of ring clearance on the performance of ESP by numerical calculation and found that when the ring clearance was greater than 0.7 mm, the performance dropped faster. Ma et al. [22] studied the tip clearance flow and the curling process of tip leakage vortex and found that the leakage flow appeared in the form of a wall jet. Tamm et al. [23] predicted the loss in the low-speed pump by formula and studied the effects of the radial clearance of the sealing gaps, which may have an essential impact on the losses of centrifugal pumps. Schleer et al. [24] analyzed the influence of the clearance flow on the flow structure at the impeller exit in part-load operation by particle image velocimetry (PIV). This flow behavior was found to be inconsistent with the classic jet-wake model, and an improved flow model including tip leakage was proposed to describe the flow structure under partial load conditions. Henry [25] found that the Reynolds number in the small clearance gap of the centrifugal pump is very high, which has great influence on the flow structures and viscosity. On account of acceleration into space, the high-pressure differences across the clearance spaces bring about a sudden pressure drop in the clearance space of centrifugal pumps. This converts the clearance space into a powerful hydrostatic bearing. As the pump rotates and vibrates, the damping and cross-coupling forces, as well as the radial stiffness, change accordingly.
Except experimental investigations, computational fluid dynamics can offer details of the internal flow field of the pump, including instability flow and performance characteristics under different flow conditions [26]. Engineering predictions of the complex flow field for the design of turbomachinery usually rely on the Reynold-averaged Navier–Stokes (RANS) for turbulence closure. Large eddy simulations (LES) and detached eddy simulations (DES) lead to an extremely fine grid resolution, which in turn makes the required calculation time and computer resources exorbitant in such complex flows [27]. LES and DES are mainly used when the aim is to investigate the unsteady phenomena or transient flow features. Pavesi et al. [28] employed DES to study the dynamic behavior of the variable speed pump-turbine in the transient load following process. Posa et al. [29] selected LES to investigate the unsteady flow features in a mixed-flow pump at off-design conditions.
Until now, once the aim was to study the effects of geometry parameters on the pump performance for optimal design, computational fluid dynamics (CFD) with RANS models and steady simulation were the first choice for the fast calculation time [30]. Shim et al. [31] chose the k–ω shear stress transport (SST) turbulence model to carry out the three-objective design optimization of a centrifugal pump impeller to reduce flow recirculation and cavitation. Liu et al. [32] used the SST model to simulate and design a double-blade centrifugal pump impeller by multicondition optimization method. Yang et al. [33] utilized the realizable k–ε turbulence model to improve the efficiency of a double volute centrifugal pump. Muggli et al. [34] employed the k-ε turbulence model and steady-state simulations to study the pump characteristic under different flow conditions. The results showed that the pump characteristic can be quite accurately predicted from full load to part load by modern numerical tools. Similar results were presented by He et al. [35]. They compared five models, i.e., standard k-ε, renormalization-group (RNG) k-ε, baseline (BSL) k-ω, standard k-ω, and SST k-ω with test results. They found that k-ε and k-ω are most suitable for internal flow and performance prediction. Furthermore, as a powerful simulation method, CFD approach was applied on the other hydraulic machines, including Francis turbine [36,37,38], water turbine [39], and tidal turbine [40].
At present, there are relatively few studies on the influence of end clearance on the performance of ESP. Especially in the high-speed ESP, if the improper end clearance is mixed with sediment, wear and tear will occur, resulting in reduced performance. In severe cases, the impeller and motor will be destroyed [41,42]. Therefore, the appropriate end clearance is crucial for the stable operation of the high-speed ESP. This article took a typical high-speed ESP as the research object. Numerical simulations of different end clearance conditions were carried out while ensuring that other design parameters remain unchanged. This test validated the effect of end clearance on ESP performance and also provided a reference for controlling end clearance during installation.
2. Numerical Methods
2.1. Geometry Model
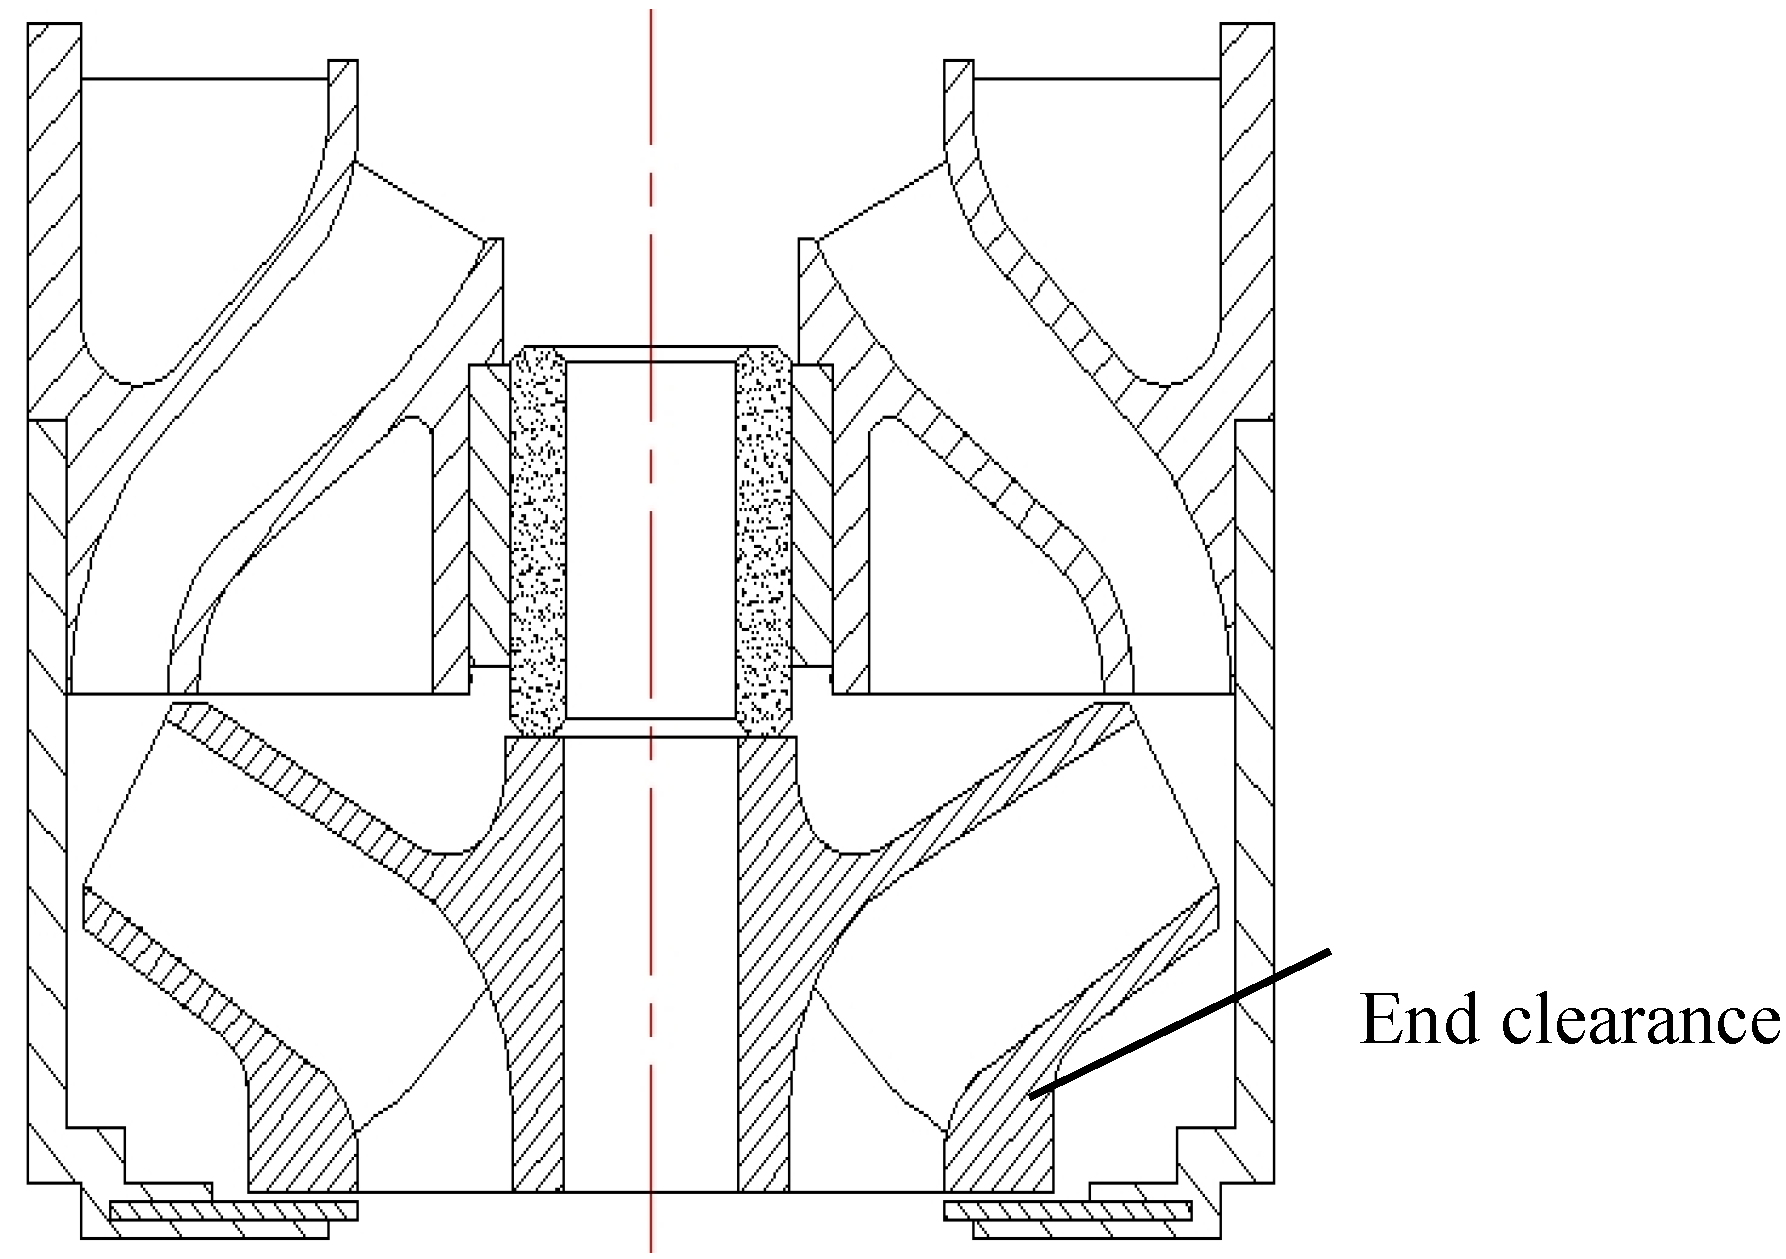
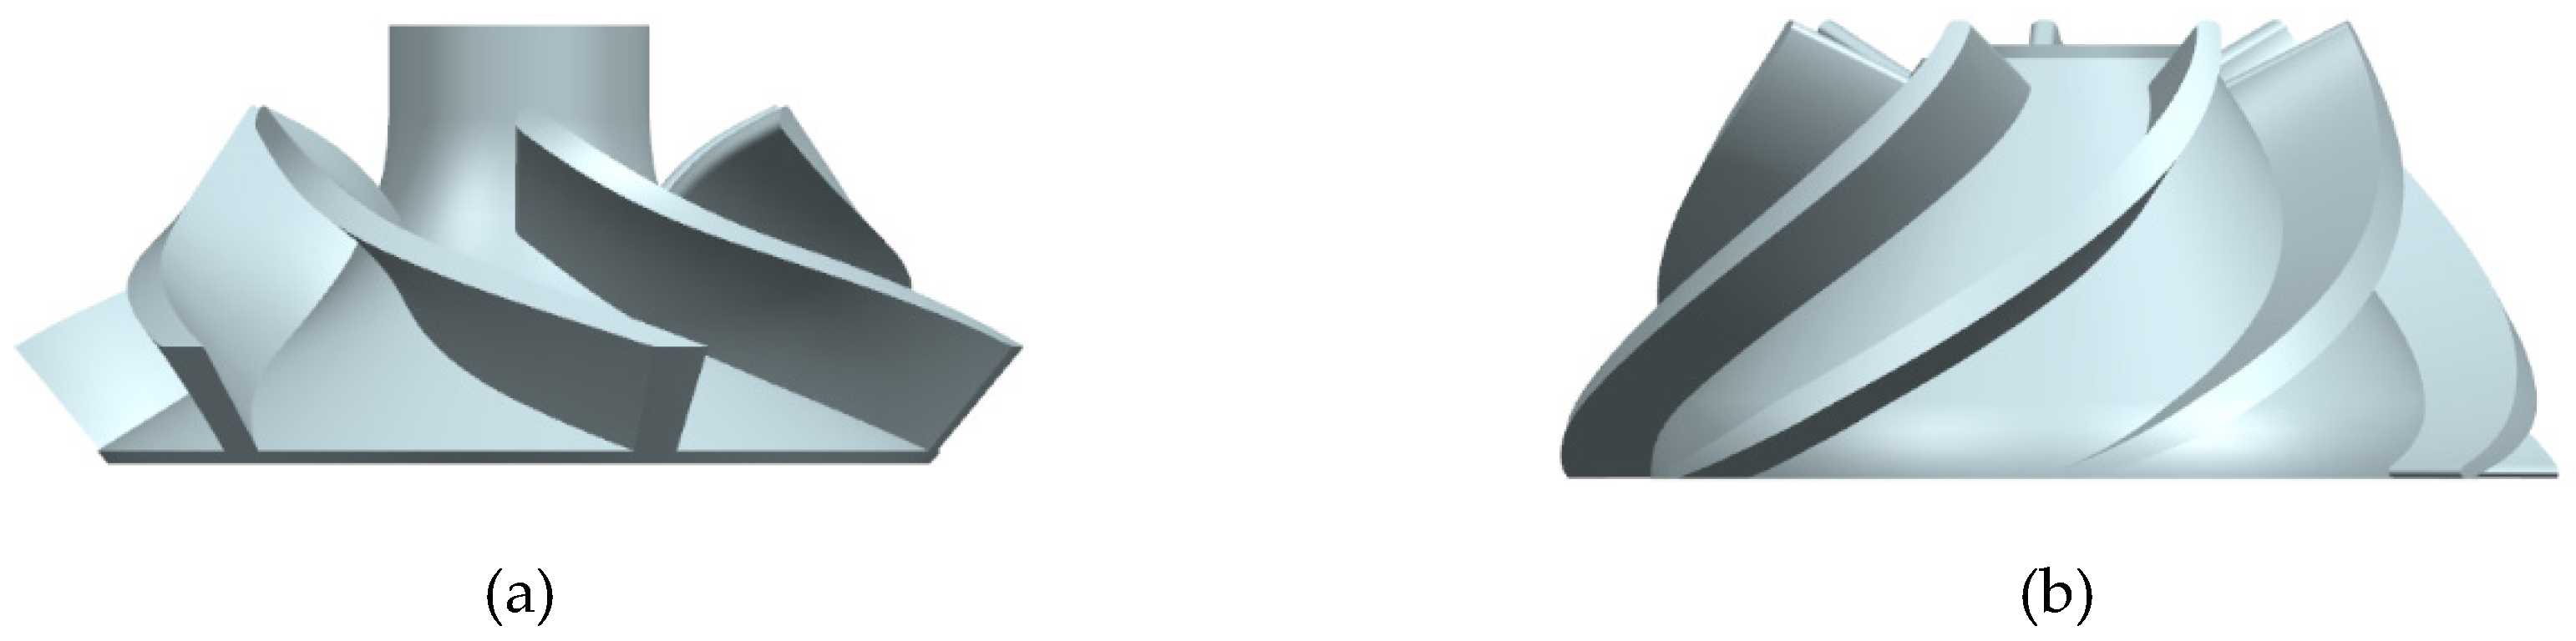
A three-stage ESP with a specific speed of 187 was selected as the research object. The design flow rate was Qd = 20 m3/h and the rated power is 5.5 kW. The main structural parameters are shown in Table 1. The pump section diagram and the location of end clearance are shown in Figure 1. The solid model of impeller and diffuser are shown in Figure 2.
2.2. Mesh and Turbulence Model
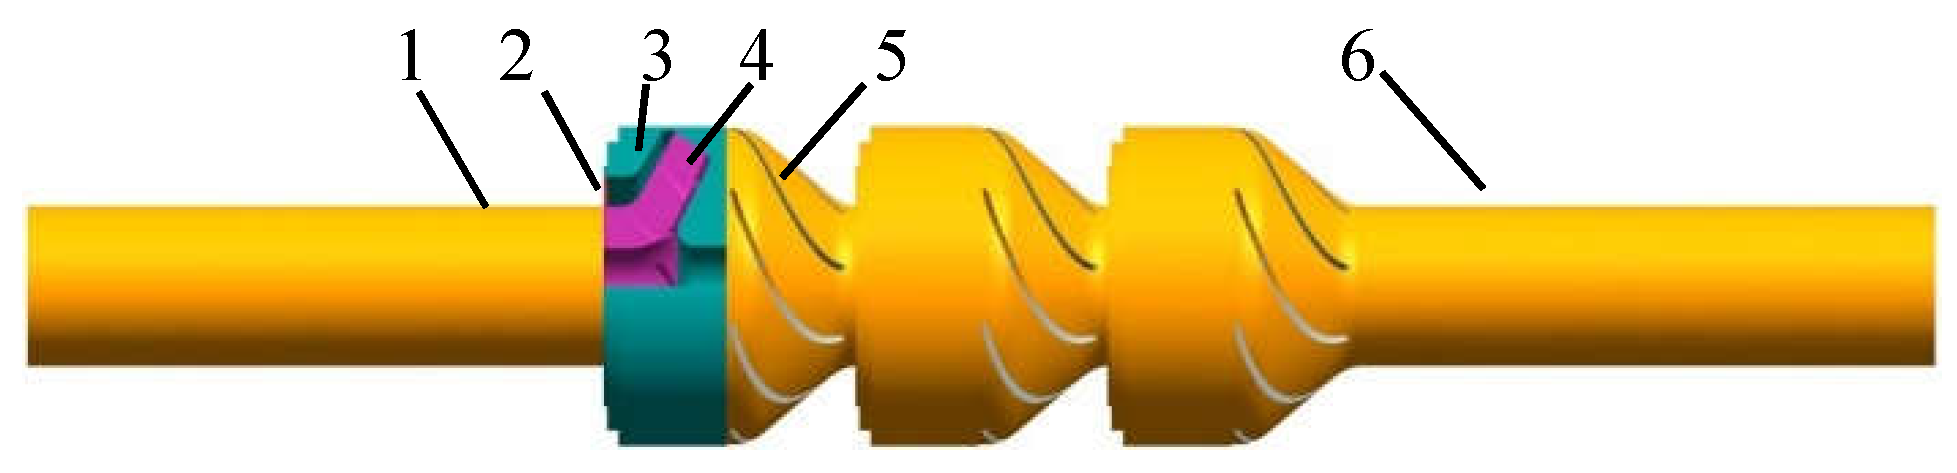
A special rubber bushing mounted on the diffuser hub will largely eliminate interstage leakage, and it can be considered that there is no interstage leakage. The solid models were created and assembled to form the computational domains in Unigraphics NX 10.0 software. As shown in Figure 3, the computational domains include the inlet section, impeller, diffuser, cavity, end clearance, and outlet section. In order to fully develop the flow and reduce the influence of the boundary on the internal flow of the pump, the length of the inlet and outlet sections was extended to four times of the inlet diameter of the impeller.
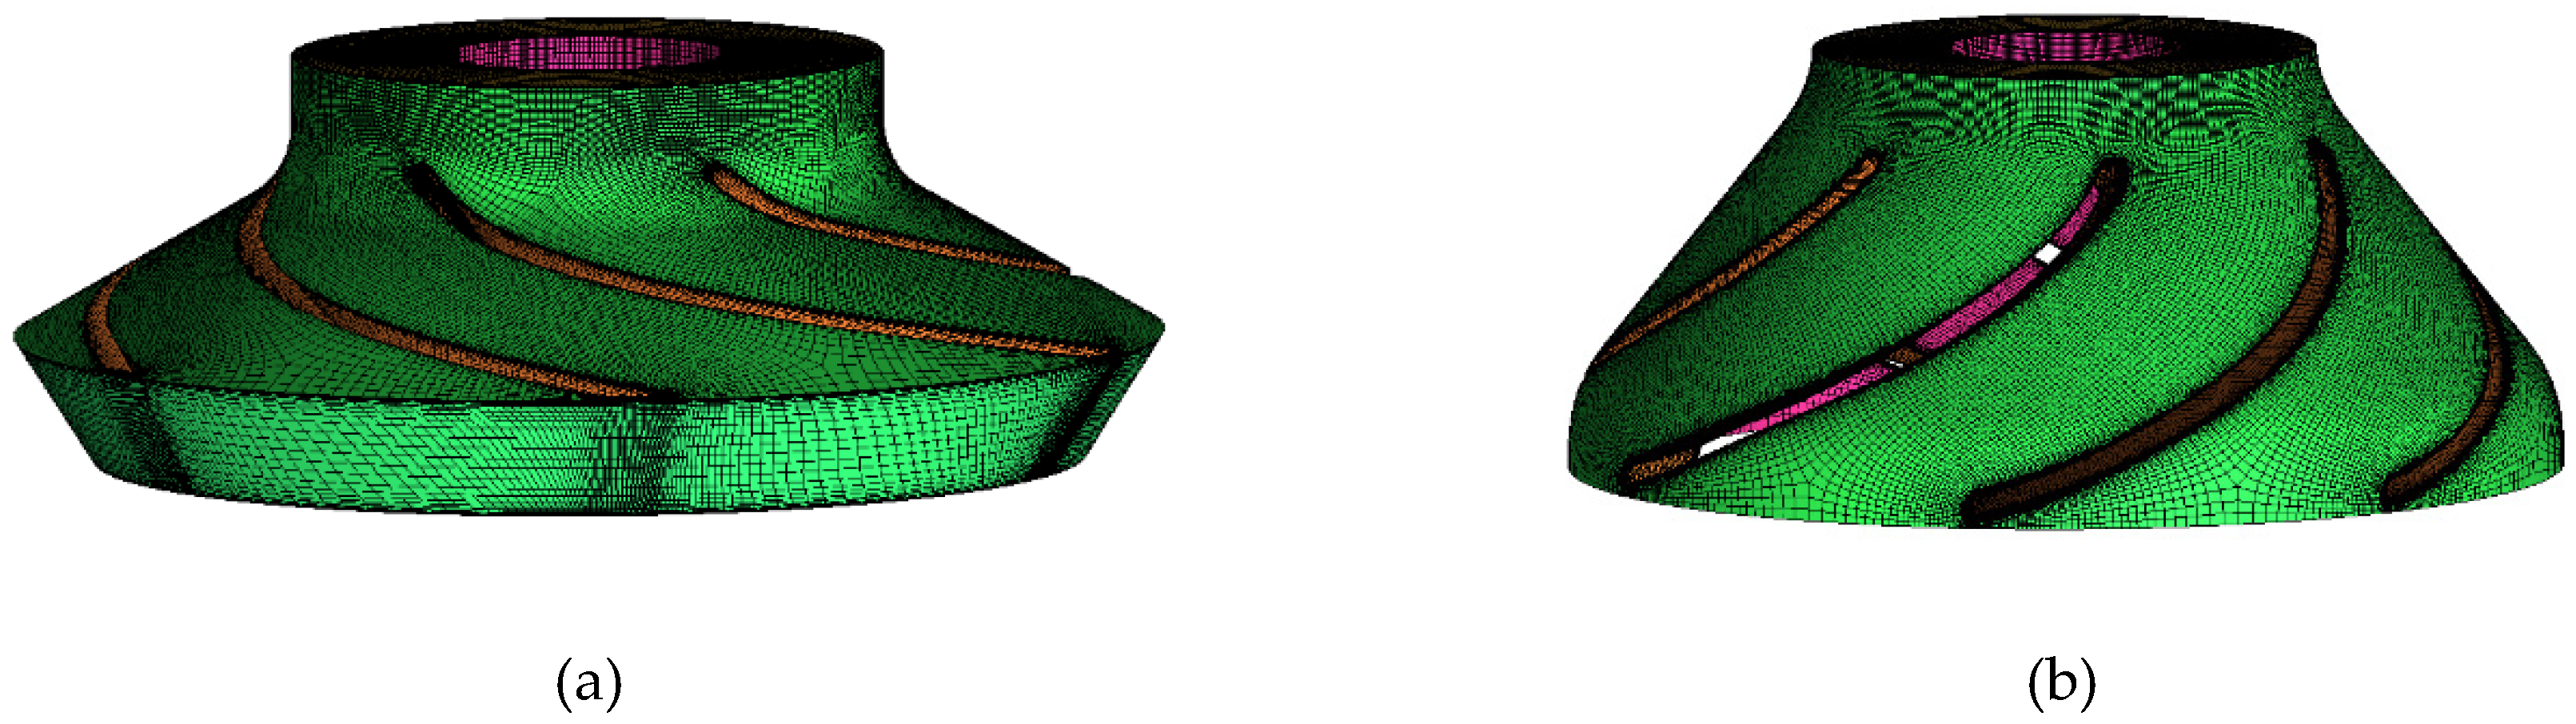
ANSYS-ICEM 17.0 software was used to build the structured mesh of computational domains associated with the block topology of Y-type and O-type. By controlling the mesh growth rate of the boundary layer, the overall mesh thickness and density were ensured. This work applied the grid independence test to opt the appropriate mesh density. The orthogonality quality of all mesh was above 0.3. As demonstrated in Table 2, this paper established five calculation schemes with different grid numbers. The head and efficiency of the ESP were taken as grid independence indicators. According to the prediction results of the performance of the ESP, it was explicit that the numerical value of head and efficiency showed a stable trend, as the number of mesh increased. The predicted head and efficiency of Scheme 1 and Scheme 2 are lower than that of other schemes. Between Scheme 3 and Scheme 4, as the grid increased, there was no significant difference in head and efficiency, which means that Scheme 3 had sufficient grid density to achieve the required accuracy. Therefore, considering the configuration and calculation time of the computer, Scheme 3 was selected as the final grid scheme for numerical computation, and the total numbers of the grid were 2,610,407. Meanwhile, it was ensured that the entire computational domain 30 < y+ < 100 to meet the requirement of standard wall functions. Figure 4 is the final mesh for the impeller, diffuser, and the whole calculation domain. The simulations were performed on following hardware configuration: Intel Xeon 2.6 GHz, 24 cores, and 64 GB ram. The computing time of design flow rate was about 2.5 h to meet the convergence criterion.
2.3. Turbulence Model and Boundary Conditions
Considering the turbulence was highly complex, there was barely a single method to comprehensively and accurately simulate the turbulence of all flow problems. The key was to consider and study the turbulence model’s simulation capabilities and calculation requirements. It was essential to find the most suitable turbulence model for the components to be calculated, and then carefully verify it by comparing the numerical results with the test data. As shown in Table 3, the pump efficiency and head predicted by four turbulence models which are widely utilized in pumps were compared with the test data of 0.3-mm clearance under the design flow rate. Among them, the RNG k-ε model predicted the highest head and pump efficiency, while the standard k-ε model had the lowest and closest predicted value with the experimental results. Thus, the standard k-ε model was chosen to proceed to numerical calculation [43,44].
For the boundary conditions, the inlet was set as the pressure inlet, the outlet boundary condition was the mass flow outlet, the wall surface was the nonslip boundary condition, and the rotational speed was 6000 r/min. As shown in Figure 3, the impeller was a rotating domain and the rest of the computational domains were static domains. The convective and the diffusive terms were solved by second order upwind discretization. Second order implicit was used as the time dependent term scheme. Semi-implicit method for pressure linked equations-consistent (SIMPLEC) algorithm was employed to calculate the pressure-velocity coupling, and the convergence criterion was set as 10−5. More details about the boundary conditions are listed in Table 4.
3. Results and Discussion
3.1. Pump Performance Verification
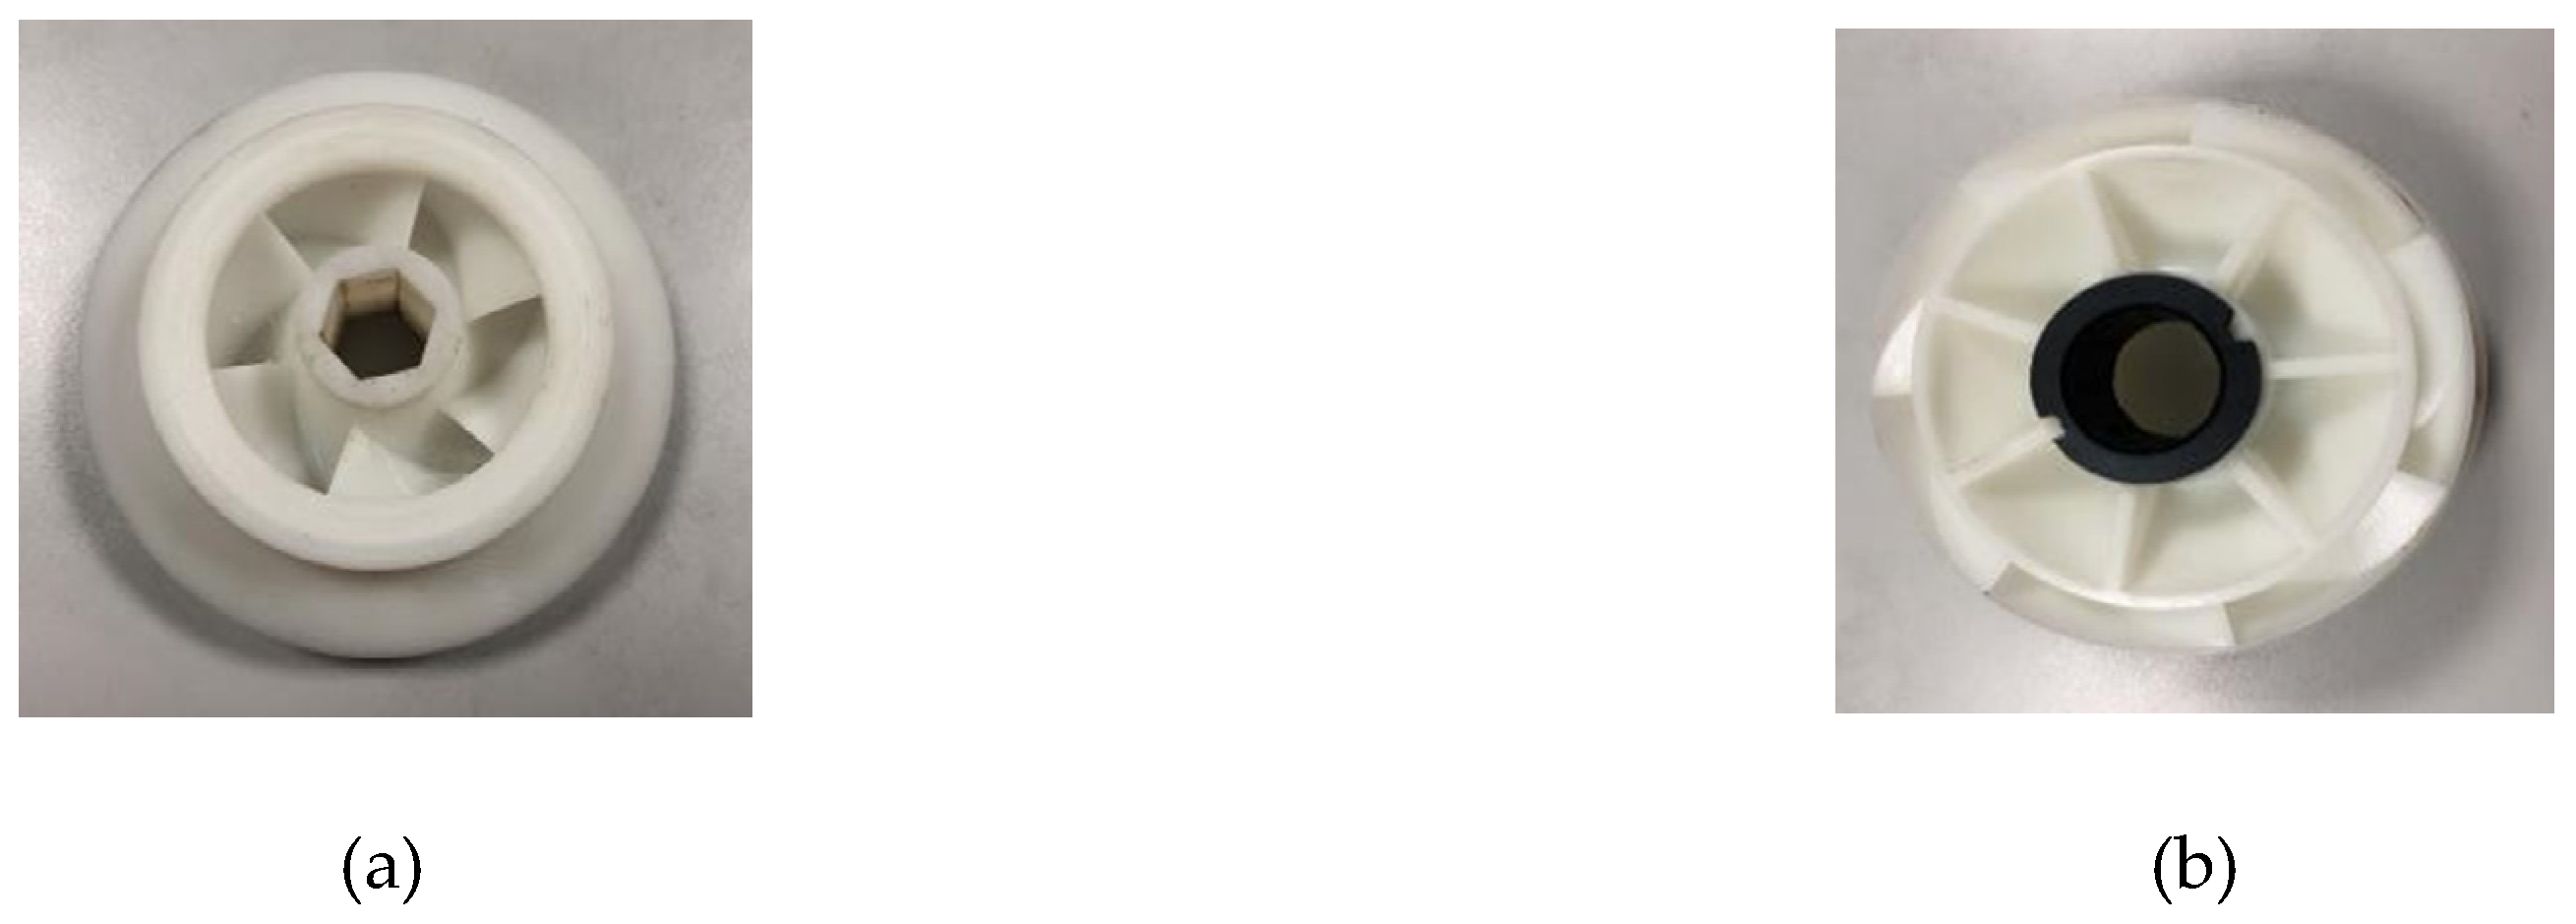
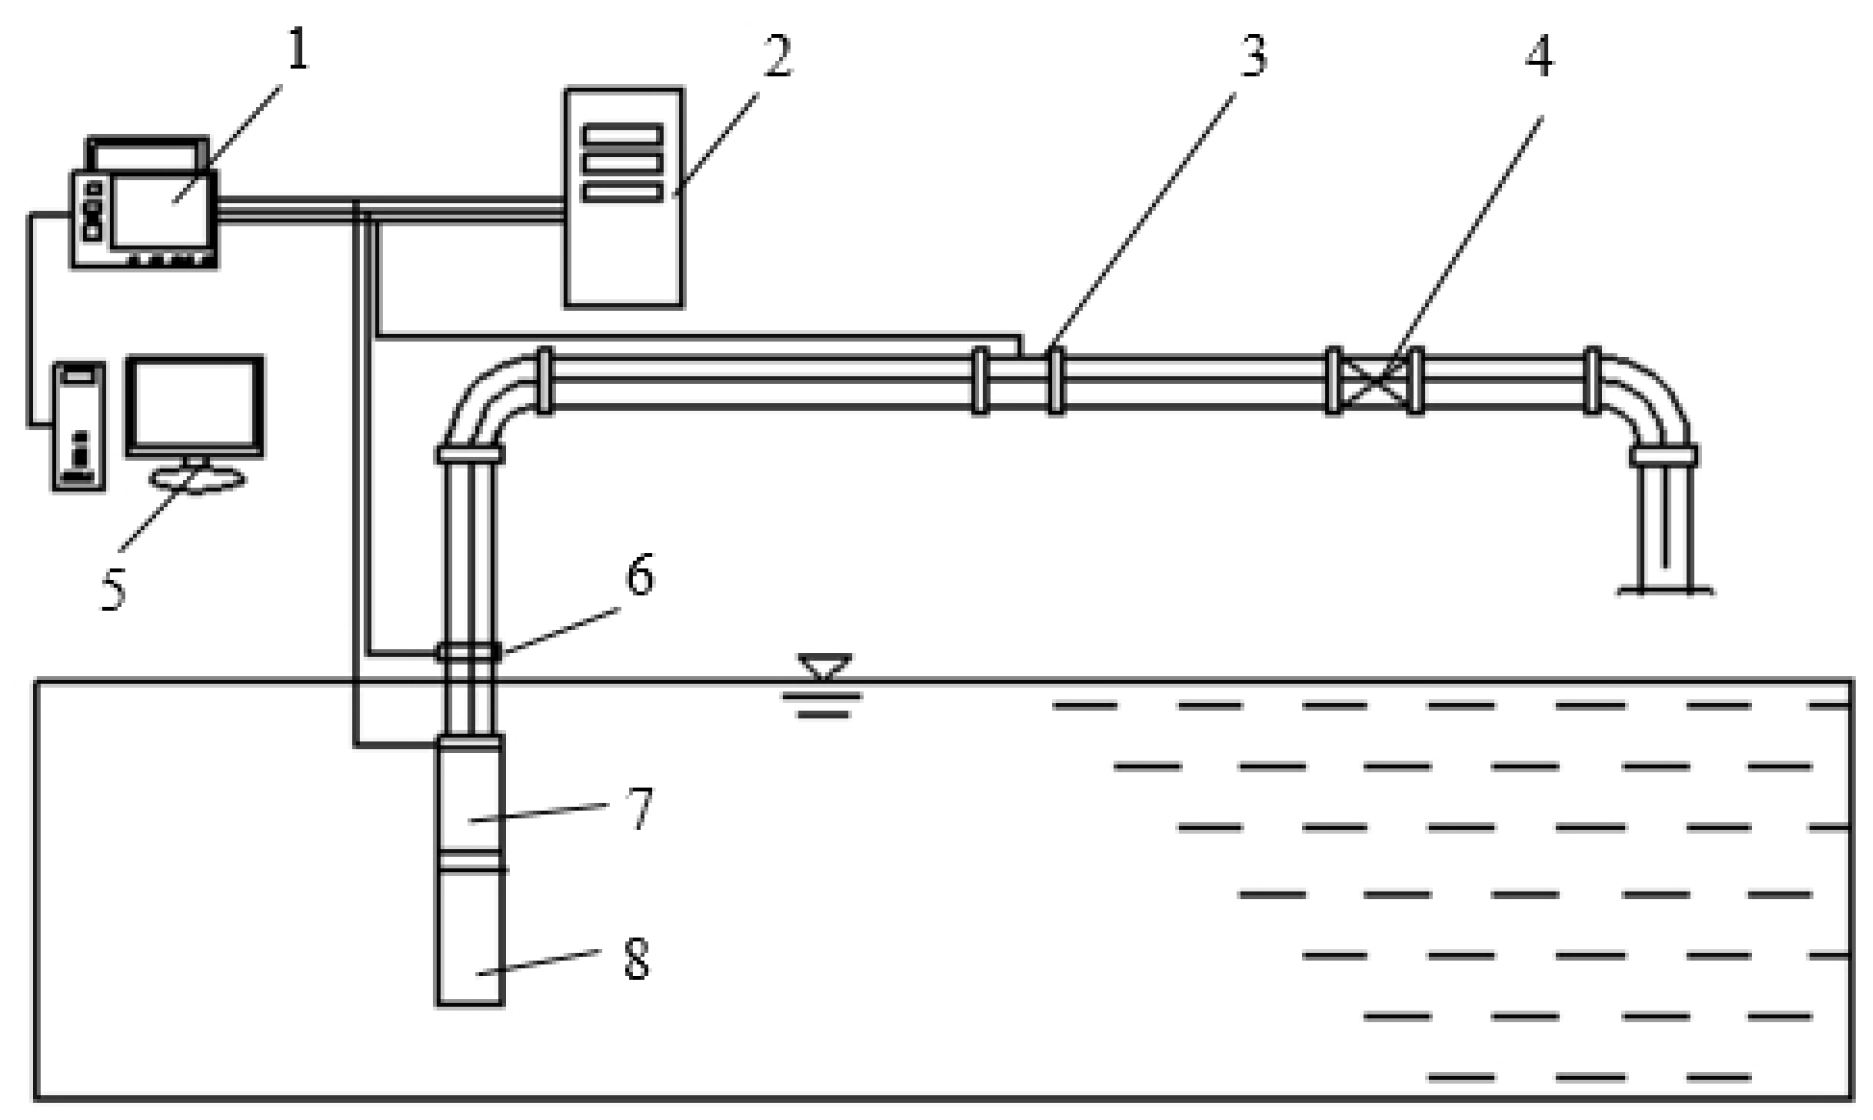
In order to verify the accuracy of the numerical calculation, the performance test of the model pump was carried out. The impeller and diffuser were manufactured by 3D printing technology and made of photosensitive resin and cyanate ester, as presented in Figure 5. The usage of a special rubber bearing in the diffuser was to reduce the effect of interstage leakage. The design of the open testbed, shown in Figure 6, included a flow control device, data acquisition device, and data processing device. During the experiment, the flow rate and the pressure were measured by the electromagnetic flowmeter and the pressure sensor [44]. Then, under the adjustment of the valve opening, the pressure at different flow rates was measured, and all signals were input to the computer software for calculation.
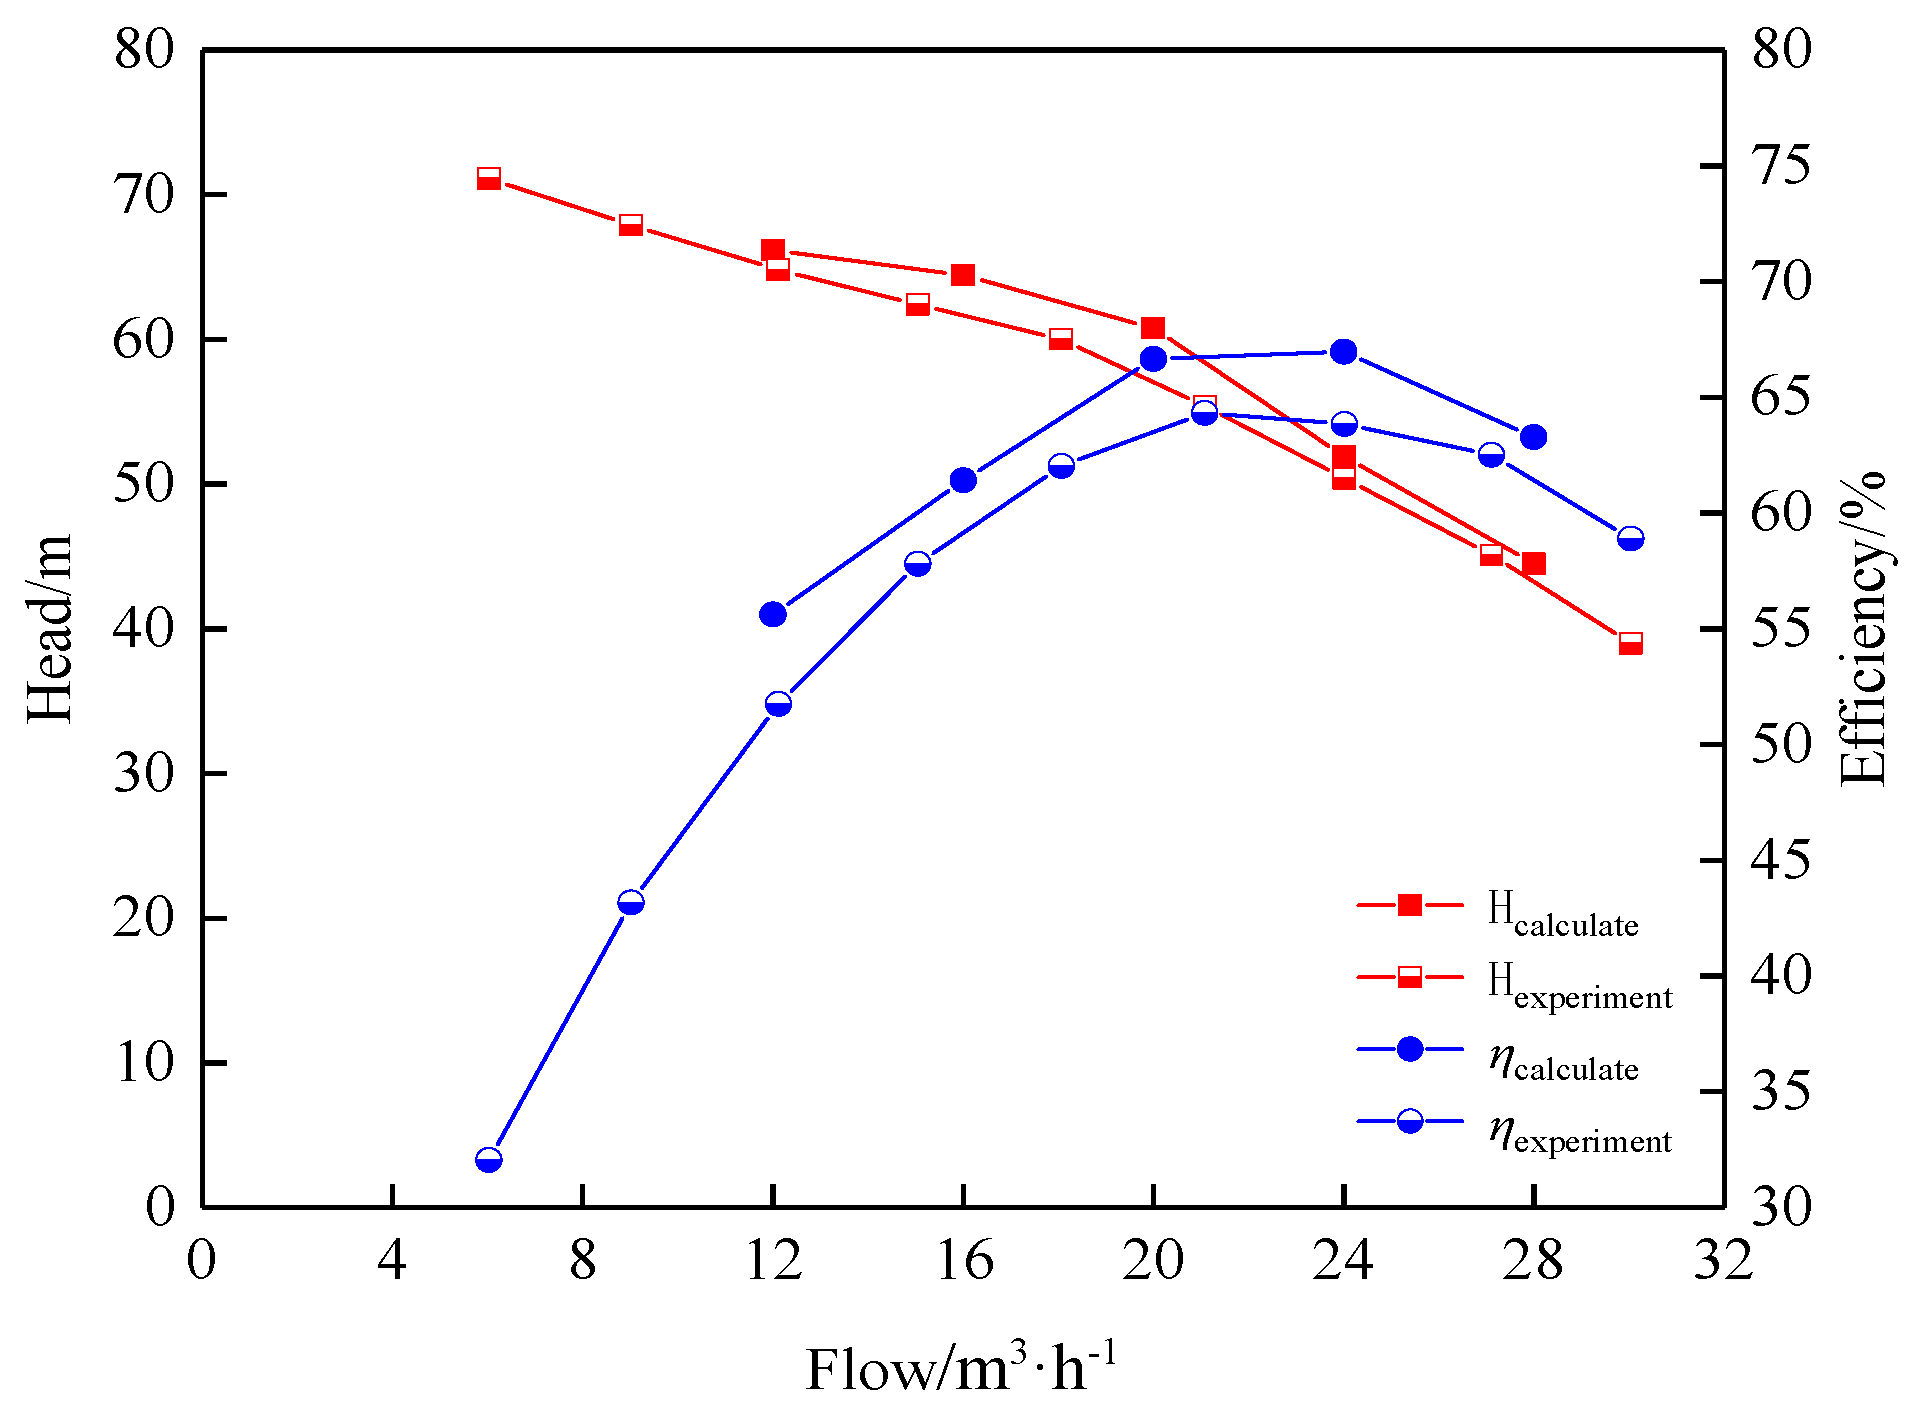
The experimental results are shown in Figure 7. In this study, five different end clearances were set to find a suitable installation clearance. We tested the performance of ESP at 0.3-mm end clearance. The numerical simulation was carried out at 12 m3/h, 16 m3/h, 20 m3/h, 24 m3/h, and 28 m3/h. It was obvious that the CFD results were in good agreement with the experimental results. The experimental results were relatively lower than the CFD results, but the error was less than 5% and they had the same changing trend at different flow rates. Hence, the method of this study is credible. The reason for the decrease in calculation results was probably the neglect of mechanical losses.
3.2. Performance Analysis
Numerical simulations were carried out at five flux (0.6 Qd, 0.8 Qd, 1.0 Qd, 1.2 Qd, 1.4 Qd) for different end clearances (b = 0.1 mm, 0.3 mm, 0.6 mm, 0.9 mm, 1.2 mm). Figure 8 shows the CFD results of the performance of the ESP at different end clearances. It can be seen that as the flow rate increased, the head decreased at the same end clearance. The efficiency of ESP showed a trend of increasing firstly and then decreasing. The highest efficiency appeared at 1.2 Qd. Under the condition of constant flow rate, the head and efficiency reduced as the end clearance increased. At the 1.0 Qd, the head dropped by 2.36 m, 2.53 m, 1.7 m, 2.42 m at 0.3 mm, 0.6 mm, 0.9 mm, and 1.2 mm, respectively. Compared with 0.1 mm, the head decreased by 9.01 m at 1.2 mm. The efficiency decreased by 1.42%, 2.25%, 1.83%, and 2.53% at 0.3 mm, 0.6 mm, 0.9 mm, and 1.2 mm, respectively. When the end clearance was 1.2 mm, the efficiency was reduced by 8.03% compared to 0.1 mm. This illustrated that the end clearance had a great influence on the performance of the ESP.
At 0.6 Qd with the 1.2-mm end clearance, the head and efficiency decreased by 11.32 m and 11.19%, respectively, compared with 0.1 mm. However, at 1.0 Qd, they decreased by 9.01 m and 8.03%, respectively. At 1.4 Qd, they just decreased by 5.58 m and 6.31%, respectively. It indicates that the influence of end clearance on the part flow condition was obviously stronger than the overflow condition in the process of increasing the end clearance.
Therefore, when it comes to the situation which contains clear water and fine sand with a diameter of 0.05 mm to 0.005 mm, it is recommended to be 0.1 mm. The smaller end clearance means better performance. However, it should be considered that the too-small end clearance, when mixed with sediment, will result in severe wear and cause power overload. When the water quality is good and the water contains a small amount of fine sand with a diameter of 0.125 mm to 0.25 mm, 0.1 mm~0.3 mm is the recommended value. At this time, the performance of the ESP will occur as a slight decline. When the water quality is poor and contains a small amount of medium sand with a diameter of 0.25 mm to 0.5 mm, given the service life and stability of the pump, it is recommended to increase the end clearance appropriately but less than 0.6 mm. In this case, the performance loss caused by the end clearance needs to be taken into account in actual operation, and the maximum is no more than 0.9 mm. Otherwise, the performance of ESP may generate a serious drop and then exceed beyond expectation ultimately.
3.3. Flow Field Analysis
3.3.1. Influence of End Clearance on the Performance of Impellers
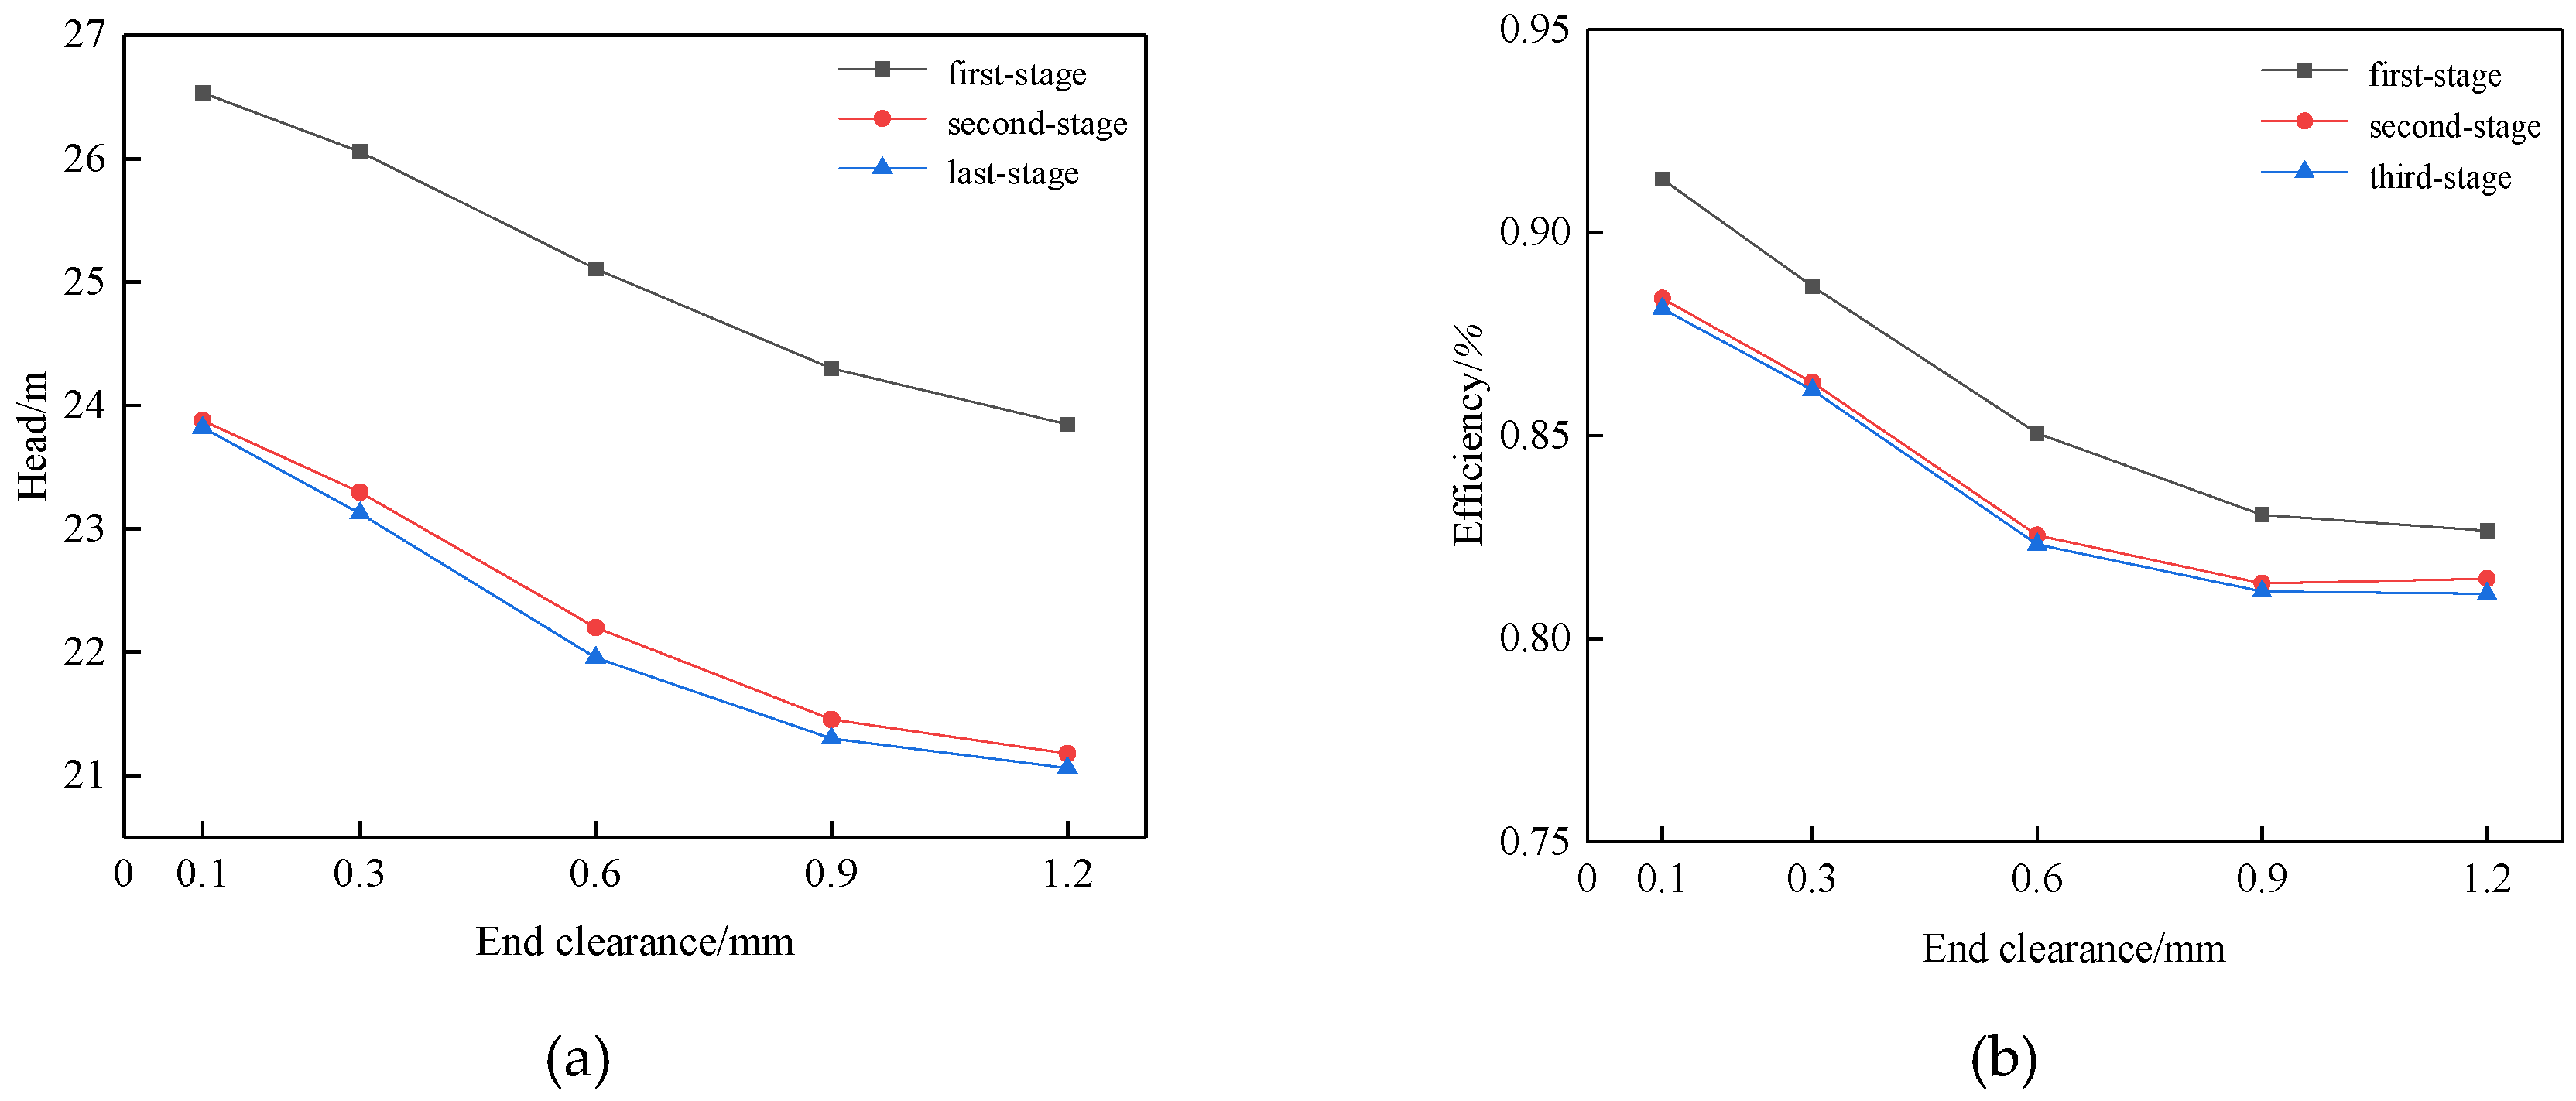
This paper used head and efficiency to study the effect of tip clearance on impeller performance. The calculated head and efficiency and the results are shown in Figure 9. The formulas for the impeller head (H) and impeller hydraulic efficiency (ηim) are as follows:
where pout is the total pressure at impeller outlet, pin is the total pressure at impeller inlet, ρ is the liquid density, M is the torque, ω is the angular velocity.
As shown in Figure 9, at the same end clearance, the head and efficiency of the second and third stage impellers were reduced compared to the first stage impeller, and the second and third stage impellers shared similar performance. We can explain the phenomenon from the Euler equation. According to the Euler equation, expression of the pump:
where Hideal is the ideal head of pump, cu1 is circumferential component of the flow velocity at the impeller, cu2 is the circumferential component of the flow velocity at the impeller outlet, u1 is the peripheral speed at impeller inlet, u2 is the peripheral speed at impeller outlet, g is the gravity acceleration.
The first-stage impeller of the ESP had no prerotation, actually cu1 = 0, so the head of the first-stage impeller was higher. Through the first-stage impeller, the liquid became swirled, cu1 > 0, so the head and efficiency of second-stage and third-stage impeller were lower than first-stage.
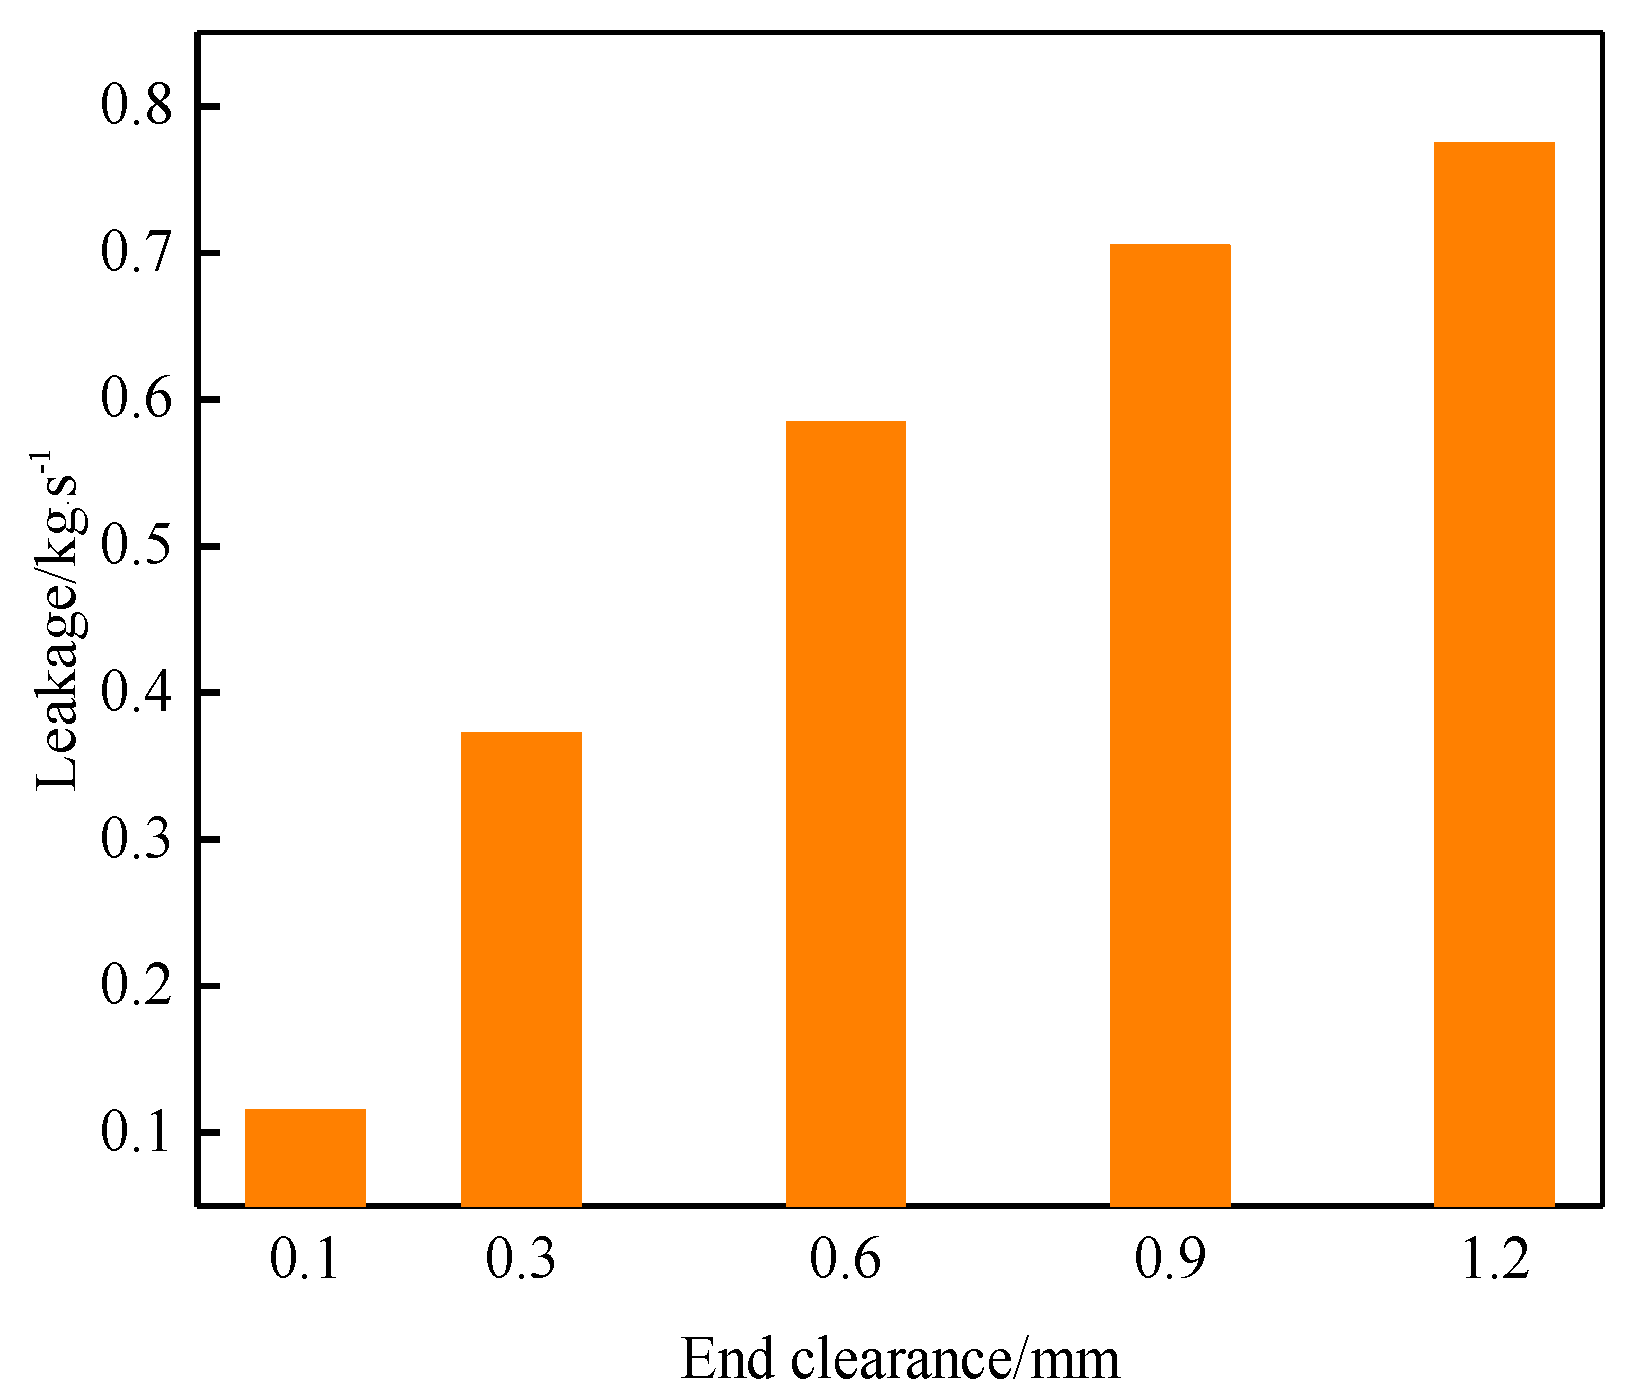
At the different end clearance, the performance of ESP dropped with the increases of the end clearance, which can intensify the internal leakage. From Figure 10, we can see the internal leakage of the single impeller at 1.2-mm end clearance was almost seven times as much as the leakage at 0.1-mm end clearance. It can be speculated that all of the liquid at the impeller entered the diffuser, and the flow can be regarded as the design flow at 0.1-mm end clearance. As the end clearance increased, part of the liquid entered into the diffuser, and part of the liquid re-entered the impeller from the end clearance, causing the actual flow to be less than the design flow. The change in flow rate triggered pre-whirl. The pre-whirl included forced pre-whirl and free pre-whirl. Forced pre-whirl was induced by external factors, such as structure, while free pre-whirl occurred independently of the structure and was only related to change of flow. The flow of pre-whirl is called the critical flow (critical flow is less than the design flow). When the flow is reduced to this critical flow, a strong countercurrent will be produced. The strong mixing of countercurrent and mainstream also caused the impeller to produce pre-whirl before the inlet. The smaller the flow is, the greater the countercurrent and the larger the pre-whirl will be. Because the energy in the process was provided by the impeller, the countercurrent caused by the pre-swirl flow consumed part of the impeller power [45].
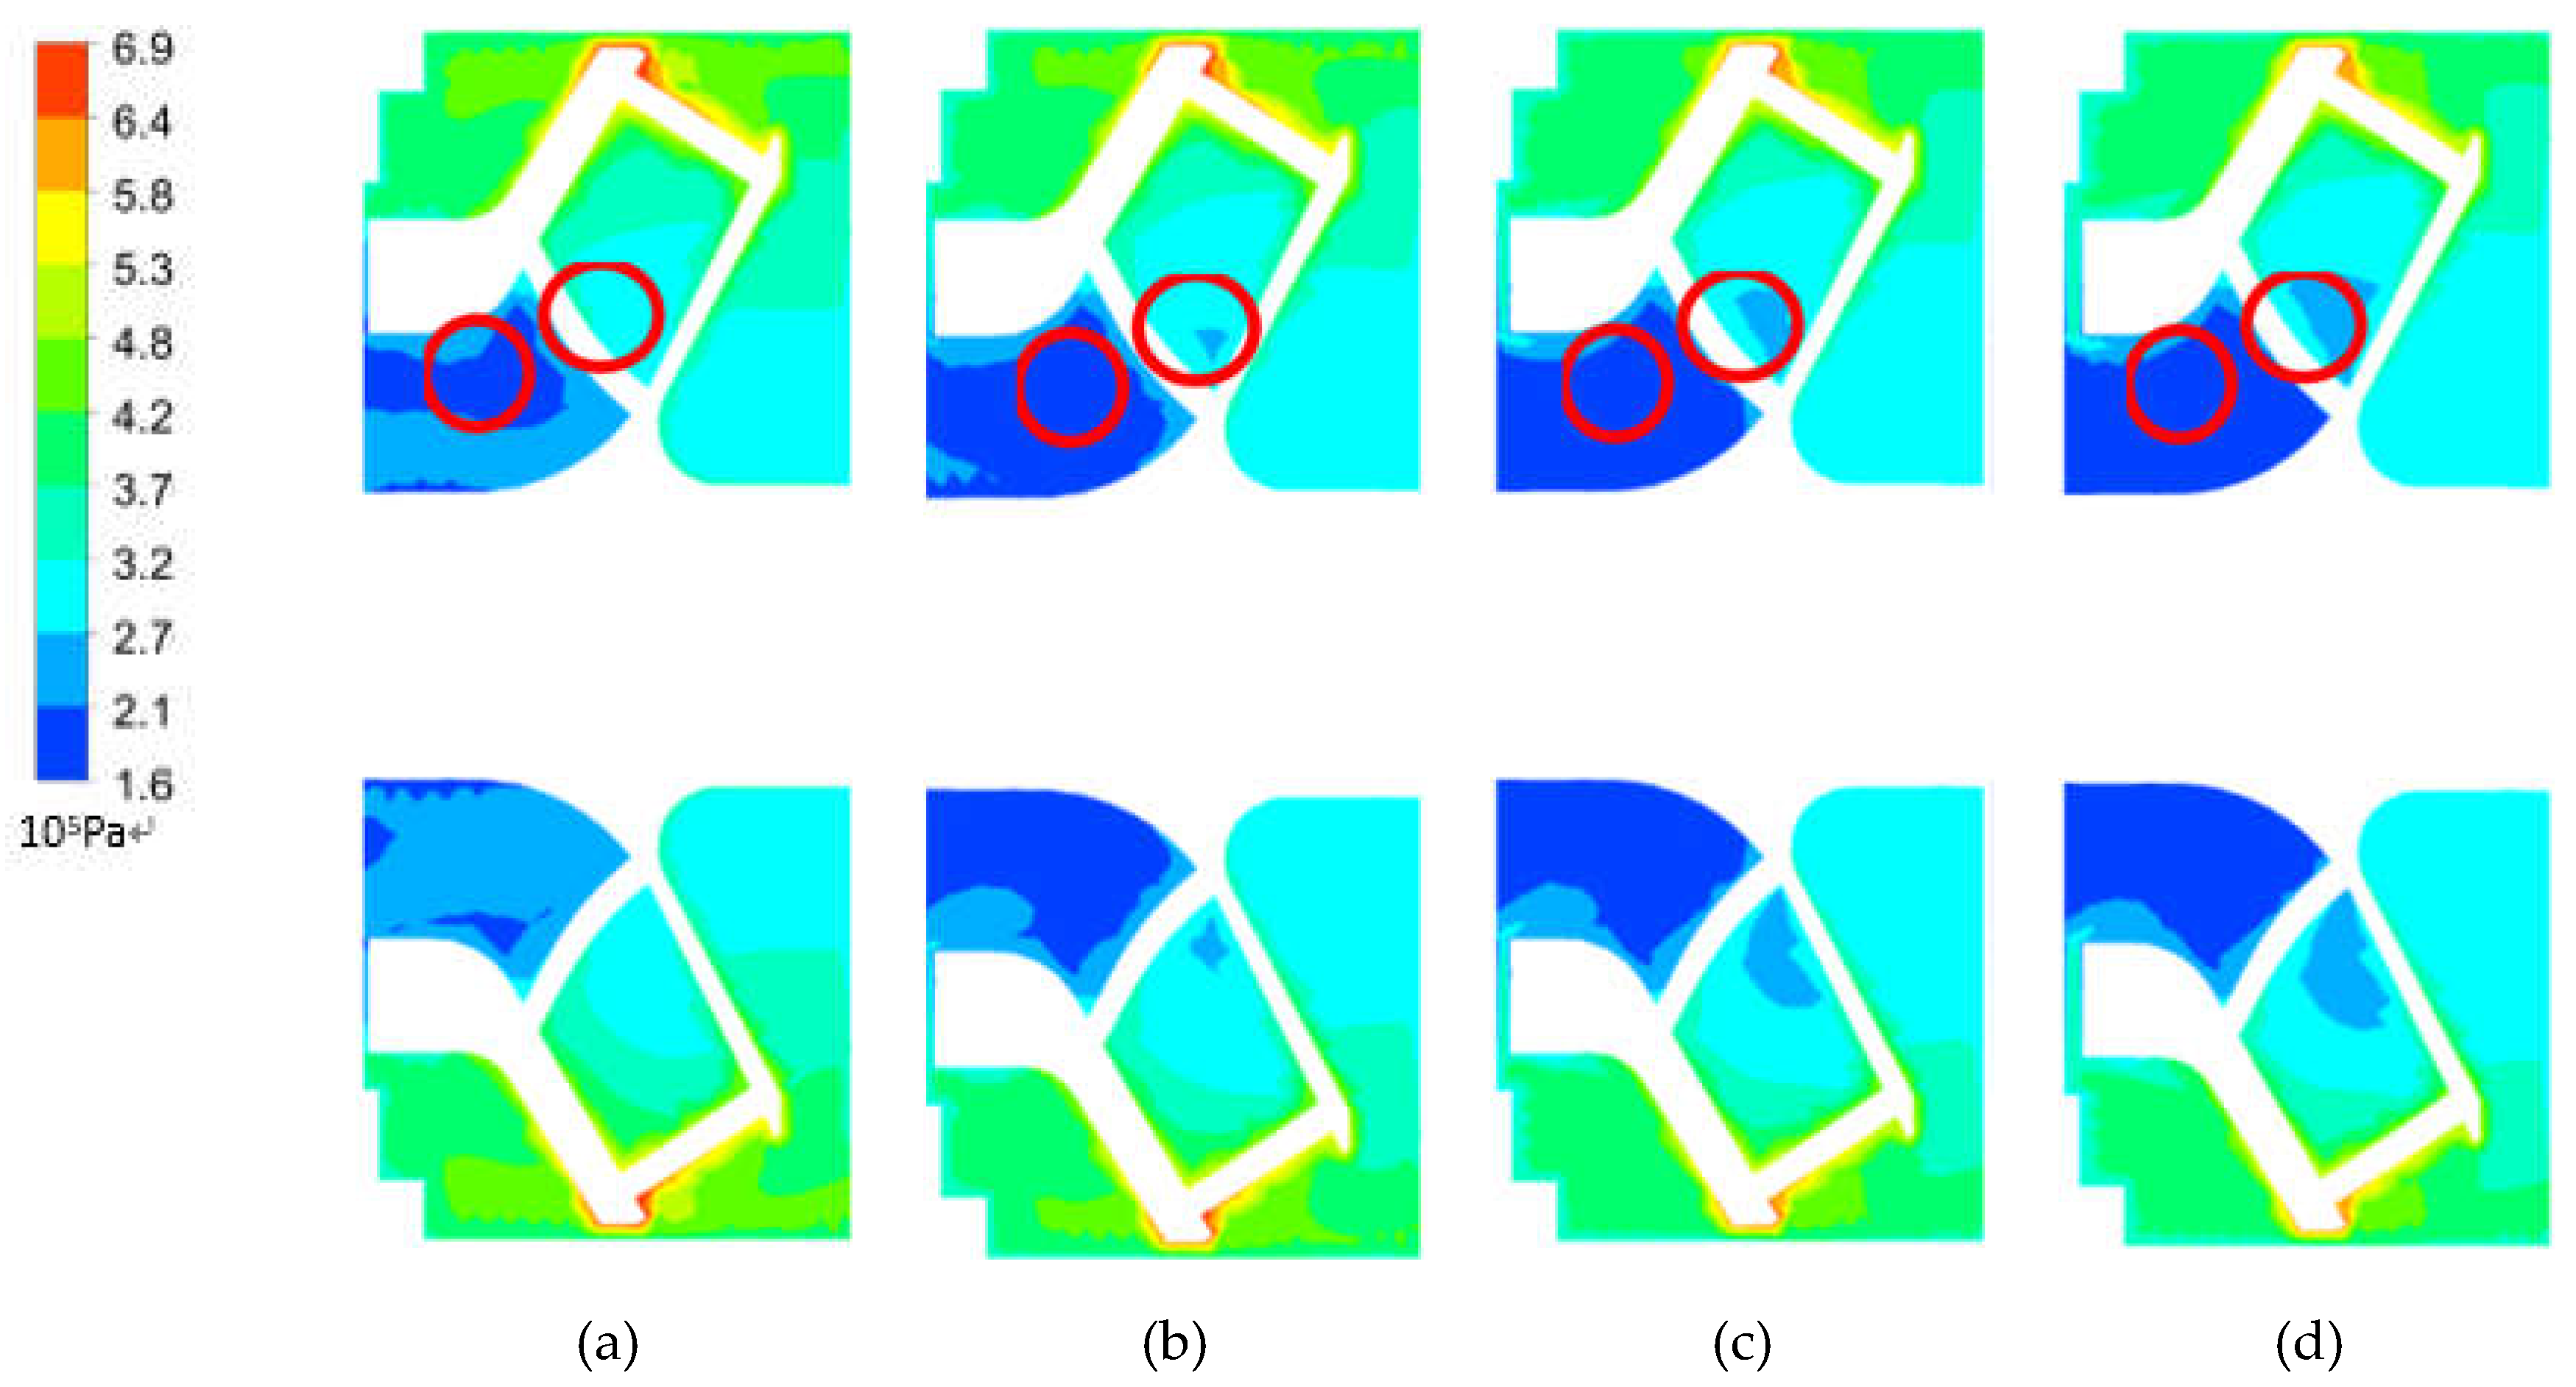
Figure 11 is the pressure diagram of the second-stage impeller and cavity under different end clearances at design flow rate. It can be seen that at the 0.3-mm end clearance, the flow inside the impeller was regularly stable, only a small low-pressure area existed in the inlet of impeller. When the end clearance increased to 0.6 mm, 0.9 mm, and 1.2 mm, the low-pressure area appeared inside the impeller. With the increase of the end clearance, this low-pressure area further extended from the impeller inlet to the middle of the impeller passage. Beyond that, the high-pressure fluid returned to the impeller inlet through the end clearance and formed a high-pressure zone, which developed along the shroud edge of the impeller. As the end clearance increased, the leakage flow rose. At 0.6-mm end clearance, separation vortex appeared at the impeller pressure side and further developed into serious flow separation as the increase of end clearance. At 1.2-mm end clearance, the impact of leakage flow on the main flow was obvious at the inlet of impeller passage.
Figure 12 is the pressure diagram of the outlet of the second-stage impeller at 1.0 Qd. It is clear that the pressure from hub to shroud was distributed from low to high. This should be attributed to the fact that ESP usually uses inclined impellers to reduce liquid clogging. The hub diameter was shorter than shroud diameter, so the length of the impeller blade was different. Besides, with the increase of the end clearance, a relatively low-pressure region appeared at the hub side. It can be seen from Figure 12 that at the end clearance of 0.6 mm, 0.9 mm, and 1.2 mm, this low-pressure region at the outlet of the impeller gradually increased. At 1.2-mm end clearance, the low-pressure area occupied half of the impeller outlet. It revealed the end clearance will affect the flow in the impeller. The performance of ESP reflected that the pressure drop was more obvious. It indicated that the existence of the end clearance had a serious impact on the performance of the ESP.
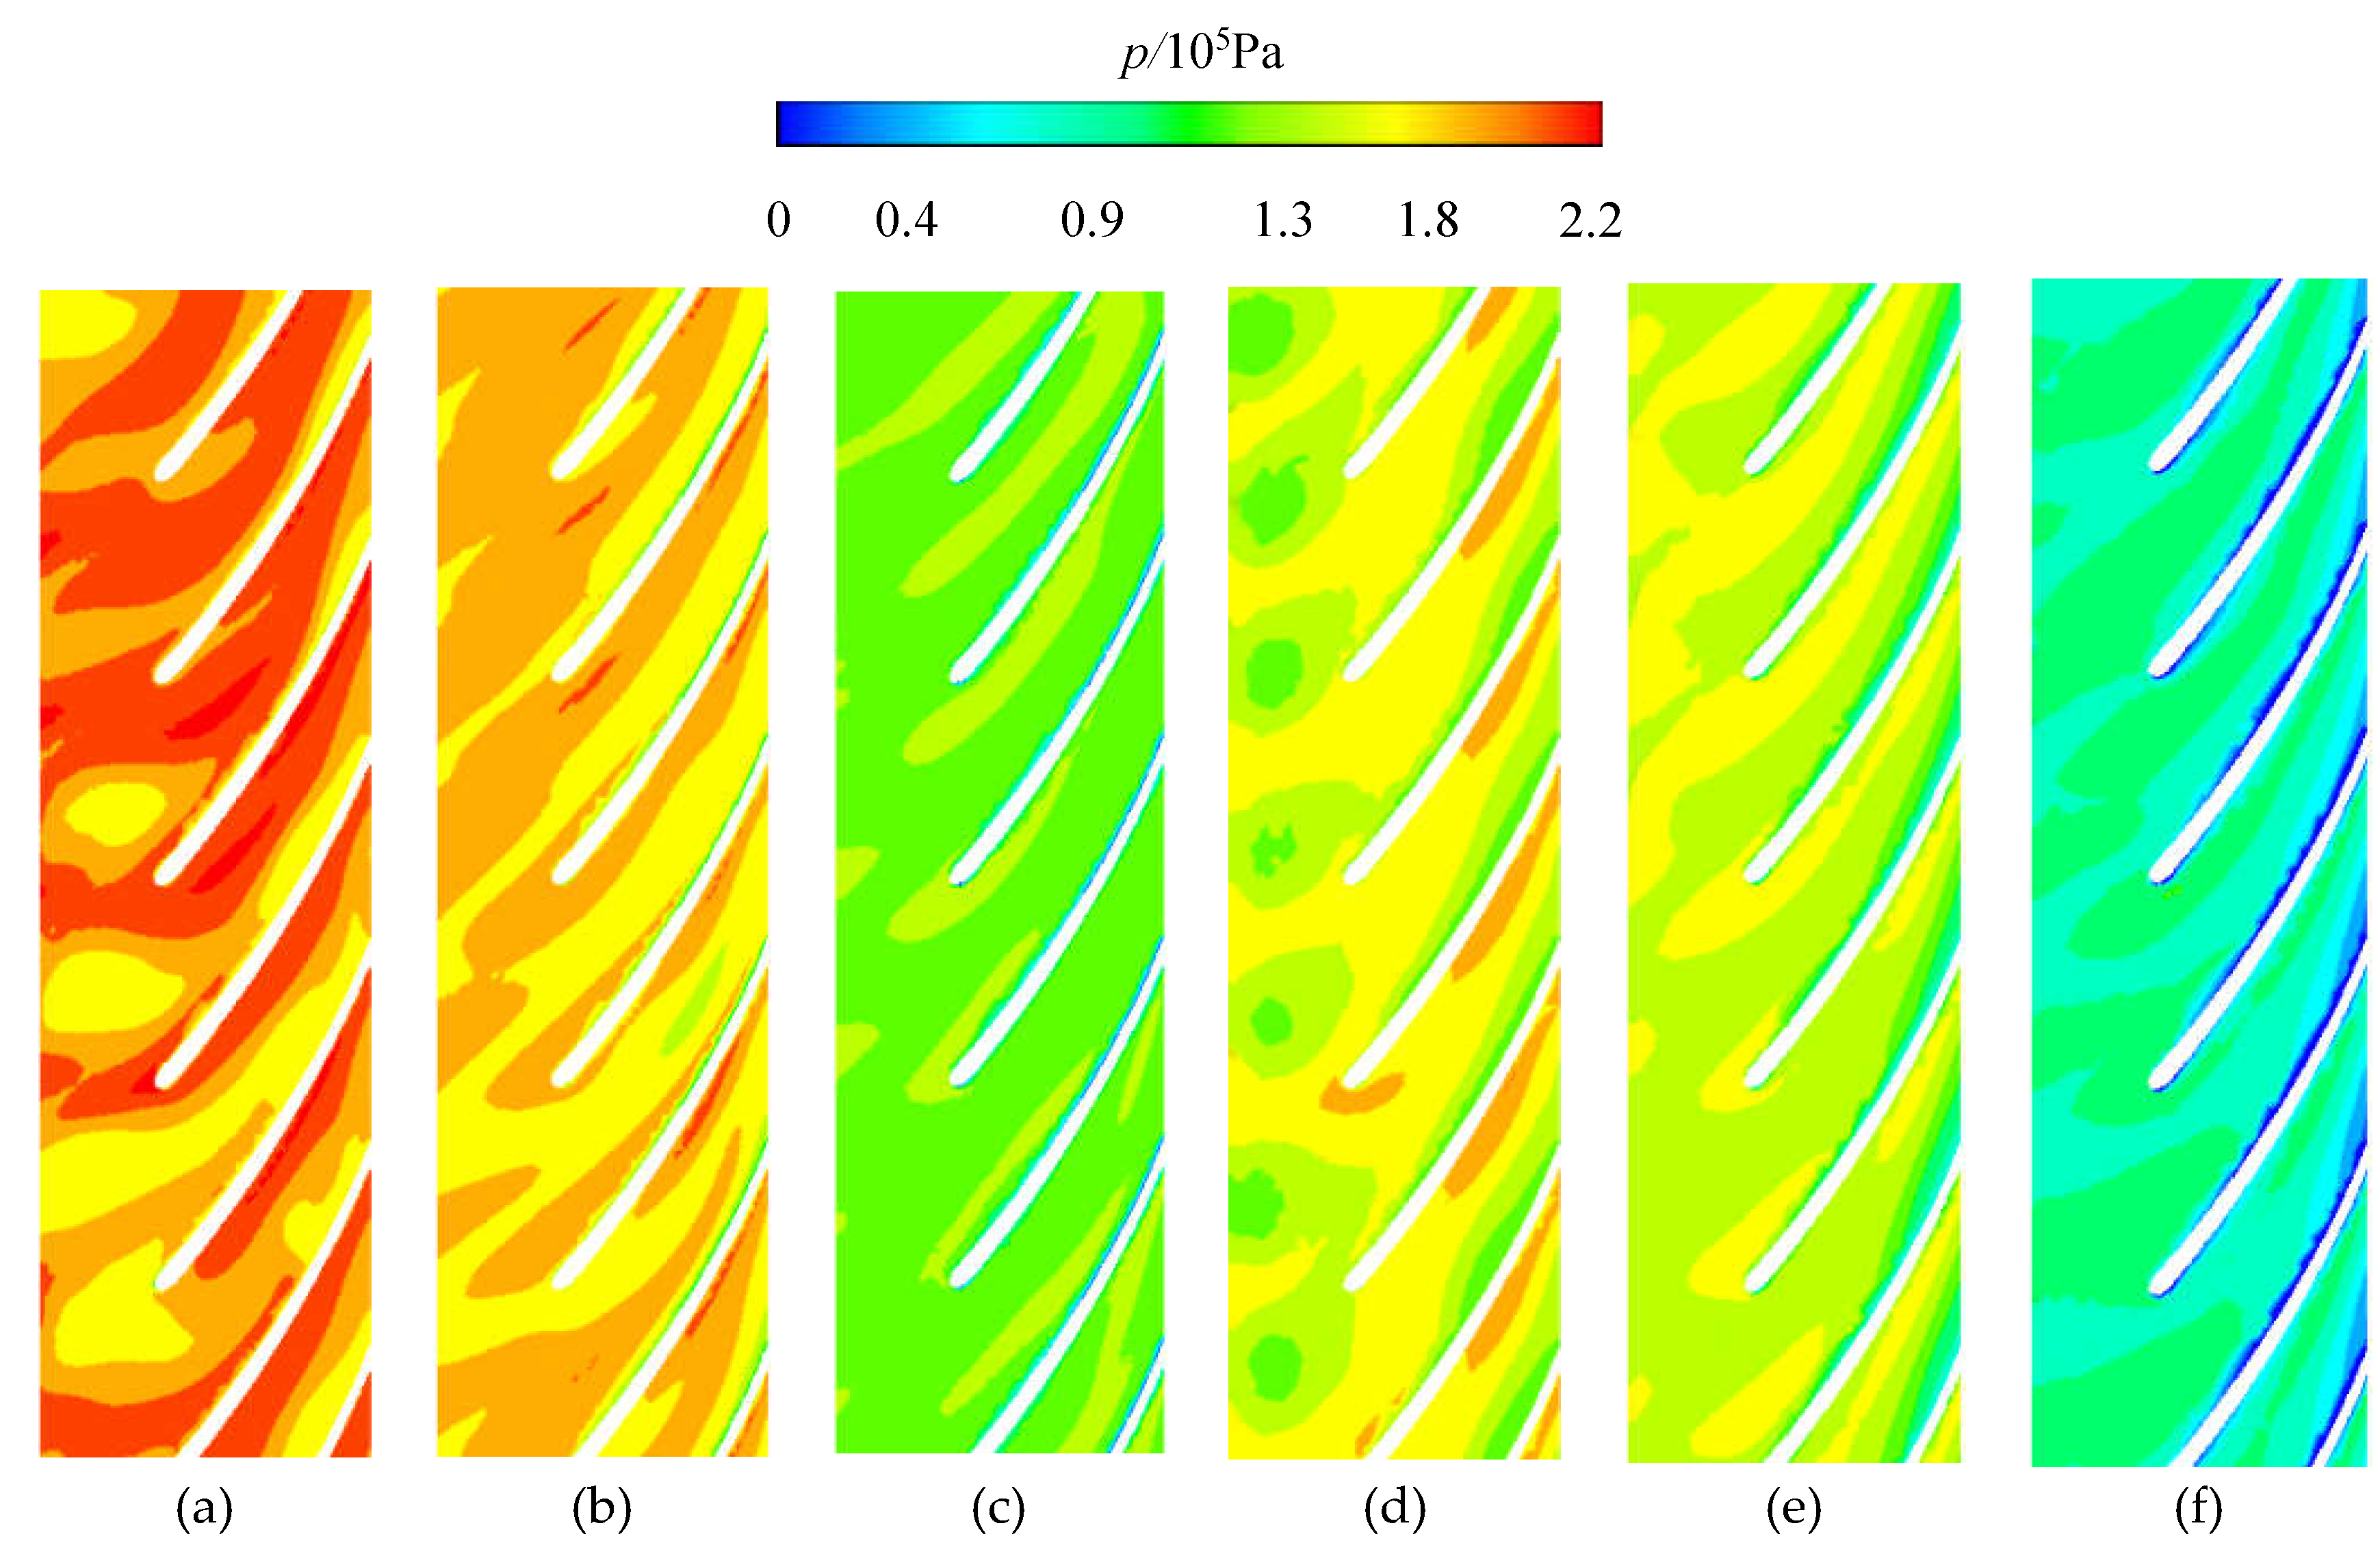
Figure 13 is a pressure distribution diagram of the second impeller with different end clearances. It is shown that the pressure distribution of each flow channel in the impeller was uniform, and the pressure of the pressure surface was higher than the suction surface. The difference was that when the end clearance was 0.1 mm, the pressure of the impeller was obviously higher than that of 1.2 mm at full flow range. It means the increase of end clearance caused the decrease in pressure and the loss of impeller performance. At 1.4 Qd, when the end clearance was 0.1 mm, the pressure distribution was relatively regular, while, as the end clearance increased to 1.2 mm, the pressure reduced severely and flow separation occurred. At 0.6 Qd, the difference in pressure distribution was more pronounced compared to 1.0 Qd and 1.4 Qd. At 0.1-mm end clearance, only four vortices were found at the tip of the blade, but at 1.2 mm, there were obvious vortices at the tip of all blades. It was noticeable that the effect of the end clearance under over-load flow conditions was more obvious than that of part-load flow conditions. At 1.0 Qd, the difference between 0.1 mm and 1.2 mm was just a reduction in pressure value.
3.3.2. Influence of End Clearance on the Performance of the Diffuser
The diffuser is a vital energy transfer device in the pump. It collects the liquid from the impeller and converts the kinetic energy to pressure energy. In order to further understand the internal flow field distribution at different end clearance, the second-stage diffuser was opted for flow-field analysis. The first-stage of the multistage ESP consisted of the first cavity, impeller, and diffuser. The single-stage diffuser efficiency was calculated by the Equations (4)–(8), which were used as an index to measure the efficiency of the diffuser.
where P is the hydraulic power, Pim is the power consumed by the impeller, H’ is the single-stage head, p2 is the pressure at diffuser outlet, p1 is the pressure at diffuser inlet, ηst is the efficiency of single-stage pump, and ηd is the efficiency of the diffuser.
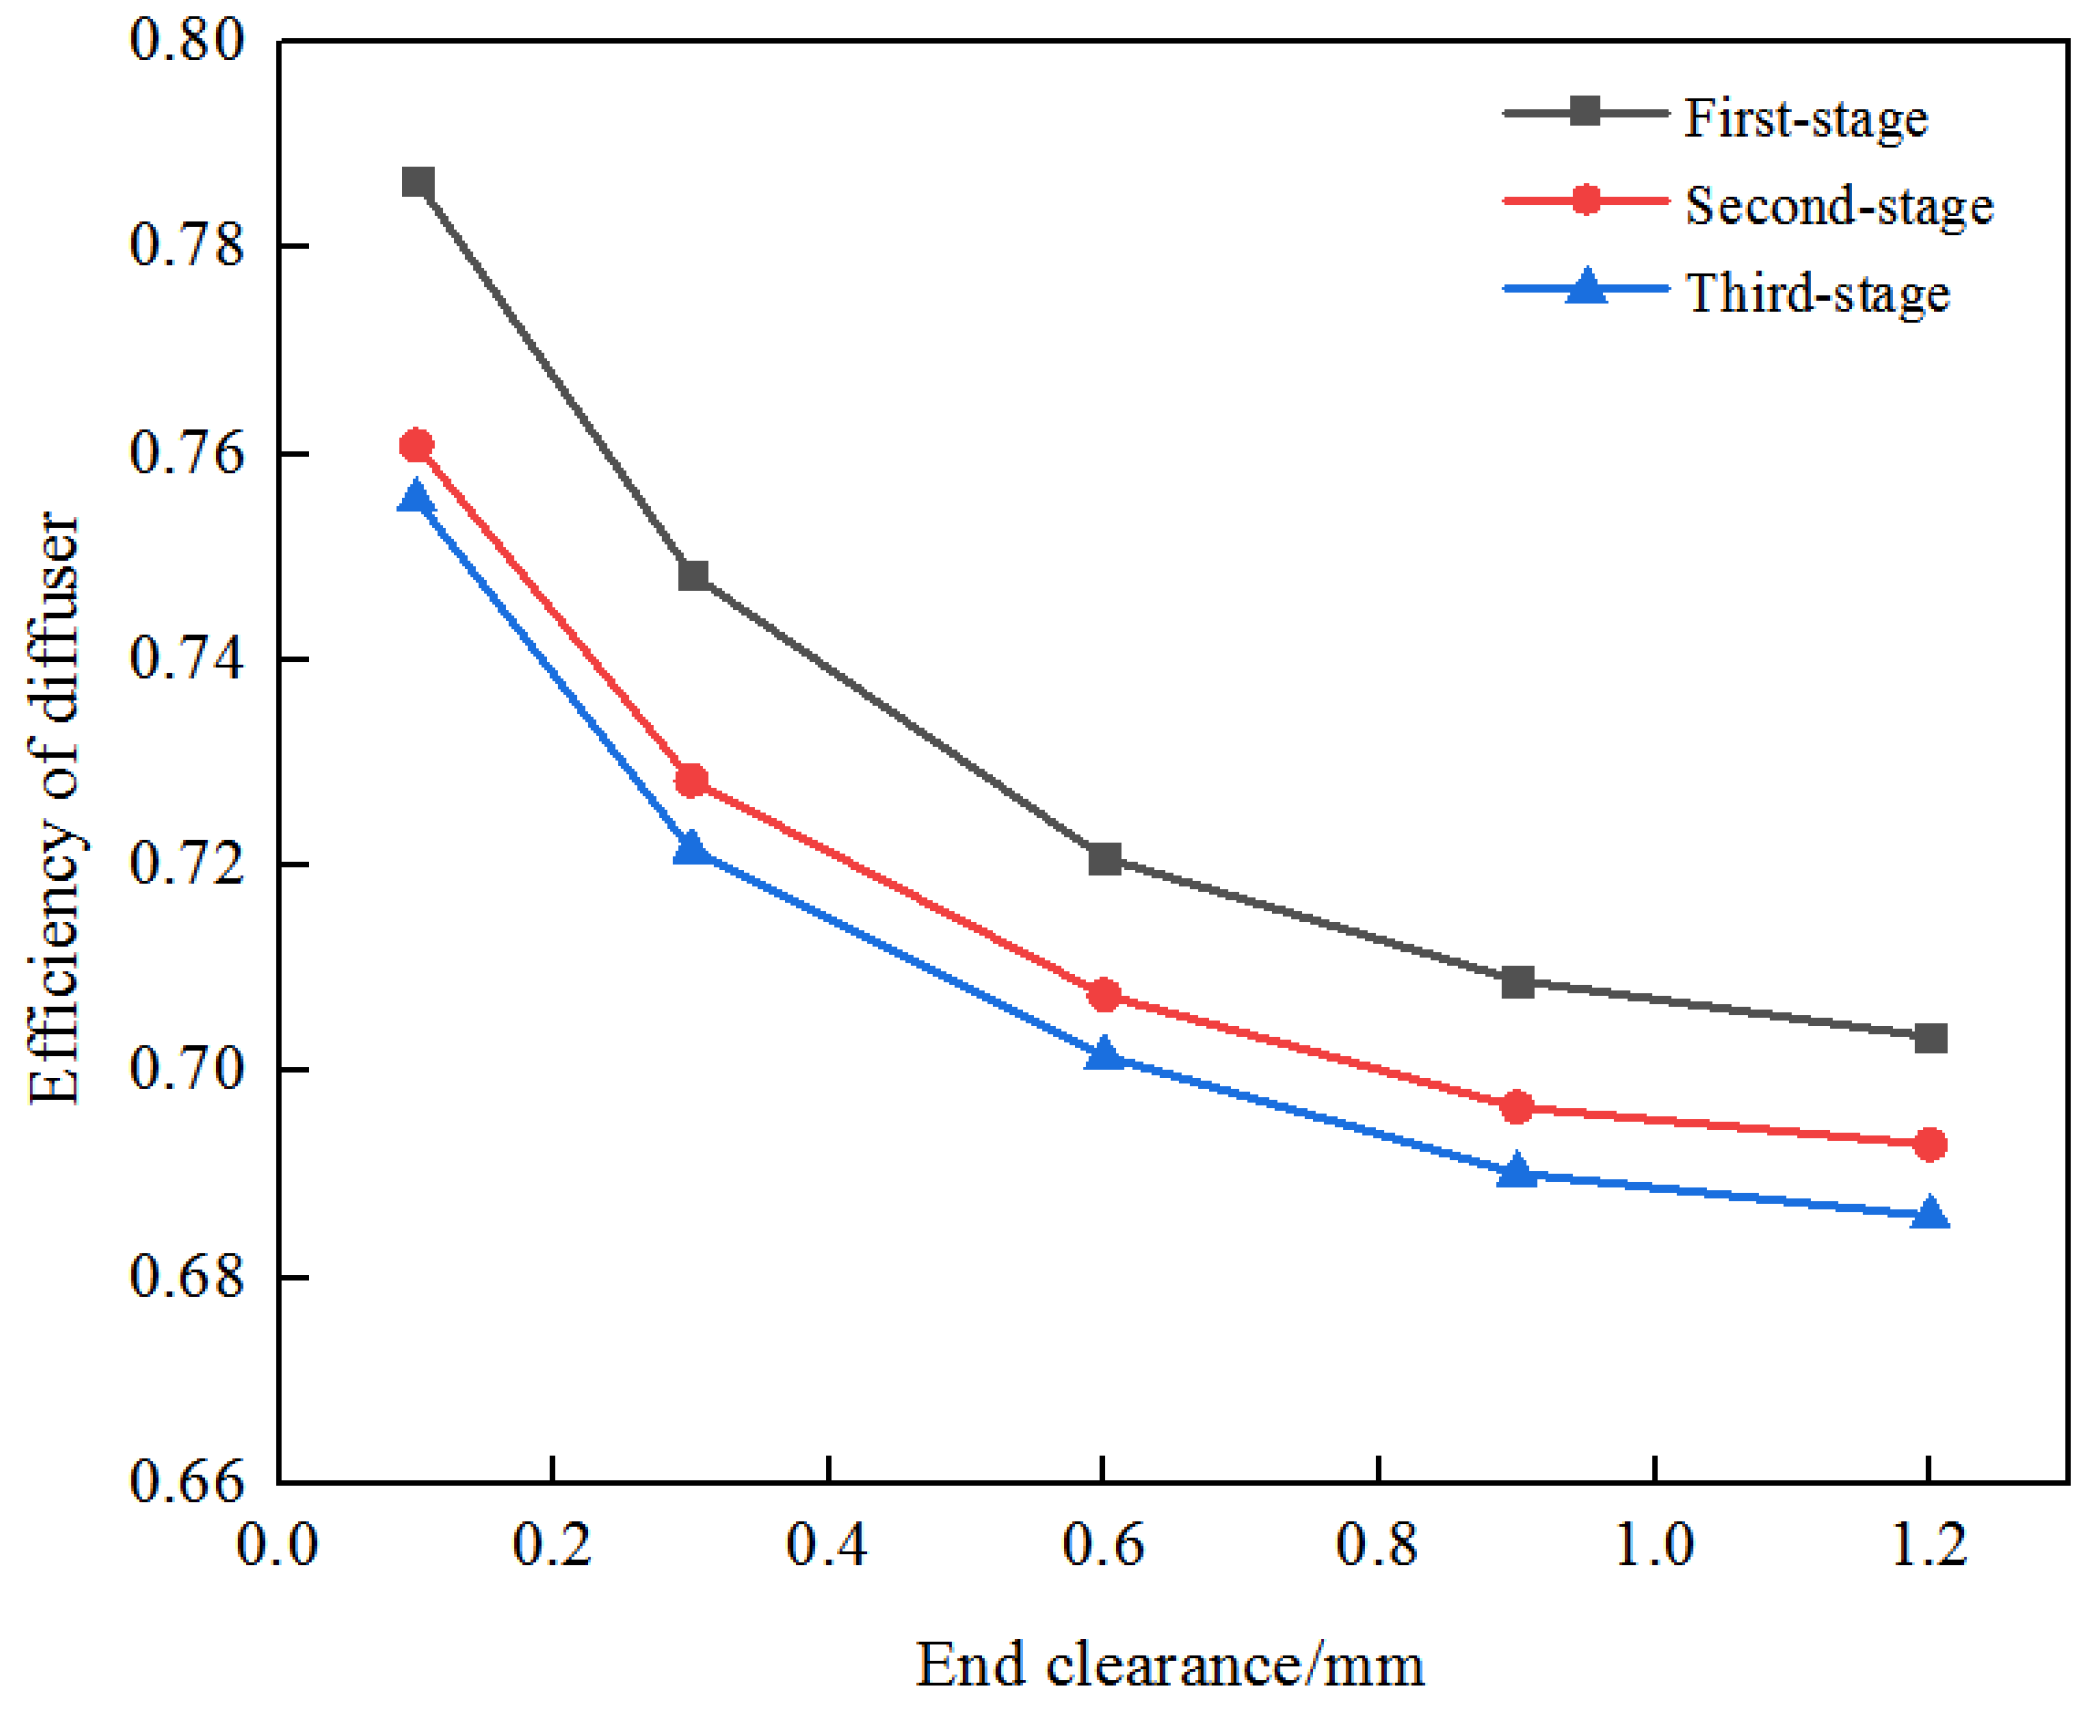
Figure 14 compares the efficiency of the diffuser at different end clearances at 1.0 Qd. It can be seen from the figure that the efficiency of the first-stage diffuser was significantly higher than the second-stage and third-stage diffuser at the same end clearance. The efficiency of second-stage and third-stage diffuser was similar. The efficiency of the same stage diffuser had a significant decrease as the end clearance increased. This may be ascribed to the increase of the end clearance disturbing the flow of liquid in the impeller, which in turn affected the flow stability of the inflow of diffuser. Meanwhile, when the end clearance increased to 0.3 mm, the decrease of the diffuser efficiency was more evident. Hence, it can be conjectured that 0.3 mm may be the installation threshold affecting the performance of the ESP.
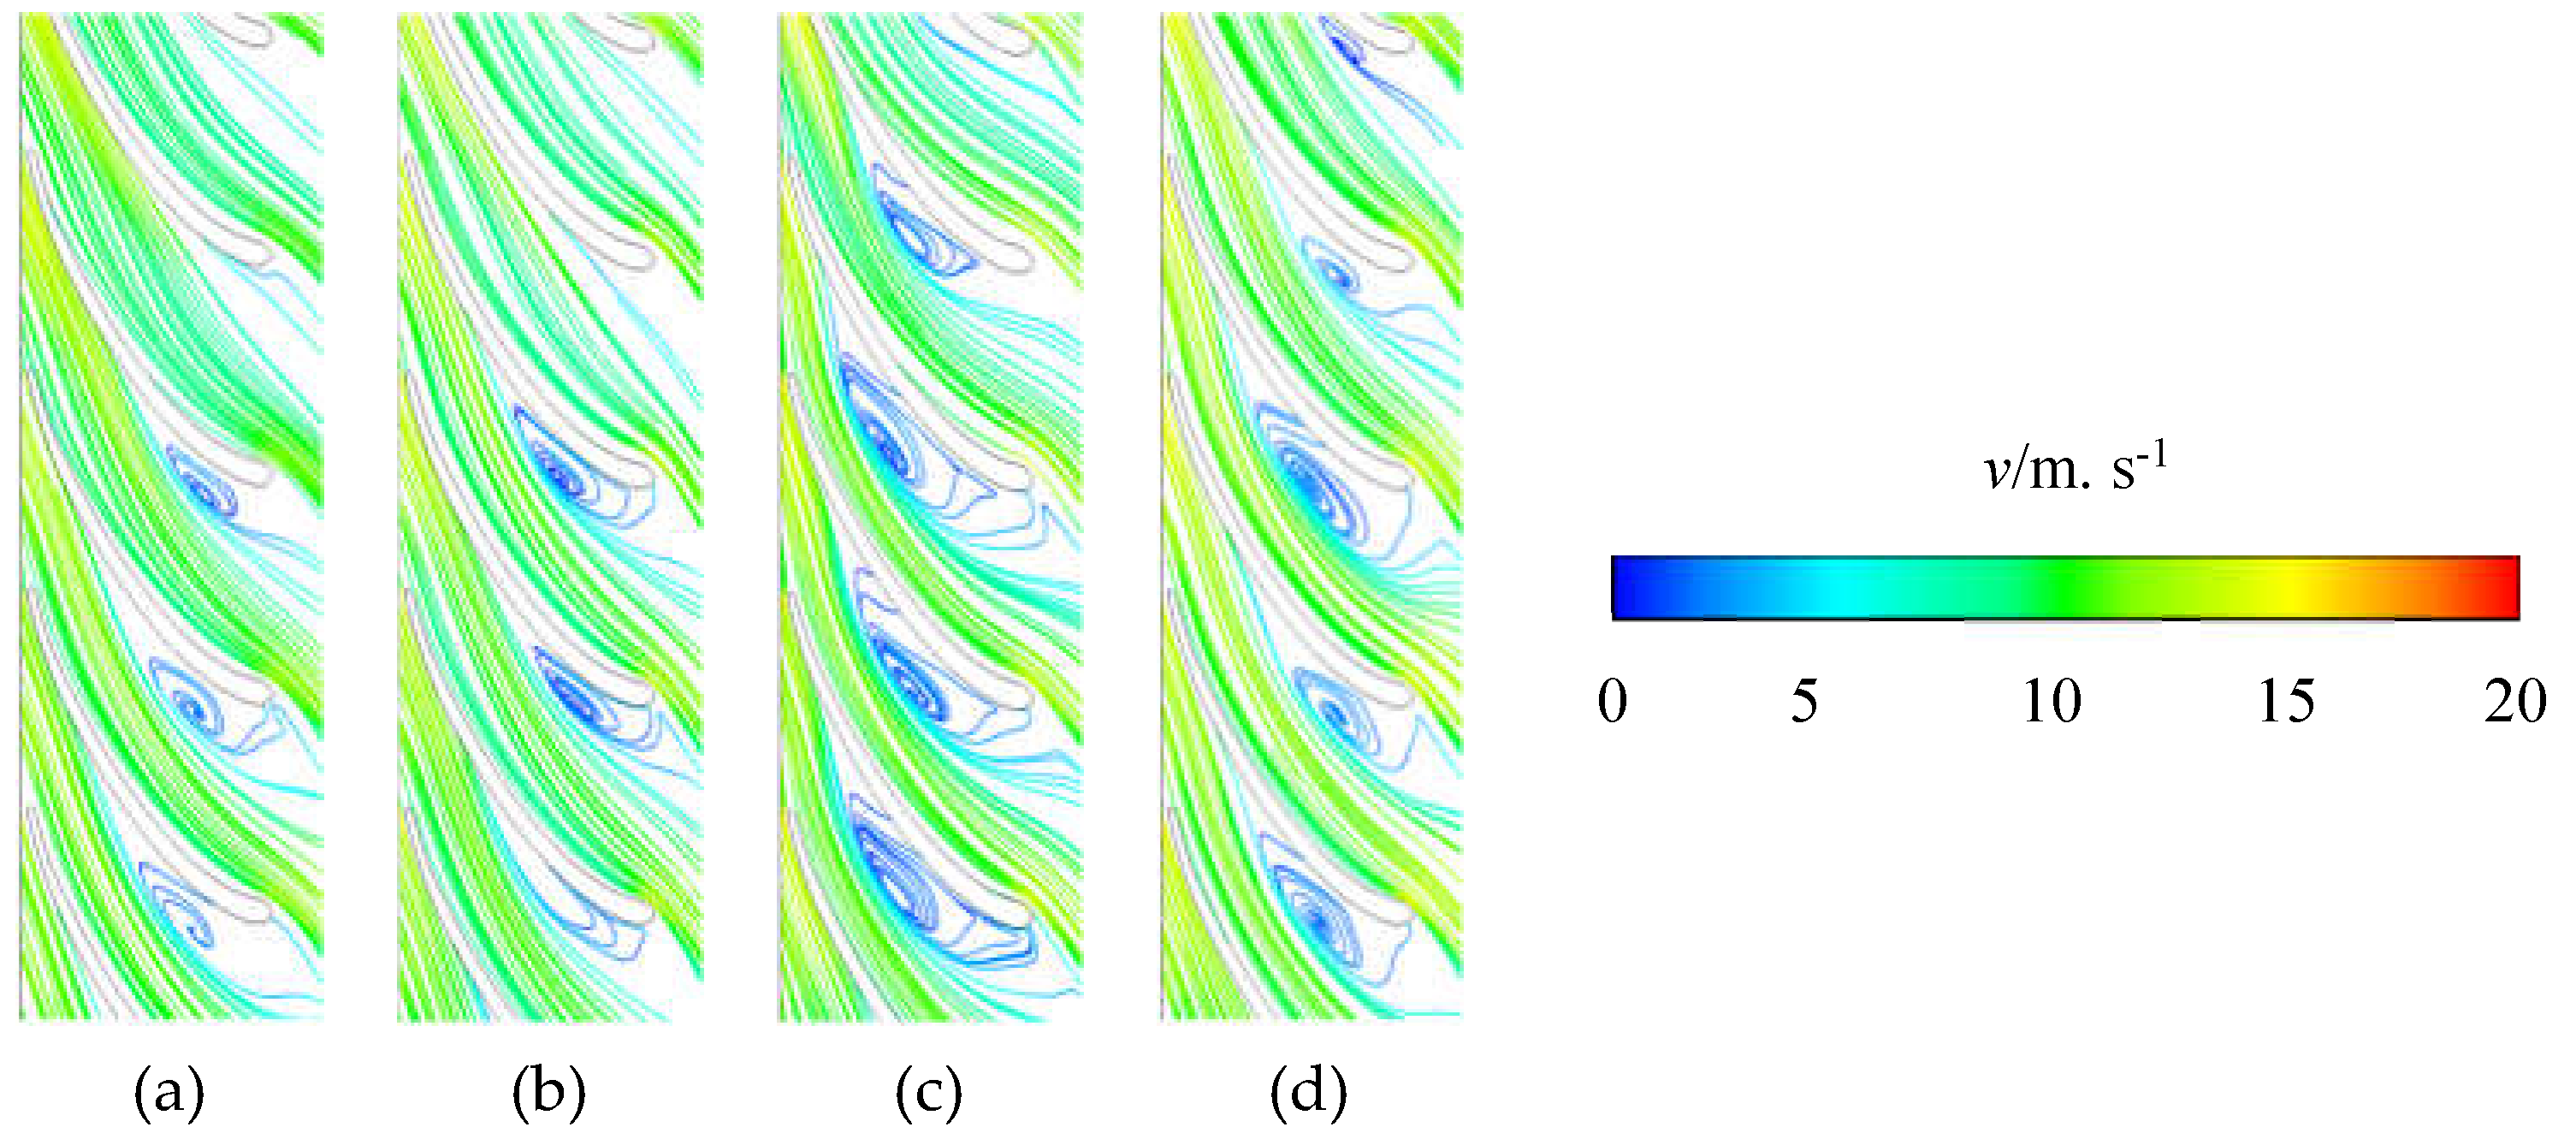
Figure 15 is the streamline diagram of the velocity of the diffuser blade on the span surface at 1.0 Qd. We found the distinct vortices in the internal flow field of the diffuser, and the vortex intensity inside the diffuser increased with the rise of the end clearance. The increase in the leakage caused by the end clearance should be the main reason for this phenomenon. On one hand, it produced a strong collision with the fluid at the outlet of the diffuser and triggered secondary flow and energy loss, since the leak flow had a high velocity at the inlet of the next stage impeller. As the leakage increased, the vortex in the middle passage of the diffuser developed further. On the other hand, according to the speed triangle principle, the existence of the end clearance caused the decrease of axial velocity, leading to the collision angle of the flow increases and the mismatch with blade setting angle of diffuser. This was also a major cause of energy loss and turbulence, which led to the decline of the ESP performance.
4. Conclusions
This paper presents the numerical and experimental study of ESP with five different end clearances under various flow conditions. The performance curve and internal flow field distribution of ESP were obtained by numerical simulation and experiment. The conclusion includes the following aspects.
- (1)
- The results illustrate that as the increase of internal leakage caused by the end clearance, the turbulence flow occurred in the impeller and the diffuser. Meanwhile, the turbulence intensity was aggravated when the end clearance increased. The diminution of the actual flow caused by the end clearance also gave rise to the free pre-whirl and aggravated energy loss.
- (2)
- It was found that the end clearance caused a decrease of ESP performance within the full flow range, and in the small flow conditions the drop was even more serious. The effect of the end clearance was especially serious in small flow conditions.
- (3)
- According to the CFD results, the suitable installation clearance was 0.1 mm~0.6 mm with the different diameters of the sand in the medium. When the clearance exceeded 0.9 mm, the ESP performance dropped rapidly. The results of this study may lay the foundation for further improving the design and operating reliability for high-speed ESP.
Author Contributions
Conceptualization, L.Z. and W.W.; methodology, Y.Z.; software, W.W.; validation, H.Y. and Y.Z.; investigation, W.W.; resources, L.Z.; data curation, J.H.; writing—original draft preparation, W.W.; writing—review and editing, L.Z.; visualization, J.W.; supervision, W.S.; project administration, W.S.; funding acquisition, L.Z. All authors have read and agreed to the published version of the manuscript.
Funding
This research was funded by the National Natural Science Foundation of China (Grant No. 51979138), Nature Science Foundation for Excellent Young Scholars of Jiangsu Province (Grant No. BK20190101), Six Talent Peaks Project of Jiangsu Province (Grant No. KTHY-030).
Conflicts of Interest
The authors declare no conflict of interest.
Nomenclature
| Q | flow rate |
| Qd | design flow rate |
| H | head |
| pout | total pressure at impeller outlet |
| pin | total pressure at impeller inlet |
| ρ | liquid density |
| M | torque |
| ω | angular velocity |
| Hideal | ideal head |
| cu1 | circumferential component of the flow velocity at the impeller inlet |
| cu2 | circumferential component of the flow velocity at the impeller outlet |
| u1 | the peripheral speed at impeller inlet |
| u2 | the peripheral speed at impeller outlet |
| g | gravity acceleration |
| P | hydraulic power |
| Pim | power consumed by impeller |
| H’ | single-stage head |
| p2 | the pressure at diffuser outlet |
| p1 | the pressure at diffuser inlet |
| ηst | The efficiency of single-stage pump |
| ηd | the efficiency of the diffuser |
| v | velocity |
References
- Romero, O.J.; Hupp, A. Subsea electrical submersible pump significance in petroleum offshore production. J. Energy Resour. Technol. 2014, 136, 012902. [Google Scholar] [CrossRef]
- Bai, L.; Zhou, L.; Han, C.; Zhu, Y.; Shi, W. Numerical study of pressure fluctuation and unsteady flow in a centrifugal pump. Processes 2019, 7, 354. [Google Scholar] [CrossRef] [Green Version]
- Tournerie, B.; Danos, J.C.; Frene, J. Three-Dimensional Modeling of THD Lubrication in Face Seals. Tribol. Trans. 2002, 45, 284–293. [Google Scholar] [CrossRef]
- Jiang, X.; Li, W.; Zhou, L.; Li, W.; Wang, C. Transient response analysis of cantilever multistage centrifugal pump based on multi-source excitation. J. Low Freq. Noise Vib. Act. Control 2019, 1–17. [Google Scholar] [CrossRef] [Green Version]
- Fabrizio, S.; Alessandro, R. Steadily loaded journal bearings: Quasi-3D mass-energy-conserving analysis. Tribol. Int. 2009, 42, 448–460. [Google Scholar]
- Yang, J.; Liu, J.; Liu, X.; Xie, T. Numerical Study of Pressure Pulsation of Centrifugal Pumps with the Compressible Mode. J. Therm. Sci. 2019, 28, 106–114. [Google Scholar] [CrossRef]
- Zhou, L.; Deshpande, K.; Zhang, X.; Agarwal, R. Process simulation of Chemical Looping Combustion using ASPEN Plus for a mixture of biomass and coal with various oxygen carriers. Energy 2020, 195, 116955. [Google Scholar] [CrossRef]
- Li, X.; Jiang, Z.; Zhu, Z.; Si, Q.; Li, Y. Entropy generation analysis for the cavitating head-drop characteristic of a centrifugal pump. Proc. Inst. Mech. Eng. Part C J. Mech. Eng. Sci. 2018, 232, 4637–4646. [Google Scholar] [CrossRef]
- Zhou, L.; Bai, L.; Shi, W.; Li, W.; Wang, C.; Ye, D. Numerical analysis and performance experiment of electric submersible pump with different diffuser vanes number. J. Braz. Soc. Mech. Sci. Eng. 2018, 40, 89. [Google Scholar] [CrossRef]
- Mohammadzaheri, M.; Tafreshi, R.; Khan, Z.; Franchek, M.; Grigoriadis, K. An intelligent approach to optimize multiphase subsea oil fields lifted by electrical submersible pumps. J. Comput. Sci. 2016, 15, 50–59. [Google Scholar] [CrossRef]
- Wu, Q.; Wang, X.; Shen, Q. Research on dynamic modeling and simulation of axial-flow pumping system based on RBF neural network. Neuro Comput. 2016, 186, 200–206. [Google Scholar] [CrossRef]
- Noon, A.A.; Kim, M.H. Erosion wear on centrifugal pump casing due to slurry flow. Wear 2016, 364, 103–111. [Google Scholar] [CrossRef]
- Bai, L.; Zhou, L.; Jiang, X.; Pang, Q.; Ye, D. Vibration in a Multistage Centrifugal Pump under Varied Conditions. Shock Vib. 2019, 2019, 2057031. [Google Scholar] [CrossRef]
- Stel, H.; Sirino, T.; Ponce, F.J.; Chiva, S.; Morales, R.E. Numerical investigation of the flow in a multistage electric submersible pump. J. Pet. Sci. Eng. 2015, 136, 41–54. [Google Scholar] [CrossRef]
- Shi, Y.; Zhu, H.; Zhang, J.; Zhang, J.; Zhao, J. Experiment and numerical study of a new generation three-stage multiphase pump. J. Pet. Sci. Eng. 2018, 169, 471–484. [Google Scholar] [CrossRef]
- Shi, W.; Zhou, L.; Lu, W.; Xu, L.; Li, W. Numerical simulation and experimental study of different stages deep-well centrifugal pump. J. Comput. Theor. Nanosci. 2013, 10, 2897–2901. [Google Scholar] [CrossRef]
- Pang, Q.; Jiang, X.; Zhu, J.; Wu, G.; Wang, X.; Wang, L. Influences of radial clearance between impeller and diffuser on flow field in side chambers of multistage centrifugal pump. J. Drain. Irrig. Mach. Eng. 2019, 37, 580–586. [Google Scholar]
- Li, W.; Zhang, Y.; Sun, B.; Shi, W.; Xu, R. Rotor radial force and pressure fluctuation of the mixed flow pump under different flow conditions. J. Drain. Irrig. Mach. Eng. 2019, 37, 277–283. [Google Scholar]
- Hsu, Y.; Brennen, C.E. Effect of swirl on rotor dynamic forces caused by front shroud pump leakage. J. Fluids Eng. 2002, 124, 1005–1010. [Google Scholar] [CrossRef]
- San Andres, L.; Lu, X.; Jie, Z. On the Leakage and Rotor Dynamic Force Coefficients of Pump Annula Seals Operating with Air/Oil Mixtures: Measurements and Predictions. In Asia Turbomachinery & Pump Symposia; Turbomachinery Laboratory, Texas A&M Engineering Experiment Station: College Station, TX, USA, 2018. [Google Scholar]
- Gao, X.; Shi, W.; Zhou, L.; Zhang, D.; Zhang, Q. Computational fluid dynamics and experimental study of inter-stage seal clearance on submersible well pump. Adv. Mech. Eng. 2016, 8, 1–7. [Google Scholar] [CrossRef] [Green Version]
- Ma, R.; Devenport, W.J. Tip gap effects on the unsteady behavior of a tip leakage vortex. AIAA J. 2007, 45, 1713–1724. [Google Scholar] [CrossRef]
- Tamm, A.; Stoffel, B. The influences of gap clearance and surface roughness on leakage loss and disc friction of centrifugal pumps. In Proceedings of the ASME 2002 Fluids Engineering Division Summer Meeting, Montreal, QC, Canada, 14–18 July 2002; pp. 14–18. [Google Scholar]
- Schleer, M.; Abhari, R.S. Clearance effects on the evolution of the flow in the vanless diffuser of a centrifugal compressor at part load conditions. ASME J. Turbomach. 2008, 130, 031009. [Google Scholar] [CrossRef]
- Black, H.F. Effects of fluid-filled clearance spaces on centrifugal pump and submerged motor vibrations. In Proceedings of the 8th Turbomachinery Symposium; Texas A&M University, Gas Turbine Laboratories: College Station, TX, USA, 1979. [Google Scholar]
- Schlatter, P.; Örlü, R. Assessment of direct numerical simulation data of turbulent boundary layers. J. Fluid Mech. 2010, 659, 116–126. [Google Scholar] [CrossRef]
- Zhou, L.; Bai, L.; Li, W.; Shi, W.; Wang, C. PIV validation of different turbulence models used for numerical simulation of a centrifugal pump diffuser. Eng. Comput. 2018, 35, 2–17. [Google Scholar] [CrossRef]
- Pavesi, G.; Cavazzini, G.; Ardizzon, G. Numerical Simulation of a Pump–Turbine Transient Load Following Process in Pump Mode. J. Fluids Eng. 2018, 140, 021114. [Google Scholar] [CrossRef]
- Posa, A.; Lippolis, A.; Balaras, E. Large-eddy simulation of a mixed-flow pump at off-design conditions. J. Fluids Eng. 2015, 137, 101302. [Google Scholar] [CrossRef]
- Li, B.; Li, X.; Jia, X.; Chen, F.; Fang, H. The Role of Blade Sinusoidal Tubercle Trailing Edge in a Centrifugal Pump with Low Specific Speed. Processes 2019, 7, 625. [Google Scholar] [CrossRef] [Green Version]
- Shim, H.S.; Kim, K.Y.; Choi, Y.S. Three-objective optimization of a centrifugal pump to reduce flow recirculation and cavitation. J. Fluids Eng. 2018, 140, 091202. [Google Scholar] [CrossRef]
- Liu, H.; Wang, K.; Yuan, S.; Tan, M.; Wang, Y.; Dong, L. Multicondition optimization and experimental measurements of a double-blade centrifugal pump impeller. J. Fluids Eng. 2013, 135, 011103. [Google Scholar] [CrossRef] [Green Version]
- Yan, P.; Chu, N.; Wu, D.; Cao, L.; Yang, S.; Wu, P. Computational fluid dynamics-based pump redesign to improve efficiency and decrease unsteady radial forces. J. Fluids Eng. 2017, 139, 011101. [Google Scholar] [CrossRef]
- Muggli, F.A.; Holbein, P.; Dupont, P. CFD calculation of a mixed flow pump characteristic from shutoff to maximum flow. J. Fluids Eng. 2002, 124, 798–802. [Google Scholar] [CrossRef]
- He, X.; Jiao, W.; Wang, C.; Cao, W. Influence of surface roughness on the pump performance based on Computational Fluid Dynamics. IEEE Access 2019, 7, 105331–105341. [Google Scholar] [CrossRef]
- Laín, S.; García, M.; Quintero, B.; Orrego, S. CFD Numerical simulations of Francis turbines. Rev. Fac. de Ing. Univ. de Antioq. 2010, 51, 24–33. [Google Scholar]
- Garcia, M.; Laín, S.; Orrego, S.; Barbosa, J.; Quintero, B. Hydraulic and rotor-dynamic interaction for performance evaluation on a Francis turbine. Int. J. Interact. Des. Manuf. 2017, 11, 623–632. [Google Scholar] [CrossRef]
- Sotoudeh, N.; Maddahian, R.; Cervantes, M.J. Investigation of Rotating Vortex Rope formation during load variation in a Francis turbine draft tube. Renew. Energy 2020, 151, 238–254. [Google Scholar] [CrossRef]
- Borkowski, D.; Węgiel, M.; Ocłoń, P.; Węgiel, T. CFD model and experimental verification of water turbine integrated with electrical generator. Energy 2019, 185, 875–883. [Google Scholar] [CrossRef]
- Bouhal, T.; Rajad, O.; Kousksou, T.; Arid, A.; El Rhafiki, T.; Jamil, A.; Benbassou, A. CFD performance enhancement of a low cut-in speed current Vertical Tidal Turbine through the nested hybridization of Savonius and Darrieus. Energy Convers. Manag. 2018, 169, 266–278. [Google Scholar]
- Zhu, Y.; Tang, S.; Quan, L.; Jiang, W.; Zhou, L. Extraction method for signal effective component based on extreme-point symmetric mode decomposition and Kullback-Leibler divergence. J. Braz. Soc. Mech. Sci. Eng. 2019, 41, 100. [Google Scholar] [CrossRef]
- Tang, S.; Yuan, S.; Zhu, Y. Deep learning-based intelligent fault diagnosis methods towards rotating machinery. IEEE Access 2020, 8, 9335–9346. [Google Scholar] [CrossRef]
- Zhou, L.; Shi, W.; Lu, W.; Hu, B.; Wu, S. Numerical investigations and performance experiments of a deep-well centrifugal pump with different diffusers. ASME J. Fluids Eng. 2012, 134, 071102. [Google Scholar] [CrossRef]
- Patil, A.; Sundar, S.; Delgado, A.; Gamboa, J. CFD based evaluation of conventional electrical submersible pump for high-speed application. J. Pet. Sci. Eng. 2019, 182, 106287. [Google Scholar] [CrossRef]
- Li, W.; Li, E.; Ji, L.; Zhou, L.; Shi, W.; Zhu, Y. Mechanism and propagation characteristics of rotating stall in a mixed-flow pump. Renew. Energy 2020, 153, 74–92. [Google Scholar] [CrossRef]
Figure 1.
Simple diagram of pump section model and end clearance.

Figure 2.
Solid model of impeller and diffuser. (a) Impeller, (b) diffuser.

Figure 3.
Computation domain. 1. Inlet. 2. End clearance. 3. Cavity. 4. Impeller. 5. Diffuser. 6. Outlet.
Figure 3.
Computation domain. 1. Inlet. 2. End clearance. 3. Cavity. 4. Impeller. 5. Diffuser. 6. Outlet.

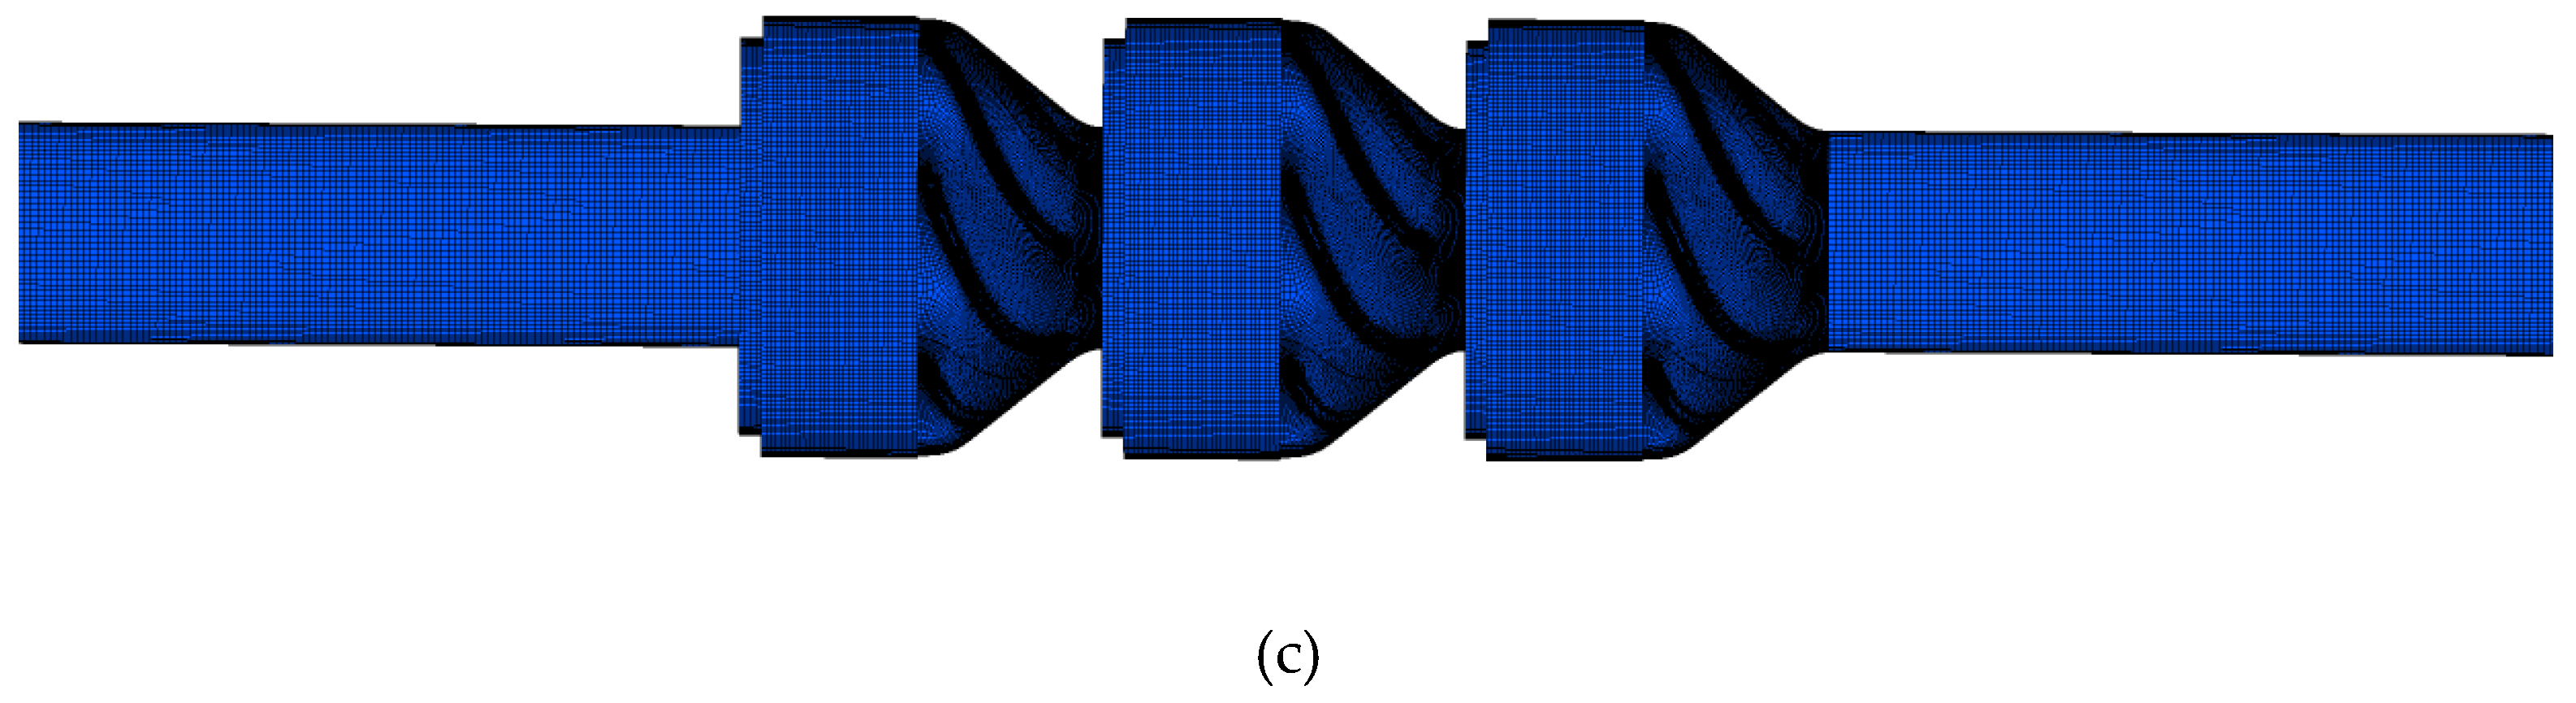
Figure 4.
Mesh of impeller and diffuser. (a) Impeller, (b) diffuser, (c) whole calculation domain.


Figure 5.
Impeller and diffuser. (a) Impeller, (b) diffuser.

Figure 6.
Testing apparatus. 1. Data acquisition instrument. 2. Frequency inverter. 3. Electromagnetic flowmeter. 4. The valve. 5. Computer. 6. Pressure sensor. 7. Pump. 8. Motor.
Figure 6.
Testing apparatus. 1. Data acquisition instrument. 2. Frequency inverter. 3. Electromagnetic flowmeter. 4. The valve. 5. Computer. 6. Pressure sensor. 7. Pump. 8. Motor.

Figure 7.
Comparison of pump performance between numerical and experimental results.

Figure 8.
CFD-predicted performance with different end clearance size. (a) Head, (b) efficiency.

Figure 9.
Comparison of impeller head and efficiency at all levels. (a) Head of single-stage impeller, (b) efficiency of single-stage impeller.
Figure 9.
Comparison of impeller head and efficiency at all levels. (a) Head of single-stage impeller, (b) efficiency of single-stage impeller.

Figure 10.
Leakage of different end clearance.

Figure 11.
Total pressure contour of second-stage impeller, (a) 0.3 mm, (b) 0.6 mm, (c) 0.9 mm, (d) 1.2 mm.
Figure 11.
Total pressure contour of second-stage impeller, (a) 0.3 mm, (b) 0.6 mm, (c) 0.9 mm, (d) 1.2 mm.

Figure 12.
Pressure contour at second-stage impeller outlet, (a) 0.3 mm, (b) 0. 6mm, (c) 0.9 mm, (d) 1.2 mm.
Figure 12.
Pressure contour at second-stage impeller outlet, (a) 0.3 mm, (b) 0. 6mm, (c) 0.9 mm, (d) 1.2 mm.


Figure 13.
Pressure distribution of blade expansion in the second-stage impeller, (a) 0.6 Qd, 1 mm; (b) 1.0 Qd, 1 mm; (c) 1.4 Qd, 1 mm; (d) 0.6 Qd, 1.2 mm; (e) 1.0 Qd, 1.2 mm; (f) 1.4 Qd, 1.2 mm.
Figure 13.
Pressure distribution of blade expansion in the second-stage impeller, (a) 0.6 Qd, 1 mm; (b) 1.0 Qd, 1 mm; (c) 1.4 Qd, 1 mm; (d) 0.6 Qd, 1.2 mm; (e) 1.0 Qd, 1.2 mm; (f) 1.4 Qd, 1.2 mm.

Figure 14.
Comparison of the efficiency of the diffuser at different end clearances.

Figure 15.
Streamline diagram of the velocity of the diffuser, (a) 0.3 mm, (b) 0.6 mm, (c) 0.9 mm, (d) 1.2 mm.
Figure 15.
Streamline diagram of the velocity of the diffuser, (a) 0.3 mm, (b) 0.6 mm, (c) 0.9 mm, (d) 1.2 mm.


Table 1.
Parameters of impeller and diffuser.
| Blade wrap angle of impeller | 85° | Impeller inlet diameter | 40 mm |
| Inlet setting angle of impeller | 44° | Impeller outlet width | 6 mm |
| Outlet setting angle of impeller | 25° | Hub diameter | 19 mm |
| Blade number of impeller | 6 | Impeller outlet diameter | 77 mm |
| Blade number of diffuser | 7 | Blade wrap angle of diffuser | 75° |
| Inlet setting angle of diffuser | 15° | Outlet setting angle of diffuser | 88° |
Table 2.
Grid independence analysis.
| Scheme No. | Grid Number | Head (m) | Efficiency (%) |
|---|---|---|---|
| Scheme 1 | 1120764 | 57.55 | 69.64 |
| Scheme 2 | 1543478 | 58.91 | 70.02 |
| Scheme 3 | 2610407 | 60.77 | 71.65 |
| Scheme 4 | 3241243 | 60.79 | 71.33 |
Table 3.
Turbulence model comparison.
| Flow Rate | Turbulence Model | Standard k-ε | RNG k-ε | Standard k-ω | SST k-ω | Test Data |
|---|---|---|---|---|---|---|
| 20 m3/h | Efficiency (%) | 66.65 | 67.35 | 66.72 | 66.91 | 64.73 |
| Head(m) | 60.77 | 62.1 | 61.35 | 61.51 | 57.26 | |
| 16 m3/h | Efficiency (%) | 61.41 | 62.82 | 62.09 | 61.95 | 58.47 |
| Head(m) | 64.45 | 66.20 | 65.41 | 64.70 | 61.55 | |
| 12 m3/h | Efficiency (%) | 55.61 | 56.31 | 56.08 | 55.44 | 52.15 |
| Head(m) | 67.15 | 67.59 | 67.26 | 66.81 | 64.92 |
Table 4.
Boundary conditions.
| Location | Boundary Condition Types | Settings |
|---|---|---|
| Inlet | Pressure inlet | 101,325 Pa, 5% turbulence intensity |
| Outlet | Mass flow outlet, | Equal to the operating flow rate |
| Wall | Nonslip wall | Surface roughness 0.01 mm |
| Impellers | Rotating | 6000 r/min |
| Diffusers | Stationary | 0 r/min |
© 2020 by the authors. Licensee MDPI, Basel, Switzerland. This article is an open access article distributed under the terms and conditions of the Creative Commons Attribution (CC BY) license (http://creativecommons.org/licenses/by/4.0/).
Share and Cite
MDPI and ACS Style
Zhou, L.; Wang, W.; Hang, J.; Shi, W.; Yan, H.; Zhu, Y. Numerical Investigation of a High-Speed Electrical Submersible Pump with Different End Clearances. Water 2020, 12, 1116. https://doi.org/10.3390/w12041116
AMA Style
Zhou L, Wang W, Hang J, Shi W, Yan H, Zhu Y. Numerical Investigation of a High-Speed Electrical Submersible Pump with Different End Clearances. Water. 2020; 12(4):1116. https://doi.org/10.3390/w12041116
Chicago/Turabian StyleZhou, Ling, Wanhong Wang, Jianwei Hang, Weidong Shi, Hao Yan, and Yong Zhu. 2020. "Numerical Investigation of a High-Speed Electrical Submersible Pump with Different End Clearances" Water 12, no. 4: 1116. https://doi.org/10.3390/w12041116
Note that from the first issue of 2016, this journal uses article numbers instead of page numbers. See further details here.