Article

Spatiotemporal Variations in Nitrogen and Phosphorus in a Large Man-Made Lake and Their Relationships with Human Activities

1
State Key Laboratory of Simulation and Regulation of Water Cycle in River Basin, China Institute of Water Research and Hydropower Research, Beijing 100048, China
2
Research Center of Water and Soil Conservation Ecological Engineering and Technology, Beijing 100048, China
3
College of Computer Science and Technology, Chongqing University of Posts and Telecommunications, Chongqing 400065, China
*
Author to whom correspondence should be addressed.
Water 2020, 12(4), 1106; https://doi.org/10.3390/w12041106
Submission received: 6 March 2020 / Revised: 6 April 2020 / Accepted: 8 April 2020 / Published: 13 April 2020
(This article belongs to the Section Water Quality and Contamination)

Abstract

:
Nitrogen and phosphorus excessive enrichment are major causes of water eutrophication, and variations in nutrients enrichment are strongly influenced by human activities. In this study, annual average water quality from 2001 to 2018 was used to explore the spatiotemporal variations in total nitrogen (TN) and total phosphorus (TP) and their relationships with human activities. Spatially, TN and TP concentrations exhibited significant variations across the five sub-lake zones, and their values were relatively higher in the NW lake zone than the other sub-lake zones. Temporally, TN concentration exhibited weak correlations with years in the NW (R2 = 0.37, p < 0.05) and NE (R2 = 0.43, p < 0.05) lake zones and significant and positive correlations with years in the SW (R2 = 0.62, p < 0.05), SE (R2 = 0.79, p < 0.05), and C (R2 = 0.84, p < 0.05) lake zones. TP concentration exhibited decreasing trends in all lake zones except the NW lake zone (R2 = 0.37, p < 0.05), its value shows a relatively low level and is the restrictive factor to algal growth. The trophic state of the Lake Qiandaohu was determined as mesotrophic. Gross domestic product (GDP) and construction land exhibited strong correlations with TN and TP. Moreover, agriculture nonpoint source pollution was the largest contributor to the excessive enrichment of TN and TP, resulting in water eutrophication. In addition, aquaculture was another major source of nutrients starting in 1999. Although the managers of Lake Qiandaohu implemented a protection-oriented fishery policy, good results cannot be easily achieved with a unilateral policy concerning environmental protection. Thus, comprehensive policies may be more effective than unilateral policies.

1. Introduction

Freshwater is an indispensable resource and essential for most life [1]. It accounts for 2.5% of all freely available water resources on the Earth’s land surface, of which only 0.3% is available in lakes, reservoirs, and rivers [2]. Throughout the last few centuries, human activities and the excess use of freshwater resources for a variety of purposes have resulted in large-scale contamination or pollution of water [3]. These negative impacts have resulted in water bodies with poor water quality, limited potential use, water eutrophication, and even the degradation of aquatic ecosystems [4,5,6]. For example, large-scale harmful algal blooms occurred in Lake Taihu in 2007 that directly threatened the safety of drinking water for millions of people in Wuxi City, Jiangsu Province, China [1]. Additionally, a high eutrophication status and algal blooms in Lake Dianchi in China were observed as early as 1977 [7].
Eutrophication is defined as an increase in the rate of supply of organic matter to an ecosystem, which is usually reflected by an increase in primary production of the system [8]. Excessive enrichment of nutrients (mainly compounds of nitrogen and phosphorus) in surface waters, causing the rapid growth of algae and aquatic macrophytes, deteriorating water quality and water eutrophication [6,9,10,11,12]. Eutrophic drinking water supply reservoirs are prone to have higher treatment costs. Natural eutrophication is an extremely slow and gradual process that generally occurs over many centuries as natural disturbances cause an imbalance between nutrient inputs and outputs [13,14,15]. However, human activities and economic development have greatly accelerated water eutrophication. Human activities and economic development are the two main factors that cause excessive enrichment of nutrients. These influencing factors include domestic and industrial sewage, agricultural runoff, gross domestic product (GDP) (primary, secondary, and tertiary industries), over-fertilization of farmland, population growth, and urbanization [16,17,18]. Moreover, aquaculture is one of the increasing sources of nutrient pollution. The worldwide annual output of freshwater aquaculture production increased by 500% from 1985 to 2005, increasing from 4.56 to 27.47 million tons [19], producing between 44 and 66 kg of N waste per ton of aquaculture production [20]. Furthermore, natural landscapes such as forests and wetlands are important in the capture and cycling of nutrients. Unfortunately, approximately 3 million ha of forests or wetlands were converted into croplands per year from 1995 to 2002 throughout the world [21], which led to greater nutrient losses to the local water bodies. Furthermore, a large number of hydroelectric dams were constructed around the world for hydropower generation, flood control, agricultural irrigation, tourism, and drinking water supply [22]. However, these hydroelectric dams greatly change the hydrometeorological conditions, sediment retention, and nutrient cycling, leading to water eutrophication [22,23,24].
Lake Qiandaohu, as a protected drinking water source, is the largest and most important artificial freshwater lake in the Yangtze River Delta and plays a vital role in the water supply of Zhejiang Province, southeastern China [25,26]. However, local outbreaks of algal blooms over the past two decades have resulted in serious threats to water quality and ecological protection. Additionally, water resource management and planning rely heavily on the knowledge of long-term trends and spatiotemporal variation of nutrients, especially total nitrogen (TN) and total phosphorus (TP) [5]. Monitoring the temporal and spatial variation in nutrient concentrations (especially TN and TP) and analyzing their correlations with human activities are important to managing water quality and water eutrophication. Therefore, the major aims of this paper are to (1) analyze the temporal and spatial variations of TN and TP concentrations from 2001 to 2018; (2) understand the interactions among TN, TP, and human activities.

2. Material and Methods

2.1. Study Area

Lake Qiandaohu (29°29′–29°50′ N, 118°36′–119°14′ E) is a man-made, large, deep freshwater lake that was built in 1959 (Figure 1) [27]. It covers an area of 580 km2, with an average water depth of 30.44 m (maximum water depth of 100 m), a water volume of 178.4 × 10⁸ m3, and a basin area of 10,450 km2 when the water level is 108 m [28,29]. This area has a typical subtropical monsoon humid climate with abundant rainfall. The average annual rainfall is 1526.38 mm, most of which occurs from April to August, accounting for ~60% of the total rainfall. The average annual temperature is ~17.71 °C (the maximum temperature occurs in July and August, and the minimum temperature occurs in January or February), and the average annual sunshine duration is ~1951 h. The main rivers entering the lake include Xin’anjiang (accounting for ~60% of the total runoff), Fuqiangxi (~20%), and Wuqiangxi (~10%), their catchments are dominated by the agricultural economy. Lake Qiandaohu was artificially divided into five sub-lake zones based on its characteristics to analyze the spatiotemporal distributions of their nutrients (mainly N and P) and their interactions with human activities (Figure 1): (1) the northwest (NW) lake zone, the northeast (NE) lake zone, the central (C) lake zone, the southwest (SW) lake zone, and the southeast (SE) lake zone.

2.2. Data Collection

Water quality data, including water temperature, pH, dissolved oxygen (DO), total nitrogen (TN), total phosphorus (TP), chlorophyll α (Chl-α), and Secchi disk were collected from the Environmental Protection Agency of Hangzhou, China. pH was measured by the glass electrode method. DO was determined using the iodometric method. TN was determined by spectrophotometry after digestion with alkaline potassium persulfate; TP was measured in the same manner as for PO43—P after digestion with alkaline potassium persulfate (K2S2O8 + NaOH); the PO43—P concentration was determined by spectrophotometry at 700 nm using the molybdenum blue method [30]; water samples that were used to measure Chl-α were filtered through GF/F filters (ANPEL Laboratory Technologies Inc., Shanghai, China), then the Chl-α was extracted with hot ethanol (90%) at 80 °C, and Chl-α was spectrophotometrically analyzed at 750 and 665 nm with a correlation for phaeopigments [23,30]; Secchi disk was determined with a standard 30-cm diameter Secchi disk (Beijing Purity Instrument Co., Ltd, Beijing, China) [31,32].

2.3. Data Analysis

Statistical analyses, including average value calculations, linear and nonlinear fitting, regression, and standard deviation calculations, were performed with the Statistical Program for Social Sciences (SPSS 19.0) software. The location of Lake Qiandaohu and the spatiotemporal variations in nutrient concentrations were analyzed using ArcGIS 10.1 software. The significance levels are reported as significant if p < 0.05.

3. Results and Discussion

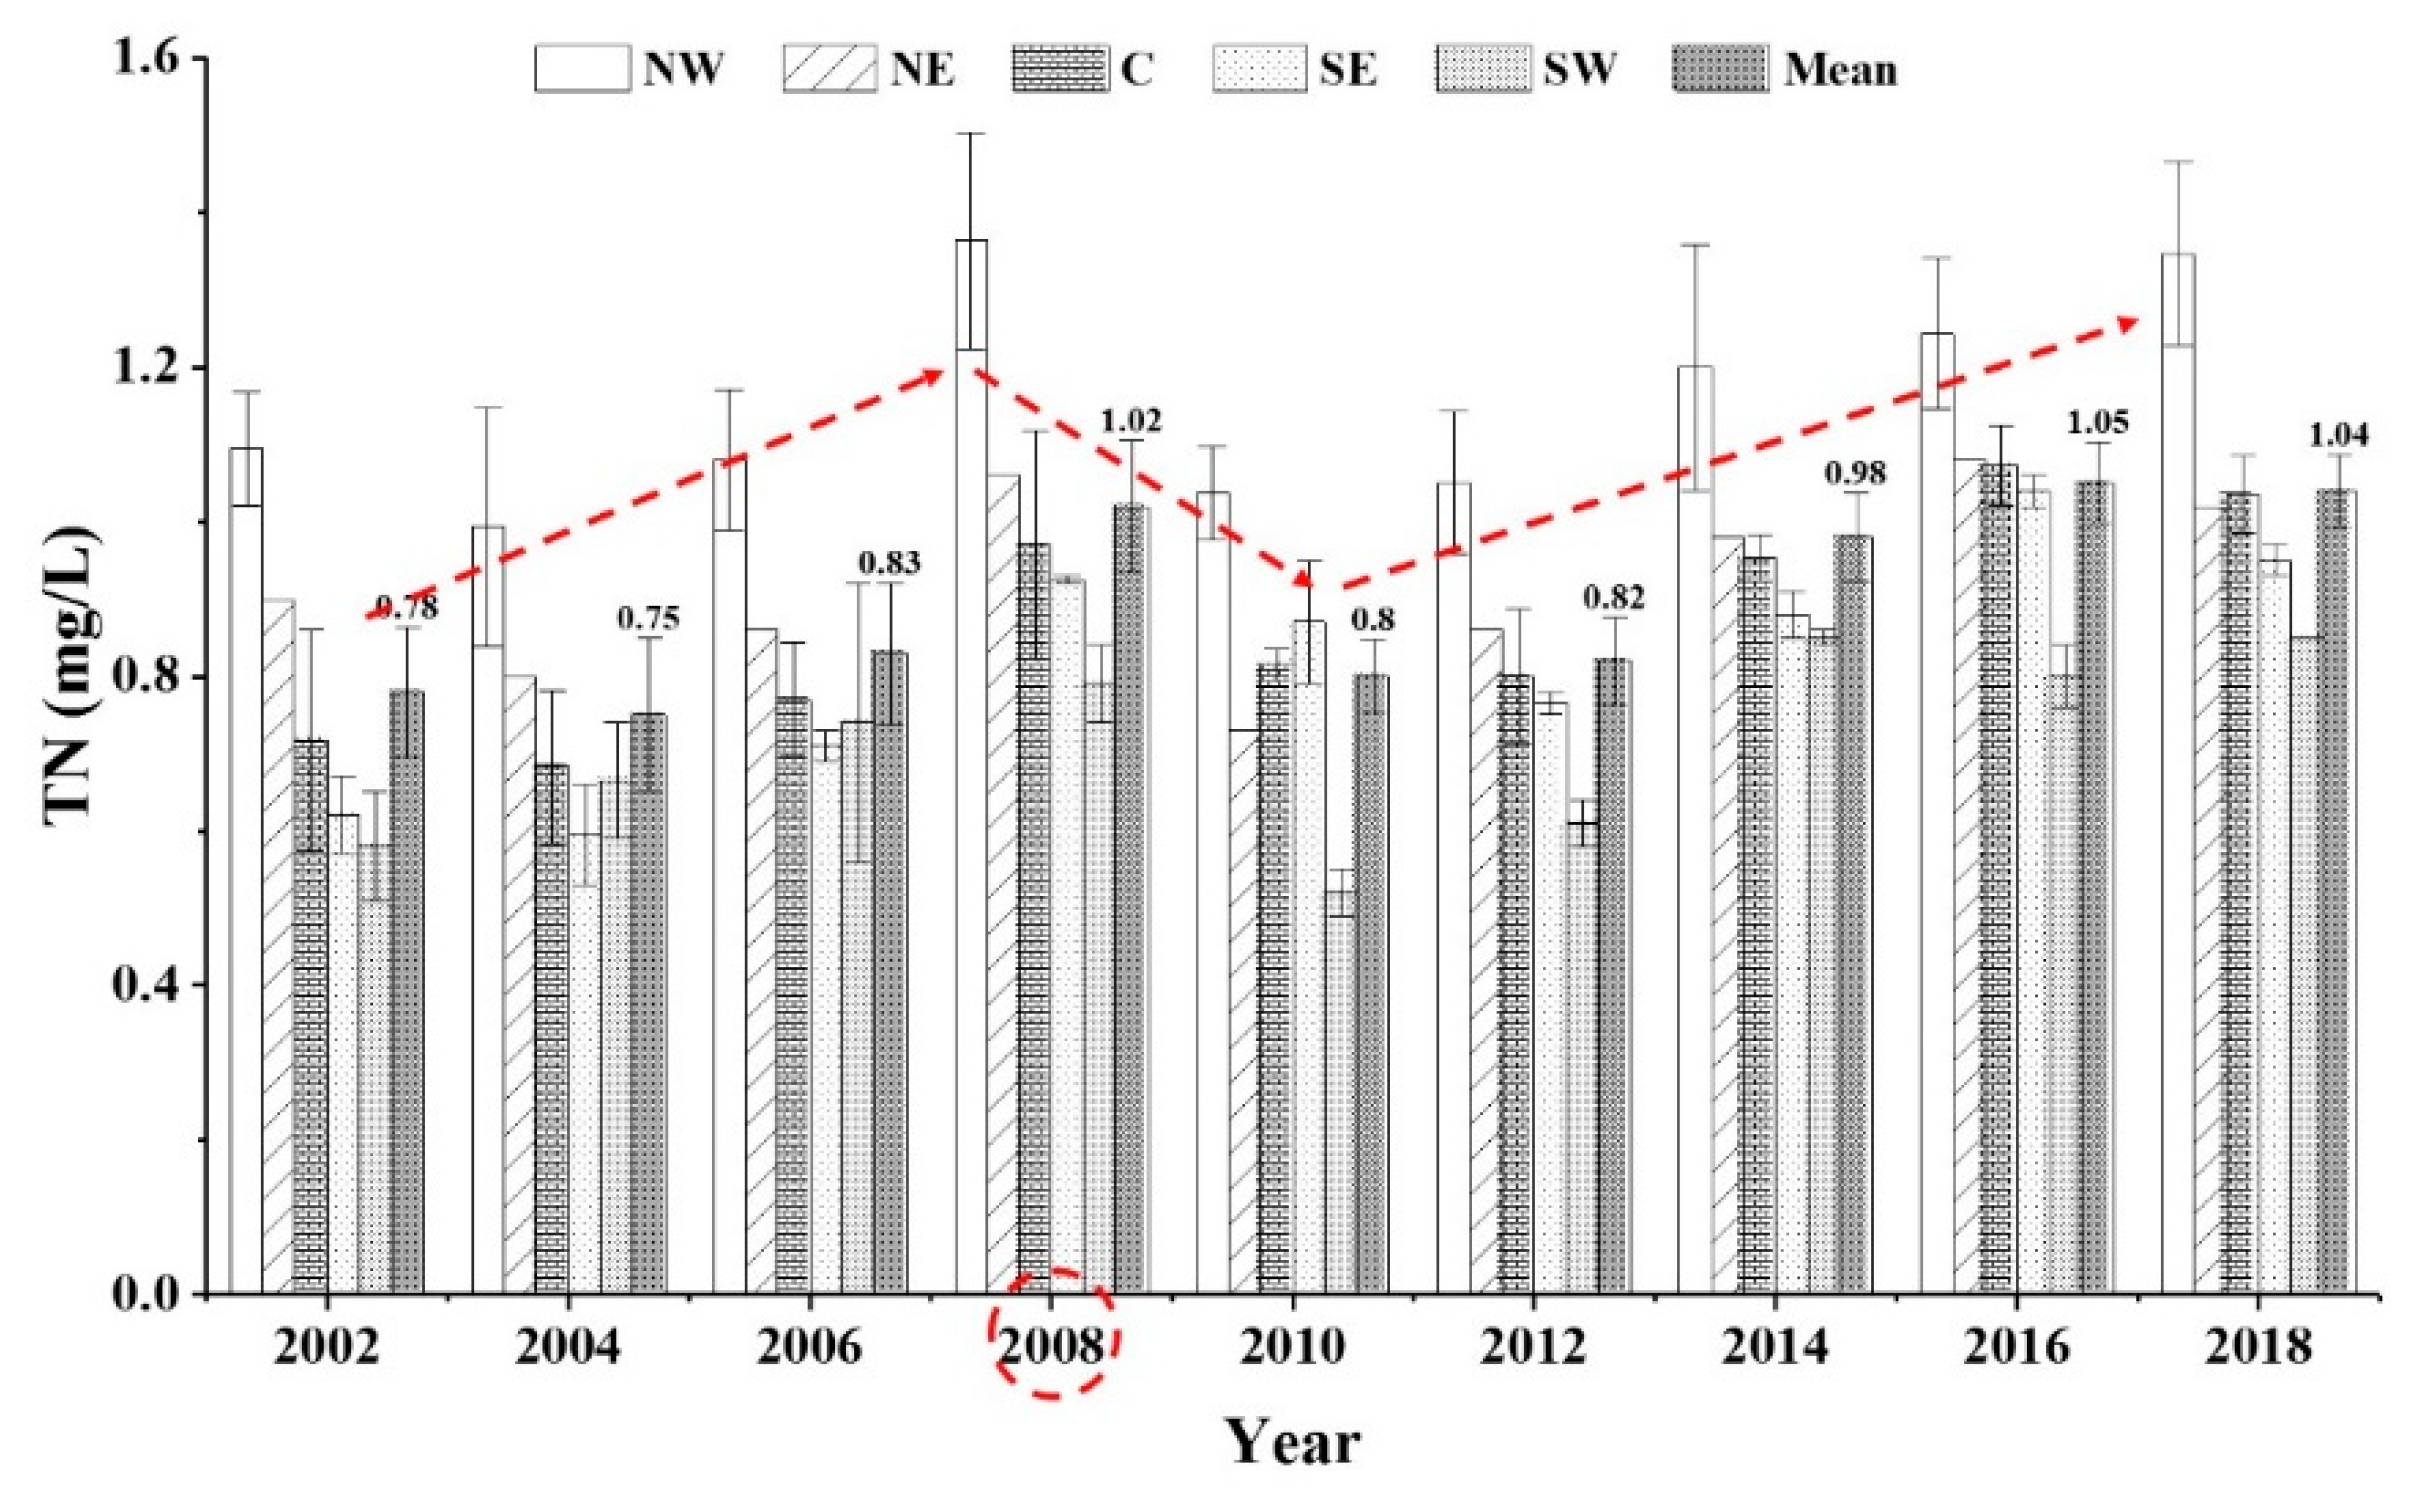
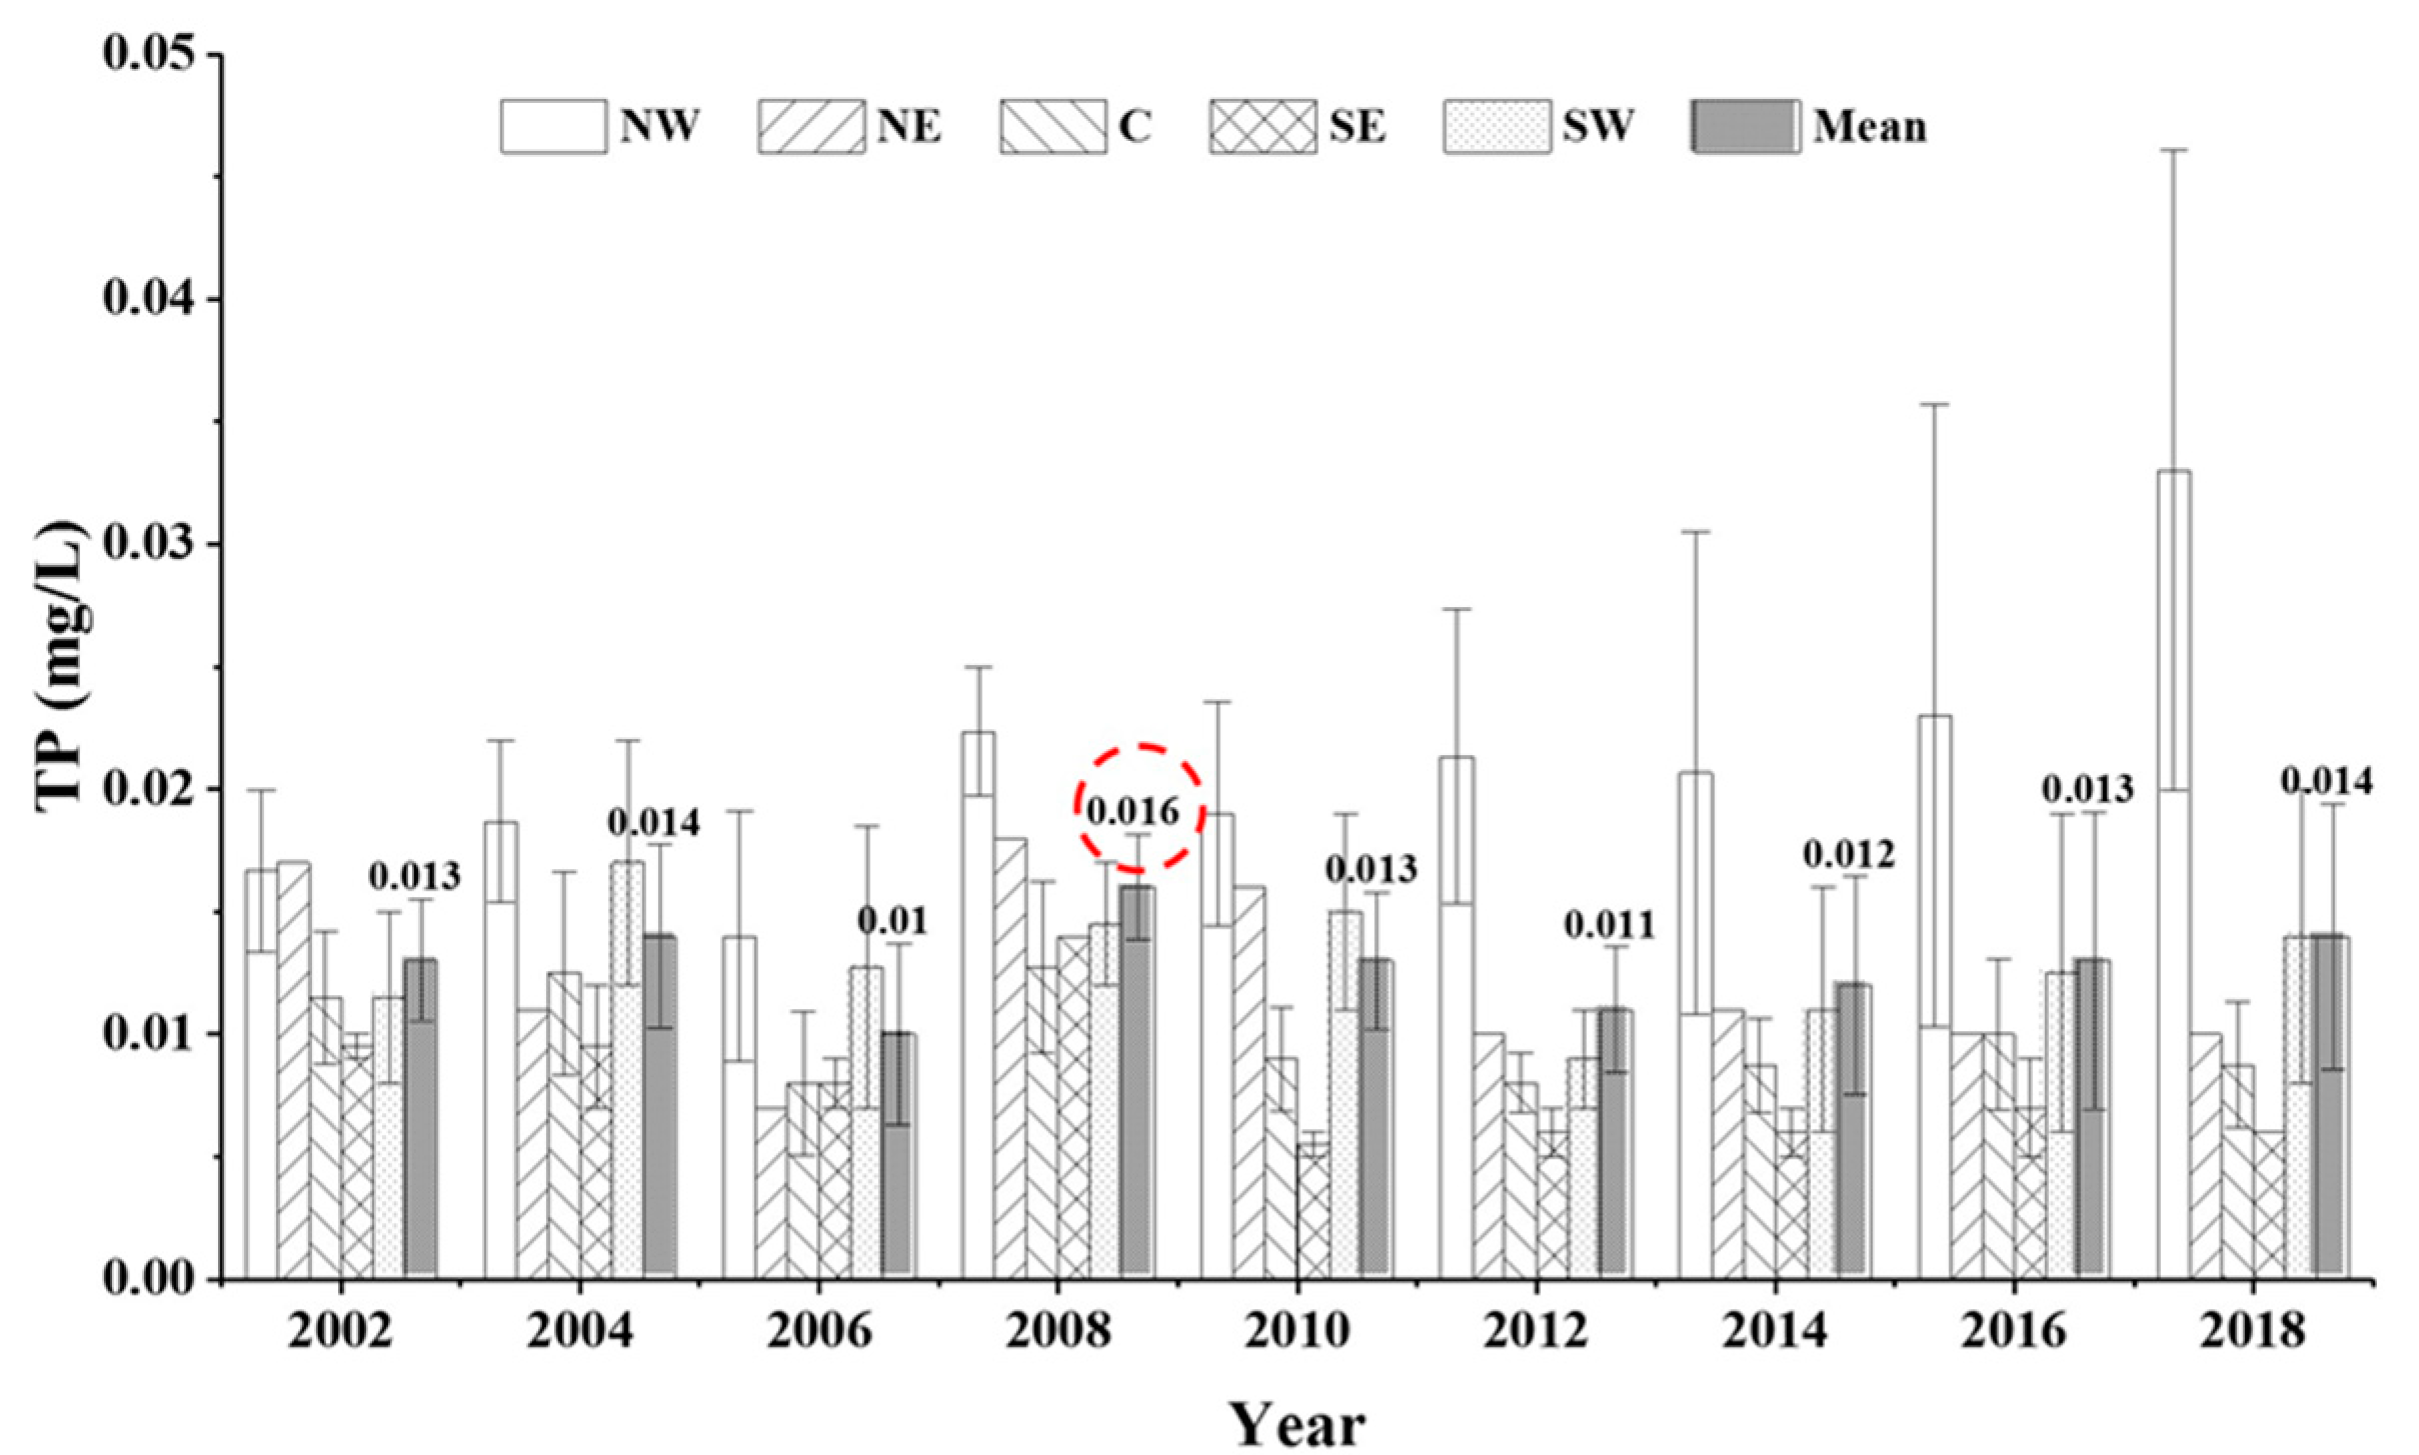
3.1. Dynamic Characteristics and Long-term Trends in TN and TP

Table 1 summarizes the variability in the nutrient concentrations in the five sub-lake zones from 2001 to 2018. TN ranged from 0.55 ± 0.06 mg/L to 1.39 ± 0.15 mg/L, with an average of 0.88 ± 0.05 mg/L. The NW lake zone had the highest average TN value (1.14 ± 0.12 mg/L), followed by the NE lake zone (0.90 mg/L). The SW lake zone had the lowest average TN value (0.71 ± 0.03 mg/L), and the C lake zone and SE lake zone were in the middle position values of 0.85 ± 0.07 mg/L and 0.80 ± 0.04 mg/L, respectively. The long-term trends in TN over the last 18 years (2001–2018) in the five sub-lake zones are shown in Figure 2. The red dotted line shows that the mean concentration of TN in the whole lake zone exhibited an increasing trend from 2001 to 2008, then declined to 2010, and then gradually increased from 2010 to 2018 (Figure 2). The reasons may be that the rainfall in 2008 experienced the highest rainfall between 2001 and 2010, which brought considerable sediment and nutrients, resulting in a higher TN concentration. Linear fitting results indicated TN presence of weak correlations with years in the NW lake zone (R2 = 0.37, p < 0.05) and NE lake zone (R2 = 0.43, p < 0.05) and significant and positive correlations with years in the SW lake zone (R2 = 0.62, p < 0.05), SE lake zone (R2 = 0.79, p < 0.05), C lake zone (R2 = 0.84, p < 0.05), and the whole lake zone (R2 = 0.71, p < 0.05) (Figure 3).
TP varied from 0.006 ± 0.001 mg/L to 0.033 ± 0.016 mg/L, with a mean value of 0.013 ± 0.004 mg/L in the five lake zones from 2001 to 2018. The NW lake zone had the highest mean value of 0.033 ± 0.016 mg/L, and similar results were found for the other sub-lake zones, with values of 0.012 mg/L in the NE lake zone, 0.013 ± 0.007 mg/L in the SW lake zone, 0.008 ± 0.001 mg/L in the SE lake zone, and 0.010 ± 0.002 mg/L in the C lake zone. The maximum value of TP was found to be five times that of the minimum. The long-term trends in TP over the last 18 years (2001–2018) among the five sub-lake zones are shown in Figure 4. The mean TP showed a fluctuating but rising trend from 2001 to 2018 and exhibited significant variations among the five sub-lake zones. The linear fitting results show that the long-term trends in TP differ from those of TN. The TP showed a weak correlation with years (R2 = 0.37, p < 0.05) in the NW lake zone and no correlations in the NE, C, SW lake zones (p > 0.05). Although TP in the SE lake zone showed a significant negative correlation with years (R2 = 0.59, p < 0.05), it showed an increasing trend from 2001 to 2009, then declined and tended to stabilize in 2010 and beyond (Figure 5).
The reservoir trophic state was determined based on Vollenweider and Kerekes [33] and the Organization Economic Cooperation and Development (OECE) [34] limits for TN, TP, Chl-α, and Secchi disk. The trophic state was determined as mesotrophic in the NW, C lake zones (Table 1), the reasons may be that the Xin’anjiang River input a large number of nutrients and declined the Secchi disk through the resuspension of sediment. The trophic state was determined as oligotrophic in the NE, SW, and SE lake zones (Table 1), the reasons may be that the SE, NE lake zones are located in the Wuqiangxi River Basin and Fuqiangxi River Basin, respectively, with good vegetation coverage, small population, and agricultural lands areas. Although the whole lake zone is still a mesotrophic system and exhibits good water quality compared to other China reservoirs, such as Lake Dianchi [7] and Lake Taihu [1], the TN concentration indicated a eutrophic or hypertrophic.
The TN:TP ratio is a widely used indicator of which nutrients limit phytoplankton growth in freshwater ecosystems. When TN:TP < 22 by weight in the freshwater environments, P may be present in excess and N often limits algal growth; otherwise, P is often the limiting factor [6,35]. Understanding which nutrients limit algal growth help managers decide what control measures should be implemented to reduce eutrophication. In Lake Qiandaohu, the TN:TP ratio varied from 27.93 ± 9.23 to 160.91 ± 10.00, with an average of 74.34 ± 17.94 in the five sub-lake zones (Table 1), which indicates that P limits phytoplankton growth.

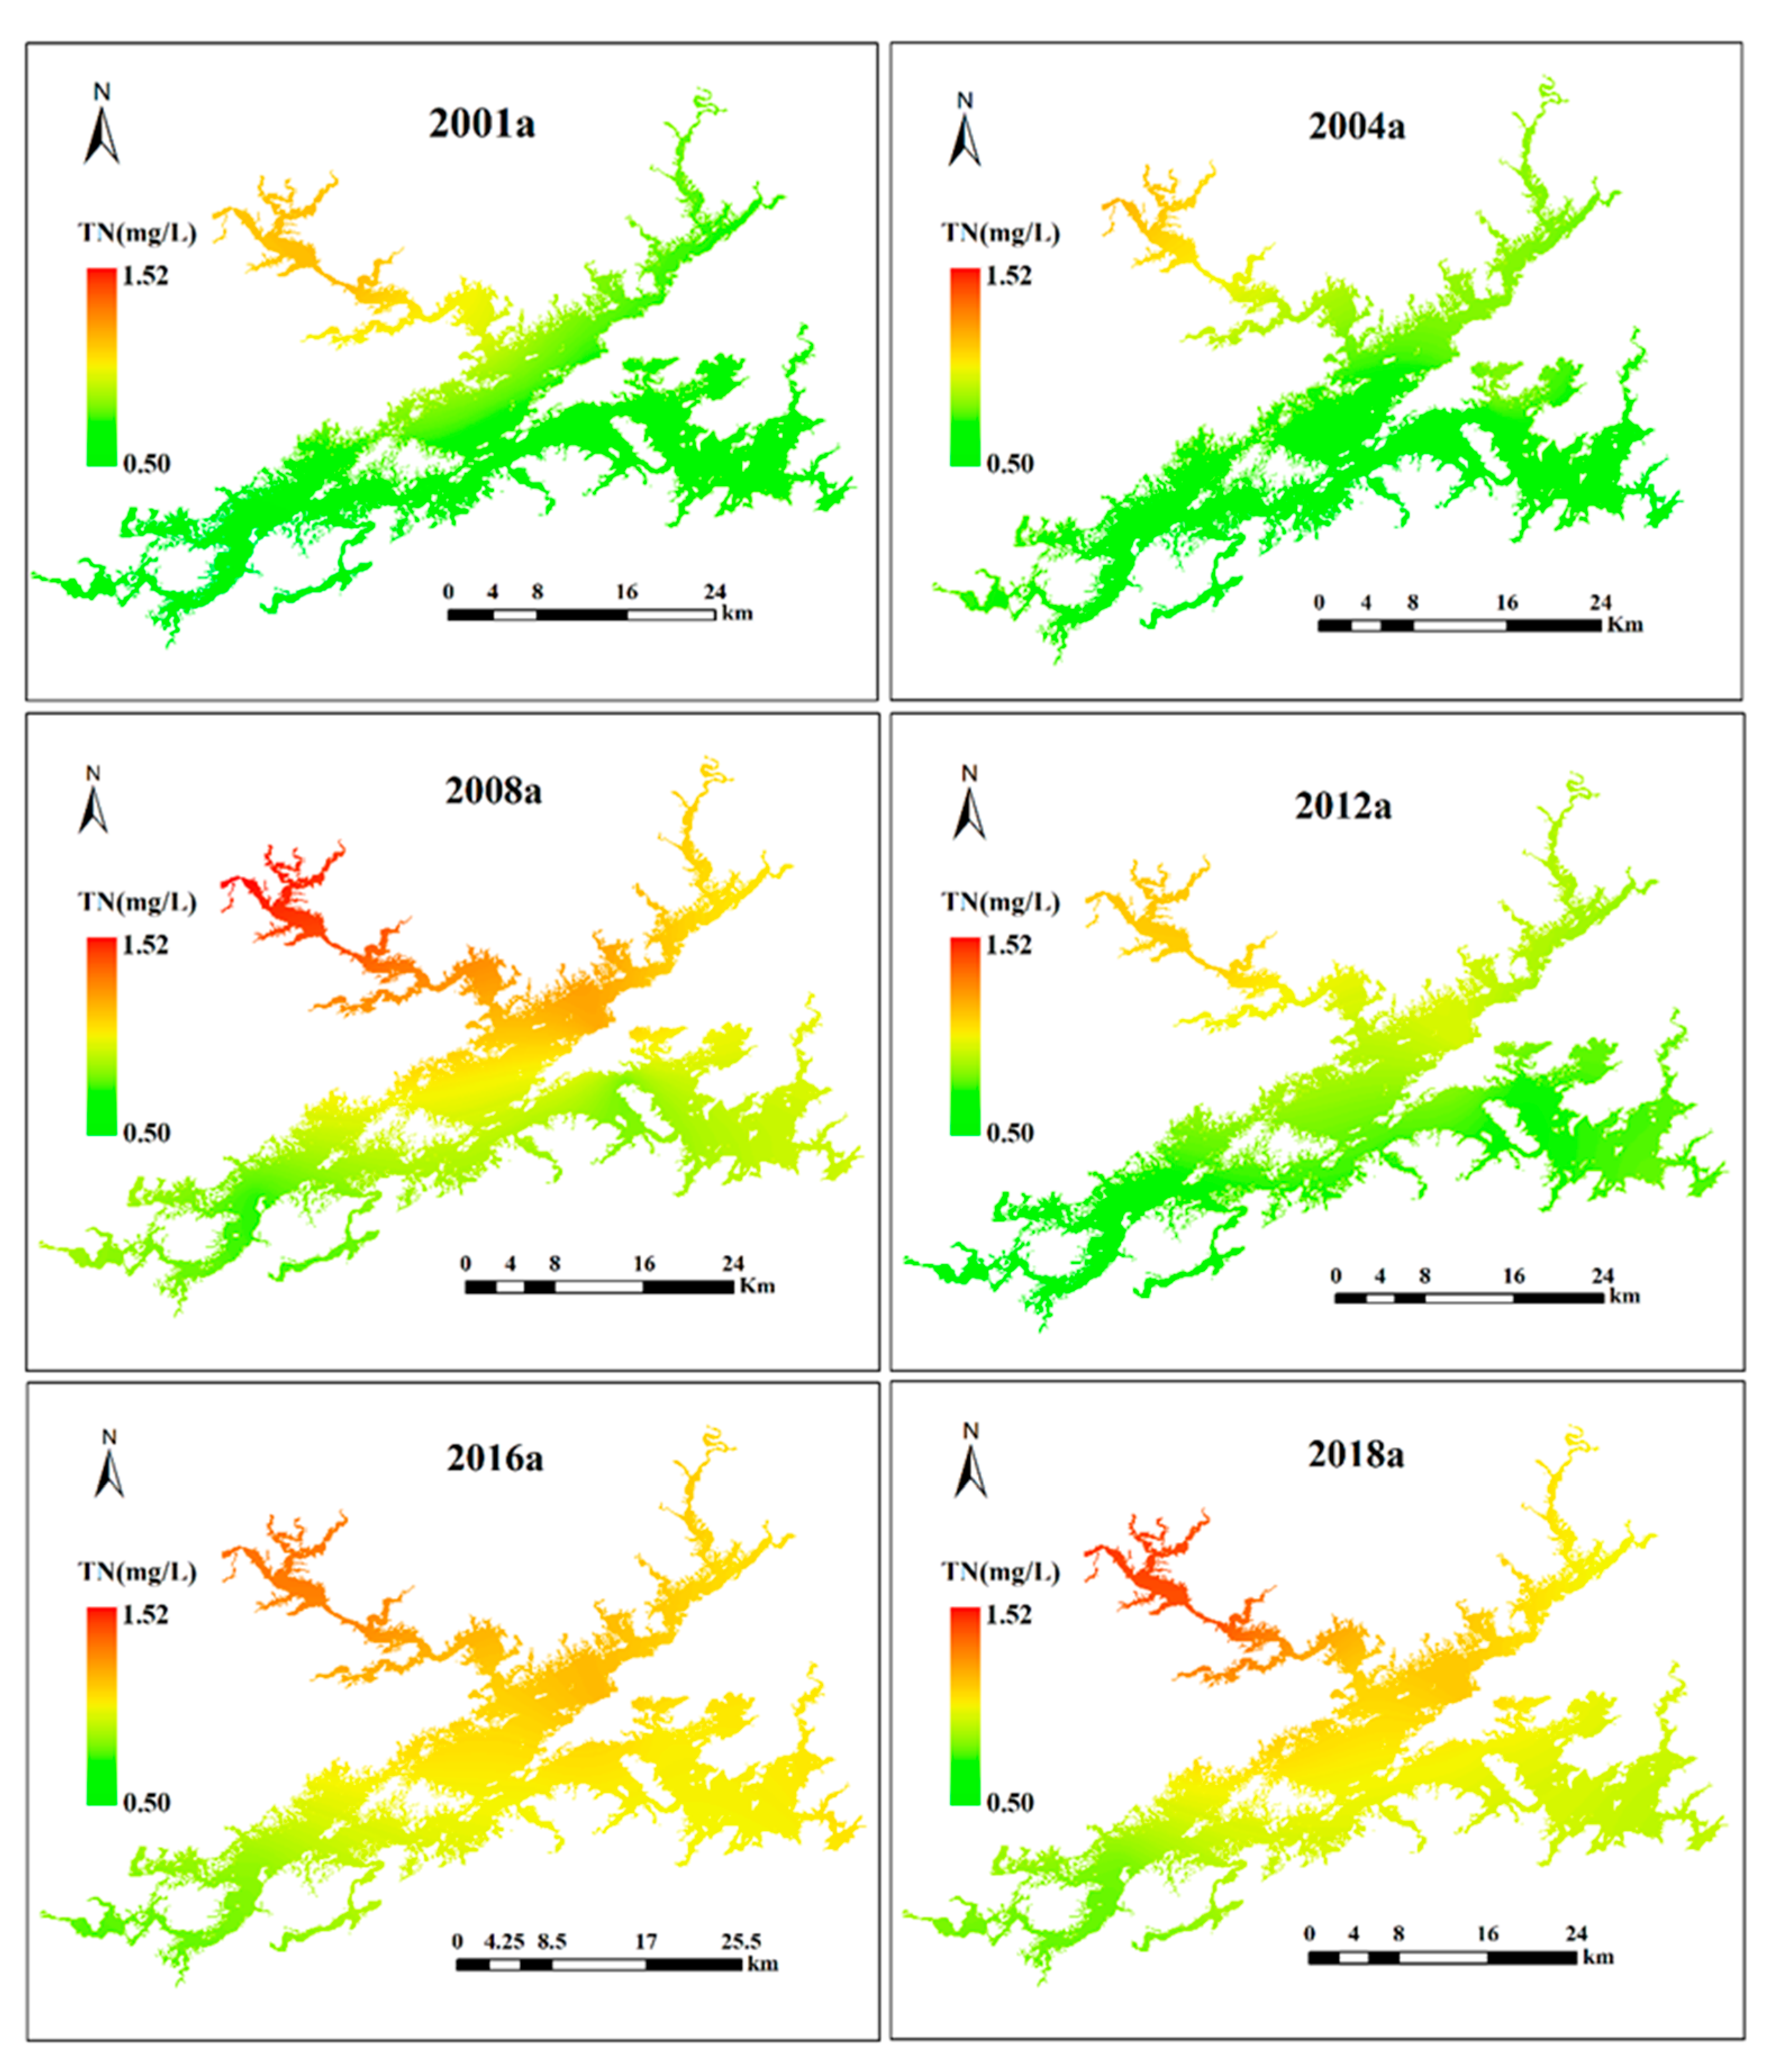
3.2. Spatiotemporal Variation Characteristics of TN

The spatial characteristics of TN in Lake Qiandaohu from 2001 to 2018 are shown in Figure 6. In comparison to other freshwater lakes in China, such as Lake Taihu and Lake Dianchi [7,36,37,38,39], TN in Lake Qiandaohu remained relatively low for many years. In terms of the spatial-temporal distribution, strong spatiotemporal variability in TN was observed throughout the lake. The long-term trends first increased from 0.50–1.16 mg/L in 2001 to 0.74–1.52 mg/L in 2008, then decreased to 0.58–1.13 mg/L in 2012, and finally increased to 0.74–1.45 mg/L in 2018, which suggests that we need to be alert to a sharp rise in TN. The NW lake zone had the highest TN values, increasing by 25% from 1.16 mg/L in 2001 to 1.45 mg/L in 2018, followed by the SE, C, and SE lake zones, whereas the lowest TN values were observed in the SW lake zone. Overall, the TN values showed an upward trend and strong spatiotemporal variability in the five sub-lake zones.

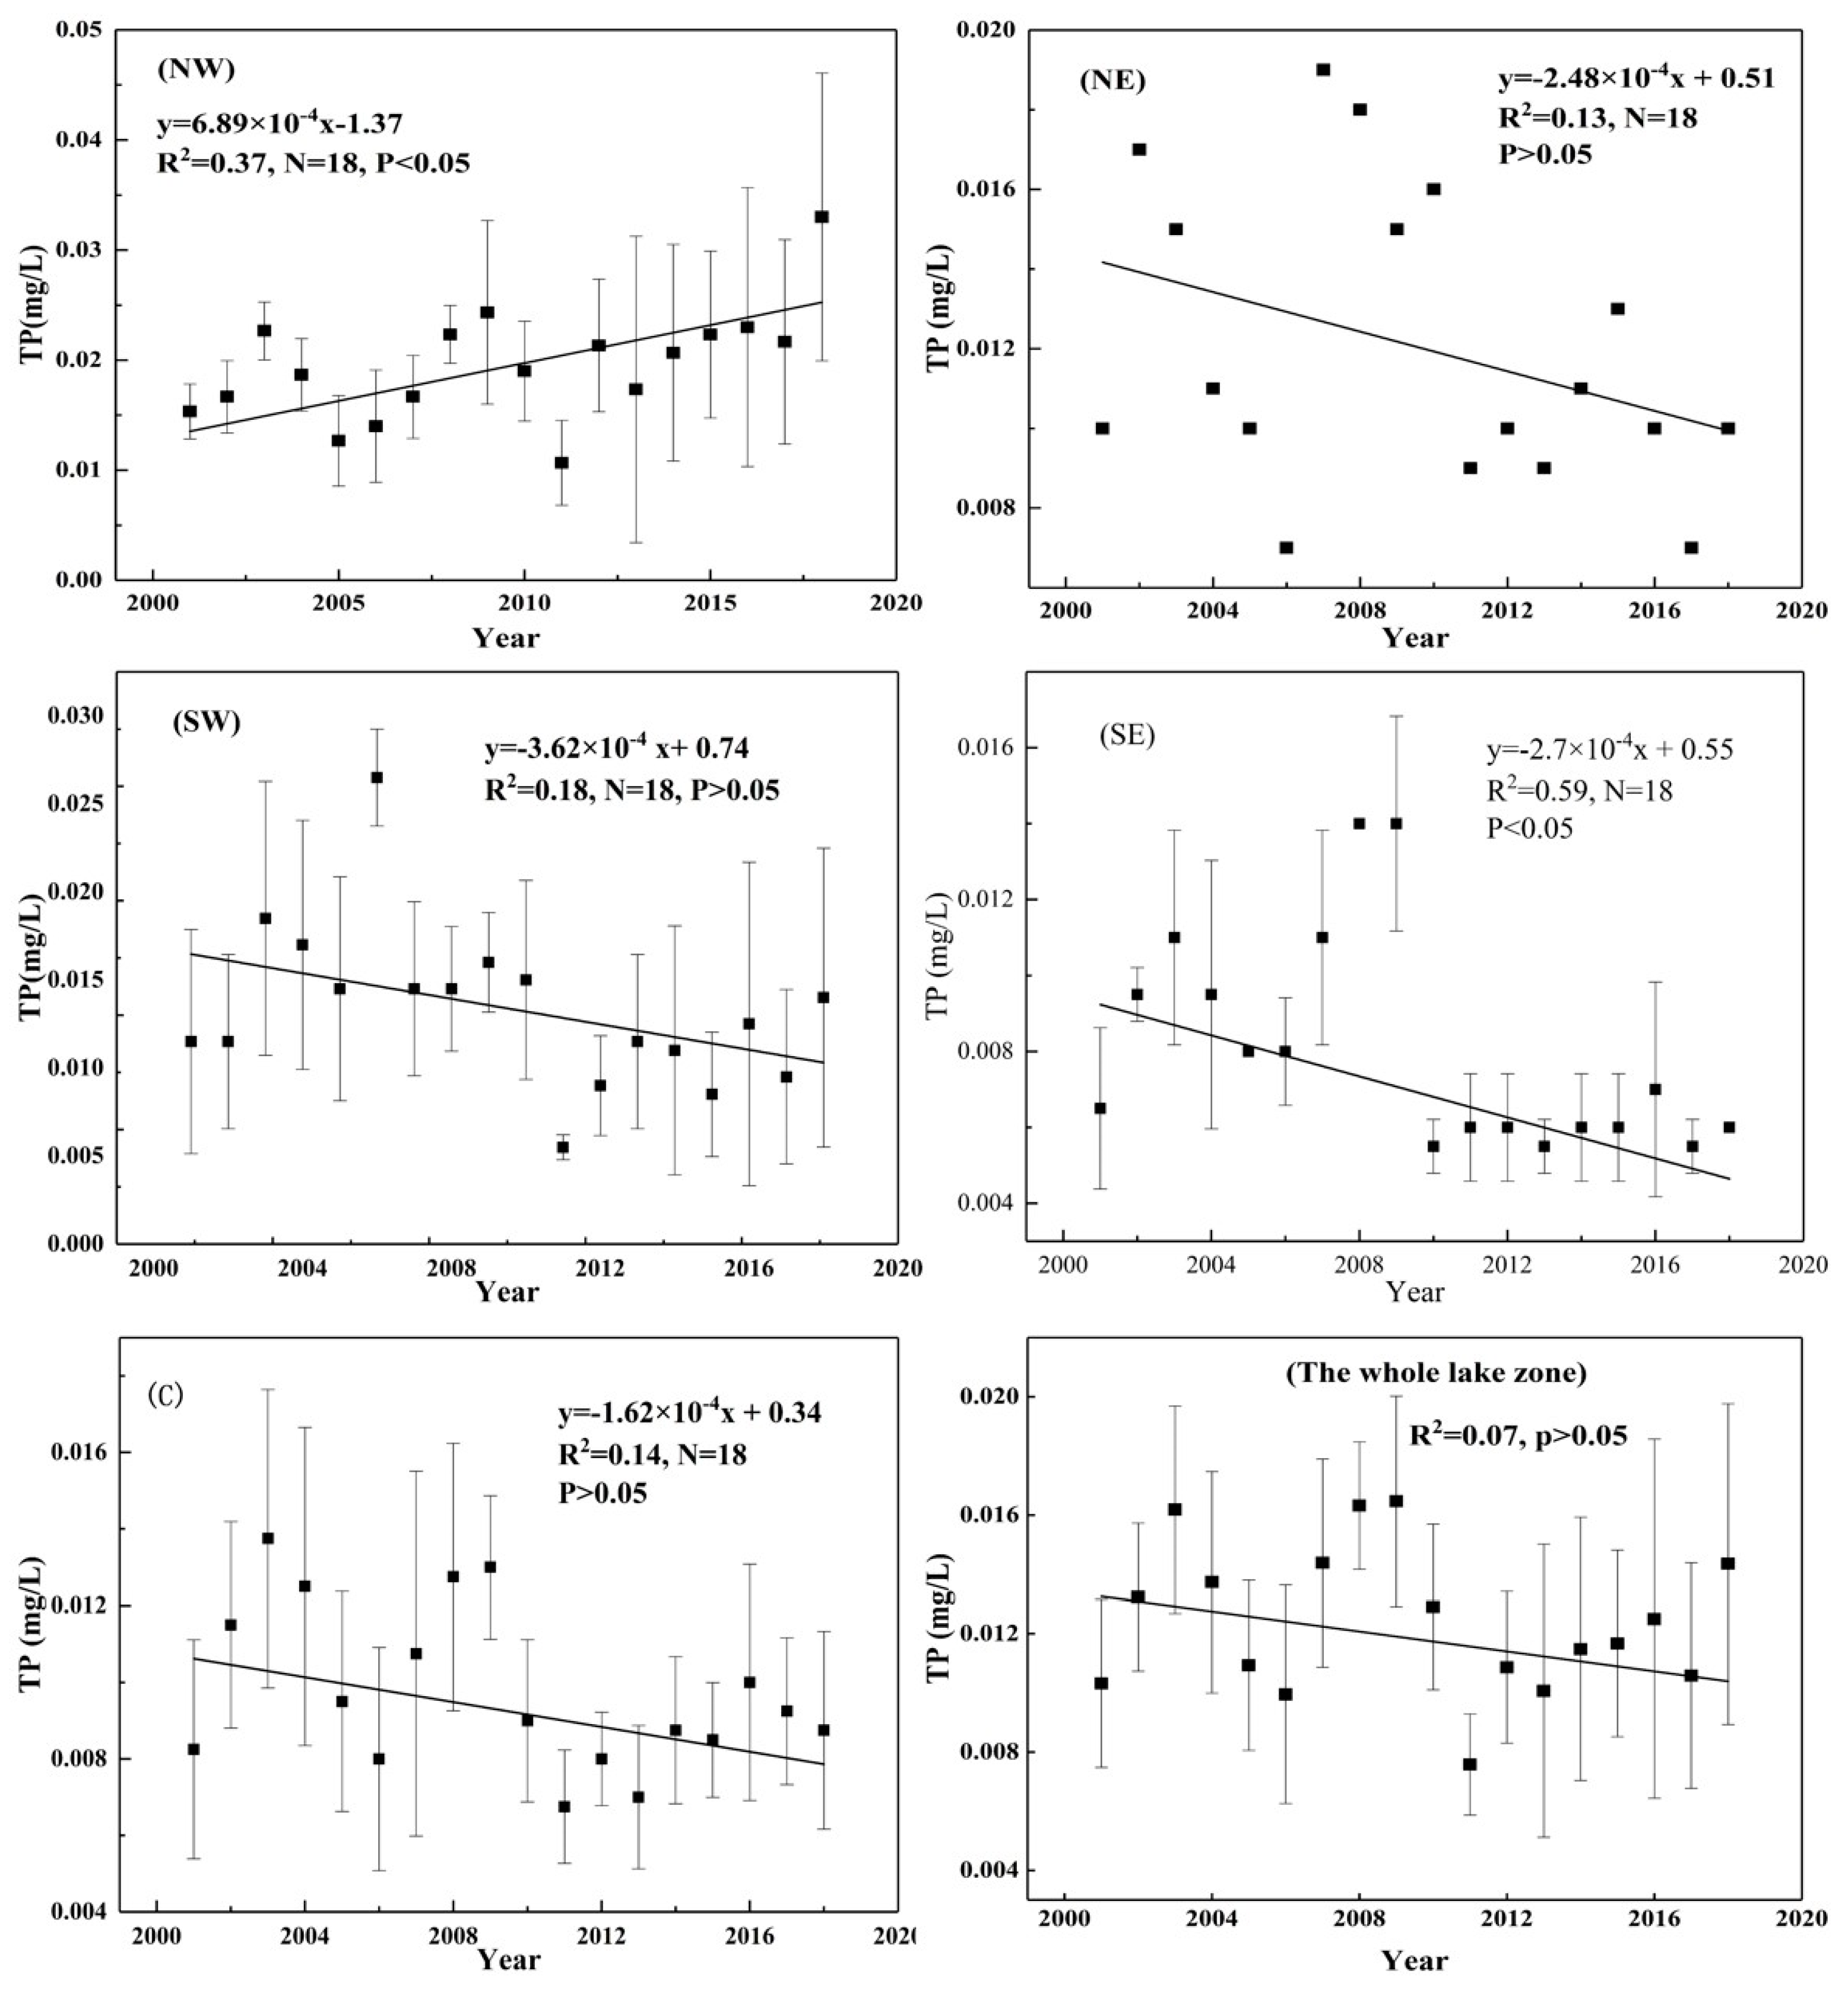
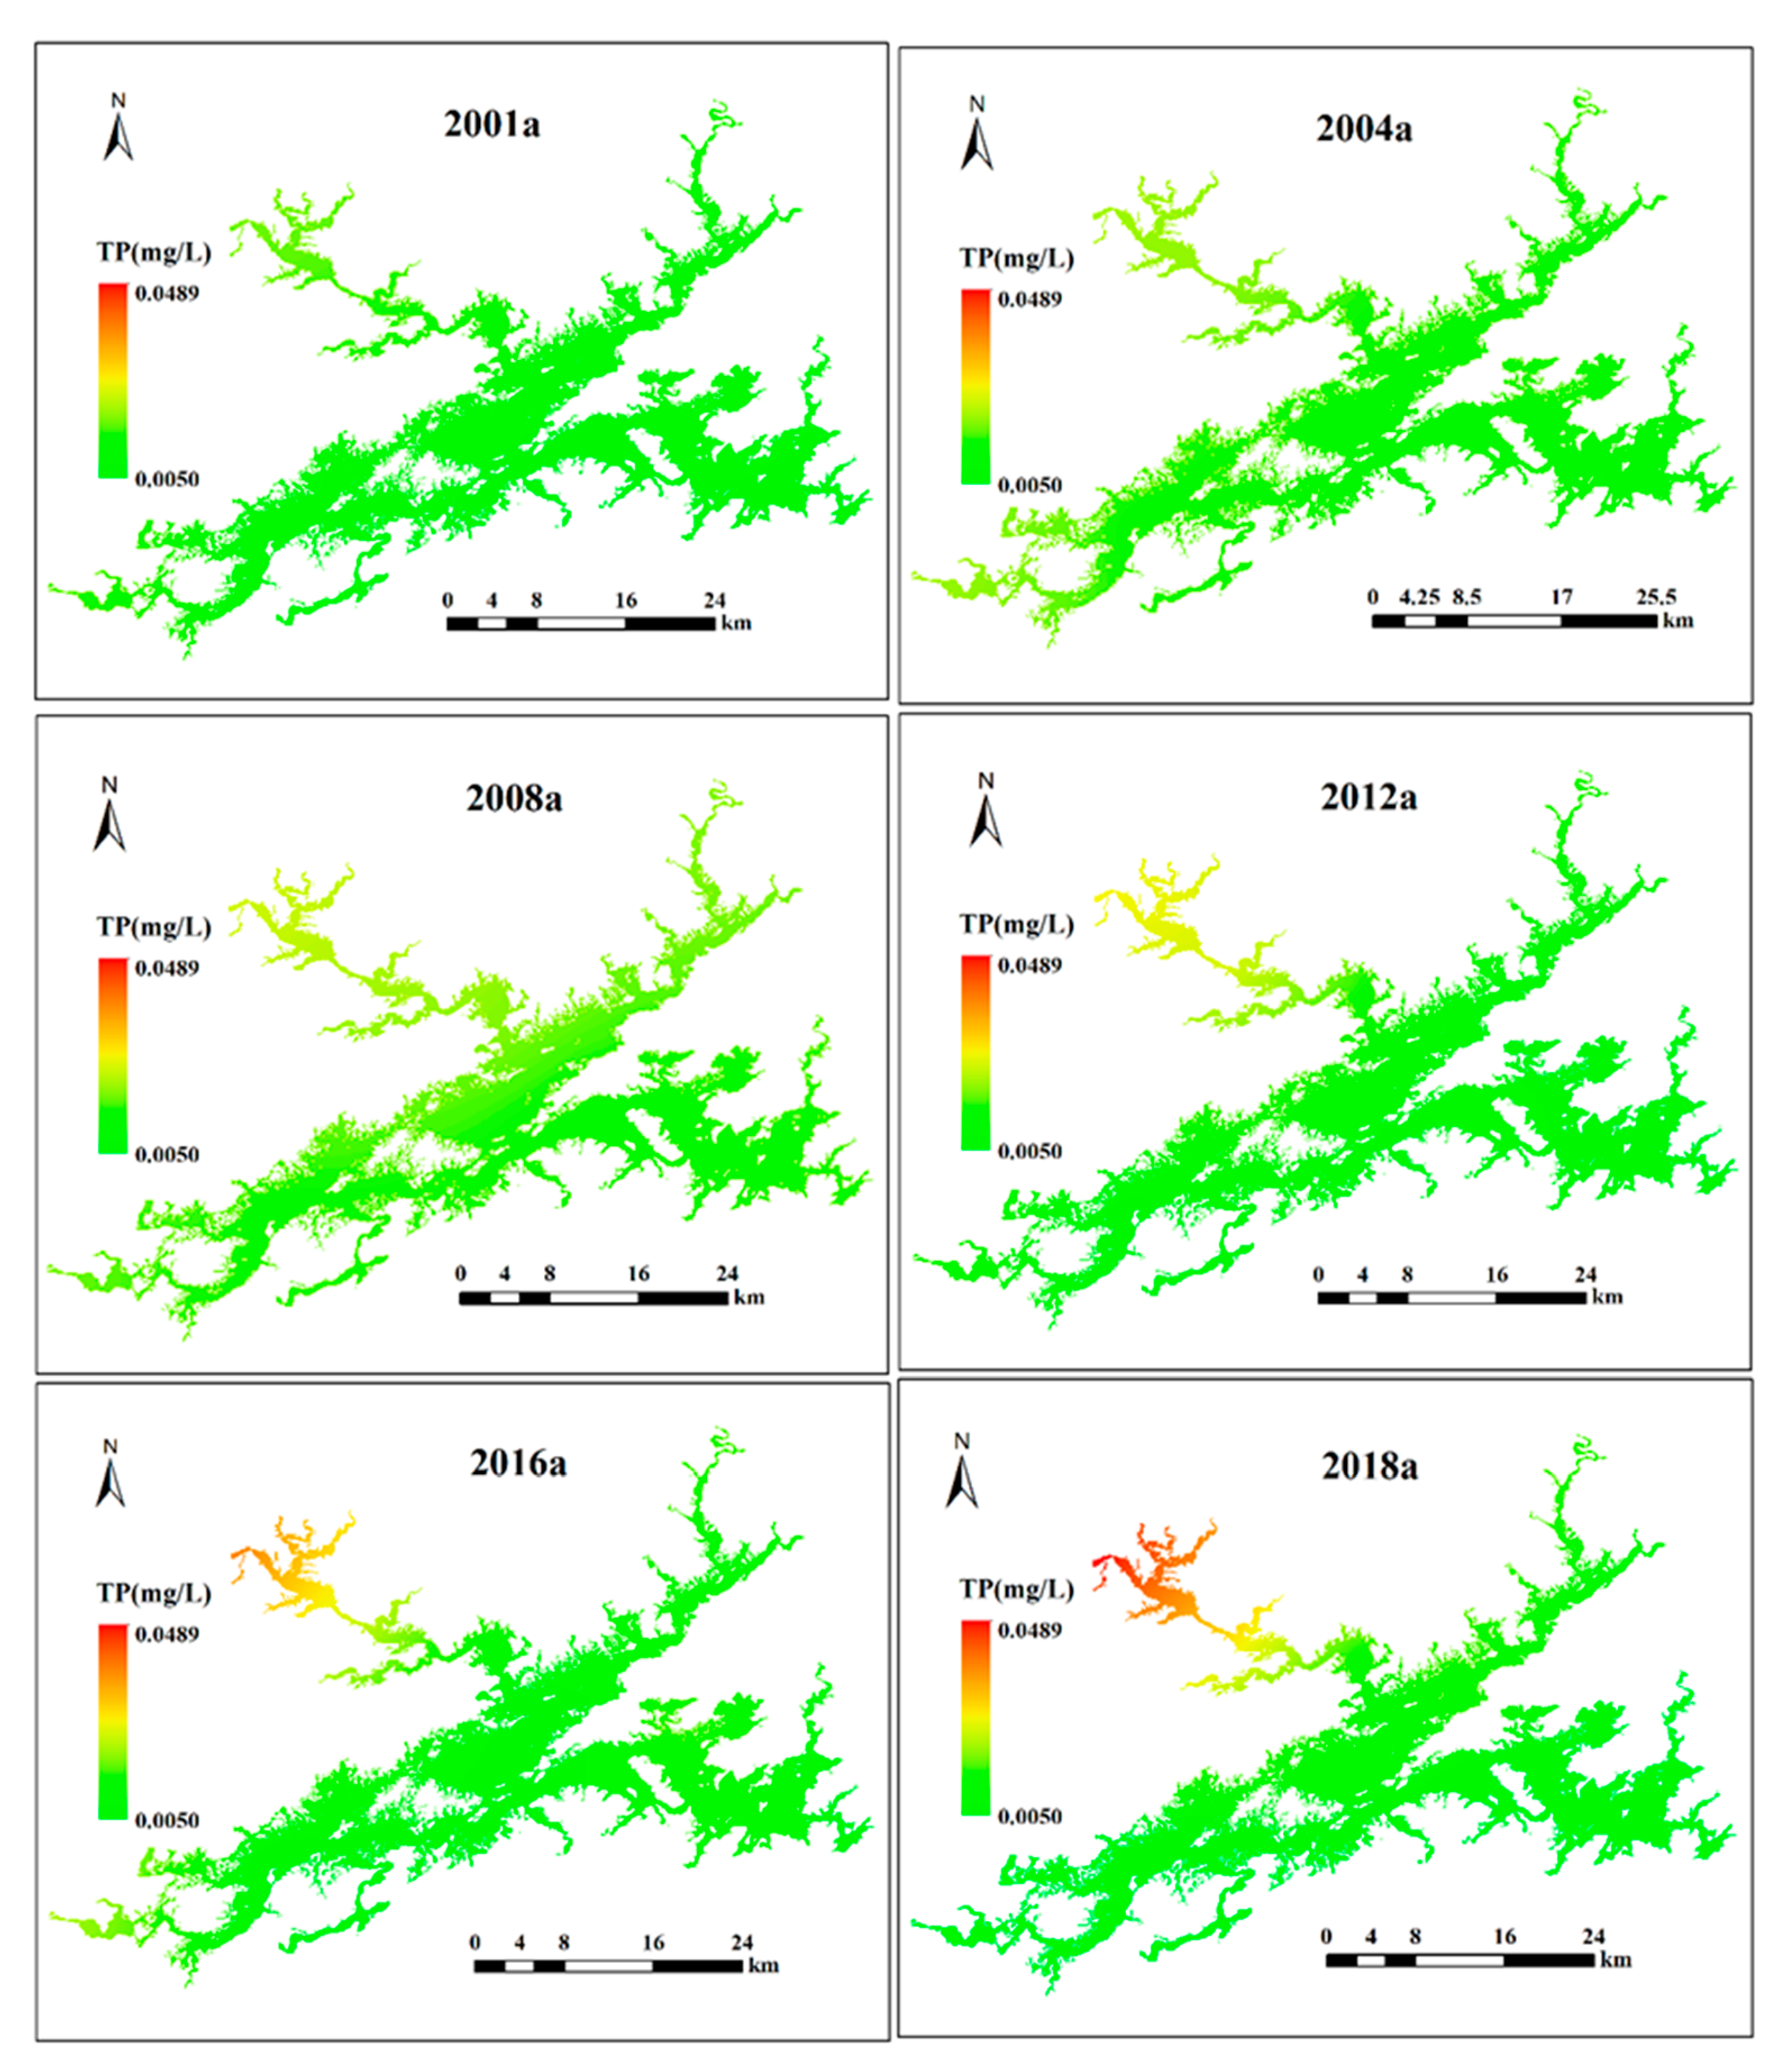
3.3. Spatiotemporal Variation Characteristics of TP

The method used to analyze the spatiotemporal variation in TP is similar to that used for TN. Clear spatial variation among the five sub-lake zones can be seen in Figure 7. First, the spatial pattern of TP from the NW lake zone to the C and SE lake zones shows a significant downward gradient. Based on the monitoring data from 2001 to 2018, the average TP values (± standard deviation) in the NW lake zone ranged from 0.011 ± 0.005 mg/L to 0.033 ± 0.016 mg/L, with an average value of 0.020 ± 0.008 mg/L. In the C lake zone, the average TP value (± standard deviation) ranged from 0.008 ± 0.001 mg/L to 0.014 ± 0.005 mg/L, with an average value of 0.010 ± 0.002 mg/L. In the SE lake zone, the average TP value (± standard deviation) ranged from 0.006 ± 0.001 mg/L to 0.014 ± 0.003 mg/L, with an average value of 0.008 ± 0.001 mg/L. The lowest average TP value was observed in the SW lake zone, with a value of 0.013 ± 0.007 mg/L. Temporally, the average TP values in the NW and SE lake zones showed a significant positive (R2 = 0.37, p < 0.05) and significantly negative correlation (R2 = 0.59, p < 0.05), respectively, whereas no significant changes were observed in the other lake zones (Figure 5). However, TP in the NE, SW, SE, and C lake zones decreased, which led to an increase in the TN:TP ratio.

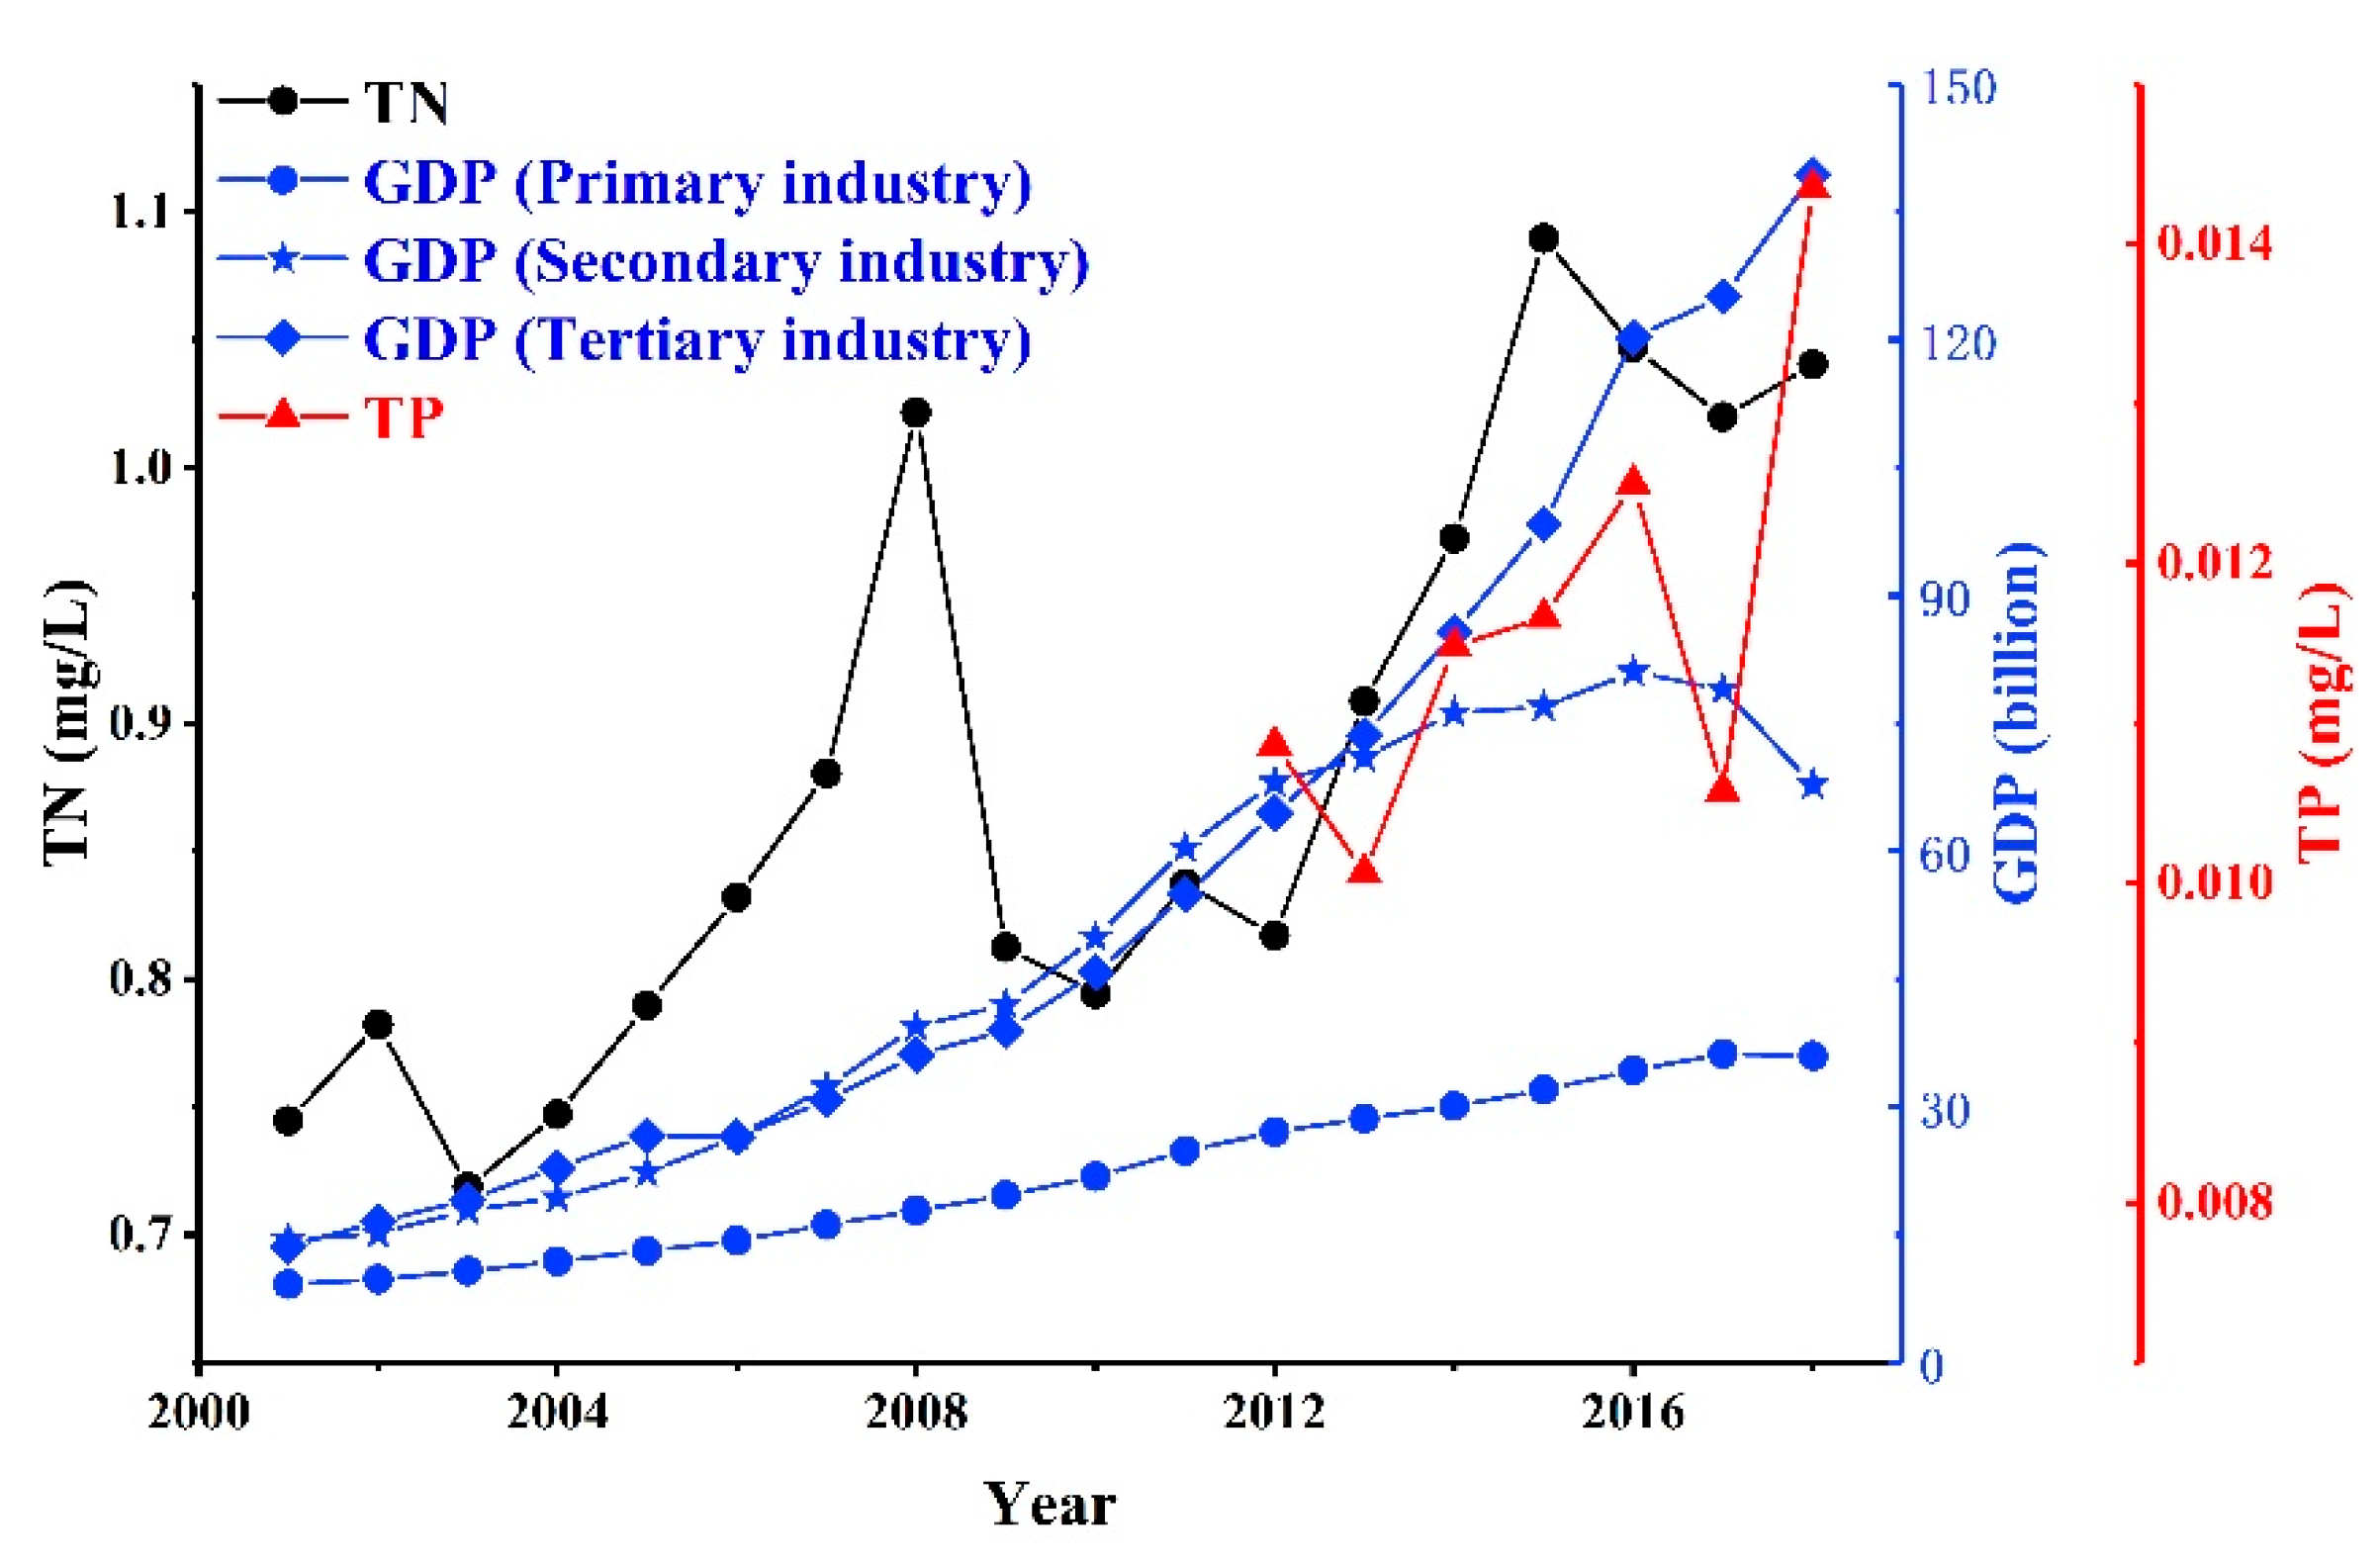
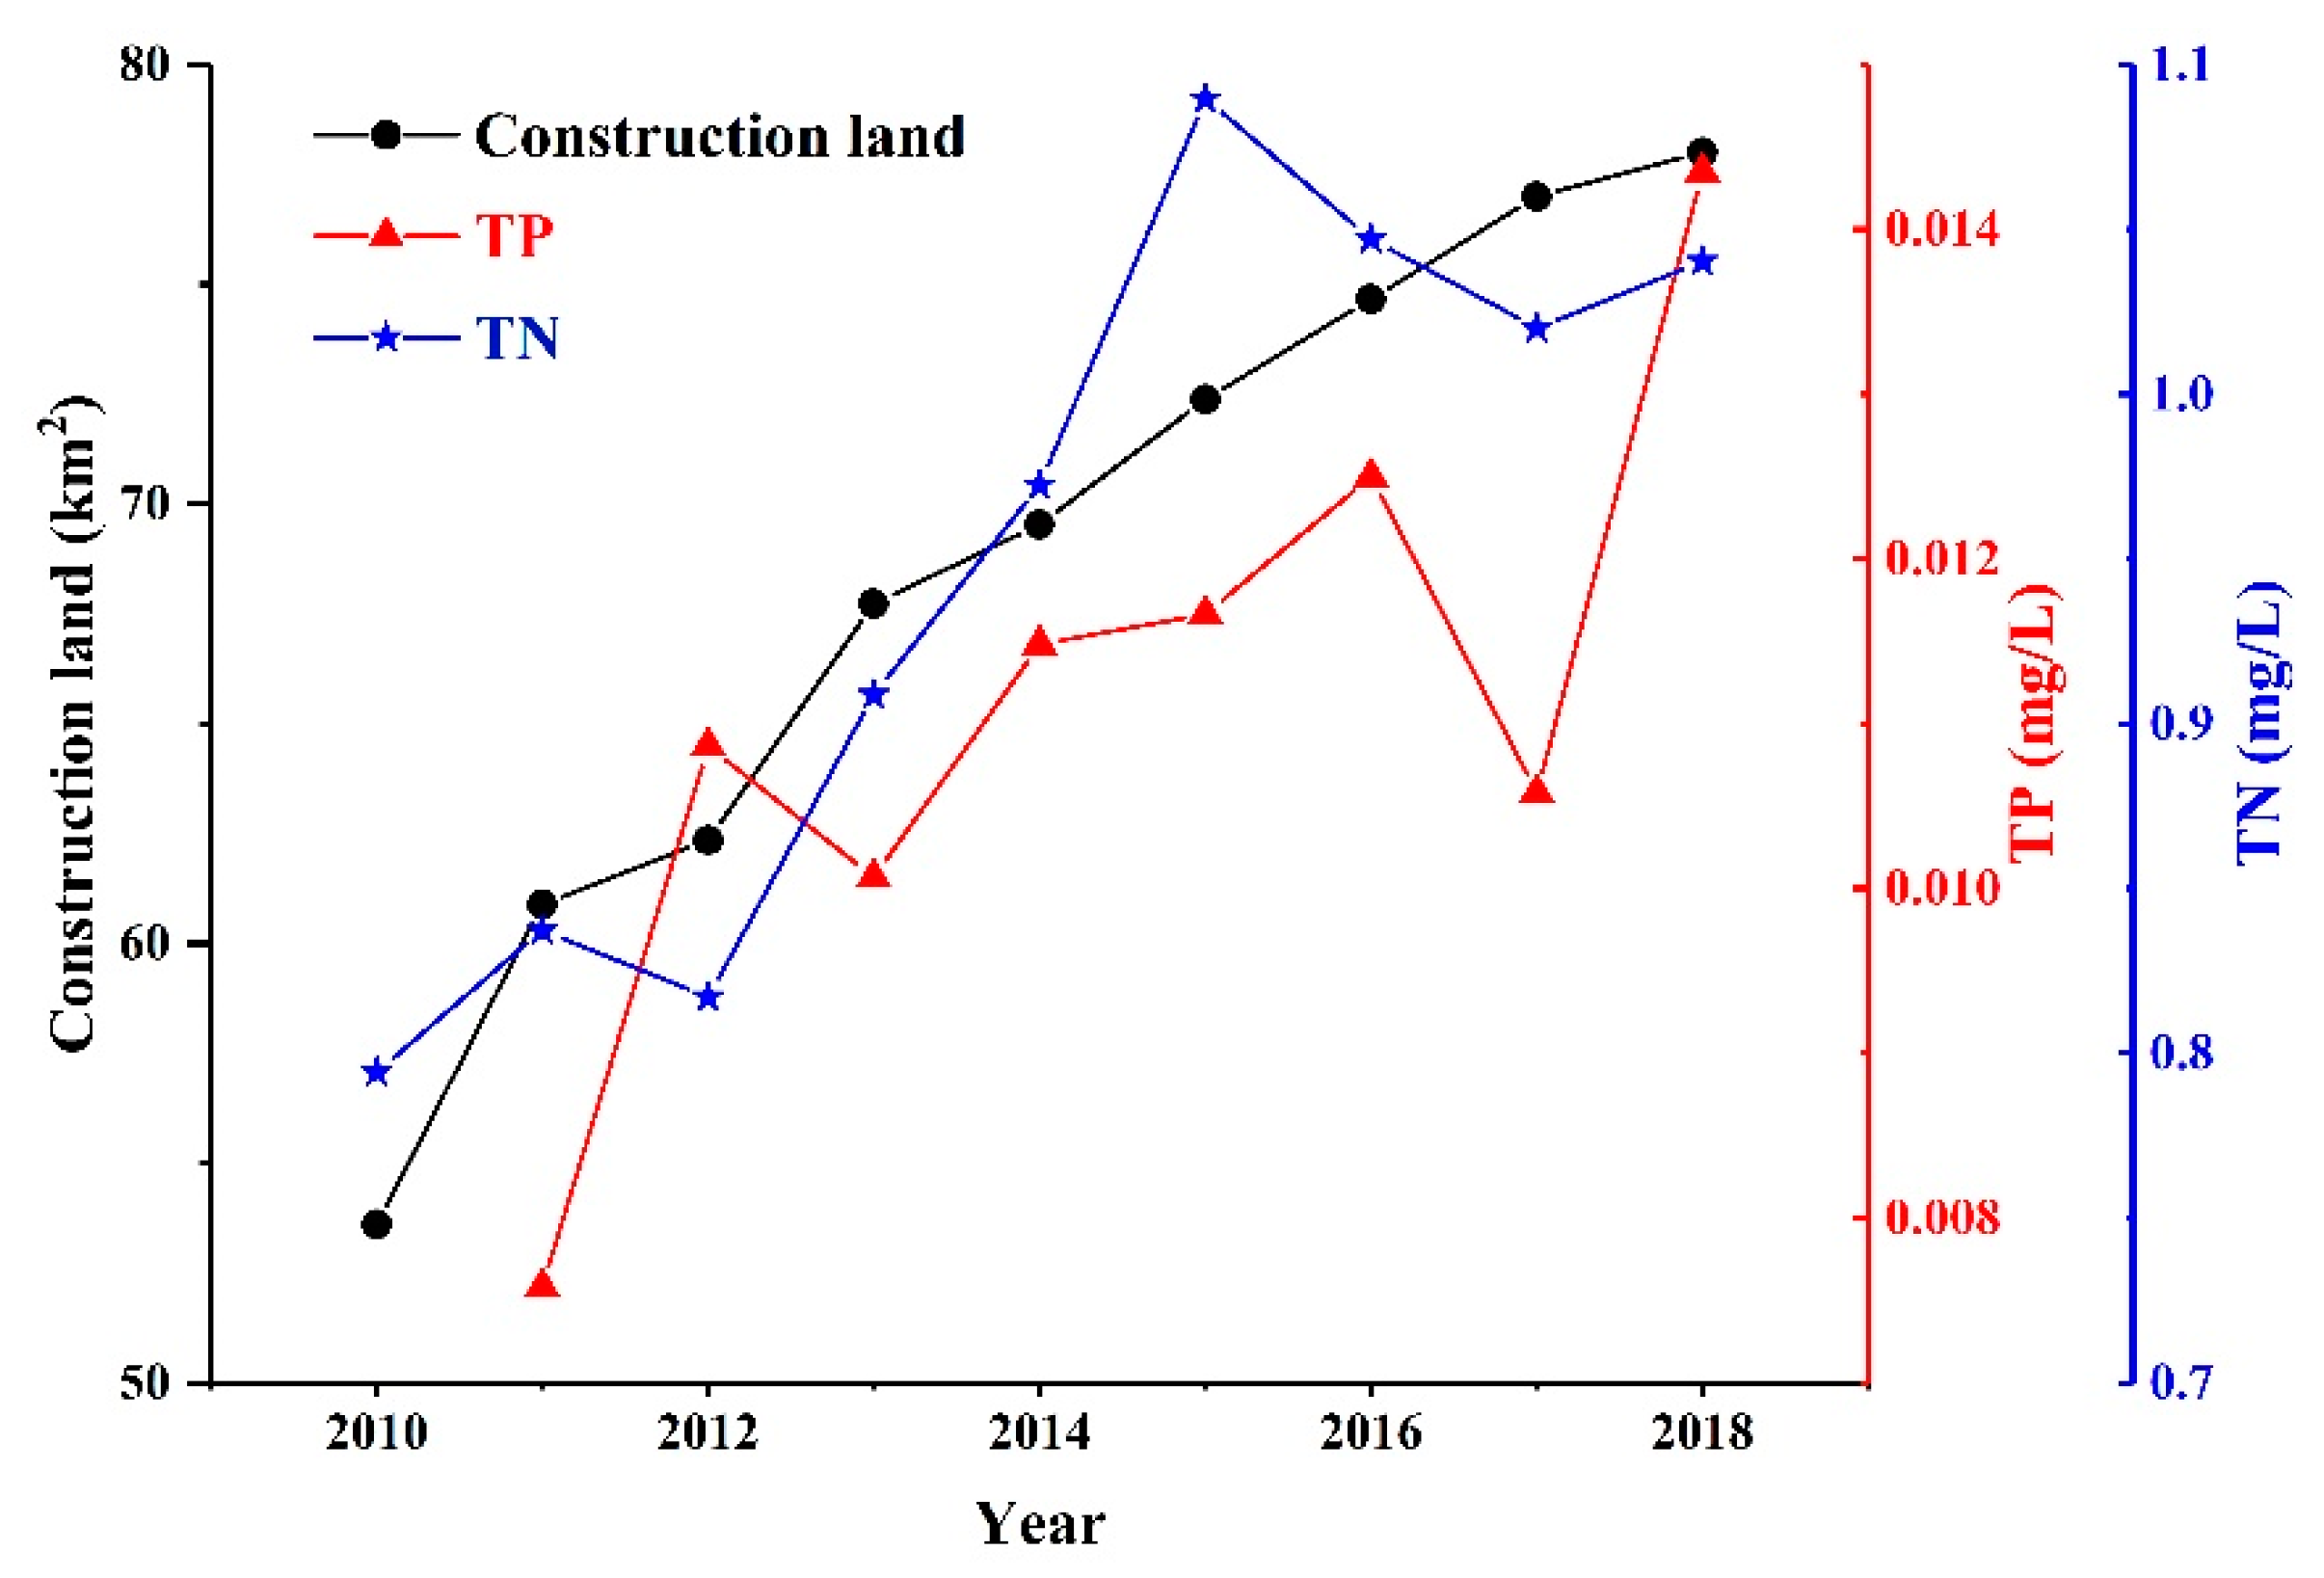
3.4. Effects of Human Activities on TN and TP

Previous studies on nutrients in lakes have indicated that human activities, including economic development, sewage discharge, urbanization and excessive use of chemical fertilizers, contribute to water eutrophication [7,40]. The gross domestic product (GDP), including primary industry (agriculture), secondary industry (industry), and tertiary industry (services), was used to analyze the contribution of human activities to water eutrophication. As shown in Figure 8, TN exhibited a higher correlation with primary and tertiary industries than with secondary industry; the correlation coefficient of TN with primary, secondary, and tertiary industries can reach 0.66, 0.59, and 0.69, respectively. TP exhibited a strong correlation with the primary industry (R2 = 0.63, p < 0.05); however, it showed a weak correlation with secondary and tertiary industries (Figure 8).
Agricultural pollution is a vital factor influencing water eutrophication. Due to the natural solubility of nitrates, agriculture sewage contains a large amount of N. It is estimated that sewage contributes 33% of the riverine environment in China [41]. However, phosphorus is a relatively immobile element and may be carried to streams through soil erosion and surface runoff from excessively fertilized agricultural fields. Phosphorus generally enters the aquatic ecosystem adhered to soil particles and is strongly influenced by watershed land use and the concentration of P in watershed soil [8]. In water bodies, phosphorus can occur in many forms, and all forms of phosphorus are not directly available to plants. Previous studies have revealed that surface water bodies near agricultural land, cities, and fertilizer units are prone to P enrichment, which promotes excessive algal blooms [42,43,44]. Agricultural (including livestock agriculture) sources of nonpoint source pollution have the largest impact on water pollution in Lake Qiandaohu because such pollution is more extensive and difficult to control [29,37,44]. Therefore, the rapid growth and intensification of crop and animal farming in the Lake Qiandaohu basin have created an imbalance in N and P inputs and outputs, which has led to regional surpluses in N and P inputs.
Urbanization or construction land area changes may be necessary for economic development. However, these changes usually lead to environmental degradation, such as excessive enrichment of nutrients in water bodies [7,45]. TN and TP showed a strong positive correlation with the construction land area, with a correlation coefficient reaching 0.91 and 0.75 (p < 0.05), respectively (Figure 9). The reasons may be that urbanization has changed the structure and nature of land use, damaged water and soil resources, exacerbated soil loss, and sediment carried a large amount of nutrients into the water body, leading to the accumulation of TN and TP. Moreover, large amounts of chemical fertilizers applied to croplands to maintain the growth of agricultural yield end up entering the freshwater system, causing degradation of water quality and eutrophication of lakes, rivers, and groundwater [7]. Additionally, under some conditions, up to 50% of the N fertilizers applied to the soil can be lost to the atmosphere by volatilization [46]. A portion of the volatilized ammonia is deposited in waterways through atmospheric deposition.
Aquaculture is another growing source of TN and TP pollution in Lake Qiandaohu. Aquaculture operations produce between 44 and 66 kg of TN waste per ton of fish [20], which results in 440–660 tons of TN waste (according to the Chun’an County statistical yearbook of 2017, the county’s annual output is more than 10,000 tons of fresh fish). Fortunately, the managers of Lake Qiandaohu have introduced nearly 1000 tons of silver and bighead carp, which mainly feed on phytoplankton, to control water eutrophication. As a result, the biomass of silver and bighead carp has increased from 500 tons in 1999 to 800 tons in 2010, a total increase of 60% [25]. This effective management practice has changed the nutrient levels in Lake Qiandaohu, especially by lowering the P levels because P is the limiting factor for phytoplankton growth.

4. Conclusions

The trophic state of the Lake Qiandaohu was determined as mesotrophic based on TN, TP, Chl-α, and Secchi disk. Spatially, TN and TP concentrations exhibited significant variations across the five sub-lake zones, and their values were relatively higher in the NW lake zone than the other sub-lake zones. Temporally, TN concentration exhibited weak correlations with years in the NW (R2 = 0.37, p < 0.05) and NE (R2 = 0.43, p < 0.05) lake zones and significant and positive correlations with years in the SW (R2 = 0.62, p < 0.05), SE (R2 = 0.79, p < 0.05), and C (R2 = 0.84, p < 0.05) lake zones. TP concentration exhibited decreasing trends in all lake zones except the NW lake zone (R2 = 0.37, p < 0.05).
The contribution of human activities, including GDP, urbanization, agriculture nonpoint source, and aquaculture to the excessive enrichment of nutrients in water bodies was drastic. The nitrogen pollution shows a high level, while phosphorus exhibits a relatively low level and is the restrictive factor to algal growth in the Lake Qiandaohu. Consequently, more attention needs to be paid to phosphorus reduction for eutrophication management.

Author Contributions

Conceptualization, L.Z. and Y.Z.; methodology, L.Z.; methodology, L.Z.; software, X.L.; validation, L.Z. and P.Z.; formal analysis, L.Z. and P.Z.; investigation, L.Z. and Y.Z.; resources, X.Z. (Xiaoming Zhang); data curation, L.Z. and X.Z. (Xiang Zhao); writing—original draft preparation, L.Z.; writing—review and editing, L.Z.; visualization, P.Z.; supervision, X.W. and X.Z. (Xiaoming Zhang).; project administration, L.Z.; funding acquisition, X.Z. (Xiaoming Zhang). All authors have read and agreed to the published version of the manuscript.

Funding

This research was funded by the National Natural Science Foundation of China, grant number [51879281 & 51979290], the Open Research Funds of State Key Laboratory of Simulation and Regulation of Water Cycle in River Basin, China Institute of Water Resources and Hydropower Research [SKL2018CG04] and IWHR Research & Development Support Program [SE0145B132020].

Acknowledgments

We wish to express our gratitude to the Forestry and Water Conservancy Agency of Hangzhou for funding the collaboration that generated this manuscript. We are grateful to the three anonymous reviewers and the assistant editor for their numerous suggestions to improve the quality of this work.

Conflicts of Interest

The authors declare that they have no known competing financial interests or personal relationships that could have appeared to influence the work reported in this paper.

References

  1. Qin, B.; Zhu, G.; Gao, G.; Zhang, Y.; Wei, L.; Paerl, H.W.; Carmichael, W.W. A Drinking Water Crisis in Lake Taihu, China: Linkage to Climatic Variability and Lake Management. J. Environ. Manag. 2010, 45, 105–112. [Google Scholar] [CrossRef] [PubMed]
  2. Smith, V.H.; Tilman, G.D.; Nekola, J.C. Eutrophication: Impacts of excess nutrient inputs on freshwater, marine, and terrestrial ecosystems. Environ. Pollut. 1999, 100, 179–196. [Google Scholar] [CrossRef]
  3. Tundisi, J.G.; Matsumuratundisi, T. Integration of research and management in optimizing multiple uses of reservoirs: The experience in South America and Brazilian case studies. Hydrobiology 2003, 500, 231–242. [Google Scholar] [CrossRef]
  4. Dunck, B.; Felisberto, S.A.; Nogueira, I.d.S. Effects of freshwater eutrophication on species and functional beta diversity of periphytic algae. Hydrobiology 2019, 837, 195–204. [Google Scholar] [CrossRef]
  5. Feng, L.; Hou, X.; Zheng, Y. Monitoring and understanding the water transparency changes of fifty large lakes on the Yangtze Plain based on long-term MODIS observations. Remote Sens. Environ. 2019, 221, 675–686. [Google Scholar] [CrossRef]
  6. Wurtsbaugh, W.A.; Paerl, H.W.; Dodds, W.K. Nutrients, eutrophication and harmful algal blooms along the freshwater to marine continuum. Wiley Interdiscip. Rev. Water. 2019, 6, e1373. [Google Scholar] [CrossRef]
  7. Huang, C.; Wang, X.; Yang, H.; Li, Y.; Wang, Y.; Chen, X.; Xu, L. Satellite data regarding the eutrophication response to human activities in the plateau lake Dianchi in China from 1974 to 2009. Sci. Total Environ. 2014, 485–486, 1–11. [Google Scholar] [CrossRef]
  8. Ansari, A.A.; Gill, S.S. Eutrophication: Causes, Consequences and Control II; Springer Science + Business Media: Dordrecht, The Netherlands, 2014. [Google Scholar] [CrossRef]
  9. Longyang, Q. Assessing the effects of climate change on water quality of plateau deep-water lake—A study case of Hongfeng Lake. Sci. Total Environ. 2019, 647, 1518–1530. [Google Scholar] [CrossRef]
  10. Lu, X.; Lu, Y.; Chen, D.; Su, C.; Song, S.; Wang, T.; Tian, H.; Liang, R.; Zhang, M.; Khan, K. Climate change induced eutrophication of cold-water lake in an ecologically fragile nature reserve. J. Environ. Sci. 2019, 75, 359–369. [Google Scholar] [CrossRef]
  11. Rabalais, N.N.; Turner, R.E.; Díaz, R.J.; Justić, D. Global change and eutrophication of coastal waters. Ices. J. Mar. Sci. 2009, 66, 1528–1537. [Google Scholar] [CrossRef]
  12. Smith, V.H.; Schindler, D.W. Eutrophication science: Where do we go from here? Trends Ecol. Evol. 2009, 24, 201–207. [Google Scholar] [CrossRef] [PubMed]
  13. Dodds, W.K.; Bouska, W.W.; Eitzmann, J.L.; Pilger, T.J.; Pitts, K.L.; Riley, A.J.; Schloesser, J.T.; Thornbrugh, D.J. Eutrophication of U.S. freshwaters: Analysis of potential economic damages. Environ. Sci. Technol. 2009, 43, 12–19. [Google Scholar] [CrossRef] [PubMed] [Green Version]
  14. Liu, W.; Zhang, Q.; Liu, G. Lake eutrophication associated with geographic location, lake morphology and climate in China. Hydrobiology 2010, 644, 289–299. [Google Scholar] [CrossRef]
  15. Hickel, W.; Mangelsdorf, P.; Berg, J. The human impact in the German Bight: Eutrophication during three decades (1962–1991). Helgol. J. Mar. Res. 1993, 47, 243–263. [Google Scholar] [CrossRef] [Green Version]
  16. Liu, M.; Zhang, Y.; Shi, K.; Zhu, G.; Wu, Z.; Liu, M.; Zhang, Y. Thermal stratification dynamics in a large and deep subtropical reservoir revealed by high-frequency buoy data. Sci. Total Environ. 2019, 651, 614–624. [Google Scholar] [CrossRef]
  17. Bennett, E.M.; Carpenter, S.R.; Caraco, N.F. Human Impact on Erodable Phosphorus and Eutrophication: A Global Perspective. Bioscience 2009, 51, 227–234. [Google Scholar] [CrossRef]
  18. Carpenter, S.R. Eutrophication of Aquatic Ecosystems: Bistability and Soil Phosphorus. Proc. Natl. Acad. Sci. USA 2005, 102, 10002–10005. [Google Scholar] [CrossRef] [Green Version]
  19. Food and Agriculture Organization (FAO); Fisheries and Aquaculture Information and Statistics Service. Aquaculture Production: Quantities 1950–2005. FISHSTAT Plus-Universal Software for fishery Statistical Time Series; FAO: Rome, Italy, 2007; Available online: http://www.fao.org/fishery/statistics/software/en (accessed on 1 December 2019).
  20. Strain, P.M.; Hargrave, B.T. Salmon Aquaculture, Nutrient Fluxes and Ecosystem Processes in Southwestern New Brunswick. In Handbook of Environmental Chemistry; Springer: Berlin/Heidelberg, Germany, 2005; Volume 5M, pp. 29–57. [Google Scholar] [CrossRef]
  21. Holmgren, P. Global Land Use Change Matrix; FAO: Rome, Italy, 2006; Available online: www.fao.org/3/ag049e/AG049E03.htm (accessed on 20 March 2020).
  22. Mo, Q.; Chen, N.; Zhou, X.; Chen, J.; Duan, S. Ammonium and phosphate enrichment across the dry–wet transition and their ecological relevance in a subtropical reservoir, China. Environ. Sci. Processes Impacts. 2016, 18, 882–894. [Google Scholar] [CrossRef]
  23. Fernanda, W.; Enner, A.; Thanan, R.; Nilton, I.; Cláudio, B.; Luiz, R. Estimation of Chlorophyll-a Concentration and the Trophic State of the Barra Bonita Hydroelectric Reservoir Using OLI/Landsat-8 Images. Int. J. Environ. Res. Publ. Health. 2015, 12, 10391–10417. [Google Scholar] [CrossRef]
  24. Li, Y.; Zhang, Y.; Shi, K.; Zhou, Y.; Zhang, Y.; Liu, X.; Guo, Y. Spatiotemporal dynamics of chlorophyll-a in a large reservoir as derived from Landsat 8 OLI data: Understanding its driving and restrictive factors. Environ. Sci. Pollut. Res. 2017, 25, 1–16. [Google Scholar] [CrossRef]
  25. Li, Y.; Zhang, Y.; Shi, K.; Zhu, G.; Zhou, Y.; Zhang, Y.; Guo, Y. Monitoring spatiotemporal variations in nutrients in a large drinking water reservoir and their relationships with hydrological and meteorological conditions based on Landsat 8 imagery. Sci. Total Environ. 2017, 599–600, 1705–1717. [Google Scholar] [CrossRef] [PubMed]
  26. Wu, Z.; Zhang, Y.; Zhou, Y.; Liu, M.; Shi, K.; Yu, Z. Seasonal-Spatial Distribution and Long-Term Variation of Transparency in Xin’anjiang Reservoir: Implications for Reservoir Management. Int. J. Environ. Res. Public Health 2015, 12, 9492–9507. [Google Scholar] [CrossRef] [PubMed]
  27. Han, X.; Zhu, G.Z.; Wu, Z.; Chen, W.; Zhu, M. Spatial-temporal variations of water quality parameters in Xin’anjiang Reservoir (Lake Qiandao) and the water protection strategy. J. Lake Sci. 2013, 25, 836–845. [Google Scholar]
  28. Zhang, Y.; Wu, Z.; Liu, M.; He, J.; Yu, Z. Thermal structure and response to long-term climatic changes in Lake Qiandaohu, a deep subtropical reservoir in China. Limnol. Oceanogr. 2015, 59, 1193–1202. [Google Scholar] [CrossRef]
  29. Wang, X.L.; Wang, Q.; Wu, C.Q.; Liang, T.; Zheng, D.H.; Wei, X.F. A method coupled with remote sensing data to evaluate non-point source pollution in the Xin’anjiang catchment of China. Sci. Total Environ. 2012, 430, 132–143. [Google Scholar] [CrossRef]
  30. Lee, J.H.; Kim, J.M.; Kim, D.S.; Hwang, S.J.; An, K.G. Nutrients and chlorophyll- a dynamics in a temperate reservoir influenced by Asian monsoon along with in situ nutrient enrichment bioassays. Limnology 2010, 11, 49–62. [Google Scholar] [CrossRef]
  31. Gaiser, E.E.; Deyrup, N.D.; Bachmann, R.W.; Battoe, L.E.; Swain, H.M. Effects of climate variability on transparency and thermal structure in subtropical, monomictic lake annie, florida. Fundam. Appl. Limnol. 2009, 175, 217–230. [Google Scholar] [CrossRef]
  32. Naumenko, M.A. Seasonality and trends in the Secchi disk transparency of Lake Ladoga. Hydrobiology 2008, 599, 59–65. [Google Scholar] [CrossRef]
  33. Vollenweider, R.A.; Kerekes, J. The loading concept as a basis for controlling eutrophication philosophy and preliminary result of the OECD programme on eutrophication. Progr. Water. Technol. 1980, 12, 5–38. [Google Scholar] [CrossRef]
  34. OECD. Eutrophication of Waters: Monitoring, Assessment and Control; Final Report; OECD Cooperative Program on Monitoring of Inland Waters (Eutrophication Control, Environment Directorate) OECD: Paris, France, 1982. [Google Scholar]
  35. Smith, V.H. The Nitrogen and Phosphorus Dependence of Algal Biomass in Lakes: An Empirical and Theoretical. Anal. Limnol. Oceanogr. 1982, 27, 1101–1112. [Google Scholar] [CrossRef]
  36. Du, L.N.; Li, Y.; Chen, X.Y.; Yang, J.X. Effect of eutrophication on molluscan community composition in the Lake Dianchi (China, Yunnan). Limnology 2011, 41, 213–219. [Google Scholar] [CrossRef] [Green Version]
  37. Gong, Z.J.; Li, Y.L.; Shen, J.; Xie, P. Diatom community succession in the recent history of a eutrophic Yunnan Plateau lake, Lake Dianchi, in subtropical China. Limnology 2009, 10, 247–253. [Google Scholar] [CrossRef]
  38. Yan, C.; Che, F.; Zeng, L.; Wang, Z.; Du, M.; Wei, Q.; Wang, Z.; Wang, D.; Zhen, Z. Spatial and seasonal changes of arsenic species in Lake Taihu in relation to eutrophication. Sci. Total. Environ. 2016, 563–564, 496–505. [Google Scholar] [CrossRef] [PubMed]
  39. Zhu, G.; Cui, Y.; Han, X.; Li, H.; Zhu, M.; Deng, J.; Li, H.; Chen, W. Response of phytoplankton to nutrient reduction in Shahe Reservoir, Taihu catchment, China. J. Freshw. Ecol. 2015, 30, 41–58. [Google Scholar] [CrossRef] [Green Version]
  40. Duan, H.T.; Ma, R.H.; Xu, X.F.; Kong, F.X.; Zhang, S.X.; Kong, W.J.; Hao, J.Y.; Shang, L.L. Two-Decade Reconstruction of Algal Blooms in China’s Lake Taihu. Environ. Sci. Technol. 2009, 43, 3522–3528. [Google Scholar] [CrossRef] [PubMed]
  41. Wang, M.; Chen, H.; Zhang, W.; Wang, K. Soil nutrients and stoichiometric ratios as affected by land use and lithology at county scale in a karst area, southwest China. Sci. Total. Environ. 2018, 619–620, 1299–1307. [Google Scholar] [CrossRef]
  42. Pickhardt, P.C.; Folt, C.L.; Chen, C.Y.; Klaue, B.; Blum, J.D. Algal blooms reduce the uptake of toxic methylmercury in freshwater food webs. PNAS 2002, 99, 4419–4423. [Google Scholar] [CrossRef] [Green Version]
  43. Shumway, S.E. A Review of the Effects of Algal Blooms on Shellfish and Aquaculture. J. World. Aquacult. Soc. 2007, 21, 65–104. [Google Scholar] [CrossRef]
  44. Wen, J.; Luo, D.Q.; Luo, X.B.; Tang, D.J.; Chen, S.P. Agriculture Non-point Source Pollution and Control Measures of Qiandao Lake Area. J. Soil Water Conserv. 2004, 18, 126–129. [Google Scholar] [CrossRef]
  45. Mekonnen, M.M.; Hoekstra, A.Y. Global Gray Water Footprint and Water Pollution Levels Related to Anthropogenic Nitrogen Loads to Fresh Water. Environ Sci Technol. 2015, 49, 12860–12868. [Google Scholar] [CrossRef]
  46. Baechle, B.; Davis, A.S.; Pittelkow, C.M. Potential Nitrogen Losses in Relation to Spatially Distinct Soil Management History and Biochar Addition. J. Environ. Qual. 2017, 47, 62–69. [Google Scholar] [CrossRef] [PubMed] [Green Version]
Figure 1. Locations of Lake Qiandaohu and the sampling sites. The numbers represent the sites as follows: 1 = Jiekou, 2 = Weipinglingchang, 3 = Xiaojinshan, 4 = Hangtoudao, 5 = Maotoujian, 6 = Baimufan, 7 = Pailingshuichang, 8 = Xiyuan, 9 = Laoshanchukou, 10 = Santandao, 11 = Maozhuyuan, 12 = Dabaqian. Sampling sites 1-3 were grouped into the northwest lake zone, sampling sites 5–6 were grouped into the southwest lake zone, sampling site 4 was grouped into the northeast lake zone, sampling sites 11–12 were grouped into the southeast lake zone, and sampling sites 7–10 were grouped into the central lake zone.
Water 12 01106 g001
Figure 2. Long-term trends in total nitrogen (TN) among the five sub-lake zones from 2001 to 2018. Note: Red dotted line indicates the trend of mean TN concentration in the whole lake area.
Water 12 01106 g002
Figure 3. Linear fitting of TN among the five sub-lake zones and the whole lake zone.
Water 12 01106 g003
Figure 4. Long-term trends in total phosphorus (TP) among the five sub-lake zones from 2001 to 2018.
Water 12 01106 g004
Figure 5. Linear fitting of TP among the five lake zones and the whole lake zone.
Water 12 01106 g005
Figure 6. Spatial distributions of TN in Lake Qiandaohu from 2001 to 2018. Note: a refers to the year.
Water 12 01106 g006
Figure 7. Spatial distributions of TP in Lake Qiandaohu from 2001 to 2018. Note: a refers to the year.
Water 12 01106 g007
Figure 8. Correlations among TN, TP, and gross domestic product (GDP) from 2001 to 2018. TN = 0.010 × GDP + 0.65, R2 = 0.66, p < 0.05 for primary industry; TN = 0.0037 × GDP + 0.70, R2 = 0.59, p < 0.05 for secondary industry; TN = 0.0025 × GDP + 0.74, R2 = 0.69, p < 0.05 for tertiary industry; TP = −2.58 × 10⁻⁴ × GDP + 0.0031, R2 = 0.63, p < 0.05 for primary industry; TP = 7.80 × 10⁻⁵ × GDP + 0.0054, R2 = 0.17, p > 0.05 for secondary industry; and TP = −3.74 × 10⁻⁵ × GDP + 0.0076, R2 = 0.071, p < 0.05 for tertiary industry.
Water 12 01106 g008
Figure 9. Correlations among construction land, TN, and TP. The correlation coefficient between TN and construction land is 0.91, p < 0.05, and the correlation coefficient between TP and construction land is 0.75, p < 0.05.
Water 12 01106 g009
Table 1. Summary of the nutrient concentrations in the five sub-lake zones from 2001 to 2018.
RegionStatistical FactorTN
(mg/L)
TP
(mg/L)
Chl-α (mg/m3)Secchi Disk (m)TN:TPTrophic State
NW lake zone
(N = 18)
Max ± SD1.39 ± 0.150.033 ± 0.01611.33 ± 3.303.91 ± 1.0277.14 ± 17.83Mesotrophic
Min ± SD0.91 ± 0.140.011 ± 0.0053.00 ± 1.412.53 ± 0.5640.81 ± 9.11
Mean ± SD1.14 ± 0.120.020 ± 0.0088.30 ± 2.343.09 ± 0.6658.22 ± 16.27
NE lake zone
(N = 18)
Max1.160.0197.004.67140.00Oligotrophic
Min0.740.0072.002.7245.63
Mean0.900.0124.063.6274.70
SW lake zone
(N = 18)
Max ± SD0.87 ± 0.010.027 ± 0.0287.50 ± 2.54.10 ± 1.40137.27 ± 10.00Oligotrophic
Min ± SD0.56 ± 0.080.009 ± 0.0034.67 ± 2.222.98 ± 0.9527.96 ± 9.23
Mean ± SD0.71 ± 0.030.013 ± 0.0073.00 ± 1.003.47 ± 1.4153.15 ± 4.64
SE lake
zone
(N = 18)
Max ± SD1.06 ± 0.160.014 ± 0.0036.50 ± 0.507.43 ± 0.27160.91 ± 10.00Oligotrophic
Min ± SD0.55 ± 0.060.006 ± 0.0011.00 ± 0.004.44 ± 0.2449.55 ± 22.50
Mean ± SD0.80 ± 0.040.008 ± 0.0013.25 ± 0.475.94 ± 0.2799.66 ± 33.16
C lake
zone
(N = 18)
Max ± SD1.07 ± 0.060.014 ± 0.0057.75 ± 2.685.95 ± 1.14128.93 ± 21.17Mesotrophic
Min ± SD0.62 ± 0.110.008 ± 0.0012.33 ± 0.473.99 ± 0.3545.09 ± 23.31
Mean ± SD0.85 ± 0.070.010 ± 0.0025.00 ± 1.394.88 ± 0.8586.92 ± 35.81
Whole lake zone
(N = 90)
Max ± SD1.39 ± 0.150.033 ± 0.0167.45 ± 3.425.04 ± 1.01160.91 ± 10.00Mesotrophic
Min ± SD0.55 ± 0.060.006 ± 0.0012.83 ± 1.003.78 ± 0.5727.93 ± 9.23
Mean ± SD0.88 ± 0.050.013 ± 0.0045.05 ± 1.614.20 ± 0.7974.34 ± 17.94
Note: Max = maximum, Min = minimum, SD = standard deviation.

