Impact of Hydrogen Peroxide and Copper Sulfate on the Delayed Release of Microcystin
by

Arash Zamyadi
1,2,*, 
Katherine E. Greenstein
3,
Caitlin M. Glover
4,
Craig Adams
5,
Erik Rosenfeldt
6 and
Eric C. Wert
3 1
Water Research Australia (WaterRA), Adelaide, SA 5001, Australia
2
BGA Innovation Hub and Water Research Centre, School of Civil and Environment Engineering, University of New South Wales (UNSW), Sydney, NSW 2052, Australia
3
Southern Nevada Water Authority (SNWA), Las Vegas, NV 89193-9954, USA
4
Department of Civil Engineering, McGill University, Montreal, QC H3A 0G4, Canada
5
Department of Civil Engineering, Saint Louis University, St. Louis, MO 63103, USA
6
Hazen and Sawyer, Raleigh, NC 27607, USA
*
Author to whom correspondence should be addressed.
Water 2020, 12(4), 1105; https://doi.org/10.3390/w12041105
Submission received: 31 January 2020
/
Revised: 3 April 2020
/
Accepted: 7 April 2020
/
Published: 13 April 2020
(This article belongs to the Special Issue Treatment and Risk Assessment of Algae in Water)
Abstract
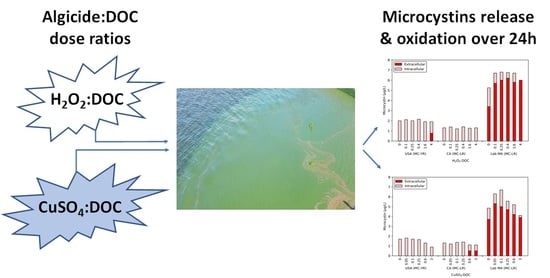
:Algicides, like hydrogen peroxide and copper sulfate, are commonly applied to recreational waters and drinking water sources to mitigate cyanobacterial blooms. In this work, the effects of hydrogen peroxide and copper sulfate were evaluated in two natural bloom samples (collected from Canadian and American waterbodies) and one lab-cultured Microcystis aeruginosa suspended in Colorado River water. Five algicide to dissolved organic carbon (DOC) dose ratios were evaluated during an initial exposure period of 24 h. One dose ratio (0.4 H2O2:DOC or 0.25 CuSO4:DOC) was then evaluated during stagnation after quenching (hydrogen peroxide) or extended exposure (copper sulfate) for up to 96 or 168 h. During the initial hydrogen peroxide exposure, the CA bloom had no release of intracellular microcystins (MCs) and the USA bloom only released MC at 4 H2O2:DOC. The reverse occurred with copper sulfate, where the CA bloom released MCs at 0.6 CuSO4:DOC but the USA bloom had no detectable extracellular MCs. Extracellular MC was released from the lab-cultured Microcystis at the lowest hydrogen peroxide and copper sulfate doses. In the hydrogen peroxide stagnation experiment, intracellular MC decreased in the USA bloom after 168 h despite the low dose applied. Similarly, the extended copper sulfate exposure led to intracellular MC decreases in both bloom samples after 168 h, despite showing no impact during the initial 24 h monitoring period. The lab-cultured Microcystis was again less resistant to both algicides, with releases observed after less than 2 h of stagnation or exposure. The damage to cells as measured by pigments during these experiments did not match the MC data, indicating that blooms with depressed pigment levels can still be a risk to nearby drinking water sources or recreational activities. These results provide insight on the timeline (up to one week) required for monitoring the potential release of MCs after algicide application.
1. Introduction
Climate change and human activities have increased the occurrence and severity of cyanobacterial blooms in surface waters used for drinking water, agriculture, and recreation [1,2,3,4]. These blooms represent a threat to both ecological and human health when present in surface waters as a result of the biomass and the release of harmful intracellular metabolites, i.e., cyanotoxins [5,6]. The algal biomass in surface waters prevents light from reaching other phytoplankton, the increased turbidity affects the growth of macrophytes that provide fish and aquatic species habitats, and bacterial degradation of the bloom during die off can result in hypoxia and anoxia [1,7,8]. Cyanotoxins are secondary metabolites that can be released during normal cell die off as well as following external stress events. The most commonly detected cyanotoxins are microcystins (MCs), which are a group of monocyclic heptapeptides with more than 100 congeners [9]. In humans, MCs can cause gastroenteritis, liver toxicity, neurologic effects, and cytotoxicity, and have been linked to cancer [5,10,11]. As a result of the potential human health effects of MCs, many regulatory bodies have implemented health advisories for drinking and recreational waters. The drinking water health advisories include MC-LR limits of 1.0 [12], 1.5 [13], and 0.3 µg/L for bottle-fed infants and 1.6 µg/L for school-age children to adults [14]. Given the exposure route, recreational water guidelines are less stringent, i.e., MC-LR limits of 20 [15] and 8 μg/L [16].
In surface waters, cyanobacterial blooms can be mitigated by implementing physical (e.g., artificial destratification, aeration, mixing, and flushing) or chemical (e.g., nutrient reduction strategies, coagulation of cells, and treatment with algicides) strategies [1,17]. Copper sulfate is a commonly applied algicide due to the ease of application, low cost, and efficacy. Depending on the concentration used, copper sulfate can inactivate cells and/or produce cell lysis [18]. When lysis occurs, the released MCs are of significant concern because they will not be oxidized by copper sulfate [19,20]. Previous studies have focused on determining the dose at which no MCs will be released [20,21,22]; however, these studies were limited in that the data focus on monocultures grown in the lab, specifically Microcystis aeruginosa (MA).
Hydrogen peroxide is an algicide that is favored because it decomposes into non-toxin byproducts, oxygen and water. Field applications of hydrogen peroxide have successfully suppressed the growth of cyanobacteria in lakes in the Netherlands [23] and China [24] as well as a waste-stabilization pond in Australia [25]. At the lab scale and in field applications, phytoplankton (e.g., green algae, cryptophytes, chrysophytes, and diatoms) were more resistant to hydrogen peroxide relative to the cyanobacteria, reinforcing its suitability for the treatment of recreational and drinking water source waters [23,26,27]. Although hydrogen peroxide itself induces limited cell damage for lab-cultured MA, the introduction of either UV or visible light leads to the formation of hydroxyl radical (OH•) [28,29]. Hydroxyl radical is a non-selective and highly reactive oxidant that has the potential to cause cell lysis and degrade MCs [29,30,31].
In this work, the impact of hydrogen peroxide and copper sulfate on the release of intracellular MCs was evaluated in two naturally occurring blooms and one lab-cultured MA. The main objectives of this work were to 1) establish the doses required for release of intracellular MC after 24 h exposure to hydrogen peroxide and copper sulfate and 2) evaluate the effect of extended exposure (copper sulfate) or stagnation post-exposure (hydrogen peroxide) on cell viability and release of MCs. This is the first study to systemically evaluate the impact various doses of hydrogen peroxide and copper sulfate have on natural blooms, as well as the impact of stagnation after oxidation and extended exposure.
2. Materials and Methods
2.1. Collection of Cyanobacterial Bloom Samples
The United States (USA) bloom sample was collected from Grand Lake St. Marys in Celina, OH, in October 2016 and shipped to SNWA on ice. The Canadian (CA) bloom was collected in the summer of 2016 from the Canadian side of Lake Champlain. Water was collected and transported to Polytechnique Montréal on ice. Water quality parameters (dissolved organic carbon (DOC), intra- and extracellular MCs, pH, pigment, cyanobacteria identification and enumeration) were determined within the hold times for individual parameters and algicide experiments were started within three days of receipt of the bloom samples.
2.2. Culturing and Suspension of Microcystis Aeruginosa
A unicellular culture of MA (LB 2385, UTEX Culture Collection) was selected for these experiments as it is known to produce MC-LR [32]. Cells were cultured in Bold3N media for a month before being centrifuged three times and rinsed with 10 mM phosphate buffer at pH of 7.5. Cells for the experiment were spiked into a sample of Colorado River water (CRW) at a concentration of 1 × 10⁶ cells/mL to mimic the concentration found in the natural blooms. The CRW sample was collected from the inlet to Lake Mead in October of 2016 and water quality (DOC and pH) was determined within prescribed hold-times.
2.3. Water Quality Parameters
Water quality parameters, DOC and pH, were measured using Standard Methods 5310B and 4500-H+B (APHA, 2012). Pigments were measured as extracted chlorophyll-a (chl-a) for the USA bloom and lab-cultured MA or phycocyanin (PC) for the CA bloom. Chl-a was determined via SM 10200 H (APHA, 2012) and PC was measured with a Total Algae sensor on a YSI EXO2 Multiparameter Sonde (YSI, Yellow Springs, OH, USA) [33,34,35]. The Total Algae sensor was blanked with deionized water and values were recorded as relative fluorescence units (RFU) as described in previous work [36].
USA bloom samples (one unpreserved and one preserved with 1% Lugol’s iodine) were sent to BSA Environmental Services (Beachwood, OH) for identification and enumeration via microscopy. CA bloom samples were similarly preserved and analyzed, but the work of identification and enumeration was completed at Polytechnique Montréal. To estimate the lab-cultured MA cell counts, a correlation between optical density at 730 nm and cell counts was established using a digital flow cytometer (FlowCAM, Fluid Imaging Technologies, Yarmouth, ME) as described in previous work [32]. Optical density was measured with a Hach DR 5000 spectrophotometer.
2.4. Detection of Intra- and Extracellular MCs
Prior to and following algicide exposure, total and extracellular MCs were detected. The total MC concentration was determined by lysing and sonicating the sample. To lyse the cells, 10 mL samples were frozen at −20 °C and thawed at 25 °C. Sonication was conducted with a probe sonicator (Q500, QSonica, Newtown, CT) for 5 min in pulses of 5 s on and 1 s off. The sonicator was dispensed at 20 kHz with 200 μm amplitude/tip displacement requiring ~30 W power. To prevent overheating of the sample and probe, samples were kept in an ice bath during the sonication period. The process of extracting total MCs did not degrade extracellular MCs during a control experiment wherein 20 μg/L MC-LR was spiked into CRW. Extracellular MCs were determined by filtering the sample with glass microfiber syringe filters, with a pore size of 0.45 μm, prior to analysis (Whatman, Little Chalfont, United Kingdom). To determine the concentration of intracellular MCs, the extracellular concentration was subtracted from the total MCs.
Initially, a total of eight microcystin congeners (MC-LA, MC-LF, MC-LR, MC-LW, MC-LY, MC-RR, MC-WR, and MC-YR) were monitored via liquid chromatography–tandem mass spectrometry (LC–MS/MS). However, after the initial screening, LC–MS/MS analysis narrowed in on the dominant congener in each sample, i.e., CA bloom and lab-cultured MA had MC-LR and the USA bloom had MC-YR. The method reporting limit (MRL) for each congener was 0.5 µg/L, as determined in previous work [37].
2.5. Application of Algicides to the Bloom Samples and Lab-Cultured MA
The impact of hydrogen peroxide and copper sulfate on the two bloom samples and the lab-cultured MA after an initial 24 h exposure was evaluated by changes observed in the DOC, pigment levels, and intra- and extracellular MCs. Hydrogen peroxide was added to the three cyanobacterial suspensions at algicide:DOC mass ratios of 0.1, 0.25, 0.4, 1.6, and 4 and allowed to react for 24 h in covered but uncapped amber glass bottles at room temperature. After exposure, samples were quenched with 100 mg/L of sodium thiosulfate. The hydrogen peroxide stock solution was prepared at a concentration of ~3500 mg/L in deionized water from a 30% stabilized hydrogen peroxide (Sigma Aldrich, Missouri, USA). The initial and residual hydrogen peroxide concentrations were monitored using a 5 cm cuvette and Hach DR 5000 spectrophotometer (Loveland, CO) [34]. Samples were filtered with glass microfiber filters, with a pore size of 0.45 μm, prior to analysis (Whatman, Little Chalfont, United Kingdom) to avoid matrix interference. Starting concentrations and residuals for the hydrogen peroxide experiments can be found in Table S1 of the Supplementary Information (SI). During the 24 h exposure, hydrogen peroxide degraded (Table S1) but, relative to previous work, this degradation was slow due to the absence of a light source [29,31].
Copper sulfate was added to the cyanobacterial suspensions at algicide:DOC mass ratios of 0.05, 0.1, 0.25, 0.6, and 3 and held for 24 h at room temperature in covered but uncapped amber glass bottles. A stock solution of copper sulfate (1000 mg/L as Cu) was prepared from copper pentahydrate (Acros Organics, New Jersey, USA) in deionized water. The concentration of total copper was measured with the EPA Method 200.7 via inductively coupled plasma optical emission spectrometry (U.S. EPA, 1994). For the USA bloom, samples were filtered with PES filters (Acrodisc, VWR), with a pore size of 0.45 μm, prior to acid digestion to determine the concentration of dissolved copper. After initial testing with the USA bloom showed no difference between total and dissolved copper, filtration was not applied to the lab-cultured MA or the CA bloom samples.
2.6. Stagnation after Hydrogen Peroxide Quenching and Extended Exposure to Copper Sulfate
Following an initial 24 h algicide exposure (a duplicate of that described in Section 2.5), the impact that stagnation had on the DOC, pigment, and intra- and extracellular MC was evaluated. For the hydrogen peroxide stagnation experiments, amber glass bottles with the cyanobacterial suspensions were exposed to 0.4 H2O2:DOC for up to 24 h. The USA bloom was accidentally quenched after only 20 min, but the CA bloom and lab-cultured MA samples were allowed to react for the full 24 h. After quenching with 100 mg/L sodium thiosulfate, time point samples were collected from <20 min up to 168 h. As copper sulfate cannot easily be removed or quenched, samples were exposed to a dose ratio of 0.25 CuSO4:DOC and then time point samples were collected from <20 min up to 168 h. All stagnation or extended exposure samples were stored at room temperature in covered but uncapped bottles to allow for the exchange of oxygen. Stagnation control experiments were undertaken for the USA bloom and the lab-cultured MA without any additions or with only sodium thiosulfate (SI Table S2). The sodium thiosulfate did not have a significant negative impact on the concentration of pigments, DOC, or the release of extracellular MCs, so the experiments were not repeated for the CA bloom.
3. Results and Discussion
3.1. Water Quality of Cyanobacterial Suspensions Prior to Algicide Exposure
A limited number of water quality parameters were collected for the three cyanobacterial suspensions prior to algicide exposure. The USA and CA bloom samples had 9.3 and 6.1 mg/L of DOC, respectively. The lab-cultured MA contained 2.5 mg/L of DOC from its CRW background, but this rose to 5.5 mg/L following cell addition. The background value was used to calculate algicide dosing concentrations. The USA and CA bloom samples had pH values of 7.9 and the lab cultured MA suspension had a pH of 8.
In the USA bloom, Planktothrix agardhii/suspensa (2.65 × 10⁶ cells/mL) and Planktolyngbya spp. (3.72 × 10⁵ cells/mL) were detected along with 1.85 ± 0.21 µg/L of intracellular MC-YR. Previous work at the sample site, Grand Lake St. Marys, has shown that the Planktothrix agardhii/suspensa is responsible for the production of MC-YR (Dumouchelle and Stelzer, 2014). The cyanobacteria detected in the CA bloom included Anabaena spiroides (1.58 × 10⁵ cells/mL), Aphanothece clathrata brevis (1.01 × 10⁵ cells/mL), and Microcystis aeruginosa (4.03 × 10⁴ cells/mL). The CA bloom’s MCs were also entirely intracellular prior to the start of experiments at a concentration of 1.3 ± 0.077 µg/L MC-LR. In contrast to these two bloom samples, the lab-cultured MA had 3.55 ± 0.21 µg/L of extracellular MC-LR prior to algicide exposure in addition to 1.5 ± 0.50 µg/L of intracellular MC-LR.
3.2. Impact of 24 h Exposure to Hydrogen Peroxide and Copper Sulfate on Cell Damage and Lysis
In this work, PC fluorescence (CA bloom) and extracted chl-a (USA bloom and lab-cultured MA) were used as proxies for the level of cell damage incurred in the presence of each algicide. Exposure to hydrogen peroxide can both reduce metabolic activity and ultimately result in cell lysis through the loss of cell membrane integrity [28]. Similarly, copper sulfate can inactivate cells and ultimately result in cell lysis [18].
As shown in Table 1, the maximum dose of hydrogen peroxide led to a small decrease for the lab-cultured MA’s chl-a (−9.5%), whereas the USA bloom levels increased after the exposure. In contrast, the highest dose of copper sulfate significantly reduced the chl-a levels for both the lab-cultured MA (−87%) and the USA bloom (−23%). The CA bloom water appeared to have been the cyanobacteria most susceptible to hydrogen peroxide and copper sulfate, with reductions of 41% and 87%, respectively. However, the use of PC fluorescence likely explains this result. PC fluorescence is a less sensitive measurement relative to the extracted chl-a and the PC probe can detect both intra- and extracellular pigment.
While pigments were used as a metric for cell damage, cell lysis was monitored through the increase in intracellular material as measured by bulk DOC (Table 1). The lab-cultured MA released 13% (0.85 mg/L) of its DOC after exposure to 4 H2O2:DOC, but the bloom waters and the copper sulfate lab-cultured MA sample had minimal changes (<6%). DOC and pigment data for all dose ratios are shown in Figure S1 and S2 of the SI.
Previous work with hydrogen peroxide found that 2 mg/L was sufficient to produce >90% cell lysis in a naturally occurring bloom of 1.2 × 10⁶ cells/mL P. agardhii in the Netherlands [23]. In contrast, a natural bloom occurring in a lake in China required 60 mg/L to reduce extracted chl-a levels by >90% [24]. In this work, both blooms would require a dose ratio higher than 4 H2O2:DOC to produce >90% removal of pigments. The differences in behavior were attributed to a combination of the lack of light that would produce HO•, exposure time periods, bloom-specific characteristics and the use of different methods to determine cell damage [23,24,29,31]. For the lab-cultured MA, previous work found that cell integrity was reduced by 14% up to 49% at doses of 10.2–102 mg/L H2O2 [18], which was similar to the 9.5% chl-a reduction at 9.76 mg/L observed in this work.
The impact of copper sulfate has only been evaluated for monocultures in media and not for bloom samples [18,20,22]. For example, Fan et al. [18] applied copper sulfate to lab-cultured MA and found that after 1.0 mg/L, 98% of cells lost their membrane integrity over 48 h (7.0 × 10⁵ cells/mL in media). Zhou et al. [20] produced similar results with 0.4 mg/L of copper sulfate reducing the extracted chl-a and damaging cell membranes by >90% (4.0 × 10⁶ cells/mL in media) over 96 h. At 8 mg/L, Iwinski et al. [22] reduced chl-a by approximately 50% after 96 hrs (4.5 × 10⁶ cells/mL in media). A similar level of damage was observed in this work with 7.5 mg/L resulting in an 87% reduction in chl-a, despite the presence of CRW as a background matrix.
3.3. Impact of 24 h Exposure to Hydrogen Peroxide and Copper Sulfate on Mycrocystins
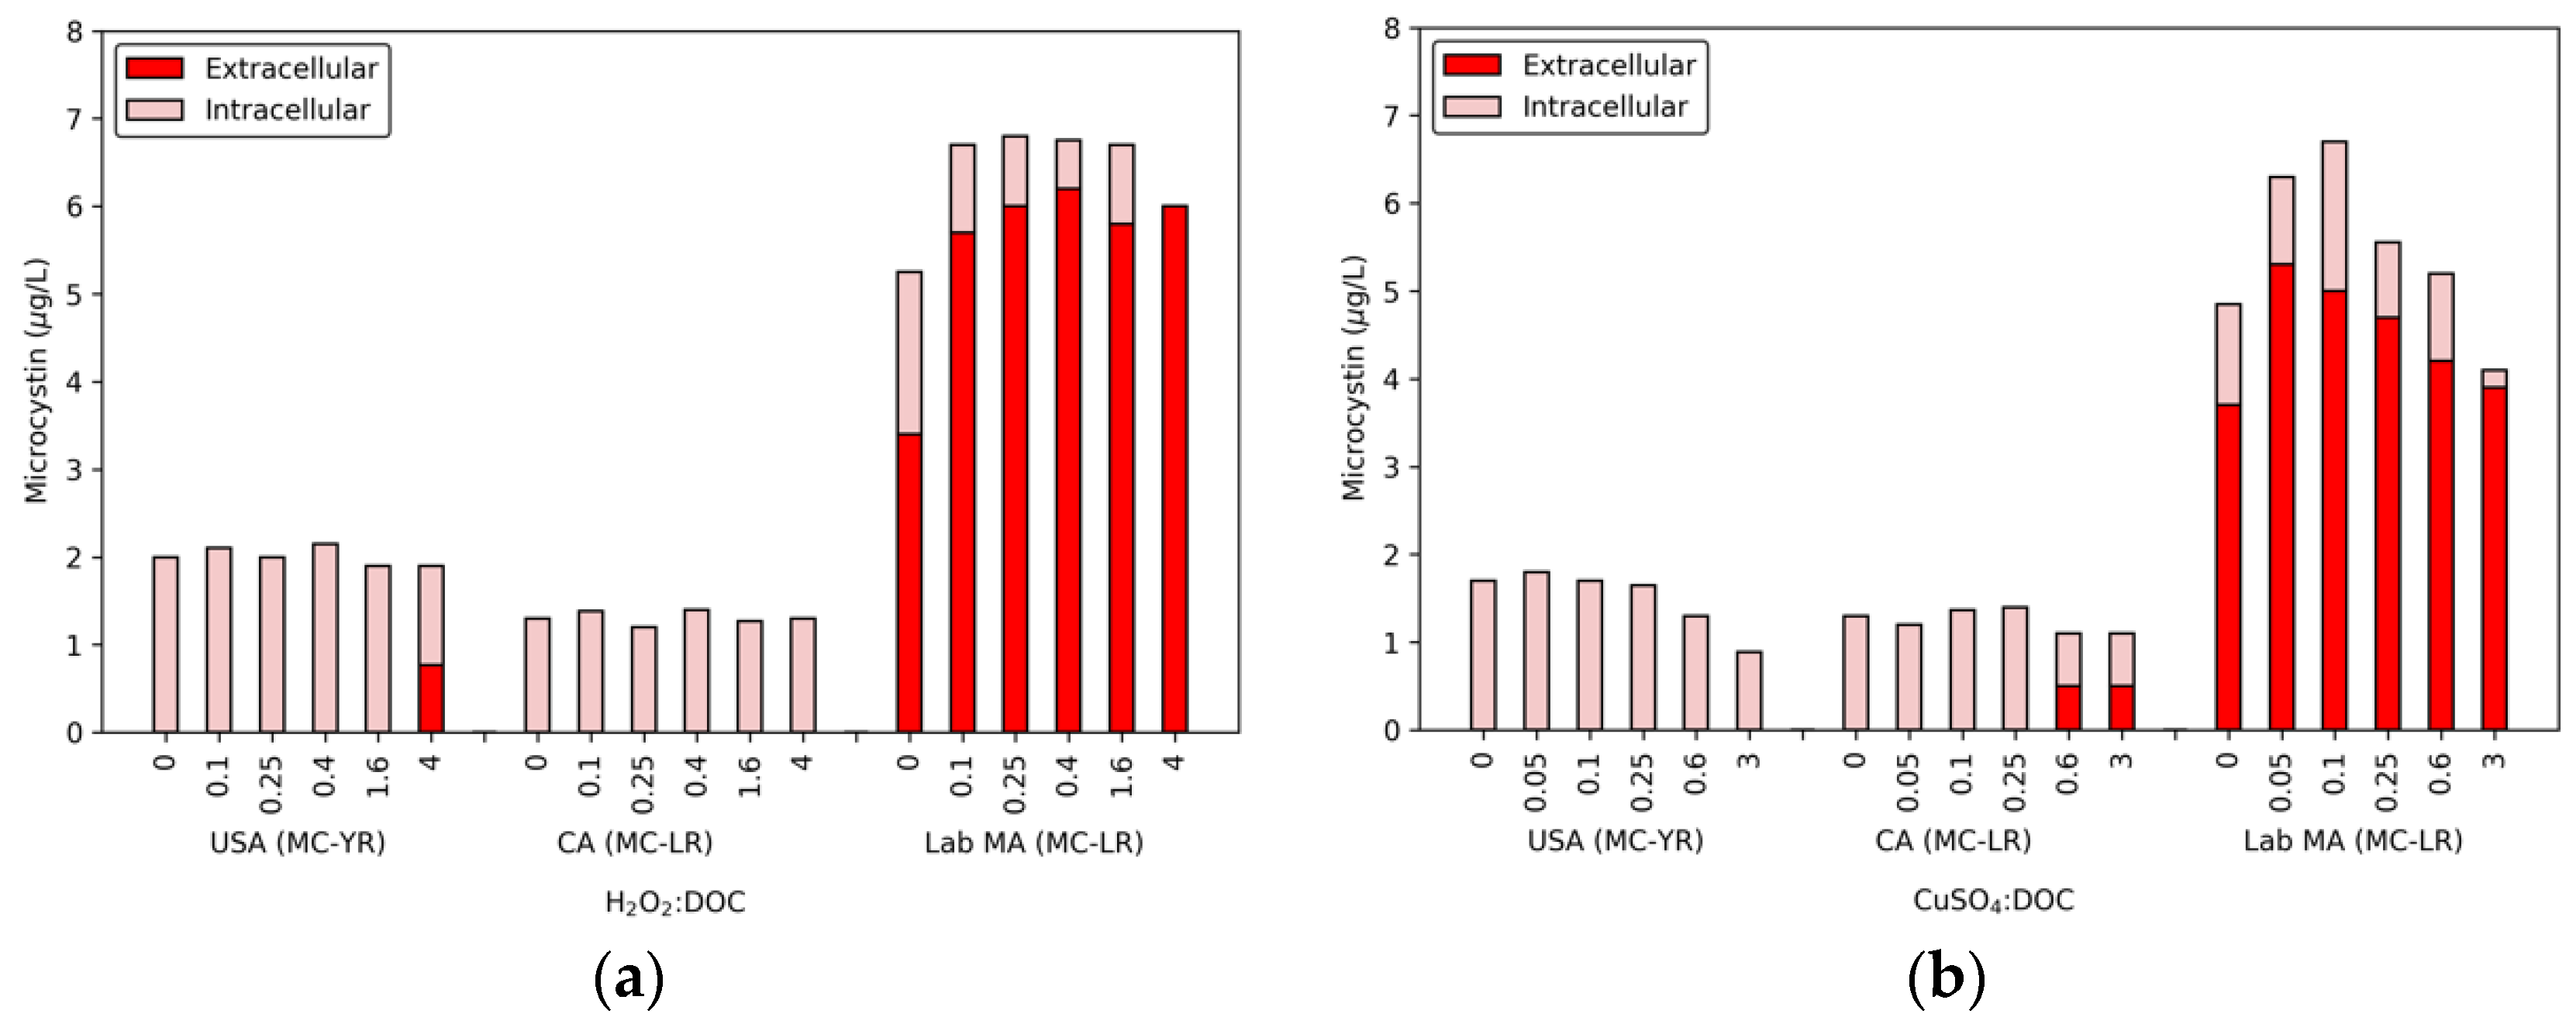
In conjunction with the release of DOC, cell lysis also led to the release of MCs (Figure 1), though this release was limited for the two bloom samples. The USA bloom released 0.77 μg/L of MC-YR with 4 H2O2:DOC, but the CA bloom had no detectable extracellular MC-LR. In contrast, a dose of 0.1 H2O2:DOC resulted in an increase of 2.2 μg/L extracellular MC-LR in the lab-cultured MA. The extracellular MC-LR continued to increase until the total MC level was extracellular. While 1.6 H2O2:DOC did not degrade MC-LR, 4 H2O2:DOC produced a removal of 0.8 μg/L in the lab-cultured water. The lab-cultured water was the only cyanobacterial suspension in which the concentration of extracellular MCs was close to the 8 μg/L U.S. EPA guideline for recreational swimming waters [16].
The effect of copper sulfate on the levels of intra- and extracellular MCs are also shown in Figure 1. As was observed with hydrogen peroxide, there was a limited release of MCs for the USA bloom. The highest dose ratio of copper sulfate (3 CuSO4:DOC) had a measurable decrease in the total MC-YR level (0.4 μg/L), which was attributed to the release of extracellular toxin at a level below the MRL (0.5 μg/L). At 0.6 and 3 CuSO4:DOC, the CA bloom had 0.5 μg/L of extracellular MC-LR. In the lab-cultured MA sample, the 0.05 and 0.1 CuSO4:DOC ratios produced 1.6 and 1.3 μg/L extracellular MC-LR, respectively. With higher doses of algicide, the extracellular and total toxin concentrations declined. A similar trend was observed in the CA bloom, though at a lower magnitude. These losses were attributed to biological degradation by aerobic bacteria following cyanobacterial cell die off with increasing concentrations of copper sulfate [37,38,39,40,41,42,43]. Previous work has shown that biodegradation of extracellular toxin depends on the congeners present as well as the background water matrix. For example, Maghsoudi et al. [42] found that the presence of phycocyanin acts as a supplementary carbon source and results in enhanced biodegradation of MCs. Although this process should be evaluated further (using additional microbial characterization techniques), the range of degradation observed here is within the maximum values found in lake waters—20 μg/day [41,42].
As expected, the two bloom waters were more resistant to hydrogen peroxide as compared against the monoculture of MA. This trend has been observed for other oxidants, e.g., chlorine and ozone and has been primarily attributed to the presence of multiple species reacting with the algicide/oxidant [32,38,39,40]. However, the difference could also be caused by the cell growth phase or lab-grown vs. natural cyanobacteria sheath layers/membrane thickness [32,38,39,40].
3.4. Impact of Stagnation Post-Quenching of Hydrogen Peroxide
From the five H2O2:DOC dose ratios, a low- to mid-point exposure was selected for monitoring during a stagnation period after the initial oxidation (Figure 2). Specifically, the 0.4 H2O2:DOC dose ratio was selected because it produced in no detectable release of extracellular MCs from the bloom samples during the initial oxidation. After quenching at 20 min (USA bloom) or 24 h (CA bloom and lab-cultured MA), samples were collected up to 96 or 168 h.
The stagnation period following quenching resulted in a consistent decrease in the pigment in lab-cultured MA water as well as the CA bloom (Figure S3). During the initial 0.4 H2O2:DOC exposure period, the CA bloom and lab-MA water lost <30% of their PC fluorescence and chl-a. However, stagnation in the absence of hydrogen peroxide revealed that the actual effect of this dose was significantly higher with the final time point reduced by 93% in the CA bloom and 74% in lab-cultured MA (Figure S3). This strongly suggests that the impact of an algicide on cyanobacterial cell damage is not captured effectively by an initial monitoring period of less than 24 h and damage can be revealed over time. Understanding that cyanobacterial cell damage needs to be monitored for up to a week after the application and quenching of hydrogen peroxide is a useful time-frame for water treatment operators looking to evaluate their surface water blooms.
In contrast to the decay observed for the CA bloom and lab-culture MA, the USA bloom cells rebounded over time with the final chl-a levels at 115% greater than prior to exposure with hydrogen peroxide (Figure S3). This was attributed to the limited exposure period for this water at 20 min relative to 24 h for the other two waters.
Although the pigment levels were immediately affected (<2 h), the DOC concentration did not change as rapidly after quenching. By the final time point, the levels of DOC had increased for each water, due to cell lysis. Specifically, after 96 or 168 h hydrogen peroxide had damaged cells such that the CA bloom released 1.1 mg/L and the lab-cultured MA cells released 0.5 mg/L. A similar release was observed during the initial contact period (0.65 mg/L) for the lab-cultured cells, but the CA bloom had no release initially. The USA bloom did not see a change in the DOC concentration during the stagnation period (<0.1 mg/L), again due to the short exposure period. These results further confirm the cell-damage data and show that additional time is necessary to capture the die-off period and subsequent release of intracellular material.
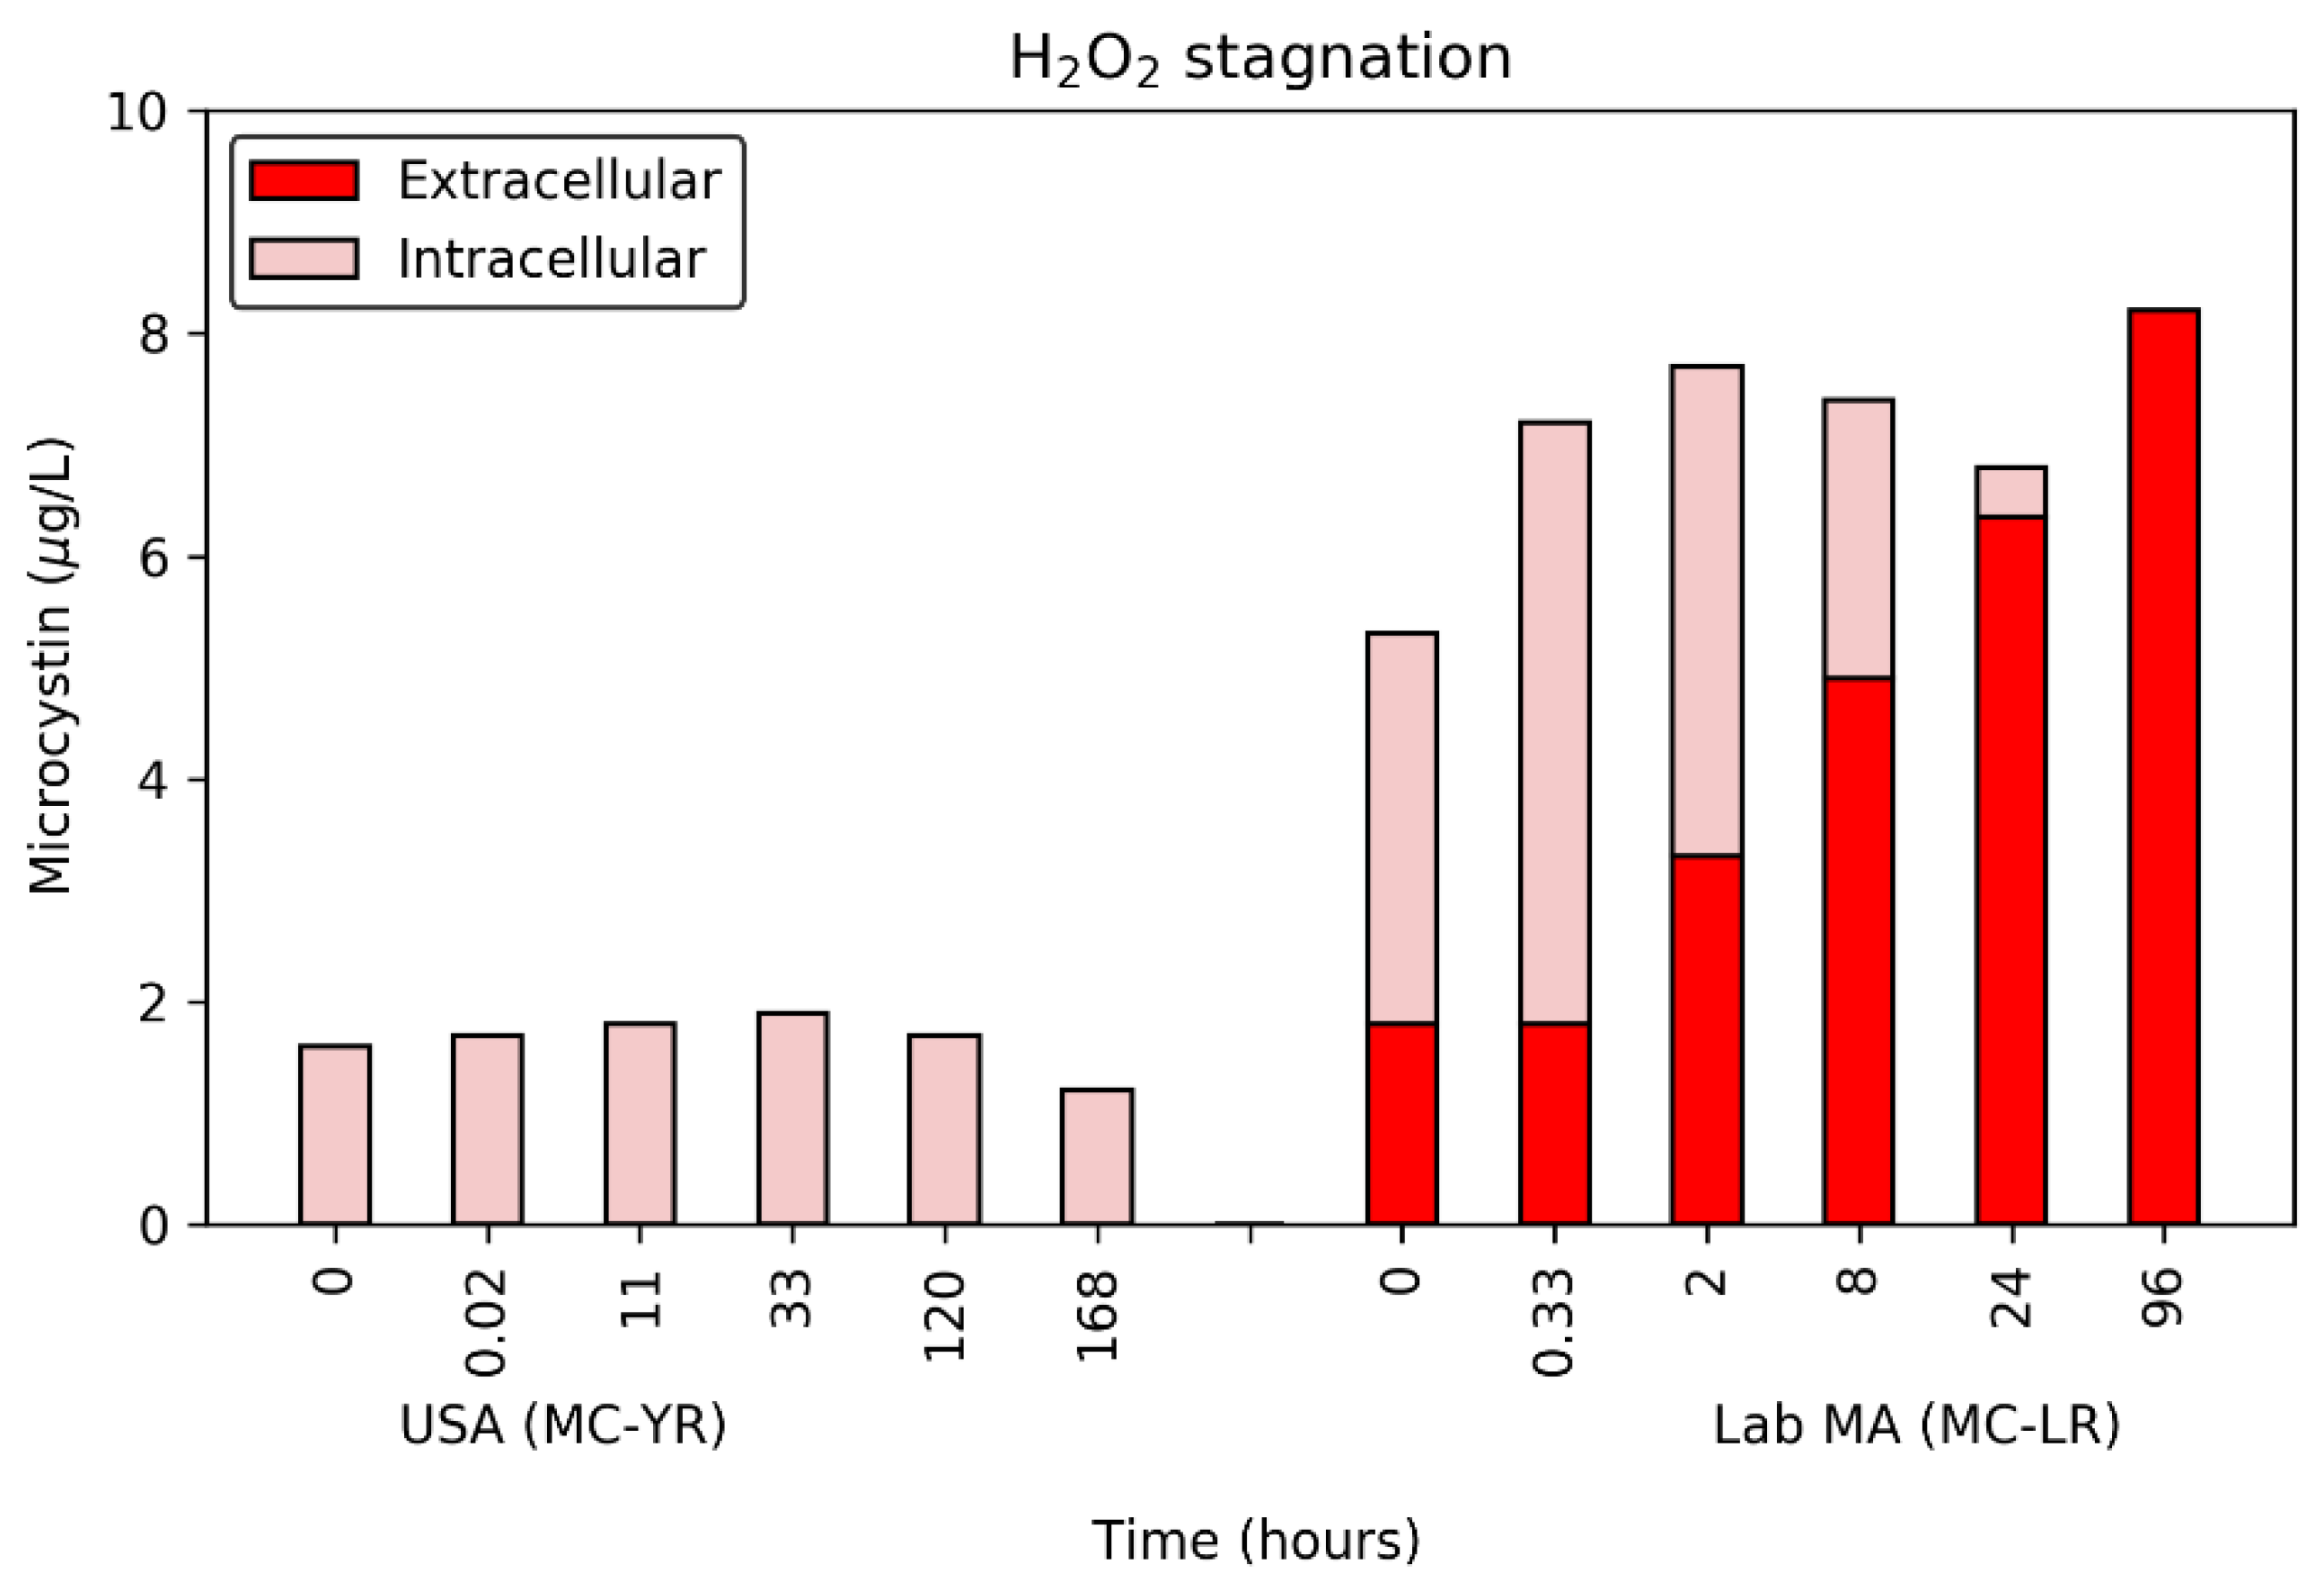
The MCs followed a similar trend to the changes observed in the pigments and DOC. In the USA bloom, no extracellular MC-YR was detected during the 168 h stagnation period. However, between the two final time points (a period of 48-hrs) the concentration of intracellular MCs decreased by 0.5 μg/day. This loss was not detected as extracellular MC-YR because it was either below the MRL or biodegraded by the background microbiota prior to sample collection. In contrast to the USA bloom, the lab-cultured MA’s extracellular MC-LR increased after a lag period of less than 2 h. These releases continued until the final time point of 96 h at which point all of the 8.2 μg/L MC-LR was present as extracellular toxin. Despite the differences in experimental setup, similar lag-periods of 1.8–2.5 h (doses of 2.5–20 mg/L) were observed in previous work with lab-cultured MA producing MC-LR [29,31].
Pigment levels are often applied in source water monitoring as an evaluation of the cyanobacterial bloom. In this work, a significant difference was observed between for the lag time prior to the decrease in pigment levels and the release of intracellular MCs. The greater lag time associated with the release of MCs shows that the risk from MCs persists for several days even after the pigment levels have been significantly reduced. These data highlight the need to collect multiple water quality parameters and not rely on results from pigments alone.
3.5. Extended (96 or 168 h) Exposure to Copper Sulfate
After the initial application of the five dose ratios, the 0.25 CuSO4:DOC dose ratio was selected for long-term monitoring over a period of up to 96 or 168 h. Unlike hydrogen peroxide, copper sulfate’s effect as an algicide cannot be easily quenched or removed from water, so exposure occurred during the entire hold period.
The level of cell damage, as monitored by pigment, continued to increase even after the initial 24 h exposure period. The final time point for the CA bloom’s PC fluorescence was reduced by 95% and the lab-cultured MA’s chl-a was reduced by 62% (Figure S4). Similar to the behavior with hydrogen peroxide, the USA bloom’s chl-a decreased in the first 20 min but rebounded over the 168 h monitoring, with a final concentration similar to the starting concentration. The data for the USA bloom were similar to results observed in other work with these algicides, wherein the percentage of intact lab-cultured MA rebounded 7 days after the application of 1.5 mg/L copper sulfate [18].
For the release of DOC, a proxy for the lysis of cells, the lab-cultured MA and CA bloom saw minimal changes (<0.2 mg/L) over the long-term exposure (Figure S4). The maximum change in DOC was observed in the USA bloom at 1.2 mg/L released. This was in contrast to the impact on chl-a, illustrating the difficulty in assessing the impact of algicides using only one metric.
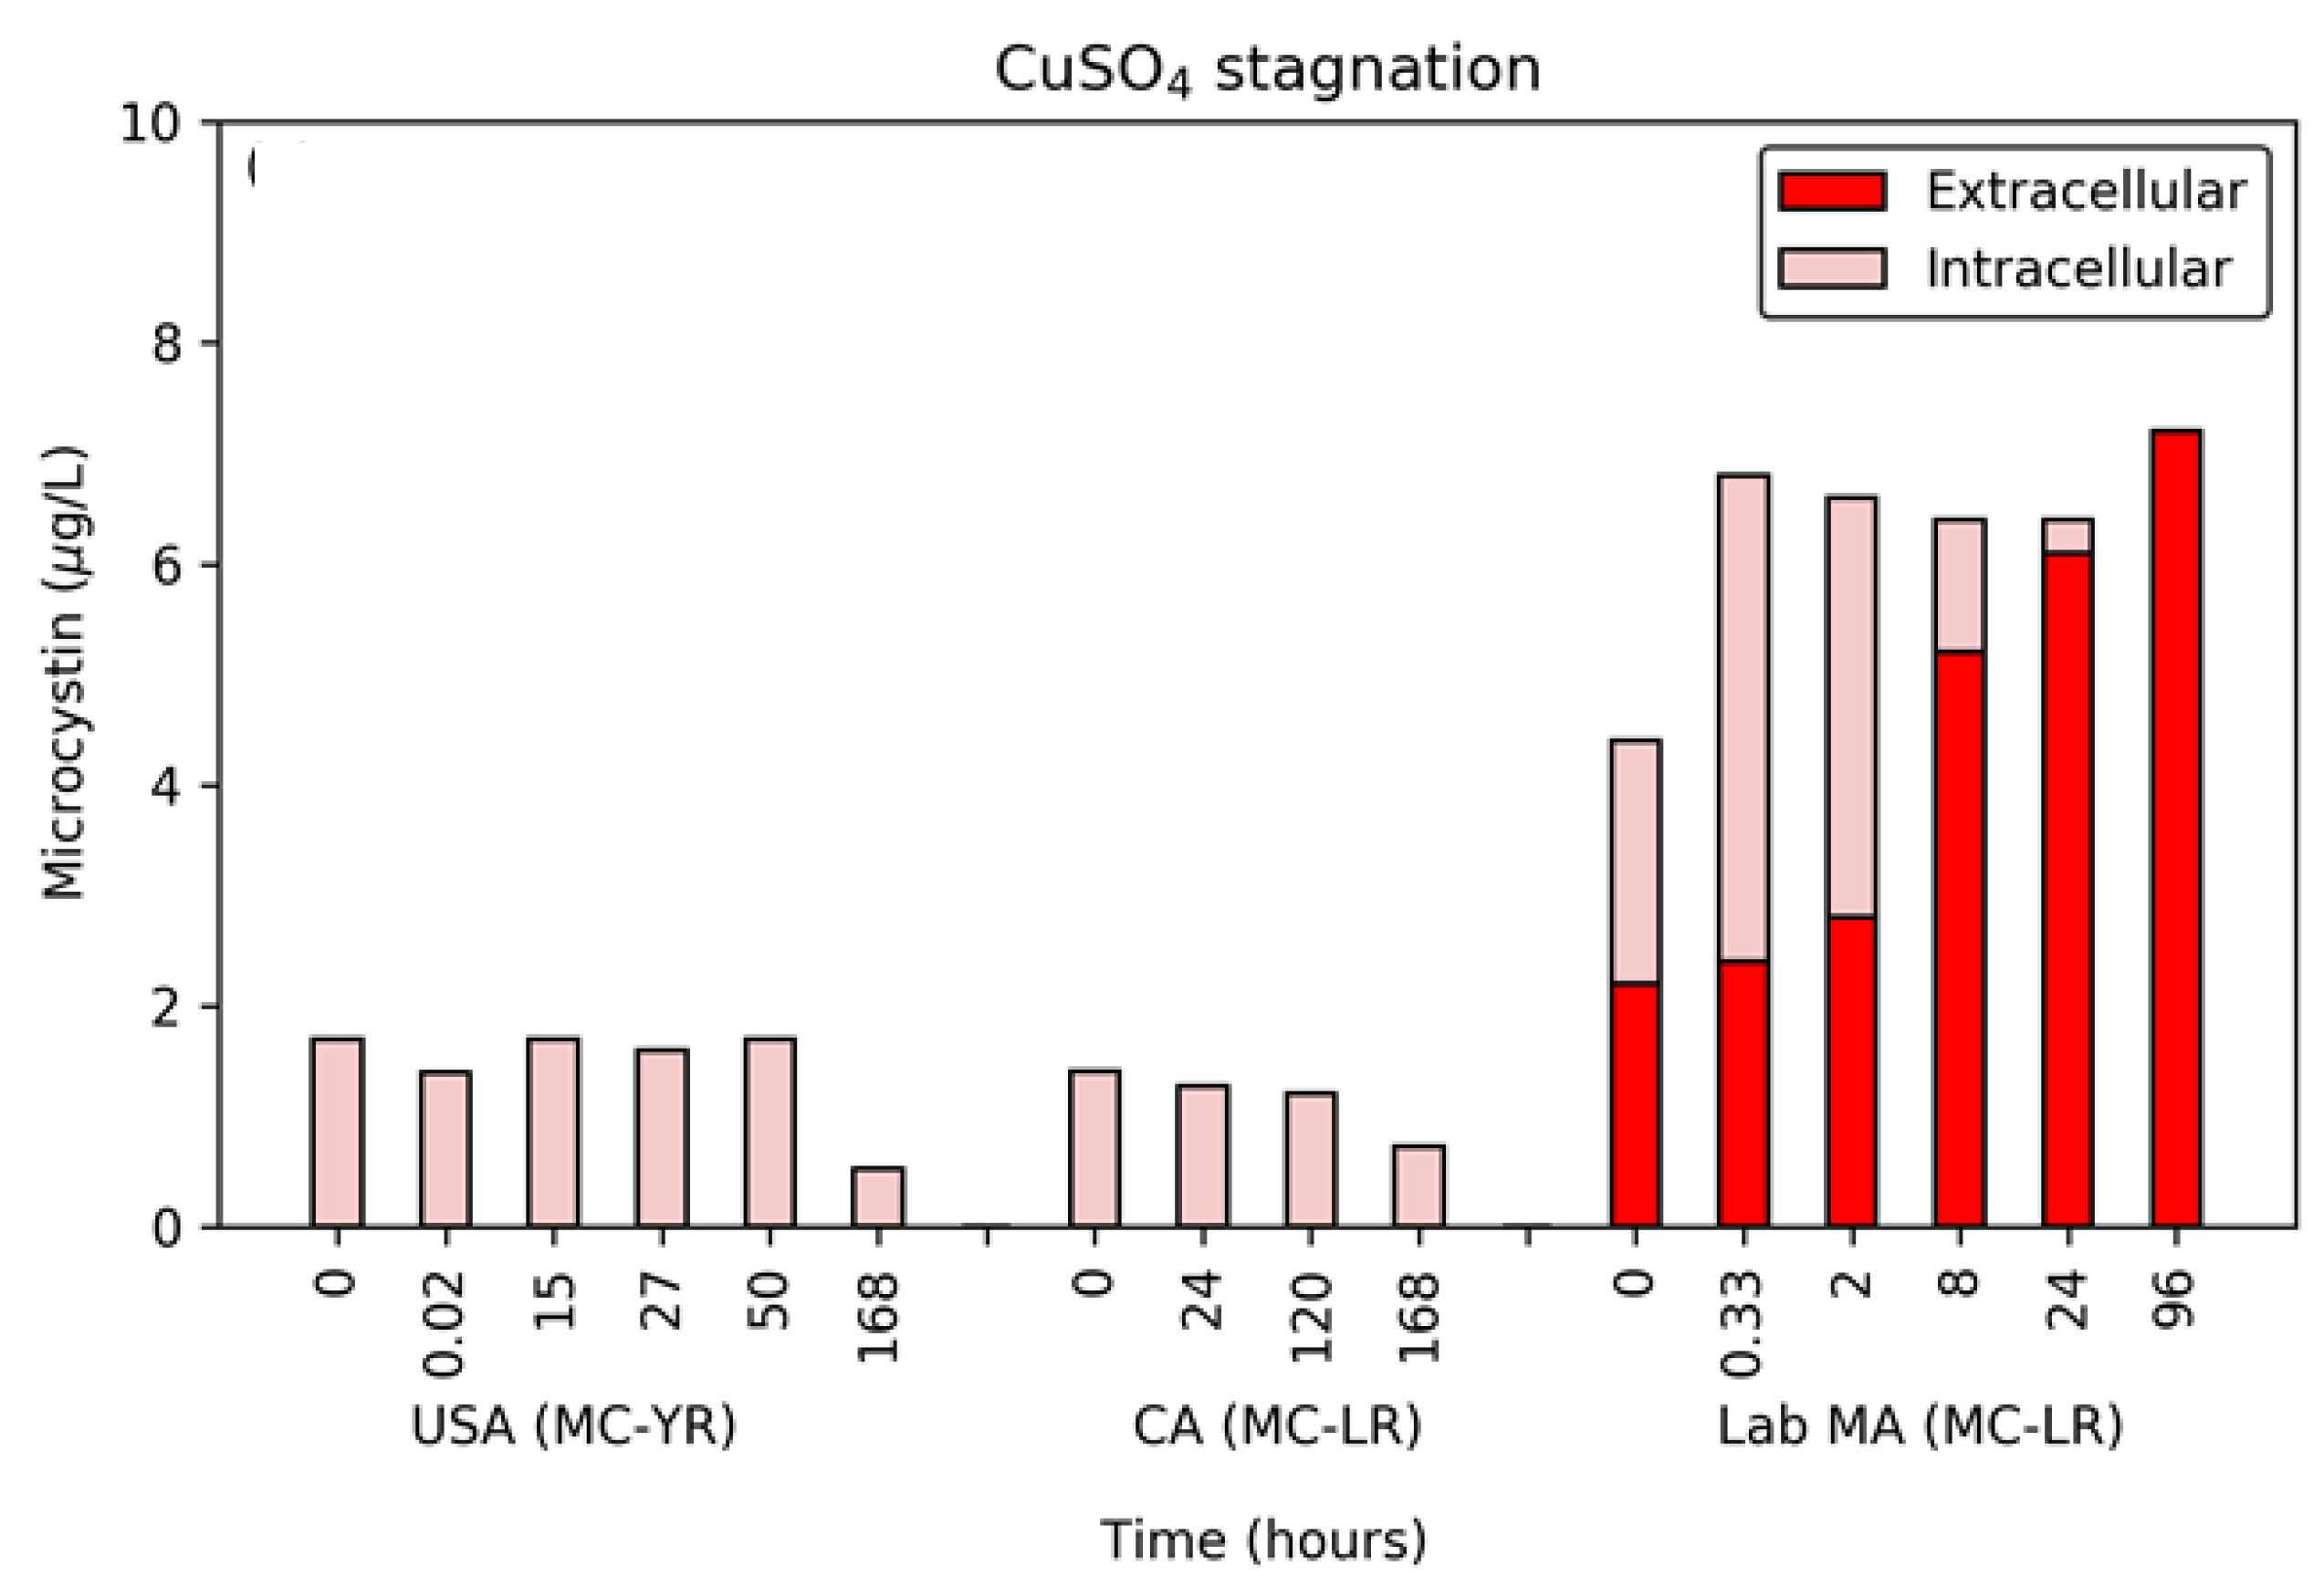
The primary parameter of concern for cyanobacterial blooms is the release of MCs following treatment. Unlike the stagnation period following dosing with hydrogen peroxide, the release of MC-LR from the lab-cultured MA during exposure to copper sulfate occurred after a lag period of approximately 8 h (Figure 3). At this point, the extracellular MC-LR increased by 3.4 µg/L, with the upward trend continuing until the final time point, where all of the MC-LR was extracellular. In contrast to the lab-cultured water, the two naturally occurring bloom samples had no detectable extracellular MC-LR or MC-YR. However, both the USA and CA blooms experienced a decrease in the total concentration of MCs. This occurred between the 50 h and 168 h time points for the USA bloom and after 24 h for the CA bloom. This was likely indicative of a biological degradation of the extracellular MCs or a concentration close to the MRL, similar to what was observed following exposure to hydrogen peroxide.
4. Conclusions
In this work, the goals were to determine the doses of hydrogen peroxide and copper sulfate necessary for the release of intracellular MC following a 24 h exposure period and understand the effect that stagnation time after exposure (hydrogen peroxide) or extended exposure (copper sulfate) has on cell viability and release of MCs. The doses required for the release of intracellular MCs were >4 H2O2:DOC or 0.6 CuSO4:DOC for the two naturally occurring bloom samples (Table 2). As expected, the lab-cultured MA was more susceptible to both algicides, with even the lowest dose ratios (0.1 H2O2 or CuSO4:DOC) resulting in the release of extracellular MC-LR.
However, the effect of hydrogen peroxide was not accurately captured during the initial monitoring period as shown during the stagnation post-quenching. The low dose ratio of 0.4 H2O2:DOC was sufficient to produce the release of MCs after one week. Similar results were observed for the copper sulfate, wherein 0.25 CuSO4:DOC exposure over a week produced release in both blooms. This timeline is relevant for water treatment plants using algicides in their source waters. Operators will need to be wary of the potential for the release of extracellular MCs one week after the application of algicides and after the pigment levels have declined.
Supplementary Materials
The following are available online at https://www.mdpi.com/2073-4441/12/4/1105/s1, Figure S1: Impact of hydrogen peroxide on a) the concentration of extracted chl-a (left axis) in the USA bloom and the lab-cultured MA in CRW and the PC fluorescence (right axis) in the CA bloom and b) the level DOC in all three suspensions, Figure S2: Impact of copper sulfate on a) the concentration of extracted chl-a (left axis) in the USA bloom and the lab-cultured MA in CRW and the PC fluorescence (right axis) in the CA bloom and b) the level DOC in all three suspensions, Figure S3: The impact of stagnation time after exposure to 0.4 H2O2:DOC on a) the extracted chl-a (left axis) in the USA bloom and the lab-cultured MA and the PC fluorescence (right axis) in the CA bloom, and b) the DOC, Figure S4: The impact of extended exposure to copper sulfate on a) the concentration of extracted chl-a (left axis) in the USA bloom and the lab cultured MA and the PC fluorescence (right axis) in the CA bloom, and b) the DOC, Table S1: Dosing and residuals for hydrogen peroxide in the lab-cultured Microcystis aeruginosa (MA) in Colorado River water (CRW) and the USA bloom, Table S2: Control experiments collected for the lab-cultured MA and USA bloom in the presence of only sodium thiosulfate or without any addition.
Author Contributions
The author contribution is as follows: conceptualization, all authors; methodology, all authors; formal analysis, all authors; investigation, all authors; resources, all authors; writing—original draft preparation, all authors; writing—review and editing, all authors; visualization, C.M.G.; supervision, A.Z. and E.C.W.; project administration, A.Z. and E.C.W.; funding acquisition, A.Z., C.A., E.R., E.C.W. All authors have read and agreed to the published version of the manuscript.
Funding
This work was funded by the Water Research Foundation (Project #4692). The authors also acknowledge additional funding provided by the Natural Sciences and Engineering Research Council of Canada (NSERC) Discovery program and the Fonds de Recherche du Québec—Nature et technologies (FRQNT).
Acknowledgments
The authors acknowledge the following people at SNWA for assistance with analytical and experimental work: Brett Vanderford, Rebecca Trenholm, Julia Lew, Glen de Vera, Mary Murphy, James Park, Shandra Staker, Janie Holady, Brittney Stipanov, Amanda Roark, Penelope Borg, Eric Dickenson, Edgard Verdugo, Justin Hanks, Chad Tyler, Paulina Hana, Douglas Mawhinney, Nick Beninato, Josephine Chu, Wilbur Frehner, Charles Meyer, Alan Sims, and Stan Van Wagenen. The authors also thank Chris Mihalkovic from Hazen and Sawyer for help in acquiring water from Grand Lake St. Marys in Celina, OH.
Conflicts of Interest
The authors declare no conflict of interest.
References
- Huisman, J.; Sharples, J.; Stroom, J.; Visser, P.M.; Kardinaal, W.E.A.; Verspagen, J.M.H.; Sommeijer, B. Changes in turbulent mixing shift competition for light between phytoplankton species. Ecology 2004, 85, 2960–2970. [Google Scholar] [CrossRef] [Green Version]
- Carey, C.C.; Ibelings, B.W.; Hoffmann, E.P.; Hamilton, D.P.; Brookes, J.D. Eco- physiological adaptations that favour freshwater cyanobacteria in a changing climate. Water Res. 2012, 46, 1394–1407. [Google Scholar] [CrossRef] [PubMed]
- Paerl, H.W.; Paul, V.J. Climate change: Links to global expansion of harmful cyanobacteria. Water Res. 2012, 46, 1349–1363. [Google Scholar] [CrossRef] [PubMed]
- Zamyadi, A.; Romanis, C.; Mills, T.; Neilan, B.; Choo, F.; Coral, L.A.; Gale, D.; Newcombe, G.; Crosbie, N.; Stuetz, R.; et al. Diagnosing water treatment critical control points for cyanobacterial removal: Exploring benefits of combined microscopy, next-generation sequencing, and cell integrity methods. Water Res. 2019, 152, 96–105. [Google Scholar] [CrossRef]
- Cheung, M.; Liang, S.; Lee, J. Toxin-producing cyanobacteria in freshwater: A review of the problems, impact on drinking water safety, and efforts for protecting public health. J. Microbiol. 2013, 51, 1–10. [Google Scholar] [CrossRef]
- Paerl, H.W.; Otten, T.G. Harmful Cyanobacterial Blooms: Causes, Consequences, and Controls. Environ. Micro. 2013, 65, 995–1010. [Google Scholar] [CrossRef]
- Huisman, J.; Codd, G.A.; Paerl, H.W.; Ibelings, B.W.; Verspagen, J.M.H.; Visser, P.M. Cyanobacterial blooms. Nat. Rev. Microbiol. 2018, 16, 471–483. [Google Scholar] [CrossRef]
- Ghadouani, A.; Pinel-Alloul, B.; Prepas, E.E. Effects of experimentally induced cyanobacterial blooms on crustacean zooplankton communities. Freshw. Biol. 2003, 48, 363–381. [Google Scholar] [CrossRef]
- Samdal, I.A.; Ballot, A.; Løvberg, K.E.; Miles, C.O. Multihapten approach leading to a sensitive ELISA with broad cross-reactivity to microcystins and nodularin. Environ. Sci. Technol. 2014, 48, 8035–8043. [Google Scholar] [CrossRef] [Green Version]
- Catherine, Q.; Susanna, W.; Isidora, E.-S.; Mark, H.; Aurelie, V.; Jean-François, H. A review of current knowledge on toxic benthic freshwater cyano- bacteria ecology, toxin production and risk management. Water Res. 2013, 47, 5464–5479. [Google Scholar] [CrossRef]
- Carmichael, W.W. Health effects of toxin-producing cyano- bacteria: “The CyanoHABs”. Hum. Ecol. Risk Assess. 2001, 7, 1393–1407. [Google Scholar] [CrossRef]
- World Health Organization (WHO). Cyanobacterial Toxins: Microcystin-LR in Drinking Water. Background Document for Preparation of WHO Guidelines for Drinking Water Quality; World Health Organization: Geneva, Switzerland, 2003. [Google Scholar]
- Health Canada. Cyanobacterial Toxins in Drinking Water; Federal-Provincial-Territorial Committee on Drinking Water: Ottawa, Canada, 2016; Available online: http://healthycanadians.gc.ca/health-system-systeme-sante/consultations/cyanobacteria-cyanobacterie/alt/cyanobacteria-cyanobacterie-eng.pdf (accessed on 28 December 2018).
- U.S. EPA. Drinking Water Health Advisory for the Cyanobacterial Microcystin Toxins; Document Number 820R15100; U.S. EPA Office of Water: Cincinnati, OH, USA, 2015. Available online: https://www.epa.gov/sites/production/files/2017-06/documents/microcystins-report-2015.pdf (accessed on 11 November 2018).
- Health Canada. Guidelines for Canadian Recreational Water Quality, 3rd ed.; Health Canada: Ottawa, Canada, 2012. Available online: https://www.canada.ca/en/health-canada/services/publications/healthy-living/guidelines-canadian-recreational-water-quality-third-edition/guidelines-canadian-recreational-water-quality-third-edition-page-11.html (accessed on 28 December 2018).
- U.S. EPA. Recommendations for Cyanobacteria and Cyanotoxin Monitoring in Recreational Waters; Document Number 820R17001; U.S. EPA Office of Water: Cincinnati, OH, USA, 2017. Available online: https://www.epa.gov/sites/production/files/2017-07/documents/08_july_3_monitoring_document_508c_7.5.17.pdf (accessed on 11 November 2018).
- Mitrovic, S.M.; Hardwick, L.; Dorani, F. Use of flow management to mitigate cyanobacterial blooms in the Lower Darling River, Australia. J. Plank. Res. 2011, 33, 229–241. [Google Scholar] [CrossRef]
- Fan, J.; Ho, L.; Hobson, P.; Brookes, J. Evaluating the effectiveness of copper sulfate, chlorine, potassium permanganate, hydrogen peroxide, and ozone on cyanobacterial cell integrity. Water Res. 2013, 47, 5153–5164. [Google Scholar] [CrossRef] [PubMed]
- Fan, J.; Hobson, P.; Ho, L.; Daly, R.; Brookes, J. The effects of various control and water treatment processes on the membrane integrity and toxin fate of cyanobacteria. J. Haz. Mat. 2014, 264, 313–322. [Google Scholar] [CrossRef] [PubMed]
- Zhou, S.; Shao, Y.; Gao, N.; Deng, Y.; Qiao, J.; Ou, H.; Deng, J. Effects of different algaecides on the photosynthetic capacity, cell integrity, and microcystin-LR release of Microcystis aeruginosa. Sci. Total Environ. 2013, 463–464, 111–119. [Google Scholar] [CrossRef]
- Tsai, K.-P. Effects of two copper compounds on Microcystis aeruginosa cell density, membrane integrity, and microcystin release. Ecotox. Environ. Saf. 2015, 120, 428–435. [Google Scholar] [CrossRef]
- Iwinski, K.J.; Calomeni, A.J.; Geer, T.D.; Rogers, J.H., Jr. Cellular and aqueous microcystin-LR following laboratory exposures of Microcystis aeruginosa to copper algaecides. Chemosphere 2016, 147, 74–81. [Google Scholar] [CrossRef]
- Matthijs, H.C.P.; Visser, P.M.; Reeze, B.; Meeuse, J.; Slot, P.C.; Wijn, G.; Talens, R.; Huisman, J. Selective suppression of harmful cyanobacteria in an entire lake with hydrogen peroxide. Water Res. 2012, 46, 1460–1472. [Google Scholar] [CrossRef]
- Wang, Z.C.; Li, D.H.; Qin, H.J.; Li, Y.X. An integrated method for removal of harmful cyanobacterial blooms in eutrophic lakes. Environ. Pollut. 2012, 160, 34–41. [Google Scholar] [CrossRef]
- Barrington, D.J.; Ghadouani, A.; Ivey, G.N. Environmental Factors and the Application of Hydrogen Peroxide for the Removal of Toxic Cyanobacteria from Waste Stabilization Ponds. J. Environ. Eng. 2011, 137, 952–960. [Google Scholar] [CrossRef]
- Barrington, D.J.; Ghadouani, A. Application of hydrogen peroxide for the removal of toxic cyanobacteria and other phytoplankton from wastewater. Environ. Sci. Technol. 2008, 42, 8916–8921. [Google Scholar] [CrossRef] [PubMed]
- Drábková, M.; Admiraal, W.; Maršálek, B. Combined exposure to hydrogen peroxide and light–selective effects on cyanobacteria, green algae, and diatoms. Environ. Sci. Technol. 2007, 41, 309–314. [Google Scholar] [CrossRef] [PubMed]
- Mikula, P.; Zezulka, S.; Jancula, D.; Marsalek, B.V. Metabolic activity and membrane integrity changes in Microcystis aeruginosa–new findings on hydrogen peroxide toxicity in cyanobacteria. Eur. J. Phycol. 2012, 47, 195–206. [Google Scholar] [CrossRef]
- Huo, X.; Chang, D.-W.; Tzeng, J.-H.; Burch, M.D.; Lin, T.-F. Exposure of Microcystis aeruginosa to Hydrogen Peroxide under Light: Kinetic Modeling of Cell Rupture and Simultaneous Microcystin Degradation. Environ. Sci. Technol. 2015, 49, 5502–5510. [Google Scholar] [CrossRef] [PubMed]
- Song, W.; Xu, T.; Cooper, W.J.; Dionysiou, D.D.; De la Cruz, A.A.; O’Shea, K.E. Radiolysis studies on the destruction of microcystin-LR in aqueous solution by hydroxyl radicals. Environ. Sci. Technol. 2009, 43, 1487–1492. [Google Scholar] [CrossRef] [PubMed] [Green Version]
- Chang, C.-W.; Huo, X.; Lin, T.-F. Exposure of Microcystis aeruginosa to hydrogen peroxide and titanium dioxide under visible light conditions: Modeling the impact of hydrogen peroxide and hydroxyl radical on cell rupture and microcystin degradation. Water Res. 2018, 141, 217–226. [Google Scholar] [CrossRef]
- Wert, E.C.; Dong, M.M.; Rosario-Ortiz, F.L. Using digital flow cytometry to assess the degradation of three cyanobacteria species after oxidation processes. Water Res. 2013, 47, 3752–3761. [Google Scholar] [CrossRef]
- U.S. EPA. Determination of Metals and Trace Elements in Water and Wastes by Inductively Coupled Plasma-Atomic Emission Spectrometry; Revision 4.4.; Environmental Monitoring Systems Laboratory, Office of Research and Development: Cincinnati, OH, USA, 1994. Available online: https://www.epa.gov/sites/production/files/2015-08/documents/method_200-7_rev_4-4_1994.pdf (accessed on 15 June 2019).
- Klassen, N.V.; Marchington, D.; McGowan, H.C.E. H2O2 Determination by the I3- Method and by KMnO4 Titration. Anal. Chem. 1994, 66, 2921–2925. [Google Scholar] [CrossRef]
- APHA. Standard Methods for the Examination of Water and Wastewater, 22nd ed.; American Public Health Association: Washington, DC, USA, 2012. [Google Scholar]
- Almuhtaram, H.; Cui, Y.; Zamyadi, A.; Hofmann, R. Cyanotoxins and Cyanobacteria Cell Accumulations in Drinking Water Treatment Plants with a Low Risk of Bloom Formation at the Source. Toxins 2018, 10, 430. [Google Scholar] [CrossRef] [Green Version]
- Wert, E.C.; Korak, J.A.; Trenholm, R.A.; Rosario-Ortiz, F.L. Effect of oxidant exposure on the release of intracellular microcystin, MIB, and geosmin from three cyanobacteria species. Water Res. 2014, 52, 251–259. [Google Scholar] [CrossRef]
- Coral, L.A.; Zamyadi, A.; Barbeau, B.; Bassetti, F.J.; Lapolli, F.R.; Prevost, M. Oxidation of Microcystis aeruginosa and Anabaena flosaquae by ozone: Impacts on cell integrity and chlorination by-product formation. Water Res. 2013, 47, 2983–2994. [Google Scholar] [CrossRef] [PubMed]
- Zamyadi, A.; Coral, L.A.; Barbeau, B.; Dorner, S.; Lapolli, F.R.; Prévost, M. Fate of toxic cyanobacterial genera from natural bloom events during ozonation. Water Res. 2015, 73, 204–215. [Google Scholar] [CrossRef] [PubMed]
- He, X.X.; Wert, E.C. Colonial cell disaggregation and intracellular microcystin release following chlorination of naturally occurring Microcystis. Water Res. 2016, 101, 10–16. [Google Scholar] [CrossRef] [PubMed]
- Chen, W.; Song, L.; Peng, L.; Wan, N.; Zhang, X.; Gan, N. Reduction in microcystin concentrations in large and shallow lakes: Water and sediment-interface contributions. Water Res. 2008, 42, 763–773. [Google Scholar] [CrossRef]
- Maghsoudi, E.; Fortin, N.; Greer, C.; Duy, S.V.; Fayad, P.; Sauvé, S.; Prévost, M.; Dorner, S. Biodegradation source: Effects of particulate attached bacteria and phycocyanin. Ecotox. Environ. Saf. 2015, 120, 409–417. [Google Scholar] [CrossRef]
- Wu, X.; Xiao, B.; Li, R.; Wang, C.; Huang, J.; Wang, Z. Mechanisms and factors affecting sorption of microcystins onto natural sediments. Environ. Sci. Technol. 2011, 45, 2641–2647. [Google Scholar] [CrossRef]
Figure 1.
Release of intracellular MCs from the USA bloom, CA bloom, and the lab-cultured MA after a 24 h exposure to (a) five H2O2:DOC and (b) five CuSO4:DOC dose ratios.
Figure 1.
Release of intracellular MCs from the USA bloom, CA bloom, and the lab-cultured MA after a 24 h exposure to (a) five H2O2:DOC and (b) five CuSO4:DOC dose ratios.

Figure 2.
Impact of stagnation on the release of microcystins (MCs) from two cyanobacterial suspensions after exposure to 0.4 H2O2:DOC for 24 h (lab-cultured MA) or 20 min (USA bloom). Note: the CA bloom MC levels were not monitored during stagnation.
Figure 2.
Impact of stagnation on the release of microcystins (MCs) from two cyanobacterial suspensions after exposure to 0.4 H2O2:DOC for 24 h (lab-cultured MA) or 20 min (USA bloom). Note: the CA bloom MC levels were not monitored during stagnation.

Figure 3.
Release of intracellular toxin during extended exposure (96 or 168 h) to copper sulfate for the three cyanobacterial suspensions.
Figure 3.
Release of intracellular toxin during extended exposure (96 or 168 h) to copper sulfate for the three cyanobacterial suspensions.


Table 1.
Impact of the highest dose ratio of hydrogen peroxide and copper sulfate on chlorophyll-a (chl-a) (USA bloom and lab-cultured Microcystis aeruginosa (MA)), phycocyanin (PC) (CA bloom), and dissolved organic carbon (DOC).
Table 1.
Impact of the highest dose ratio of hydrogen peroxide and copper sulfate on chlorophyll-a (chl-a) (USA bloom and lab-cultured Microcystis aeruginosa (MA)), phycocyanin (PC) (CA bloom), and dissolved organic carbon (DOC).
| Dose Ratio | Parameter | Lab-Cultured MA | USA Bloom | CA Bloom | |||
|---|---|---|---|---|---|---|---|
| Pre-Algicide Exposure | Change after 24 h | Pre-Algicide Exposure | Change after 24 h | Pre-Algicide Exposure | Change after 24 h | ||
| 4 H2O2: DOC | DOC (mg/L) | 5.5 ± 0.21 | +13% | 10 ± 1.9 | +5.6% | 6.3 | +4.8% |
| Pigment (µg/L or RFU) | 57 ± 16 | −9.5% | 130 ± 10 | +88% | 1.4 | −41% | |
| 3 CuSO4: DOC | DOC (mg/L) | 5.7 ± 0.07 | +4% | 9.01 ± 0.24 | +1.5% | 6.4 | −1.5% |
| Pigment (µg/L or RFU) | 66 ± 3.8 | −87% | 170 ± 31 | −23% | 1.4 | −91% | |
Table 2.
Dose ratio or time required for the release of MCs in the two bloom samples and lab-cultured MA. NR: no release of MCs observed at dose applied.
Table 2.
Dose ratio or time required for the release of MCs in the two bloom samples and lab-cultured MA. NR: no release of MCs observed at dose applied.
| Cyanobacterial Suspension | Hydrogen Peroxide | Copper Sulfate | ||
|---|---|---|---|---|
| H2O2:DOC | After Exposure | CuSO4:DOC | Extended Contact | |
| USA bloom | 4 | 168 h | NR | 168 h |
| CA bloom | NR | - | 0.6 | 168 h |
| Lab-cultured MA | 0.1 | 2 h | 0.1 | 2 h |
© 2020 by the authors. Licensee MDPI, Basel, Switzerland. This article is an open access article distributed under the terms and conditions of the Creative Commons Attribution (CC BY) license (http://creativecommons.org/licenses/by/4.0/).
Share and Cite
MDPI and ACS Style
Zamyadi, A.; Greenstein, K.E.; Glover, C.M.; Adams, C.; Rosenfeldt, E.; Wert, E.C. Impact of Hydrogen Peroxide and Copper Sulfate on the Delayed Release of Microcystin. Water 2020, 12, 1105. https://doi.org/10.3390/w12041105
AMA Style
Zamyadi A, Greenstein KE, Glover CM, Adams C, Rosenfeldt E, Wert EC. Impact of Hydrogen Peroxide and Copper Sulfate on the Delayed Release of Microcystin. Water. 2020; 12(4):1105. https://doi.org/10.3390/w12041105
Chicago/Turabian StyleZamyadi, Arash, Katherine E. Greenstein, Caitlin M. Glover, Craig Adams, Erik Rosenfeldt, and Eric C. Wert. 2020. "Impact of Hydrogen Peroxide and Copper Sulfate on the Delayed Release of Microcystin" Water 12, no. 4: 1105. https://doi.org/10.3390/w12041105
Note that from the first issue of 2016, this journal uses article numbers instead of page numbers. See further details here.