Article

Drought Trends and the Extreme Drought Frequency and Characteristics under Climate Change Based on SPI and HI in the Upper and Middle Reaches of the Huai River Basin, China

1
Department of Agriculture and Water Resources Engineering, Yangzhou University, Yangzhou 225009, China
2
Department of Water Conservancy and Port Engineering, Yangzhou University, Yangzhou 225009, China
*
Author to whom correspondence should be addressed.
Water 2020, 12(4), 1100; https://doi.org/10.3390/w12041100
Submission received: 5 March 2020 / Revised: 25 March 2020 / Accepted: 10 April 2020 / Published: 13 April 2020
(This article belongs to the Section Hydrology)

Abstract

:
The Huai River Basin (HRB) is an important grain and industrial production area in eastern China with frequent droughts. Under the background of current climate change, the hydrological and meteorological characteristics of the basin may be changed, which may lead to the changes of regional drought characteristics. It should be paid more attention on the drought research under climate change and the difference between different drought indices. Coupled Model Intercomparison Project phase 5 (CMIP5) as an important tool for climate change research has been used in the study and the study chosen three global circulation models (GCMs)—such as CNRM-CM5 (CNR), HadGEM2-ES (Had), and MIROC5 (MIR)—to gather an ensemble model (EnM) for providing the future climate information. The Standardized Precipitation Index (SPI) and Humidity Index (HI) were used to evaluate and compare the drought situations in the past and the future periods with two representative concentration path scenarios (RCP4.5 & RCP8.5). Some sequence statistics methods, such as Mann–Kendall test and run theory, were carried out to analyze the trend and the changes of extreme drought frequency and characteristics values. The research showed that the simulation accuracy of the EnM would better. SPI and HI take different factors into count and thus lead to differences in describing drought trend, extreme drought frequency, and characteristic values, such as drought severity, drought duration, mean drought severity, and max drought intensity. The research showed that both SPI and HI showed the same wetting or drying trend in the same timescales (except winter) as in the historical data. However, the future annual and seasonal drought trend reflected by SPI shows a wetting trend while HI shows a drying trend. Both in the past and the future, extreme drought frequency and characteristic values reflected by HI are higher than SPI. The drought trend is greater, and the extreme drought frequency and characteristics tend to be strengthened under RCP8.5. Low precipitation and high potential evapotranspiration (PET), especially the PET caused by temperature rise, are the main influencing factors of drought in the future. Therefore, the influence of the PET should not be ignored in drought analysis and we should strengthen the comparative study of different drought indices in future drought analysis under climate change.

1. Introduction

Drought is a long-term natural phenomenon wherein the water condition is less sustainable than the local normal situation. With global warming and the El Nino phenomenon in the Pacific Ocean intensifying the destabilization of the atmospheric structure, the ocean monsoons are unable to land and form rainfall, thus leading to frequent drought disasters around the world in recent years, including North America [1], Australia [2], East Africa [3], and Asia [4]. Drought disasters lead to a lack of drinking water for people and animals, and the destruction of crops and land. They can also reduce the width of river water level drop, and shut down the shipping industry [5,6,7,8]. It is of great significance to understand the temporal and spatial characteristics of drought for water resources planning and management.
Huai River Basin (HRB) is a typical large basin in the eastern China and it is one of the most important agricultural production areas in China. In the past decades, more drought events occurred in the HRB [9,10] and the cumulative drought affected area of HRB was 1.67 × 10⁹ hm2 during 1949–2010. In addition, more scholars have studied the drought situation and conditions in the HRB under climate change. Li et al. [11] pointed out that frequency, duration, severity, and intensity of drought in the HRB would rise from 2010 to 2099. Sun et al. [12] analyzed the hydrological drought regimes of the HRB and found that the frequency of hydrological droughts in the upper of the HRB was more than that in the middle of HRB under the climate change. He et al. [13] analyzed the annual and seasonal SPI series of the HRB and found that there has been a drying trend in spring and autumn, and a wetting trend in summer and winter. Their studies showed that HRB is prone to floods and droughts. Li at el. [14] found that the variation of the reference evapotranspiration (ETref) in the HRB could not generate obvious spatial diversity and the higher values concentrated in the northern basin. Climate change has caused severe situation of drought problems or risks in the basin, those previous studies have shown that the watershed water cycle would be altered under climate change and then influence the drought conditions, so it is necessary to strengthen the research on drought in the HRB under the influence of climate change.
Climate models provide an important tool for the study of climate change mechanism and climate change attribution. Up to now, there are many global climate models (GCMs) and regional climate models (RCMs) for studying climate change mechanism and exploring climate change factor. A series of GCMs can effectively simulate the average characteristics of large-scale grid, the characteristics of near surface temperature, high-level gas field and atmospheric circulation [10]. The Fifth Phase of Coupled Model Intercomparison Project (CMIP5) was designed by the World Climate Research Programmer’s (WCRP) Working Group on Coupled Modelling (WGCM) [15]. It determined to use a new scenario characterized by stable concentration typical concentration paths (RCPs). Compared with other early project, CMIP5 has higher spatial-temporal resolution, perfect or optimized physical, chemical parameterization scheme, coupler technology, and computing capacity, and at the same time, a considerable number of models have added dynamic vegetation model and carbon cycle model [15]. Therefore, CMIP5 has been an important tool to predict future climate change because it has good performances in the accuracy verification and application research of the different regions and CMIP5 has been used widely in various fields in recent years, such as near-surface wind speed, extreme precipitation, flood, and drought. Wang et al. [10] analyzed the drought tendency, frequency, and characteristics with three CMIP5 models, and found that the drought in Huai River Basin would have higher frequency and bigger characteristic values under the high scenario. Ma et al. [16] used the CMIP5 to study the trend of arid/humid climate in China and determine the area of arid/humid pattern change in the next 100 years, and found that the humid area would suffer obvious shrinkage, and the arid/humid transition zone may lead to expansion. Zha et al. [17] used 24 CMIP5 models to study the near-surface wind speed (SWSs) over eastern China, and found that the annual mean SWSs could show a weak strengthening over the next 20 years. Sun et al. [18] evaluated 14 global climate models in CMIP5 to capture China’s extreme climate events and agricultural climate index. Wang et al. [
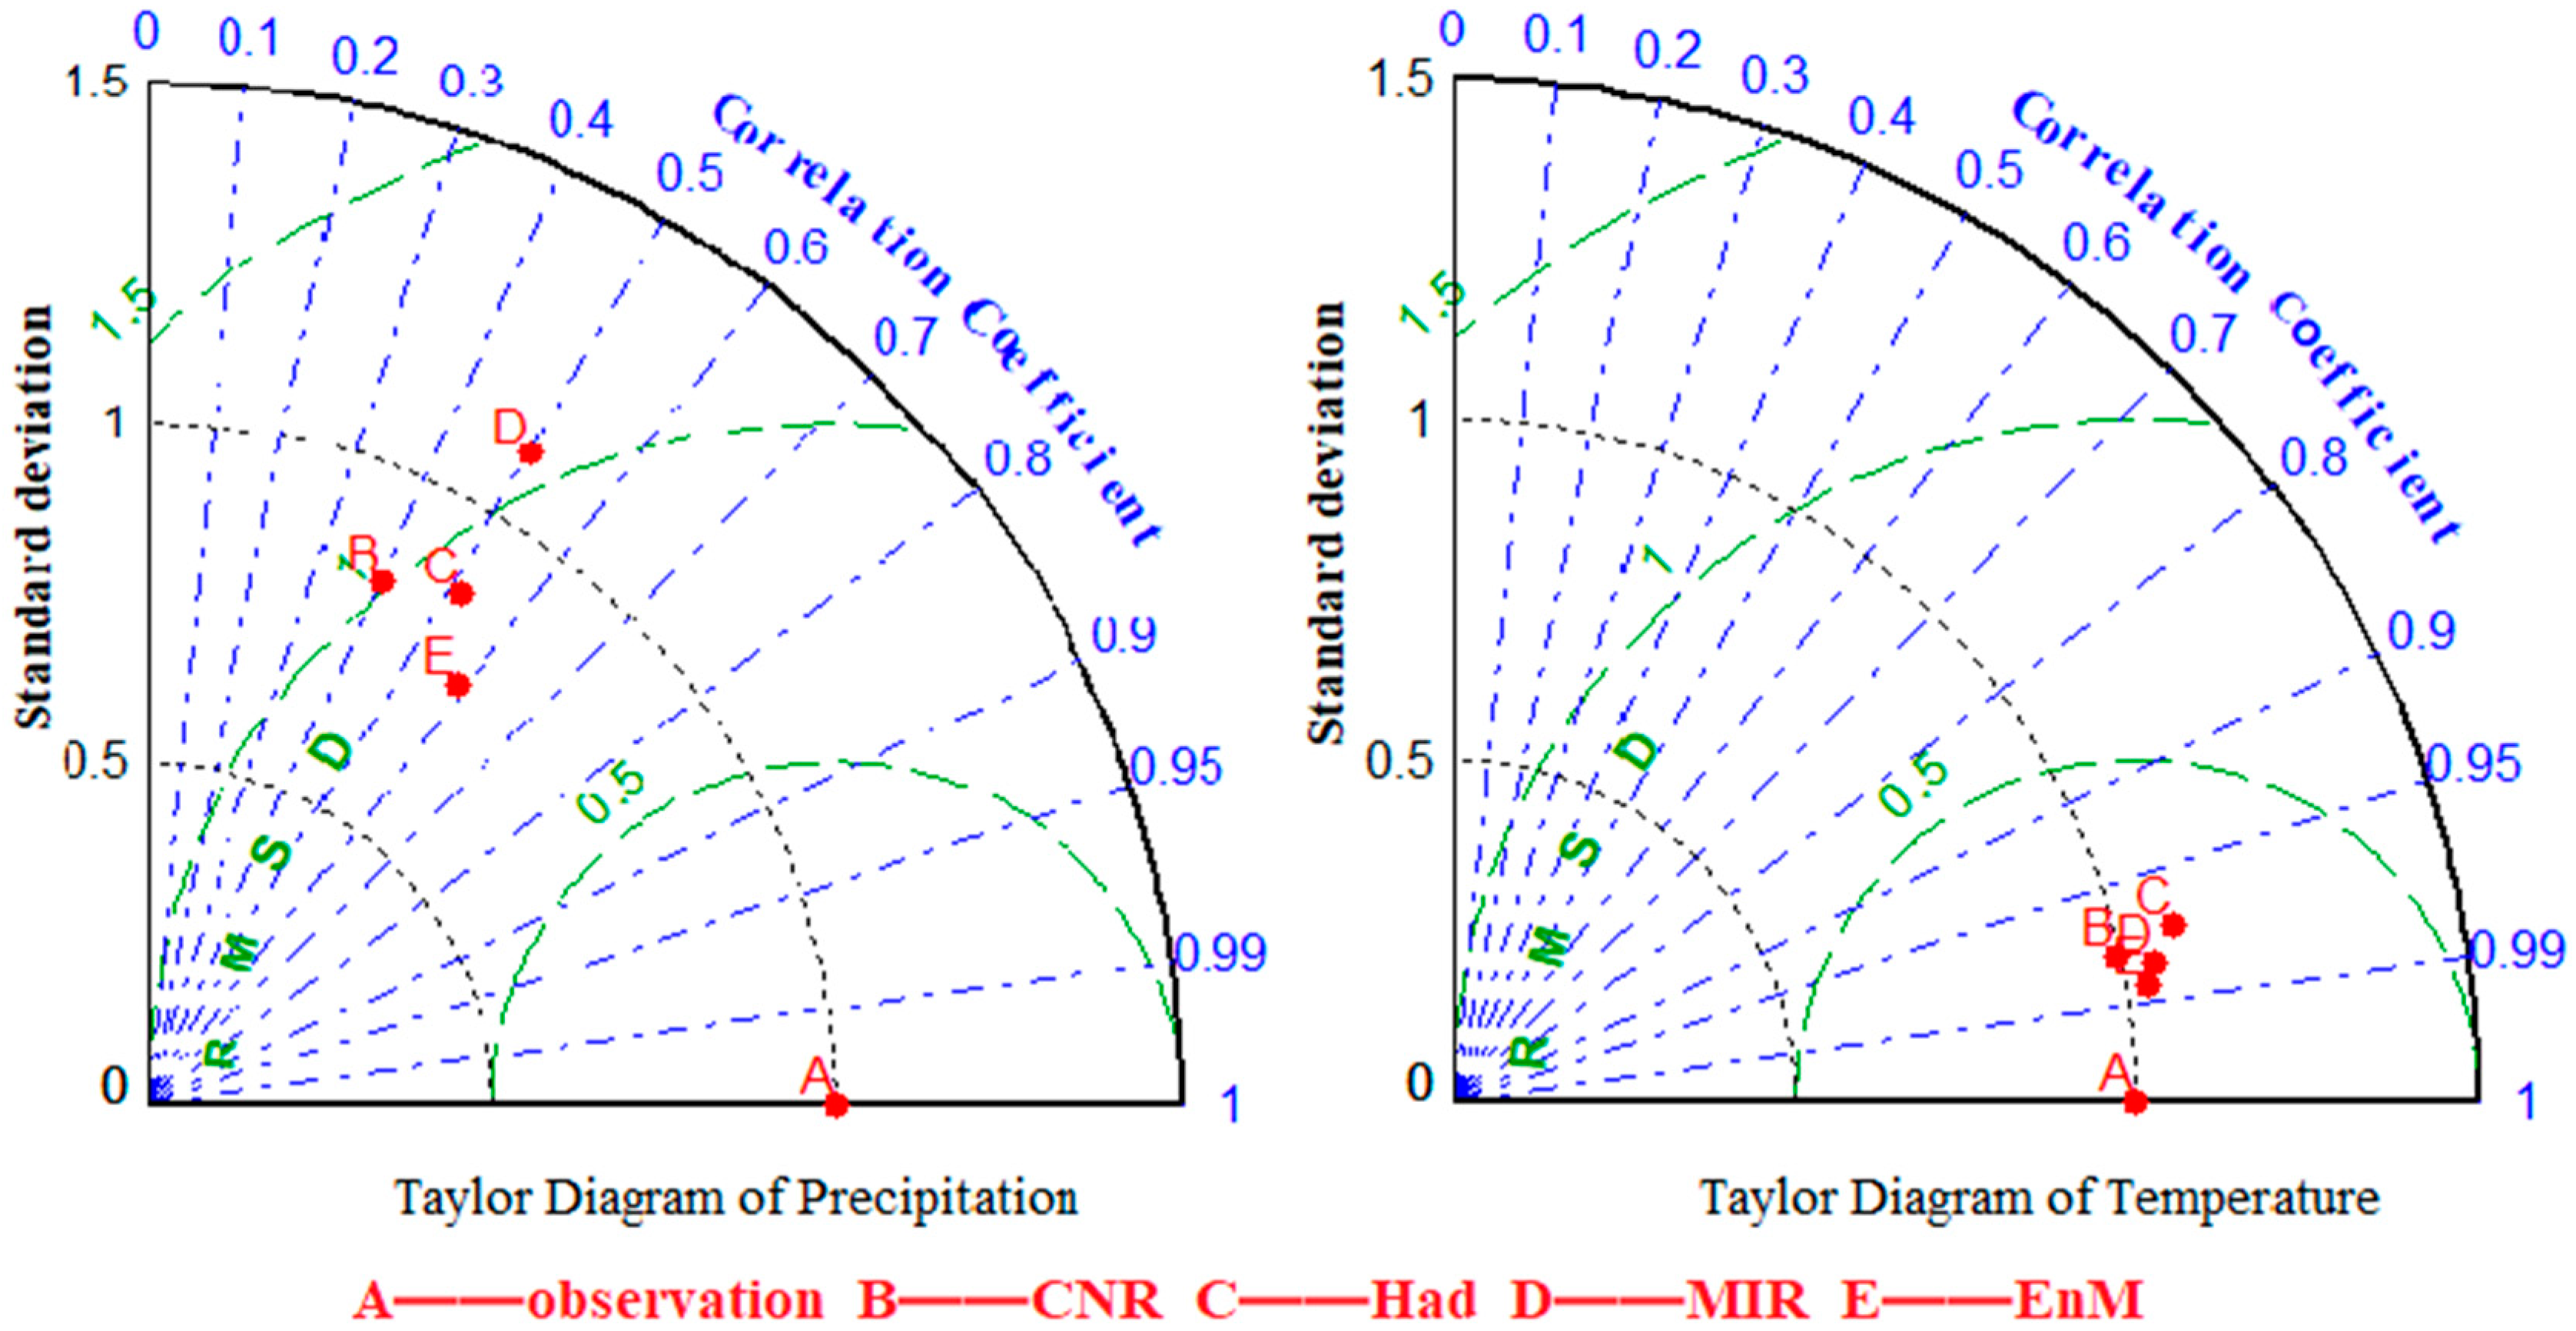
19] used CMIP5 models to analyze the spatiotemporal variation of future drought in the Pearl River Basin (PRB) and found that the PRB may face serious drought threat in the future. Thus, CMIP5 could be well applied to the study of climate related impacts, especially in drought research. In this study, three GCMs which have better simulation accuracy in China—such as CNRM-CM5 (CNR), HadGEM2-ES (Had), and MIROC5 (MIR)—were used to combine an ensemble model (EnM). Considering the temperature would continue rising in the future, the medium carbon emission scenario (RCP4.5) and high concentration carbon emission scenario (RCP8.5) are selected as future research background to analyze the changes of drought trends and extreme drought frequency and characteristics under climate change in upper and middle reaches of HRB (UMHRB).
Drought could be quantified by drought index for providing drought severity, drought duration, drought intensity, and so on [20]. More and more drought indices were developed in drought monitoring and quantification [21]. The commonly used drought indices include palmer drought index (PDSI) [22], standardized precipitation index (SPI) [23], standardized precipitation evapotranspiration index (SPEI) [24], comprehensive drought index (CI) [25], reconnaissance drought index (RDI) [26], humid index (HI) [27], etc. The SPI is probably the most widely used meteorological drought index in the world because it only needs precipitation data and the result is reliable [28]. Labedzki et al. [29] used SPI to verify the precipitation condition forecast and found that the 10-day SPI forecast was reliable no matter the SPI classification forecast or the SPI value forecast, and the 20-day forecast should be reserved, accepted, and used cautiously. Sobral et al. [30] found that SPI could better reflect the drought situation in Rio de Janeiro in Brazil. SPI plays an important role in the analysis of drought characteristics because the income of precipitation does have a direct impact on the occurrence and evolution of drought. However, it should not be ignored that the water expenditure, such as the potential evapotranspiration (PET), also has a direct impact on the evolution of drought. Therefore, taking the expenditure of the PET into account has become the focus of scholars’ research in recent years; thus some droughts indices, such as SPEI and HI, have been developed. Because the research of meteorological drought focuses on describing the change process of the dry and wet state in the time domain, HI is also used to express the surface dry and wet state, which can reflect the water and heat balance of a certain area. Compared with SPI, HI is not only needs precipitation data, but also considers the PET. Ma et al. [27] constructed the surface moisture index by using monthly precipitation and monthly average temperature and finally found that the frequency of extreme drought in northern China increased significantly in recent 10 years. Wang et al. [31] used HI to analyze the dry-wet condition in southwestern China and found that the southwest of China had a decreasing trend in fluctuation and its change tendency rate was −0.005/10a tending to drought in the past 52 years. Considering that drought depends on the water collection (such as precipitation) and expenditure (such as the PET loss), different drought indices may have differences in the description of drought in the same region. Therefore, in order to reduce the uncertainty of the description of regional drought characteristics based on different drought indices, this study chose SPI and HI to analyze the drought in the upper and middle reaches of the Huai River Basin (UMHRB).
In view of the importance of the research and the shortcomings of the previous analysis, the main tasks of this study are as follows: Section 2 introduces the general situation and data sources of the research area, the accuracy of selected climate models, and brief descriptions of the analysis methods. In Section 3, the study analyzes the drought tendency changing, the extreme drought frequency, and the characteristic values. Section 4 discusses the different results between SPI and HI, the division of truncation level with extreme drought, and the uncertainty of the datasets. Finally, Section 5 gives the conclusions of this study.

2. Materials and Methods

2.1. Study Area

The Huai River Basin (HRB) located in the east of China and situated in the middle of the north–south climatic transition zone, which also is an important food production base and industrial development area in China. The special geographical location and climate, water and heat conditions make the drought of HRB have significant characteristics. Therefore, it is necessary and important to analyze the drought in HRB. This study focused on the upper and middle reaches of the HRB (UMHRB), and the location of the UMHRB and the distribution of surface meteorological stations were shown in Figure 1. The drainage area is about 16 × 104 km2, accounting for 59.3% of HRB (about 27 × 104 km2). The basin topography of HRB is mainly characterized by low plain. In addition to the middle and high mountains near the basin boundary, there are many lakes and low-lying lands. Precipitation mainly occurs during the periods from June to September, with great inter-annual and seasonal changes.

2.2. Datasets

2.2.1. Historical Observation Datasets

The data of ground observation stations are obtained from China Meteorological Data Network (http://data.cma.cn/), including the monthly precipitation and temperature data of 19 meteorological stations of UMHRB from 1960 to 2015. The missing and some abnormal values have been interpolated based on the measured data in the previous five years and the next five years. The average precipitation and temperature of the UMHRB were calculated by using the Thiess polygon method. Thiess polygon method is also called vertical bisection method or weighted average method. Firstly, straight lines to make the vertical bisector of each line connect the adjacent stations in the basin. The basin is divided into several polygons, each of which has a measuring point. Then, according to the divided vertical bisector polygons, the area A i of each polygon can be calculated. If the total area of the basin is A , the weight coefficient f i of each station is
f i = A i / A       i = 1 , 2 , 3 , n
R f a c e = R 1 f 1 + R 2 f 2 + + R i f i
R i is the precipitation of the ith polygon and f i is the weight coefficient of the ith meteorological station.
Historical observation datasets are particularly important. They can be an important standard for selecting climate models, Moreover, they can show the historical dry or wet conditions accurately and as the contrast object of future drought analysis.

2.2.2. Future Simulation Datasets

CMIP5 as an important tool for analyzing climate change has been used widely in recent years. Some relevant studies have found that many models (such as CNRM-CM5 (CNR), HadGEM2-ES (Had), and MIROC5 (MIR)) have good accuracy in China, and the research group has compared several CMIP5 models in previous studies and carried out relative optimization [10]. Therefore, this study employed CNR, Had, and MIR CMIP5 models to analyze the drought trend and extreme drought frequency and characteristics. The specific information about the three CMIP5 models is shown in Table 1.
Future simulation data in this study were provided by the CMIP5 website (http://pcmdi3.llnl.gov/es-gect/home.htm), which contained precipitation and temperature. The required datasets were NC files and they were intercepted based on R software. In this study, these three CMIP5 models were used to form an ensemble model (EnM) and finally analyze the drought conditions based on the EnM datasets.

2.3. Accuracy Test of CMIP Dataset

Taylor diagram was used in the study to test the accuracy of CNR, Had, MIR, and EnM based on the historical observation data of precipitation and temperature (Figure 2). The correlation coefficient of precipitation simulation of each model is between 0.4–0.6, the standard deviation is between 0.7–1.2 and the root mean square error is about 1, while the correlation coefficient of temperature simulation of each model is between 0.95–0.99, the standard deviation is about 1, and the root mean square error is less than 0.5. In sum, the simulation effect of temperature is better than that of precipitation, and the EnM is better than single CMIP5 model. These results are closer to those of Wang et al. [32] who also pointed out that the average value of multiple model set simulation was better than most single model results. Therefore, the study of future drought conditions in UMHRB is based on EnM in 2020–2099.

2.4. Methods

2.4.1. Standardized Precipitation Index (SPI) and Humidity Index (HI)

The study is based on SPI and HI. SPI is a widely used drought index because of its wide applicability, and it does not consider temperature. However, a large number of climate change studies have shown that the temperature would rise significantly in the future. Therefore, it is necessary to use the drought index with which is considering the influences of temperature, such as HI, for supplementing quantitative evaluation of drought events.
The SPI is a kind of multi-time scale drought index developed by McKee et al. [23] in 1993, it uses gamma function to describe the change of precipitation. The SPI can reflect the intensity and duration of drought, and it is sensitive to the change of drought. At the same time, the characteristics of multi-time scale application can serve for water resources assessment and drought monitoring in different time scales. The detailed descriptions of the SPI calculation could be found in the references of McKee et al. [23] and Wu et al. [28]. The calculation steps are as follows:
Step 1: Assuming that the precipitation in a certain period is x , the probability density function of Γ distribution is
f ( x ) = 1 β γ Γ ( γ ) x γ 1 e x / β       x > 0
where, β and γ are scale and shape parameters respectively, which could be obtained by maximum likelihood estimation method
γ ^ = 1 + 1 + 4 A / 3 4 A
A = lg x ¯ 1 n i = 1 n lgx i
β ^ = x ¯ / γ ^
After the parameters in the probability density function are determined, for the precipitation of a certain year x 0 , the probability that the random variable x < x 0 is calculated as
F ( x < x 0 ) = 0 x 0 f ( x ) d x
Step 2: Probability of event when the estimated precipitation is 0
F ( x = 0 ) = m / n
where m is the number of samples with m precipitation of 0, and n is the total number of samples.
Step 3: The probability of Γ distribution is normalized, it means that the probability value obtained from Equations (7) and (8) is substituted into the normalized normal distribution function
F ( x < x 0 ) = 1 2 π 0 x 0 e z 2 / 2 d x
Step 4: Approximate solution to Equation (9)
SPI = S [ t ( c 2 t + c 1 ) t + c 0 [ ( d 3 t + d 2 ) t + d 1 ] t + 1.0 ]
in which
t = ln 1 F 2
with the following constant values: c 0 = 2.515517, c 1 = 0.802853, c 2 = 0.010328, d 1 = 1.43278, d 2 = 0.189269, d 3 = 0.001308.
The Humidity Index (HI) takes into account two main factors, such as precipitation and the potential evapotranspiration (PET), which affect the changes of surface moisture and dryness. The increase of precipitation could let the surface to be wetter, while the increase of PET could make the surface to be drier. In recent years, HI has shown better applicability in the study of drought, extreme drought and dryness and wetness changes in China. The calculation of HI is [8,33]
HI = P PET
where the PET is calculated based on Thornthwaite method [34,35]. The advantage of Thornthwaite method is that it only needs the temperature and only considers the impact of surface energy on PET.
SPI and HI calculation can be divided into 1, 3, 6, 9, 12, and 18 months and other time scales, and different time scales represent different water accumulation states. It is suggested that the time scale of drought events should not be too short or too long because of the distinct four seasons and the obvious seasonal variation characteristics of drought events in the Huai River Basin. Therefore, the SPI and HI of three-month scale (SPI-3 and HI-3) are suitable for identifying the continuous drought events in the basin, because the three-month scale will neither cause the drought index to change too fast nor too slow. At the same time, SPI-12 and HI-12 in December of each year were used as the annual drought index indicating water shortage in a given year. SPI-3 and HI-3 in February, May, August, and November were used to indicate water shortage in a given winter, spring, summer, and autumn, respectively [10].
According to different SPI and HI values, drought categories could be divided into five grades (Table 2), such as none, mild, moderate, severe, and extreme, respectively. The drought categories of SPI were based on the research of McKee et al. [23] and the classifications of HI were calculated by the drought classification of Moisture Index (MI) [36].
In order to consider the comparability of different drought indices, standardized time series of SPI and HI are used for comparison. Both Ma [27] and Zhou [33] adopt the value of the standardized HI time series below the −0.5 as the truncation level of extreme drought, and they have analyzed the characteristics of the extreme droughts in the north of China and the Shi Yang River Basin in northwest of China, respectively. In addition, for studying the extreme drought characteristics in the UMHRB and further comprised the two drought indices, the standardized value of −0.5 was selected as the truncation level of extreme drought.

2.4.2. Mann–Kendall Test for Drought Trend

Mann–Kendall (M-K) test [37] is a nonparametric test recommended by the World Meteorological Organization and has been widely used. It can test the significance of the change trend of time series or the mutation test. The advantage is that it does not need the sample to follow a certain distribution, nor is it interfered by a few abnormal values [10]. In this study, the original M-K test is employed to identify the trend of SPI and HI series. Fang et al. [38] given the detailed descriptions.
Assuming one series X = { x 1 , x 2 , , x n } , the M-K test statistic S is estimated as
S = i = 1 n 1 j = i + 1 n sgn ( x i x j )
in which
sgn ( x i x j ) = { 1 , i f   x j > x i 0 , i f   x j = x i 1 , i f   x j < x i
Note that the positive and negative values of S represent the up and down trend in the time series, respectively. Under the assumption that all elements in X are randomly arranged and independent, S is a normal random variable with variance S [ V a r ( S ) ] is estimated using Z statistics to determine trend significance
Z = { S 1 V a r ( S ) i f   S > 0 0 i f   S = 0 S + 1 V a r ( S ) i f   S < 0
The basic statistic Z of this test and the critical value | Z 1 α / 2 | based on the given significance level α (usually let α = 0.05 or 0.01) can be found in the standard normal distribution table. When α = 0.05 , | Z 1 α / 2 | = 1.96 , when α = 0.01 , | Z 1 α / 2 | = 2.58 . If | Z | > | Z 1 α / 2 | , there is a significant trend of change. When Z is negative, it is a downward trend; when Z is positive, it is an upward trend.

2.4.3. Run Theory for Discovering Extreme Drought Characteristics

Run theory was proposed by Yevjevich [39] in 1967, it was employed to recognize the characteristics of drought. A run is composed by a part of the time series of drought variables, where each value is higher or lower than a given truncation level [40]. In this study, the value of −0.5 was selected as the truncation level. If the SPI and HI standardization value is below −0.5, then that will be classified as extreme drought. This study chooses drought severity, drought duration, mean drought severity and max drought intensity to analyze the extreme drought events in HRB. Drought severity refers to the severity of extreme drought climate, and the number of drought months is used to analyze the duration of drought. The mean drought severity is divided by the drought severity and drought months. The max drought intensity refers to the peak value of drought severity, which is used to evaluate the most serious situation of extreme drought in the future.

3. Results and Analysis

3.1. Drought Tendency Changes Historically and in the Future

3.1.1. Interdecadal Linear Trend for the Monthly SPI-3 and HI-3 in Past and Future

The time series of SPI-3 and HI-3 standardized values are shown in Figure 3 and their interdecadal linear slope are shown in Table 3.
Historically, SPI-3 values showed a downward trend from the 1960s to the 1990s. In the early 21st century, SPI-3 values showed an upward trend. While HI-3 values showed a downward trend from the 1970s to the 2000s, and an upward trend occurred in the 1960s and 2010s. The overall linear trend of SPI-3 did not change significantly, but the overall linear trend of HI-3 declined and showed a drying trend.
Under the RCP4.5 scenario, both SPI-3 and HI-3 have a drying trend in the 2020s and 2080s but they are showing a wetting trend in 2030s and 2090s. In the 2050s through to the 2070s, SPI-3 shows wetting-wetting-drying trend while HI-3 shows the opposite trend. The overall linear trend reflected by SPI-3 and HI-3 are opposite. SPI-3 shows a wetting trend, while HI-3 shows a drying trend.
Under the RCP8.5 scenario, the most interdecadal drying and wetting trend reflected by SPI-3 and HI-3 keep the same (except 2030s and 2070s). The overall linear trend reflected by SPI-3 and HI-3 are also opposite. SPI-3 shows a wetting trend, while HI-3 shows a drying trend.
The SPI-3 shows wetting trend in the future is faster than that in the historical data. HI-3 shows a drying trend in the past and the future, but the drying trend in the future is also faster than that in the past. No matter wetting or drying trend reflected by SPI-3 and HI-3, the performance of RCP8.5 scenario is more obvious than that of RCP4.5 scenario.

3.1.2. Mann–Kendall Test for the Annual (SPI-12 and HI-12) and Seasonal (SPI-3 and HI-3) Time-Scales in the Past and Future

The result of Mann–Kendall test for annual (SPI-12 and HI-12) and seasonal (SPI-3 and HI-3) timescales in the past and future shown in Table 4. The difference between SPI and HI are obvious.
Historically, SPI and HI showed that all-time scales did not pass the significance test. Both SPI and HI reflected drying trend in the annual, spring, and autumn periods while those same indices reflected a wetting trend in summer. In winter, SPI-3 reflected wetting trend, while HI-3 reflected drying trend.
In the future, SPI shows that UMHRB would have a wetting trend no matter what timescales. However, HI shows that UMHRB would have a drying trend no matter what timescales. Under the RCP4.5 scenario, mostly time scales (except summer) reflected by SPI would have passed the confidence test with the significance level of 0.05. Meanwhile, the season of summer reflected by HI would have passed the confidence test with the significance level of 0.05, while the season of winter would have passed the confidence test with the significance level of 0.01. Under the RCP8.5 scenario, all-time scales reflected by SPI pass the confidence test of significance level of 0.01. More seasons (except summer and autumn) and annual timescale reflected by HI would have passed the confidence test with the significance level of 0.01.
In a few words, SPI and HI reflected the same dry or wet trend at the same time scale (except winter) in the historical data. Although the dry or wet trend reflected by SPI and HI are different in the future, both of them show more significant trend under RCP8.5 scenario.

3.2. Extreme Drought Frequency Comparison Based on SPI and HI in the Past and Future Periods

3.2.1. Inter-Decadal Extreme Drought Frequency in the Past and the Future Periods

The interdecadal extreme drought frequency (SPI-3 and HI-3) in the past and the future are shown in Table 5.
Historically, SPI-3 showed that the inter-decadal extreme drought frequency was higher between 1960s and 1990s but was lower in 2000s, while, HI-3 showed the inter-decadal extreme drought frequency had a gradual increase from 1970s to 2000s. At the beginning of the 21st century, the inter-decadal extreme drought frequencies reflected by the SPI and HI were showing a great difference, they were 29 and 47 times, respectively. The difference was smaller in other inter-decadal, no more than 5 times.
Under the RCP 4.5 scenario, the extreme drought frequency of SPI-3 would be higher than HI-3 from 2020s to2040s. Both SPI-3 and HI-3 reflect the higher extreme drought frequency in 2050s. Since 2060s, the extreme drought frequency reflected by SPI-3 would be much less than that by HI-3.
Under the RCP 8.5 scenario, SPI-3 shows that the higher extreme drought frequency would concentrate between 2020s and 2040s and would be lower from 2050s to 2090s, but the conditions by HI-3 are opposite.

3.2.2. Annual and Seasonal Extreme Drought Frequency in the Past and the Future

The annual (SPI-12 and HI-12) and seasonal (SPI-3 and HI-3) extreme drought frequency in the past and the future are shown in Table 6.
Historically, the periods of annual and the seasonal extreme drought frequency reflected by SPI-12 and HI-12 were closer. The frequency of extreme drought reflected by HI was slightly higher.
In the future, the scenarios of annual extreme drought frequency reflected by SPI-12 from higher to lower are RCP4.5 and RCP8.5. While the scenarios of annual extreme drought frequency reflected by HI-12 from higher to lower are RCP8.5 and RCP4.5. Under the RCP4.5 scenario, the seasons of seasonal extreme drought frequency reflected by SPI-3 and HI-3 are most in summer and winter. Under the RCP8.5 scenario, the seasons of seasonal extreme drought frequency reflected by SPI-3 and HI-3 are most in summer, autumn, and winter.
Due to the length of historical and the future periods are different, the annual and seasonal average decadal extreme drought frequency needs to be further explored. The historical period and future scenarios of annual average decadal extreme drought frequency reflected by SPI-12 from higher to lower are RCP4.5, history, and RCP8.5. While the historical period and future scenarios of annual average decadal extreme drought frequency reflected by HI-12 from higher to lower are RCP8.5, RCP4.5, and history.
Under the RCP4.5 scenario, in terms of SPI, only the average decadal extreme drought frequency of winter is higher than that of historical periods. While, in terms of HI, the average decadal extreme drought frequency of summer and winter are higher than that of historical periods.
Under the RCP8.5 scenario, in terms of SPI, only the average decadal extreme drought frequency of autumn is higher than that of historical periods. While, in terms of HI, the average decadal extreme drought frequency of all seasons is higher than that of historical periods.
To sum up, HI considers the PET factor, while SPI only considers the precipitation factor. Therefore, the extreme drought frequency reflected by HI is generally higher than SPI. Moreover, as the concentration of the emission scenario increases, the gap between HI and SPI is growing.

3.2.3. Monthly Extreme Drought Frequency in the Past and Future

The monthly extreme drought frequency (SPI-3 and HI-3) in the past and the future are shown in Figure 4.
Historically, the monthly extreme drought frequency reflected by HI-3 was higher than SPI-3. In contrast, both SPI-3 and HI-3 showed that the historical extreme drought often occurred in March, April, June, July, and August, and the difference between the two indices was little in those months. In other months, the monthly extreme drought frequency reflected by HI-3 was mother higher than SPI-3. Under the RCP4.5 scenario, SPI-3 shows that February, July, August, and October would have the higher extreme drought frequency, while the monthly extreme drought frequency reflected by HI-3 shows that January, February, March, July, August, September, October, November, and December would be the months with relatively higher extreme drought frequency in the future.
Under the RCP8.5 scenario, extreme drought occurs mainly in January to March and July to December. The monthly extreme drought frequency reflected by HI-3 is higher than SPI-3, and the extreme drought frequency reflected by the two indices are nearly only in September.
As the temperature increases in the future, the significant rising of temperature will play a more important role on the drought conditions and this performance is more obvious under the RCP8.5 scenario. Khan et al. [41] have also concluded that the PET was a very significant component in the hydrological cycle, and it could not be ignored for the future drought forecasting due to the global warming.

3.3. Extreme Drought Characteristics Comparison Based on SPI and HI in the Past and Future

3.3.1. Inter-Annual Changes in Characteristics of Extreme Drought in the Past and Future

Inter-annual changes of extreme drought characteristics in the past and the future are shown in Figure 5.
Drought severity reflected by the SPI and HI in the historical periods were basically keep the same fluctuation and change in most of the periods. However, SPI-3 of the two scenarios would be greater than HI-3 in 2020–2040, HI-3 of the two scenarios would be greater than SPI-3 in 2060–2090. Considering that the trend of temperature has risen significantly in the future, it seems that the drought severity of HI is more serious.
Drought duration reflected by SPI and HI in the historical periods were basically keep the same fluctuation. The max drought duration were not more than 8 months. Under the RCP4.5 scenario, SPI-3 reflects higher drought duration than HI-3 in 2020–2050 and then HI-3 has higher drought duration after 2050. Under the RCP8.5 scenario, SPI-3 reflects higher drought duration than HI-3 in 2020–2040 and then HI-3 has higher drought duration after 2040. The duration of drought increased in the middle and late 21st century, especially in 2040 and 2078 with which the two whole year would be extremely drought under the RCP8.5 scenario.
Mean drought severity reflected by SPI-3 was higher than HI-3 in historical periods, and the gap between the two indices was the largest in 2010. In the future, mean drought severity would be basically keep the same fluctuation by SPI-3 and HI-3. In general, mean drought severity of the RCP8.5 scenario would be slightly higher than that of the RCP4.5 scenario.
Max drought intensity reflected by SPI-3 was higher than HI-3 in the most of historical periods. In the future, max drought intensity reflected by SPI-3 would be higher than HI-3, such as 2020–2040 under the RCP4.5 scenario and 2020–2060 under the RCP8.5 scenario. Overall, the max drought intensity of RCP4.5 scenario fluctuates greatly, while the max drought intensity of RCP8.5 scenario is relatively regular.

3.3.2. Statistical Changes in Characteristics of Extreme Drought in the Past and Future

The multi-year average values of historical and future extreme drought characteristics are shown in Figure 6. In terms of annual drought severity, SPI-3 shows that the drought severity under RCP4.5 scenario is lower than that in the historical period, while the drought severity under RCP8.5 scenario is higher than that in the historical period. HI-3 reflects that annual drought severity would rise in the future under the RCP4.5 and RCP8.5 scenario. In terms of annual drought duration, both SPI-3 and HI-3 reflect that it would decrease under the RCP4.5 scenario and would increase under the RCP8.5 scenario. Both SPI-3 and HI-3 show that the mean drought severity and max drought intensity would be relatively lower in the future. However, the mean drought severity and max drought intensity described by SPI-3 would be larger than HI-3.
The phenomenon of the different extreme drought characteristics describing with different drought indices was also found by Khan et al. [41]. Therefore, in order to explore the impacts of the future climate change on drought characteristics, more attention should be paid to distinguish the results of different indices.

4. Discussion

4.1. Different Calculation Methods between SPI and HI

Generally, different drought indices put particular emphasis on different aspects of drought, and they require different variables for their estimation. Therefore, various indices could yield different results for a specific drought event [42,43]. The SPI is mainly calculated by precipitation, and the results of this study shows the UMHRB tend to be wetter in the future. While HI is mainly calculated based on precipitation and the PET, and the results shows the UMHRB tend to be dryer. 
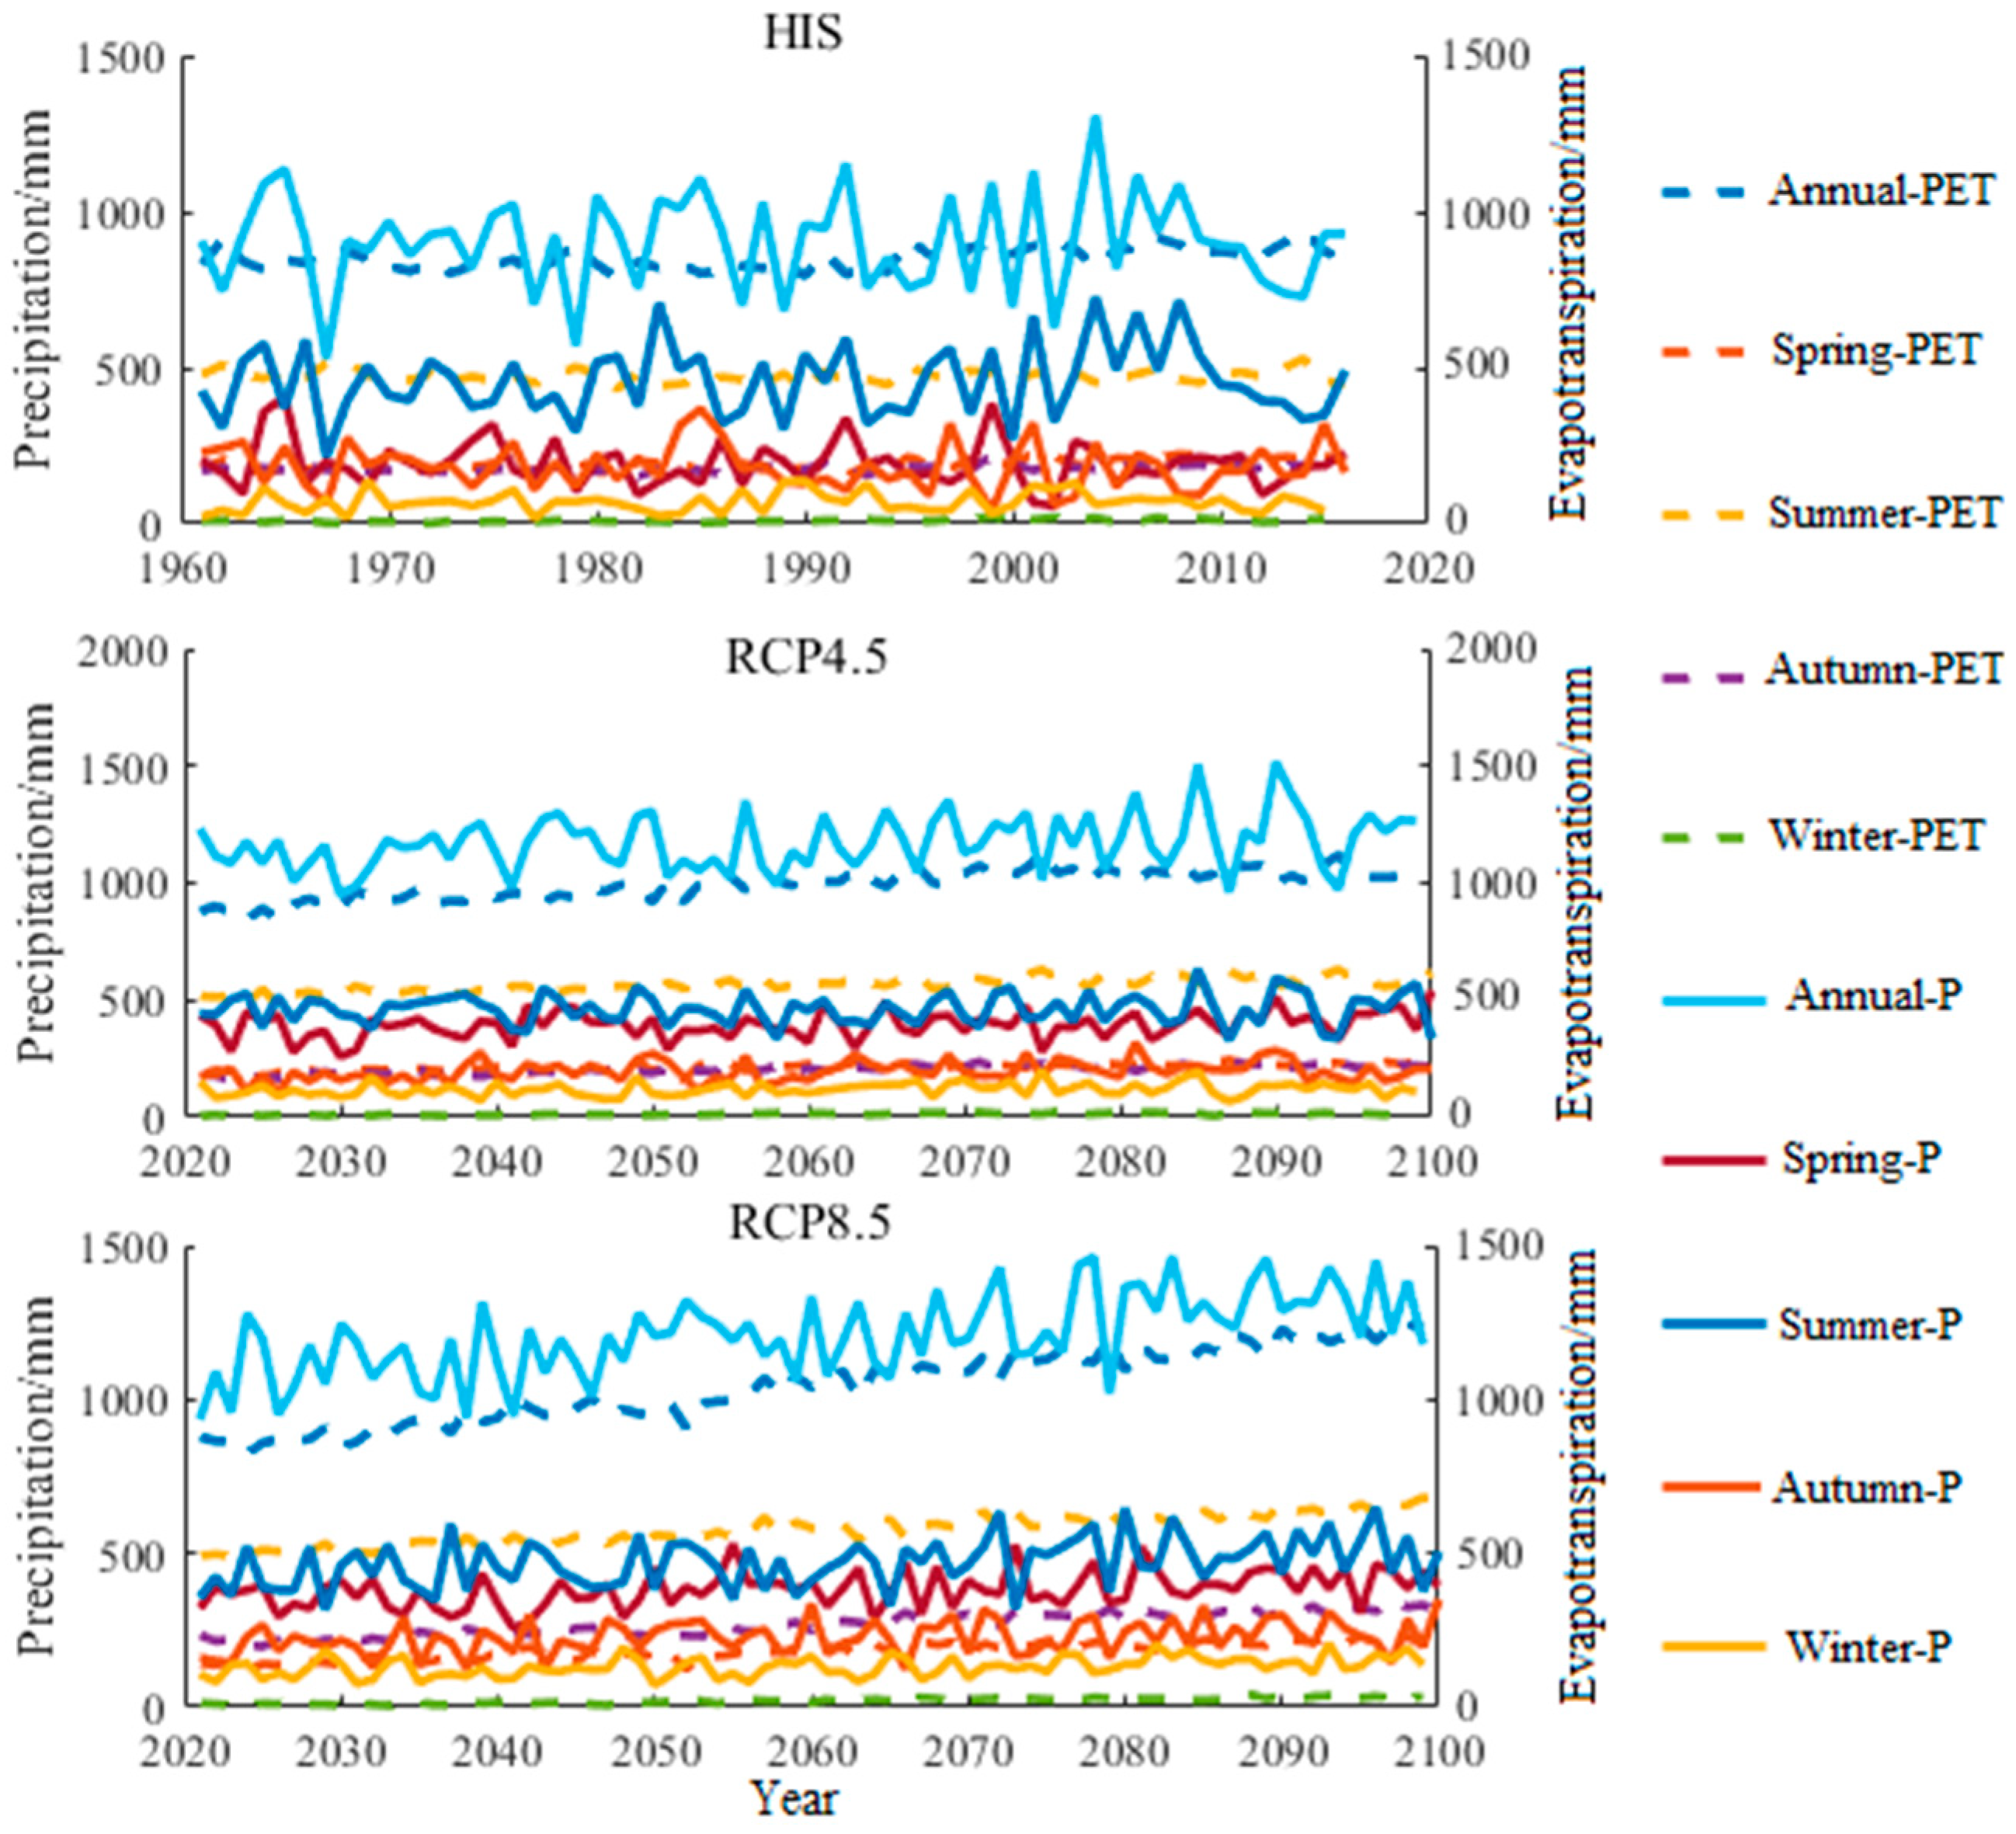
Figure 7 shows the changes of precipitation and the PET on the timescales of annual and four seasons and Table 7 shows the detailed trend value of precipitation and the PET.
Under the annual scale in the past, the trend value of the PET was 7.15 while the trend value of precipitation was 0.13. That was why SPI -12 and HI-12 showed a dryer trend in the past, and the performances of HI-12 was more serious that of SPI-12. In the future, the trend value of precipitation under the RCP4.5 is 7.11 and the trend value of precipitation under the RCP8.5 is 14.02. Therefore, the SPI-12 shows wetter trend in the future, and the severity of humid in the RCP8.5 scenario is more serious than that in the RCP4.5 scenario. The PET would also increase significantly in the future, the trend value of the PET under the RCP4.5 is 19.33 and the trend value of the PET under the RCP8.5 is 22.13. No matter what the scenario, the annual scale of the rising trend of the PET is significantly higher than that of precipitation, it indicates that the PET is dominant. Therefore, HI-12 shows drought trend in the future, and the drought trend of RCP8.5 is higher than that of RCP4.5.
Historically, the precipitation in spring and autumn had a downward trend, with the trend values were −2.21 and −1.98, respectively. Therefore, SPI-3 showed drought trend in the spring and autumn. While the precipitation in summer and winter showed an upward trend, with the trend values were 2.14 and 2.11, respectively. Therefore, SPI-3 showed a humid trend in summer and autumn. The PET showed an upward trend in spring and autumn, with their linear trend values were 8.95 and 7.98, respectively. Combined with the characteristics of precipitation decreasing in spring and autumn, HI-3 showed drought trend in spring and autumn. The trend of the PET had a downward trend in summer with the linear trend value −0.84. Therefore, HI-3 showed wetter trend in summer. The trend of the PET is 7.11 in winter, it is much higher than that of precipitation. Therefore, HI-3 shows the drought trend in winter.
In the future, all seasonal precipitation shows an upward trend under the emission scenarios of RCP4.5 and RCP8.5, so SPI-3 shows humid trend in the future of any seasons. The two emission scenarios are based on the different concentrations of greenhouse gases such as CO2, resulting in the gradual rise of the simulated temperature. Therefore, the PET also increases with the rise of the temperature. The PET of RCP4.5 in spring, autumn, and winter would not change much compared with historical data. However, the PET of RCP8.5 in spring and autumn increase significantly and the PET in autumn would be higher than that in spring. Under the two emission scenarios, the rising trend of seasonal PET is higher than that of precipitation (except winter). This phenomenon under the RCP8.5 is more significant than RCP4.5. Therefore, HI-3 shows drought trend in the future of any seasons, drought trend of RCP8.5 is more serious than that of RCP4.5 under the same time scale.
Obviously, the PET is very important for drought analysis. Wang et al. [10] and Yu et al. [44] also considered the PET should not be neglected in future drought analysis. Many authors have noticed that the main discrepancies between existing drought indices were caused by uncertainty in atmospheric water demand used in evaluating drought indices [45,46,47], especially in water-limited regions where the actual atmospheric water uptake was primarily dominated by change in precipitation rather than in the PET [48]. Therefore, it is particularly important to use different drought indices for drought assessment in different regions for further drought research.

4.2. Division of Truncation Level with Extreme Drought

In this study, the standardized value of −0.5 was selected as the truncation level to discovering the extreme drought event from the standard time series of the SPI and HI drought indices. According the results shown in Section 3.2, the frequency of extreme drought seems higher under the truncation level, while, it is consistent with the results of Zhou [33] whom also obtained that the extreme drought frequency reflected by HI was also higher in the studied region. This could be due to the value which would be used as the truncation level of extreme drought.
However, it also indicated that the truncation level of different drought categories is very important for the research results. In order to improve the accuracy of drought analyze and the applicability of drought indices, it should be paid more attention to the original division interval of each single drought index and the comparisons of different drought indices in the future.

4.3. Accuracy and Uncertainty of Model Data and Variable Estimation

Reliable long-term meteorological and hydrological data are the basis for drought effective evaluation [49]. In this study, the future precipitation and temperature data are come from CMIP5 datasets. CMIP5 have been improved in many aspects, such as experiment design, especially in physical parameterization and model resolution. It has been widely used in climate change research in many areas and has been proved as a valuable tool for climate change research. To some extent, it can improve the simulation effect of temperature and some atmospheric circulation evolution characteristics, but it does not seem to improve the precipitation simulation very well [50]. In addition, CMIP models underestimate multi-decadal trends in surface radiation fluxes and then the Ensemble of some CMIP models would also underestimate multi-decadal trends in surface solar radiation fluxes. Lastly, the spatial resolution of CMIP5 datasets is lower and the accuracy of future prediction data remains to be verified. All of these situations would have some certain impacts on the results of this study.
In addition, another significant difference is that the CMIP5 simulation of temperature shows a strong warming trend while the CMIP5 simulation of the precipitation shows a relative slower growing trend. This may lead to certain impacts in HI because the calculation need the PET which has a great relationship by the temperature, especially in this study the Thornthwaite method has been chosen for the PET calculated only based on the temperature. Yang at el. [51] also found that Thornthwaite method was significantly lower in the subtropics, whereas it was significantly higher in the tropics and high latitudes. Although the contribution of heat factor to the PET is relatively higher, but with the change of climate conditions throughout the year, the impact of aerodynamic factors is also constantly changing. The calculation accuracy of the PET by Thornthwaite method may not be as good as that by Penman–Monteith method with which should need more meteorological information. Therefore, it is necessary to take aerodynamic factors into account in the future drought research and analysis.

4.4. Attentions Should Be Paid in Further Drought Research

In this study, HI showed that the future extreme drought of the HRB is stronger than SPI. The main reason is that HI take the PET into count. Therefore, the influence of the PET should not be ignored on future drought research.
In addition, the results would helpful to the regional applicability of drought indices. Different drought indices lead to different results, some indices results are dry comparatively, while others are wet comparatively. Obviously, different drought indices would have limited broad applicability if their performances inconsistently among the same region. According to the results of the research, the recommended step is that it is better to include multiple drought indices into the analysis and comparison of drought quantitative evaluation to avoid the quantitative deviation of drought degree, or severity caused by a single drought index.
Furthermore, we should strengthen the statistical scale or physical scale to obtain higher temporal and spatial resolution of climate factors, in order to improve the reliability of drought research under the influence of climate change. Further research should be based on the coupling of global and regional climate models to obtain these datasets.
The results also showed that there is a risk of drought in future of the HRB, especially under the high emission scenarios. Those are helpful to study the regional drought response under different climate models and emission scenarios, and would be of great significance to regional water resources strategic planning, drought disaster prevention, and agricultural development planning in the UMHRB.

5. Conclusions

The three global climate models—such as CNRM-CM5 (CNR), HadGEM2-ES (Had), and MIROC5 (MIR)—have a relative better accuracy of temperature and precipitation in the UMHRB. The ensemble model (EnM), which was combined by the above three CMIP5 models, has been shown better accuracy results than the three single CMIP5 models to give the future development temperature and precipitation in the UMHRB.
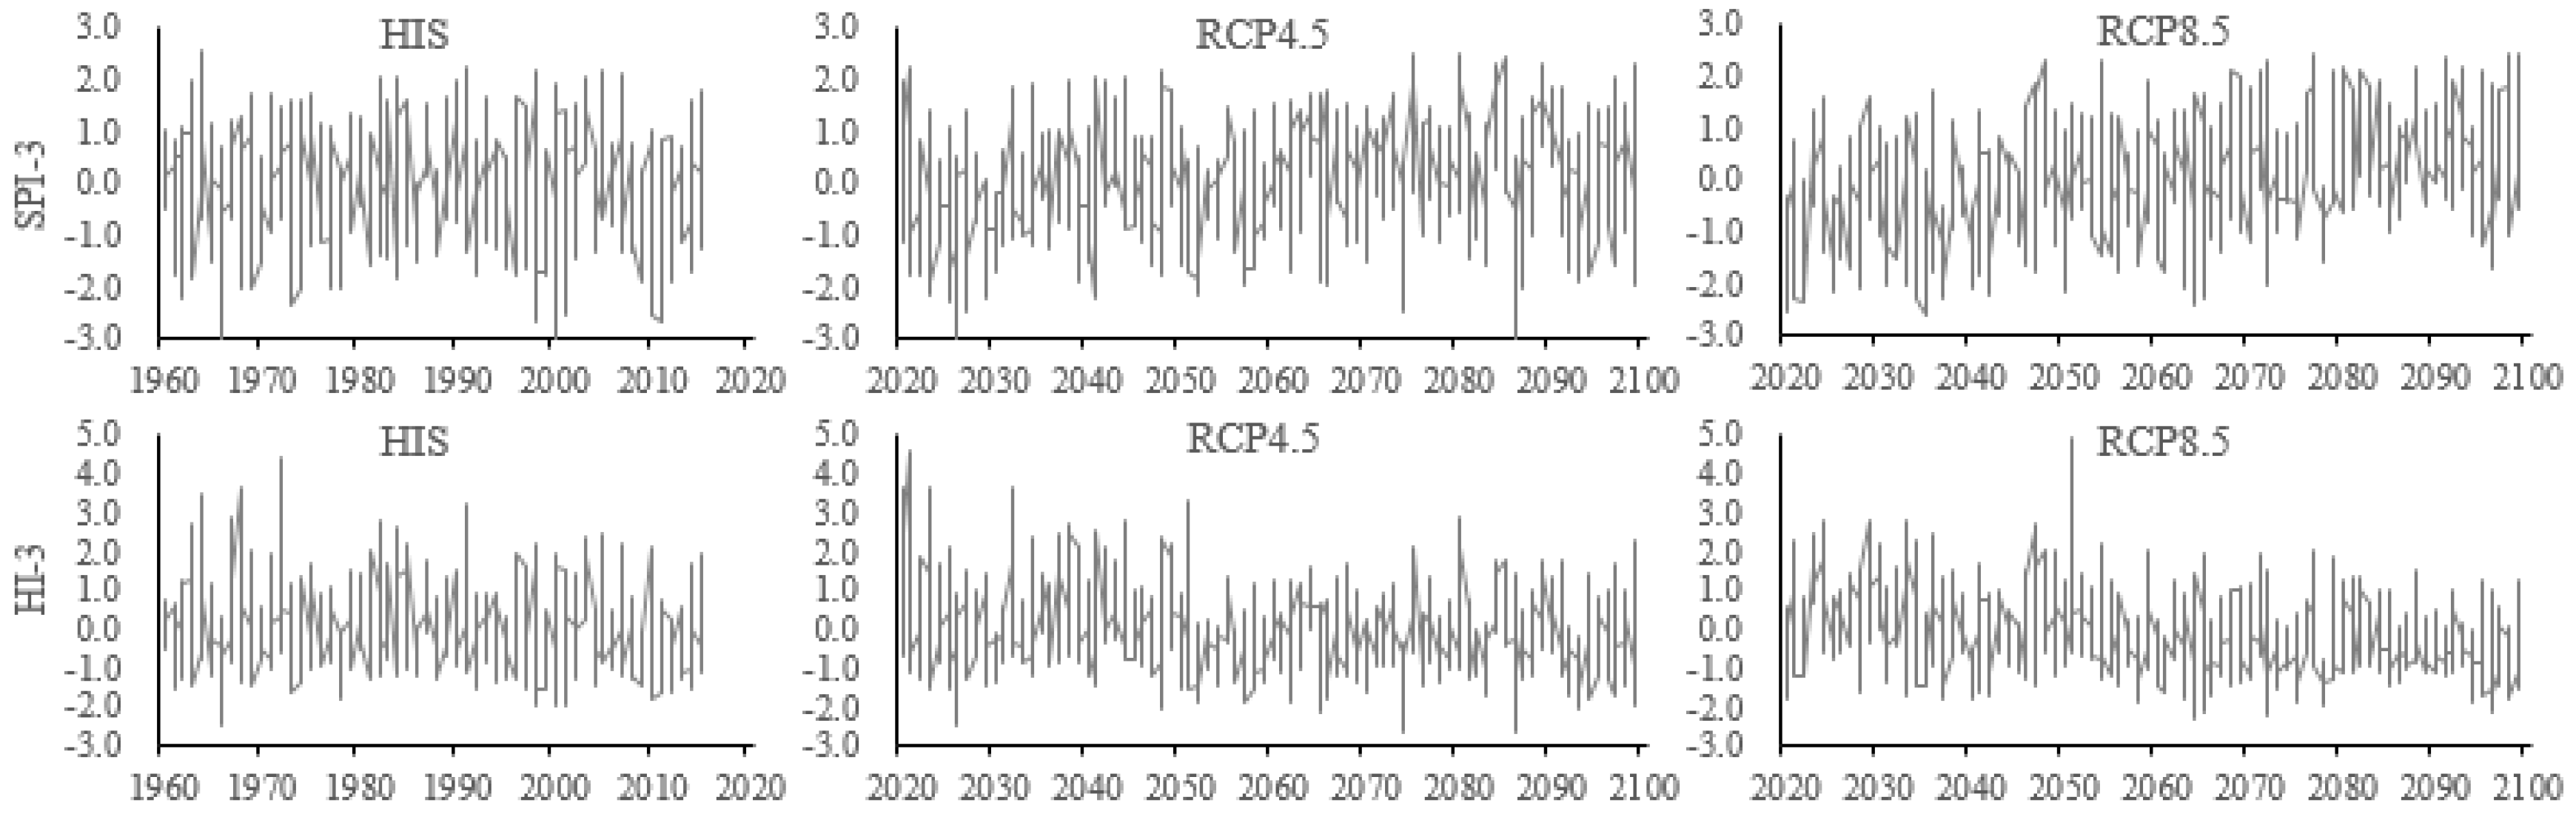
In both the past and future periods, SPI-3 shows a wetting trend while HI-3 shows a drying trend. The annual and seasonal Mann–Kendall test value with historical SPI and HI manifested as drying trend (except summer), but not any time scale pass the significant test. In the future, the annual and seasonal M-K test value of SPI reflect wetting trend, while that of HI show a drying trend. No matter wetting or drying trend reflected by SPI-3 and HI-3, the performance of RCP8.5 scenario is more obvious than that of RCP4.5 scenario.
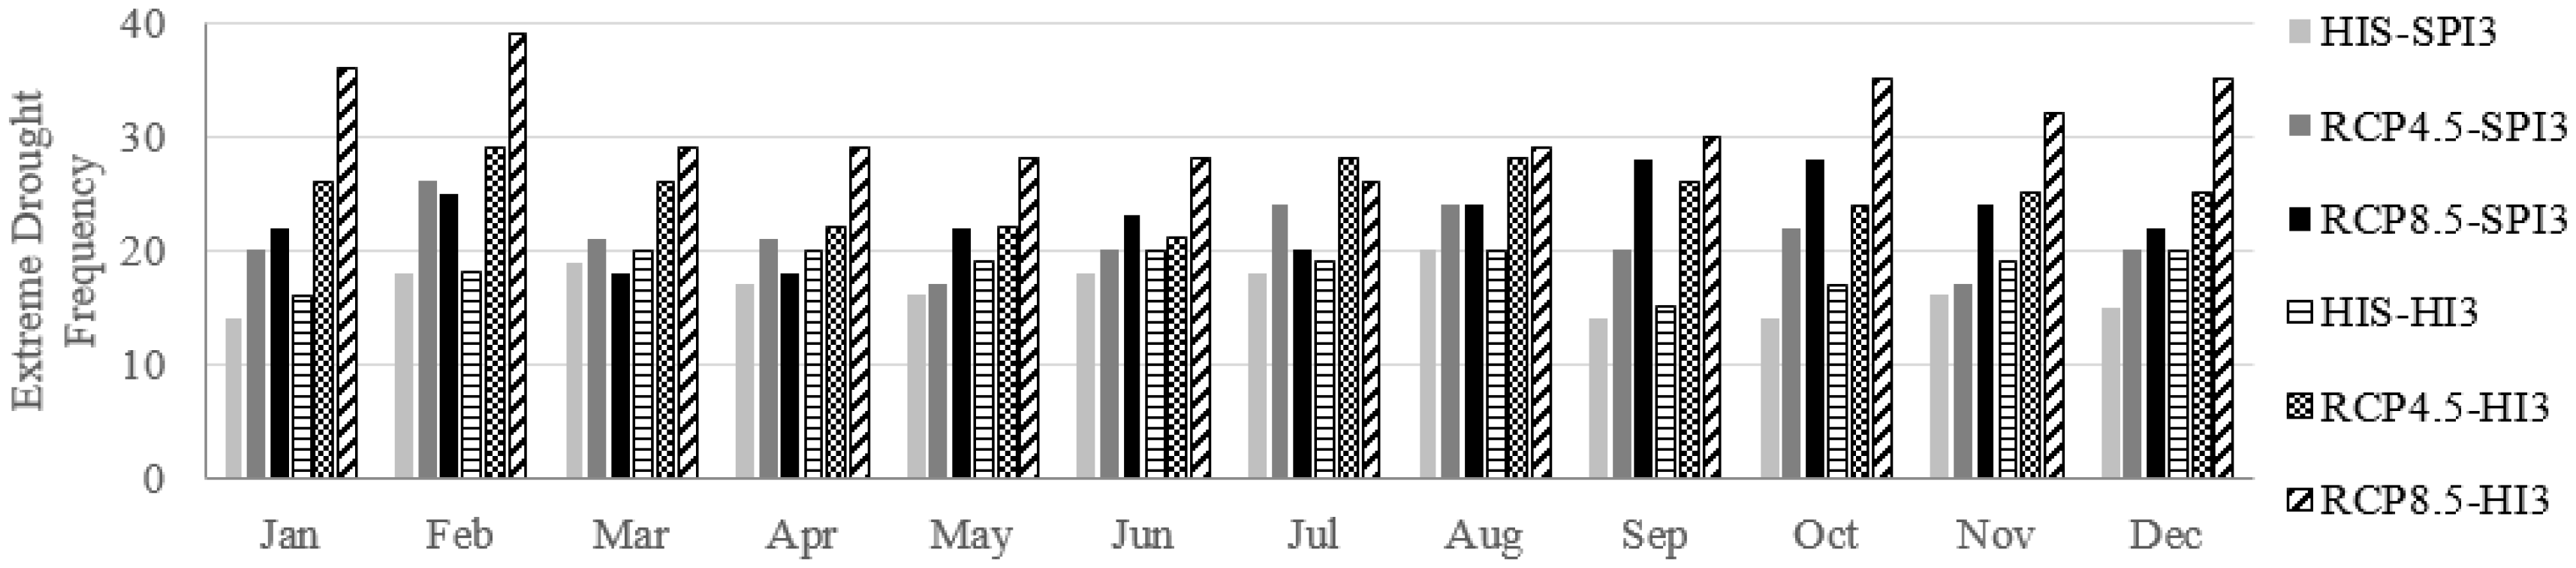
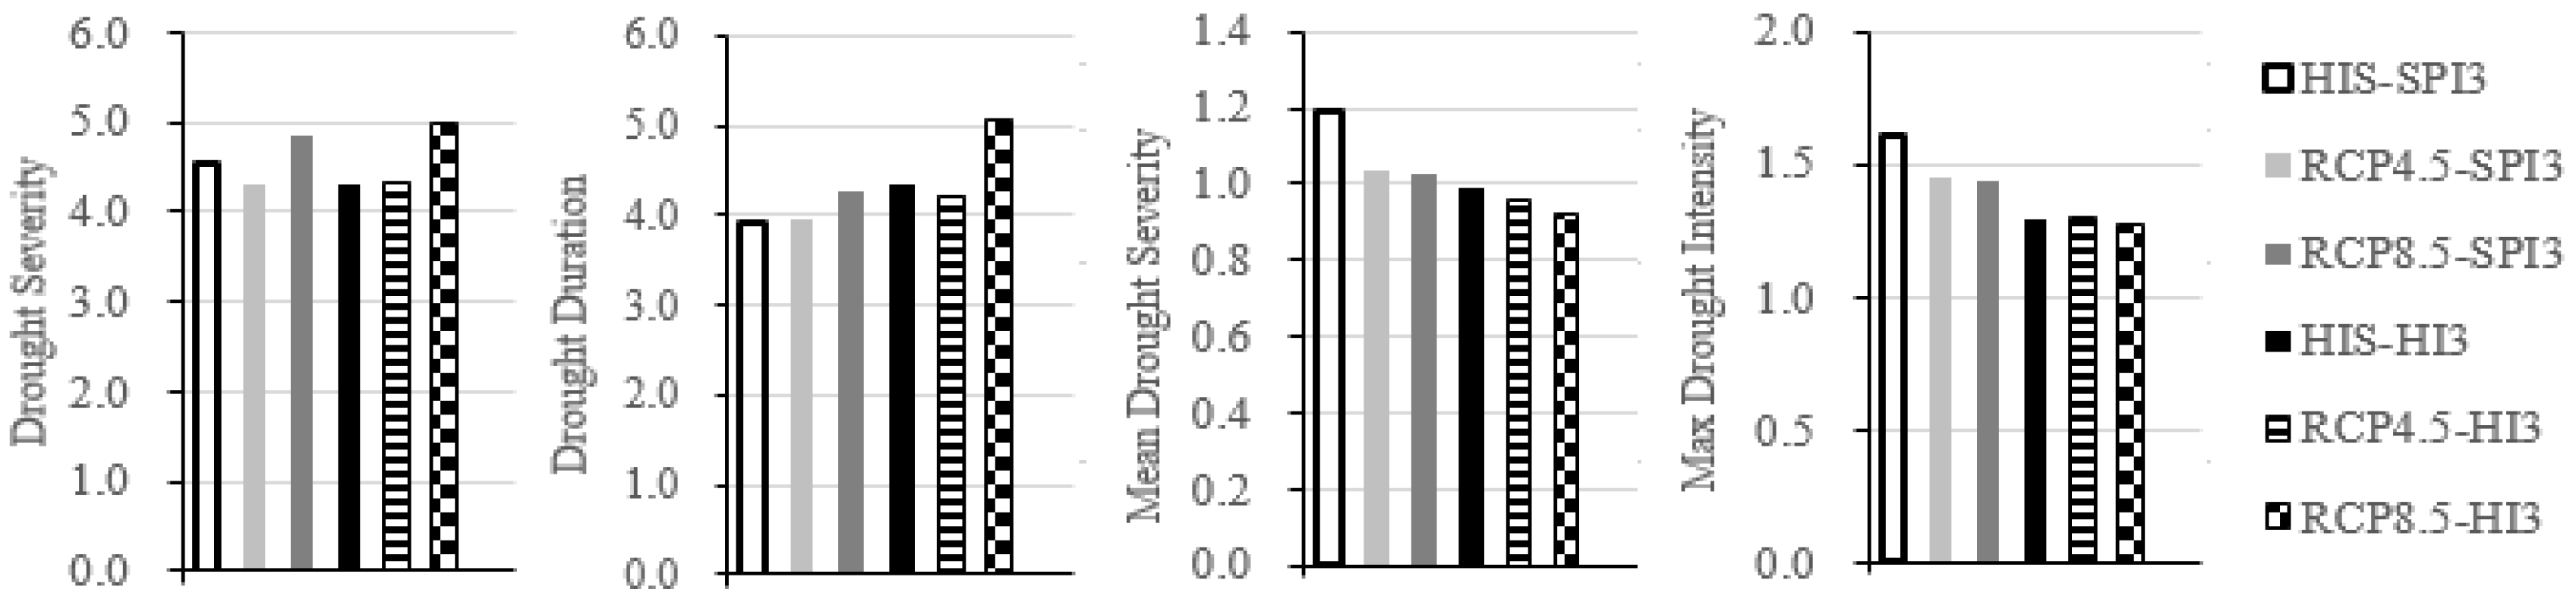
The extreme drought frequency of UMHRB would be more serious in the future. The extreme drought frequency reflected by HI-3 is more than that by SPI-3. The frequency of extreme drought under RCP8.5 scenario is more than that of RCP4.5 scenario, particularly in winter.
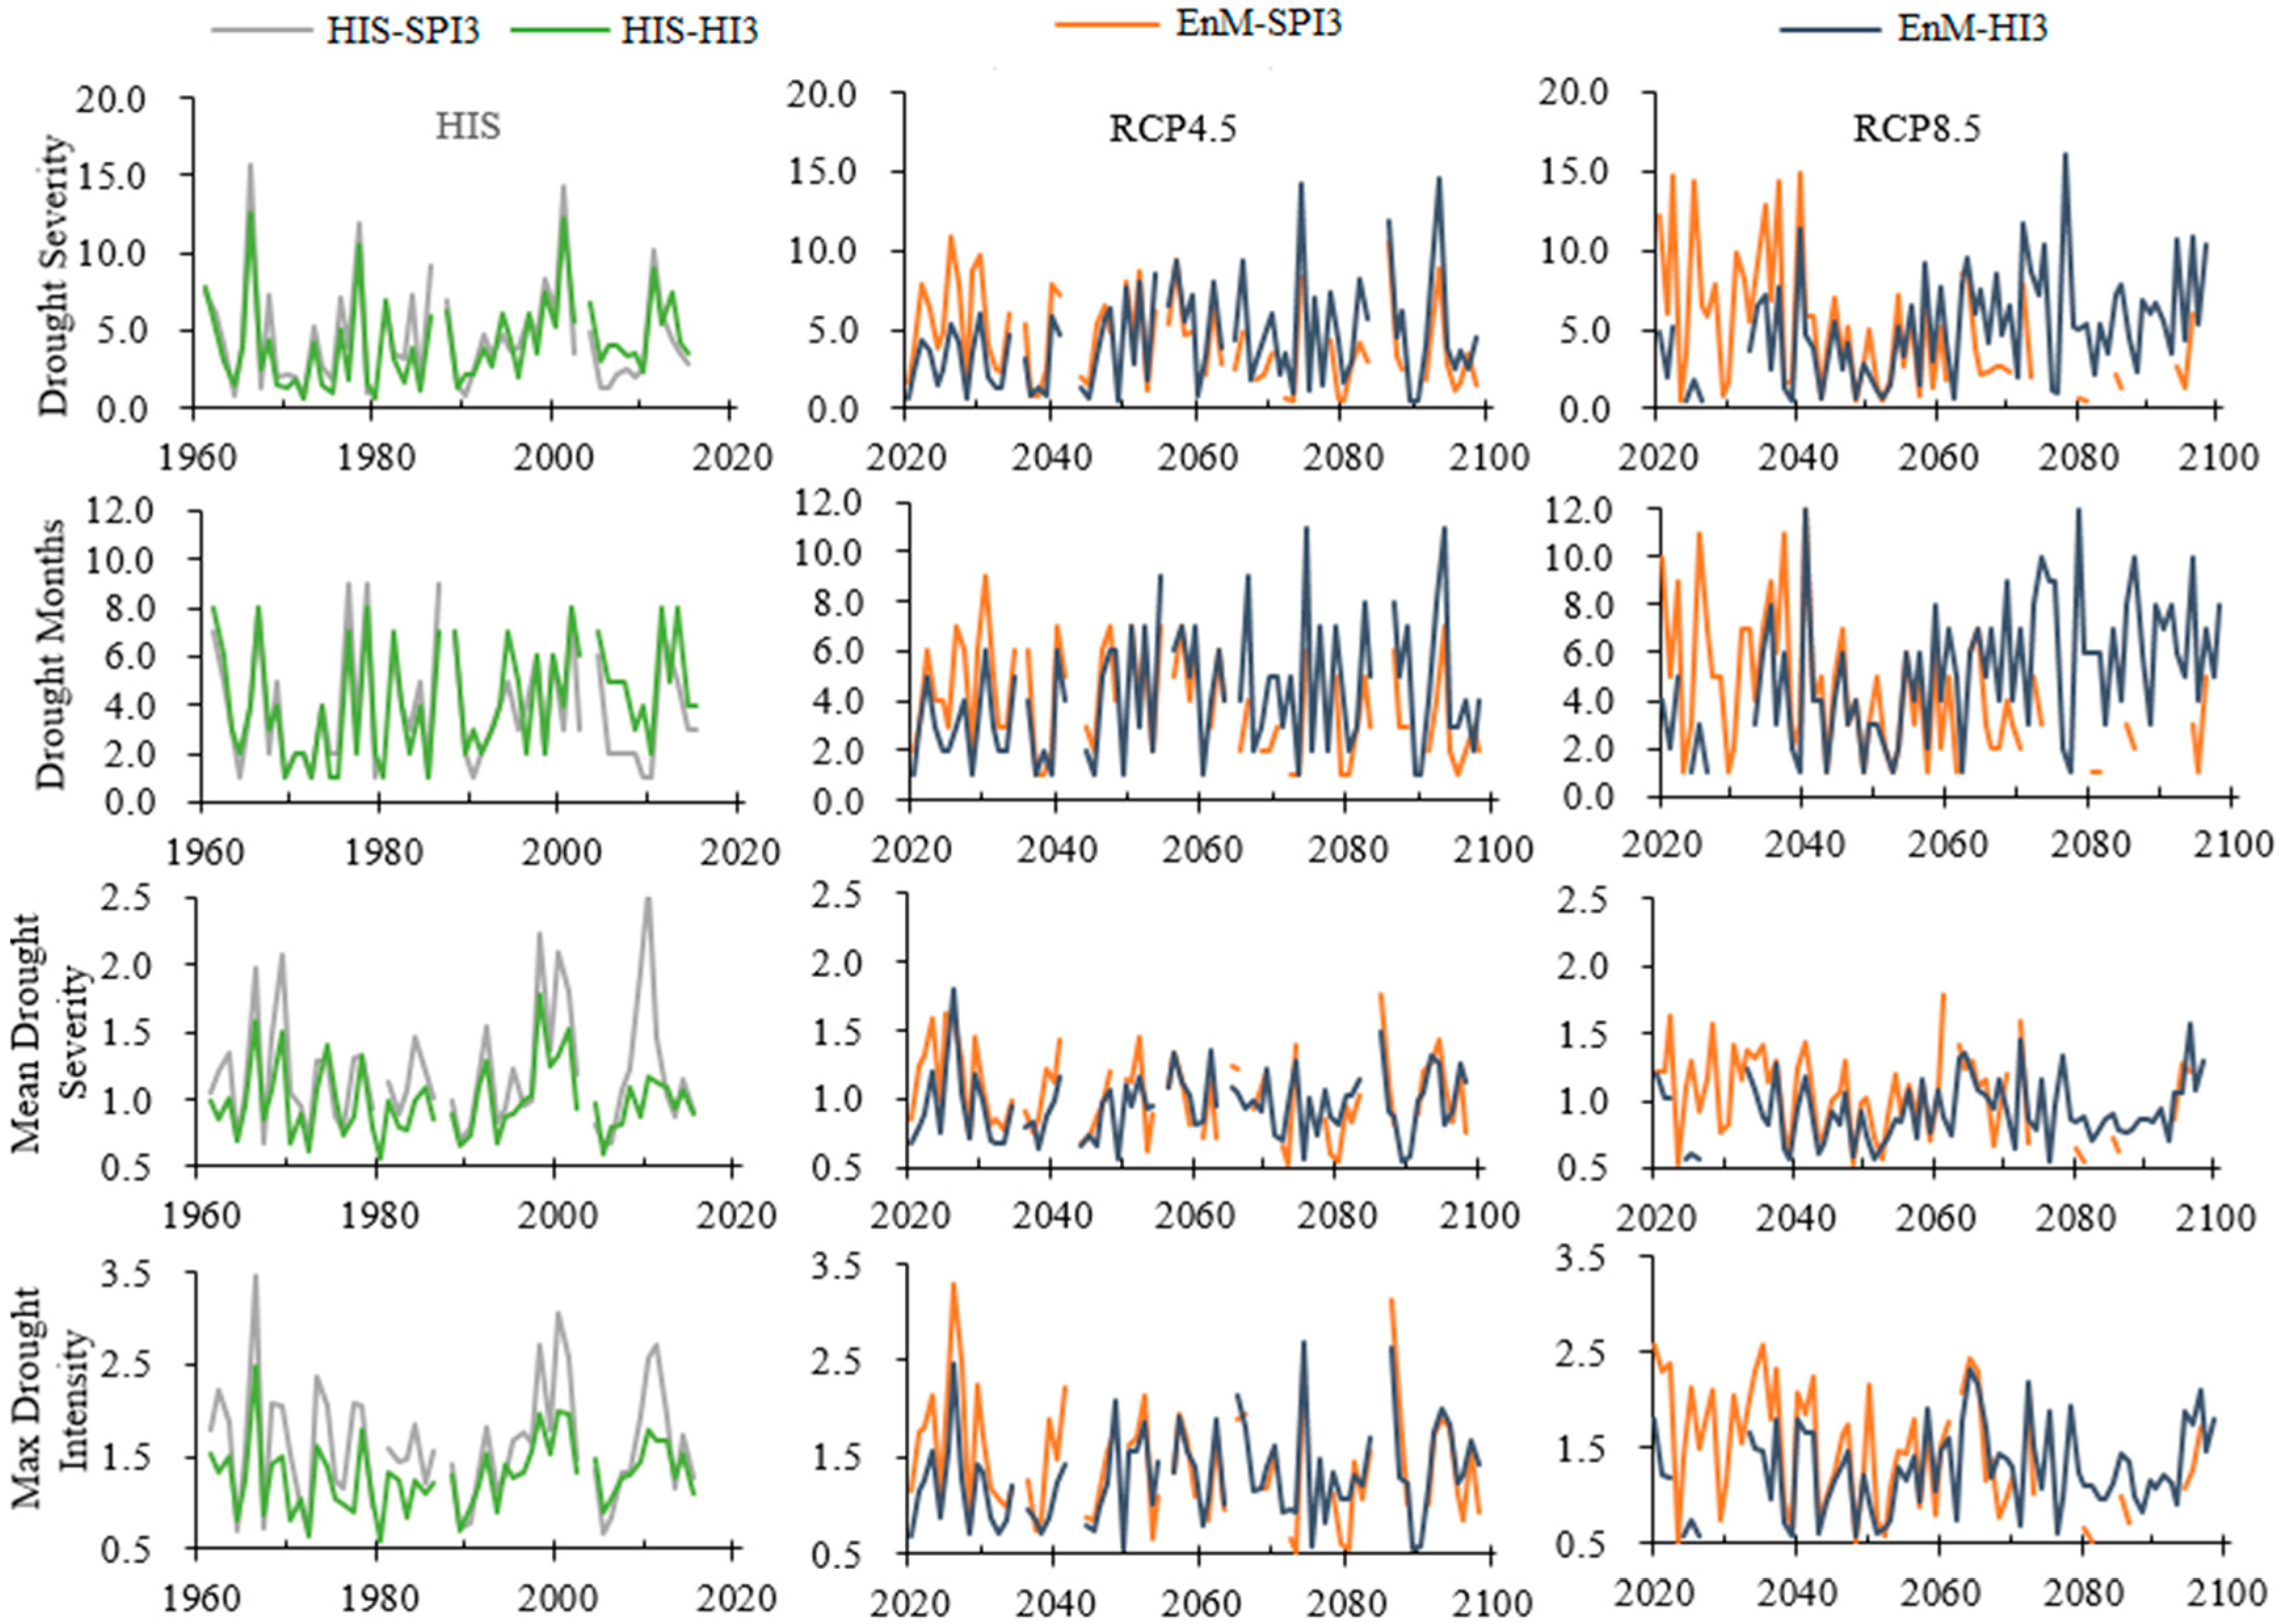
Historically, the drought severity and drought months reflected by SPI-3 and HI-3 were keep the same fluctuation. The historical mean drought severity and the max drought intensity reflected by SPI-3 were higher than that of HI-3. In the early 21st century (2020s–2050s), the drought severity and drought months reflected by SPI-3 is higher than that of HI-3, while it is opposite after 2050s. The future mean drought severity and the max drought intensity under RCP8.5 scenario is generally higher than that under RCP4.5 scenario. Overall, the drought characteristics under RCP4.5 scenario is more serious than that under RCP8.5. With the rising temperature in the future, the extreme drought in the UMHRB would be more serious under the high emission scenario.
The generalization of the research is that different drought indices could lead to different evaluations of the drought level or severity about the same drought events because different drought indices are based on different principles and calculation methods, and thus have a direct impact on the timely and accurate drought risk response and drought disaster management. Drought is a natural phenomenon caused by water imbalance. The distribution of water’s revenue and expenditure should be considered in the quantitative assessment of drought. Therefore, using comprehensive drought indices which can reflect drought’s occurrence and development is the key direction of drought research in the future.

Author Contributions

All authors contributed to the design and research of the manuscript. H.L. was responsible for the CMIP5 data collecting and analyzing and prepared the draft of the manuscript. J.W. provided the general framework and some research ideals and revised this manuscript. F.L., Y.X., C.J., and L.S. participated in the research work and offered many important suggestions for the manuscript structure. All authors have read and agreed to the published version of the manuscript.

Funding

This research was supported by the Natural Science Foundation of the Jiangsu Higher Education Institutions of China (No. 15KJB170019), the Priority Academic Program Development of Jiangsu Higher Education Institutions (PAPD), the Postdoctoral Research Foundation of Yangzhou University (No. 137070375), China Postdoctoral Science Foundation (No. 2019M651976), and the Science and Technology Innovation Fund of Yangzhou University (No. 2016CXJ041).

Acknowledgments

The research data obtained by the CMA and WCRP and the authors would like to express much gratitude to the data provider.

Conflicts of Interest

The authors declare no conflict of interest.

References

  1. Cook, E.R.; Seager, R.; Cane, M.A.; Stahle, D.W. North American drought: Reconstructions, causes, and consequences. Earth Sci. Rev. 2007, 81, 93–134. [Google Scholar] [CrossRef]
  2. Grafton, R.Q.; Pittock, J.; Williams, J.; Jiang, Q.; Possingham, H.; Quiggin, J. Water Planning and Hydro-Climatic Change in the Murray-Darling Basin, Australia. AMBIO 2014, 43, 1082–1092. [Google Scholar] [CrossRef] [PubMed] [Green Version]
  3. Shukla, S.; Roberts, J.; Hoell, A.; Funk, C.C.; Robertson, F.; Kirtman, B. Assessing North American multimodel ensemble (NMME) seasonal forecast skill to assist in the early warning of anomalous hydrometeorological events over East Africa. Clim. Dyn. 2019, 12, 7411–7427. [Google Scholar] [CrossRef]
  4. Guo, H.; Bao, A.; Ndayisaba, F.; Liu, T.; Jiapaer, G.; El-Tantawi, A.M.; De Maeyer, P. Space-time characterization of drought events and their impacts on vegetation in Central Asia. J. Hydrol. 2018, 564, 1165–1178. [Google Scholar] [CrossRef]
  5. Xu, K.; Yang, D.; Yang, H.; Li, Z.; Qin, Y.; Shen, Y. Spatio-temporal variation of drought in China during 1961–2012: A climatic perspective. J. Hydrol. 2015, 526, 253–264. [Google Scholar] [CrossRef]
  6. Mkhabela, M.; Bullock, P.; Gervais, M.; Finlay, G.; Sapirstein, H. Assessing indicators of agricultural drought impacts on spring wheat yield and quality on the Canadian prairies. Agric. For. Meteorol. 2010, 150, 399–410. [Google Scholar] [CrossRef]
  7. Al-Kaisi, M.M.; Elmore, R.W.; Guzman, J.G.; Hanna, H.M.; Hart, C.E.; Helmers, M.J.; Hodgson, E.W.; Lenssen, A.W.; Mallarino, A.P.; Robertson, A.E.; et al. Drought impact on crop production and the soil environment: 2012 experiences from Iowa. J. Soil Water Conserv. 2013, 68, 19–24. [Google Scholar] [CrossRef] [Green Version]
  8. Zhang, Z.; Chen, X.; Xu, C.; Hong, Y.; Hardy, J.; Sun, Z. Examining the influence of river–lake interaction on the drought and water resources in the Poyang Lake basin. J. Hydrol. 2015, 522, 510–521. [Google Scholar] [CrossRef]
  9. Yang, C.; Yu, Z.; Hao, Z.; Zhang, J.; Zhu, J. Impact of climate change on flood and drought events in Huaihe River Basin, China. Hydrol. Res. 2012, 43, 14–22. [Google Scholar] [CrossRef]
  10. Wang, J.; Lin, H.; Huang, J.; Jiang, C.; Xie, Y.; Zhou, M. Variations of Drought Tendency, Frequency, and Characteristics and Their Responses to Climate Change under CMIP5 RCP Scenarios in Huai River Basin, China. Water 2019, 11, 2174. [Google Scholar] [CrossRef] [Green Version]
  11. Li, X.; Ju, H.; Sarah, G.; Yan, C.; Batchelor, W.D.; Liu, Q. Spatiotemporal variation of drought characteristics in the Huang-Huai-Hai Plain, China under the climate change scenario. J. Integr. Agric. 2017, 16, 2308–2322. [Google Scholar] [CrossRef]
  12. Sun, P.; Zhang, Q.; Yao, R.; Wen, Q. Hydrological Drought Regimes of the Huai River Basin, China: Probabilistic Behavior, Causes and Implications. Water 2019, 11, 2390. [Google Scholar] [CrossRef] [Green Version]
  13. He, Y.; Ye, J.; Yang, X. Analysis of the spatio-temporal patterns of dry and wet conditions in the Huai River Basin using the standardized precipitation index. Atmos. Res. 2015, 166, 120–128. [Google Scholar] [CrossRef] [Green Version]
  14. Li, M.; Chu, R.; Shen, S.; Islam, A. Quantifying Climatic Impact on Reference Evapotranspiration Trends in the Huai River Basin of Eastern China. Water 2018, 10, 144. [Google Scholar] [CrossRef] [Green Version]
  15. Taylor, K.E.; Stouffer, R.J.; Meehl, G.A. An Overview of CMIP5 and the Experiment Design. Bull. Am. Meteorol. Soc. 2012, 93, 485–498. [Google Scholar] [CrossRef] [Green Version]
  16. Ma, D.; Deng, H.; Yin, Y.; Wu, S.; Zheng, D. Sensitivity of arid/humid patterns in China to future climate change under a high-emissions scenario. J. Geogr. Sci. 2019, 29, 29–48. [Google Scholar] [CrossRef] [Green Version]
  17. Zha, J.; Wu, J.; Zhao, D.; Fan, W. Future projections of the near-surface wind speed over eastern China based on CMIP5 datasets. Clim. Dyn. 2020, 54, 2361–2385. [Google Scholar] [CrossRef]
  18. Sun, Q.; Miao, C.; Duan, Q. Extreme climate events and agricultural climate indices in China: CMIP5 model evaluation and projections. Int. J. Climatol. 2016, 36, 43–61. [Google Scholar] [CrossRef]
  19. Wang, Z.; Zhong, R.; Lai, C.; Zeng, Z.; Lian, Y.; Bai, X. Climate change enhances the severity and variability of drought in the Pearl River Basin in South China in the 21st century. Agric. For. Meteorol. 2018, 249, 149–162. [Google Scholar] [CrossRef]
  20. Keyantash, J.; Dracup, J.A. The quantification of drought: An evaluation of drought indices. Bull. Am. Meteorol. Soc. 2002, 83, 1167–1180. [Google Scholar] [CrossRef]
  21. Peyman, M.; Rigi, A.; Miri Kamak, M. A comparative study of precipitation-based drought indices with the aim of selecting the best index for drought monitoring in Iran. Theor. Appl. Climatol. 2019, 137, 3123–3138. [Google Scholar]
  22. Gobena, A.K.; Gan, T.Y. Assessment of Trends and Possible Climate Change Impacts on Summer Moisture Availability in Western Canada based on Metrics of the Palmer Drought Severity Index. J. Clim. 2013, 26, 4583–4595. [Google Scholar] [CrossRef]
  23. McKee, T.B.; Doesken, N.J.; Kleist, J. The Relationship of Drought Frequency and Duration to Time Scales. In Proceedings of the Eighth Conference on Applied Climatology, Anaheim, CA, USA, 17–22 January 1993; pp. 179–184. [Google Scholar]
  24. Vicente-Serrano, S.M.; Beguería, S.; López-Moreno, J.I. A Multiscalar Drought Index Sensitive to Global Warming: The Standardized Precipitation Evapotranspiration Index. J. Clim. 2010, 23, 1696–1718. [Google Scholar] [CrossRef] [Green Version]
  25. Murthy, C.S.; Singh, J.; Kumar, P.; Sesha-Sai, M.V.R. A composite index for drought hazard assessment using CPC rainfall time series data. Int. J. Environ. Sci. Technol. 2017, 14, 1981–1988. [Google Scholar] [CrossRef]
  26. Asadi-Zarch, M.A.; Sivakumar, B.; Sharma, A. Droughts in a warming climate: A global assessment of Standardized precipitation index (SPI) and Reconnaissance drought index (RDI). J. Hydrol. 2015, 526, 183–195. [Google Scholar] [CrossRef]
  27. Ma, Z.; Hu, L.; Ren, X. The extreme dry/wet events in northern China during recent 100 years. Acta Geogr. Sin. 2003, 58, 69–74. [Google Scholar]
  28. Wu, H.; Hayes, M.J.; Wilhite, D.A.; Svoboda, M.D. The effect of the length of record on the standardized precipitation index calculation. Int. J. Climatol. 2005, 25, 505–520. [Google Scholar] [CrossRef] [Green Version]
  29. Łabędzki, L. Categorical Forecast of Precipitation Anomaly Using the Standardized Precipitation Index SPI. Water 2017, 9, 8. [Google Scholar] [CrossRef]
  30. Sobral, B.S.; Oliveira-Júnior, J.F.; Góis, G.; Junior, E.R.P.; Terassi, P.M.D.B.; Muniz-Júnior, J.G.R.; Lyra, G.B.; Zeri, M. Drought characterization for the state of Rio de Janeiro based on the annual SPI index: Trends, statistical tests and its relation with ENSO. Atmos Res. 2019, 220, 141–154. [Google Scholar] [CrossRef]
  31. Wang, Y.; Liu, P.; Cao, L.; Gao, Y.; Yong, G. Characteristics of Southwestern China Dry-wet Condition Based on Wetness Index in 1960-2011. J. Nat. Res. 2014, 29, 830–838. [Google Scholar]
  32. Wang, L.; Liu, Y.; Wang, J.; Ding, Y.; Yang, R. Simulations and estimates of low latitude highland temperature by five CMIP5 models. J. Yunnan Univ. 2015, 37, 851–860. [Google Scholar]
  33. Zhou, J.; Shi, P.; Shi, W. Temporal and Spatial Characteristics of Climate Change and Extreme Dry and Wet Events in Shi Yang River Basin from 1960 to 2009. J. Nat. Res. 2012, 27, 143–153. [Google Scholar]
  34. Dai, A. Characteristics and trends in various forms of the Palmer Drought Severity Index during 1900–2008. J. Geophys. Res. Atmos. 2011, 116, D12115. [Google Scholar] [CrossRef] [Green Version]
  35. Thornthwaite, C.W. An Approach toward a Rational Classification of Climate. Geogr. Rev. 1948, 38, 55–94. [Google Scholar] [CrossRef]
  36. China Meteorological Administration. Classification of Meteorological Drought; China Meteorological Administration: Beijing, China, 2006. [Google Scholar]
  37. Mann, H.B. Non-Parametric Test Against Trend. Econometrica 1945, 13, 245–259. [Google Scholar] [CrossRef]
  38. Fang, W.; Huang, S.; Huang, G.; Huang, Q.; Wang, H.; Wang, L.; Zhang, Y.; Li, P.; Ma, L. Copulas-based risk analysis for inter-seasonal combinations of wet and dry conditions under a changing climate. Int. J. Climatol. 2019, 39, 2005–2021. [Google Scholar] [CrossRef]
  39. Yevjevich, V. An Objective Approach to Definitions and Investigations of Continental Hydrologic Droughts; Colorado State University: Fort Collins, CO, USA, 1967. [Google Scholar]
  40. Huang, S.; Chang, J.; Huang, Q.; Chen, Y. Spatio-temporal Changes and Frequency Analysis of Drought in the Wei River Basin, China. Water Resour. Manag. 2014, 28, 3095–3110. [Google Scholar] [CrossRef]
  41. Khan, M.I.; Liu, D.; Fu, Q.; Saddique, Q.; Faiz, M.A.; Li, T.; Qamar, M.U.; Cui, S.; Cheng, C. Projected Changes of Future Extreme Drought Events under Numerous Drought Indices in the Heilongjiang Province of China. Water Resour. Manag. 2017, 31, 3921–3937. [Google Scholar] [CrossRef]
  42. Vicente-Serrano, S.M.; Beguería, S.; López-Moreno, J.I. Comment on Characteristics and trends in various forms of the Palmer Drought Severity Index (PDSI) during 1900–2008 by Aiguo Dai. J. Geophys. Res. Atmos. 2011, 116, D19112. [Google Scholar] [CrossRef] [Green Version]
  43. Zhong, R.; Chen, X.; Lai, C.; Wang, Z.; Lian, Y.; Yu, H.; Wu, X. Drought monitoring utility of satellite-based precipitation products across mainland China. J. Hydrol. 2019, 568, 343–359. [Google Scholar] [CrossRef]
  44. Yu, M.; Li, Q.; Hayes, M.J.; Svoboda, M.D.; Heim, R.R. Are droughts becoming more frequent or severe in China based on the Standardized Precipitation Evapotranspiration Index: 1951–2010. Int. J. Climatol. 2014, 34, 545–558. [Google Scholar] [CrossRef]
  45. Sheffield, J.; Goteti, G.; Wood, E.F. Development of a 50-Year High-Resolution Global Dataset of Meteorological Forcings for Land Surface Modeling. J. Clim. 2012, 19, 3088–3111. [Google Scholar] [CrossRef] [Green Version]
  46. Sheffield, J.; Wood, E.F.; Roderick, M.L. Little change in global drought over the past 60 years. Nature 2012, 491, 435–438. [Google Scholar] [CrossRef]
  47. Zhang, B.; Zhao, X.; Jin, J.; Wu, P. Development and evaluation of a physically based multiscalar drought index: The Standardized Moisture Anomaly Index. J. Geophys. Res. Atmos. 2015, 120, 11575–11588. [Google Scholar] [CrossRef] [Green Version]
  48. Yang, D.; Sun, F.; Liu, Z.; Cong, Z.; Lei, Z. Interpreting the complementary relationship in non-humid environments based on the Budyko and Penman hypotheses. Geophys. Res. Lett. 2006, 33, L18402. [Google Scholar] [CrossRef]
  49. Duan, K.; Mei, Y. Comparison of Meteorological, Hydrological and Agricultural Drought Responses to Climate Change and Uncertainty Assessment. Water Resour. Manag. 2014, 28, 5039–5054. [Google Scholar] [CrossRef]
  50. Loew, A.; Andersson, A.; Trentmann, J.; Schröder, M. Assessing Surface Solar Radiation Fluxes in the CMIP Ensembles. J. Clim. 2016, 29, 7231–7246. [Google Scholar] [CrossRef]
  51. Yang, Q.; Ma, Z.; Zheng, Z.; Duan, Y. Sensitivity of Potential Evapotranspiration Estimation to the Thornthwaite and Penman–Monteith Methods in the Study of Global Drylands. Adv. Atmos. Sci. 2017, 12, 3–16. [Google Scholar] [CrossRef]
Figure 1. Location of the upper and middle reaches of the Huai River Basin and the distribution of ground meteorological stations.
Water 12 01100 g001
Figure 2. Accuracy test of three single CMIP5 model and EnM.
Water 12 01100 g002
Figure 3. Time-series changes of standardized SPI and HI in past and future periods.
Water 12 01100 g003
Figure 4. Monthly extreme drought frequency in the past and the future.
Water 12 01100 g004
Figure 5. Inter-annual changes in characteristics of extreme drought in the past and the future.
Water 12 01100 g005
Figure 6. Statistical extreme drought characteristic values by SPI and HI in the past (1960–2015) and future (2020–2099) periods.
Water 12 01100 g006
Figure 7. Annual and seasonal precipitation and the potential evapotranspiration (PET) in the past and the future.
Water 12 01100 g007
Table 1. Basic information of the three CMIP5 models.
CMIP5InstitutionsGrid ResolutionSpatial ResolutionSimulated PeriodsProjected Periods
CNRM-CM5(CNR)CNRM-CERFACS(France)256 × 1281.40° × 1.40°1850–20052006–2100
HadGEM2-ES(Had)MOHC(Britain)192 × 1451.875° × 1.25°1850–20052006–2099
MIROC5((MIR))MIROC(Japan)256 × 1281.40° × 1.40°1850–20052006–2100
Table 2. Classification scale for SPI and HI and their drought categories.
Drought CategoriesSPI RangesHI Ranges
NoneMore than −0.5More than 0.6
Mild−1.0 to −0.50.35 to 0.6
Moderate−1.5 to −1.00.2 to 0.35
Severe−2.0 to −1.50.05 to 0.2
ExtremeLess than −2.0Less than 0.05
Table 3. Interdecadal linear slope for the monthly SPI-3 and HI-3 in the past and future.
Time Series1960s1970s1980s1990s2000s2010s Total
SPI-3−0.0006−0.0022−0.0003−0.00600.00060.0068 0.0000
HI-30.0018−0.0050−0.0018−0.0067−0.00160.0016 −0.0006
Time Series2020s2030s2040s2050s2060s2070s2080s2090sTotal
SPI-3/RCP4.5−0.00650.00640.00500.00120.0009−0.00230.0021−0.00140.0007
SPI-3/RCP8.50.00740.00100.0092−0.00140.00440.0003−0.0017−0.00120.0014
HI-3/RCP4.5−0.01000.00720.0024−0.0035−0.00050.00010.0017−0.0003−0.0007
HI-3/RCP8.50.0056−0.00350.0087−0.00880.0018−0.0004−0.0023−0.0021−0.0011
Table 4. Mann–Kendall test values of the annual and seasonal series of SPI and HI historically and in the future.
TimescalesHisRCP4.5RCP8.5
Annual−0.15/−0.802.53 */−1.745.57 **/−3.12 **
Spring−0.32/−1.182.16 */−0.703.38 **/−3.61 **
Summer0.40/0.540.10/−2.01 *3.35 **/−0.70
Autumn−1.22/−1.592.21 */−0.652.64 **/−1.82
Winter1.16/−1.442.37 */−3.97 **3.76 **/−5.81 **
Notes: (1) The value on the left of sign “/” represents SPI, while the right represents HI. (2) Values marked with *, ** indicate that the series of SPI and HI have been passed confidence test with the significance level of 0.05, 0.01 respectively.
Table 5. Inter-decadal extreme drought frequency historically and in the future.
Time Series1960s1970s1980s1990s2000s
His37/4035/3037/3536/4029/47
Time Series2020s2030s2040s2050s2060s2070s2080s2090s
RCP4.543/2736/2634/3148/5323/3821/4824/3926/47
RCP8.557/2058/3345/4233/3833/5525/678/6116/68
Notes: The value on the left of sign “/” represents SPI, while the right represents HI.
Table 6. Annual and seasonal total extreme drought frequency and their average decadal extreme drought frequency in the whole historical period (1960–2015) and the future (2020–2099).
TimescalesValuesHisRCP4.5RCP8.5
AnnualTotal16/1723/2618/30
decadal2.86/3.042.91/3.292.28/3.80
SpringTotal16/1917/2222/29
decadal2.86/3.342.13/2.752.75/3.63
SummerTotal20/2025/2924/30
decadal3.57/3.573.13/3.633.00/3.75
AutumnTotal16/1917/2524/32
decadal2.86/3.392.13/3.133.00/4.00
WinterTotal18/1826/3024/40
decadal3.21/3.213.25/3.753.00/5.00
Notes: The value on the left of sign “/” represents SPI, while the right represents HI.
Table 7. Slope of precipitation and the potential evapotranspiration (PET) standardized value.
ScenarioAnnualSpringSummerAutumnWinter
HIS0.13/7.15−2.11/8.952.14/−0.84−1.98/7.982.11/7.11
RCP4.57.11/19.336.75/16.450.71/17.586.44/19.295.52/15.92
RCP8.514.02/22.139.04/20.428.99/21.547.53/21.639.54/20.32
Note: The value on the left of sign “/” represents precipitation, while the right represents the PET.

