Article

Nutrients Enrichment and Process Repercussions in Hybrid Microfiltration Osmotic Membrane Bioreactor: A Guideline for Forward Osmosis Development Based on Lab-Scale Experience

by
Khum Gurung
1,*,
Morten Lykkegaard Christensen
2,
Mika Sillanpää
3,4,5,*,
Mohamed Chaker Ncibi
6 and
Mads Koustrup Jørgensen
2,*
1
Department of Separation Science, School of Engineering Science, Lappeenranta University of Technology, Sammonkatu 12, FI-50130 Mikkeli, Finland
2
Center for Membrane Technology, Aalborg University, Fredrik Bajers Vej 7H, 9220 Aalborg Øst, Denmark
3
Institute of Research and Development, Duy Tan University, Da Nang 550000, Vietnam
4
Faculty of Environment and Chemical Engineering, Duy Tan University, Da Nang 550000, Vietnam
5
School of Civil Engineering and Surveying, Faculty of Health, Engineering and Sciences, University of Southern Queensland, West Street, Toowoomba, 4350 Queensland, Australia
6
International Water Research Institute, Mohammed VI Polytechnic University, Green City Ben Guerir 43150, Morocco
*
Authors to whom correspondence should be addressed.
Water 2020, 12(4), 1098; https://doi.org/10.3390/w12041098
Submission received: 23 March 2020 / Revised: 2 April 2020 / Accepted: 10 April 2020 / Published: 12 April 2020
(This article belongs to the Special Issue Membrane Technologies and Water Treatment)

Abstract

:
The effects of reverse salt diffusion through a forward osmosis membrane were studied in a microfiltration osmotic membrane bioreactor. The reactor was used to treat and simultaneously concentrate nutrients from wastewater. The system was operated at different draw solution concentrations, leading to varying salinity conditions. A relatively low, yet stable forward osmosis flux was observed regardless of increasing draw solution conductivities from 10 to 50 mS cm−1. A substantial increase in sludge conductivity from 5.7 to 19.8 mS cm−1 was observed during the operation. Batch transmembrane pressure-step experiments showed a decline in sludge filtration properties with increasing salinity buildup in sludge due to increasing deflocculation and associated release of protein and carbohydrate fractions of extracellular polymeric substances. Mathematical simulations showed that accumulation of total dissolved solids could mainly be attributed to reverse flux of salts from the draw solution rather than by the enrichment of incoming nutrients when forward osmosis membrane’s salt permeability was high and water permeability low. Ideally, salt permeability below 0.010 L m−2 h−1 and effective water permeability above 0.13 L m−2 h−1 bar−1 are crucial to ensure enhanced nutrient enrichment and reduce sludge osmotic pressure, microbial inactivation, sludge deflocculation and membrane fouling.

1. Introduction

Rapid expansion of population and climate change have continuously aggravated the pressure on existing freshwater resources throughout the world. Wastewater reclamation has been an alternative approach for augmenting fresh water supplies via water reuse measures. Although, phosphorus and nitrogen are pollutants responsible for eutrophication in natural water bodies, if released untreated, they are on the other hand essential elements for plant growth and food yield. However, scarcity of these nutrients, is a global issue these days since they are currently produced via nonrenewable resources and some energy intensive processes [1].
Membrane bioreactors (MBR) became a state-of-the-art technology in municipal and industrial wastewater treatment many years ago owing to their remarkable benefits, such as high-quality treated effluent, relatively small plant footprint required, and less sludge production [2,3,4]. However, challenges accompanying membrane fouling and the recovery of value-added products (e.g., nutrients) from wastewater are still questionable. On this note, osmotic membrane bioreactors (OMBRs) that combine an activated sludge process with a forward osmosis (FO) membrane system, have attracted growing interest among the scientific community for wastewater treatment and nutrient recovery [5,6,7,8]. The OMBR facilitates the diffusion of pure water through a semipermeable FO membrane by virtue of the osmotic pressure difference between the sludge and draw solution (DS). The FO membrane as a robust alternative for the indirect and direct potable reuse of reclaimed wastewater can effectively retain organic micropollutants in the bioreactor, thereby enabling their subsequent biotransformation [9]. The FO system rejects most of the nutrients, such as PO43−, NH4+, Ca2+, Mg2+, and enriches them in the bioreactor. Indeed, the OMBR process is a multiple-barrier treatment approach with several advantages over conventional MBR technologies, such as low membrane fouling propensity, excellent rejection of organic compounds and nutrients, and nutrient enrichment [10,11]. However, OMBR has some shortcomings, such as the salinity build-up in the sludge due to the reverse salt flux (RSF) from the DS and high retention capability of solutes by the FO membrane, resulting in decreased driving force for permeate flux, reduced microbial activity, and sludge deflocculation [12]. To eliminate the abovementioned problems, many studies have recently proposed the integration and parallel operation of a microfiltration (MF) or ultrafiltration (UF) modules to the OMBR system as an alternative strategy [7,9,10,13,14]. The hybrid microfiltration osmotic membrane bioreactor (MF-OMBR) system enables not only to bleed out salinity build-up from the bioreactor but also to subsequent direct recovery of concentrated nutrients (phosphorus and ammonia) from MF permeate easily by adjusting the pH [7,15]. Therefore, the synergy of OMBR and pressure driven MF filtration system is an interesting approach in wastewater treatment to enhance the rejection and concentration of nutrients and for effective salinity reduction. FO membrane fouling is less pronounced [16], but normally the MF membrane in MF-OMBR fouls rapidly owing to possible external concentration polarization (ECP), soluble and suspended organic polymers attachment to membrane surface and possible scale deposits, which subsequently increase its filtration resistance and hence MF flow declines. A lower MF flow can lead to more salinity accumulation inside the bioreactor and conversely deteriorate the FO flow due to reduced effective osmotic pressure gradient and biological activity as well [17]. These are the major bottlenecks in hybrid OMBR systems, which need further investigations to understand salinity buildup and its possible consequences on system performance.
In this study, a MF-OMBR system was used to treat and enrich the nutrients from synthetic municipal wastewater. The system was operated under varying salinity conditions in order to investigate the influences of draw solution salinity on salt accumulation in the MF-OMBR system and to evaluate the associated effects on FO and MF flux and the sludge floc characteristics at different concentration factors. The propensity of the MBR sludge to foul the MF membrane was assessed by conducting separate batch filtration tests using different sludge inocula collected under different salinity conditions. The development in the concentration of relevant biofoulants, such as soluble microbial product (SMP) and bound extracellular polymeric substance (EPS), were measured as the fractions of carbohydrate, protein, and humic substances. Finally, simulations were made based on the experiments to evaluate:
  • The salinity buildup either via reverse salt flux or high FO rejection of influent substrate ions;
  • The influence of FO membrane salt permeability on total dissolved solids (TDS) accumulation in the sludge.
Based on this, a recommendation for maximum salt permeability of FO membranes to ensure sustainable operation is given.

2. Materials and Methods

2.1. FO and MF Membranes

The FO membrane used was a flat sheet, thin-film composite (TFC) membrane with polyamide active layer and an effective surface area of 722 cm2. Likewise, a flat sheet MF membrane made of polyvinylidene fluoride active layer and polypropylene support layer (MFP2, Alfa Laval, Denmark) was used. The nominal pore size and effective surface area of the MF membrane were 0.2 µm and 133 cm2, respectively. Both the FO and the MF membranes were submerged inside the bioreactor. Draw solutions of varying conductivities were prepared for the FO membrane by dissolving inorganic salt i.e., NaCl (Sigma-Aldrich, St. Louis, MO, USA) in deionized water.

2.2. MF-OMBR System

The lab-scale MF-OMBR system was comprised of an aerobic bioreactor, and two membrane modules (FO and MF) under a cross-flow air configuration. The overall details of MF-OMBR is explained elsewhere [13]. In brief, the MF-OMBR was made of an acrylic plastic having internal length, width, and depth of 25 cm, 6 cm, and 65 cm, respectively. The volume of wastewater in the bioreactor was kept constant at 6.5 L by means of a tap water reservoir connected with a floating valve to ensure the proper immersing of the membrane modules and to avoid any foaming events. Compressed air (5.0–7.0 NL min−1) was used to continuously aerate the bioreactor and to reduce the membranes fouling via the air diffusers installed below the membranes. The active layer of the FO membrane was faced to the feed solution (FS, i.e., AL-FS or FO-mode) in order to avoid the aggravated fouling propensities in the support layer [13,17]. The MF permeate was extracted with an intermittent filtration/relaxation (10 min ON/1 min OFF) and the transmembrane pressure (TMP) was created by the water level difference between the bioreactor and the permeate collection chamber. A peristaltic pump (Ecoline VC-380, Ismatec, Germany) was used to circulate DS through the FO cell channel with a crossflow velocity of 1.70 cm s−1 to get FO permeate. The MF permeate collection chamber and the DS reservoir were placed on the digital balances (Scout STX2202, Ohaus, NJ, USA) and data were continuously logged into a computer. The conductivity and temperature of DS were measured continuously and logged by a conductivity meter (CDM210, Radiometer Analytical, France). To ensure a constant osmotic driving force or regeneration of working DS in FO cell during experimental periods, a concentrated NaCl (35 g L−1) was automatically fed to the DS reservoir by a peristaltic dosing pump (EH-B20VC-230PR2, IWAKI, Japan).

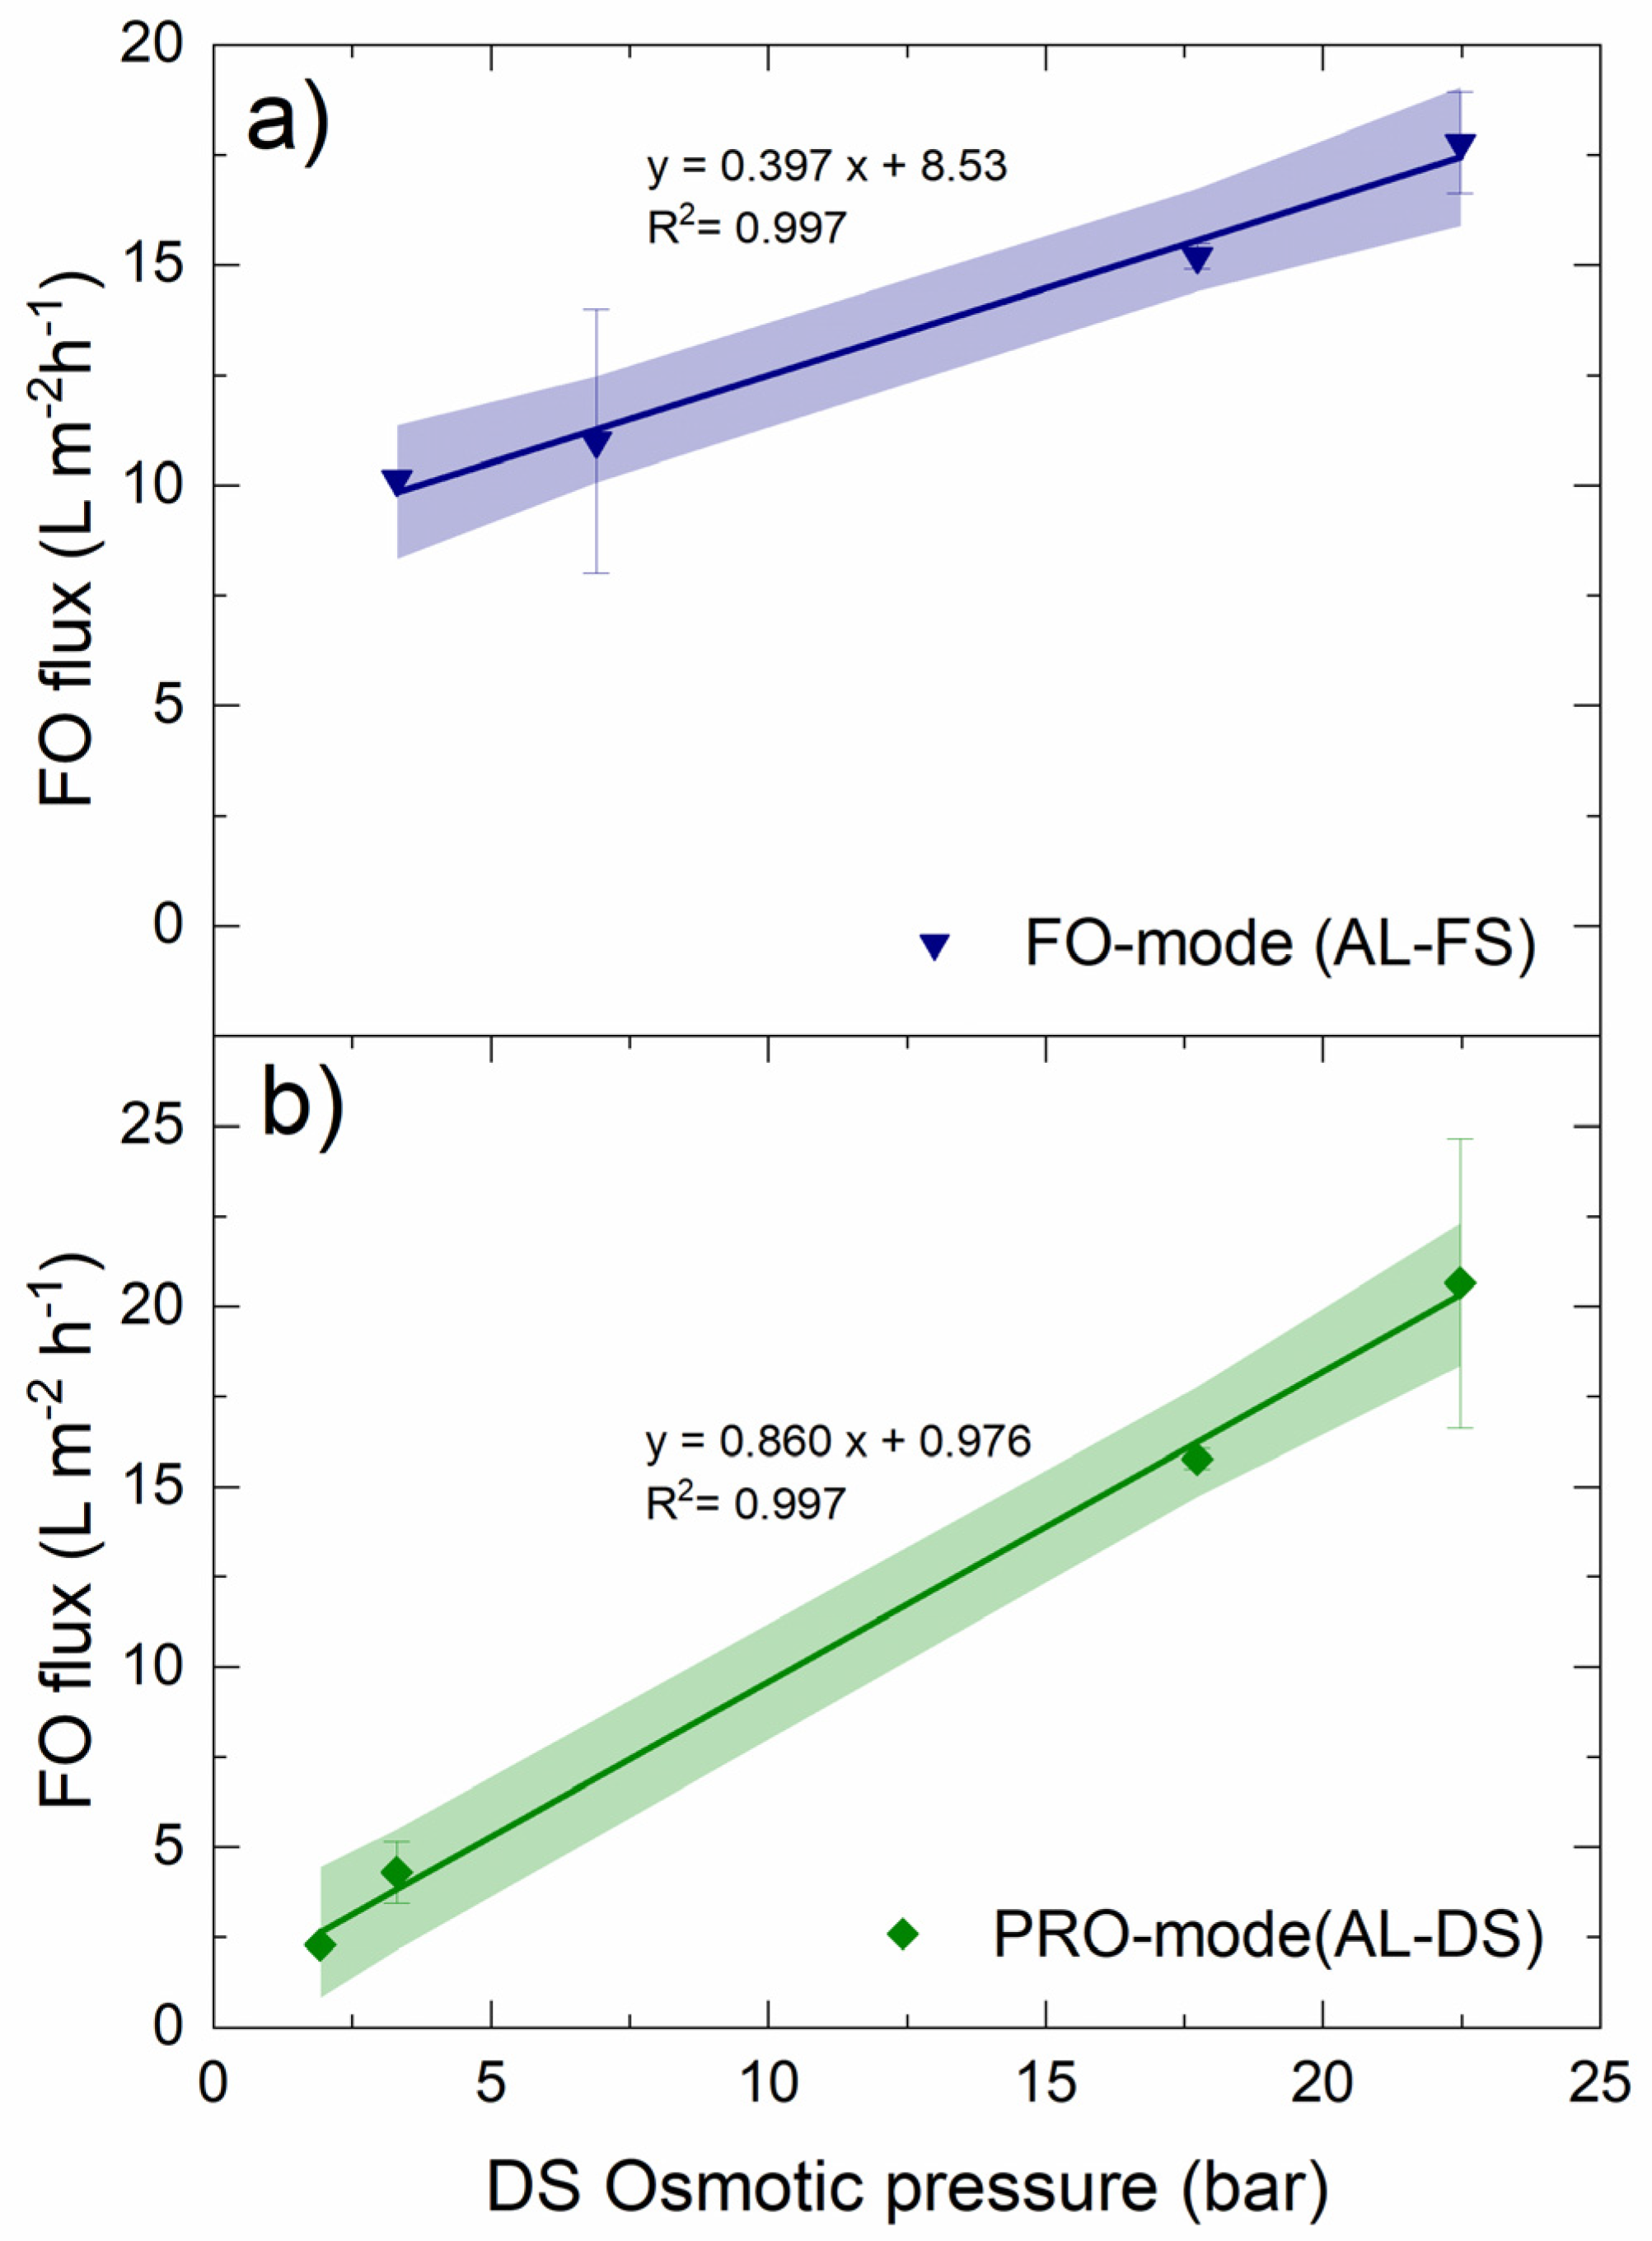
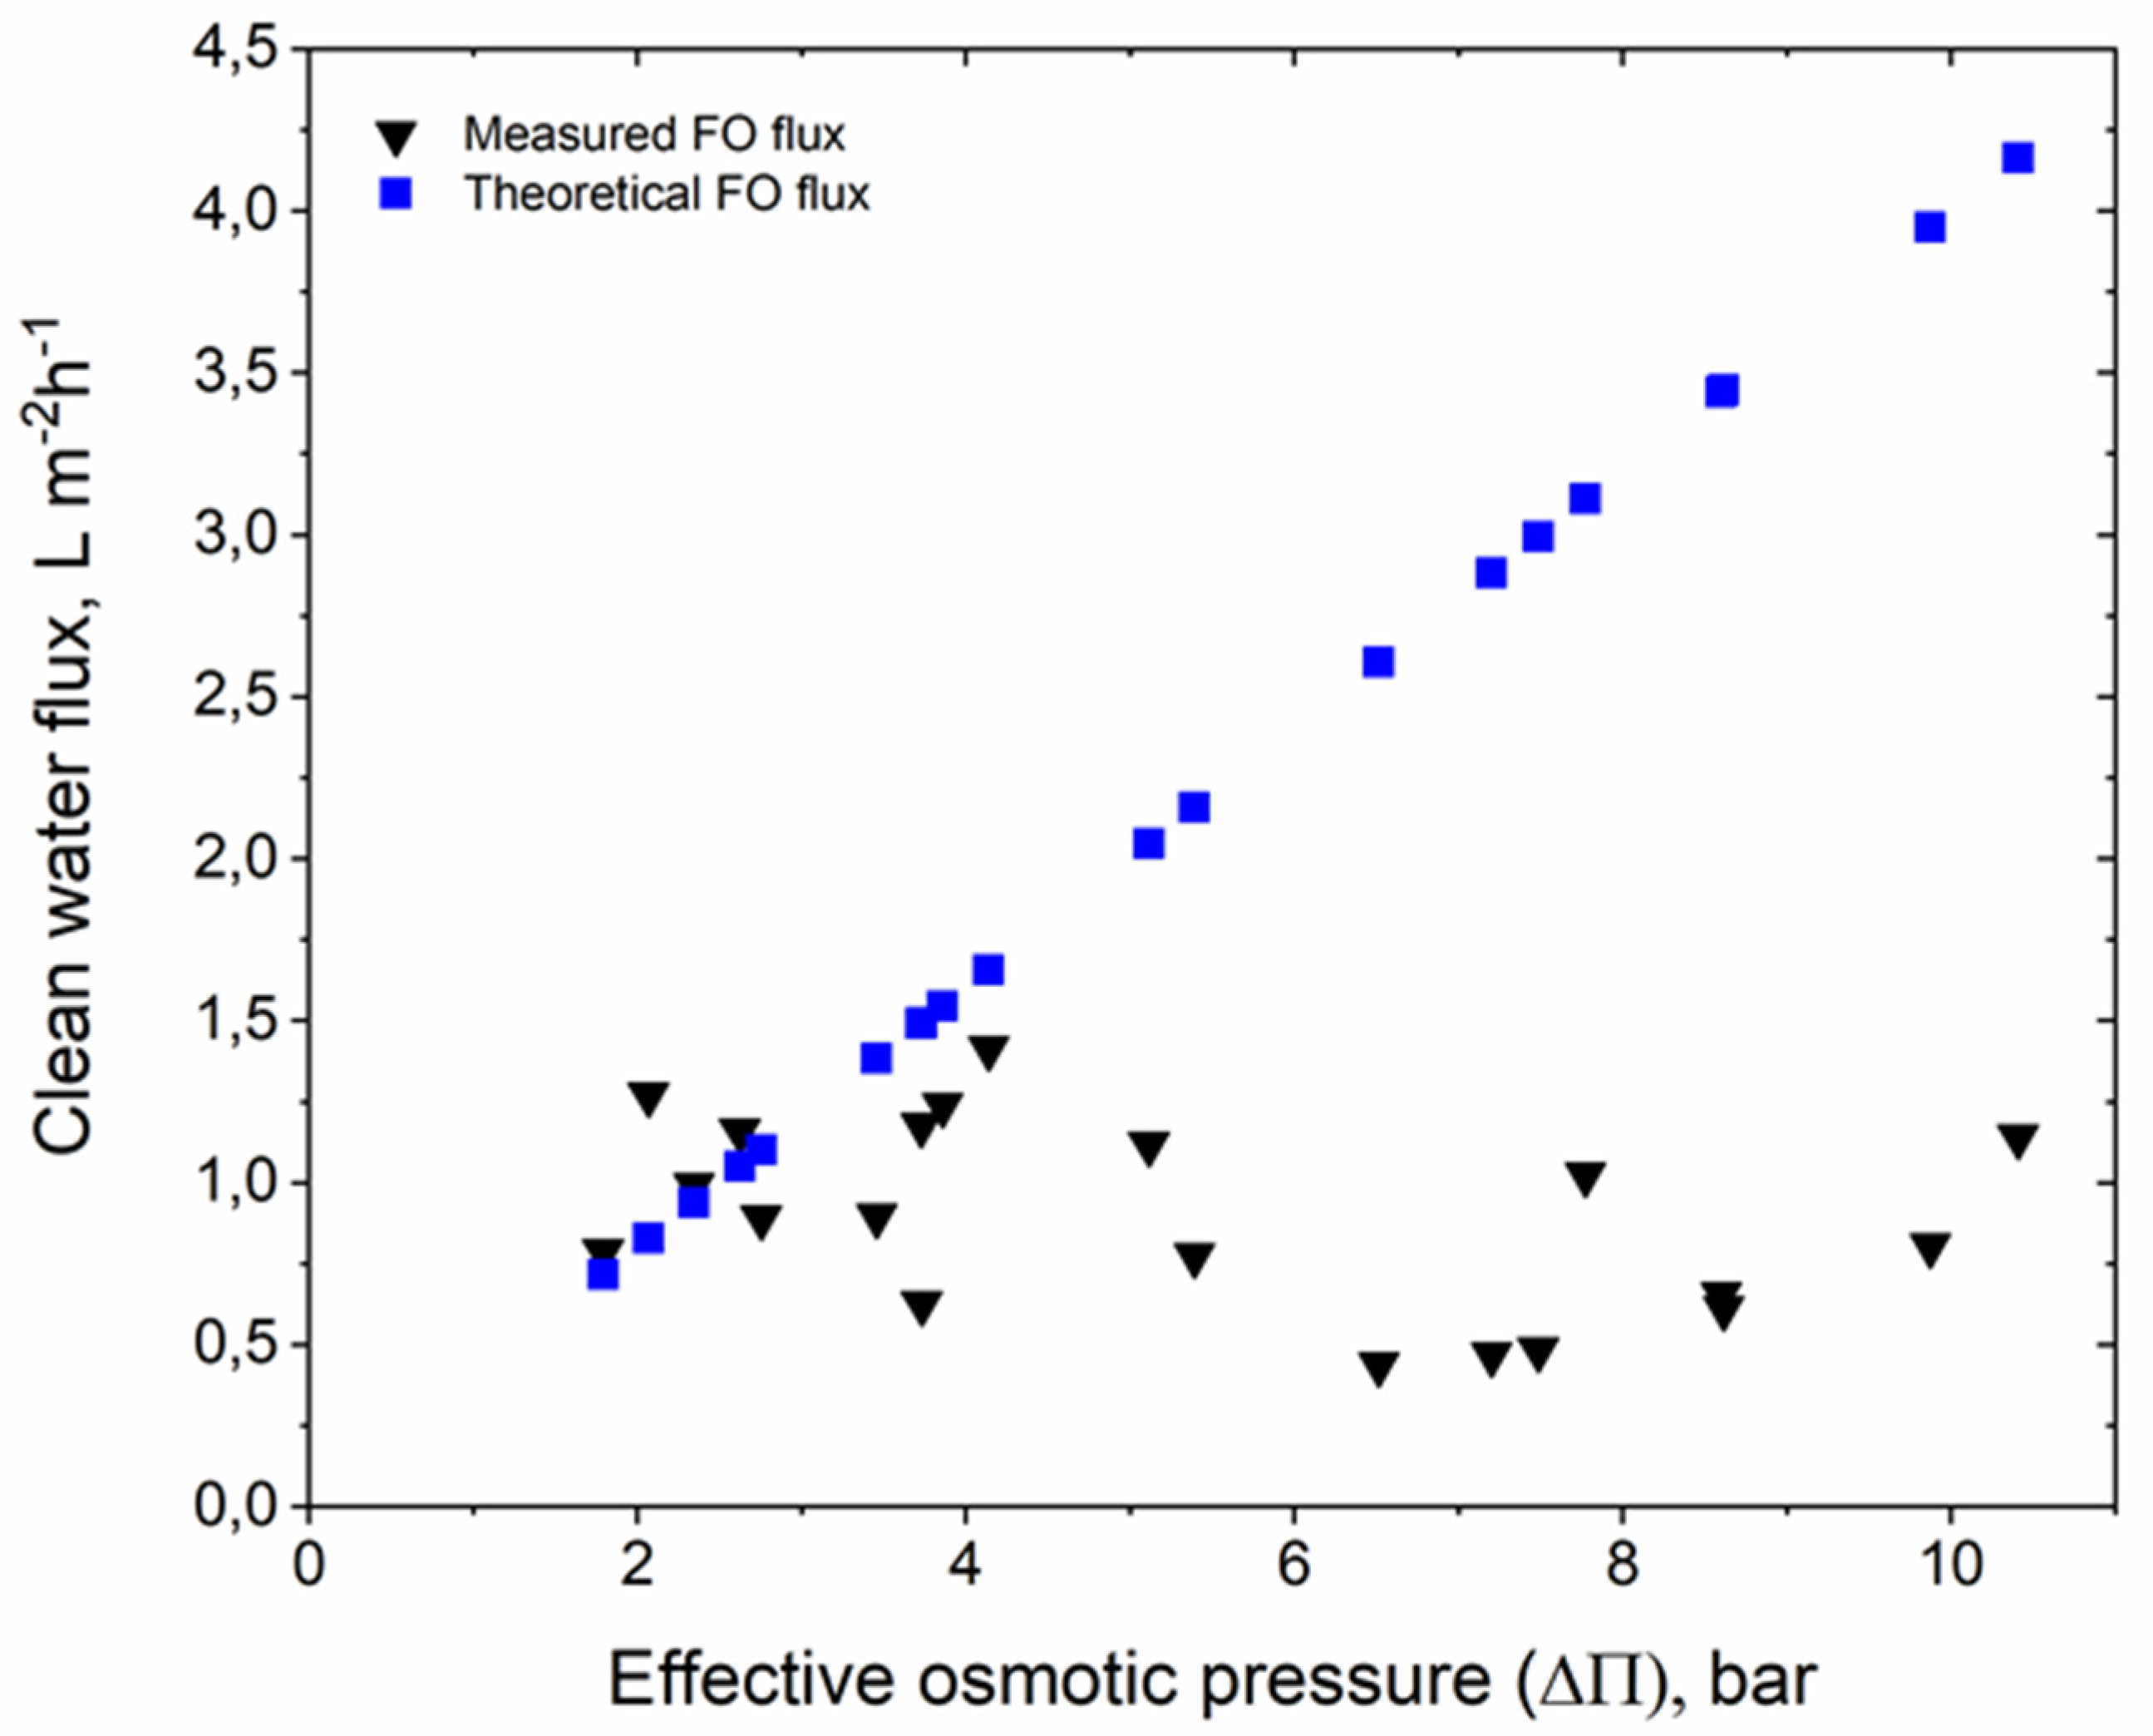
2.3. Experimental Protocol and FO Membrane Characterization

The MF-OMBR system was initially inoculated with activated sludge from Aalborg West Wastewater Treatment Plant (Aalborg, Denmark) having initial mixed liquor suspended solid (MLSS) concentration of 3.5 g L−1. Subsequently, the reactor was fed continuously with a synthetic substrate using a peristaltic dosing pump (Thomas, Germany) at 0.4 to 0.7 mL min−1 dosing every hour to reach the food to microorganism (F/M) ratio of 0.1–0.2 g COD (g MLSS)−1. The composition of synthetic substrate was selected in order to simulate nutrient composition of municipal wastewater (see Table A1, Appendix A). Likewise, tap water was automatically filled into the system with a floating valve for keeping the bioreactor volume constant. No sludge was removed from the reactor during the start-up process (about five weeks) to ensure enough acclimatization of the activated sludge process. However, a solid retention time (SRT) of 43 days was maintained after the MLSS concentration was reached to a quite stable value of 3.30 ± 0.3 g L−1 by continuously wasting about 150 mL d−1 of sludge from the system. Once the MF-MBR system was completely stabilized, FO system was also turned on and complete hybrid system was operated continuously at different operating conditions.
The conductivity of DS was elevated from 10 to 50 µS cm−1 at the interval of four days in order to increase the FO flux by constantly increasing osmotic pressure gradient at the FO membrane interface. Each conductivity of DS was maintained at least for four days in order to achieve a state of system equilibrium and operated for five different phases (as shown in Figure 1b). Therefore, nutrients enrichment was investigated under nearly steady concentration factor and FO flux, and varying salinity conditions in the MF-OMBR operation. DS was periodically changed with new solution after each four days of the operation and MF membrane was chemically cleaned (soaked in 0.1% (w/w) NaOCl and 1% (w/w) citric acid solutions for 24 h) before using for the subsequent experiments. However, no significant fouling was observed in the FO membrane, and the membrane was manually cleaned by water and normal brush after each experiment.
In addition, abiotic batch experiments were carried out to determine FO permeability of a membrane mounted in a membrane cell (Acrylic Sepa CF cell, Sterlitech, Kent, WA, USA) with effective surface area of 20 cm2 and crossflow velocity of 9 cm s−1 [18]. The membrane was oriented in both FO-mode (membrane active layer facing the feed solution) and PRO-mode (membrane active layer facing the DS) (Figure A1, Appendix A). The results showed that the permeability of FO membrane was nearly two times higher in PRO mode than in FO mode. This tendency is in good agreement with results of previous researchers [19]. Dilutive ICP occurred in FO-mode is more severe than in PRO-mode since larger molecular weight solutes cannot diffuse via active layer as quickly as the porous support [20,21].
Ideally, increasing the DS conductivity would increase osmotic pressure (Π) due to decreasing water activities of the solution in accordance with Equation (1). However, either the high FO rejection of ions or the reverse salt transport from DS can subsequently increase the osmotic pressure of feed solution, which leads on declining osmotic pressure gradient. The water flux (Jw) during the FO process was be calculated by using Equation (2), assuming that no boundary layers occur on either sides of the membrane [22].
Π = −ln(awR٠T/Vm
Jw = Am٠ΔΠ= Am٠(ΠDS − ΠFS)
where, aw is the water activity of a solution, R is the universal gas constant (8.314 × 10⁻² L bar K−1 moL−1), T is the temperature in Kelvin, Vm is the molar volume of solvent (L moL−1). Am is the water permeability coefficient of membrane, ΔΠ is the osmotic pressure difference between DS (ΠDS) and feed solution (ΠFS) at membrane interface that indicates an effective osmotic pressure gradient (driving force) across the active layer of membrane. The osmotic pressure of suspensions was determined by Equation (1) using measured water activities, as described in Section 2.5.

2.4. Membrane Fouling Propensity: TMP-Step Method

To assess the fouling propensity of sludge at different salinity conditions on the MF membrane, a batch TMP-step method was performed as described elsewhere [23]. In short, a lab-scale MBR (1.0 L) system was used with MF membrane module (A = 0.0085 m2) submerged inside, which was fed by the MF-OMBR sludge at the end of each four days as discussed in Section 2.3 and aerated continuously to simulate the identical condition as in the MF-OMBR system. The TMP was increased continuously from 20 to 100 kPa (five sets in total) by manually adjusting the difference in level of liquid in the reactor and MF permeate collection chamber. Each set was run for 15 min and a duration of five minutes relaxation was arbitrarily selected for all the steps. During filtration, permeate was collected in a beaker on a balance (Scout STX2202, Ohaus, NJ, USA) to record flux.

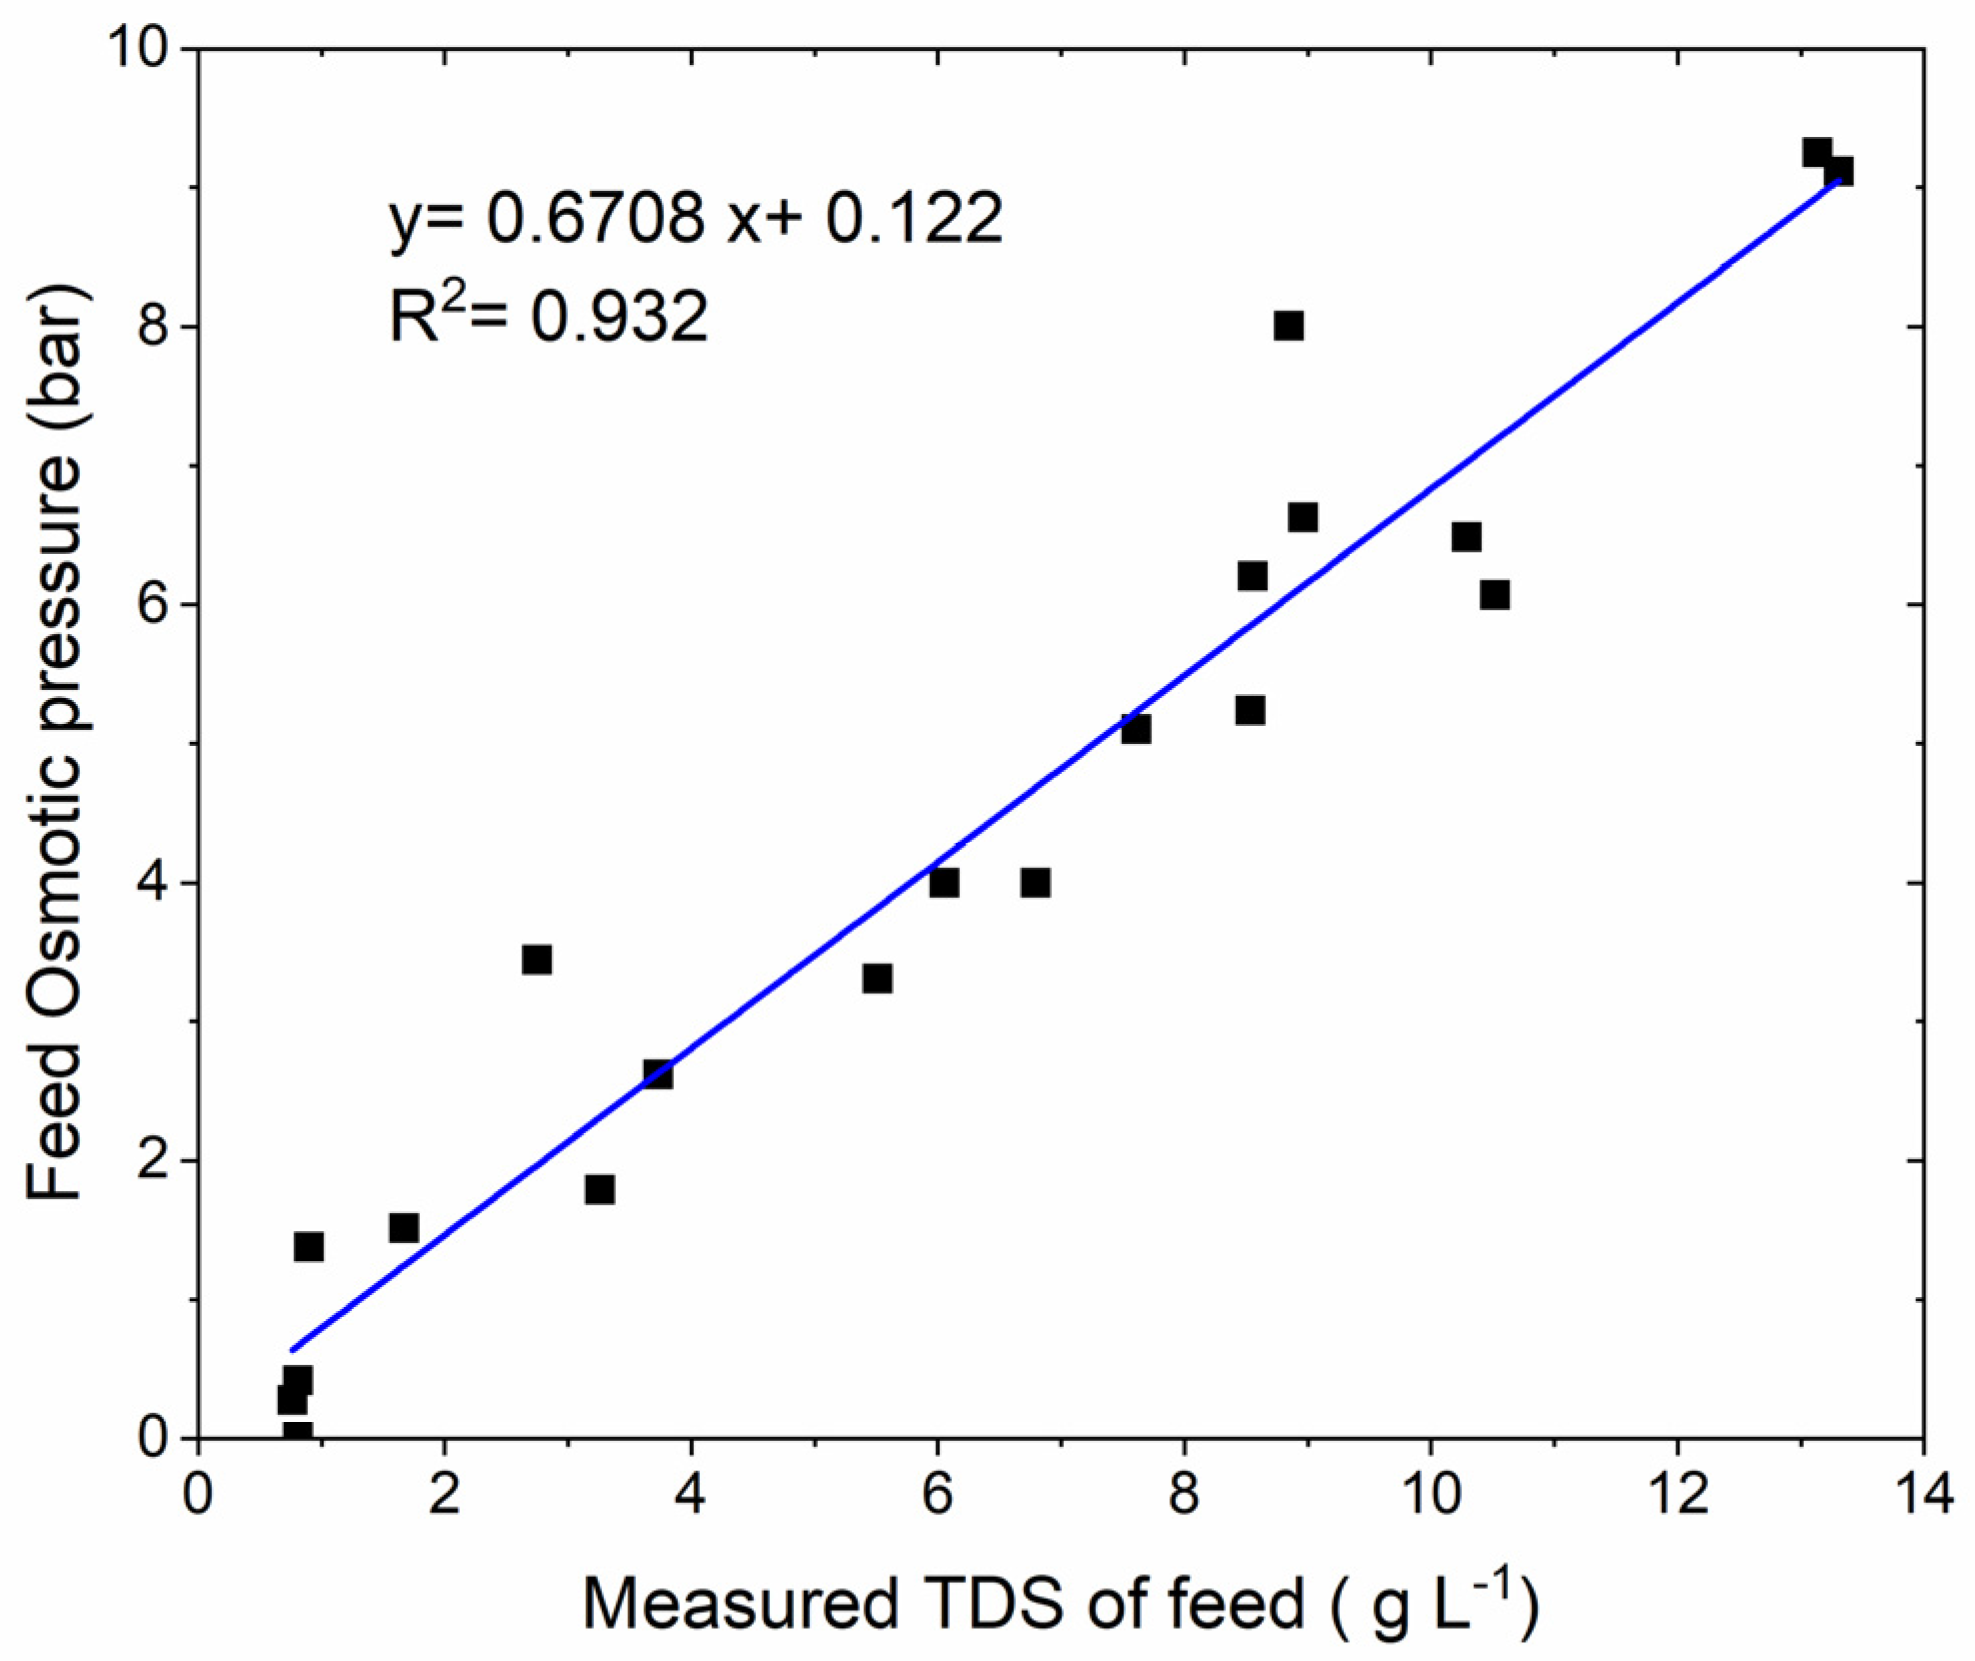
2.5. Analytical Methods

The conductivity, salinity, and pH of the MLSS were monitored on a daily basis by conductivity meter (F30, Mettler Toledo, Columbus, OH, USA) and pH meter (F20, Mettler Toledo, Columbus, OH, USA). MLSS and mixed liquor volatile suspended solid (MLVSS) concentrations were determined daily according to the Standard Methods for the Examination of Water and Wastewater [24]. Water activity, aw, was measured by using an Aqualab water activity meter (Aqualab 4TE, Pullman, Washington, DC, USA) to calculate the osmotic pressure of DS and sludge.
Ammonium nitrogen (NH4-N) and orthophosphate (PO4-P) from FO permeate, sludge and MF permeate samples were collected daily. Sludge samples for PO4-P and NH4-N analysis were centrifuged (2000 rpm, 15 min) and supernatants were filtered through 0.45 µm membrane filters. The PO4-P filtrates were conserved with 4 mM H2SO4. Subsequently, the samples were analyzed using spectrophotometric method as described elsewhere [13].
The concentrations of biopolymers such as SMP and bound EPS in the sludge samples were determined as the fractions of protein, polysaccharide and humus. The extraction of SMP was carried out by centrifuging the sludge samples at 2000 rpm for 15 min and filtering the supernatant solution through a 0.45 µm filter, whereas bound EPS was extracted directly from the sludge samples. Polysaccharide was determined by the modified Anthrone method [25], with glucose as a standard, whereas the modified Lowry method using bovine serum albumin was used to determine protein and humus concentrations in the sludge.

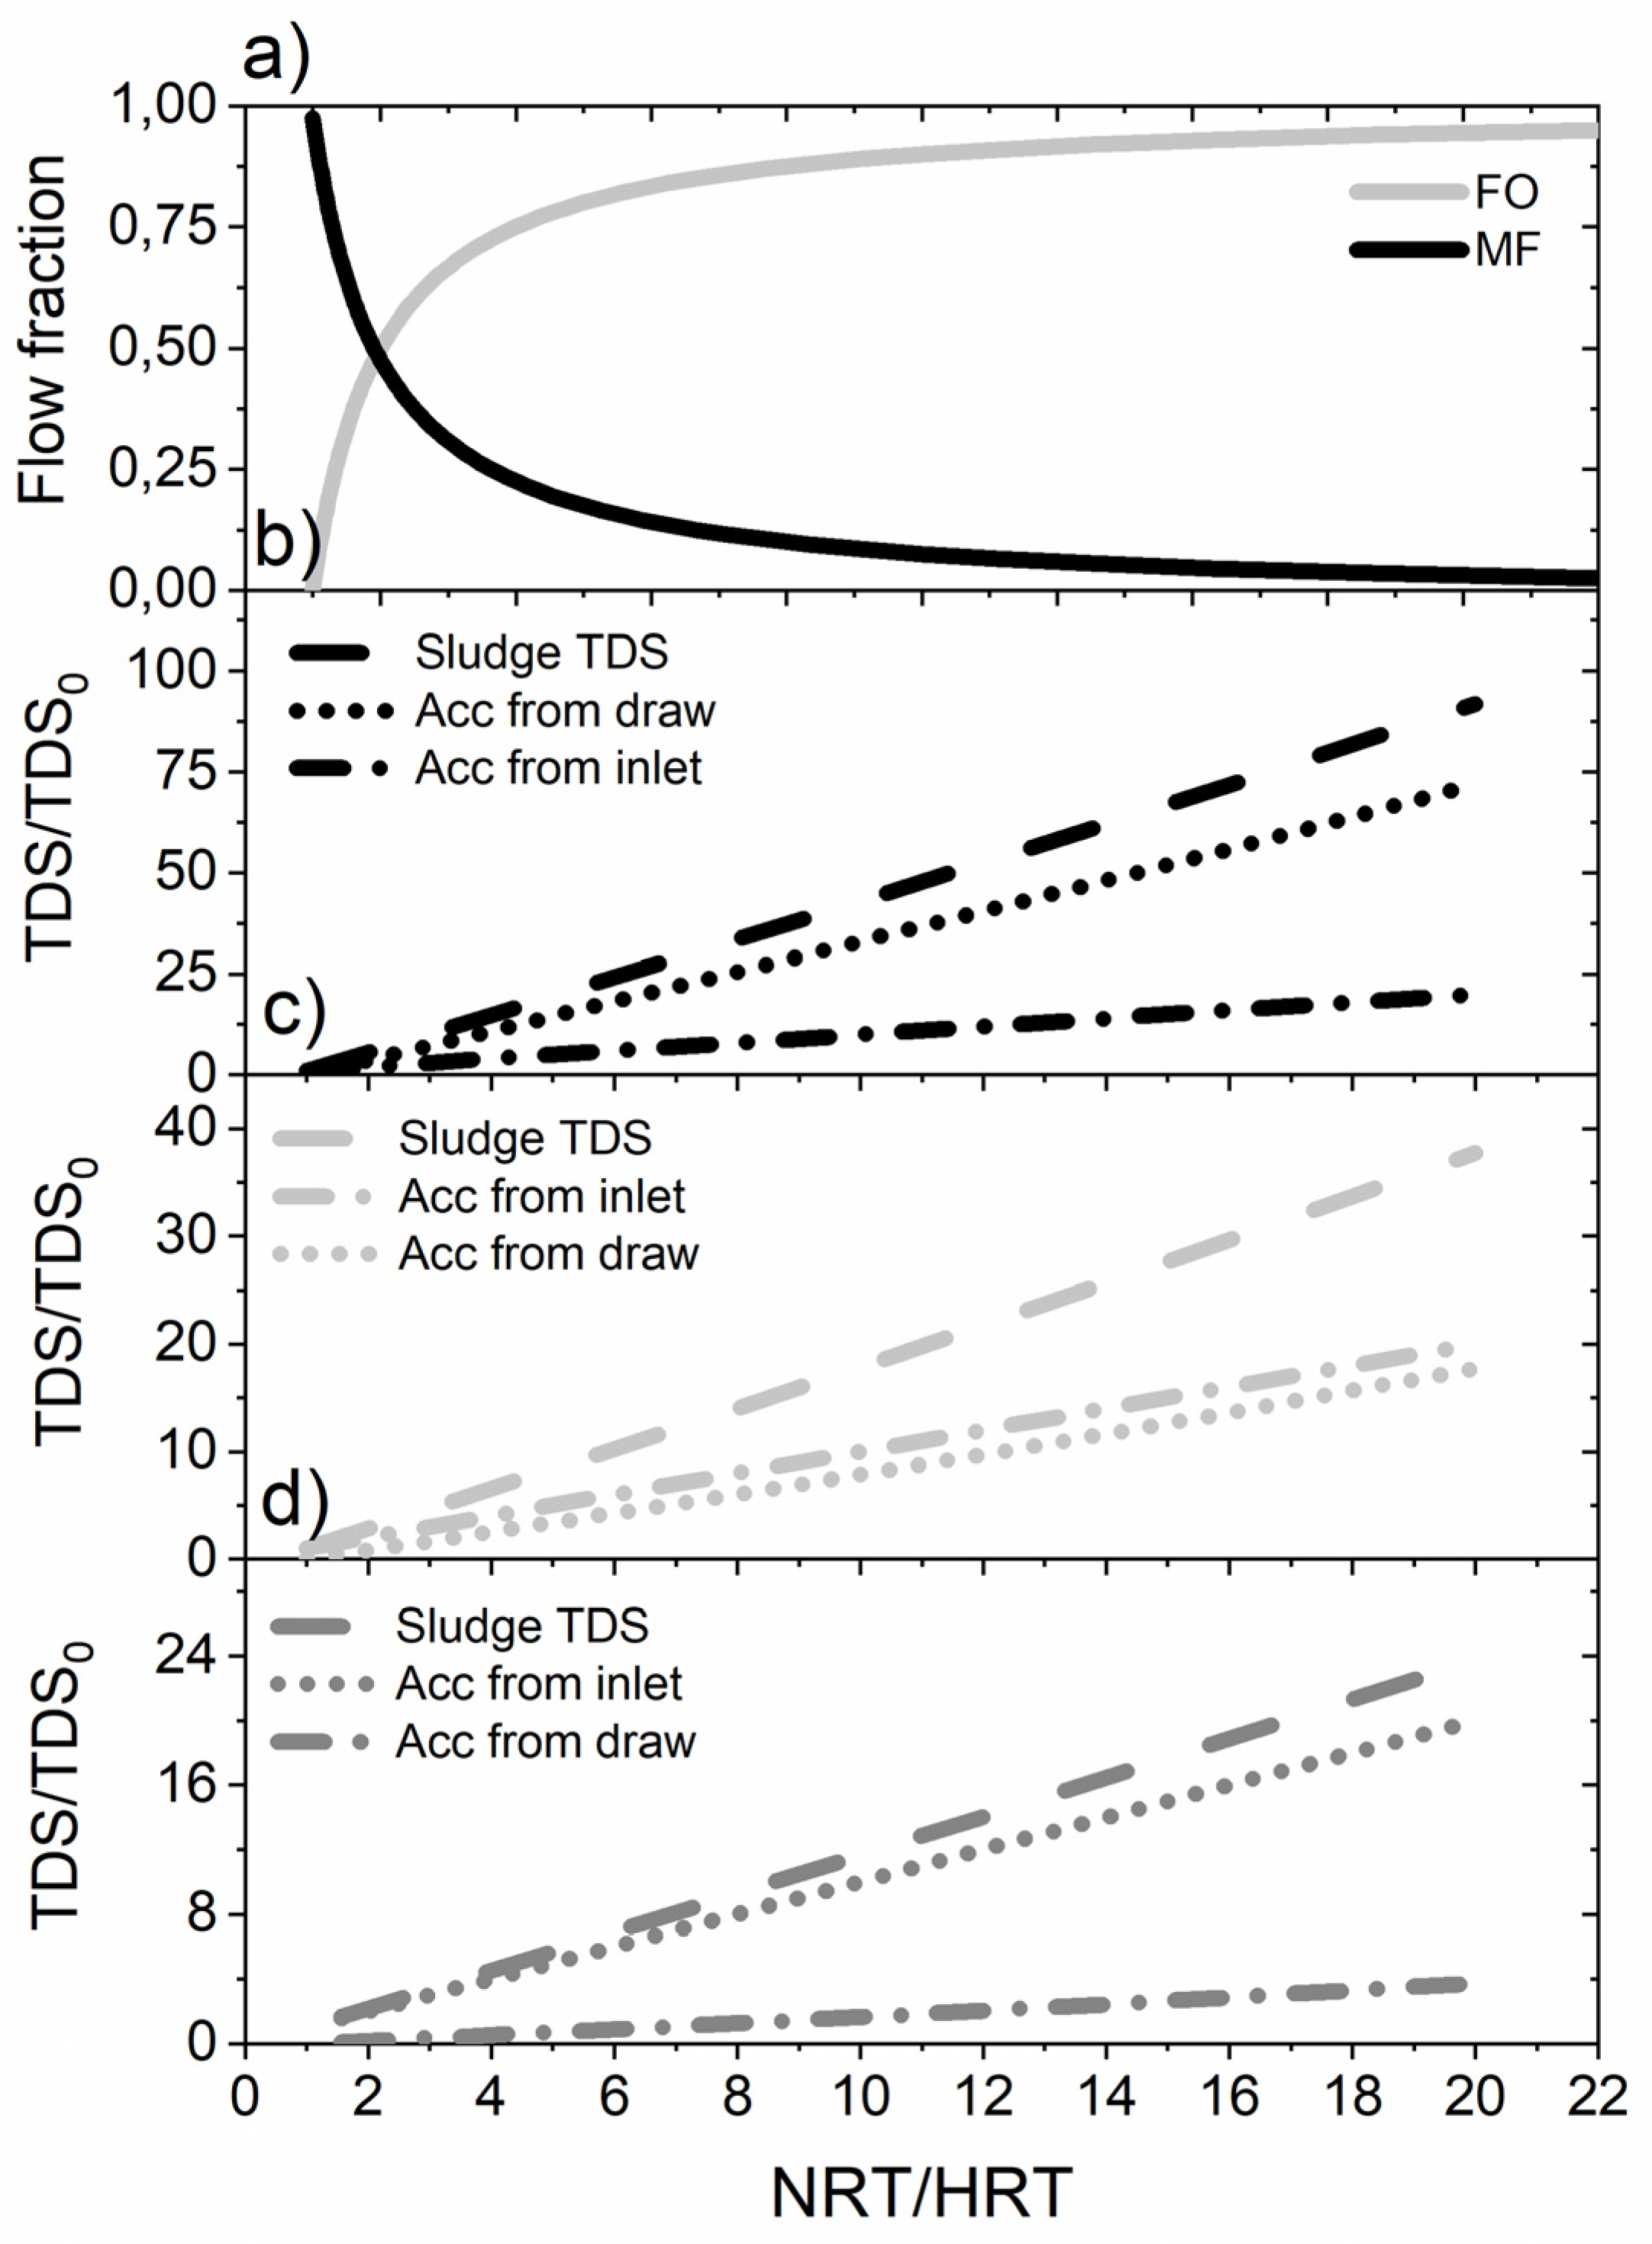
2.6. Simulations on Salt Accumulation at Varying Salt Diffusivities and Concentration Factors

The permeate flux through the FO membranes using MBR sludge as feed and NaCl as draw solution was simulated by using Equation (2), in which the osmotic pressure of DS was estimated using Equation (3):
ΠDS = 2٠CNaCl٠R٠T
where, CNaCl is the concentration of NaCl (mol L−1), and T is the temperature (293 K). On the other hand, osmotic pressure developed inside the system was calculated from the empirical equation (Equation (4)) deduced from the batch experiments (Figure A2, Appendix A) as explained in Section 2.3:
ΠFS = 0.67٠TDS + 0.122
where TDS is the total dissolved solids concentration. The reverse salt flux, from draw to feed (sludge) across the FO membrane was simulated by assuming that the solute flux depended directly on the concentration gradient according to Fick’s law of diffusion, Equation (5) [26]:
JS = B٠(CNaCl,DSCNaCl,FS)
where, B is the salt permeability (diffusivity) and CNaCl,DS and CNaCl,FS are the salt concentrations in draw solution and feed side of the FO membrane, respectively. Assuming the concentration of large particles did not contribute significantly to the osmotic pressure, in steady state of the system, the mass balance of the TDS inside the reactor would equal zero (Equation (6)):
dTDS/dt = TDS0٠Qin + Js٠A − TDS٠(QMF + QX)
where, TDS0 is the TDS entering the system with flow rate Qin; Js is the reverse salt flux from the membrane area A; TDS is extracted through an MF membrane (QMF) and excess sludge removal (Qx). The mass balance was solved to find the TDS concentration at steady state from inlet and draw (reverse salt flux) accumulation, as described in Equation (7):
dTDS/dt = TDS0٠Qin/(QMF + Qx) + Js٠A/(QMF + QX)
The first term in the right hand side of the equation, TDS0٠Qin/(QMF + Qx), describes the theoretical concentration factor of incoming dissolved solids neglecting the reverse salt flux, while the second term, Js٠A/(QMF + QX) is the TDS accumulated from the draw solution. Equation (7) can be rewritten to express TDS accumulation as a function of concentration gradient across the FO membrane and salt permeability, B by combining Equation (5):
dTDS/dt = TDS0٠Qin/(QMF + Qx) + B (CNaCl,DSCNaCl,FSA/(QMF + QX)
The hydraulic retention time (HRT), nutrients retention time (NRT) and concentration factor were defined by Equations (9)–(11), respectively [13]:
HRT = V/Qin
NRT = V/(QMF+QX)
Concentration factor = NRT/HRT
where, V refers to total volume of the reactor (L), and the concentration factor is for salt and molecules that are rejected by be forward osmosis membrane, but passed through the microfiltration membrane.

3. Results

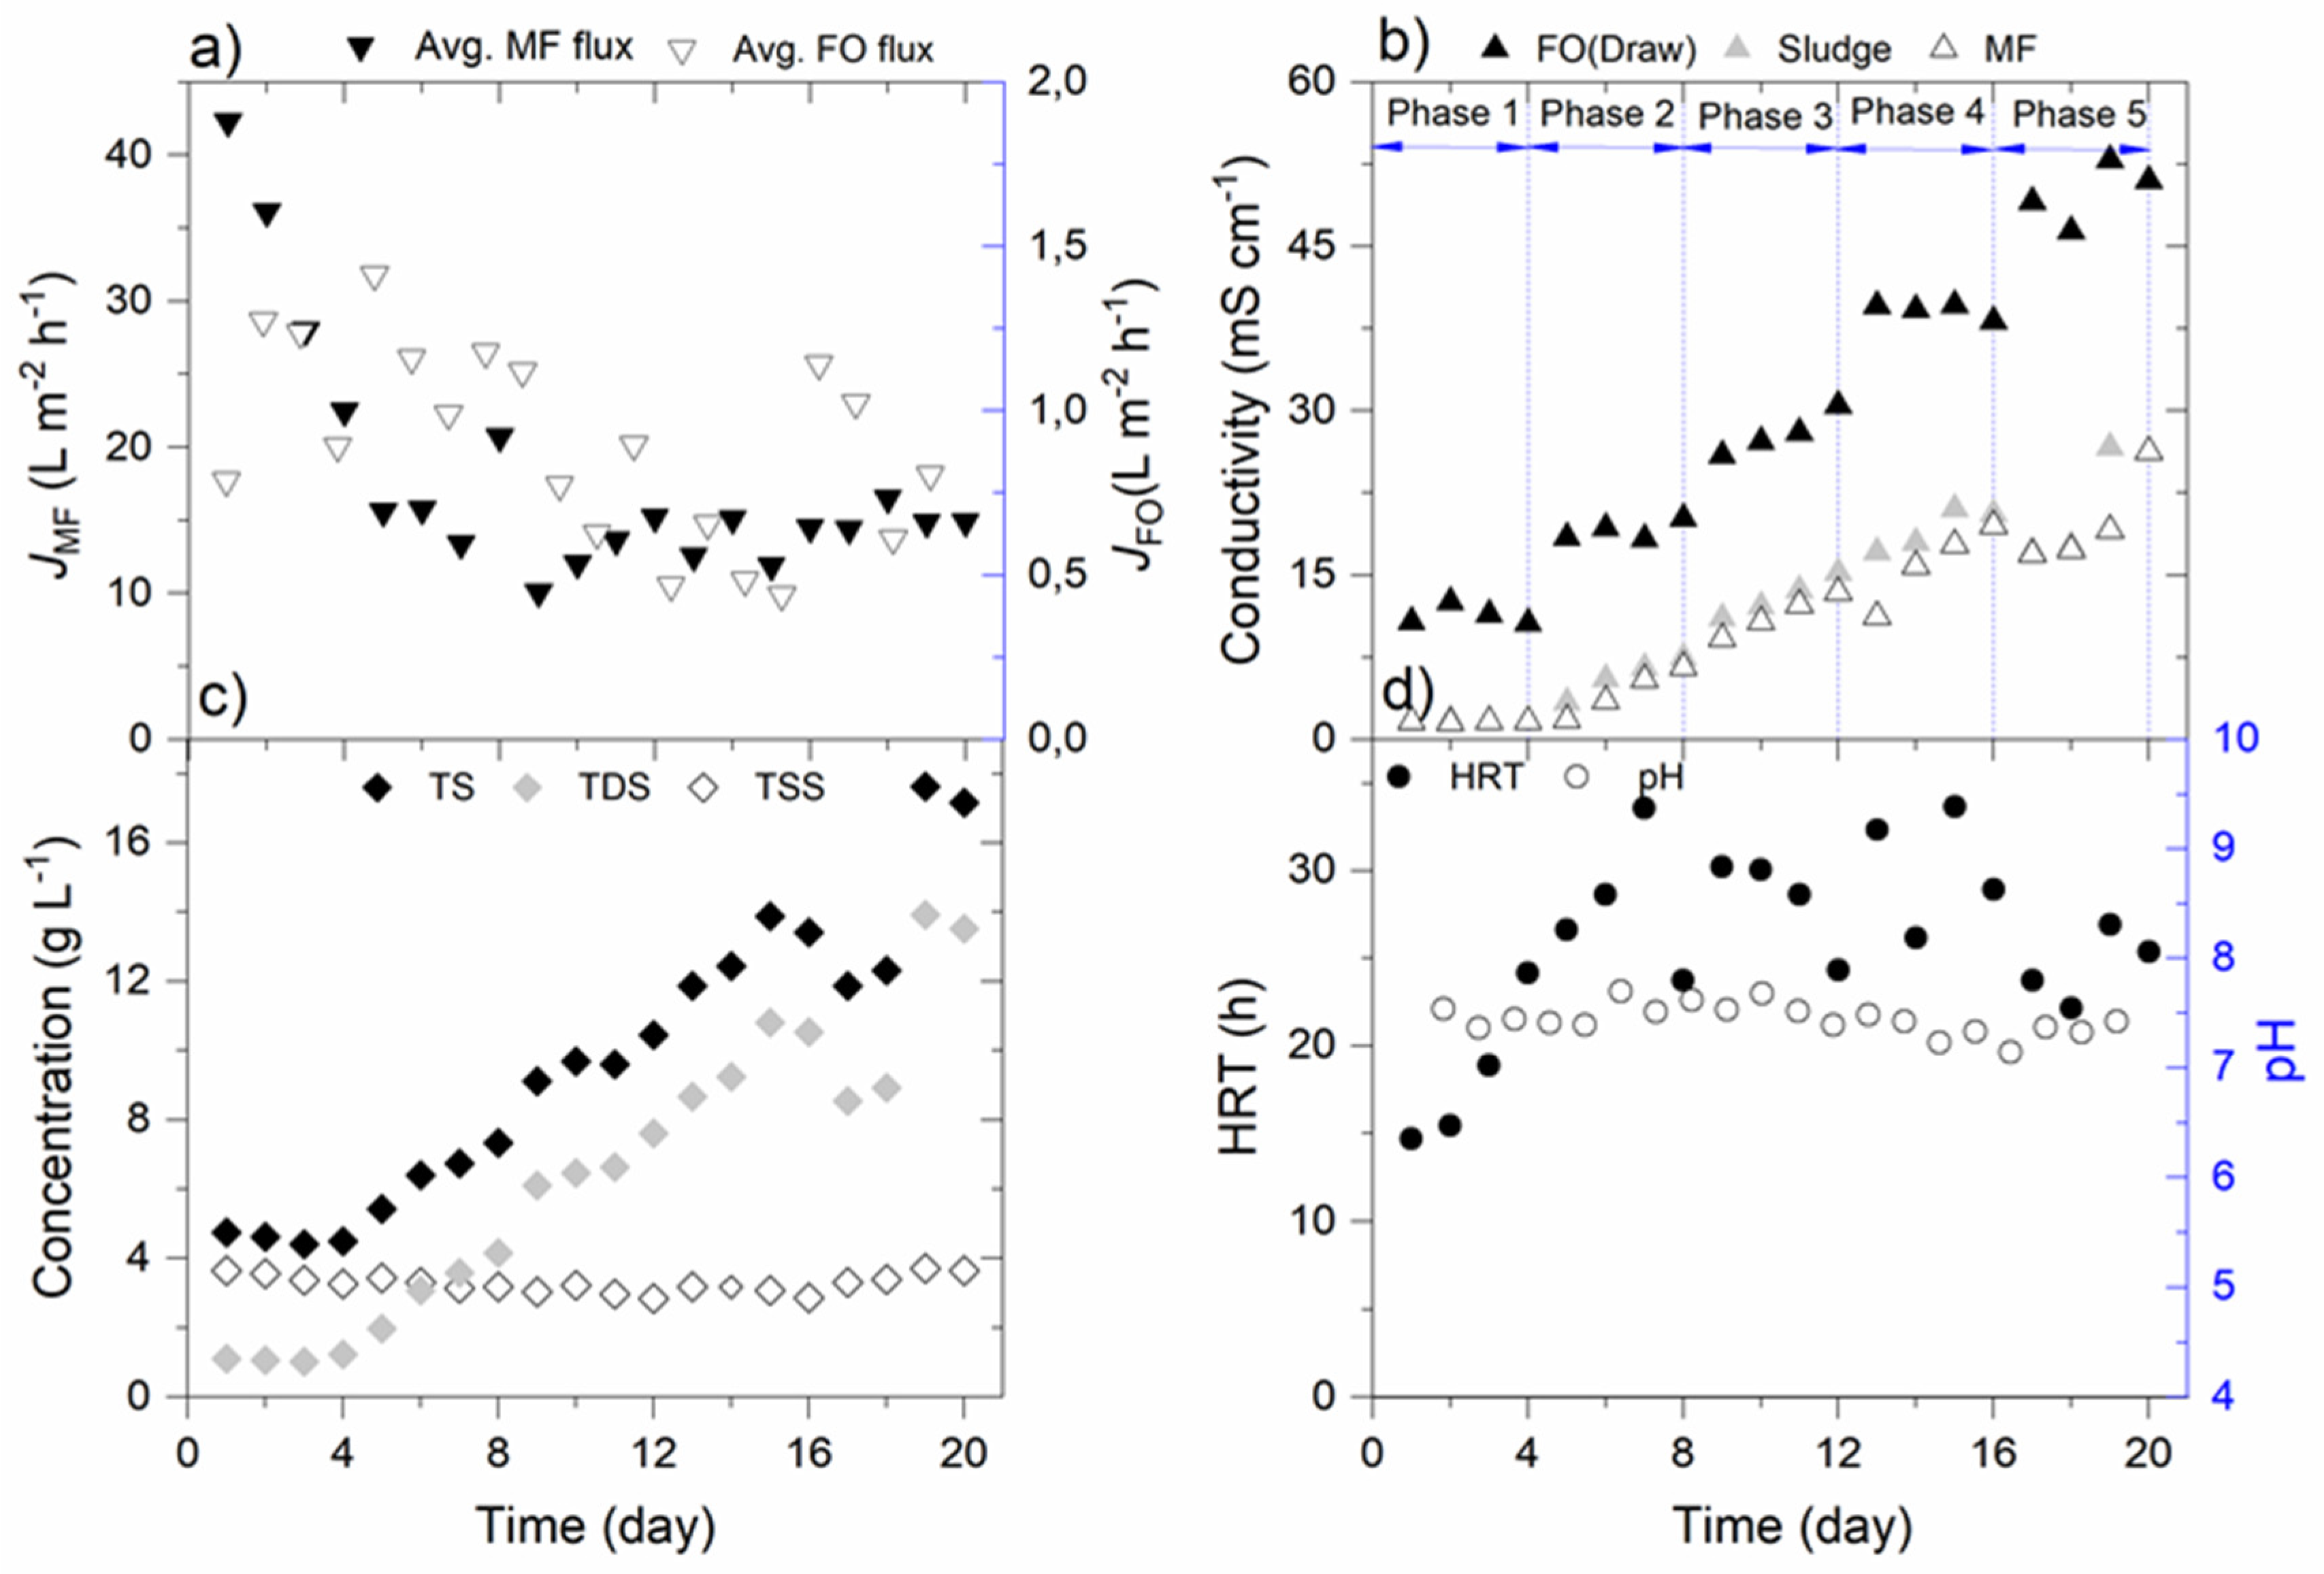
3.1. MF-OMBR Process Parameters under Varying Salinity Conditions and Concentration Factors

The operational parameters of the MF-OMBR process were observed as shown in Figure 1a–d. The MF flux declined rapidly from 42.3 to 15.6 L m−2 h−1 during the first five days, but gradually adjusted and maintained at 14.5 ± 2.4 L m−2 h−1 over day 8 to 20 (Figure 1a). Although the MF membrane fouled rapidly over the operation, the in situ cleaning of membrane helped in maintaining the constant MF flux. On the other hand, a relatively low, yet stable FO flux (0.9 ± 0.3 L m−2 h−1) was observed over the experimental period despite of periodically increasing the DS conductivity. Indeed, low flux tendencies in the MF-OMBR have also been reported in other studies [13,17]. Since a relatively low flux was contributed by the FO membrane, the MF flux predominantly influenced the overall HRT of the system. After day 5, the overall HRT of the system was maintained between 22.2 and 33.6 h (27.8 ± 3.5 h) (Figure 1d).
Since DS conductivity was elevated periodically from set values of 10 to 50 mS cm−1 (actual 11.3 to 49.8 mS cm−1), conductivity of the sludge as well as MF flux substantially increased after day 4 (Figure 1b). The conductivity of sludge and MF permeate increased linearly from 5.7 and 4.3 mS cm−1 on day 5 to 21.9 and 19.8 mS cm−1, respectively on day 20. Since the HRT of the system was kept almost constant in this study, a relatively steady bleeding of solutes via MF permeate can be expected. The increasing sludge conductivity may be a combined consequence of retention and therefore concentration of ions by the FO membrane and by the reverse salt flux from draw side. To assess this further, the reverse salt flux (RSF) was measured analytically using the FO membrane that was used in the system after day 20 using 35 g L−1 NaCl as DS. A permeate flux of 3.0 L m−2 h−1 was observed with the corresponding RSF of 2.788 g m−2 h−1 corresponding to a NaCl permeability of 0.0797 L m−2 h−1. It is worth noting that the observed flux of salt from the draw stream was relatively high as compared to another study using Aquaporin membranes, where RSF of 0.011 g m−2 h−1 was reported [18]. Indeed, the inorganic monovalent NaCl salts are prone to relatively high reverse salt flux due to their small size and high diffusivity [10,17]. The reverse salt flux accumulation of solutes in the sludge and associated increase in osmotic pressure may be an explanation for the lack of elevation in FO flux as draw solution osmotic pressure is elevated.
Increasing tendencies in the concentrations of TS and TDS were observed, whereas TSS concentration, proportional to biomass concentration, remained steady (Figure 1c). This indicated that the inorganic constituents were predominant in the sludge. Indeed, the high TDS concentrations accumulation can interfere with the oxygen transfer and influence the biological metabolism, which could deteriorate shock load sustaining capability of the reactor [27]. The higher conductivity and hence higher osmotic pressure of the feed solution is a result of higher inorganic ions concentration such as Ca2+, Mg2+, Na+, K+, SO42−, CO32−, and natural organic matter that are continuously rejected by the FO process [13]. Although the osmotic pressure difference can be kept steady by gradually increasing the DS conductivity, the pure FO water flux is limited by the high salt flux in the reverse direction [12]. Therefore, it is important to optimize the MF and FO flows to keep a sustainable salt accumulation and ensure appropriate permeate flux. Moreover, pH of the sludge did not vary and remained at 7.44 ± 0.2 over the experimental period (Figure 1d).
To further investigate how osmotic pressures influence the FO permeate flux in the MF-OMBR system, an average FO flux and the theoretical flux (as calculated by Equation (2)) due to osmotic driving force, were plotted against the effective osmotic pressure (Figure A3, Appendix A). A clean water permeability (Am) of 0.4 L m−2 h−1 bar−1 was adopted for FO membrane orienting in FO-mode (Figure A1, Appendix A). In Figure A3, a linearly positive correlation of theoretical FO flux was observed with corresponding effective osmotic pressures. Contrarily, measured FO flux practically showed no significant correlation with increasing effective osmotic pressure and remained nearly constant. These results confirmed the effect of salt diffusion to feed side with the increasing draw solution concentration, which continuously build up salinity in the sludge. This may have resulted in concentration polarization and reduced elevation of effective osmotic pressure gradients since draw solution concentration was leveled, resulting in a very low and almost constant FO permeate flux.

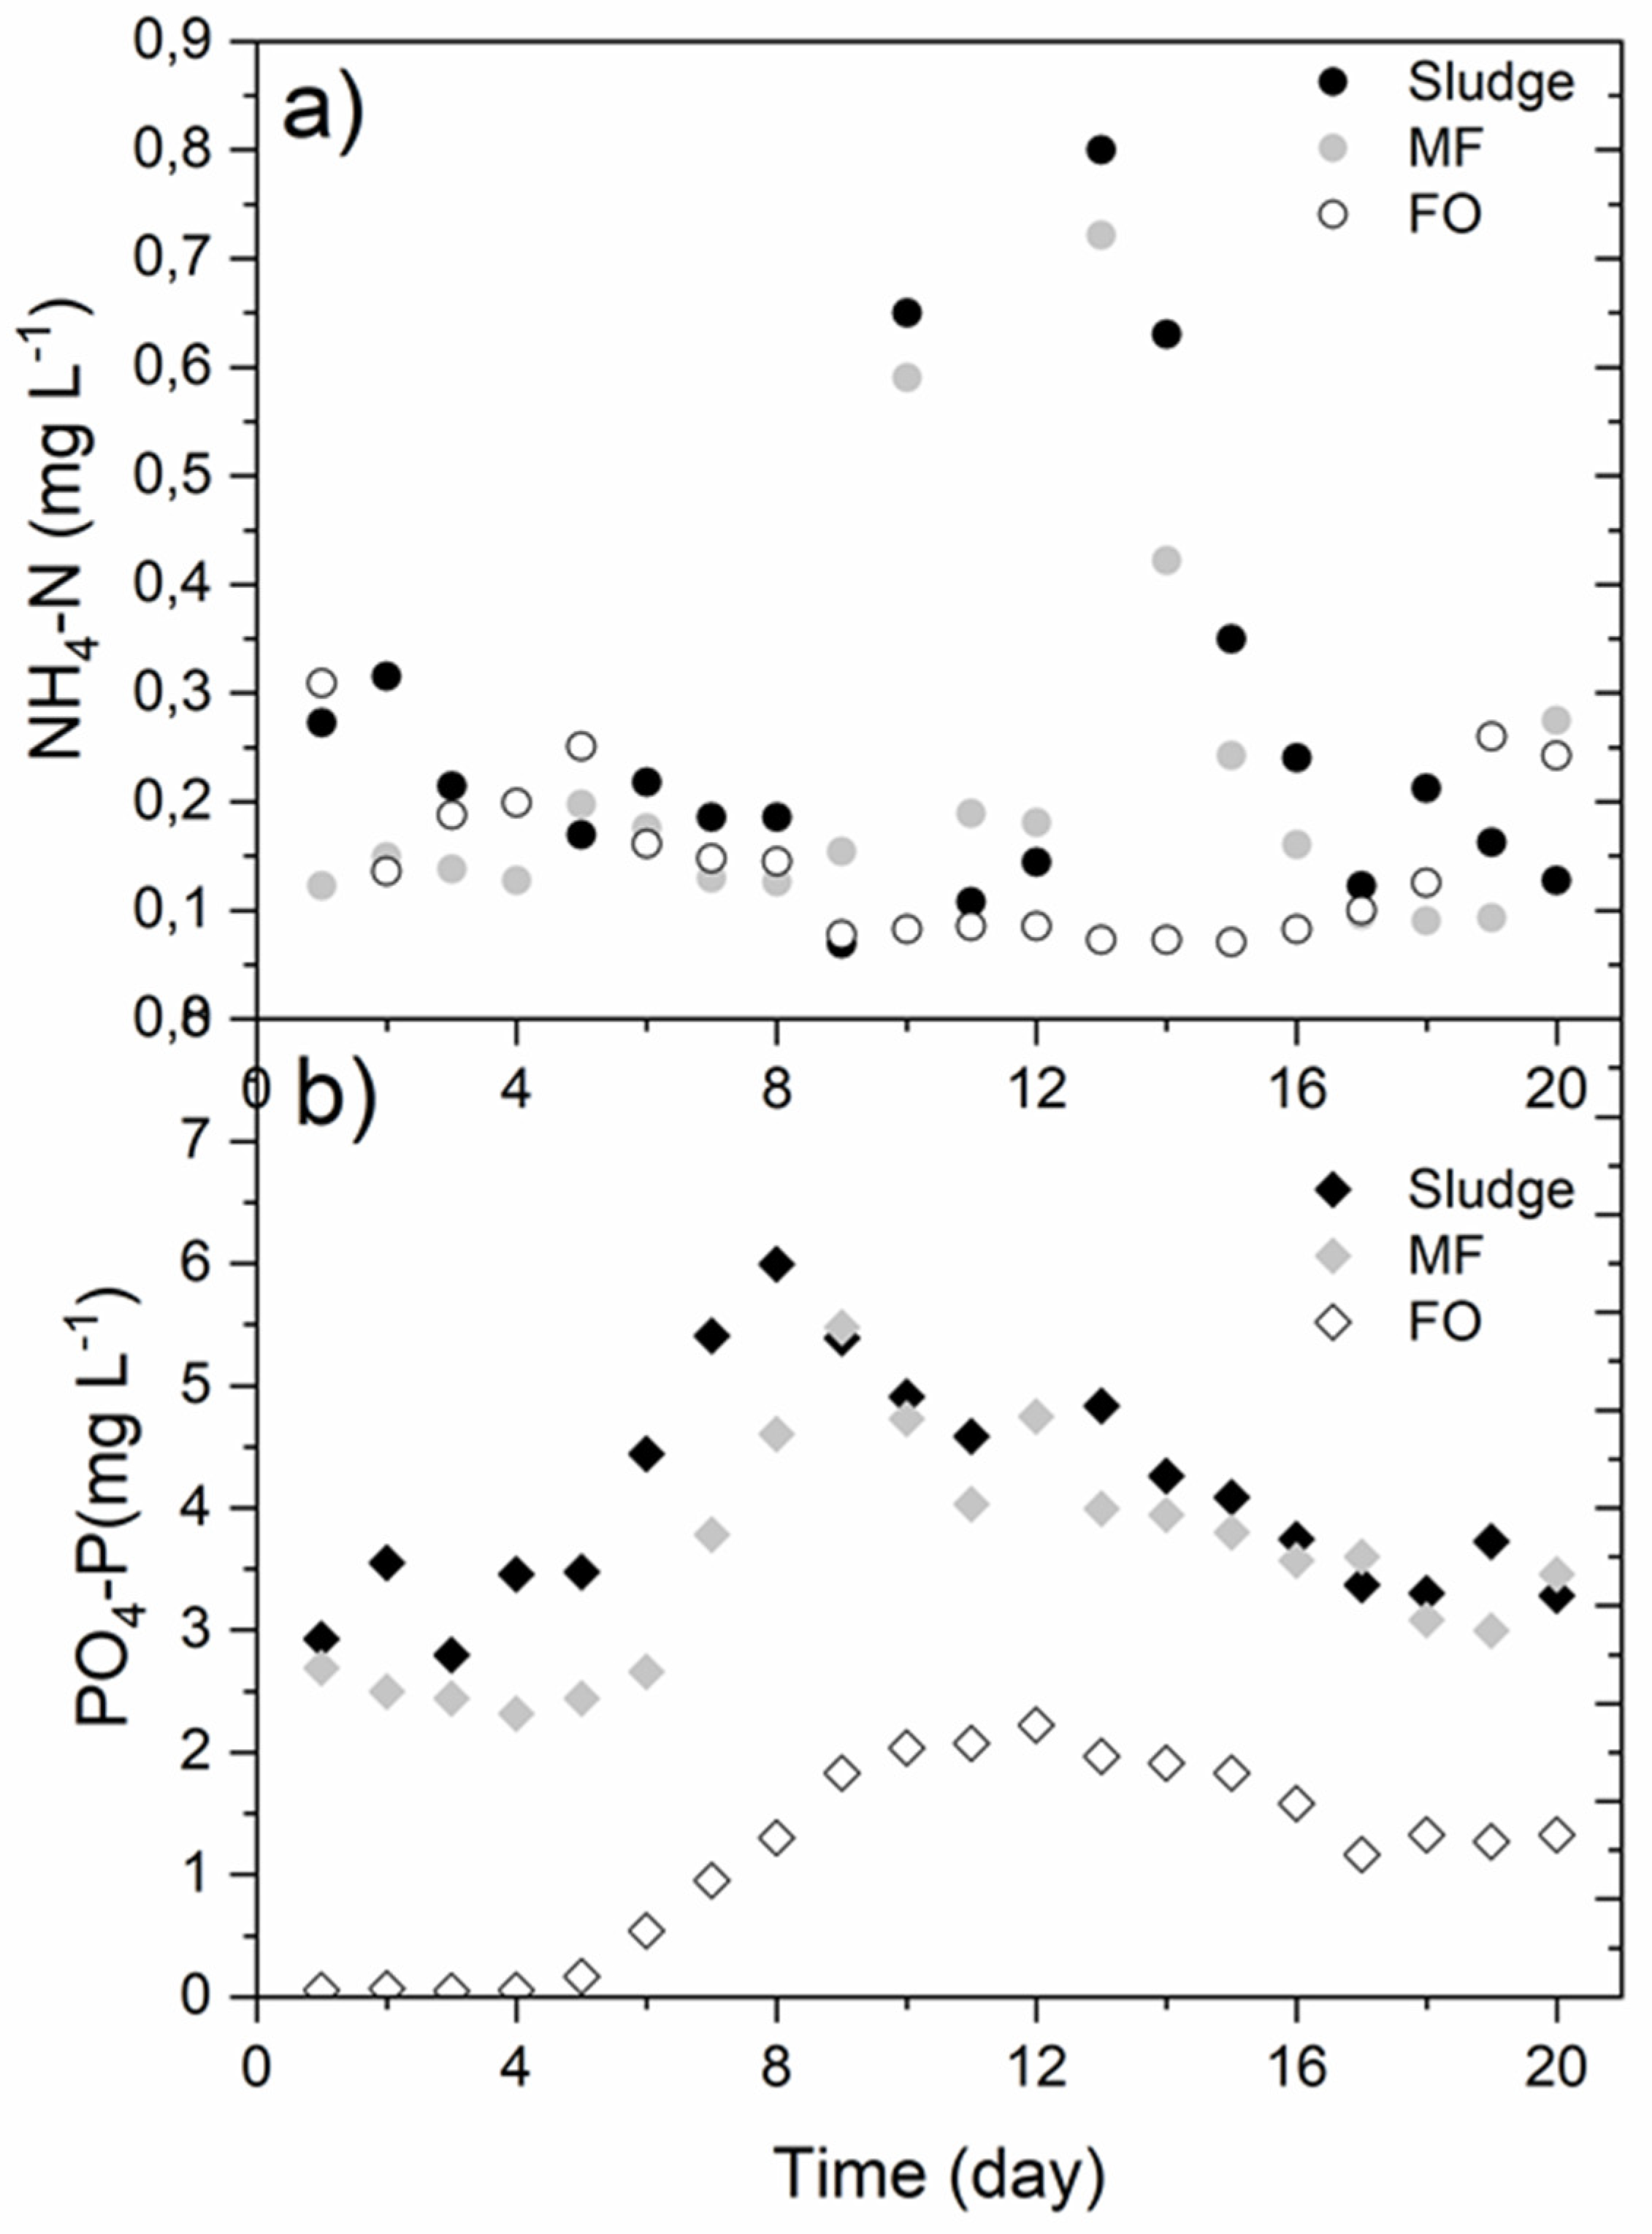
3.2. Nutrients Enrichment in the MF-OMBR System

Nutrient concentrations, i.e., dissolved nitrogen (NH4-N), dissolved phosphorus (PO4-P), and total phosphorus (TP), were continuously monitored during the entire experimental period from excess sludge, FO and MF permeate samples (Figure 2).
Over the experimental period, very low NH4-N concentrations (<1 mg L−1) were observed in the samples of sludge, MF permeate, and FO permeate (Figure 2a), as compared to the initial NH4-N concentration of 10.75 ± 0.7 mg L−1. The idea was to concentrate the dissolved nitrogen inside the reactor that can be recovered further via MF permeate as direct struvite recovery, but since nitrifying bacteria were grown during the inoculation of the system from aerobic sludge, most of the NH4-N was nitrified. However, during the operation days 10 to 15, NH4-N concentrations in sludge and MF permeate increased (about fourfold), which can be attributed to the elevated salinity buildup inhibiting the metabolism of nitrifying bacteria, and thus the nitrification process [15]. However, NH4-N concentration continued decreasing and reached at 0.13 mg L−1 during day 17 to 20 while the sludge conductivity was above 20 mS cm−1, which may be due to the microbial acclimatization to increased salinity. On the other hand, apparently low rejection of NH4-N was observed from FO membrane over the experimental period with average draw concentration of 0.14 mg L−1. This may be attributed to the possible ions exchange of reverse sodium flux (with high concentrations) to facilitate forward NH4-N flux at pH 5–8 [28].
The dissolved phosphorus (i.e., PO4-P) concentration showed fluctuating tendency over the different salinity conditions (Figure 2b). The concentrations of PO4-P extracted from sludge and MF permeate were nearly comparable with similar evolution tendencies, as expected. While, PO4-P concentrations in FO permeate were very low during low salinity period, followed by gradual increases up to day 8, and then decreased with increasing salinity of the sludge until day 20. The PO4-P concentrations in FO permeate increased from 0.05 mg L−1 to 1.5 ± 0.5 mg L−1 while the sludge conductivity increased from 1.6 to 26.3 mS cm−1. The biological phosphorus removal occurs mainly because of uptake and assimilation by phosphate accumulating organisms (PAOs), which are highly vulnerable to saline conditions [15]. The PO4-P enriched in the sludge until day 8 and reached up to 6.0 mg L−1, while the conductivity was observed to be 3.7 ± 2.4 mS cm−1. The concentration of PO4-P continuously decreased between day 8 and 20, which may be eventually due to precipitation within the reactor [13].
Contrarily, in this study, noticeable concentrations of PO4-P were observed in FO permeate. This phenomenon might be due to the possible reverse salt transport flow from the DS reservoir into the bioreactor that enabled the diffusion of charged PO4-P via the same route [28]. Nevertheless, relatively high and stable rejection of PO4-P by the FO membrane was observed and explained by the larger hydrated radius of phosphate molecules and their negative charged ions (H2PO4 and HPO42−), and the negatively charged FO membrane surface [29].

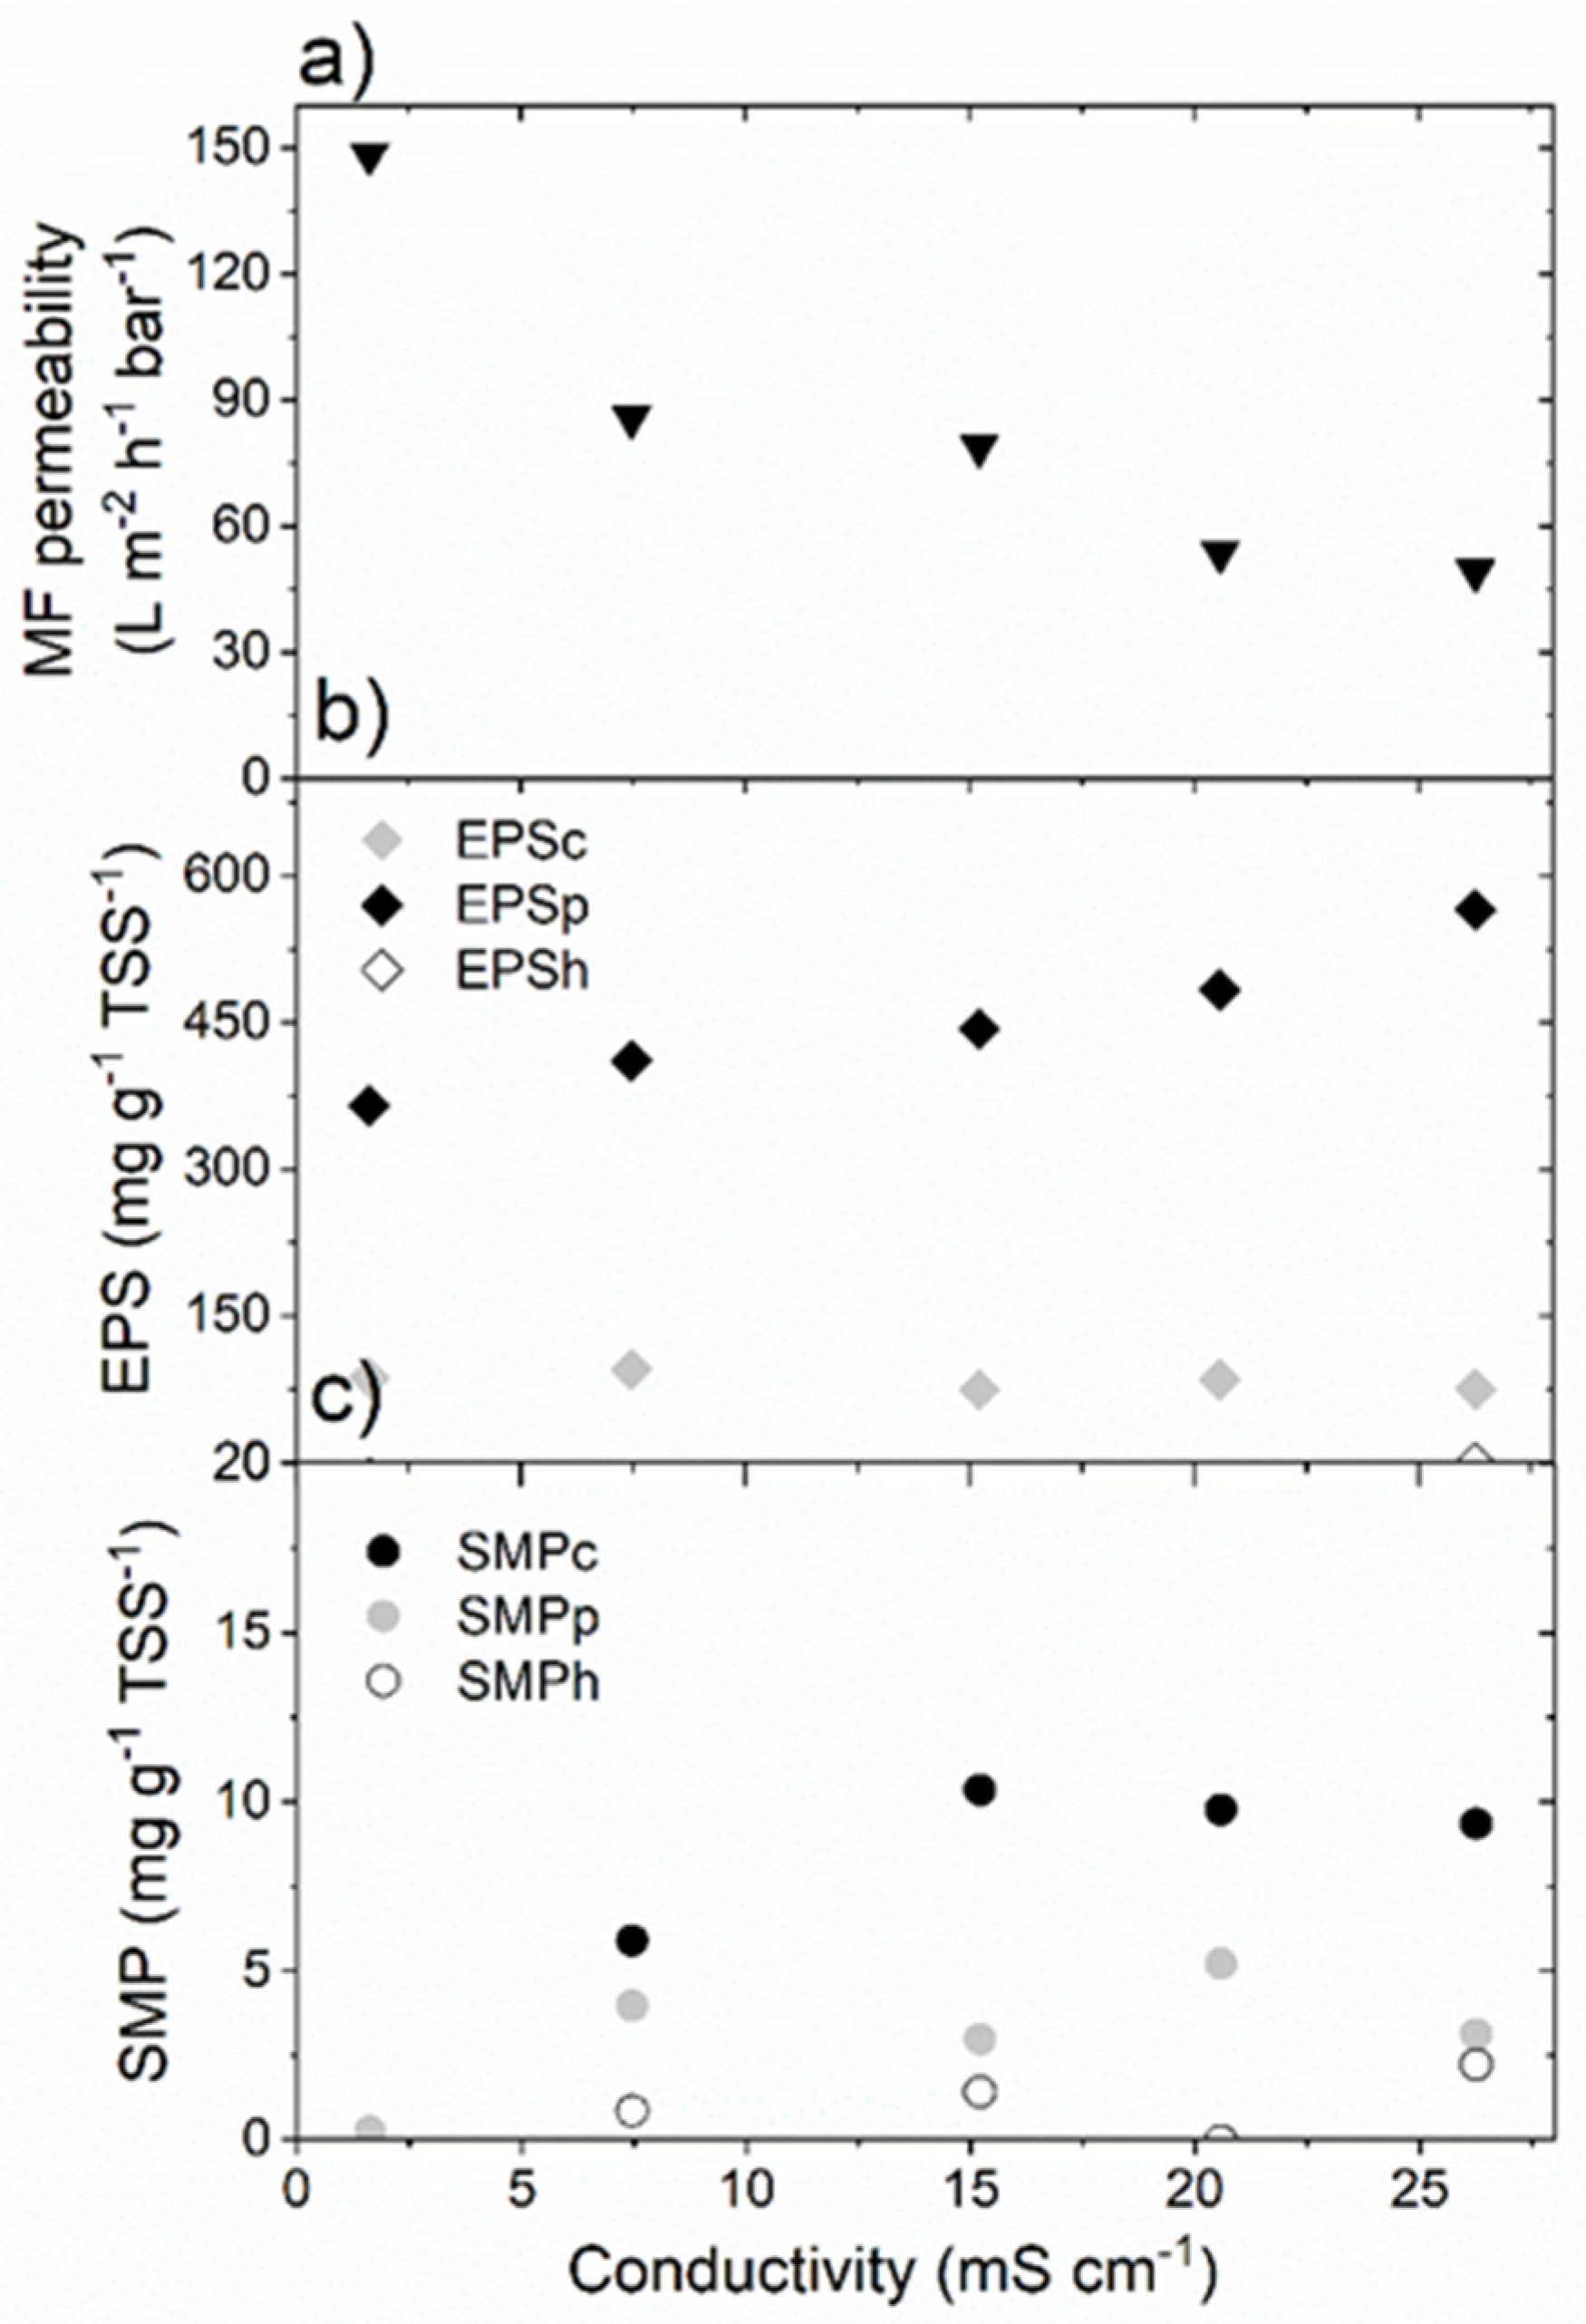
3.3. Membrane Fouling Assessment

Since the integrated system was operated with the membrane active layer facing the feed side (AL-FS or FO-mode), no significant fouling was observed on the FO membrane surface. The hydraulic shear force contributed via continuous aeration from the bottom of the reactor sufficiently removed the loosely built up fouling layer. However, a frequent loss in the MF permeability was observed over the experimental period. The fouling assessment of the MF membrane was not viable straight from the MF-OMBR system due to the periodic cleaning protocols involved during the operation. Therefore, batch TMP-step experiments were carried out to assess the influence of the different sludge salinity conditions on MF permeability (i.e., membrane fouling propensity by sludge). The permeability of each set of the experiments was estimated from the range of TMPs in which average MF-flux and TMP were linearly correlated with an R2 value of more than 0.95. The MF permeability from TMP-step experiments and relevant fouling precursors are plotted against the sludge conductivity (Figure 3).
Figure 3a shows the MF permeability obtained by the TMP-step experiments plotted against the sludge conductivity developed inside the MF-OMBR system. The observation indicated that the MF permeability declined gradually with the increasing salinity inside the system from day 1 to 20. These results have established a clear negative correlation of MF permeability to the increasing salinity of the feed solution, indicating a severe fouling tendency of the MF membrane owing to sludge deflocculation under the elevated saline environment. Furthermore, the membrane fouling precursors, such as SMP and EPS concentrations that were developed inside the system due to the sludge conductivity increased during operation of the system are shown in Figure 3b,c. These compounds significantly change the sludge properties and membrane fouling tendencies [30]. From the results, relatively high concentrations of bound EPS were observed compared to soluble SMP. The comparable trend has been reported by other researchers, where EPS was the dominant precursor on the MF-OMBR fouling [17]. Protein fractions of EPS increased from about 365 mg g−1 TSS−1 at the conductivity of 1.63 mS cm−1 on day 1 to nearly 565 mg g−1 TSS−1 when conductivity of the sludge reached 26.3 mS cm−1 on day 20, establishing a moderately positive correlation between them. This may be due to elevated cell lysis of bacteria at high conductivity of sludge that produces high amount of EPS protein. Carbohydrate fractions of EPS did not show substantial correlation with the increasing conductivity of the sludge, which is in agreement with the results reported in the previous research [31]. The humic fractions were observed at very low concentrations both in the EPS and SMP fractions. The residual humic concentrations might come from the sludge samples from the full-scale wastewater treatment plant (WWTP) during inoculation. On the other hand, a relatively positive correlation was observed for all the fractions of SMP at increasing conductivities. Protein, carbohydrate and humic fractions of SMP were observed at 3.95 to 5.2 mg g−1 TSS−1, 5.9 to 10.3 mg g−1 TSS−1, and 0.85 to 2.2 mg g−1 TSS−1, respectively. The results indicated that the increased salinity conditions inside the bioreactor increased the concentrations of soluble EPS (SMP). This could be a result of either salinity promoting sludge deflocculation, releasing EPS from flocs to bulk, or EPS being released owing to increase in osmotic pressure during bacterial metabolism and enhancement of cell lysis [31]. Some SMP fractions are degraded during treatment, while the FO membrane can reject other fractions that are difficult to degrade, which further concentrates the SMP [17]. In addition, sludge can produce high molecular weight compounds in a high salinity environment, which slowly degrade and contribute to increasing SMP fractions [31]. Therefore, the high salinity could inevitably lead to the elevation in bound EPS and SMP. Nonetheless, the effect of conductivity on the EPS was not as clear as compared to the SMP fractions.
A previous study reported an upper limit for sludge conductivity of 20 mS cm−1, above which severe sludge deflocculation and inhibition of nitrification was observed [13]. This corresponds well with the release of EPS at high salinities observed in the present study, along with the high ammonium concentrations at day 11–15 where conductivity exceeds 20 mS cm−1.

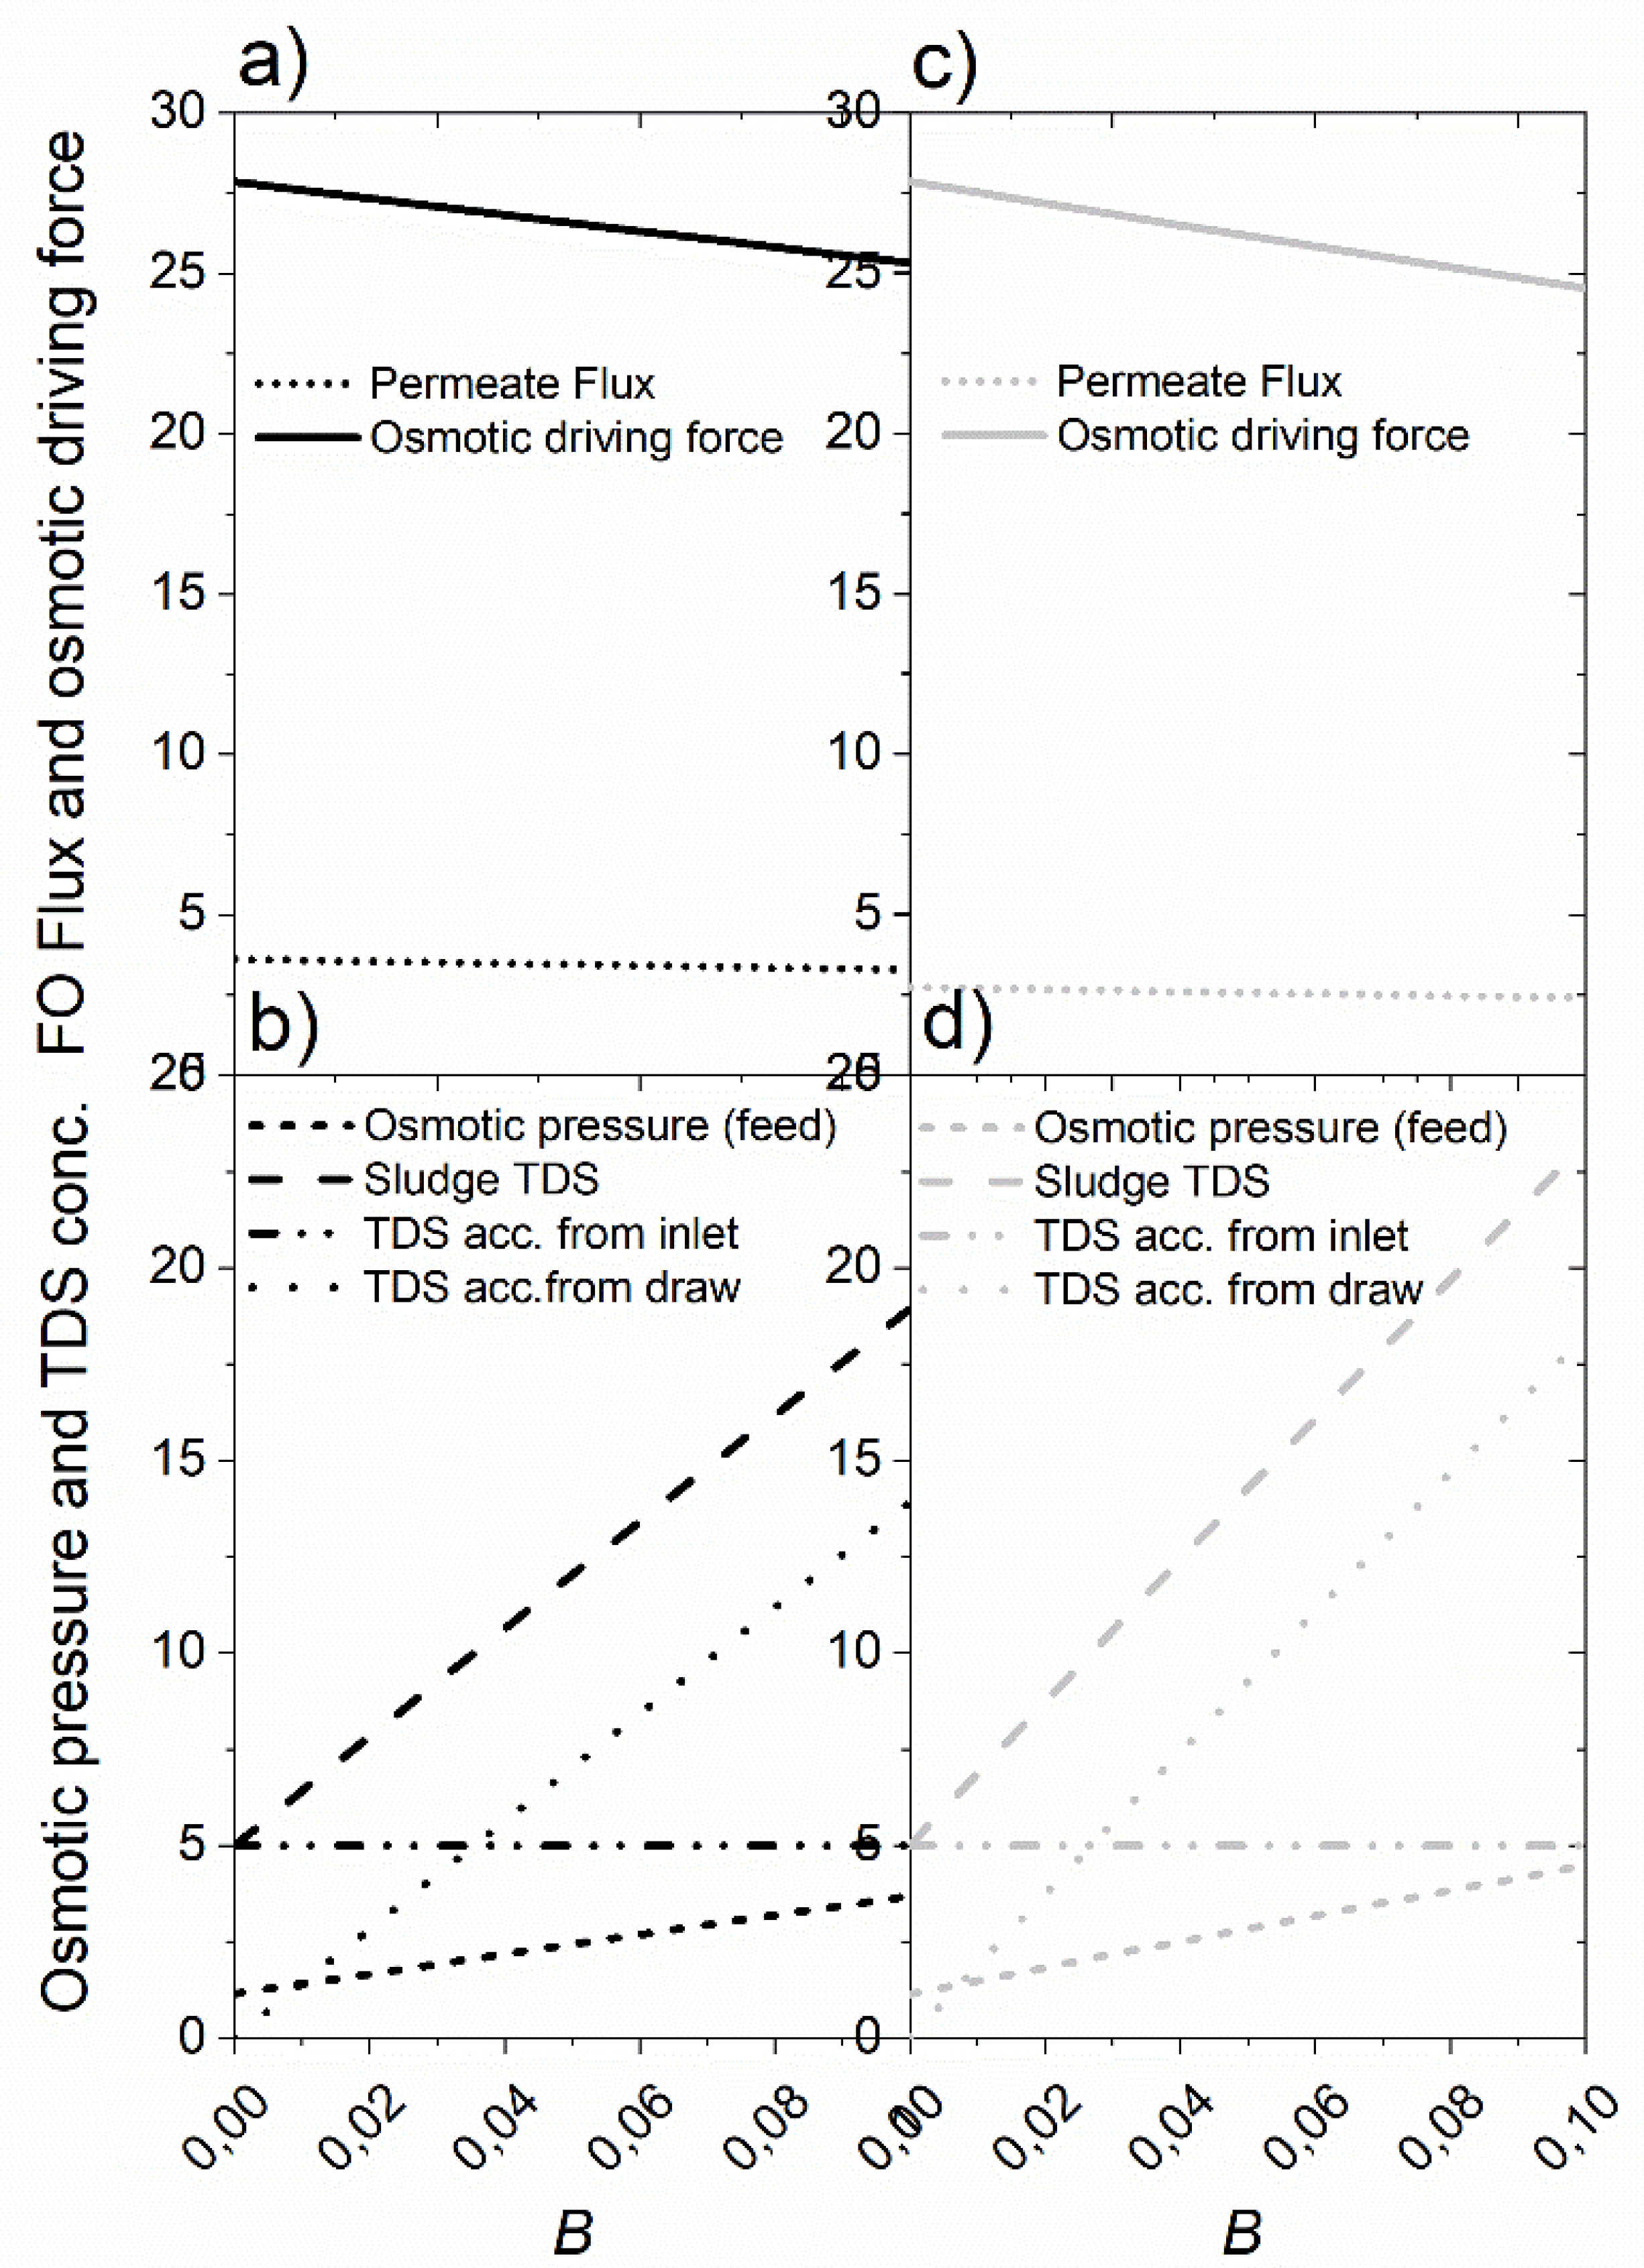
3.4. TDS Accumulation from High FO Rejection of Inlet TDS and Reverse Salt Flux from DS

To further investigate the reverse salt flux effects on deteriorating the FO flux, simulation on TDS development into the MF-OMBR system was assessed at varying salt diffusivities and TDS concentration factors as shown in Figure 4 and Figure 5, respectively.
The development in steady state TDS concentration was first assessed at varying salt permeability constant, B (membrane diffusivity) values ranging from 0 to 0.1 L m−2 h−1 using two membranes; one corresponding to the FO membrane used in the MF-OMBR described in this study with a low effective permeability (Am = 0.099 L m−2 h−1 bar−1, determined from batch tests), and another commercially available cellulose triacetate (CTA) membrane with higher water permeability. This membrane was obtained from Fluid Technology Solutions Inc. (OR) and batch FO experiments with 35 g L−1 NaCl draw and DI water feed with active layer facing feed showed an effective water permeability Am = 0.130 L m−2 h−1 bar−1 and salt permeability constant of B = 0.024 L m−2 h−1. The MF-OMBR system was simulated at HRT = 20 h, SRT = V/Qx = 33 d and with a TDS concentration factor, i.e., NRT/HRT = Qin/(QMF+QX) = 5. The reverse flow of salt through FO membranes was estimated from the TDS concentration gradient between draw and feed using Equation (5) and setting an initial concentration of NaCl (CNaCl, DS) of 35 g L−1. For the calculation of reverse salt flux, the surface area of FO membrane was determined from the area required to reach the required FO flow to reach a concentration factor of 5 at the given HRT.
The steady state of TDS concentrations and osmotic pressure in sludge were calculated using Equation (8) and the mechanism of conductivity building up inside the reactor was evaluated by considering the accumulation of TDS from influent (TDS0٠Qin/(QMF + Qx)) or/and via reverse salt transport from the draw side (B٠(CNaCl,DSCNaCl,FSA/(QMF + QX)). The results for CTA and TFC membranes are plotted in Figure 4a–d, respectively.
Both membranes show similar tendencies of permeate flux productivity and the osmotic driving force dissipation with respect to the varying B values (Figure 4a,c). The FO permeate flux was found to be almost constant at about 2.5 L m−2 h−1, whereas the osmotic driving force was linearly declining from about 27 to 24 bar when B was changed from 0 to 0.1 L m−2 h−1, which is a consequence of reduced osmotic gradient due to TDS accumulation in the sludge. The insignificant decline in simulated flux is consistent with the constant flux measured during operation of the MF-OMBR system (Figure A3).
It was revealed that higher accumulation of TDS resulted in lower FO fluxes due to the lower osmotic gradients established. At lower salt diffusivities (low B values), the accumulation of salt was mainly due to the inlet TDS concentration than from the reverse salt transport from DS, whereas at higher B values more accumulation of TDS was from reverse salt flux from the draw solution, i.e., TDS0٠Qin/(QMF + Qx) < B٠(CNaCl,DSCNaCl,FSA/(QMF + QX). According to Equation (8), the critical salt permeability, Bcrit, where more TDS accumulate from draw than from feed can be determined as follows (Equation (12)):
Bcrit = TDS0٠Qin/(A٠(CNaCl,DSCNaCl,FS))
Hence, for a high FO membrane area and high concentration gradient from draw to feed, the critical B value is low, whereas for high inlet flow and TDS concentration, the critical value of salt permeability is higher, meaning that reverse salt flux is less problematic. This is in line with Figure 4b,d, showing that higher water permeability results in less TDS buildup at steady state and it is possible to reach NRT/HRT of 5 with less membrane area and therefore lower reverse salt flux. Also, it is quite evident that the TDS accumulated from draw solution exceeded the TDS accumulated from inlet at B values of more than 0.026 L m−2 h−1 with water permeability of 0.099 L m−2 h−1 bar−1 for TFC membrane (Figure 4d) and B values of more than 0.036 L m−2 h−1 with permeability of 0.130 L m−2 h−1 bar−1 for CTA membranes (Figure 4b). Hence, the mathematical simulations show that the membranes with sufficiently low B values of salt diffusivity are crucial for the development of MF-OMBR system to ensure enhanced enrichment of nutrients from influent wastewater streams with sustainable treated clean water reclamation, while maintaining a sustainable flux and avoiding deflocculation due to buildup of salinity.
To further explore the effect of reverse salt flux on the system operation, simulations were performed to estimate TDS accumulation at varying concentration factors of NRT/HRT at given HRT of 20 h and SRT of 33 d, as shown in Figure 5. The resulting RSF and TDS concentrations at steady state were estimated by solving the mass balance equations (Equations (5)–(8). The flow fractions of FO and MF were simulated at NRT/HRT ratio of 0 to 20 (Figure 5a) with the water permeability (Am) of 0.099 L m−2 h−1 bar−1 and salt permeability constant (B) of 0.079 L m−2 h−1 at a DS (NaCl) concentration of 35 g L−1. The salt permeability constant was determined in batch FO tests with 35 g L−1 draw and DI water feed, with the active layer facing the feed solution. The simulations revealed that at higher concentration factors, higher FO flow via the system is required in equilibrium state. However, higher concentration factors result in higher accumulation of TDS, both from inlet and draw solution, as there is greater membrane area to facilitate reverse salt flux. For the TFC membrane, the accumulation of TDS from draw exceeds the accumulation from inlet (Figure 5b) at any of the NRT/HRT values. Hence, it is obvious that the TFC membrane is not so feasible since it facilitates relatively high TDS accumulation from DS owing to higher reverse salt flux with less concentration of TDS accumulation from inlet. While the main objective was to develop the MF-OMBR system with high tendency of incoming nutrient enrichment, this membrane system would mainly contribute to the consequences, such as higher osmotic sludge pressure, biomass inactivation and sludge deflocculation owing to accumulation of salts from the draw solution.
Similarly, the CTA membrane in the FO system was simulated at concentration factor ranging from 0 to 20 (Figure 5c) with Am = 0.13 L m−2 h−1 bar−1 and B = 0.024 L m−2 h−1, respectively. The results revealed that for the CTA membrane, the accumulation of inlet TDS exceeds the accumulation of TDS from reverse salt transport, however the percentage shares were 53% from inlet and remaining 47% from the draw, respectively.
Therefore, in comparison, the CTA membrane showed better implications in the integrated MF-OMBR system, enabling higher TDS concentrations accumulation from inlet than in the TFC membrane. Moreover, more severe flux decline owing to membrane fouling is reported in the TFC membrane as compared to the CTA membrane, although biofouling is a challenge in CTA membranes [32]. Hence, it is evident that the FO membrane’s water permeability and salt permeability are crucial for sustainable operation of the hybrid MF-OMBRs to enrich incoming nutrients. Figure 5d shows a similar simulation as Figure 5b,c, using Am = 0.13 L m−2 h−1 bar−1 and B = 0.005 L m−2 h−1. In this case, the reverse salt flux was observed at low level contributing only 16% of accumulated TDS in sludge, whereas 84% accountability is from inlet TDS (Figure 5d). This ideal case might possibly be a best condition that practically limits sludge osmotic pressure buildup, microbial inactivation, deflocculation and fouling propensity to ensure sustainable operation of the MF-OMBR system.

4. Conclusions

A hybrid microfiltration osmotic membrane bioreactor system was used to treat and simultaneously concentrate nutrients from synthetic wastewater. The MF flux declined to a steady level of 14.5 ± 2.4 L m−2 h−1 over the experimental period, while relatively low and stable FO flux was observed regardless of increasing DS conductivities from 10 to 50 mS cm−1. This was explained by an increase in sludge conductivity and TDS concentration in the sludge, leading to elevated osmotic pressures. Batch TMP-step experiments showed lower filtration properties of sludge samples with increasing salinity buildup inside the MF-OMBR system because of increasing protein, carbohydrate fractions of EPS and SMPs.
The role of reverse salt flux for salinity buildup and subsequent decline in osmotic driving force was demonstrated by mathematical simulations at varying values of salt permeability of the FO membranes. At high salt permeabilities and low water permeabilities, the TDS accumulation in sludge due to increasing reverse salt flux exceeded the accumulation ascribed to inlet salinity enrichment. TDS accumulated from draw exceeded the TDS accumulated from inlet at B values of more than 0.026 L m−2 h−1 for TFC membrane (Am = 0.099 L m−2 h−1 bar−1) and of more than 0.036 L m−2 h−1 for CTA membranes (Am = 0.13 L m−2 h−1 bar−1). Also, increasing the ratio of concentration factor results in increasing tendencies of salt accumulation inside the system from both inlet and draw for TFC membrane, whereas accumulation of TDS from inlet exceeds reverse salt transport for the CTA membrane. It was demonstrated that if the B value of the CTA FO membrane could be reduced to 0.005 L m−2 h−1, while maintaining Am of 0.13 L m−2 h−1 bar−1, only 16% of TDS accumulated in the sludge would originate from the draw solutions, whereas 84% TDS would be accumulated from influent. Therefore, to enrich incoming nutrients while ensuring low salinity buildup to avoid deflocculation, fouling and microbial inactivation, it is crucial to use FO membranes with highly efficient water permeability (>0.13 L m−2 h−1 bar−1) and low salt permeability (<0.01 L m−2 h−1) to develop a sustainable hybrid MF-OMBR system.

Author Contributions

Formal analysis, K.G.; Investigation, K.G.; Methodology, M.K.J.; Supervision, M.S. and M.C.N.; Writing—original draft, K.G. and M.K.J.; Writing—review & editing, M.L.C., M.S. and M.C.N. All authors have read and agreed to the published version of the manuscript.

Funding

This research was funded by Business Finland (former Tekes) and LUT research foundation (Lappeenrannan Teknillisen Yliopiston Tukisäätiö) for international research visit to the Department of Chemistry and Bioscience, Aalborg University, Denmark.

Acknowledgments

Authors would like to thank laboratory technicians Lisbeth Wybrandt and Henriette Casper Jensen for helping us with the samples analysis at Aalborg University. We also would like to thank Anders Richardt Lynge Havgaard for helping on reverse salt flux tests. Also, we are thankful to Aalborg West WWTP management committee for providing us activated sludge for our system inoculation.

Conflicts of Interest

The authors declare no conflict of interest.

Appendix A

Figure A1. Clean water FO membrane permeability tests: (a) FO mode, and (b) PRO-mode.
Water 12 01098 g0a1
Figure A2. Plot of osmotic pressure vs. TDS of feed in the MF-OMBR system.
Water 12 01098 g0a2
Figure A3. Plot of Measured and theoretical FO flux against effective osmotic pressure.
Water 12 01098 g0a3
Table A1. Synthetic substrate composition.
CompoundConcentration (mg L−1)
Glucose (C6H12O6)1000
Peptone1000
Potassium dihydrogen phosphate (KH2PO4)175
Magnesium sulfate (MgSO4)175
Ferrous sulfate hepthahydrate (FeSO4٠7H2O)100
Sodium acetate (CH3COONa)2250
Urea (CH4N2O)350

References

  1. Cordell, D.; White, S. Peak phosphorus: Clarifying the key issues of a vigorous debate about long-term phosphorus security. Sustainability 2011, 3, 2027–2049. [Google Scholar] [CrossRef] [Green Version]
  2. Gurung, K.; Ncibi, M.C.; Fontmorin, J.M. Incorporating Submerged MBR in Conventional Activated Sludge Process for Municipal Wastewater Treatment: A Feasibility and Performance Assessment. J. Membr. Sci. Technol. 2016, 6. [Google Scholar] [CrossRef] [Green Version]
  3. Gurung, K.; Ncibi, M.C.; Sillanpää, M. Assessing membrane fouling and the performance of pilot-scale membrane bioreactor (MBR) to treat real municipal wastewater during winter season in Nordic regions. Sci. Total Environ. 2017, 579, 1289–1297. [Google Scholar] [CrossRef] [PubMed]
  4. Judd, S. The status of membrane bioreactor technology. Trends Biotechnol. 2008, 26, 109–116. [Google Scholar] [CrossRef] [PubMed]
  5. Alturki, A.; McDonald, J.; Khan, S.J.; Hai, F.I.; Price, W.E.; Nghiem, L.D. Performance of a novel osmotic membrane bioreactor (OMBR) system: Flux stability and removal of trace organics. Bioresour. Technol. 2012, 113, 201–206. [Google Scholar] [CrossRef] [PubMed] [Green Version]
  6. Blandin, G.; Gautier, C.; Toran, M.S.; Monclús, H.; Rodríguez-Roda, I.; Comas, J. Retrofitting membrane bioreactor (MBR) into osmotic membrane bioreactor (OMBR): A pilot scale study. Chem. Eng. J 2018, 339, 268–277. [Google Scholar] [CrossRef]
  7. Qiu, G.; Ting, Y.P. Direct phosphorus recovery from municipal wastewater via osmotic membrane bioreactor (OMBR) for wastewater treatment. Bioresour. Technol. 2014, 170, 221–229. [Google Scholar] [CrossRef]
  8. Lay, W.C.L.; Zhang, Q.; Zhang, J.; McDougald, D.; Tang, C.; Wang, R.; Liu, Y.; Fane, A.G. Effect of Pharmaceuticals on the Performance of a Novel Osmotic Membrane Bioreactor (OMBR). Sep. Sci. Technol. 2012, 47, 543–554. [Google Scholar] [CrossRef]
  9. Pathak, N.; Li, S.; Kim, Y.; Chekli, L.; Phuntsho, S.; Jang, A.; Ghaffour, N.; Leiknes, T.O.; Shon, H.K. Assessing the removal of organic micropollutants by a novel baffled osmotic membrane bioreactor-microfiltration hybrid system. Bioresour. Technol. 2018, 262, 98–106. [Google Scholar] [CrossRef]
  10. Holloway, R.W.; Wait, A.S.; da Silva, A.F.; Herron, J.; Schutter, M.D.; Lampi, K.; Cath, T.Y. Long-term pilot scale investigation of novel hybrid ultrafiltration-osmotic membrane bioreactors. Desalination 2015, 363, 64–74. [Google Scholar] [CrossRef]
  11. Neoh, C.H.; Noor, Z.Z.; Mutamim, N.S.A.; Lim, C.K. Green technology in wastewater treatment technologies: Integration of membrane bioreactor with various wastewater treatment systems. Chem. Eng. J. 2016, 283, 582–594. [Google Scholar] [CrossRef] [Green Version]
  12. Holloway, R.W.; Regnery, J.; Nghiem, L.D.; Cath, T.Y. Removal of trace organic chemicals and performance of a novel hybrid ultrafiltration-osmotic membrane bioreactor. Environ. Sci. Technol. 2014, 48, 10859–10868. [Google Scholar] [CrossRef] [PubMed] [Green Version]
  13. Jørgensen, M.K.; Sørensen, J.H.; Quist-Jensen, C.A.; Christensen, M.L. Wastewater treatment and concentration of phosphorus with the hybrid osmotic microfiltration bioreactor. J. Memb. Sci. 2018, 559, 107–116. [Google Scholar] [CrossRef]
  14. Luo, W.; Hai, F.I.; Kang, J.; Price, W.E.; Nghiem, L.D.; Elimelech, M. The role of forward osmosis and microfiltration in an integrated osmotic-microfiltration membrane bioreactor system. Chemosphere 2015, 136, 125–132. [Google Scholar] [CrossRef] [PubMed] [Green Version]
  15. Luo, W.; Hai, F.I.; Price, W.E.; Guo, W.; Ngo, H.H.; Yamamoto, K.; Nghiem, L.D. Phosphorus and water recovery by a novel osmotic membrane bioreactor-reverse osmosis system. Bioresour. Technol. 2016, 200, 297–304. [Google Scholar] [CrossRef] [PubMed]
  16. Cornelissen, E.R.; Harmsen, D.; de Korte, K.F.; Ruiken, C.J.; Qin, J.J.; Oo, H.; Wessels, L.P. Membrane fouling and process performance of forward osmosis membranes on activated sludge. J. Memb. Sci. 2008, 319, 158–168. [Google Scholar] [CrossRef]
  17. Wang, X.; Yuan, B.; Chen, Y.; Li, X.; Ren, Y. Integration of micro-filtration into osmotic membrane bioreactors to prevent salinity build-up. Bioresour. Technol. 2014, 167, 116–123. [Google Scholar] [CrossRef]
  18. Kedwell, K.C.; Quist-Jensen, C.A.; Giannakakis, G.; Christensen, M.L. Forward osmosis with high-performing TFC membranes for concentration of digester centrate prior to phosphorus recovery. Sep. Purif. Technol. 2018, 197, 449–456. [Google Scholar] [CrossRef]
  19. Ren, J.; McCutcheon, J.R. A new commercial thin film composite membrane for forward osmosis. Desalination 2014, 343, 187–193. [Google Scholar] [CrossRef]
  20. McCutcheon, J.R.; Elimelech, M. Influence of concentrative and dilutive internal concentration polarization on flux behavior in forward osmosis. J. Memb. Sci. 2006, 284, 237–247. [Google Scholar] [CrossRef]
  21. Alsvik, I.L.; Hägg, M.B. Pressure retarded osmosis and forward osmosis membranes: Materials and methods. Polymers (Basel). 2013, 5, 303–327. [Google Scholar] [CrossRef] [Green Version]
  22. Cath, T.Y.; Elimelech, M.; McCutcheon, J.R.; McGinnis, R.L.; Achilli, A.; Anastasio, D.; Brady, A.R.; Childress, A.E.; Farr, I.V.; Hancock, N.T.; et al. Standard Methodology for Evaluating Membrane Performance in Osmotically Driven Membrane Processes. Desalination 2013, 312, 31–38. [Google Scholar] [CrossRef] [Green Version]
  23. Bugge, T.V.; Jørgensen, M.K.; Christensen, M.L.; Keiding, K. Modeling cake buildup under TMP-step filtration in a membrane bioreactor: Cake compressibility is significant. Water Res. 2012, 46, 4330–4338. [Google Scholar] [CrossRef] [PubMed]
  24. APHA; AWWA; WEF. Standard Methods for the Examination of Water and Wastewater; American Public Health Association: Washington, DC, USA, 2005; Volume 21. [Google Scholar]
  25. Raunkjær, K.; Hvitved-Jacobsen, T.; Nielsen, P.H. Measurement of pools of protein, carbohydrate and lipid in domestic wastewater. Water Res. 1994, 28, 251–262. [Google Scholar] [CrossRef]
  26. Baker, R. Membrane Technology and Applications, 2nd ed.; John Wiley & Sons, Ltd.: Hoboken, NJ, USA, 2004; ISBN 9780470854457. [Google Scholar]
  27. Pathak, N.; Chekli, L.; Wang, J.; Kim, Y.; Phuntsho, S.; Li, S.; Ghaffour, N.; Leiknes, T.O.; Shon, H. Performance of a novel baffled osmotic membrane bioreactor-microfiltration hybrid system under continuous operation for simultaneous nutrient removal and mitigation of brine discharge. Bioresour. Technol. 2017, 240, 50–58. [Google Scholar] [CrossRef] [Green Version]
  28. Kedwell, K.C.; Christensen, M.L.; Quist-Jensen, C.A.; Jørgensen, M.K. Effect of reverse sodium flux and pH on ammoniacal nitrogen transport through biomimetic membranes. Sep. Purif. Technol. 2019, 217, 40–47. [Google Scholar] [CrossRef]
  29. Liu, L.F.; Huang, X.; Zhang, X.; Li, K.; Ji, Y.L.; Yu, C.Y.; Gao, C.J. Modification of polyamide TFC nanofiltration membrane for improving separation and antifouling properties. RSC Adv. 2018, 8, 15102–15110. [Google Scholar] [CrossRef] [Green Version]
  30. Le-Clech, P.; Chen, V.; Fane, T.A.G. Fouling in membrane bioreactors used in wastewater treatment. J. Memb. Sci. 2006, 284, 17–53. [Google Scholar] [CrossRef]
  31. Chen, L.; Gu, Y.; Cao, C.; Zhang, J.; Ng, J.-W.; Tang, C. Performance of a submerged anaerobic membrane bioreactor with forward osmosis membrane for low-strength wastewater treatment. Water Res. 2014, 50, 114–123. [Google Scholar] [CrossRef]
  32. Wang, X.; Zhao, Y.; Yuan, B.; Wang, Z.; Li, X.; Ren, Y. Comparison of biofouling mechanisms between cellulose triacetate (CTA) and thin-film composite (TFC) polyamide forward osmosis membranes in osmotic membrane bioreactors. Bioresour. Technol. 2016, 202, 50–58. [Google Scholar] [CrossRef]
Figure 1. Process parameters of the hybrid microfiltration osmotic membrane bioreactor (MF-OMBR) operation: (a) daily averaged microfiltration (MF) and forward osmosis (FO) flow; (b) conductivities of the draw solution (DS) (FO permeate), sludge and MF permeate with respect to five different phases; (c) total, suspended and dissolved solids in sludge; and (d) overall hydraulic retention time (HRT) and pH of sludge.
Water 12 01098 g001
Figure 2. Nutrient concentrations of (a) dissolved nitrogen (NH4-N), and (b) dissolved phosphorus (PO4-P), by MF-OMBR over the experimental period.
Water 12 01098 g002
Figure 3. (a) MF permeability, (b) bound extracellular polymeric substance (EPS) fractions, and (c) soluble microbial product (SMP) fractions plotted against sludge conductivity developed inside the MF-OMBR system.
Water 12 01098 g003
Figure 4. Simulation of flux, osmotic pressure and TDS at varying salt diffusivities (B) under steady state condition (a,b) for CTA membrane (water permeability Am = 0.130 L m−2 h−1 bar−1), and (c,d) thin-film composite (TFC) membrane (Am= 0.099 L m−2 h−1 bar−1).
Water 12 01098 g004
Figure 5. Simulations of TDS at varying concentration factors at solid retention time (SRT) = 33 d: (a) flow fraction for both TFC/CTA membranes; (b) for TFC membrane; (c) for CTA membrane; and (d) for an ideal membrane.
Water 12 01098 g005

