1. Introduction
Water is a scarce and precious resource that is being put under pressure due to the fast-growing population that is extracting too much water and polluting our rivers, lakes, and groundwater with municipal, agricultural, and industrial wastes. Climate change, loss of biodiversity, unsustainable use of natural resources, and environmental pressures have a negative impact on water quality and quantity which are inextricably linked, with over extraction causing low river flows, low ground water levels, and drying up of wetlands. The deteriorating water environment, accelerating the shortage of water and affecting human health, has become an important problem that restricts the development of cities.
One of the most important environmental problems today is, undoubtedly, the contamination of water by nitrates, especially in areas with significant agricultural activity, as occurs in the southeast of Spain [
1,
2]. The nitrates are natural components of soil and water, both surface and underground, which come, in part, from the decomposition of nitrogenous organic matter, although their presence in the soil and in aquifers increases with the use of nitrogenous fertilizers and manure in areas with a high level of agricultural activity. Farmers invest large amounts of nitrogenous fertilizers in the fields to maintain adequate production and increase yields. Most of these are not absorbed by plants, so they settle in the soil and gradually filter through it, reaching groundwater. Similarly, these compounds can circulate through surface runoff and cause contamination problems in surface, fresh, or marine waters [
3].
An excessive contribution of nutrients in surface waters, especially nitrogen and phosphorus, gives rise to a rapid proliferation of aquatic vegetation, as a consequence of oxygen depletion on the surface, which favors the appearance of eutrophication processes [
4]. The Mar Menor (Region of Murcia, southeast of Spain) has been in the news in recent years due to the eutrophication, which refers to the processes of the ecosystem originated by the enrichment of nutrients of the water, especially nitrogen and/or phosphorus [
5,
6]. This situation, added to by the fact that most of the effluents from the wastewater treatment plants (WWTP) in this area are used for irrigation in agriculture, implies an increase in responsibility of the water industry to adopt a more sustainable management of urban water systems for this type of compound [
7]. One of the most effective approaches to address this challenge of sustainability is wastewater treatment, in which water quality monitoring (WQM) plays a key role.
WQM can be described as a method for periodically sampling and analyzing water conditions and characteristics [
8]. This method forms the basis for water environmental management, as it is vital to monitor source waters and the aquatic systems that receive inputs from industrial waste and sewage treatment plants, stormwater systems, and runoff from urban and agricultural lands [
9]. Similarly, domestic sewage and water flows resulting from chemical processes and waste in industry and sanitation should be monitored in wastewater treatment plants that purify the water to decontaminate it before releasing it into the sea (or other large bodies of water), or be used for other applications such as irrigation, and to detect possible toxic or radioactive discharges [
10]. Wastewater, also known as sewage, contains more than 99% water and is characterized by volume or rate of flow, physical condition, chemical constituents, and the bacteriological organisms that it contains. The quality of treated wastewater is defined by physical-chemical parameters such as pH, temperature, conductivity, turbidity, Biological Oxygen Demand (BOD), Chemical Oxygen Demand (COD), Total Organic Carbon (TOC), Total Suspended Solids (TSS), and nitrogen and phosphorus compounds [
11,
12]. From an environmental perspective, the concentrations of phosphate, nitrate and nitrite in water are crucial due to their role in eutrophication. They are important analytes for environmental, food and human health monitoring and thus their detection and quantification is essential [
13]. The sensor implemented in this paper within the developed integrated system for water quality monitoring is a low-cost device that consists of a nitrate and nitrite analyzer based on a novel ion chromatography detection method [
14].
Wastewater treatment is an important component in the water cycle, as it ensures that the environmental impact of human usage of water is significantly reduced. Wastewater treatment plants (WWTPs) use a series of treatment stages to clean up the contaminated water so that the treated effluent is safely discharged to inland water, estuaries and the sea. Wastewater treatment consists of several processes (physical, biological, and chemical) that aim to reduce nitrogen, phosphorous, organic matter, and suspended solids content [
15]. The purpose of WQM is to support the control of these processes by accurately monitoring water parameters (e.g., nitrate, nitrite, phosphate, and pH) mainly in the influent and effluent of each WWTP. Specifically, WQM performs (i) the detection and quantification of these parameters in the influent wastewater that could affect the treatment processes, providing the plant operator with valuable information to foresee such effects, and (ii) the analytical control of the effluent to verify that the treated waters comply with the standards required by the current regulations [
16], ensuring the environmental sustainability of water. In the European context, environmental legislation requires improvements in water quality and effluent discharged to waterways due to the Water Framework Directive [
17] and related Directives, e.g., the Urban Wastewater Treatment Directive [
18] and the Nitrates Directive [
19]. The need for compliance with these Directives has created a demand among Government Monitoring Agencies and legislative bodies throughout Europe for frequent monitoring, both temporally and spatially. Traditional WQM methods involve the manual collection of water samples at different locations, followed by laboratory analytical techniques in order to characterize the water quality. Such methods take a long time and are no longer considered efficient. Although these methodologies analyze physical, chemical, and biological agents, they have several drawbacks: (i) poor spatiotemporal coverage [
20], (ii) they are labor intensive and high cost (labor, operation, and equipment), and (iii) the lack of near-real-time water quality information to enable critical decisions for public health and environment protection [
21]. Therefore, there is a need for WQM systems that enable reliable performance of WWTPs through effective data management and the online near real-time monitoring capability. The WQM system presented in this work is tested in a wastewater treatment real scenario and reported results are compared with analytical techniques values.
In the recent years, the vision of the Internet of Things (IoT) [
22] augmented with advances in software technologies, such as service-oriented architecture (SOA), software as a service (SaaS), cloud computing, and others, has stimulated the development of smart water quality monitoring systems (SWQMSs) [
23,
24]. These systems combine technologies and components from microsystems (miniaturized electric, mechanical, optical, and fluid devices) with knowledge, technology, and functionality from disciplines like biology, chemistry, nanosciences, and cognitive sciences. Fortunately, the use of IoT software platforms helps to overcome the challenges associated with the broad set of technologies, systems, and design principles of the IoT [
25,
26]. SWQMSs are a new generation of systems architecture (hardware, software, network technologies, and managed services) that provides near-real-time awareness based on inputs from machines, people, video streams, maps, news feeds, sensors, and more that integrate people, processes, and knowledge to enable collective awareness and decision making where devices can offer more advanced access to their functionality [
27]. As such, event-based information can be acquired, and then processed on-device and in-network. This capability provides new ground for approaches that can be more dynamic and highly sophisticated and that can take advantage of the available context (readings of water quality parameters). For this reason, SWQMSs allow to optimize the performance of the WWTP in particular and the treatment system in general achieving a smart wastewater management. Wired SWQMSs are still the main approach to monitor the parameters in existing wastewater treatment plants. However, this type of system has the drawbacks of high cost, poor expansion capability and difficult maintenance due to inefficient operating environment [
28]. In order to overcome these previously mentioned drawbacks, a cost-effective decentralized SWQMS is designed in this work, using a low-cost water quality monitoring device that is integrated in an IoT software platform and in a Wireless Sensor Network (WSN) [
29].
Wireless Sensor Networks have proven to be a very effective technology for numerous environmental monitoring applications. WSNs currently enable the automatic monitoring of air pollution [
30], noise pollution [
31,
32,
33], forest fires [
34], climatological conditions [
35], and much more over wide areas, something previously impossible. The use of WSNs for WQM is particularly appealing due to the low cost of the sensor nodes and hence the cost-effectiveness of this solution. These simple and low-cost networks allow monitoring of processes remotely, in near-real-time and with minimal human intervention. Considerable research has been conducted to monitor water quality through the development of WSNs. Adu-Manu and Pule [
36,
37] study and analyze recent developments in the sensor devices, data acquisition procedures, communication and network architectures, and power management schemes of WSNs to maintain a long-lived operational SWQMSs. Adamo [
38] presents a SWQMS that supports to strategic decisions concerning critical environment issues of the marine ecosystem by implementing an smart buoy prototype designed for in situ and in continuous space-time monitoring of water temperature, salinity/conductivity, turbidity, and chlorophyll-a concentration as biological indicators of water eutrophication. Jiang [
39] developed a WSN based on ZigBee technology for online auto-monitoring of the water temperature and pH value of an artificial lake.
In the field of wastewater treatment, WSNs represent a promising technology because of their rapid deployment and their ability to acquire, process and transmit data at a number of distributed sampling points. The application of WSNs to WQM has opened up a new avenue of research towards the development of decentralized SWQMSs that evolve with the changing wastewater infrastructure to meet the water requirements of smart cities [
40,
41,
42]. These decentralized SWQMSs (i) offer great potential for cost reduction, (ii) allow for precise matching of growing wastewater capacity requirements, (iii) take advantage of the relative homogeneity of wastewater streams at their point of origin, (iv) do not need large sewer systems nor require extensive networks for the distribution of treated water, and (v) present probability of failure significantly lower than that of failure of centralized system. The advent of WSNs allows the replacement of traditional WQM methods or the expansion of existing wired SWQMS. Tadokoro and Wang [
43,
44] describe the design of SWQMSs using wired and wireless technologies for online near-real-time supervisory, control, and data acquisition (SCADA) of wastewater treatment processes. The designs conceived support many functions directed at multiple wastewater treatment plants, such as decentralized control, centralized management, remote diagnosis and fault early warning. Regarding WSNs sensor nodes, there is research work focused on the design of devices to monitor diverse parameters. In this sense, the work presented by Geetha [
24] is based on the single-chip TI CC3200 microcontroller to monitor pH, conductivity, water level and turbidity and upload them to the Ubidots cloud. Reference [
45] is based on Arduino to monitor pH, conductivity and dissolved oxygen and upload them to the ThingSpeak cloud, whereas the work presented by Saravanan [
46] is based on Arduino to monitor flow, temperature, color, and turbidity, and upload them to the SWQMS cloud server. However, the prototypes cited previously are far from the close-to-market stage.
This paper presents the integration to a WSN and a preliminary validation in a wastewater treatment plant scenario of a low-cost water quality monitoring device in the close-to-market stage. This device consists of a nitrate and nitrite analyzer based on a novel ion chromatography detection method. The analytical device is integrated using an Internet of Things software platform and tested under real conditions in a wastewater treatment plant scenario. By doing so, a decentralized SWQMS conceived and developed for wastewater quality monitoring and management is accomplished. This investigation is part of an ongoing research project, referred to as LIFE EcoSens Aquamonitrix [
47], which aims to validate and optimize this solution to achieve a low-cost, fully automated in situ analyzer for environmental water monitoring ready to be launched in the market after the project.
The paper is structured as follows. After this introduction,
Section 2 describes the analytical device, the IoT software platform, the developed SWQMS called the EcoSens Aquamonitrix System, and the methodology followed for the validation of the system implemented in a real wastewater treatment scenario. In
Section 3, the features of the EcoSens Aquamonitrix System are shown and the results obtained from the experiments to validate the analytical device are discussed. Finally,
Section 4 presents the general conclusions of this study and proposes future work.
2. Materials and Methods
The proposed integrated system encompasses the analytical device that was connected to an IoT software platform, henceforth IoT platform, via a wireless sensor network. The description of the device design is highlighted in
Section 2.1.
Section 2.2 presents the IoT platform and discusses the middleware that supports the system.
Section 2.3 describes the implementation of the IoT water quality monitoring system in a wastewater treatment plant scenario. Finally,
Section 2.4 details the methodology followed in this investigation for a preliminary validation of the system.
2.1. Device
The core of the analytical device is a portable ion chromatography (IC) system based on the method previously reported by Murray [
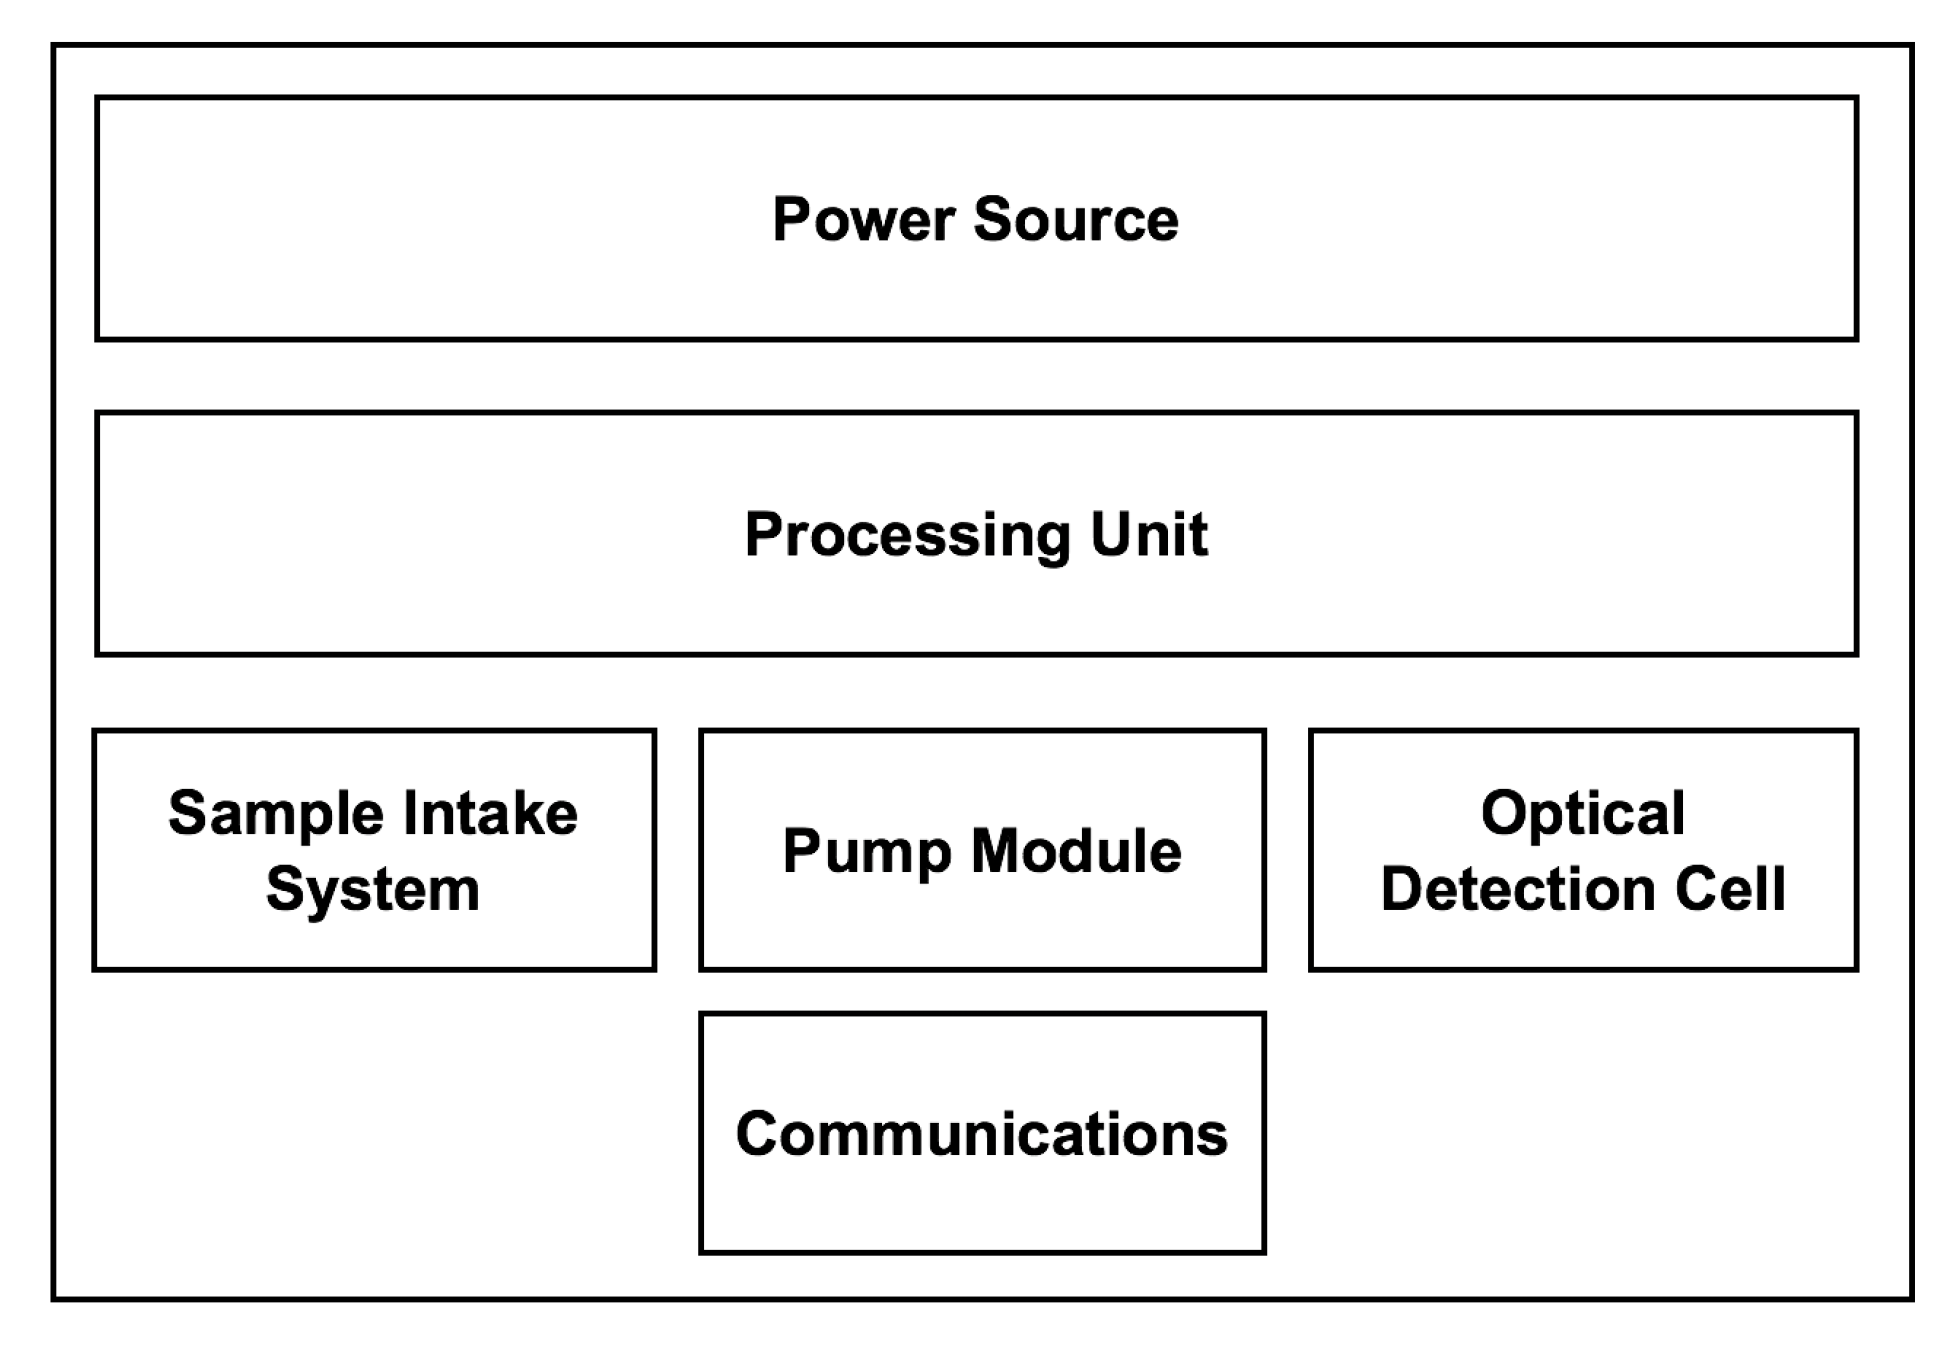
14]. This system employs a novel design of a ultraviolet (UV) light-emitting diode (LED)-based optical detector which enables cost-effective direct in situ detection of nitrite and nitrate in natural waters. The automated portable IC system is described in detail by Murray [
48]. The main functional blocks of the system are depicted in
Figure 1 and each component is subsequently described.
The sample intake system is comprised of a 12 V high flow pump and a reservoir. The pump draws sample from the water source filling the reservoir. The sample intake pump runs at the beginning of each analysis cycle for 30 s. The pump module is responsible for loading sample into the system and pumping the eluent through the ion exchange column and detector for analysis. The pump module consists of four 3D printed syringe pumps, three of which are used for eluent delivery, whereas the fourth syringe pump draws sample from the reservoir. Once full, the syringe pumps empty at a set flow rate enabling chromatographic analysis and analyte detection. The optical detection cell consists of a low-cost, UV absorbance detector which incorporates a 235 nm LED and photodiode [
14]. The photodiode is coupled with an ADS1115 analogue to digital converter (ADC). The signal from the photodiode (0–3.3 V) is sampled every 50 ms by the ADC which communicates with the systems microcontroller via I2C protocol. A HTU21D-F temperature and humidity sensor is used to measure the internal parameters of the analyzer. The sensor communicates over I2C and the readings are logged once at the beginning of every cycle.
The system is powered from a portable battery (Voltaic V88), which has a capacity of 24 Ampere-hour and supplies 12 Volts to the embedded system. The battery is charged from an alternating current source with a supplied adapter. The system can operate on battery alone for short periods of time, however, for long term deployments the unit runs from the battery while it is charging. This setup allows the system to function for up to 5 days on battery alone at an hourly sampling frequency, if the main power supply fails.
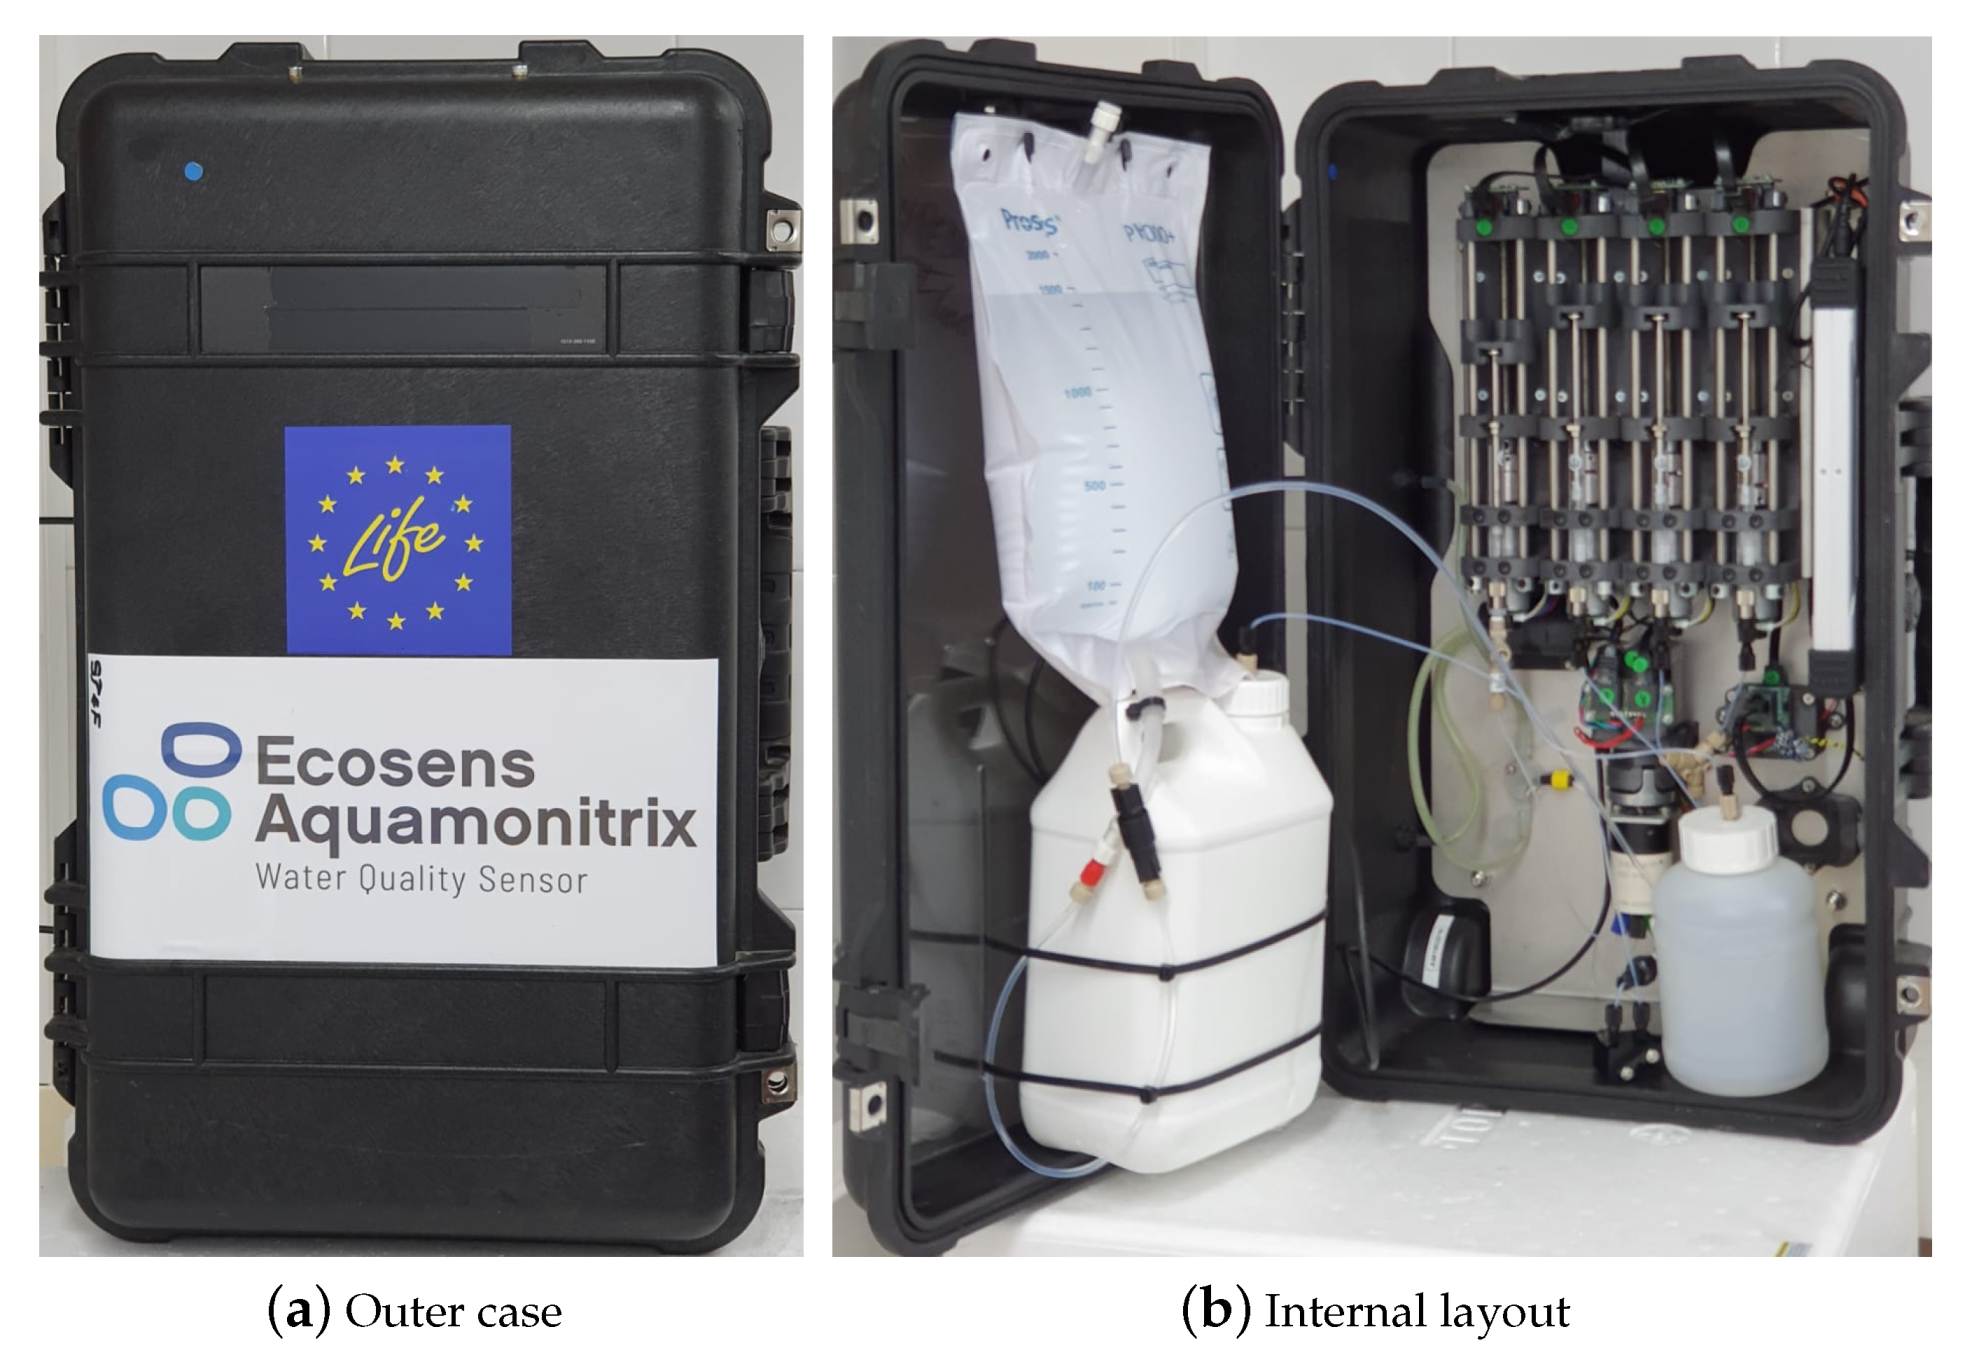
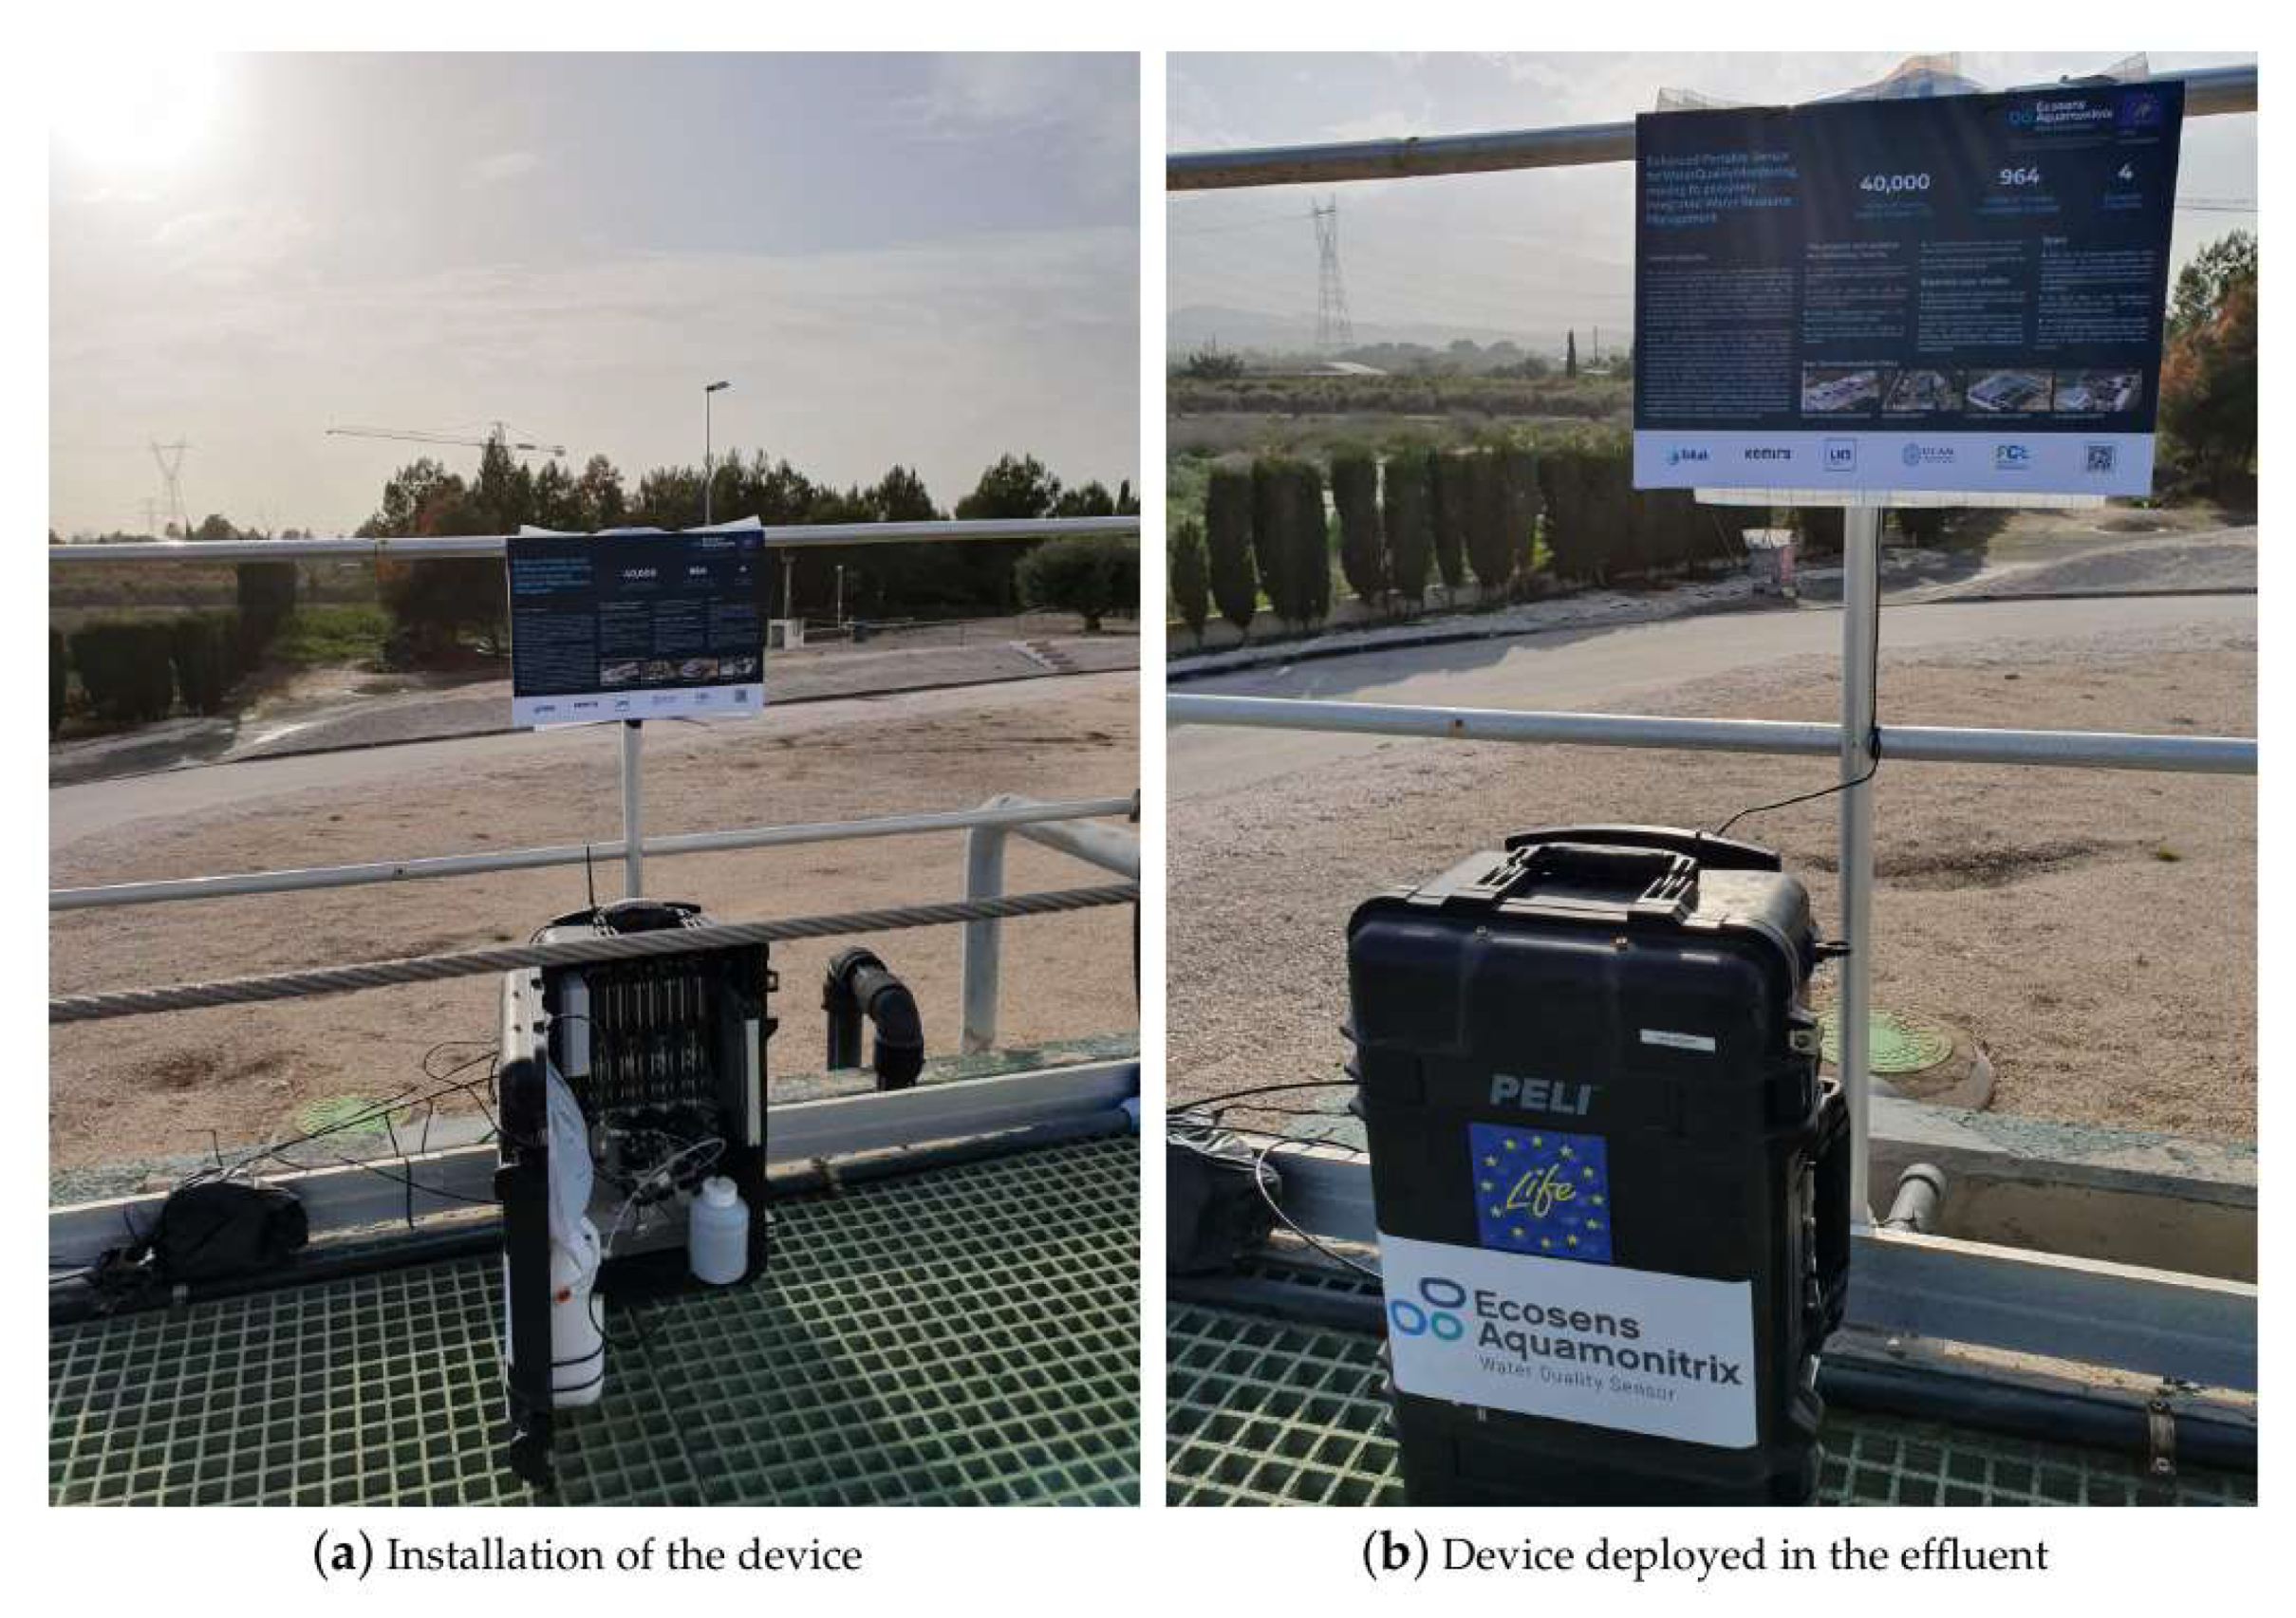
The analyzer is housed within a Peli 1510M Mobility Case (see
Figure 2a). The case is water resistant, crushproof, dust resistant, and features a pressure equalization valve to balance interior pressure. The modular design of the system facilitates maintenance and exchange of components, without affecting the functioning of the other modules (see
Figure 2b).
An embedded system based on the Teensy 3.6 microcontroller unit is used to automate all functionality of the system. The firmware allows the unit to operate independently without user interaction once set up. A real-time clock wakes the system at a defined interval upon which system sampling and analysis functions begin to execute.
In this work, to add the connectivity with the wireless sensor network, an IoT solution associated with the system is implemented using a Raspberry Pi Zero W (Rpi) connected to a SimCom SIM800 Quad-Band GSM/GPRS integrated component. Raw signal transmission is acquired in real-time via an RS232 serial connection between the microcontroller and Rpi. The raw data is processed at the end of each IC run and used to calculate retention time and peak area of nitrate and nitrite. These values are transmitted via the SIM800 module. A small buffer of processed data are stored on the RPi unit in the event of a data transmission failure. The IoT devices attempt to transmit the buffered data at the end of subsequent IC runs.
2.2. IoT Platform
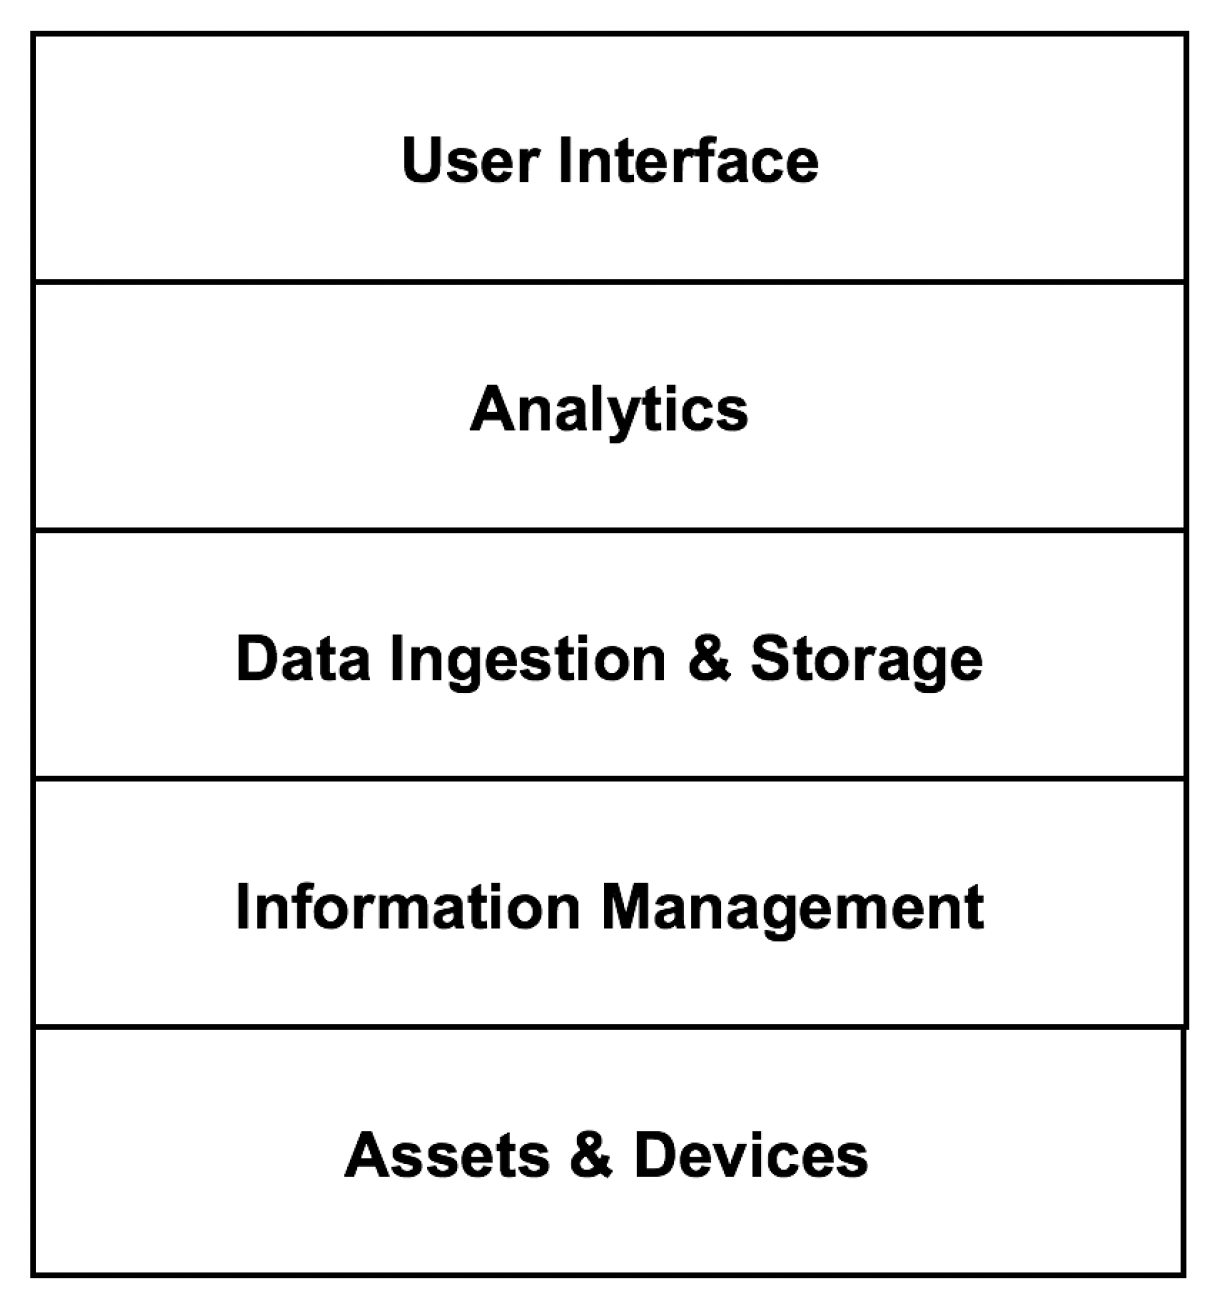
The IoT platform applied in this research is based on the middleware called thethings.io [
49]. As shown in the
Figure 3, the architecture of the IoT platform has been structured in five layers. The aspects of IoT middleware which are relevant for the understanding of the developed system are described below.
At the lowest layer are the assets and devices. Assets are the reason for the development of IoT applications. The assets of interest are the real-world objects and entities subject to monitoring, as well as having digital representations and identities. Assets are instrumented with embedded technologies that bridge the digital realm with the physical world, and that provide the capability to monitor the assets as well as providing identities to the assets. Sensors and actuators in various devices, e.g., Wireless Sensor Networks, provide the main functional capabilities of sensing and embedded identities.
The second layer corresponds to the information management middleware, which is based on the specification of an information model and an Application Program Interface (API) based on the Representational State Transfer (REST) software architectural style (see Zhou [
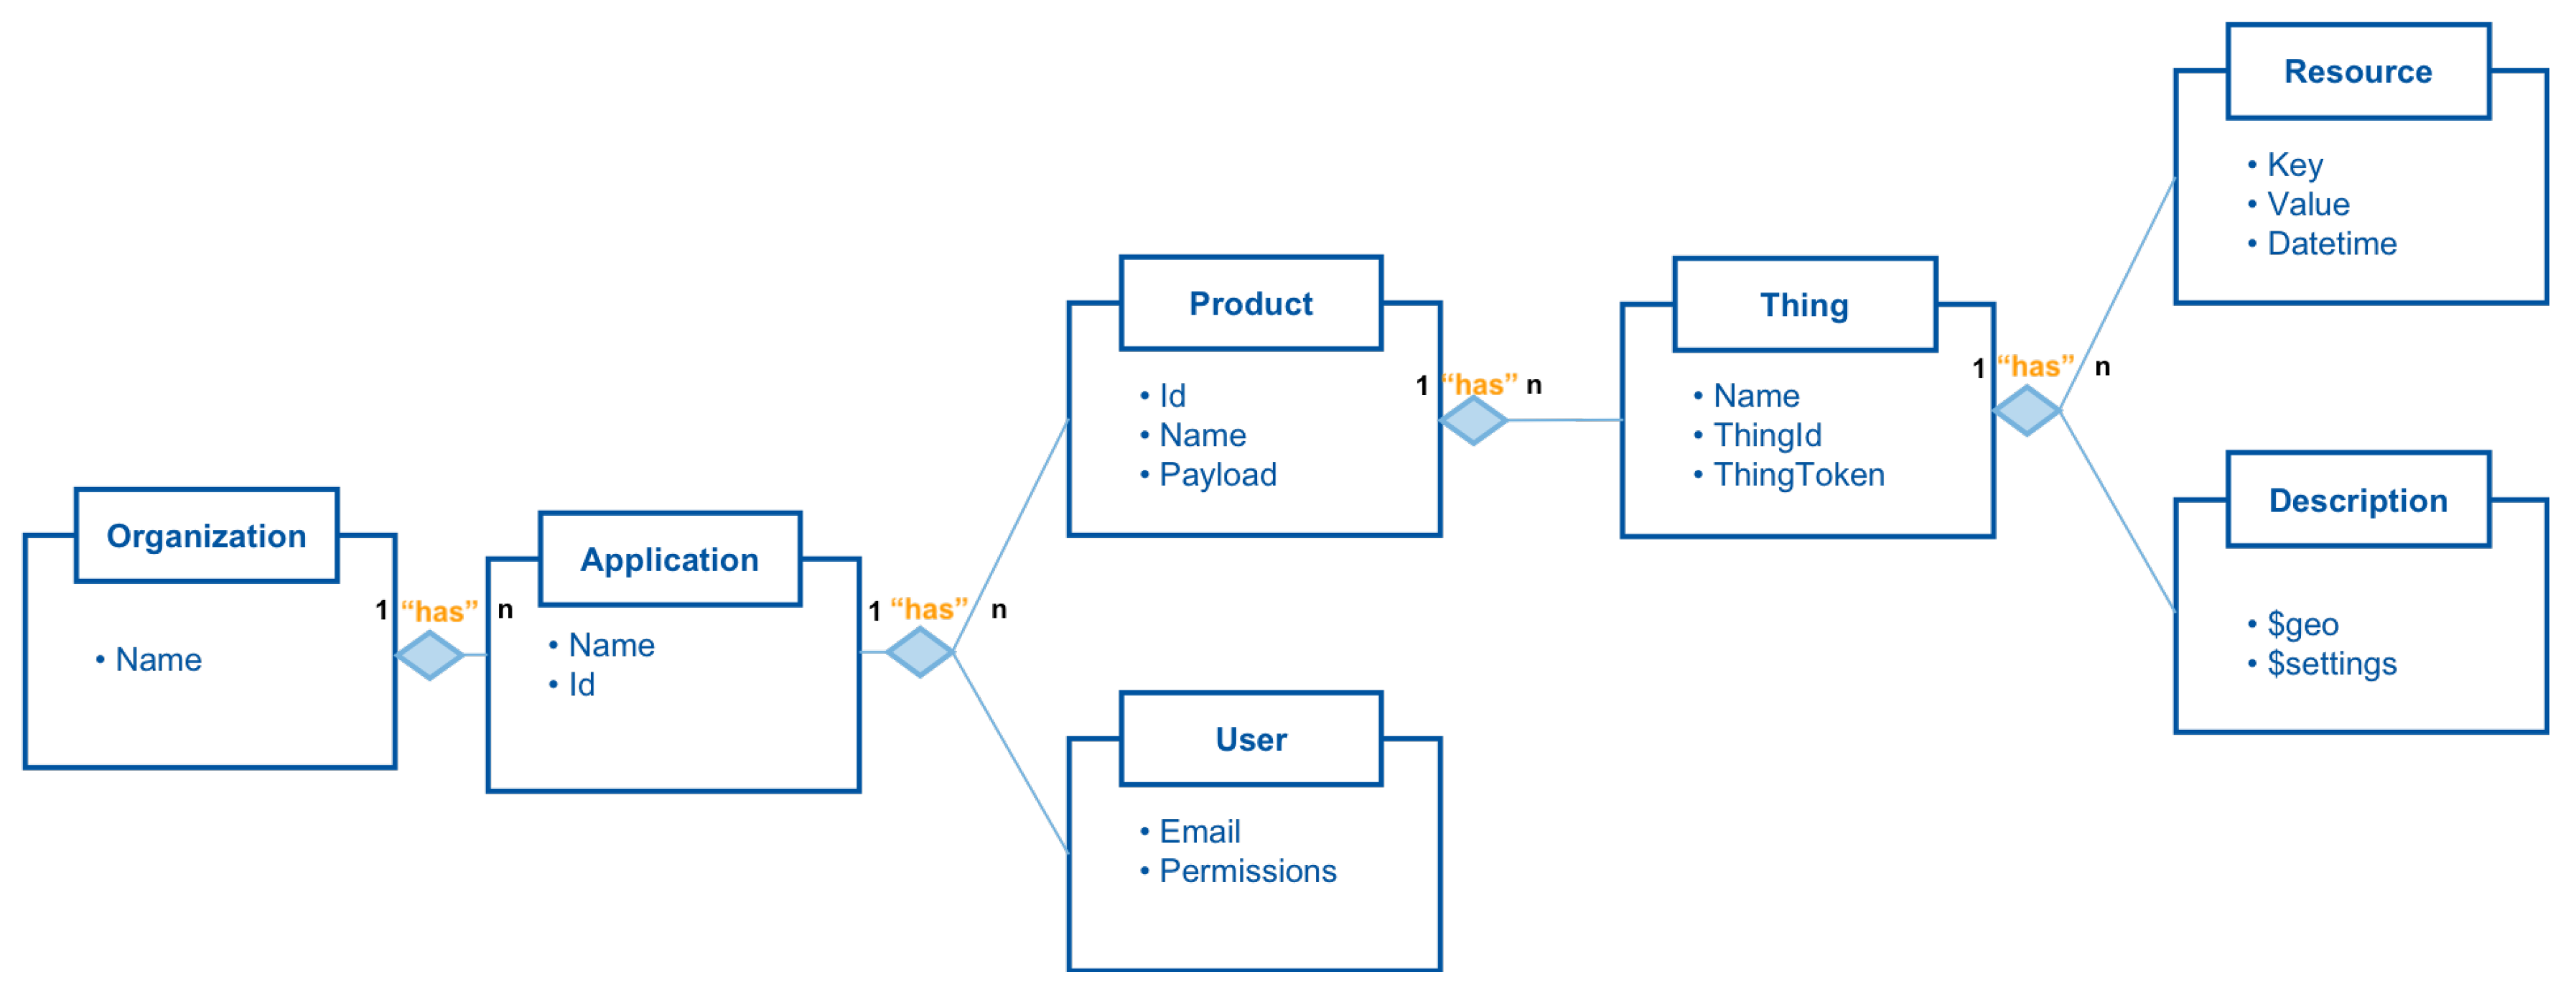
27]), as well as the adoption of communication protocols to manage and exchange information. All the information handled by the IoT platform is modeled by defining an information model composed of seven types of entities.
Figure 4 illustrates these entities, as well as the relationships between them.
An entity can refer to hardware, that is called thing, e.g., IoT device, or software, that is called resource, e.g., hosted in the device, and to high-level abstractions, that are called product, that group entities of different types, e.g., product can have different types of things. An organization-type entity represents an account associated with the IoT platform and is uniquely identified by a name. An organization has applications. Applications are characterized by a pair <name_app, id>. Applications have products and users. Users are characterized by a pair <email, permissions>. Products are identified by a triplet <id, name_product, payload>. Each product has things also characterized by triplets <name_thing, thingid, thingtoken>. Finally, things have resources and descriptions. Descriptions are semantic data (metadata) characterized by a pair <$geo, $settings>. The attributes of the resources are data associated with a date and time grouped in triplets <key, value, datetime>. The values of these attributes become the information of the system.
The IoT platform provides a complete backend solution to develop IoT applications through an easy and flexible REST API, which allows the mediation between a large number of services.
Table 1 shows the operations at thing level supported by information management middleware. Moreover, the IoT platform is agnostic to hardware, being possible to integrate any hardware platform. To do this, it is necessary to use the supported protocols [
27,
50]: Hypertext Transfer Protocol (HTTP), Websockets, Message Queue Telemetry Transport (MQTT), User Datagram Protocol (UDP), Transmission Control Protocol (TCP), or Constrained Application Protocol (CoAP). Regarding serialization formats, such as JavaScript Object Notation (JSON), Messagepack, and Protocol Buffers, are supported.
The third layer of the platform architecture is responsible for data ingestion and storage. Ingestion consists of getting data from producers, e.g., IoT devices, and making them available to consumers, e.g., IoT applications. For this purpose, a component called
message broker is used. This component is based on Redis technology [
51]. Producers send data to the message broker using the information management middleware. The data is pushed to the temporary storage of the message broker. The temporary storage consists of a cache that allows later stages (e.g., analytics) a simple and quick access to the incoming data. In doing so, producers can publish messages and consumers can consume them quickly using Redis database engine, which means real-time data management. The message broker persists the information published by the producers in two data warehouses called
DB Time series and
object repository that use NoSQL Cassandra [
52] and MongoDB [
53] technologies, respectively. The time series built from the attributes of the system resources, <key, value> pairs, are stored in the DB Time series. The rest of the information is stored in the object repository. The biggest challenge for the message broker is to be able to dispatch the received requests. For this purpose, a memory and CPU cluster are available. The management of these resources is automated thanks to the application of auto-scaling tasks [
54].
At the fourth layer, the IoT middleware allows the modeling of data by scientists who perform analytical tasks to discover valuable insights hidden in the big data stored in the platform. In this analytical architecture, three types of mechanisms can be distinguished: functions, jobs, and triggers. Functions are fragments of code executed using a call from the RESTful API. Functions can be invoked by triggers and jobs. This mechanism is useful for encapsulating logic hosted in the cloud. The execution of functions is limited to 15 s. Jobs are executed automatically each predefined time period. Jobs are used to process data in order to generate key performance indicators (kpis) and analytics by aggregating event data. The execution of the jobs is limited to 5 min. Triggers are executed when an event occurs after using the RESTful API, e.g., thingWrite request. Triggers enable alarms to be sent through various methods (e-mail, short message service (SMS), twitter or voice calls). Triggers also allow the creation of aggregated resources or events for the calculation of kpis and analytics using jobs. Triggers execution is limited to 2 s.
The IoT platform provides the cloud code API (see
Table 2) and the
Cloud Code Sandbox to execute JavaScript code associated with triggers and jobs. The cloud code sandbox uses Jailed [
55]. Thanks to this library, it is possible to launch an independent and secure sandbox for each request (trigger or job). In addition, Jailed allows to export a set of external functions into the sandbox.
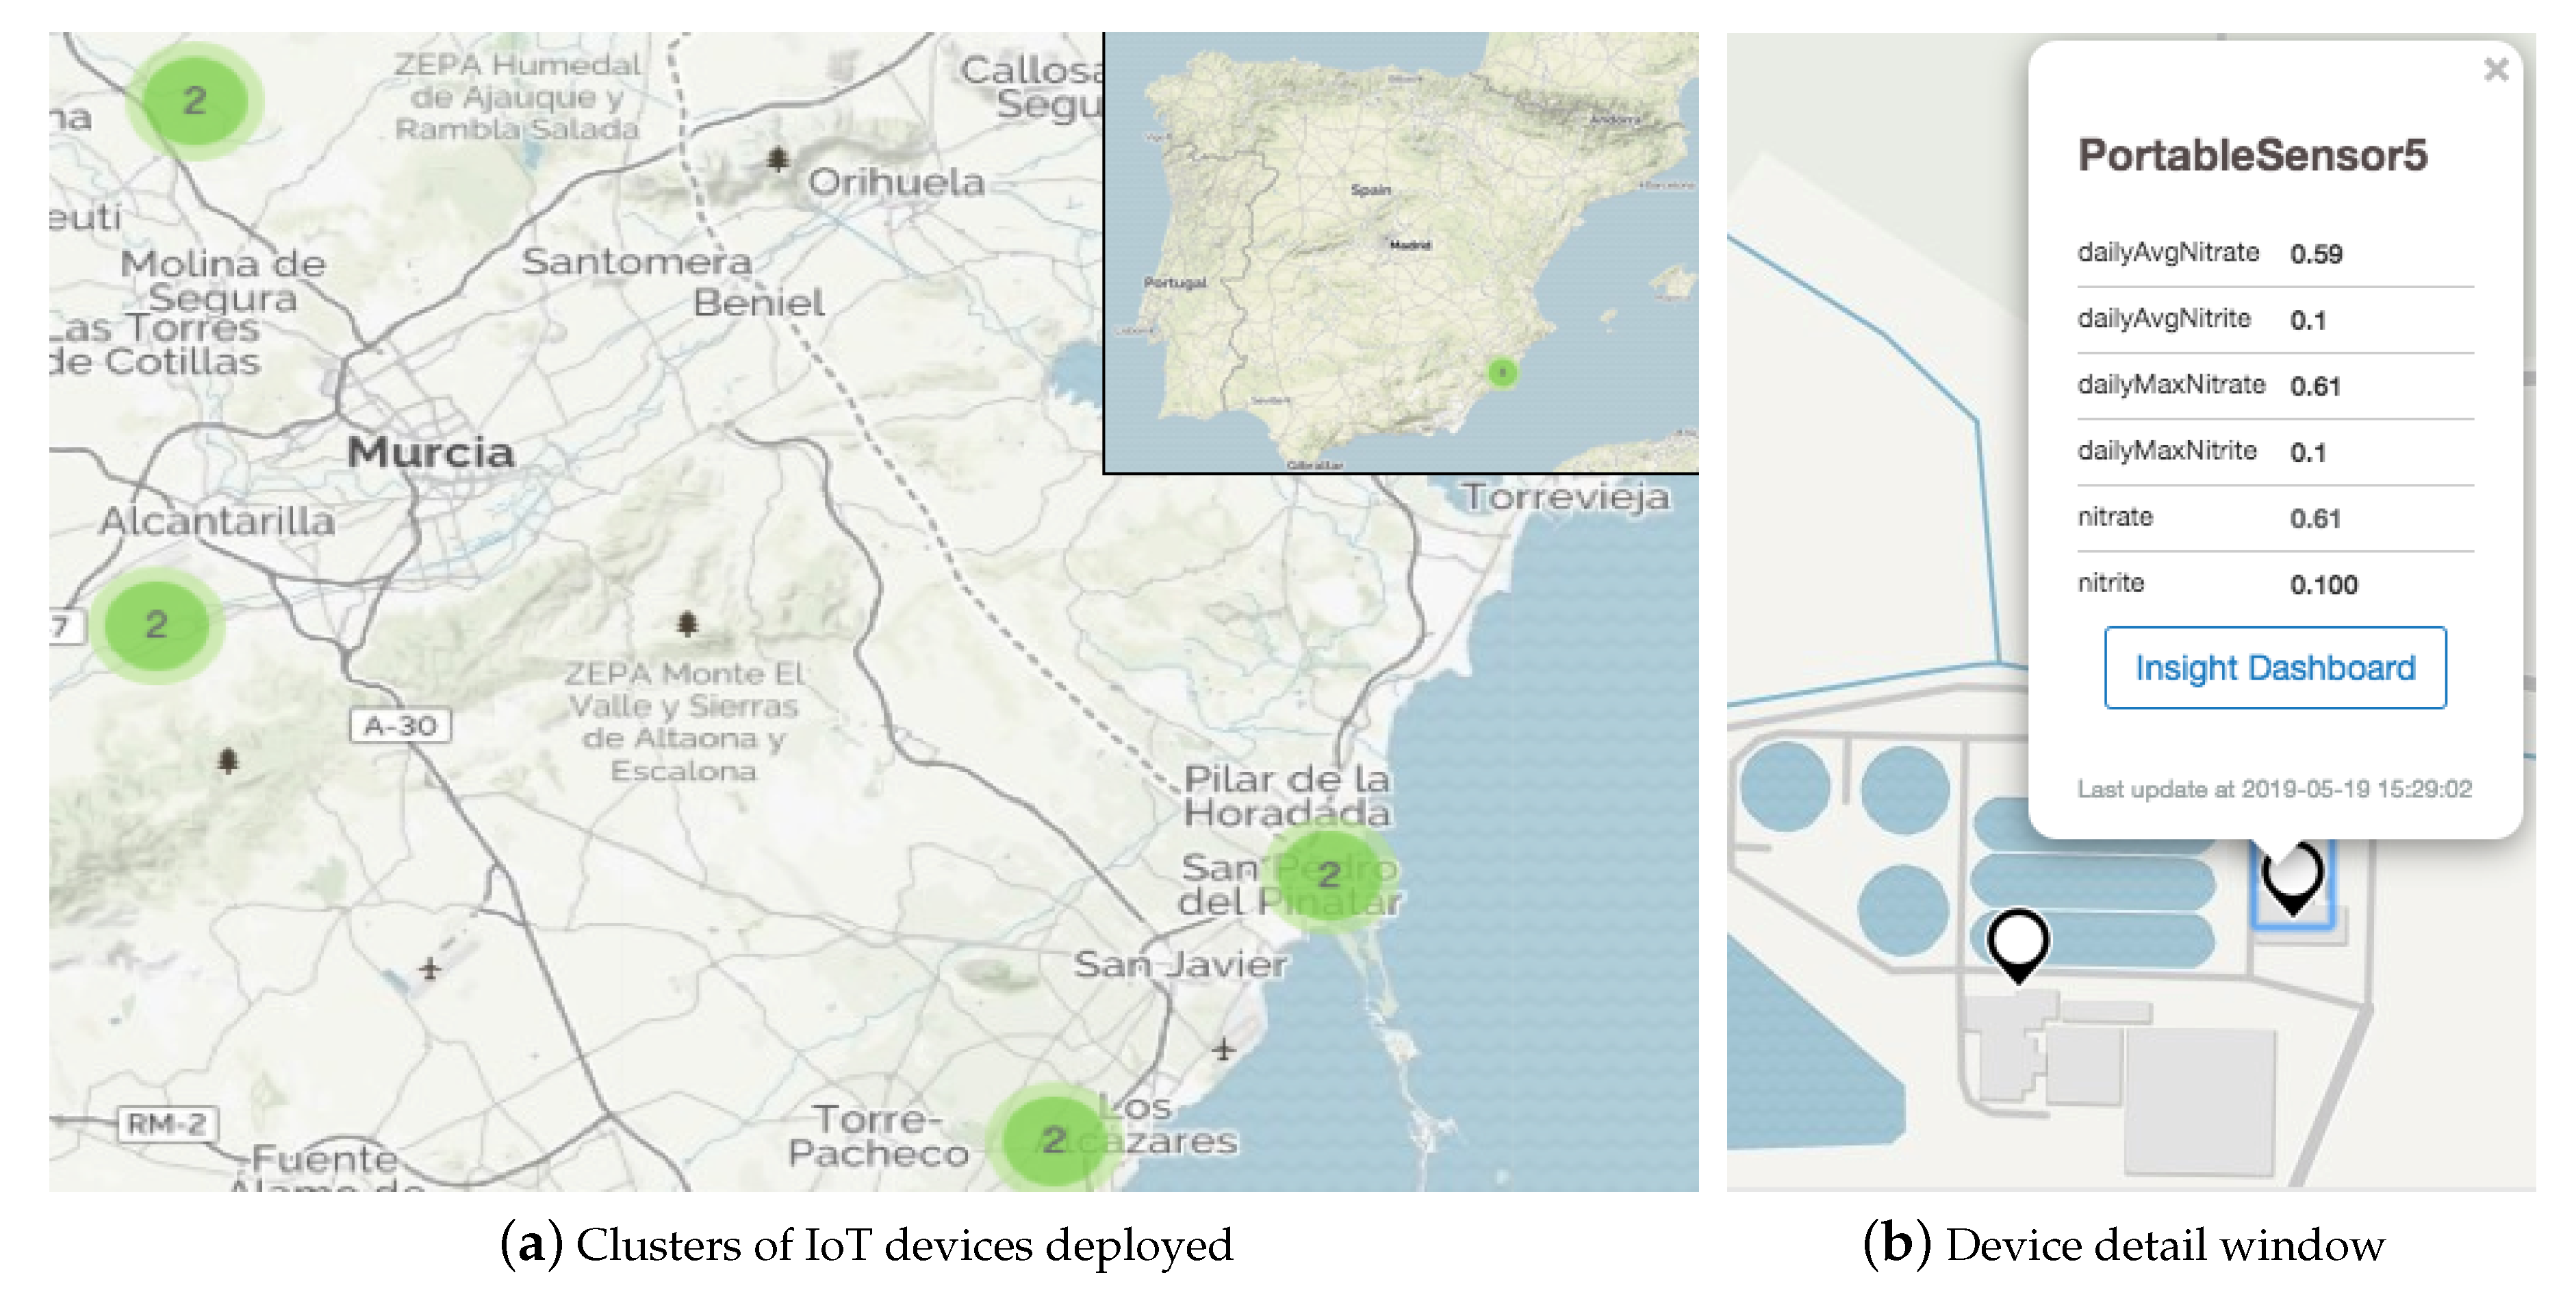
At the top of the architecture is the user interface, which provides to the user data monitoring and management capabilities. For this purpose, both a dashboard system and a global online management panel are accessible from anywhere. The dashboard system incorporates widgets from libraries and proprietary that allow their customization to get the best possible response in the visualization of information. There are three levels of dashboard: main, application, and insight. The main dashboard displays the metrics of the applications and IoT devices, and their activity. The applications show the measurements of a subset of devices and their activity. Finally, the insight dashboard displays the measurements and activity of an IoT device related to an application. Therefore, the dashboard system can monitor the information associated with IoT applications: data from resources, kpis, device status, alarms, and other information.
After presenting the device (see
Section 2.1) and the IoT platform, the integration process that results in a smart water quality monitoring system is addressed in the following section by describing a decentralized use case in the field of wastewater treatment.
2.3. EcoSens Aquamonitrix System in a WasteWater Treatment Domain
A distributed scenario is assumed in the wastewater treatment domain, e.g., WWTPs in many regions or countries. This is a complex IoT scenario, as it involves the management of a large number of sensors. The sensors are hosted in the
devices, see
Section 2.1, developed with the aim of collecting, processing and transmitting data associated with
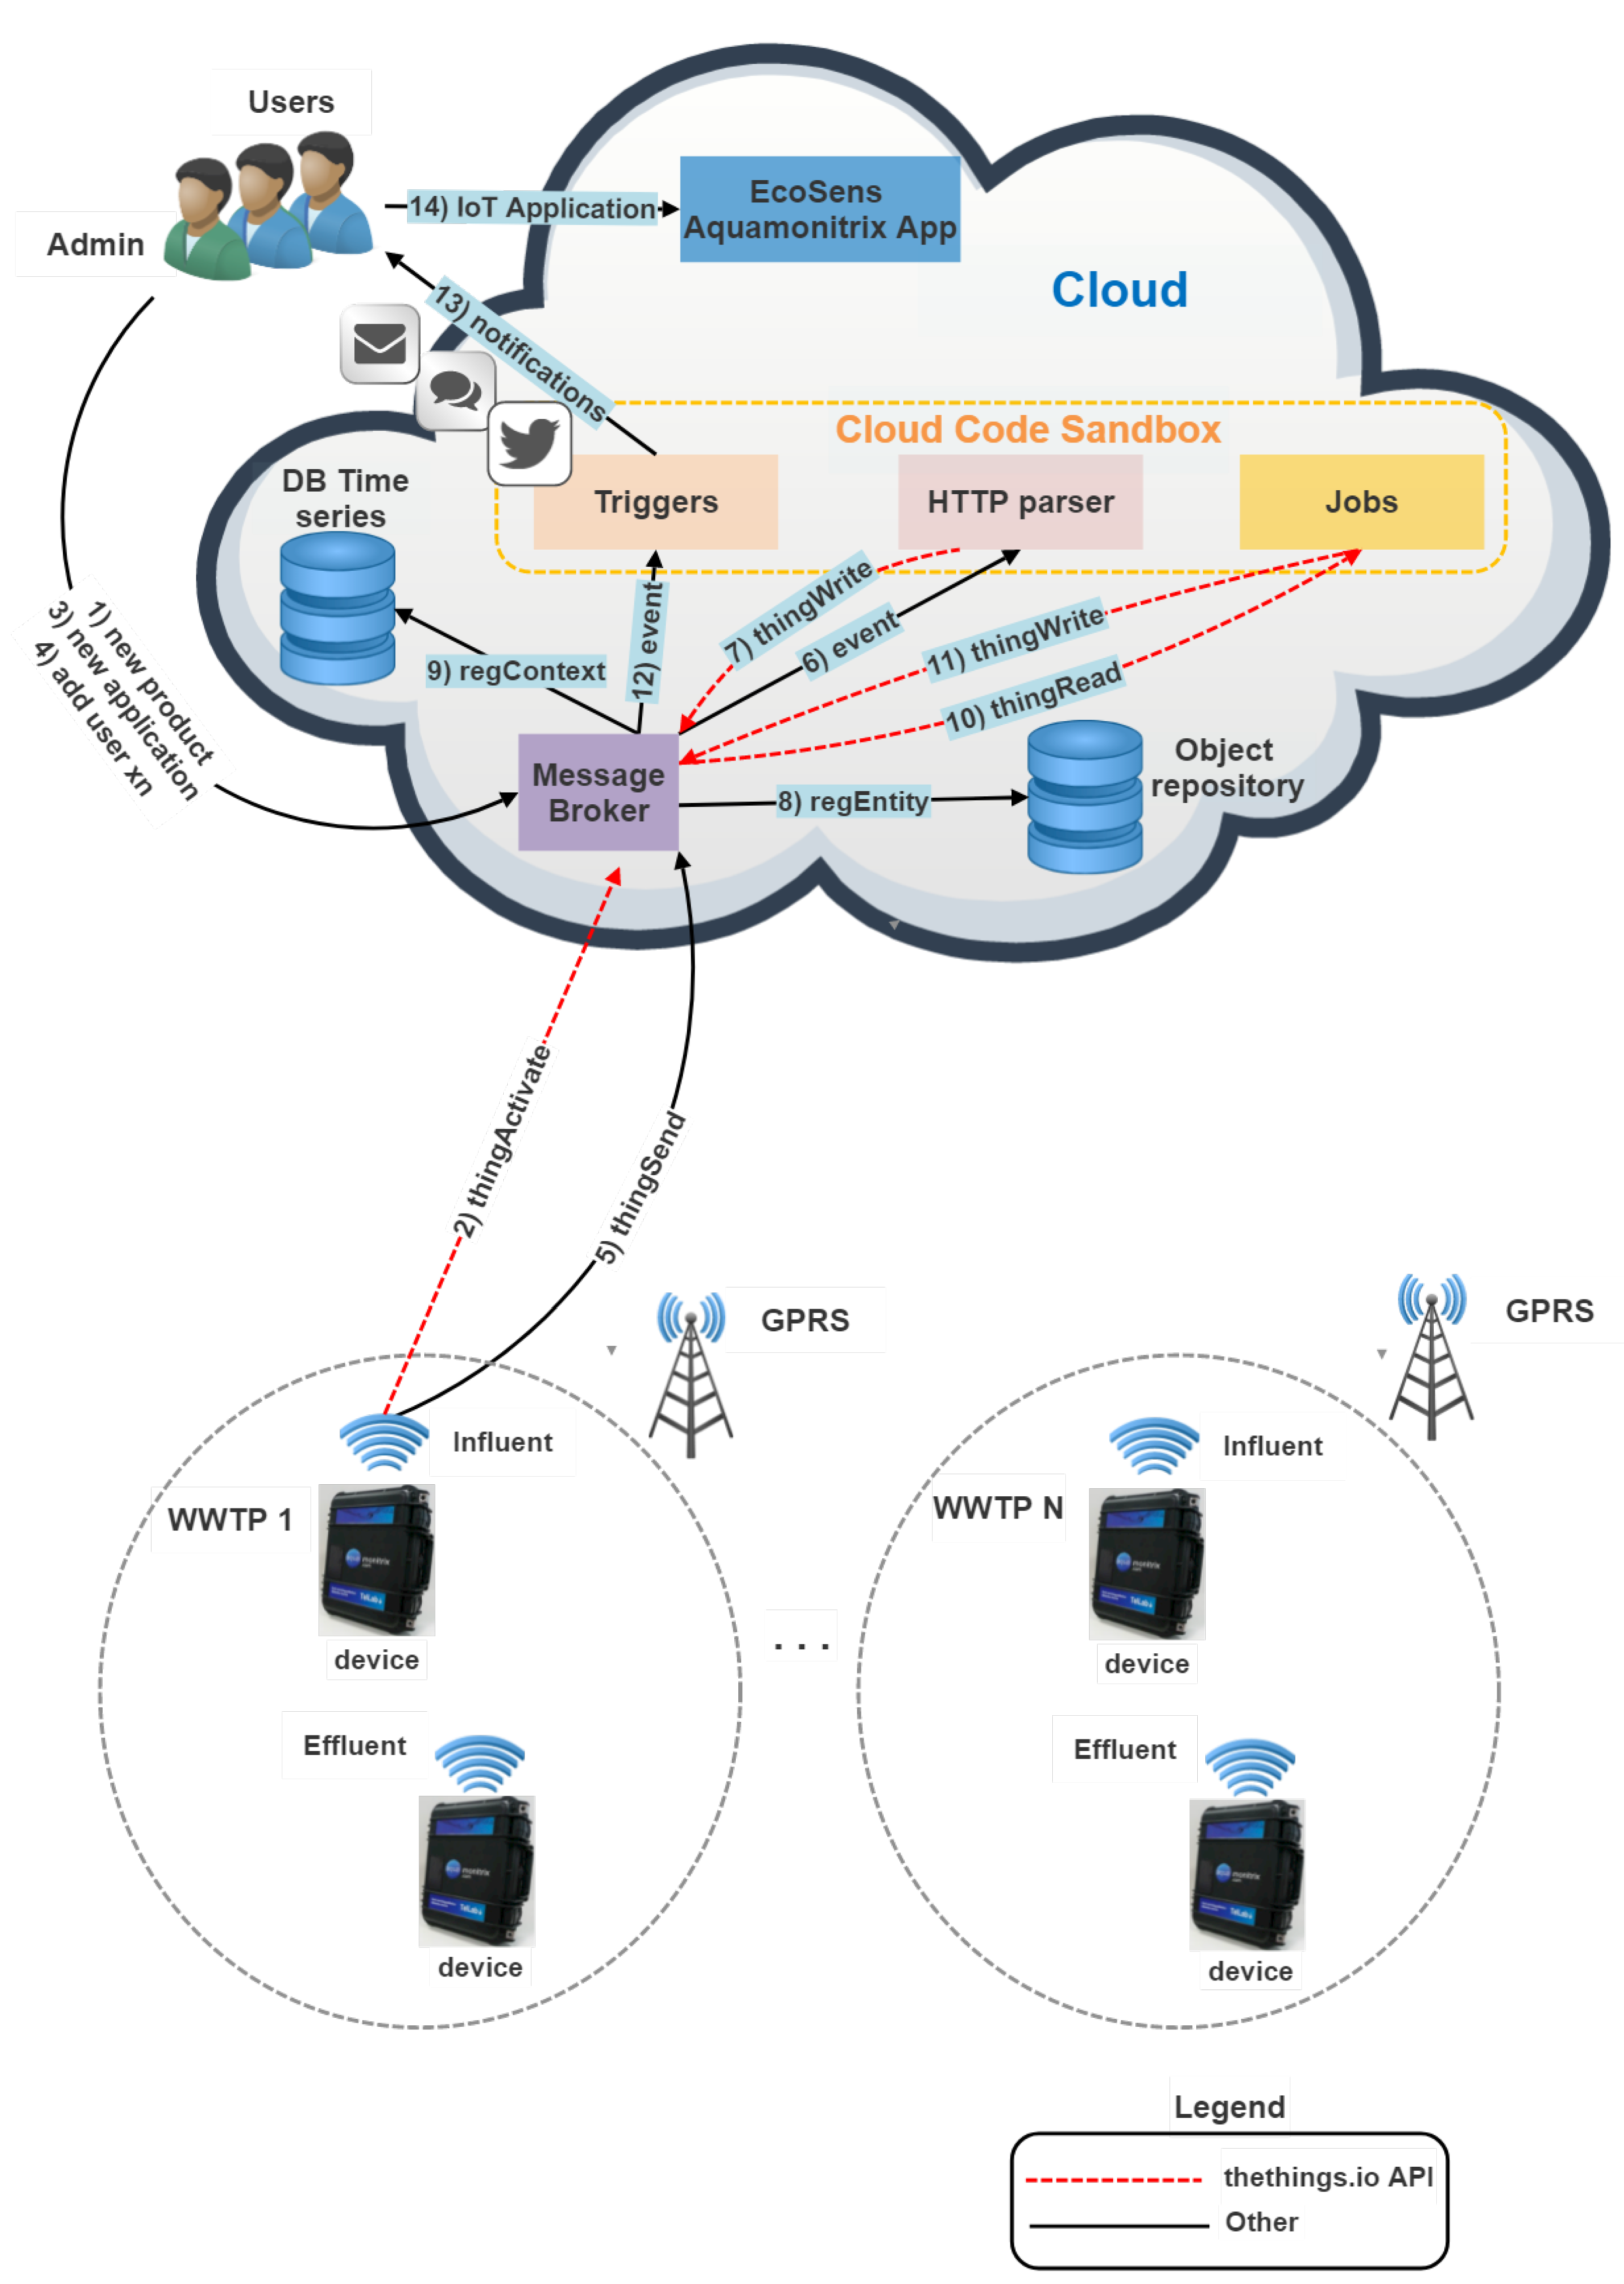
assets (nitrate and nitrite concentrations). The proposed scenario demands a solution that allows to integrate, manage and scale a large number of IoT devices and users. In order to meet these requirements, the EcoSens Aquamonitrix System has been implemented in a wastewater treatment plant scenario. This smart water quality monitoring system (SWQMS) depicted by
Figure 5 is powered by the IoT platform described in the
Section 2.2 to leverage the potential of wireless sensor networks and the sensor, see
Section 2.1.
In the EcoSens Aquamonitrix System, the integration of the device with the IoT platform is achieved thanks to the information management middleware (see layer 2 of IoT architecture). Specifically, it uses an operation, henceforth
thingSend, as a result of versioning the RESTful API to send the water quality data collected by the devices to the platform. This feature is useful because it allows to customize the body of the request and provides a special URL (endpoint) to access the
HTTP parser, a Web service in charge of decoding and preprocessing the information. In this way, this innovative system takes advantage of the new functionalities offered by the Internet of Things based on the architecture studied in the
Section 2.2. The devices are deployed in the influent and effluent of each WWTP. The devices communicate with the cloud via the mobile network, using the General Packet Radio Service (GPRS). At the top of the
Figure 5 is the cloud, where instances of the components
message broker,
DB Time series,
Object repository, and
Cloud Code SandBox have been deployed. As a starting point, it is supposed the creation of an
organization entity in the system. This entity has associated a
user with administrator permissions. There are five different processes involved in the operation of the SWQMS: system initialization, capture and storage of information, information modeling, data analytics and visualization, and management of information. These processes are described below.
System initialization
- 1.
The administrator sends a request to the message broker from the platform’s user interface (things manager) to create a product. The message broker creates a product entity in the object repository. This entity is used to group the resources and things of the system.
- 2.
Each device sends a thingActivate request, see
Table 1, to the message broker. As a result, a unique identifier (thingToken) is created and transmitted to the device. For each request received, the message broker creates a thing entity in the object repository.
- 3.
The administrator sends a request to the message broker from the user interface of the platform for the creation of an IoT application. The message broker creates an application entity in the object repository.
- 4.
The administrator sends as many requests to the message broker as users to be registered in the system. As a result, a number of user entities is created in the object repository.
Note: step 2 can also be performed by the administrator using the thingActivate operation of the RESTful API or by sending a request from the user interface to create a thing.
Capture and storage of information
- 5.
Water quality data is acquired by sensors and collected by IoT devices. The IoT devices add spatial and temporal information to the data. The information is transmitted to the message broker using the thingSend operation.
- 6.
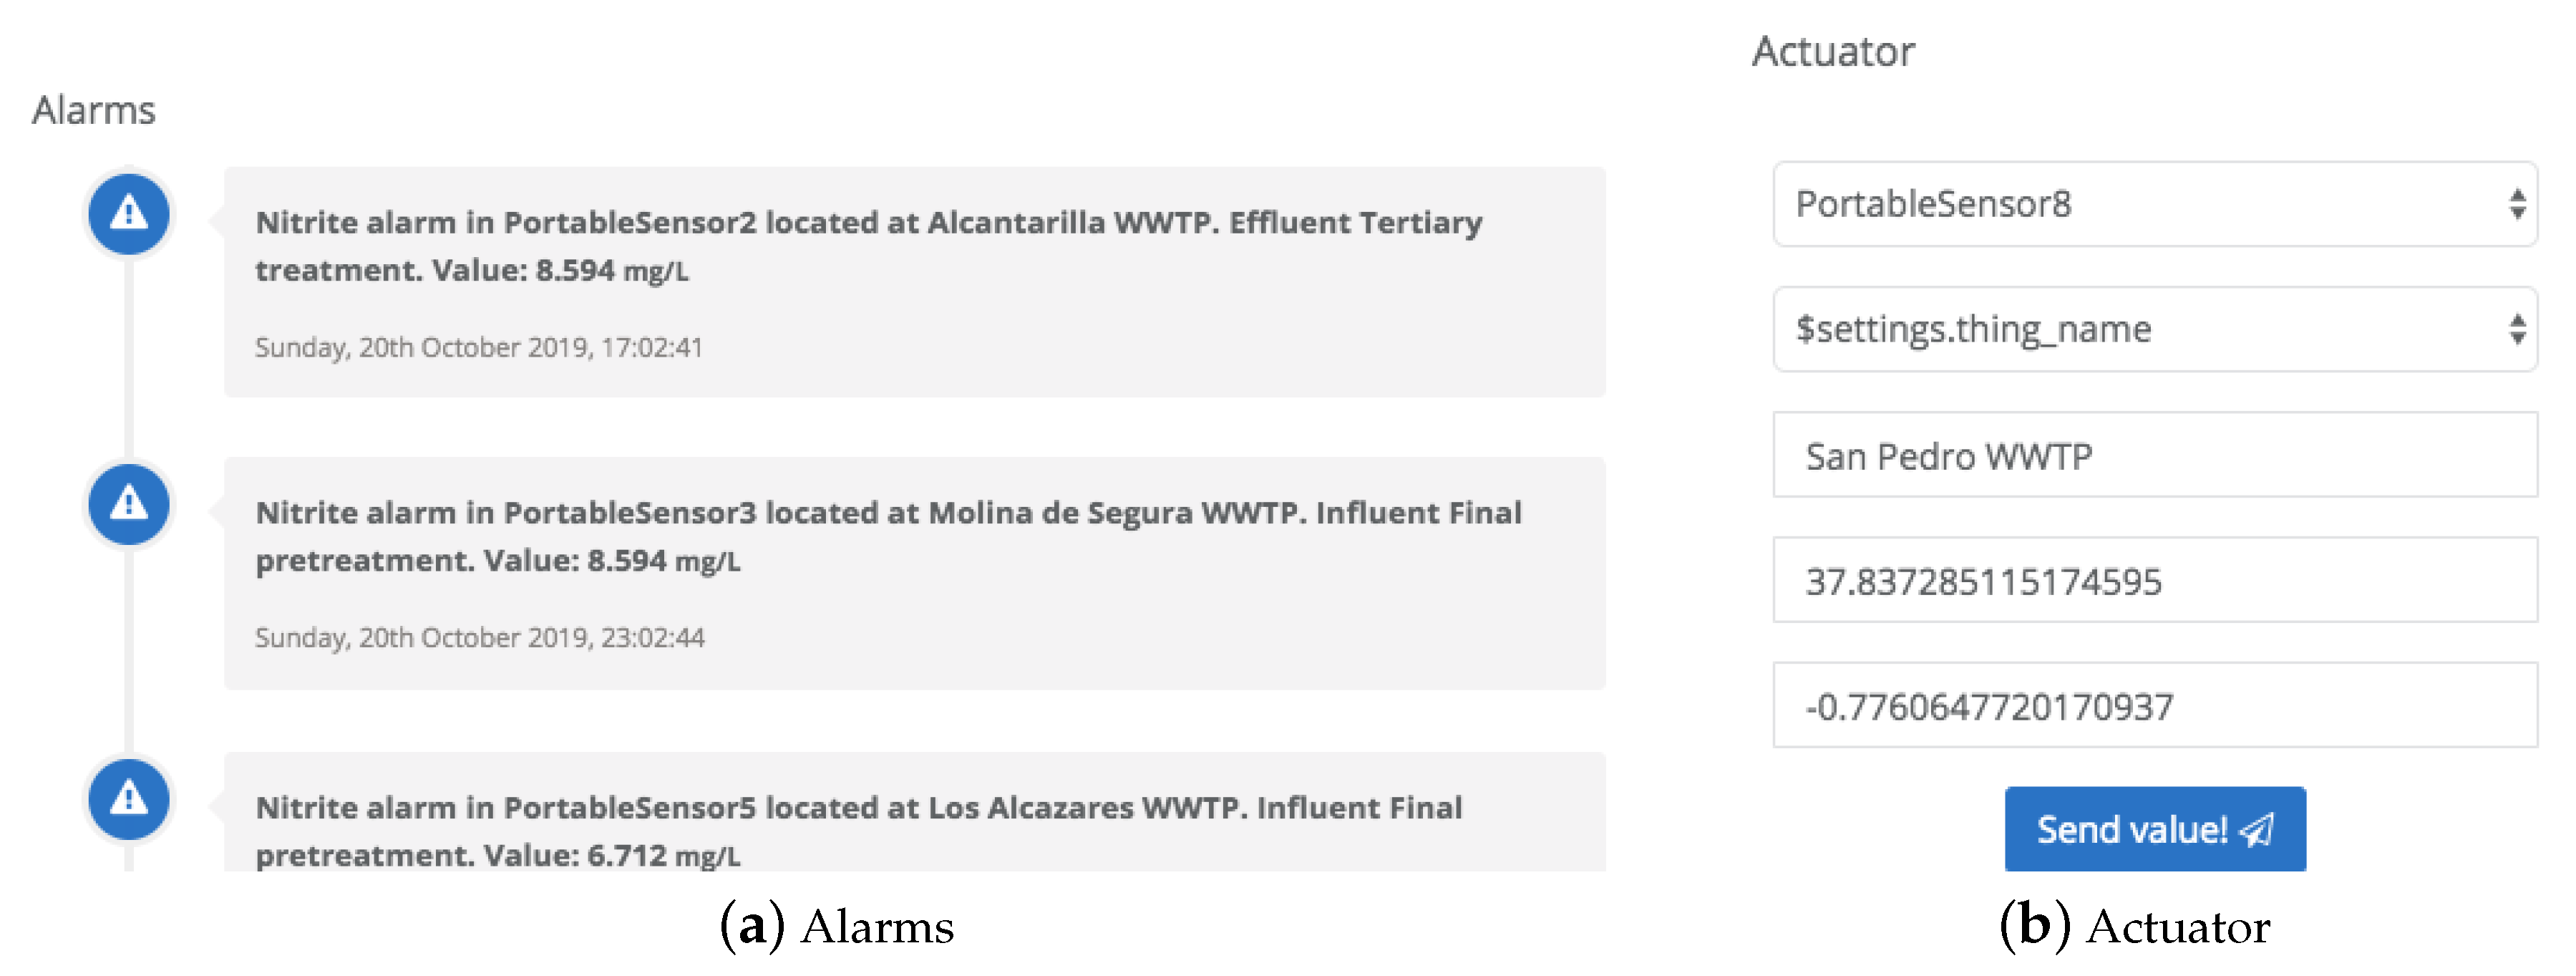
When the information of an IoT device is published in the message broker, there is an event that notifies the consumer, in this case an
HTTP parser. The HTTP parser decodes and preprocesses the message broker information to obtain the nitrate and nitrite measurements as well as the alarms. The alarms are generated if nitrate and nitrite concentrations exceed the allowed limits of 50 mg/L and 5 mg/L, respectively [
56]. Note that other customized alarm levels are allowed.
- 7.
The thingWrite operation, see
Table 1, is used to store in the two system databases the information decoded and preprocessed: <key, value> pairs and associations of the nitrate, nitrite, and alarms resources.
Information modeling
- 8.
The platform provides the RESTful API (see
Table 1) and and other services, e.g., thingSend operation, used by both the administrator and the IoT devices to create or update entities. Entities represent different levels of abstraction (see
Section 2.2). The mapping is done in the object repository, which records the associations between the system entities such as resource, thing, product, application, etc.
- 9.
The information preprocessed by the HTTP parser, see step 6, is stored in the time series database of the system. This data warehouse provides the perfect infrastructure for mission-critical data.
Data analytics
- 10.
In the Cloud Code SandBox, several
jobs, such as hourly, daily, weekly, and monthly, have been implemented to get the system information using thingRead and exploit it through operations of the cloud code API, see
Table 2. As a result, different
kpis, e.g., mean, maximum, minimum, and standard deviation, related to nitrate and nitrite concentrations are obtained.
- 11.
In a similar way to the alarms generated by the HTTP parser, the kpis are modeled as resources and stored using thingWrite in the time series database of the system.
- 12.
Triggers are released when events occur after the thingWrite operations of the HTTP parser.
- 13.
The use of triggers allows to notify alarms by e-mail, short message service, twitter or voice calls.
Visualization and management of the information
- 14.
Finally, the visualization and management of the information is achieved through a user interface, which consists of a web service that takes advantage of the information stored in the system. The data sent by IoT devices and the alarms generated by the HTTP parser are published instantaneously, while key performance indicators calculated during the data analytics process are shown according to the job frequency (hourly, daily, weekly, or monthly). In this way, the interface provides to the user with valuable knowledge about water quality for decision making. Note that the interface has a functionality that allows exporting the data sets in csv, jpeg, and excel formats.
In summary, the EcoSens Aquamonitrix System is water quality aware: the information collected from the sensors is decoded, preprocessed, and modeled for processing, analysis, and knowledge extraction. This knowledge supports decision making by government agencies responsible for environmental protection and wastewater plant operators. The achieved behavior is possible thanks to the orchestration of the IoT services provided by the IoT platform, which allows the resources associated with the IoT devices to be searchable, accessible, and usable, thus maximizing their interaction with the user interface.
2.4. Integrated System Demonstration and Validation
Once the general integrated system has been applied to a IoT use case scenario in the wastewater treatment domain (see
Section 2.3), a system customization has been developed for its demonstration and validation in real conditions. For these purposes, the experiments detailed in
Section 2.4.1 and
Section 2.4.2 have been designed and carried out.
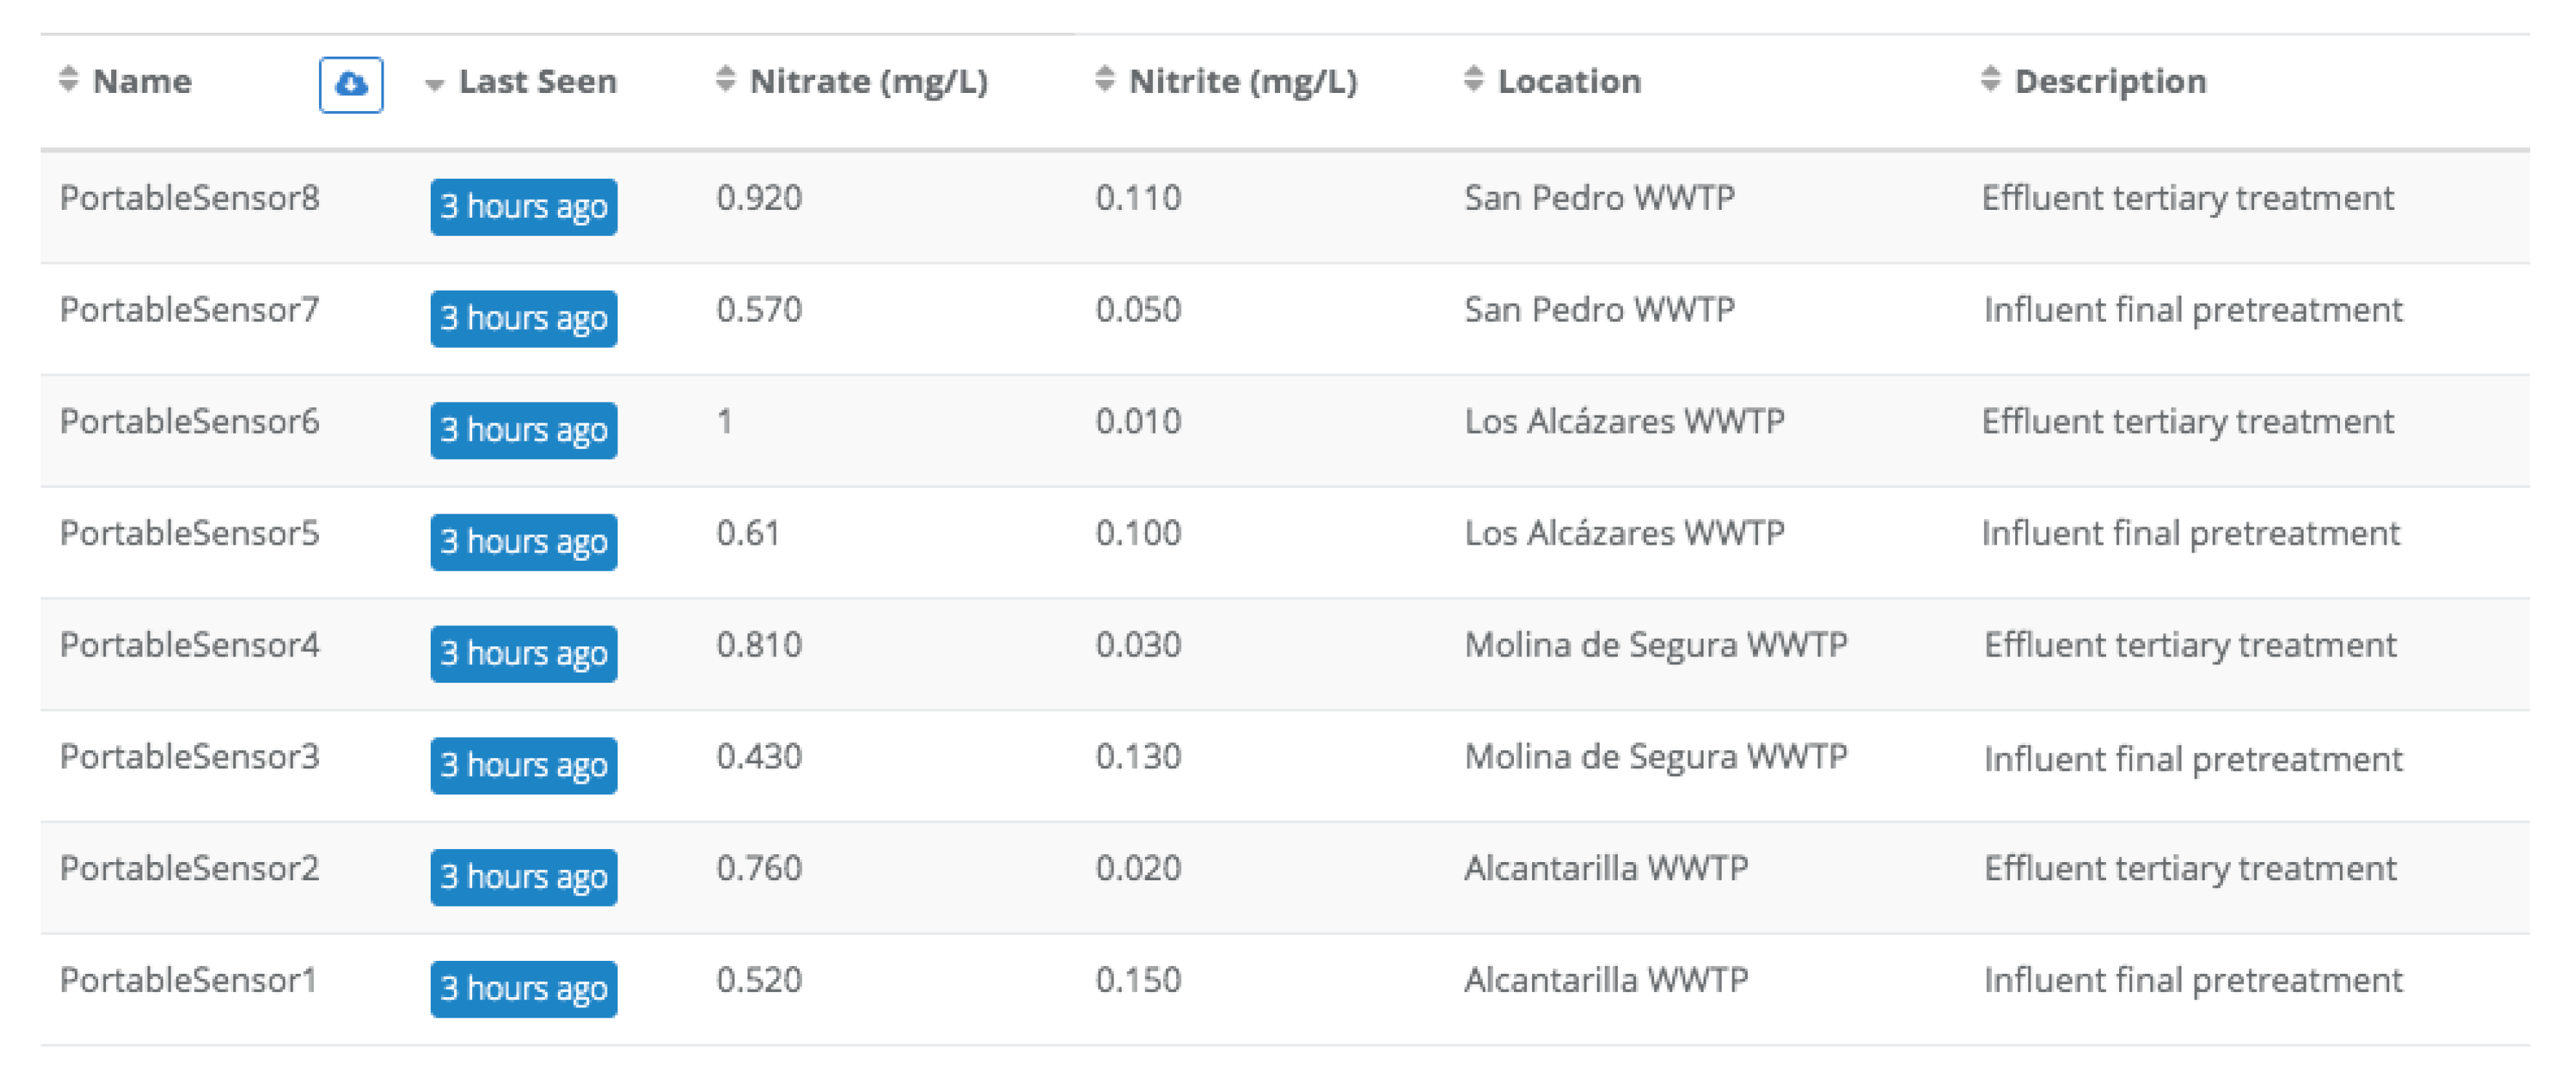
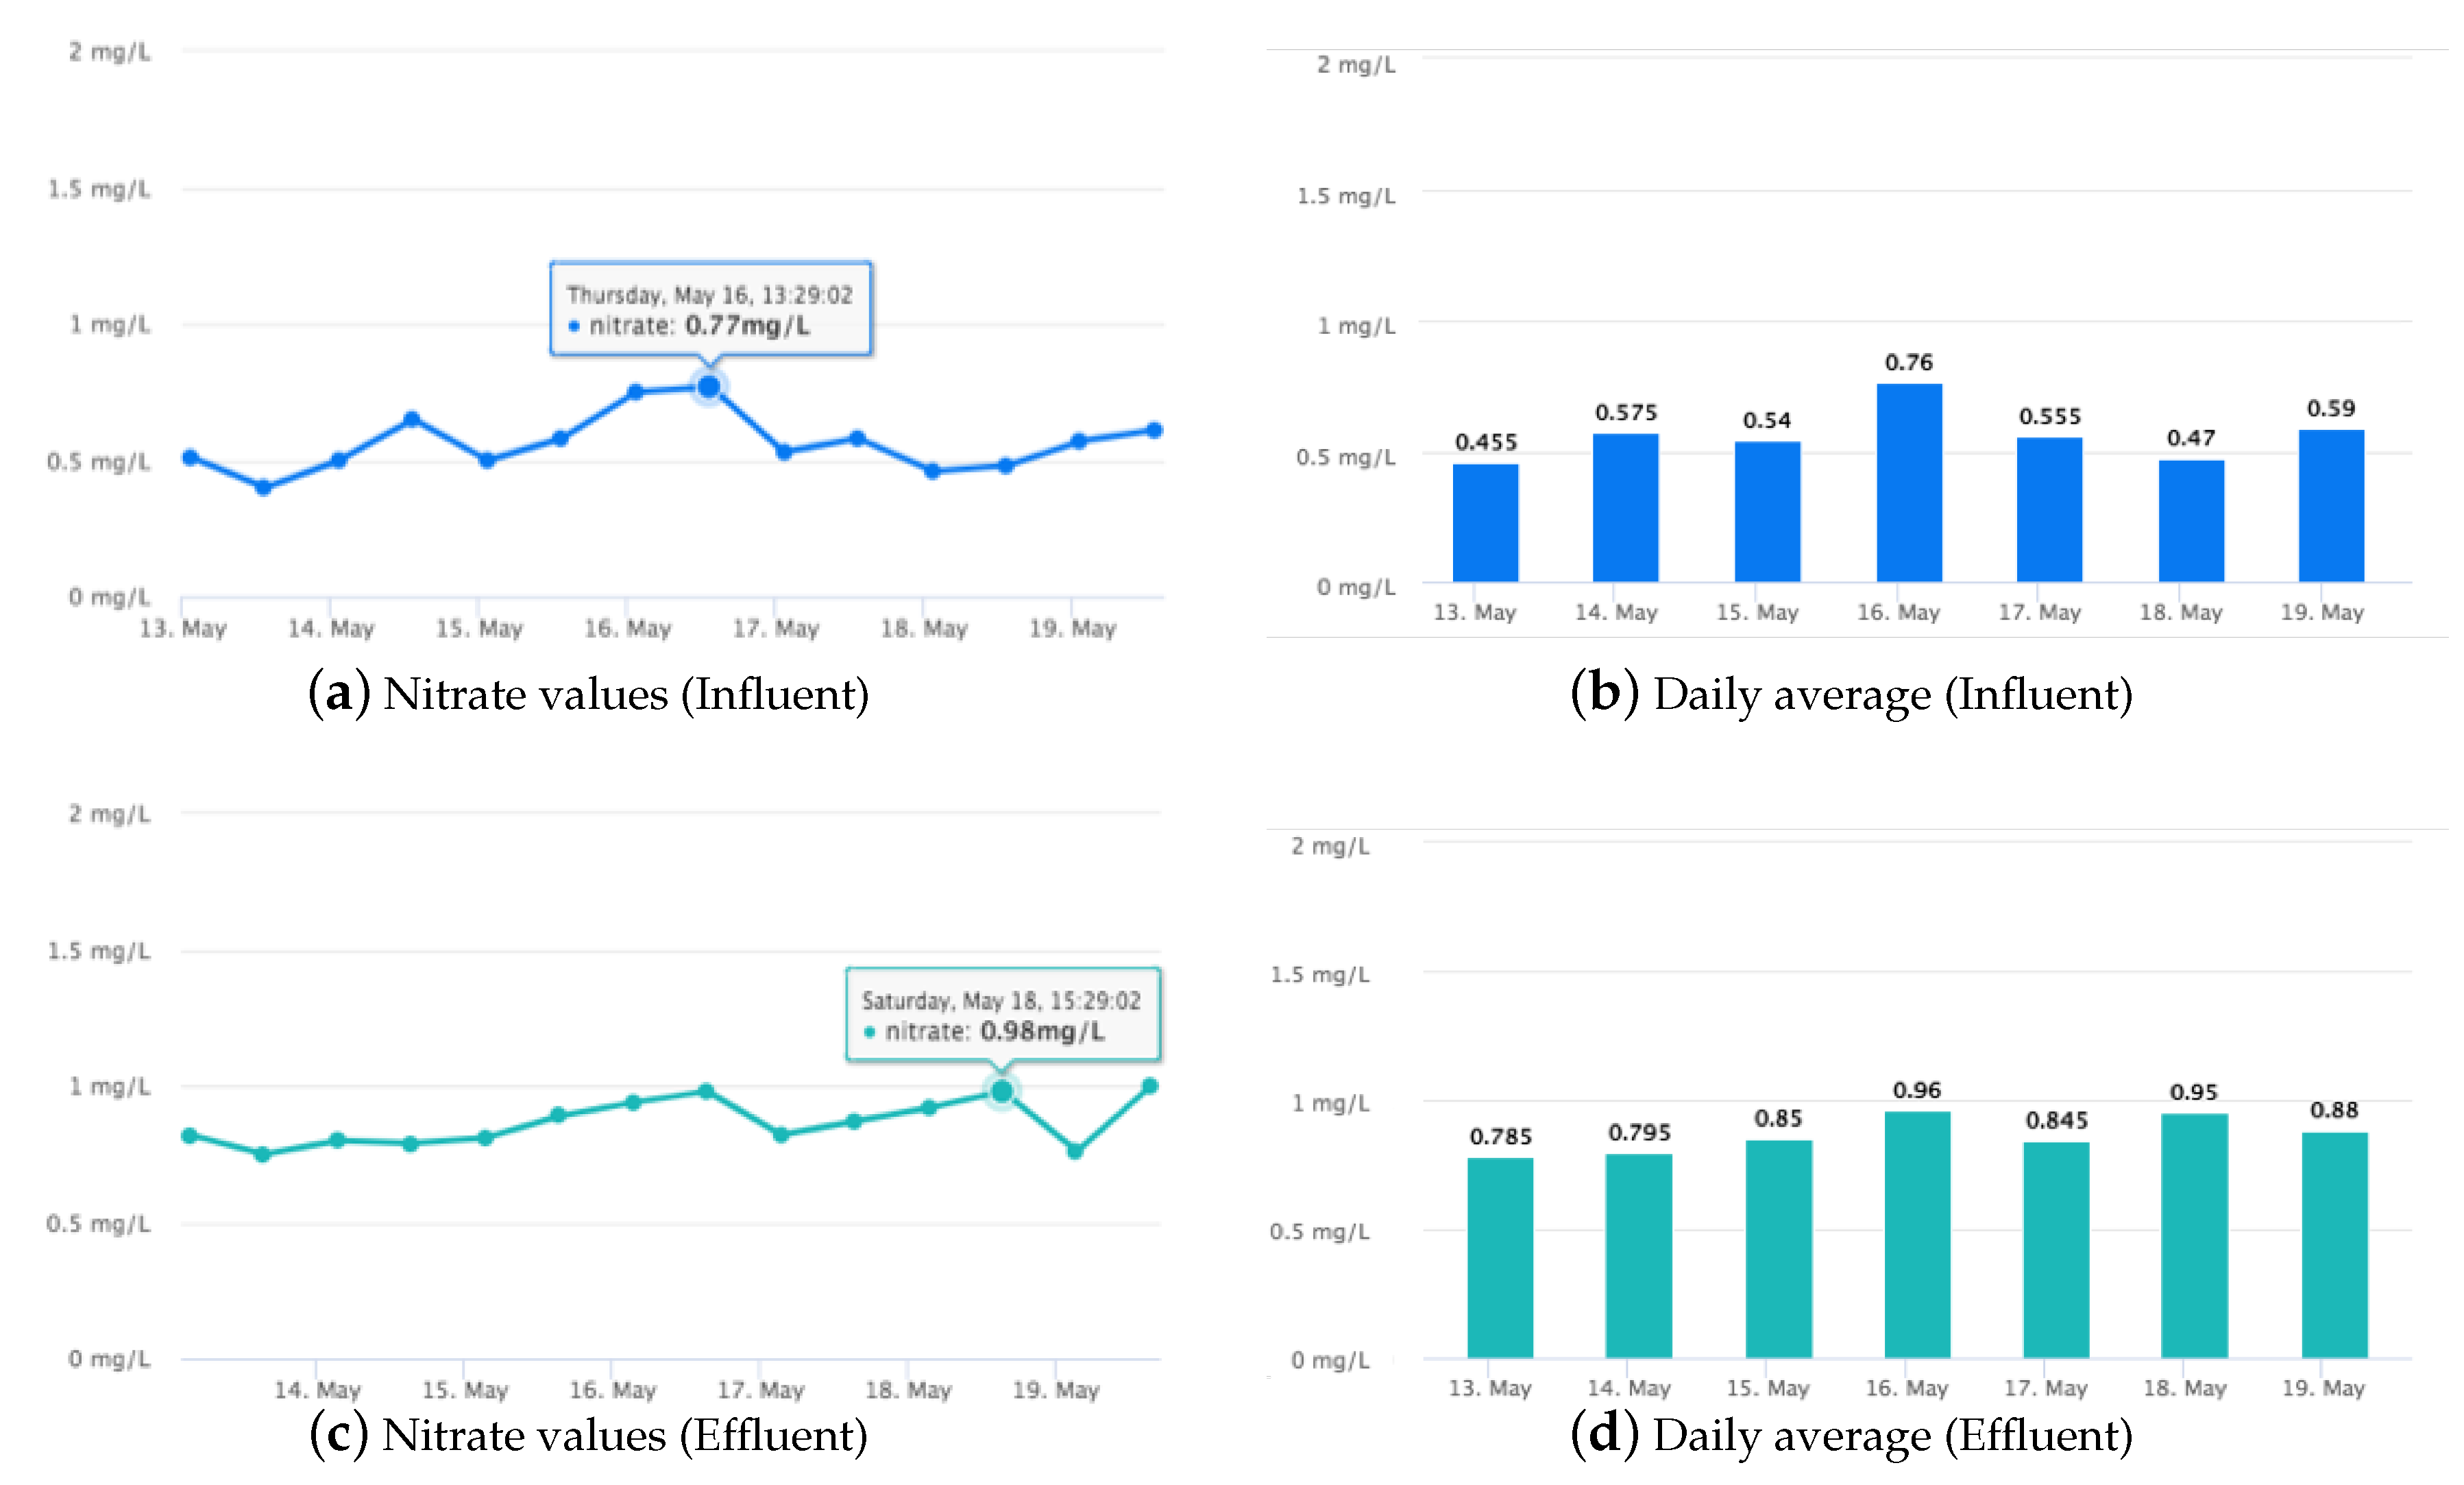
2.4.1. IoT System Demonstration in a Wastewater Treatment Scenario
The first experiment consisted of demonstrating the features implemented at the IoT application level. To do this, eight devices have been deployed in four WWTP located in the Region of Murcia (Spain): Alcantarilla, Molina de Segura, Los Alcázares, and San Pedro del Pinatar. A device has been placed at influent and effluent of each plant. During the test, devices have collected data related to nitrate and nitrite concentrations during the month of May 2019, twice a day, regardless of their location. This sampling frequency is appropriate for water quality monitoring applications, hence the term
near-real-time. Note that the sampling frequency for traditional manual water quality monitoring techniques is usually once a week. The data transmitted by the devices are captured, stored, analyzed, and finally represented through the user interface by means of different customizations that compose the IoT application hosted in the system platform. In
Section 3.1, all the customizations implemented in the integrated system are presented.
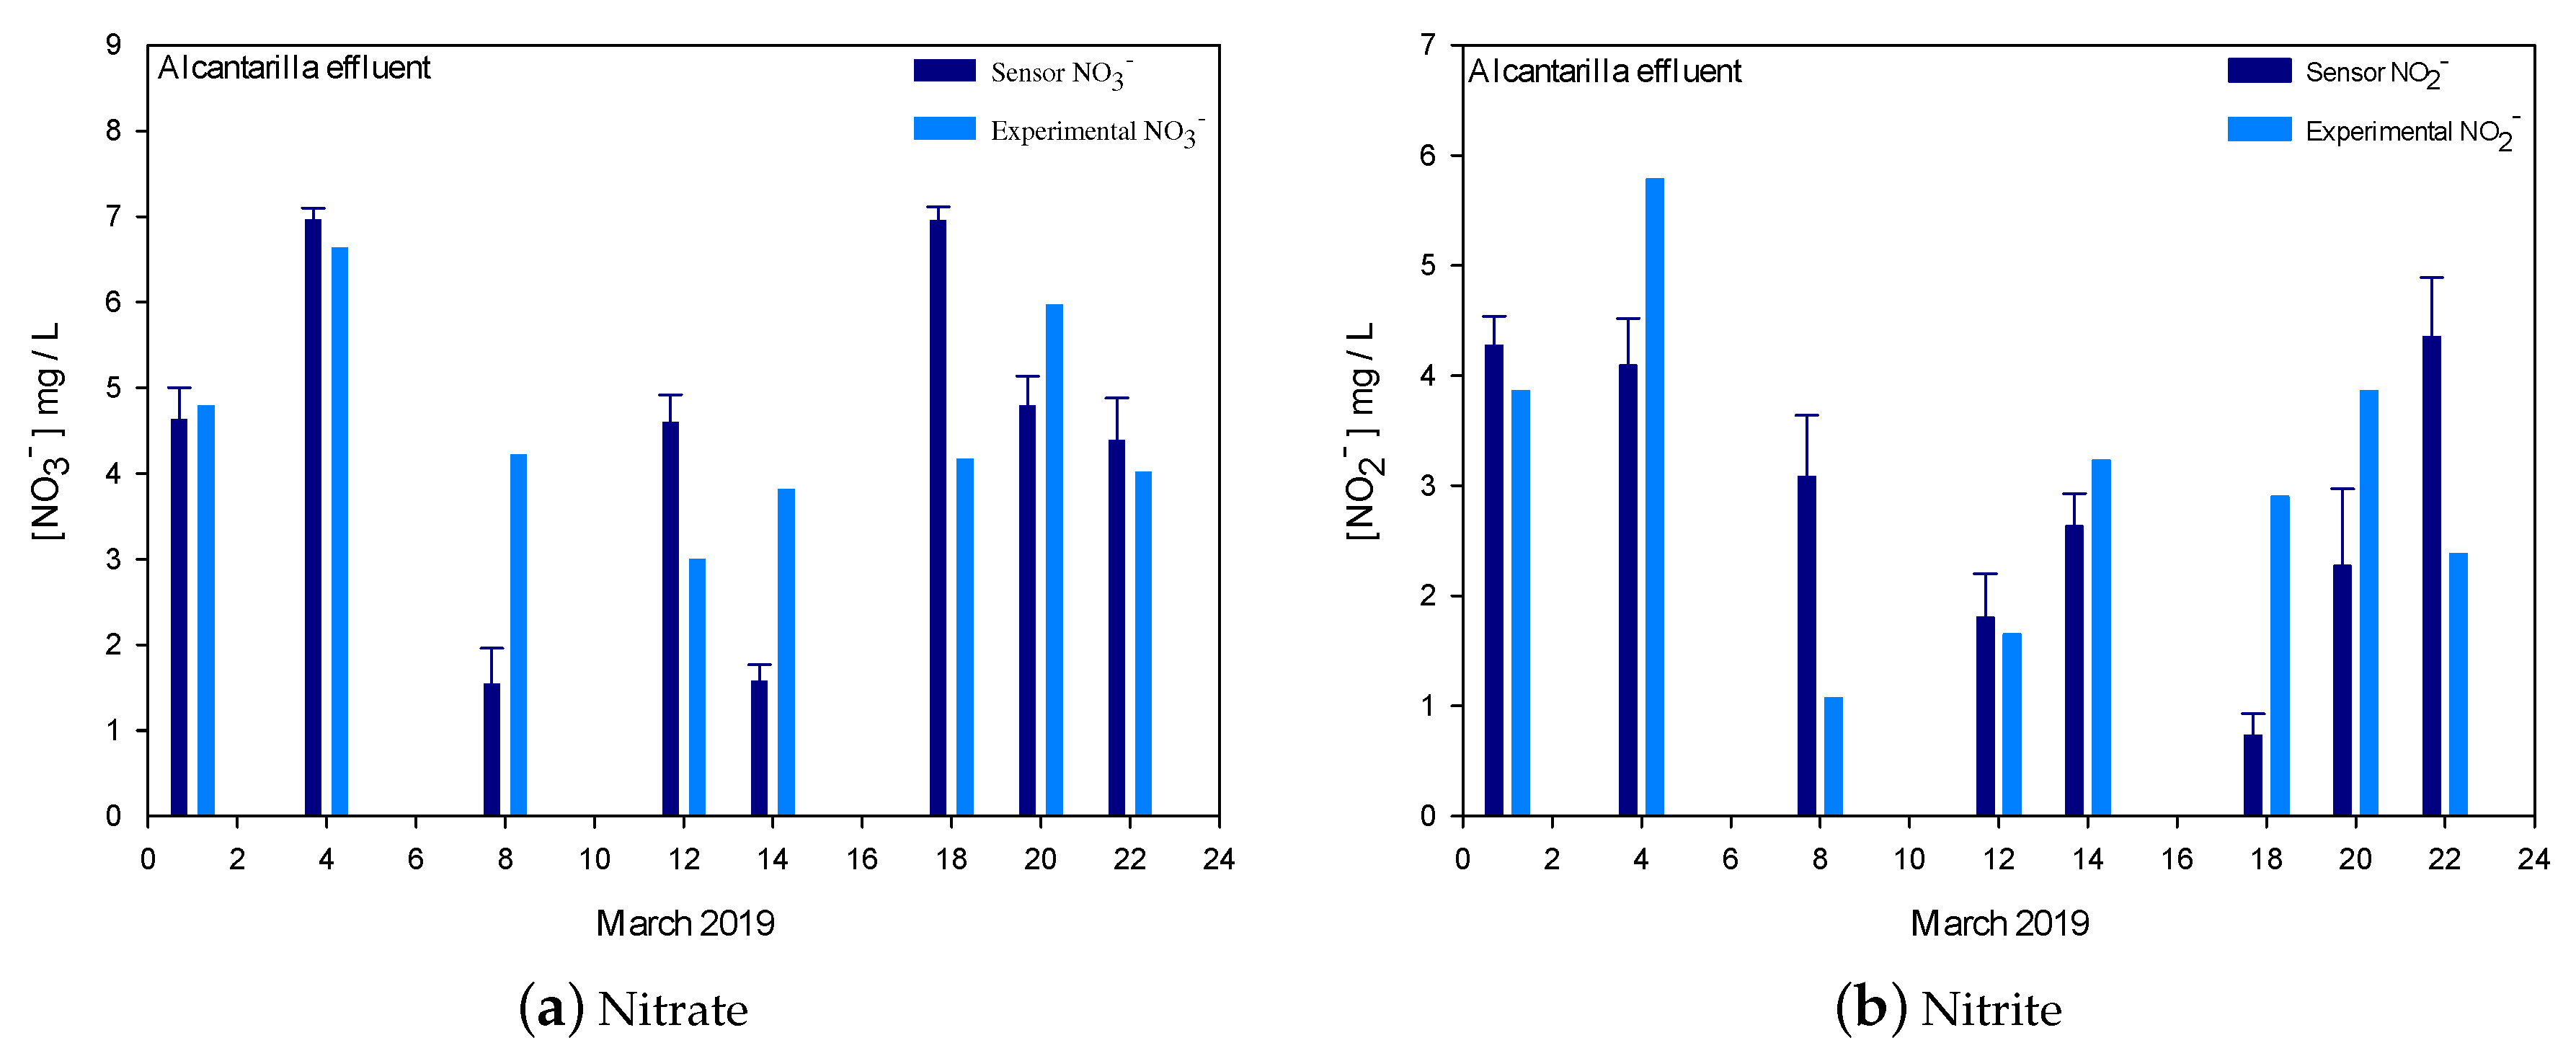
2.4.2. Detection Method Validation
The second experiment has focused on the preliminary validation in real conditions of the ion chromatography detection method in which the analytical device is based. To do this, nitrate and nitrite values collected by a device deployed in a WWTP and available on the IoT platform have been compared with experimental data analyzed in laboratory tests carried out with the usual procedures.
Sampling collection
The WWTP is located in Alcantarilla (Murcia, SE Spain) at the coordinates 37
55
39
N 1
14
28
W. This locality has an estimated population of 41,622 people in 2018. The plant has a design flow that exceeds 13,000 m
/day corresponding to 151,667 population equivalent. The treatment included the following steps; (i) mechanical pretreatment, (ii) aerobic biological process as secondary treatment with active sludge with double stage, (iii) coagulation and flocculation, and (iv) sand filter and disinfection with ultraviolet in closed pipes. The device was placed in the wastewater effluent (see
Figure 6).
The sampling procedure involved the acquisition of the analytical data obtained by the sensor daily (average value of 3 daily readings) and the analytical data obtained from 3 daily samples of effluent that were integrated and subsequently analyzed in the laboratory. The samples were stored at 4 C until further analysis. The sampling was carried out during the month of March 2019, and eight samples were compared in the following days 1, 4, 8, 12, 14, 18, 20, and 22.
Analytical determination by portable IC
The prototype analytical device is a portable ion chromatography (IC) system based on the method previously reported by [
14] as mentioned in the
Section 2.1. Therefore, the study parameters have been extracted from this paper. Concretely, these parameters are Limit of Detection (LOD), Limit of Quantification (LOQ), Range, Linearity, Repeatability, and Accuracy.
Analytical determination by standardized method
Nitrate and nitrite were analyzed using ion chromatography. Water samples of effluent were filtered through a Minisart® Plus syringe membrane filter (NY, USA). The available analytical standards for sodium nitrite, sodium nitrate, and sodium carbonate provided by Panreac (Barcelona, Spain). Distilled, de-ionized water (DDW, cm) was used in all sample preparation procedures.
The samples were injected into the IC system consisting of a Metrohm pump (Herisau, Switzerland) coupled by a transfer line to a Metrohm conductimetric detector (Herisau, Switzerland). The column used was Metrosep A Supp 7, Metrohm (Herisau, Switzerland). The injection volume was 20 L and the mobile phase flow (, 3.6 mM) was 0.7 mL.min. The anions were identified and quantified according to their retention times ( and for nitrite and nitrate, respectively).
Statistical analysis
The statistical software SigmaPlot version 13 (Systat, Software Inc., San Jose, CA, USA) [
57] was used to verify the correlation between the results obtained by the sensor and the experimental data, the average were compared by an hypothesis test (
p > 0.05).

 ,
, 


