Article

Water Consumption and Management in Schools in the City of Alicante (Southern Spain) (2000–2017): Free Water Helps Promote Saving Water?

by
Álvaro-Francisco Morote
1,*,
María Hernández
2,
Jorge Olcina
2 and
Antonio-Manuel Rico
2
1
Department of Experimental and Social Sciences, Faculty of Teaching Training, University of Valencia, 46010 Valencia, Spain
2
Interuniversity Institute of Geography, University of Alicante, 03690 Alicante, Spain
*
Author to whom correspondence should be addressed.
Water 2020, 12(4), 1052; https://doi.org/10.3390/w12041052
Submission received: 11 March 2020 / Revised: 28 March 2020 / Accepted: 3 April 2020 / Published: 8 April 2020
(This article belongs to the Special Issue Water Demand Management)

Abstract

:
Studies on water in cities usually focus on household consumption. However, little attention has been given to non-household consumption and schools from a geographic perspective. The objectives of this research are to examine water consumption trends in schools in the city of Alicante (Southern Spain) between 2000–2017, revise how water use is managed in these centers, and, lastly, examine initiatives aimed at environmental education and saving water in these schools. The results obtained from a survey of school directors indicate a low level of participation because only 14 of the 88 educational centres in the city chose to collaborate in this research. Second, and with regard to water trend consumption, in 2017, water consumption increased by 1.76% in comparison with the average for the period of 2000 to 2004, in contrast with a 38.9% fall in non-household general consumption in the city. Lastly, measures to encourage water saving and environmental education in schools are limited. This tendency is explained by the increase in the number of users over the last five years. Second, the water bill is not paid directly by schools’ directors and, thus, ‘free’ water is a factor that does not incentivise savings. A third is the little investment made in the installation of water-saving devices, water-saving plans, or action taken to promote the use of non-conventional water resources to the watering garden. Lastly, low promotion of environmental education or incentives for savings in schools.

1. Introduction

Water resources are vitally important for various economic sectors, administrative areas, and uses (for example, agricultural irrigation and supply for urban tourism) [1]. Demand is increasing and it is necessary to manage this resource in an appropriate and sustainable manner. This issue is important in urban areas with scarce water resources due to the need to guarantee the availability of water in sufficient quantity and quality [2]. Another focus of interest is climate change with increasing intensities of drought and growing water shortages in certain areas such as the Mediterranean where this study area is located [3]. In the case of Spain, regional modelling of rainfall and circulating water resources indicates growing water shortages south of the 40th latitude [4]. Therefore, factors essential for tackling these effects include better management of water resources and heightened public awareness about the importance of responsible consumption. This takes on greater meaning in the training and education of the children who will rebuild society in the future [5].
Environmental campaigns have a very direct relationship with the activities undertaken in educational centres to encourage savings and the efficient management of water resources, especially in regions with water shortages [5]. According to Cian et al. [6], school education is an important national foundation and deeply influences the development of society. In relation to environmental awareness, March et al. [7] indicate that perception and responses to drought and water shortages have been an important subject for social science research since the pioneering study by Saarinen [8] in the prairies of the United States. According to a review of water conservation campaigns, most studies have focused on assessing the immediate effects of water campaigns on consumption, but not the longer-term effects [9,10].
Internationally, research on water consumption in schools is relatively scarce. Traditionally, such research has focused on an analysis of the volume supplied to cities (household consumption) [5,11,12,13,14,15] and, to a lesser extent, non-household consumption, mainly for industrial use [16,17,18,19,20], and the tourism sector [21,22,23]. The literature on the determinants of household water consumption is extensive, beginning with the early case studies in the United States in the 1960s and 1970s [24,25,26,27]. According to March et al. [28], econometric studies in Europe on the determinants of household water consumption [29,30,31] means that there is an important body of literature centered on urban household water demand [32,33,34]. However, Zhou and Tol [35] explain that it is necessary to analyse water demand in various sectors separately due to the factors and processes that characterize each. Since 1960, there has been a significant increase in urban water consumption in developed countries, which reached record peaks in the late 1990s [13,36,37]. This has been due to a general increase in housing and associated population growth in cities and tourist areas [38,39]. However, since the end of the 1990s, there has been a decline in consumption in most urban areas in developed countries [5,13,40,41]. Nevertheless, relatively little is known about the trend in water consumption in schools at a European or international level, and, especially, from a geographical perspective.
Research on water consumption in schools has focused on topics related to an analysis of personal hygiene, environmental education, quality, and access to water in underdeveloped or developing countries. For example, such studies have been conducted in Zambia [42], Nigeria [43], Niger [44], Cambodia [45], Brazil [46], and Mexico [47]. Works carried out in developed countries related to water consumption are related to health issues by saving measures, user perception, consumption awareness, etc.). They have been carried out, for example, in Italy [47], USA [48,49,50], the UK [51], and Spain [52]. Therefore, in these studies, the expected impact of water use in the educational centres on an urban scale is not the priority aim.
The interest and innovation in this study lies in a series of points. First, there is a lack of literature on water consumption in schools, not only in the area studied (Alicante, Southern Spain) but also on a national scale. Second, after finding that, in most urban areas in developed countries, there has been a fall in water consumption, it is necessary to revise and verify the trend in schools. Third, this study is based on the use of water utility bills, which the water companies are generally reluctant to provide. The use of real data on water consumption in Spain, unlike other countries, is infrequent, due to the difficulty in accessing data. Such data is usually replaced by extrapolations and estimates based on survey data. Fourth, it is examined as the current state of awareness about water savings and awareness raising activities carried out in schools. Fifth, the price of water is understood as a deterrent that encourages savings [53]. The average price of water in Spain for urban consumption is €1.65/m3 (including water supplied, meter maintenance, sewage charges, and rate of water treatment levy). In the city of Alicante, this reaches €2.55/m3. This makes Alicante the city with the third most expensive water in Spain, only surpassed by Murcia and Barcelona [54]. Furthermore, the climatic characteristics of the study area and implications from the point of view of water resources. This is a semiarid region (311 mm/year) [55] dependent on water carried to the area by the Tagus-Segura Aqueduct (TSA) since 1979 [56]. However, in recent years, this dependence has been lessened by incorporating non-conventional resources (desalination) that guarantee supply even during times of intense and prolonged drought such as the last drought (2015–2019), and debate on demand management has widened recently to include the consequences of climate change and territorial resilience to drought [2].
As a hypothesis, it should be noted that, in a semiarid area such as the city of Alicante, where drought is considered a recurrent and inherent hazard, it must be added as the effects of climate change, which means more intense and frequent droughts. Therefore, educational centres should adopt measures to reduce water consumption (sustainable management), but also adopt initiatives encouraging environmental awareness for students. This would produce a reduction in water consumption and students would become more aware about the proper use of water. The objectives proposed in this paper are: (1) examine water consumption trends in schools in the city of Alicante (Southern Spain) for the period 2000–2017, (2) revise how water use is managed in these schools, and (3) examine initiatives aimed at encouraging environmental education and water saving in these educational centres. This research adopts a geographical and social approach in which different study cases have been taken into account. Therefore, it is a descriptive and exploratory research and what matters is to deepen the measures and water management in these educational centres that have participated in the study.

2. Materials and Methods

For this research, it has been used data from various sources: (1) a survey of school directors of the city of Alicante (2017), and (2) data on annual water consumption for the educational centres that participated in the survey (2000–2017).

2.1. Survey

This is a mixed descriptive and exploratory study (not experimental). It should be noted that the design is comprehensive because the information was obtained from participants in 2017.
The participants were the school directors of the city of Alicante (Southern Spain) (Figure 1). The selection procedure was a non-probabilistic sampling (available or convenience sampling) and including both primary (6–12 years) and secondary (13–18 years) schools in the city (there are generally three types of schools in Spain: public, charter, and private). There are 88 educational centres in the city [57]. To calculate the representativeness of the sample, a confidence level of 90% and a margin of error of 10% were selected. The representative sample should be 39 centres. The questionnaire was sent to all schools’ directors. After three attempts per school (carried out between September–December 2017), only 14 directors agreed to participate (all public schools) (response rate: 35.9% of the representative sample), of which 8 were primary schools and 6 were secondary. When revising the results, all have been grouped together as there were no significant differences between them in size or number of students, constructive typologies, or outdoor uses that made it necessary to disaggregate the study by primary or secondary schools. A visual control test in relation with the school’s facilities (plot, green areas, etc.) was also carried out, including some that refuse answering the surveys in December 2017 (from the street and satellite photos) to verify the non-existence of differences between secondary and primary schools.
The response rate was low despite the school directors being contacted up to three times. This may determine the representativeness of the results. However, given the lack of studies of this subject area, the study remains worthwhile as an exploratory research. In addition, this reduced response rate shows the little interest shown by school directors—even less being shown by private and charter school directors since no one responded, and the subject of this research is not a priority for educational centres. Both possible answers are considered relevant information for drawing conclusions about the importance of managing water in the city’s schools. In this regard, a compilation was made of the responses of directors for justifying their non-participation (see Section 3.3.). Likewise, it was also necessary to obtain the consent of them to access the consumption data held by the water company (Aguas Municipalizadas de Alicante, Empresa Mixta) (AMAEM). While the directors were told that this data would be treated anonymously, this may also have added to an unwillingness to participate in this research. It should be highlighted that this research takes a geographical and social approach. Therefore, statistical analysis is limited and not a priority objective. What matters is to deepen the knowledge of the measures and the management of the water resource that is carried out in these educational centres that have participated in the study.
The process of gathering information consisted of a questionnaire without manipulation or intervention by the interviewer. The questionnaire was divided into four parts with a total of 26 items and including: (1) characteristics of the school (5 items), (2) water use and management (4 items), (3) characteristics of gardened spaces (5 items), and (4) perception of water consumption and efforts to encourage savings (12 items). Answers involved ended the “answer-question” portion and rating an item (Likert scale) (Table 1). The questionnaire was validated by (1) two researchers from the Department of Didactics of Experimental and Social Sciences (University of Valencia, Spain), and a researcher from the Department of Regional Geographic Analysis and Physical Geography (University of Alicante, Spain), and (2) two engineers from the water company. The questionnaires were intended for the school directors. All the participants answered all the questions and the anonymity of participants was preserved during the entire procedure and confidentiality was guaranteed in writing.

2.2. Data Supplied by the Water Company

AMAEM is owned equally by the Alicante city council and a private company—Hidraqua, Gestión Integral de Aguas de Levante S.A., a subsidiary of Aquadom (Suez Environnement). Under the supervision of the public partner, Hidraqua enjoys ample autonomy in technical decision-making [40]. According to the World Bank, Alicante became, in 1953, the first international example of a successful water company with mixed (public and private) capital under the name of ‘Aguas de Alicante’ [58].
This company supplied the water consumption data for the schools that participated in the survey for the period 2000–2017 (litres per day) [59]. AMAEM also provided global consumption data for the city (household and non-household) for the same period in order to enable a comparison with other users. The third type of information provided was the price of water (€/m3) in accordance with the different blocks of consumption applicable in the city for the period of 2007–2017. This term was selected because: (1) it coincides with a period of marked decline in urban water demand after 2004–05 (city of Alicante), (2) 2008 was the year when the economic crisis hit Spain, (3) 2017 is the last year for which a full set of consumption data is available (survey date), and (4) these dates enable a comparison of water consumption before and after the economic crisis (which, from the macroeconomic point of view, ended in 2016).
Working with real consumption data presented a number of advantages over other methods—such as analyses based on data extrapolation or consultation of information provided by statistical agencies such as the Spanish Institute of Statistics (INE). For example, such data yielded access to information not available from conventional statistical sources, which do not disaggregate consumption data beyond large categories (urban, industrial, and agricultural). The data examined was also more accurate and reliable than that obtained by statistical analyses of a small number of real values.

3. Results

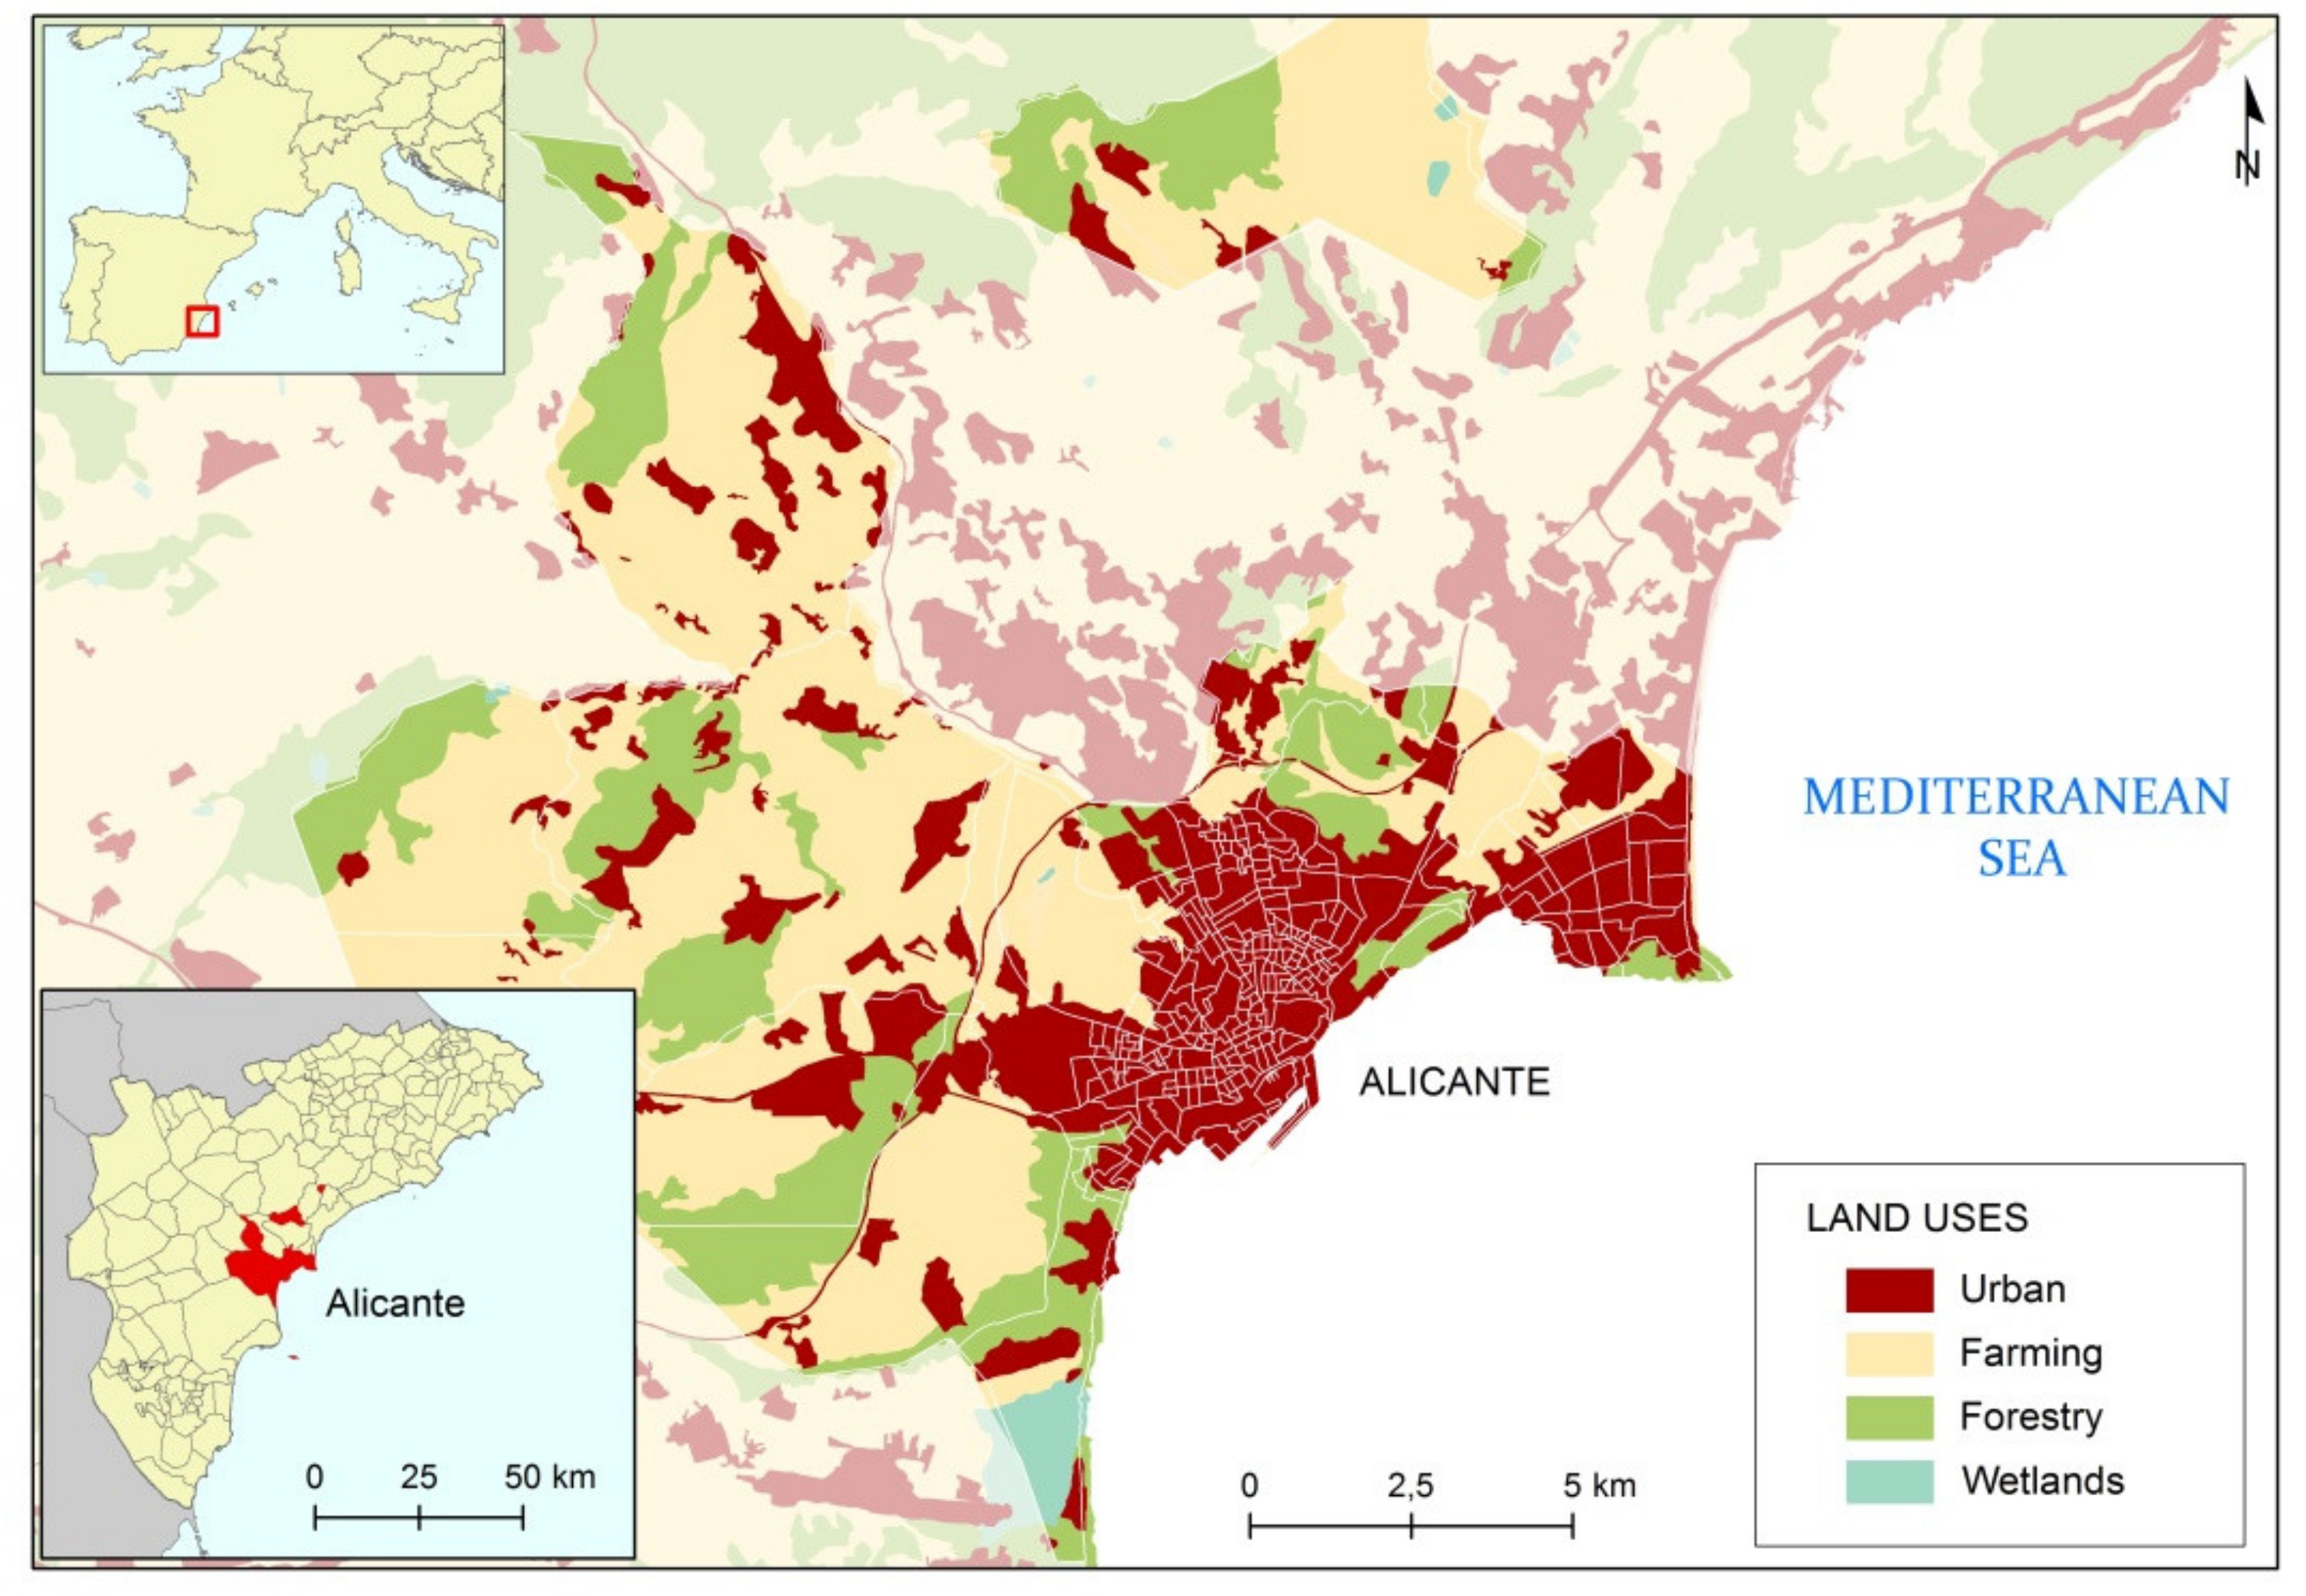
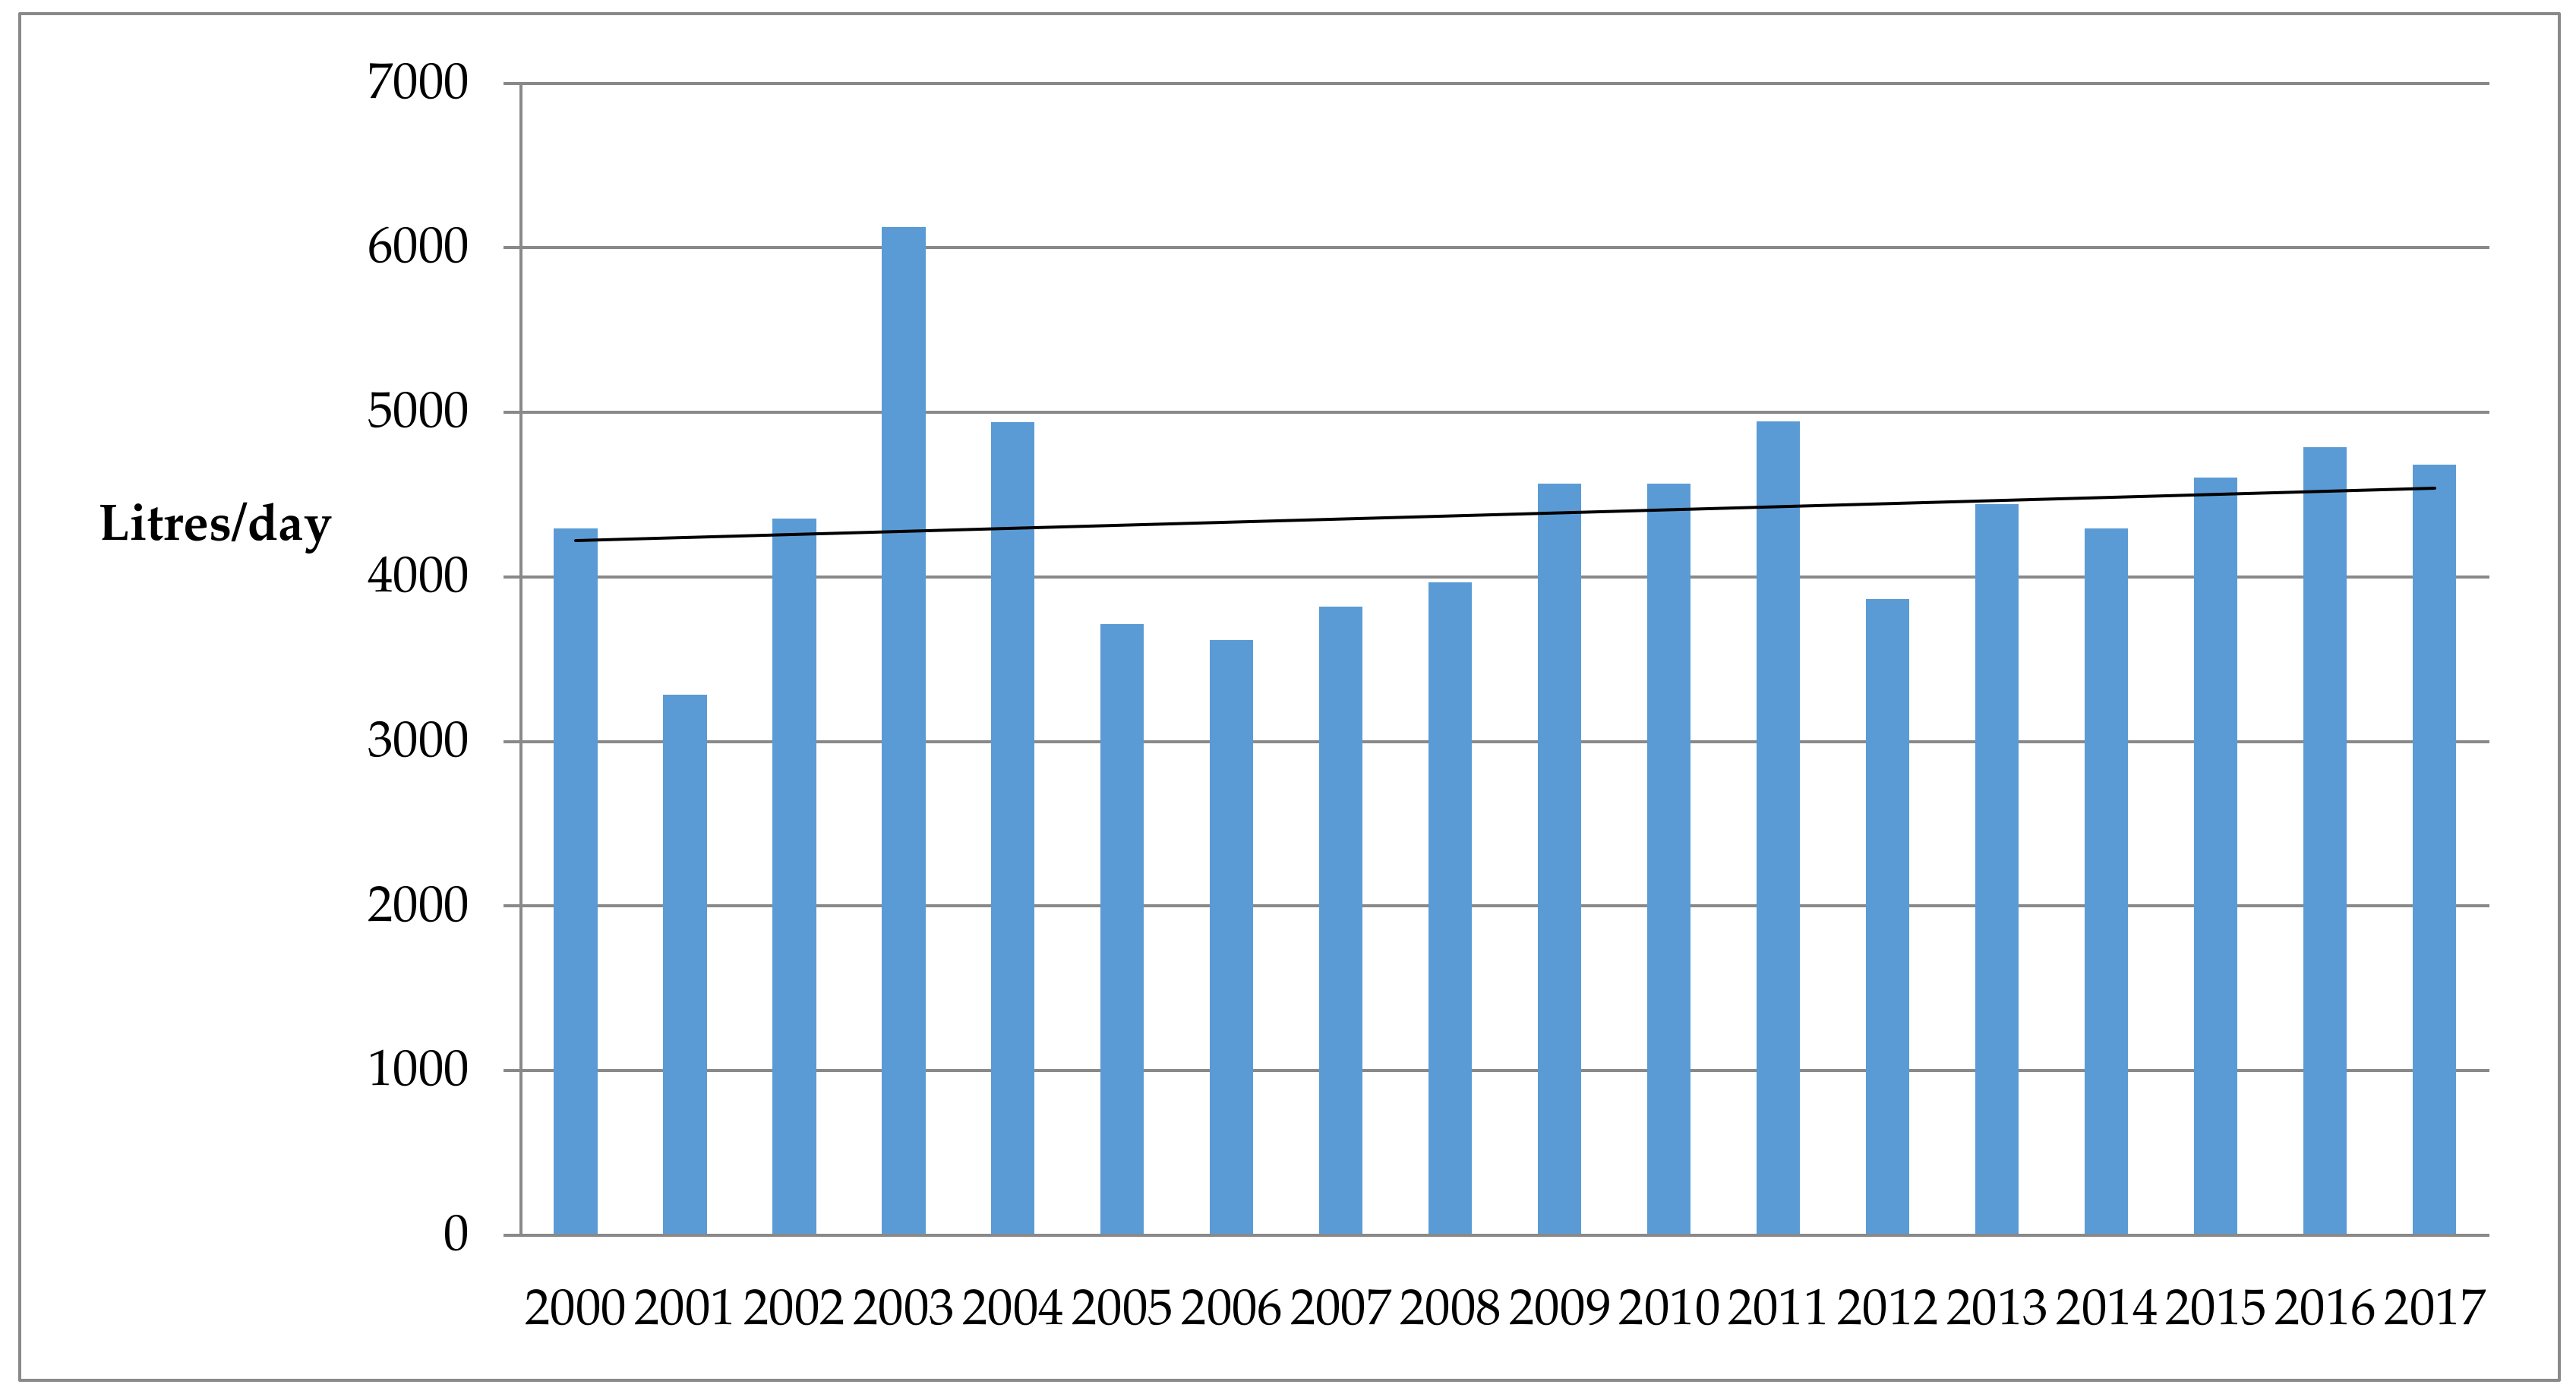
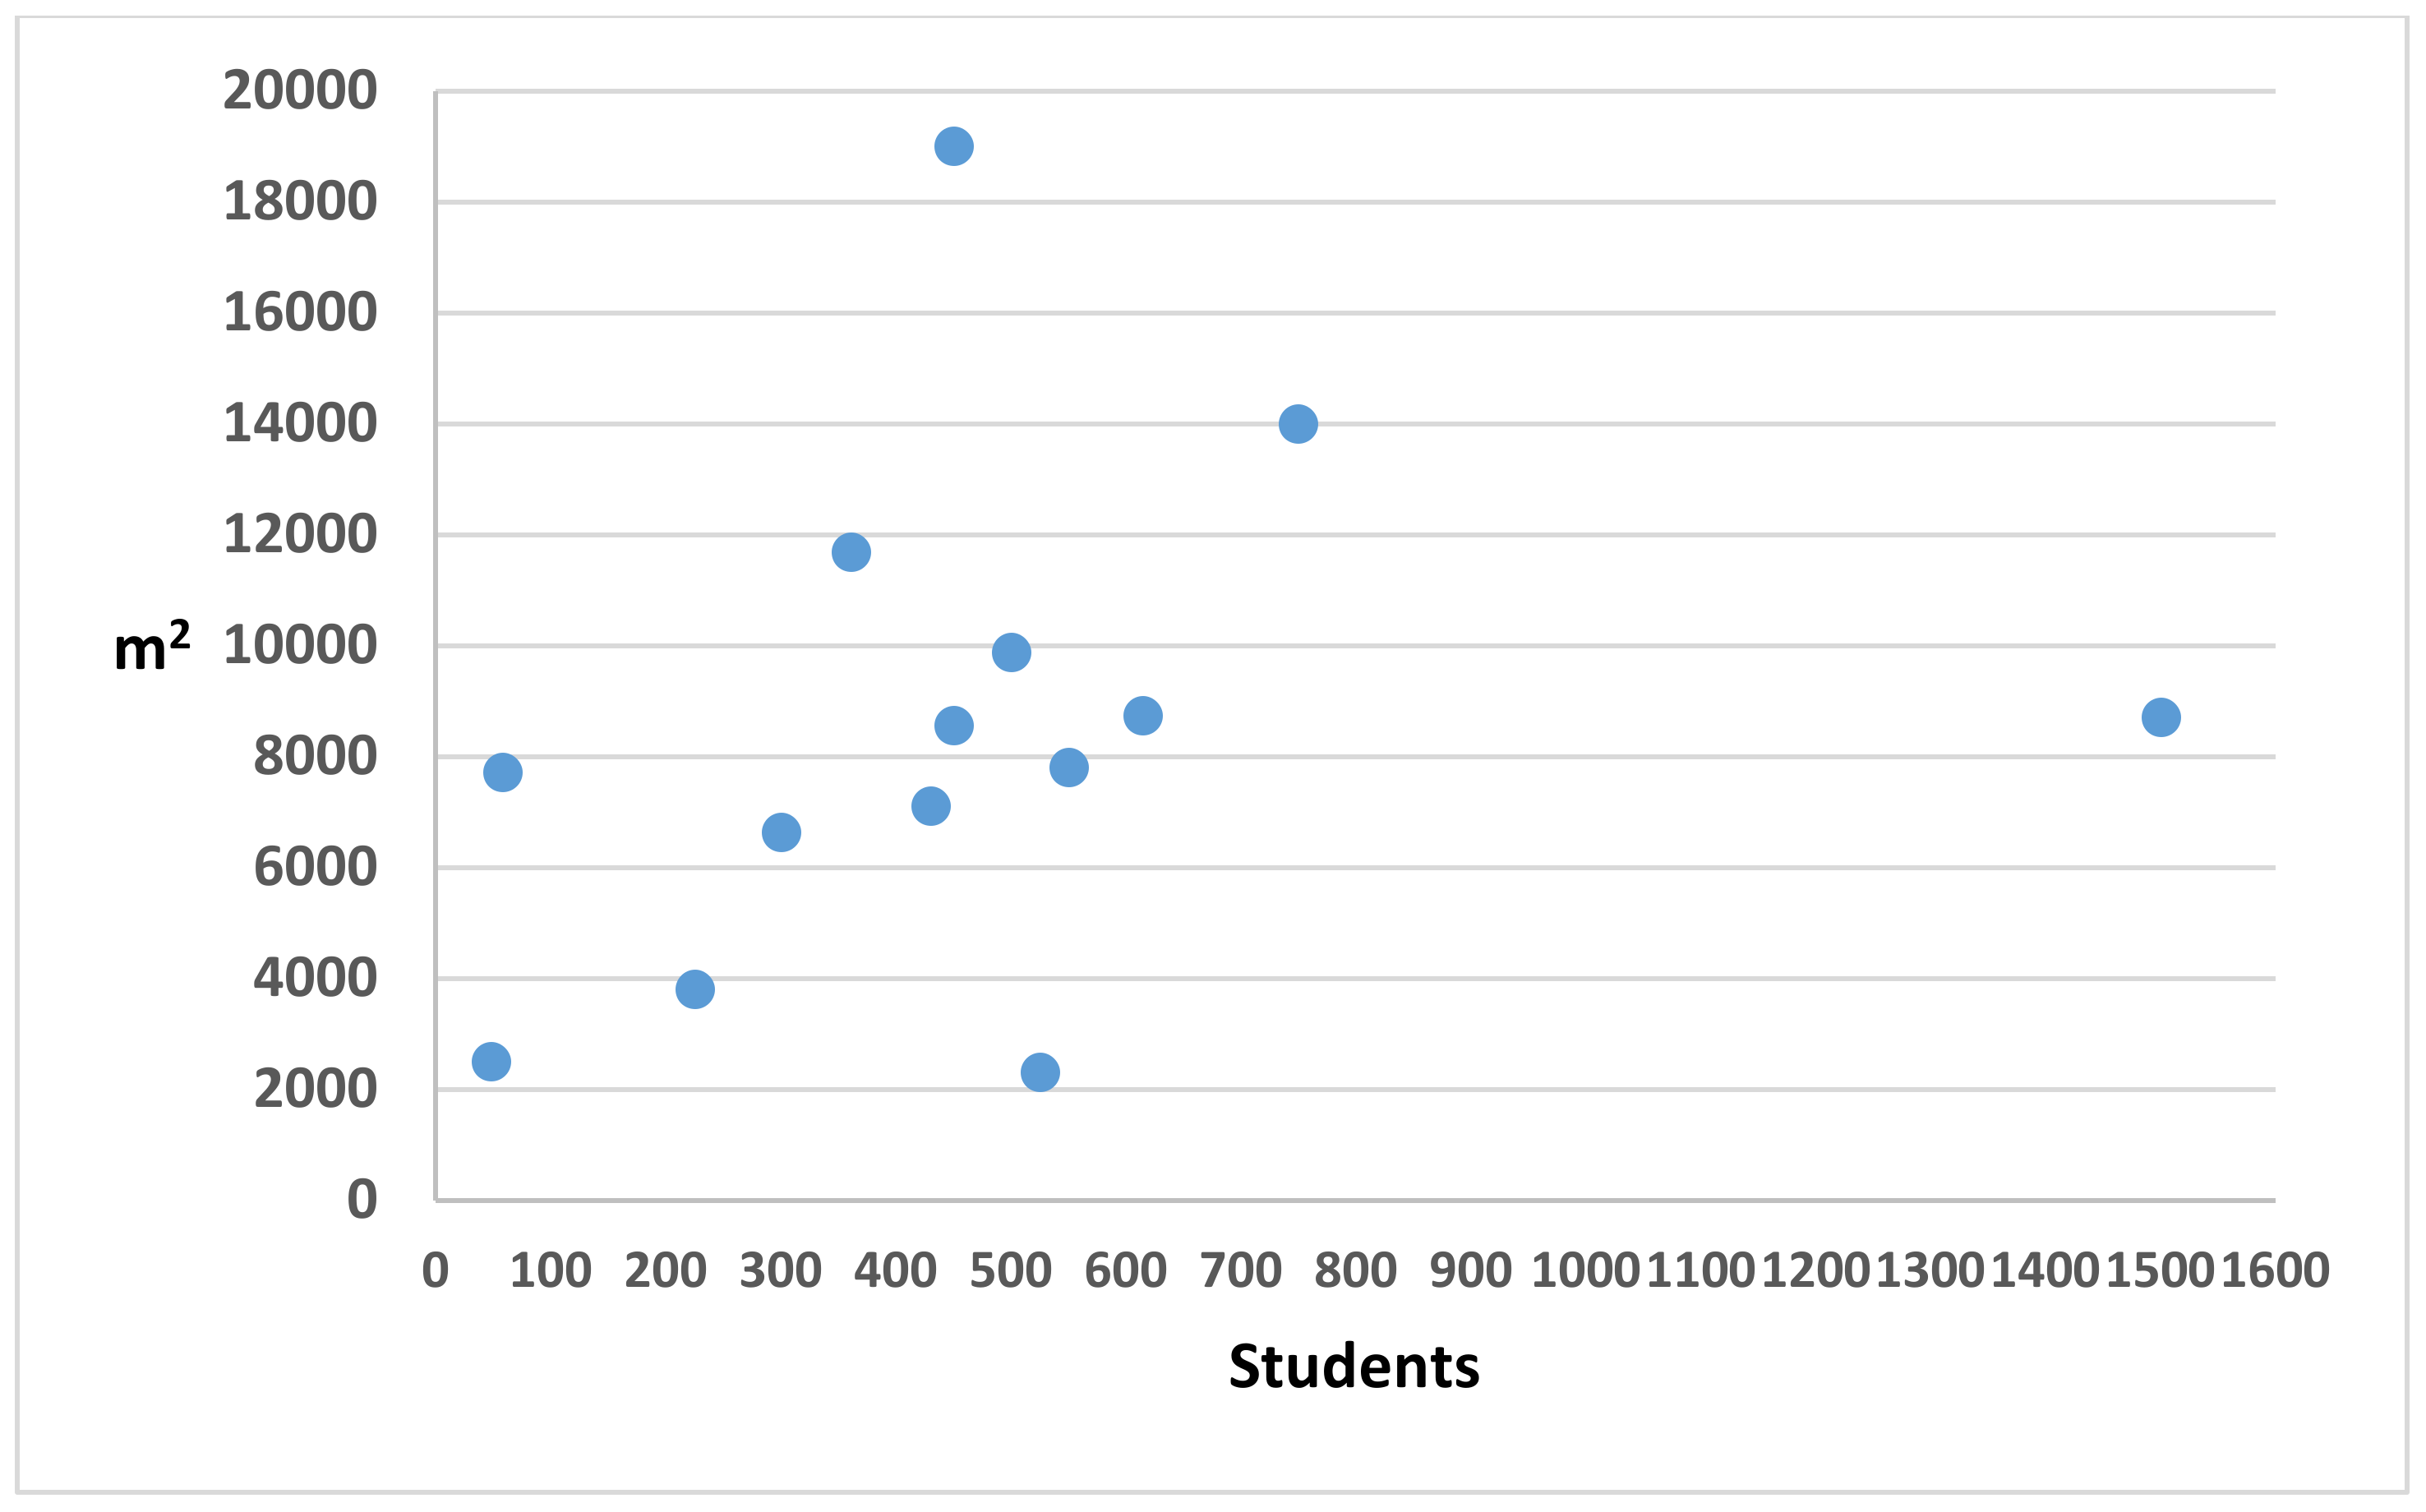
3.1. Water Consumption in Schools in the City of Alicante (2000–2017)

To examine water consumption in schools in the city of Alicante, it is necessary to previously obtain the general trend of the city’s water consumption (both household and non-household). Household consumption between the period 2000–2017 fell by 7.3% (from 15.58 hm3 to 14.43 hm3, 154 l/inhabitant/day to 120 l/inhabitant/day). For non-households (mainly: commercial, industry, public administration, and hotels) the decrease was 38.9% (5.59 hm3 to 3.41 hm3, 931 l/subscriber/day to 654 l/subscriber/day). For non-household users, it is also necessary to disaggregate users given their diversity (public or private). Thus, the trend in private companies was downwards (−58.42%) compared to an increase in consumption by public organisations (15%) for the watering of public gardens and street cleaning (28.35%). The fall in consumption by private users has been mainly motivated by the economic crisis (2008), which produced a reduction in activity, fewer employees, and the closure of companies [5]. Increased public use (city hall and public administration) is explained by the construction of new municipal buildings. The increase in consumption for watering gardens and street cleaning is the result of the building of new gardens and roads during the last housing boom (1997–2008) [2].
Three periods are observed regarding the trend in water consumption in schools that participated in the research (see Figure 2). The first period (2000–2004) is characterised by an increase in consumption (average of 4599 litres/day), which coincides with the general increase in the city [14]. The second period (2005–2011) is characterised by a notable decrease, but with a slight increase in the last several years of this period (average of 4,170 litres/day), but always below the first term. This second period coincides with the worst years of the economic crisis when the general consumption trend in the city was falling [5]. In the third period (between 2012–2017), average consumption in schools is lower than the first, but the trend is not entirely clear (average of 4445 litres/day). This review reveals two considerations: (1) Average consumption in the third period compared to the first fell by 3.3%; (2) However, if consumption in recent years (since 2015) is considered, it is significantly higher than the average for the other periods. For example, for 2017, (4680 litres/day) consumption was 1.76% higher than the period of 2000–2004. This does not seem to be a very significant increase, but it does acquire significance when it recalled that the city’s water use decreased during this period (household by 7.3% and non-household by 38.9%). The trend line in Figure 2 shows that the general trend of water consumption in schools in the period analysed (2000–2017) is slightly upward, despite many “saw teeth.” Although it presents a low increase (1.76%), this percentage is noteworthy because it is positive, which contrast with other urban water uses (both household and non-household) that have registered high decreases. For example, while households and the rest of the non-household sector in the city of Alicante showed a negative trend (−7.3% and −38.9%, respectively), school water consumption increased between 2000–2004 and 2012–2017.
One of the queries in the questionnaire (item 15) was aimed at discovering the perception of the trend by school directors. Although there is an increase in recent years compared to the first period (2000–2004), the results reveal that the directors are unaware of this trend in their water use. In this regard, five directors replied that they did not exactly know the level of consumption, four said that consumption levels were steady, three thought that consumption had increased, and two that consumption had fallen.
The various water uses within the school depend on factors such as the number of students, employees (mainly teachers), outdoor spaces that are watered, type of gardens, efficiency of the watering systems, use of water-saving devices, size of surfaces that need cleaning, and more. This upward trend, among other factors (see Section 3.2) may be associated with an increased number of users (students and employees) (Table 2). In most educational centres (nine schools), the number of students has increased (item 2) while student numbers fell in only one school. Staff numbers have increased or remained steady in six schools, while only two centres registered a fall in staff (item 4).
The average daily water consumption of the schools in 2017 amounted to 4,680 litres (absolute date), while average water consumption per capita is 7.34 litres/user/day. This value has been obtained by dividing water consumption by the average number of students (579 students) and staff (58). The highest consumption recorded is 9331 litres/day (1 school with 14,000 m2 of plot and 750 students), while the lowest corresponds to a school with 1443 litres/day (1 school with 2307 m2 of plot and 525 students). Given the diversity of the educational centres that participated in the research, they were grouped into several categories (depending on the number of students and the size of the plot), as there may be synergies associated with economies of scale that could enable minimising some consumptions (Table 3). In percent values (litres/user/day), it can be seen how consumption is higher in those schools where the number of users is lower (less than 500 students) (16.17 litres/student/day) and consumption is reduced considerably per capita in those schools with more than 1000 students (4.32 litres/student/day). If water expenditure is considered according to the size of the school plot, then the highest consumption corresponds to the schools that have larger areas (0.66 litres/m2/day) and this highlights that smaller ones (0–2500 m2) have a slightly higher consumption than those sized 2501–10,000 m2.
Among the various variables that affect this relationship (consumption and size), it is necessary to mention the number of students and the size of the plot, the size of the gardening areas, or the type of vegetation. This fact is inserted within the framework of the economies of scale that determine that the higher the number (in this case, students), the result of any relationship is lower (in this case, the water consumption) (Figure 3). Schools that have less than 500 students match with those that have a higher consumption per student (16.17 litres/student/day). Additionally, sometimes, they match with those with the largest plots and with more gardening areas and even by the percentage of grass. On the other hand, this relationship is not so evident in larger centres. As an example, we can indicate that the school that has more students (1 school with 1,500 students), consumption amounted to 6493 litres/day in 2017. Its consumption (in absolute terms) is not the highest, nor is it the one with the most plot area. Its plot is 8700 m2. In this case, the peculiarity is that the garden has no grass. One of the keys to understand water consumption is the presence or not of grass that triggers water consumption.
Considering that the price of a cubic metre of water in the city of Alicante amounts to €2.36 (for users of more than 61 m3 per quarter), the average water bill using data from 2017 reaches up to €544 per month (€6539 per year) for educational centres with a high level of consumption (more than 5000 litres a day). It also falls to €106 per month (€1276 a year) in those with less consumption (less than 2000 litres/day) (Table 4). The school with the highest consumption in this study spend 9331 litres/day. This represents an annual total of €8037. In the case of the school with the lowest consumption (1443 litres/day), the annual water bill would be €1243. However, in the case of the city of Alicante, the water bill for primary schools is paid by the city council while the Valencian regional government pays the water bills for secondary educational centres.

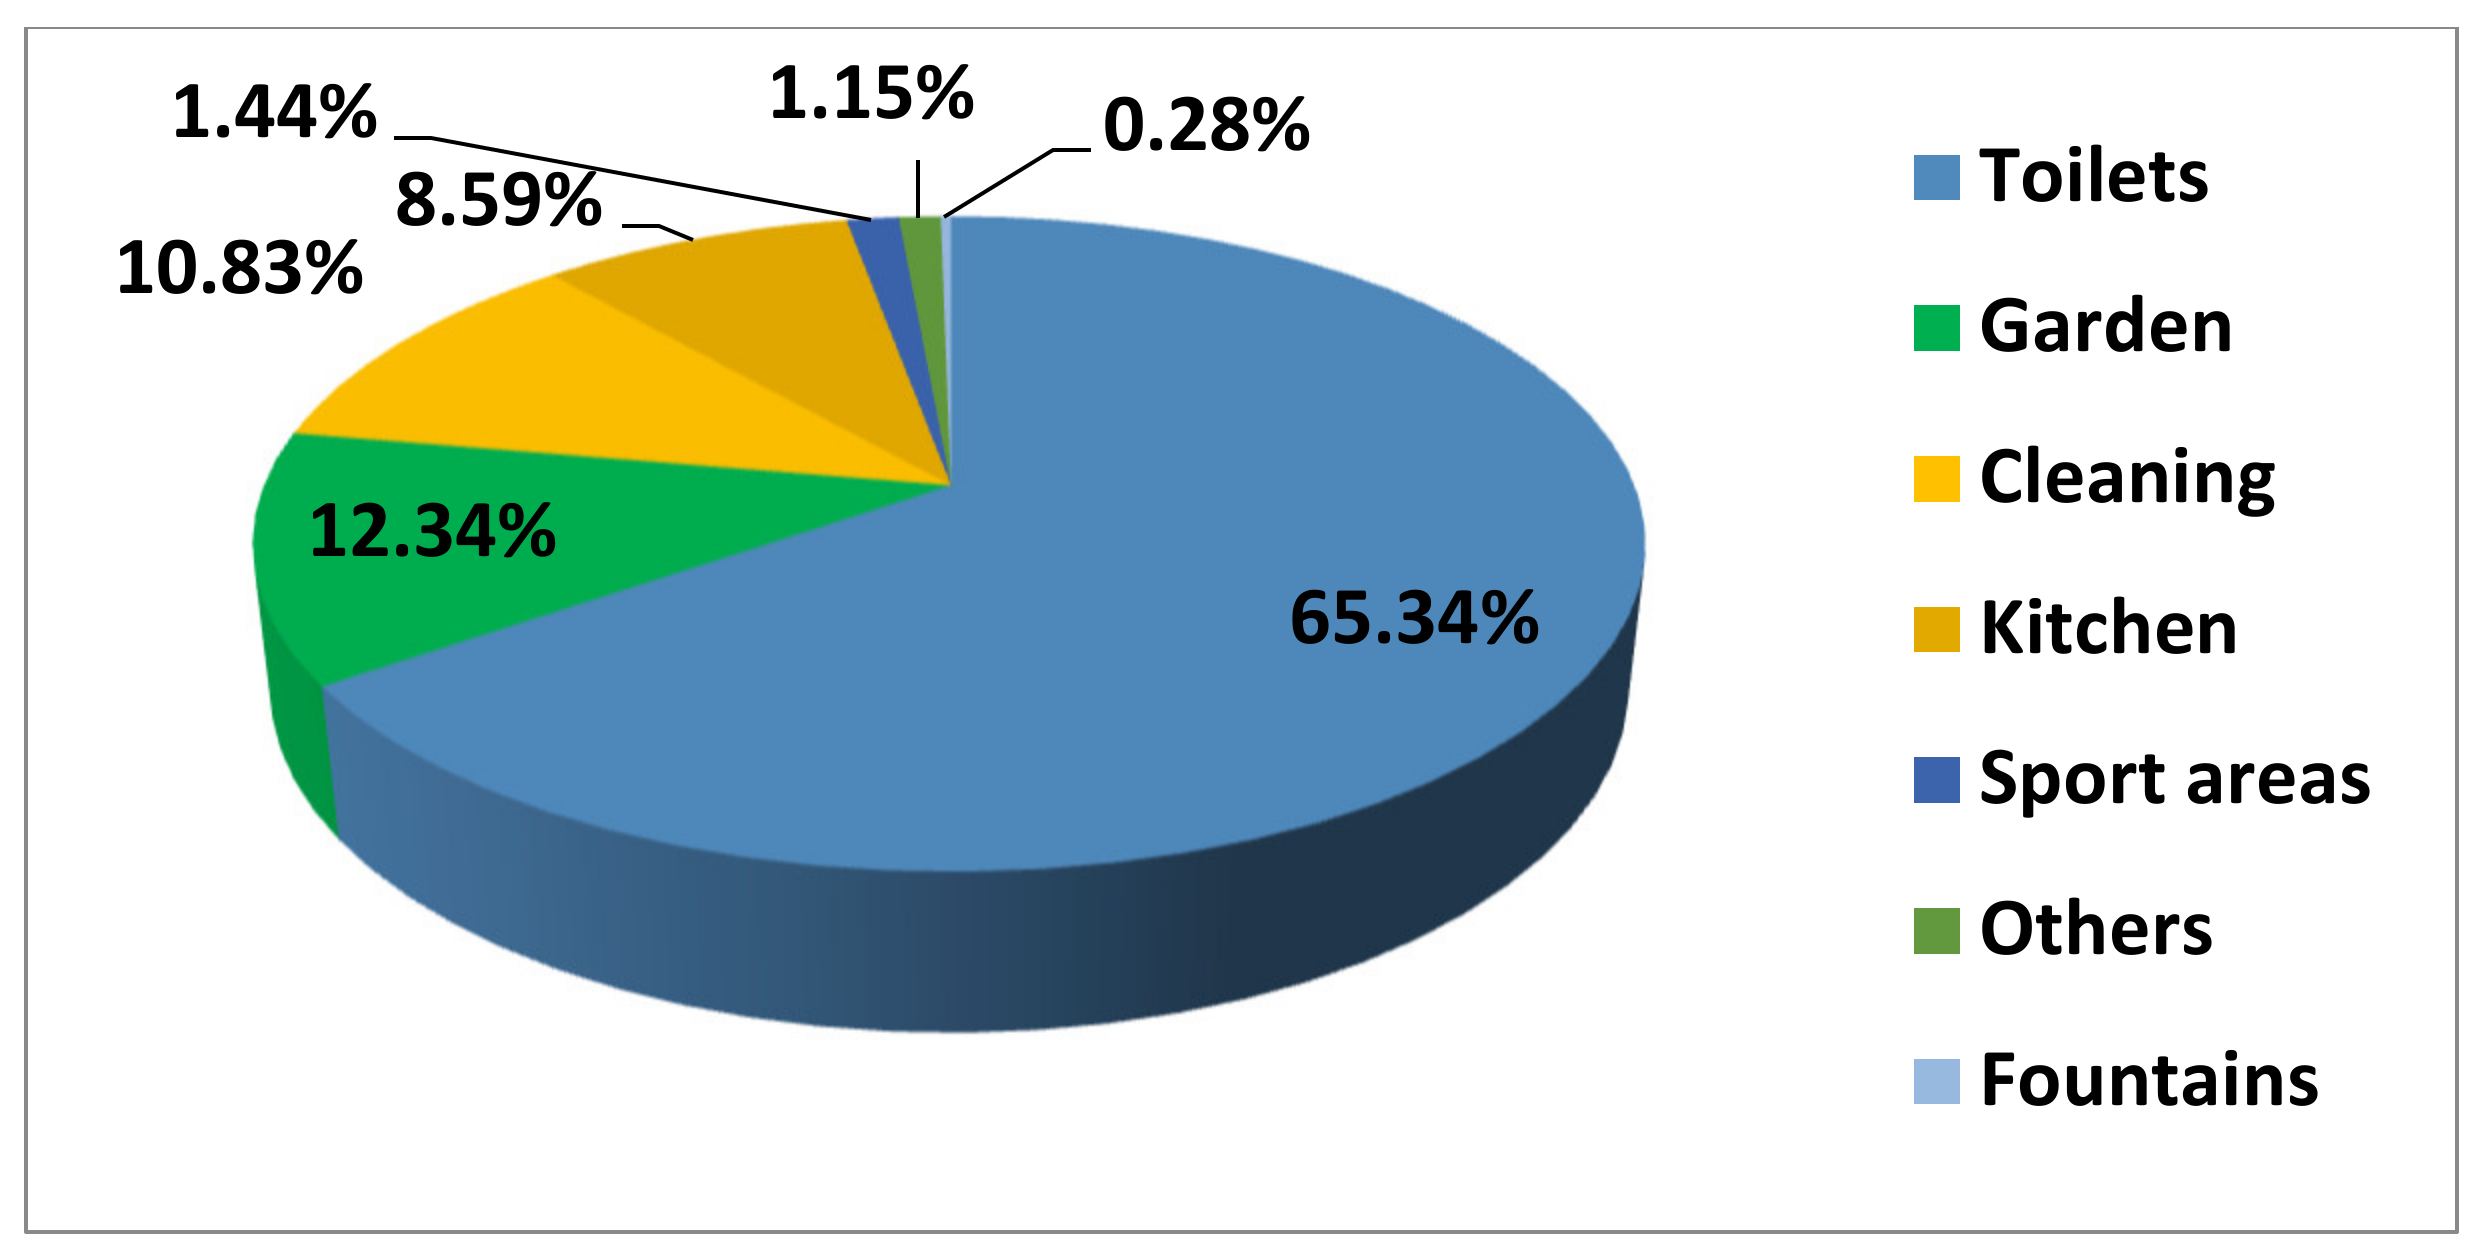
3.2. Management and Water Use in Schools

Responses related to water use (school directors were asked about the place and the use where more water was consumed–item 6) reveal that most of the water used in schools is used in the toilets (65.34%). A smaller percentage is used for watering the grounds (12.34%), cleaning (10.83%), or in the kitchen and canteen (Figure 4). Regarding the systems and elements (item 7) that consume most water (Table 5), the first three in order of volume are: (1) taps, (2) toilet bowls, and (3) the dishwasher. Most educational centres use the same amount of water for cleaning as in previous years (11 schools) (item 8).
The second largest use of water in schools is for watering green areas (12.34%). When revising this concept, it is possible to consider the different factors that will have an impact on consumption such as: total gardened area, type of vegetation, gardening skills, watering systems and efficiency, origin of water used, and climatic conditions (dry or wet year). The climate generates significant variations between educational centres and between years.
The average size of the gardened spaces (item 5) is 1269 m2 or 15% of the land size (8457 m2). The space for the school building represents 46% of the land (3909 m2), while the remaining space (39%, 3279 m2) is for playgrounds, parking, sports activities, etc. The total plot size of the schools observed ranges from 19,000 m2 to only 2307 m2. The gardened spaces vary from 4000 m2 to 50 m2 and one school had no garden at all.
In relation with the supply for watering (item 9), most supplies (14 schools) are supplied from the public network. A minimal percentage of the centres had rainwater storage tanks for watering the garden (1 school where rainwater represent the 20% of the garden water supply). With regard to the type of vegetation (item 10), ornamental shrubs predominate in the gardened spaces (57%) with succulent plants in second place (30%). Grass lawns, usually an Atlantic type of vegetation that requires some 1,000–1,200 litres/m2/year [60] in the study area only occupy 11% of the gardened areas (139.59 m2) (Figure 5). It should also be noted that only 4 schools have grass in their gardens and the school with the largest number of students has no lawn in their green area. In this way, a higher consumption associated with a high number of students is compensated by the non-presence of grass. The data shows a predominance of vegetation adapted to the Mediterranean climate.
One of the questions about the gardened spaces asked about any changes (species of vegetation and watering systems—items 11 to 13) made that could affect water consumption. For example, one question asked if the grass area had been reduced in recent years (item 11) given its high levels of consumption. Most respondents answered no (12 schools). The main watering method (item 12) is drip (78.5%) and this is one of the most efficient methods (efficiency over 90%). In relation to changes, a fact to highlight is that, in recent years, five schools had improved their watering techniques with the introduction of a drip system (item 13). Regarding the frequency of watering (item 14), directors indicated that the garden was never watered given the predominance of vegetation adapted to the Mediterranean climate.

3.3. Environmental Awareness and Water Saving

As mentioned in the methodology, the number of educational centres that agreed to participate in the survey denotes, in itself, a notable lack of interest in the water issue. Of the 88 schools in the city, only 14 participated in this research. The reasons given by the director for non-compliance were as follows (replies of the directors): (1) 70% did not bother to respond or justify their non-participation, (2) 19.3% replied that they did not have time to complete the questionnaire, and (3) the remaining 9.7% gave responses such as ‘I did not complete the questionnaire because the issue of water is something that does not affect or interest me.’
In Table 6, the answers are summarised regarding questions about environmental awareness and water saving (Part 4 of the questionnaire). The answers show the limited importance of initiatives to save water or campaigns to raise awareness. In relation with the directors that take part in this research, participants were asked four questions related to water savings: the installation of water-saving devices in taps (item 16) and in toilets (item 17), implementation of savings plans (item 18), and the comparative examination of the water bill (item 19). For devices in taps, in eight schools, no taps were fitted with saving devices, in four schools, the devices were installed on every tap, and, in the remaining two schools, some savings devices were fitted. For toilets bowls (existence of double push buttons), the majority (9 schools) of these devices were not fitted. In three schools, some toilets bowls had double-push buttons. In one school, the respondent said that they did not know of its existence and only one school had double-push buttons installed. Only one school had a plan for saving water. That action is included in an official document carried out in schools (either at the initiative of the same or by the regional government) and characterized by their planned character. With regard to the query, if school directors compared the water bill with the previous ones in order to discover the consumption trend (item 19), nine directors replied that they did not compare bills, five do not know/no answer, and four compare the bills.
With regard to the campaigns to raise awareness, none of the schools had information panels encouraging water savings positioned in the main water consumption points (taps, toilets, fountains, etc.) (item 20). However, in eight schools, those efforts were made to raise environmental awareness (item 21). Most directors (in 10 schools) said no water-saving campaigns were made in the school by the state administration, the water company, or the school itself (item 22). Yet, this response contrasts with responses about the adoption of appropriate measures during drought, where most educational centres were answered in the affirmative. This answer (item 26) may correspond to a response that is ‘politically correct’ or the result of actions implemented by the government and water company during droughts.
Besides, the questionnaire asked about the environmental awareness (according to directors) of teachers (item 23) and students (item 24). In the case of teachers, in seven schools, they were reported to have a ‘moderate’ environmental awareness, followed by ‘very aware’ (5 schools), and do not know/no answer (2 schools). In the case of the students, in five schools, they were reported to have a ‘moderate’ environmental awareness, followed by ‘do not know/no answer’ (4 schools), ‘little awareness’ (3 schools), and ‘very aware’ (2 schools). This section also asked about potential factors that may have influenced in a hypothetical decrease in water consumption in schools (as perceived by directors) (item 25). The data indicates that the three main reasons would have been: (1) greater environmental awareness, (2) installation of water-saving devices, and (3) existence of systems and devices that use water more efficiently (technical innovations). However, this response shows certain contradictions with the previous answers (improvements in water-saving systems in taps and toilets and the implementation of savings plans).

4. Discussion

In the main cities of developed countries, there has been a fall in water consumption in recent decades [5]. This trend has been observed in Seville [61], Madrid [30,62], Paris [63], several German cities [64], and Alicante itself [14]. However, and unlike what has happened in households and the rest of the non-household sector in the city of Alicante where there is a negative trend (−7.3% and −38.9%, respectively), school water consumption increased between 2000–2004 and 2012–2017.
The possible causes of the current trend, according to the results, are: (1) increase in number of users over the last five years, (2) the water bill is not paid directly by schools and, thus, ‘free’ water as a factor that does not incentivise savings, (3) little investment made in the installation of water-saving devices or water-saving plans, (4) little promotion of environmental education or incentives for saving water in schools, and (5) actions taken in gardened areas and availability of alternative water sources. The tendency of the water consumption in the centres that participated follows the same general tendency of all the schools of the city. According to the water company informed [65], in general, since 2001, when the maximum invoiced consumption is registered (609,101 m3), a progressive decrease begins that is interrupted in 2008 (483,488 m3). After this date, the consumption increases again. Factors such as reducing investments in schools to improve facilities and increasing students may be at the root of this upward trend. This general trend of water consumption in schools in Alicante (since 2008) is also corroborated for the centres that completed the survey.
The average water consumption per school in Alicante in 2017 amounted to 4680 litres/day. In Italy, Farina et al. [48] calculated that educational centres consumed about 4493 m3/year (12,309 litres/day). These authors analysed three types of schools: nurseries (0–3 years old children), kindergartens (3–6 years), and primary schools (6–11 years). The basic demand for water was estimated as 48 litres/day per nursery school student and 18 litres/day per elementary school student. Moreover, younger children use more water on a daily basis than elementary school students, as they need more services, such as laundries and kitchens, whereas older students mainly consume water for the toilets.
On the whole, most of the studies carried out in developed countries about water consumption in schools are related to issues about consumption habits or consumption awareness, but not directly with the consumption trend. In other words, in these studies, the expected impact of water uses in the educational centres on an urban scale is not the priority aim. For developing countries, studies focus more on health issues (e.g., quality water) and the effects it may have on student health. In the United States, ensuring safe, accessible drinking water in schools is a national health priority. In the research of Cradock et al. [49], the objective was to identify whether there are differences in water quality, availability, and education-related practices in schools by demographic characteristics. The research showed that most schools teach the importance of water consumption (81.1%) and offer free drinking water in the canteen (88.3%). Additionally, in the U.S.A. (California), Bogart et al. [50] interviewed a total of 2665 adolescents (aged 12–17 years) regarding their water consumption and availability of free water during lunchtime at their school. Three-fourths reported that their school provided free water at lunchtime, mainly via fountains. Both papers highlight the importance of providing free fresh drinking water (for health reasons, basically to reduce the consumption of sugary soft drinks). This measured free water can contribute to increase water consumption, as has been shown in our research. Therefore, this action can condition the savings associated with the adoption of other initiatives.
Other research analyse the water footprint associated with activities carried out at school (mainly cook food and heating water). For example, in the United Kingdom, Laurentis et al. [51] quantified the carbon footprint (CF) and water footprint (WF) of primary school meals served. In Spain, Gamarra et al. [52] analysed the energy, material, and water requirement activities of two schools located in a hot climate area. Additionally, these authors evaluates the aggregated energy and water consumption, water scarcity exacerbation problems, and the associated carbon footprint through the Life Cycle Assessment, which allows the quantification of the impacts along the whole value chain of the school activities per student. Both of them suggest strategies to achieve a reduction in the water footprint. The expected impact of water in school on an urban scale would be related to the adoption of these measures.
In our study case, in relation with the increase in the number of users, it should be noted that the numbers of both staff and students in educational centres have increased in the last five years. Average per capita water consumption in the schools amounts to 7.34 litres/user/day with the main use of water being in the toilets (65.34%). Average daily consumption amounts to 4680 litres. Schools are one of heaviest users in the city if they are compared (in absolute terms) with, for example, households. In Alicante, consumption in 2013 in homes of the urban core amounted to 244 litres/day, 322 litres in terraced houses, 387 litres in apartment blocks, and 1,052 litres in detached houses [5]. A study carried out in 2017 in the coast of Alicante shows that consumption in detached houses is 712 litres/day [48].
Regarding the low level of motivation for saving because water is effectively ‘free,’ some of the opinions given by the directors confirm this statement (‘I do not pay for water, it is paid by the city council’, ‘The issue of water does not matter a bit because the city council pays for it’, ‘I have no interest in taking savings measures,’ or ’I do not pay for water’, etc.). This acquires greater relevance if one considers that, in 2007, the price of a cubic metre was €1.63 and the average consumption in the educational centres amounted to 3820 litres/day (€2,272 per year). In 2017, considering the increase in consumption and the price of a cubic metre, the bill would amount to some €6539 per year in schools with the highest consumption (more than 5000 litres/day) and €1276 per year in those with the lowest consumption (less than 2000 litres/day). Of the schools that participated in this study, the annual bill for the school with the highest consumption (9331 litres/day) would be €8037.
Prices and taxes have received considerable attention in the past [66,67,68,69]. Baumann et al. [70] and Dalhuisen et al. [33] argue that prices (and, especially, prices set according to consumption blocks) have an important effect on demand. Other authors [68] consider that water is generally considered to be an inelastic good because it cannot be substituted, and so increased prices do not produce a reduction in consumption unless other types of measures are adopted [5]. According to Sánchez and Blanco [53], an increase in the price of water has been identified as a means to control consumption, and may be one of the factors that explain the reduction in consumption in Europe [5]. Combined with the effects of the current economic crisis (since 2008), this increase in the total sum paid by users has led to the adoption of measures to cut company costs. One includes a measure to reduce water consumption. In France, Reynaud [20] found that the industrial demand for water was determined by price, and that the use of treated water for manufacturing processes reduced drinking water consumption.
The ‘free water’ factor has discouraged schools from introducing water-saving measures or raising awareness (the third factor), as shown by the low percentage of water-saving devices installed in taps, the non-application of measures during the current drought, and the non-realisation of environmental campaigns, etc. The use of water-saving devices in the Spanish Mediterranean coastal area has led to a notable decrease in water consumption in households, as shown by Gil et al. [40]. The lack of interest shown by the majority of school directors in participating in this research must also be noted. The results of those who participated show a lack of knowledge about the consumption trend and a lack of interest in examining their own water bills.
Initiatives usually include environmental campaigns aimed at reducing water consumption (fourth factor). Campaigns aimed at promoting water efficiency were implemented during periods of drought, and these were intensive during severe and lasting droughts [40]. These campaigns have encouraged the incorporation of technological innovations and have fostered a reduction in consumption by changing behaviour and hygiene habits. For example, in the metropolitan area of Barcelona (Spain), March et al. [7] calculated that, during the 2007–2008 drought, spending fell by as much as 22.82% in some low-density housing developments. These same authors estimated that conducting environmental campaigns, according to the people surveyed, was one of the main adopted measures. This contrast with the lack of encouragement for saving water has been seen in the schools of the city of Alicante. It is worth emphasising that it is compulsory to raise awareness of the need to save water in Spanish educational centres. This is established in the curriculum set for both primary and secondary schools. For example, for primary schools, Royal Decree 108/2014 of 4 July establishes that children must be taught sustainable use of water resources, the importance of water management during droughts, and that consideration must be given to climate change.
A final identified factor is the use of water in gardened spaces and the non-availability of alternative water sources. For the first case, the gardened area in educational centres amounts to 1269 m2 (15% of the plot) and the lawned areas represent 11% (139.59 m2). Higher percentages are recorded in the arid and semi-arid regions of the Western United States [71], or in Perth (Australia) [72]. In this study, lawned and gardened areas are not associated with greater water consumption in schools as species adapted to Mediterranean conditions predominate (see Figure 5). School directors also pointed out that, in some cases, no watering is done. Another fact that would question a relationship between increased water consumption and increased gardened spaces is the incorporation of more efficient watering systems. Thus, five schools had installed more efficient drip watering systems in recent years.
Considering that the annual consumption per square metre of grass in the study area amounts to about 1000 litres. The estimate would be an average of 382 litres/day just to irrigate the grass. In other words, some 8.16% of the daily water consumption in schools would, theoretically, be for watering grass (if watered according to its needs). The non-existence of works on the consumption of these spaces in schools makes comparisons with the household sector necessary. For example, in the province of Alicante, it has been calculated that water consumption for gardens (in detached houses) represents 47% of consumption on the north coast and 29% on the south coast [60].
None of the surveyed educational centres had access to alternative water sources as treated water. Reused waters in the city of Alicante has gained importance in recent years thanks to the implementation of the Reuse Plan (2002). The reuse of water can result in a decrease in the consumption of drinking water since treated water is used for street cleaning or watering gardens. For example, in the case of consumption in detached houses, the use of this non-conventional resource resulted in a 54% decrease in drinking water consumption between 2007–2013 [40]. Currently, some 80% of Alicante’s green areas are watered with reused water (446 hectares). It is a process that, in addition to producing economic, energy, and environmental savings, has enabled tripling the size of the city’s parks over the last 10 years [5]. Reusing water is considered one of the practices best suited to the principles of sustainable development [73], even though its use is limited by: 1) regulations, 2) lack of investment necessary to build quality distribution and storage infrastructure, and 3) a social rejection of its use in households for sanitary reasons [74].
It is also necessary to mention the low levels of interest by school directors in the use of rainwater (only one school, but 20% of the garden water supply). This is likely explained by the perception of the limited effectiveness of these systems in semi-arid climates [75]. In the case of educational centres, investing in these systems would not be profitable given that drinking water is apparently ‘free.’ Water is paid for by the city council or the regional government, and these bodies also carry out the maintenance and modernisation of them. Investing in these types of rainwater facilities would be a major expense in the short-term, which would be amortised as a result of the reduction of water bills that are currently increasing, and an investment in sustainability in the medium and long-term. This issue is important given the dryness of the area to which the effects of climate change (a greater intensity and frequency of droughts) must be added.
Taking into account what is indicated in the previous paragraphs, the impact of the water consumption of schools at the urban scale will depend on the degree of implementation and effectiveness of the measures aimed at a better water management. If the factors described are maintained, the expected impact of the water consumption of the schools will increase its importance over the total urban uses. This trend would also be accentuated by the regressive dynamics of household and non-household due to the decrease in consumption associated with the incidence of the economic crisis, the incorporation of non-conventional water resources, or the investment made in the installation of water-saving devices.

5. Conclusions

This research has established the current trend in water use in schools in the city of Alicante. A consideration of the trend shows that the starting hypothesis, specifically, a reduction in consumption linked to the implementation of water-saving measures and the encouragement of water-saving actions, is not corroborated. A fact that has influenced in increased consumption is that schools are provided with ‘free’ water. Since they do not have to pay their water bills, they have no need or motivation to implement water-saving measures. The low level of participation and collaboration by school directors in this research denotes a very notable lack of interest that, in the long-term could influence the perception of children regarding the environment. Students need to be educated in these subjects. There is a need for education on sustainable water consumption due to trends in global water consumption and an intensification of the resulting consequences. Environmental education is very important in the current climate change situation because this is a non-structural factor to mitigate their effects. In this sense, a more sustainable management of natural resources should also be given attention by teachers and even the parents of students. Revising how the issue of water and how saving actions are promoted by teachers in the classroom are the issues that will be the challenges approached in future research. For this, it will be necessary to survey teachers and students.
The efforts to create greater awareness of the effects of climate change (in this case, water shortage) are causing a gradual modification of the lifestyle in the richest countries and people are choosing more sustainable habits. This process does not seem to be evident in the case study presented. ‘Free’ water may not help to promote saving water. However, this factor should not be an excuse. Some types of change can be applied (for example, water-saving taps) and schools that do not implement water-saving measures could be penalised. Similarly, some reflection should be made about the poor level of water management in educational and the opinion of those bodies that pay the water bills should be sought. In Alicante, the council pays the water bill for primary schools and the regional government pays the bill for secondary educational centres. In addition, it should be emphasised that these organisations have not made investments related to water efficiency since the start of the economic crisis in 2008. Among the limitations of this research, it is worth mentioning the low interest shown by the directors of the schools to take part in this research. However, given the few studies on this issue in the scientific literature (at a national and international level), this research could be considered as an innovative contribution.
Lastly, the semi-arid climate of the study area cannot be forgotten and climate change is considered (less rain and more frequent droughts). It is essential to adopt actions to adapt the territories to droughts (for example, use of non-conventional sources) and reduce vulnerability to an increasing scarcity of water. Among these measures, the efficient use and management of water is a priority for achieving more sustainable cities and raising awareness among the population and younger generations. Only then will a more resilient society be built that can cope with a climate crisis.

Author Contributions

Conceptualization, Methodology, Formal Review, and Investigation, Á.-F.M., M.H., J.O., and A.-M.R. All authors have read and agreed to the published version of the manuscript.

Funding

The results presented in this article are part of the research’s projects “Uses and Management of Non-Conventional Water Resources on the Coast of Valencia and Murcia as an Adaptation Strategy to Drought” funded by the Spanish MINECO under grant number CSO2015-65182-C2-2-P and “Social representations of school content in the development of teaching competencies” funded by the Spanish MINECO under grant number PGC2018-094491-B-C32.

Acknowledgments

The authors would like to thank Aguas Municipalizadas de Alicante, Empresa Mixta S.A. for providing the data on water consumption, and especially Asunción Martínez, Francisco Bartual, Francisco Agulló, César Vázquez, Vicent Martínez, and Antonio Sánchez, and the schools that participated.

Conflicts of Interest

The authors declare no conflict of interest.

References

  1. Pérez, A. Recursos y demandas en la Demarcación Hidrográfica del Segura (DHS). In El Trasvase Tajo-Segura. Propuestas Para su Continuidad y Futuro; Gómez, J.M., Ed.; Editorial Académica Española: Murcia, Spain, 2007; pp. 70–95. [Google Scholar]
  2. Morote, A.F.; Olcina, J.; Hernández, M. The use of non-conventional water resources as a means of adaptation to drought and climate change in semi-arid regions: South-eastern Spain. Water 2019, 11, 93. [Google Scholar] [CrossRef] [Green Version]
  3. Intergovernmental Panel on Climate Change (IPCC). Special Report Global warming of 1.5 °C; 2018. Available online: https://www.ipcc.ch/report/sr15/ (accessed on 9 November 2019).
  4. Centros de Estudios y Experimentación de Obras Públicas (CEDEX). Evaluación del impacto del cambio climático en los recursos hídricos y sequías en España; Centro de Estudios Hidrográficos; Ministerio de Fomento y Ministerio de Medio Ambiente: Madrid, Spain, 2017.
  5. Morote, Á.F.; Hernández, M.; Rico, A.M. Causes of domestic water consumption trends in the city of alicante: Exploring the links between the housing bubble, the types of housing and the socio-economic factors. Water 2016, 8, 374. [Google Scholar] [CrossRef] [Green Version]
  6. Cian, C.; Barraud, P.A.; Melin, B.; Raphel, C. Effects of fluid ingestion on cognitive function after heat stress or exercise-induced dehydration. Int. J. Psychophysiol. 2001, 42, 243–251. [Google Scholar] [CrossRef]
  7. March, H.; Domènech, L.; Saurí, D. Water conservation campaigns and citizen perceptions: The drought of 2007–2008 in the metropolitan area of Barcelona. Nat. Hazards 2013, 65, 1951–1966. [Google Scholar] [CrossRef]
  8. Saarinen, T.F. Perception of Drought Hazard on the Great Plains; Research Paper No. 106; Department of Geography University of Chicago: Chicago, IL, USA, 1996. [Google Scholar]
  9. Syme, G.J.; Nancarrow, B.E.; Seligman, C. The evaluation of information campaigns to promote voluntary household water conservation. Eval. Rev. 2000, 24, 539–578. [Google Scholar] [CrossRef]
  10. Willis, R.M.; Stewart, R.A.; Panuwatwanich, K.; Williams, P.R.; Hollingsworth, A.L. Quantifying the influence of environmental and water conservation attitudes on household end use water consumption. J. Environ. Manag. 2011, 92, 1996–2009. [Google Scholar] [CrossRef] [Green Version]
  11. Chenoweth, J.; López-Avilés, A.; Morse, S.; Druckman, A. Water consumption and subjective wellbeing: An analysis of British households. Ecol. Econ. 2016, 136, 186–194. [Google Scholar] [CrossRef]
  12. Hof, A.; Blázquez-Salom, M.; Garau, J.M. Domestic urban water rate structure and water prices in Mallorca, Balearic Islands. Boletín de la Asociación de Geógrafos Españoles 2018, 77, 52–79. [Google Scholar] [CrossRef] [Green Version]
  13. March, H.; Saurí, D. When sustainable may not mean just: A critical interpretation of urban water consumption decline in Barcelona. Local Environ. 2017, 22, 523–535. [Google Scholar] [CrossRef]
  14. Morote, A.F.; Olcina, J.; Rico, A.M.; Hernández, M. Water management in urban sprawl typologies in the city of alicante (Southern Spain): New trends and perception after the economic crisis? Urban Sci. 2019, 3, 7. [Google Scholar] [CrossRef] [Green Version]
  15. Romano, G.; Salvati, N.; Guerrini, A. Estimating the determinants of residential water demand in Italy. Water 2014, 6, 2929–2945. [Google Scholar] [CrossRef]
  16. Grebenstein, C.R.; Field, B.C. Substituting for water inputs in U.S. manufacturing. Water Resour. Res. 1979, 15, 228–232. [Google Scholar] [CrossRef]
  17. Kollar, K.L.; Brewer, R. The impact of industrial water use on public water supplies. J. Am. Water Works Assoc. 1977, 69, 468–473. [Google Scholar] [CrossRef]
  18. Renzetti, S. An econometric study of industrial water demands in British Columbia, Canada. Water Resour. Res. 1988, 24, 1569–1573. [Google Scholar] [CrossRef]
  19. Renzetti, S. Estimating the structure of industrial water demands: The case of Canadian manufacturing. Land Econ. 1992, 68, 396–404. [Google Scholar] [CrossRef] [Green Version]
  20. Reynaud, A. An econometric estimation of industrial water demand in France. Environ. Resour. Econ. 2003, 25, 213–232. [Google Scholar] [CrossRef]
  21. Baños, C.J.; Hernández, M.; Rico, A.M.; Olcina, J. The hydrosocial cycle in coastal tourist destinations in Alicante, Spain: Increasing resilience to drought. Sustainability 2019, 11, 4494. [Google Scholar] [CrossRef] [Green Version]
  22. Gabardà, A.; Garcia, X.; Ribas, A. Mass tourism and water efficiency in the hotel industry: A case study. Int. J. Hosp. Manag. 2017, 61, 82–93. [Google Scholar] [CrossRef]
  23. Olcina, J.; Baños, C.J.; Rico, A.M. Medidas de adaptación al riesgo de sequía en el sector hotelero de Benidorm (Alicante, España) [Measures to adapt to the risk of drought in the hotel sector of Benidorm (Alicante, Spain)]. Revista de Geografía Norte Grande 2016, 65, 129–153. [Google Scholar] [CrossRef] [Green Version]
  24. Gottlieb, M. Urban domestic demand of water in the United States. Land Econ. 1963, 39, 204–210. [Google Scholar] [CrossRef]
  25. Hanke, S.H.; Flack, J.E. Effects of metering urban water. J. Am. Water Works Assoc. 1968, 60, 1359–1366. [Google Scholar] [CrossRef]
  26. Howe, C.W.; Linaweaver, F.P. The impact of price on residential water demand and its relation to system design and price structure. Water Resour. Res. 1967, 3, 13–32. [Google Scholar] [CrossRef]
  27. Sewellw, R.D.; Roueche, L. Peak load pricing and urban water management: Victoria, BC, a case study. Nat. Resour. J. 1974, 14, 383–400. [Google Scholar]
  28. March, H.; Perarnau, J.; Saurí, D. Exploring the links between immigration, ageing and domestic water consumption: The case of the metropolitan area of barcelona. Reg. Stud. 2012, 46, 229–244. [Google Scholar] [CrossRef]
  29. Hummel, D.; Lux, A. Population decline and infrastructure: The case of the German water supply system. Vienna Yearb. Popul. Res. 2007, 5, 167–191. [Google Scholar] [CrossRef] [Green Version]
  30. March, H.; Saurí, D. The suburbanization of water scarcity in the barcelona metropolitan region: Sociodemographic and urban changes influencing domestic water consumption. Prof. Geogr. 2010, 62, 32–45. [Google Scholar] [CrossRef]
  31. Mazzanti, M.; Montini, A. The determinants of residential water demand: Empirical evidence for a panel of Italian municipalities. Appl. Econ. Lett. 2006, 13, 107–111. [Google Scholar] [CrossRef]
  32. Castro, J.E.; Kaika, M.; Swyngedouw, E. London: Structural continuities and institutional change in water management. Eur. Plan. Stud. 2003, 11, 283–298. [Google Scholar] [CrossRef]
  33. Dalhuisen, J.M.; Florax, R.J.G.M.; De Groot, H.L.F.; Nijkamp, P. Price and income elasticities of residential water demand: A meta-analysis. Land Econ. 2003, 79, 292–308. [Google Scholar] [CrossRef]
  34. Kallis, G.; Coccossis, H. Managing water for Athens: From the hydraulic to the rational growth paradigm. Eur. Plan. Stud. 2003, 11, 245–261. [Google Scholar] [CrossRef]
  35. Zhou, Y.; Tol, R.S.J. Water Use in China’s Domestic, Industrial and Agricultural Sectors: An Empirical Analysis; Working paper-67; FNU University: Hamburg, Germany, 2005. [Google Scholar]
  36. Deoreo, W.; Mayer, P. Insights into declining single-family residential water demands. J. Am. Water World Assoc. 2012, 104, 383–394. [Google Scholar] [CrossRef]
  37. Roger, P.; De Silva, R.; Bhatia, R. Water is an economic good: How to use prices to promote equity, efficiency, and sustainability. Water Policy 2002, 4, 1–17. [Google Scholar] [CrossRef]
  38. Romero, J.; Brandis, D.; Delgado, C.; García, J.L.; Gómez, M.L.; Olcina, J.; Rullán, O.; Vera, J.F.; Vicente, J. Aproximación a la Geografía del despilfarro en España: Balance de las últimas dos décadas. Boletín de la Asociación de Geógrafos Españoles 2018, 77, 1–51. [Google Scholar] [CrossRef] [Green Version]
  39. Tenza, A.J.; Pagán, J.I.; Aragonés, L.; Saval, J.M.; Serra, J.C.; López, I. 60 years of urban development in Denia and its influence on the Marineta Cassiana beach. Int. J. Sustain. Dev. Plan. 2017, 12, 678–686. [Google Scholar] [CrossRef] [Green Version]
  40. Gil, A.; Hernández, M.; Morote, A.F.; Rico, A.M.; Saurí, D.; March, H. Tendencias del Consumo de Agua Potable en la Ciudad de Alicante y Área Metropolitana de Barcelona, 2007–2013; Hidraqua Gestión Integral: Alicante, Spain, 2015. [Google Scholar]
  41. Morote, A.F.; Hernández, M. Unauthorized domestic water consumption in the city of Alicante (Spain): A consideration of its causes and urban distribution (2005–2017). Water 2018, 10, 851. [Google Scholar] [CrossRef] [Green Version]
  42. Trinies, V.; Chard, A.N.; Mateo, T.; Freeman, M. Effects of water provision and hydration on cognitive function among primary-school pupils in zambia: A randomized trial. PLoS ONE 2016, 11, e0150071. [Google Scholar] [CrossRef]
  43. Egbinola, N.C.; Amanmbu, A.C. Water supply, sanitation and hygiene education in secondary schools in Ibadan, Nigeria. Bull. Geogr. Socio–Econ. Ser. 2015, 29, 31–46. [Google Scholar] [CrossRef] [Green Version]
  44. Boubacar, H.; Tohon, Z. Assessing the health impact of the following measures in schools in Maradi (Niger): Construction of latrines, clean water supply, establishment of hand washing stations, and health education. J. Parasitol. Res. 2014, 2014, 190451. [Google Scholar]
  45. Hunter, P.R.; Risebro, H.; Yen, M.; Longuet, C.; Jaquenoud, F. Impact of the provision of safe drinking water on school absence rates in Cambodia: A quasi-experimental study. PLoS ONE 2014, 9, e91847. [Google Scholar] [CrossRef] [Green Version]
  46. Ribeiro, M.G.; De Abreu, L.C.; Laporta, G.Z. Drinking water and rural schools in the Western Amazon: An environmental intervention study. PeerJ 2018, 6, e4993. [Google Scholar] [CrossRef] [Green Version]
  47. Farina, M.; Maglionico, M.; Pollastri, M.; Stojkov, I. Water consumptions in public schools. Procedia Eng. 2011, 21, 929–938. [Google Scholar] [CrossRef] [Green Version]
  48. Elder, J.P.; Holub, C.K.; Arredondo, E.M.; Sánchez-Romero, L.M.; Moreno-Sancho, J.E.; Barquera, S.; Rivera, J. Promotion of water consumption in elementary school children in San Diego, USA and Tlaltizapan, Mexico. Salud pública de México 2014, 56, 148–156. [Google Scholar] [CrossRef] [PubMed] [Green Version]
  49. Cradock, A.L.; Everett-Jones, S.; Merlo, C. Examining differences in the implementation of school water-quality practices and water-access policies by school demographic characteristics. Prev. Med. Rep. 2019, 14, 100823. [Google Scholar] [CrossRef] [PubMed]
  50. Bogart, L.M.; Babey, S.H.; Patel, A.I.; Wang, P.; Schuster, M.A. Lunchtime school water availability and water consumption among California adolescents. J. Adolesc. Health 2016, 58, 98–103. [Google Scholar] [CrossRef] [PubMed] [Green Version]
  51. De Laurentis, V.; Hunt, D.V.L.; Rogers, C.D.F. Contribution of school meals to climate change and water use in England. Energy Procedia 2017, 123, 204–211. [Google Scholar] [CrossRef]
  52. Gamarra, A.R.; Istrate, I.R.; Herrera, I.; Lizana, J.; Lechón, Y. Energy and water consumption and carbon footprint of school buildings in hot climate conditions. Results from life cycle assessment. J. Clean. Prod. 2018, 195, 1326–1337. [Google Scholar] [CrossRef]
  53. Sánchez, V.E.; Blanco, F.J. El uso sostenible del agua en núcleos urbanos: Las tarifas como herramienta de control del consumo. Obs. Ambient. 2012, 15, 35–59. [Google Scholar] [CrossRef] [Green Version]
  54. Organización de Consumidores y Usuarios (OCU) (2019): El Precio del Agua en 53 Ciudades. Available online: https://www.ocu.org/alimentacion/agua/informe/el-precio-del-agua.2019 (accessed on 13 May 2019).
  55. Agencia Estatal de Meteorología (AEMET). Servicios climáticos. 2019. Available online: http://www.aemet.es/es/serviciosclimaticos/datosclimatologicos/valoresclimatologicos?l=8025&k=val (accessed on 20 September 2019).
  56. Morote, A.F.; Olcina, J.; Rico, A.M. Challenges and proposals for socio-ecological sustainability of the tagus–segura aqueduct (Spain) under climate change. Sustainability 2017, 9, 2058. [Google Scholar] [CrossRef] [Green Version]
  57. Conselleria de Educación, Investigación, Cultura y Deporte. Guia de Centros Docentes. Available online: http://www.ceice.gva.es/es (accessed on 20 February 2017).
  58. Cabrera, C. Aguas de Alicante; Aguas de Alicante: Alicante, Spain, 1999. [Google Scholar]
  59. Aguas Municipalizadas de Alicante, Empresa Mixta (AMAEM). Datos Sobre Consumo de Agua; AMAEM: Alicante, Spain, 2018. [Google Scholar]
  60. Morote, A.F.; Hernández, M. El uso y consumo de agua en los jardines de las viviendas unifamiliares del litoral de Alicante. Cuadernos de Geografía de la Universidad de Valencia 2016, 98, 29–44. [Google Scholar]
  61. Del Moral-Ituarte, L.; Giansante, C. Constraints to drought contingency planning in Spain: The hydraulic paradigm and the case of seville. J. Contingencies Crisis Manag. 2000, 8, 93–102. [Google Scholar] [CrossRef]
  62. Naredo, J.M.; Carpintero, O.; Frías, J.; Gascó, J.M.; Saa, A. El agua virtual y la huella hidrológica en la Comunidad de Madrid. Cuadernos I+D+I; Canal de Isabel II: Madrid, Spain, 2008; Volume 85. [Google Scholar]
  63. Barraqué, B. (Paris, France). Personal communication, 18 November 2010. [Google Scholar]
  64. Lux, A. Shrinking cities and water supply. In Population Dynamics and Supply Systems; Hummel, D., Ed.; Frankfurt am Main: Frankfurt, Germany, 2008; pp. 161–179. [Google Scholar]
  65. Aguas Municipalizadas de Alicante, Empresa Mixta (AMAEM). Informe de Evolución de Consumes; AMAEM: Alicante, Spain, 2009. [Google Scholar]
  66. Agthe, D.; Billings, R. Equity, price elasticity, and household income under increasing block rates for water. Am. J. Econ. Sociol. 1987, 46, 273–286. [Google Scholar] [CrossRef]
  67. Arbués, F.; García, M.A.; Martínez, R. Estimation of residential water demand: A state of the art review. J. Socio-Econ. 2003, 32, 81–102. [Google Scholar] [CrossRef]
  68. Martínez, R.; Nauges, C. Is all domestic water consumption sensitive to price control? Appl. Econ. 2004, 36, 1697–1703. [Google Scholar] [CrossRef]
  69. Olmstead, S.; Hanemann, M.; Stavins, R. Does price structure matter? HouseholdWater demand under increasing-block and uniform prices. Econ. Semin. 2003. Available online: http://www.econ.ucsb.edu/seminar/papers/olmstead.pdf (accessed on 9 June 2019).
  70. Baumann, D.D.; Boland, J.J.; Hanemann, W.M. Urban Water Demand Management and Planning; McGraw-Hill: New York, NY, USA, 1998. [Google Scholar]
  71. Hilaire, S.T.; Spinti, R.; Van Leeuwen, D.; Smith, C. Lansdcape Preferences and Attitudes Toward Water Conservation: A Public Opinion Survey of Homeowners in Las Cruces; New Mexico State University: Las Cruces, NM, USA, 2003. [Google Scholar]
  72. Loh, M.; Coghlan, P. Domestic Water use Study: Perth, Western Australia 1998–2001; Water Corporation: Perth, Australia, 2003. [Google Scholar]
  73. Seguí, L.A. Sistemas de regeneración y reutilización de Aguas Residuales. Metodología Para el análisis técnico-económico y Casos. Ph.D. Tesis, Departament d’Enginyeria Agroalimentària i Biotecnologia, Universitat Politècnica de Catalunya, Barcelona, Spain, 2004. [Google Scholar]
  74. Baeza, J. Reutilización de aguas residuales para riego. Trabajo Fin de Máster en Gestión Sostenible y Tecnologías del Agua.; Universidad de Alicante: Alicante, Spain, 2009. [Google Scholar]
  75. Hernández, M.; Morote, A.F. The use of rainwater in Alicante (Southeast Spain). A new urban approach to urban water management. UPLanD–J. Urban Plan. Landsc. Environ. Des. 2019, 4, 53–66. [Google Scholar]
Figure 1. Study area (city of Alicante). Own elaboration.
Water 12 01052 g001
Figure 2. Water consumption in schools (litres/day) (2000–2017). Source: Aguas Municipalizadas de Alicante, Empresa Mixta (AMAEM) [59]. Own elaboration.
Water 12 01052 g002
Figure 3. Schools according to the size of the plot (m2) and the number of students. Source: survey results. Own elaboration.
Water 12 01052 g003
Figure 4. Water use in schools (%). Source: survey results. Own elaboration.
Water 12 01052 g004
Figure 5. Surface occupied by the different types of vegetation in the gardened areas of the schools (%). Source: survey results. Own elaboration.
Water 12 01052 g005
Table 1. Questionnaires sent to the school directors
1. Characteristics of the School
ItemsResponse Type/Variables
1. Number of studentsEnded answer question/number
2. Change in student numbers in the last 5 yearsEnded answer questions/increase, no change, reduction
3. Number of staff (teachers, cleaning assistants, etc.)Ended answer question/number
4. Change in the number of staff in the last 5 yearsEnded answer questions/increase, no change,
Reduction
5. Size of the plot and other elements that take part of the school (m2)Ended answer questions/Surface: plot, building, green areas, others
2. Water Use and Management
ItemsResponse Type/Variables
6. Water use in schools (%). Point out which places and uses consume the most water. Ended answer question/Percentage: toilets, garden, cleaning, kitchen, sport areas, fountain, others
7. Systems that consume most water. Point out which systems and elements consume the most water.Likert scale (value: 1 to 6. 1 being the highest value and the lowest 6)/Taps (indoor uses), toilet bowls, dishwasher, taps (outdoor uses), taps (cleaning), showers
8. Cleaning. Volume of water used for cleaning. Ended answer question/need more water, need the same, need less water
9. Point out origin of supply water sourcesEnded answer question/water public network, wells, treated water, rainwater tanks
3. Characteristics of Gardened Areas
ItemsResponses
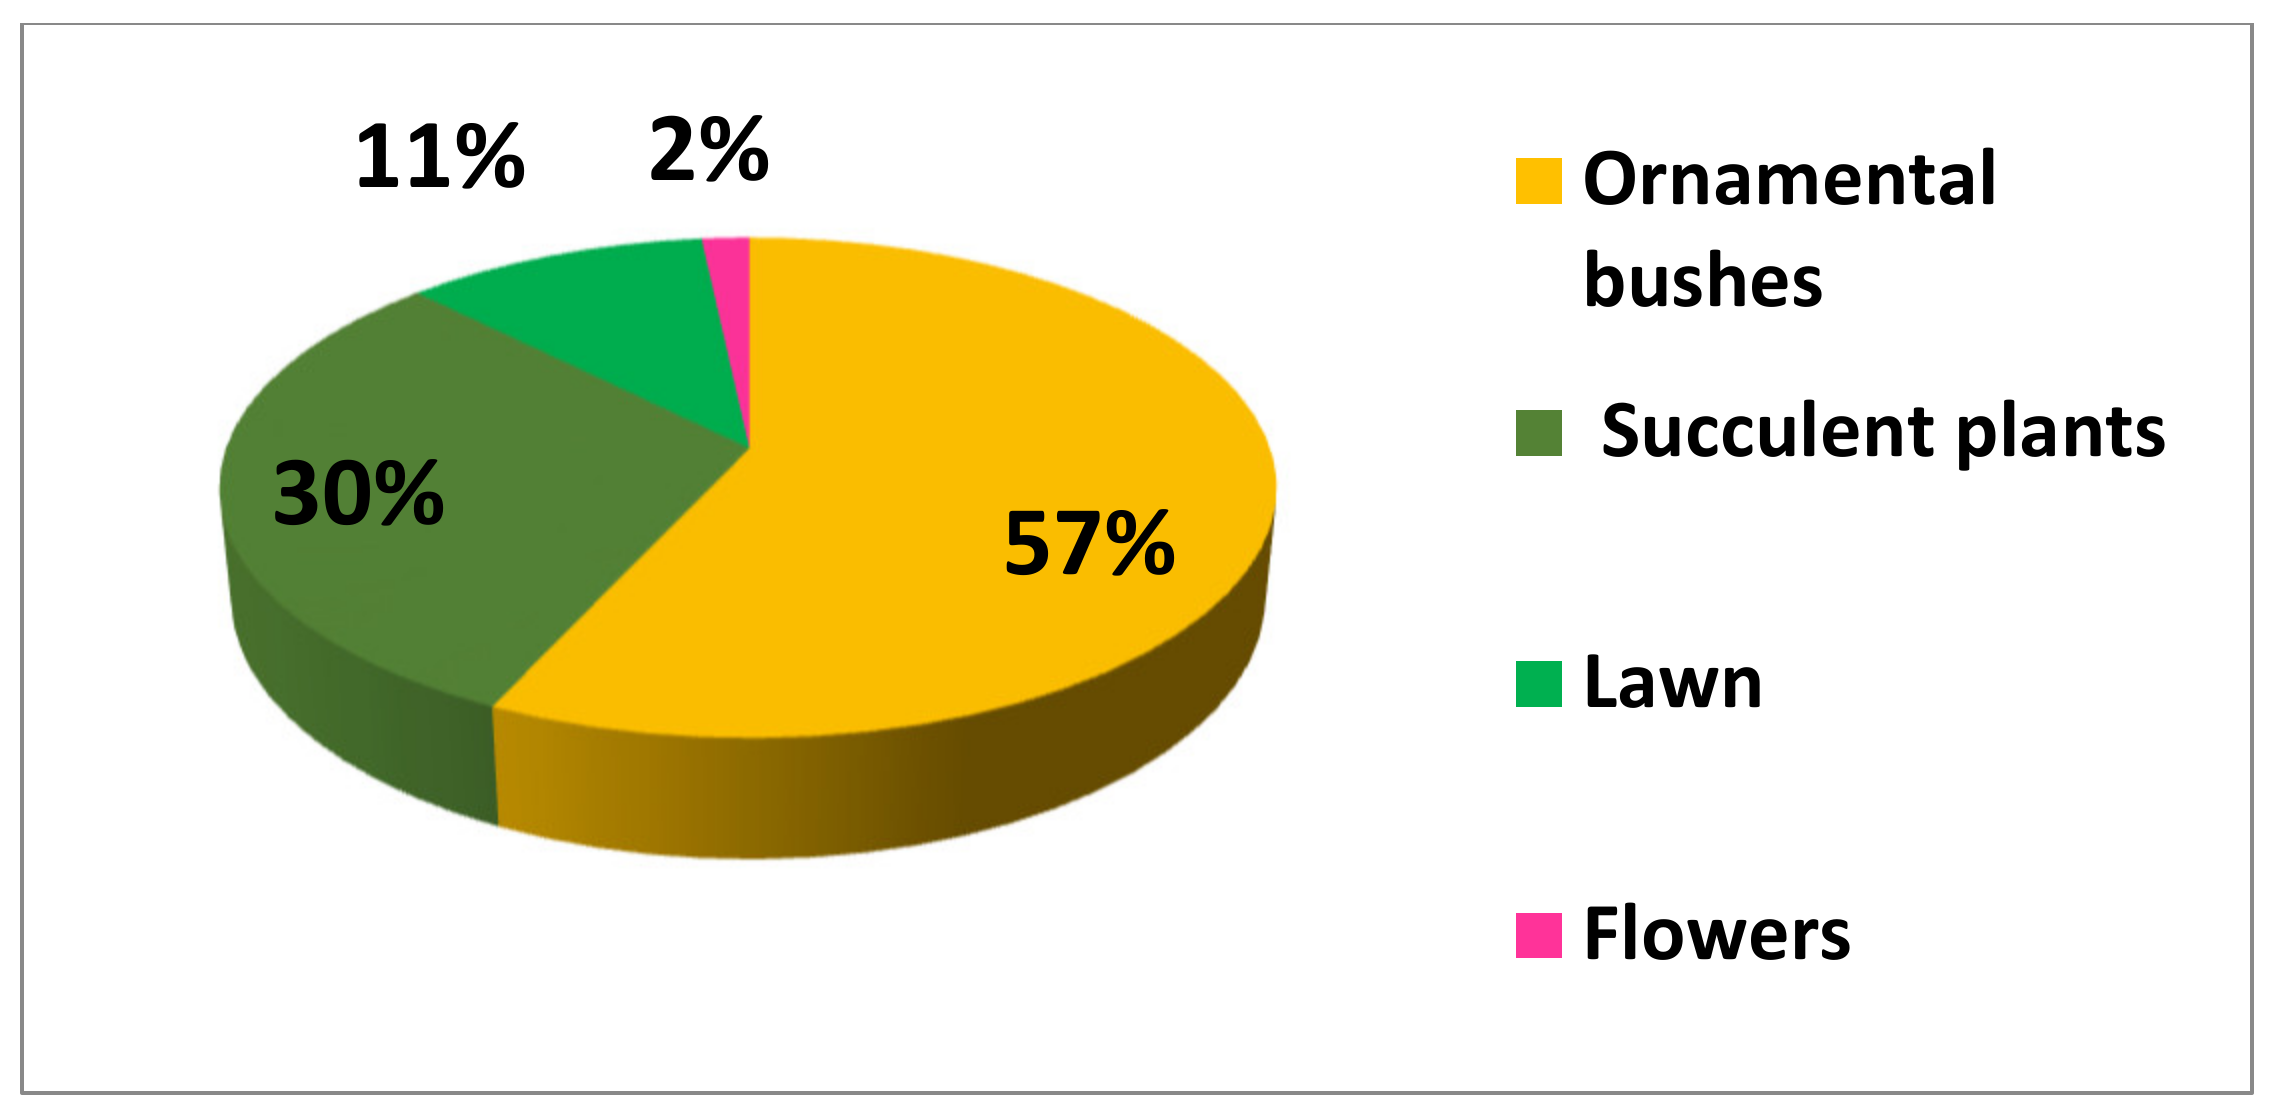
10. Percentage of the different types of vegetationEnded answer question/Percentage: Ornamental bushes, succulent plants, grass, flowers
11. Reduction of grass in the last five yearsEnded answer question/Yes, No
12. Type of watering systems (%) Point out, if the garden is wateringEnded answer/Percentage: Hosepipe, sprinklers, drip, others
13. Changes (improve) carried out in watering systems in the last five years (if the garden is watering)Ended answer/Yes, No
14. Watering garden areasEnded answer question/Yes, No
4. Perception of Water Consumption and Efforts to Encourage Savings
ItemsResponses
15. Perception of water consumption trend Ended answer/reduced, remained the same, increased/Do not know/no answer
16. Installation of water-saving devices (taps)Ended answer/Installed in all taps, installed in some, none, do not know/no answer
17. Installation of water-saving devices (toilets)Ended answer/installed in all toilets, installed in some, none, do not know/no answer
18. Implementation of water-saving plans Ended answer/Yes, No
19. Comparison with previous water invoicesEnded answer/Yes, No, Do not know/no answer
20. Information on saving water at main points of consumptionEnded answer/Yes, No
21. Effort to raise environmental awareness in schoolEnded answer/Yes, No
22. Environmental awareness campaignsEnded answer/Yes, No
23. Perception of teachers’ environmental awareness (according to the directors) Ended answer/Very aware, Moderate, Little awareness, Not aware, Do not know/no answer
24. Perception of students’ environmental awareness (according to the directors) Ended answer/Very aware, Moderate, Little awareness, Not aware, Do not know/no answer
25. Main factors for reducing water useLikert scale (value: 1 to 8. 1 being the highest value and the lowest 8)/Environmental awareness, Water-saving devices, Technical innovations, Droughts, Climate change, Price of water, Economic crisis, Staff cuts
26. Measures taken during the last drought (2015–2018)Ended answer/Yes, No
Own elaboration.
Table 2. Changes in the number of students and staff at schools.
VariableChangesSchools (nº)
Change in student numbers in the last five years (item 2)Increase
No change
Reduction
9 schools
4 schools
1 school
Change in the number of staff in the last five years (item 4)Increase
No change
Reduction
6 schools
6 schools
2 schools
Source: Survey results. Own elaboration.
Table 3. Average daily water consumption according to the number of students and land area (m2) (2017).
Number StudentsLitres/School/DayLitres/Student/DayLand Size (m2)Garden (m2)Grass (%)
More than 100064934.32870029930
501–100059089.718543134019%
Less than 500528816.17837210106.25%
Source: survey results. Own elaboration.
Table 4. Average amount of school water bills (2017) (€/m3).
Litres/School/Day€/Day€/Month€/Year
More than 5,000l/day17.915446539
2,001–5,000l/day9.202793559
Less than 2,000l/day3.491061276
Source: survey results. Own elaboration.
Table 5. Uses and water management in schools.
Systems that Consume Most Water (Item 7)Taps (indoor uses)
Toilet bowls
Dishwasher
Taps (outdoor uses)
Taps (cleaning)
Showers


Cleaning Volume of Water Used for Cleaning (Item 8)Need more water
Need the same
Need less water
3 schools
11 schools
0 schools
Point Out Origin of Supply Water Sources (Item 9)Water public network
Wells
Treated water
Rainwater tanks
14 schools
0 schools
0 schools
1 school (only 20% of the garden water supply)
Source: survey results. Own elaboration.
Table 6. Perception of water consumption and efforts to encourage saving water in schools
Perception of Water Consumption Trend (Item 15)Reduced
Remained the same
Increased
Don’t know/no answer
2 schools
4 schools
3 schools
5 schools
Installation of Water-Saving Devices (Taps) (Item 16)Installed in all taps
Installed in some
None
Don’t know/no answer
4 schools
2 schools
8 schools
0 schools
Installation of Water-Saving Devices (Toilets) (Item 17)Installed in all toilets
Installed in some
None
Do not know/no answer
1 school
3 schools
9 schools
1 school
Implementation of Water-Saving Plans (Item 18)Yes
No
0 schools
14 schools
Comparison with Previous Invoices (Item 19)Yes
No
Do not know/no answer
5 schools
4 schools
5 schools
Information on Saving Water at the Main Points of Consumption (Item 20)Yes
No
0 schools
14 schools
Efforts to Raise Environmental Awareness in School (Item 21)Yes
No
8 schools
6 schools
Environmental Awareness Campaigns (Item 22)Yes
No
10 schools
4 schools
Perception of Teachers’ Environmental Awareness (According to the Directors) (Item 23)Very aware
Moderate
Little awareness
Not aware
Do not know/no answer
5 schools
7 schools
0 schools
0 schools
2 schools
Perception of Students’ Environmental Awareness (According to the Directors) (Item 24)Very aware
Moderate
Little awareness
Not aware
Do not know/no answer
2 schools
5 schools
3 schools
0 schools
4 schools
Main Factors for Reducing Water Use (Item 25)Environmental awareness Water-saving devices
Technical innovations
Droughts
Climate change
Price of water
Economic crisis
Staff cuts


Measures Taken during the Last Drought (2015–2018) (Item 26)Yes
No
13 schools
1 school
Source: survey results. Own elaboration.

