Moisture Transfer and Formation of Separate Ice in the Freezing Process of Saturated Soils


1
School of Highway, ChangAn University, Xian 710064, China
2
CCCC Second Harbour Engineering Company Ltd., Wuhan 430040, China
3
Key Laboratory of Large-Span Bridge Construction Technology, Wuhan 430040, China
4
State Key Laboratory of Hydraulics and Mountain Engineering, College of Water Resource and Hydropower Engineering, Sichuan University, Chengdu 610065, China
5
Research and Development Center of Transport Industry of Intelligent Manufacturing Technologies of Transport Infrastructure, Wuhan 430040, China
*
Author to whom correspondence should be addressed.
Water 2020, 12(4), 1044; https://doi.org/10.3390/w12041044
Submission received: 9 March 2020
/
Revised: 30 March 2020
/
Accepted: 3 April 2020
/
Published: 7 April 2020
(This article belongs to the Section Hydraulics and Hydrodynamics)
Abstract
:The formation and layer of ice lenses during the freezing of soil in cold regions is closely related to frozen heave and moisture immigration. The purpose of the paper is to explain the physical mechanisms pertaining to ice lens formation, which were analyzed and verified using numerical simulation results. Based on a few assumptions, the formation and layers of ice lenses are illuminated in the following steps: the initial stage of freezing, formation of the first layer of ice lens, formation of the second layer of ice lens, and formation of the final layer of ice lens. Compared with the numerical results of coupled thermo–hydro–mechanical simulations of one-side freezing of soil columns in an open system, the proposed analysis method of the formation and layers of ice lenses is verified to be reasonable, and it is demonstrated that the classical criterion for the formation of ice lens in freezing saturated soil is only suitable for the final layer of ice lens. Finally, a new criterion, in terms of flux rate, for the formation of ice lens is proposed.
1. Introduction
In cold regions, soil freezing in soil deposits near the ground surface may occur in response to seasonal variations of temperature. During soil freezing, frost heave and ice segregation typically appear simultaneously. Frozen heave and ice segregation are crucial in geotechnical engineering in cold regions, as they can cause damage to pavements, displacement and fracture of oil pipelines, and loss of bearing capacity of structure foundation. Therefore, it is critical to reflect the water migration and formation process of frost heave when formulating a frost heave model [1,2]. In-situ and laboratory experiments have demonstrated that ice lenses are discontinuously distributed by layers and that thick ice lenses exist within the ground. To explain this phenomenon, the secondary frost theory has been proposed [3,4,5]. According to this theory, ice penetrates soil and water migrates toward the ice simultaneously, causing an accumulation of ice within the frozen soil. Lenses of segregated ice develop within forced discontinuities in the frozen soil fabric, which consequently drives the movement of the soil surface. In the frozen fringe zone, the temperature of ice segregation, unfrozen water content, pore pressure, and hydraulic conductivity are key controlling parameters.
During the freezing of saturated soil deposits, the unfrozen water content depends significantly on the pore pressure of a combined action of pore water and pore ice pressures and hydraulic conductivity. When the pore pressure is less than zero, the occurrence of water driving force results in water migration. Hence, variations in water driving force and hydraulic conductivity should be emphasized when modeling frost heave and water transfer. Taber [6] proposed the crystallization theory, which states that pressure gradient is caused by ice crystals, which causes the migration of unfrozen water and hence the formation of ice crystals. Beskow [7] combined suction force with film water migration theory and demonstrated that unfrozen water migrated along a clearance filled with unfrozen water between soil grains and ice grains in the frozen zone. Edlefsen [8] regarded suction as the total driving force of moisture migration, neglecting water migration. Subsequently, Gilpin [5] and Nixon [9] indicated that hydraulic conductivity is a function of temperature. Watanabe [10] observed the microstructure near the freezing front using a microscope during soil freezing, which clarifies that the growth rate of ice lenses decreases with increasing temperature at the growth surface of the warmest ice lens. No pore ice appeared in the freezing fringe, and the freezing velocity determines the temperature at which the ice lenses start to form. Thomas [11] discovered that the pore pressure of the unfrozen soil can reach values of −300 to 400 kPa by performing two small-scale laboratory freezing–thawing tests. Xu [1] discovered that the soil density of the unfrozen zone increased at the end of the experiment for both the closed and open system, indicating that the unfrozen zone was compressed during the freezing process. Zhou et al. [12] assumed hydraulic conductivity as a function of position because unfrozen water could not flow through ice lenses.
Extensive studies on the formation criterion of a new ice lens have been performed to determine when and where a new ice lens may form. Konrad and Morgenstern [4] reported that, at temperatures lower than ( at the formation of an ice lens during unsteady heat flow), an ice lens begin to form; when the temperature reduces to (the maximum for a given ice lens), the ice lens stops growing, in which is the segregation–freezing temperature. O’Neill [13] reported that, when the pore pressure exceeds the total pressure, an ice lens is formed. Another opinion is that an ice lens forms when the pore pressure exceeds the sum of the total stress and separation strength [5,9]. Zhou et al. [12] proposed the concept of the separating void ratio esep. When the void ratio is less than esep, pore ice grains cannot connect with each other, even if the soil grains are separated. When the void ratio is greater than or equal to esep, the ice grains connect with each other to become integrated, and ice lenses begin to form. When performing a coupling analysis on thermo–hydro–mechanical interactions during the freezing process, coupled frameworks for modeling frozen and freezing soils should be provided; in fact, researchers have performed studies regarding these topics. Michalowski and Zhu [14] proposed a continuum mechanics-based framework for solving boundary value problems based on a new concept of a porosity rate function dependent on two primary material parameters, i.e., the maximum rate and the temperature at which the maximum rate occurs. Nishimura et al. [15] presented a fully coupled thermo–hydro–mechanical finite element formulation, considering thermal, hydraulic, and mechanical processes and their various interactions, through fundamental physical laws and models. Zhou and Meschke [16] proposed a three-phase finite element soil model based on poromechanics theory, in which solid particles, liquid water, and crystal ice are considered as separate phases, and mixture temperature, liquid pressure, and solid displacement as primary field variables. Zhang and Michalowski [17] proposed a constitutive model based on the concept of critical state, which can simulate the freezing and thawing of soils, as well as associated changes in soil strength. Liu et al. [18] derived equations of mass and momentum balance and the kinetic theorem for freezing saturated frozen soils in Eulerian and Lagrangian formulations considering phase transition, which is an extension of studies regarding poroelasticity and poro-elasoplasticity, considering the phase changes between liquid water and ice crystals during freezing; furthermore, they can be applied to study the frost heave of freezing ground in cold regions.
However, few studies have addressed how ice lens layers are formed and the corresponding effect on water migration. In this study, the separation strength was assumed to be sufficiently large to separate soil grains and form ice lens before the formation of the final layer of ice lens. However, the existing criteria for the formation of ice lens in freezing soil render it challenging to analyze when and where ice lenses form before the formation of the final one; therefore, this issue was investigated in this study.
2. Analysis of Layering Process of Ice Lens
2.1. Analysis of Experimental Results of One-Side Freezing of Soil Columns in an Open System
In this section, the experimental results published in [19,20] are provided to analyze the layering process of ice lenses.
Experiments were performed in the freezing and thawing test chamber of XT5405B series in the State Key Laboratory of Frozen Soil Engineering of China [19,20]. For the freezing and thawing test chamber of XT5405B, its operating temperature ranges from −35 to +35 °C, in which the controlled liquids are alcohol, set from −40 to +60 °C with an accuracy of ±0.5 °C, circulating through the bottom and top plates of the test chamber. The soils tested were silty clay, which were extracted from the Qinghai–Tibet Plateau, and their initial water content was 22.83%, plasticity index was 18.8%, d10 was 0.032 mm, d30 was 0.015 mm, and d60 was 0.050 mm. The soil samples were a cylinder of diameter 100 mm and height 100 mm. The reconstituted soil sample was prepared according to test code of the soil [19,20] and compacted layer by layer by controlling the dry density. The soil column was loaded with 50 kPa at the upper surface and placed in a thermotank of constant temperature 1.2 °C. The experiments were conducted during one-side freezing; the upper end was cold at negative temperatures, whereas the bottom end was warm at positive temperatures. When the freezing process began, the top and bottom surface temperatures were maintained at −2.2 °C and 1.2 °C during the entire test. The freezing period was 90 h, and the temperature gradients can be obtained by calculating the temperature difference between the two ends of the soil column, divided by the sample height. The water supplement system was composed of a Mariotte flash connected with the bottom plate through a plastic tube. In these experiments, water was supplemented without an external pressure. Data Taker 80 was used to collect data in the experiments, including temperature, displacement, and stress.
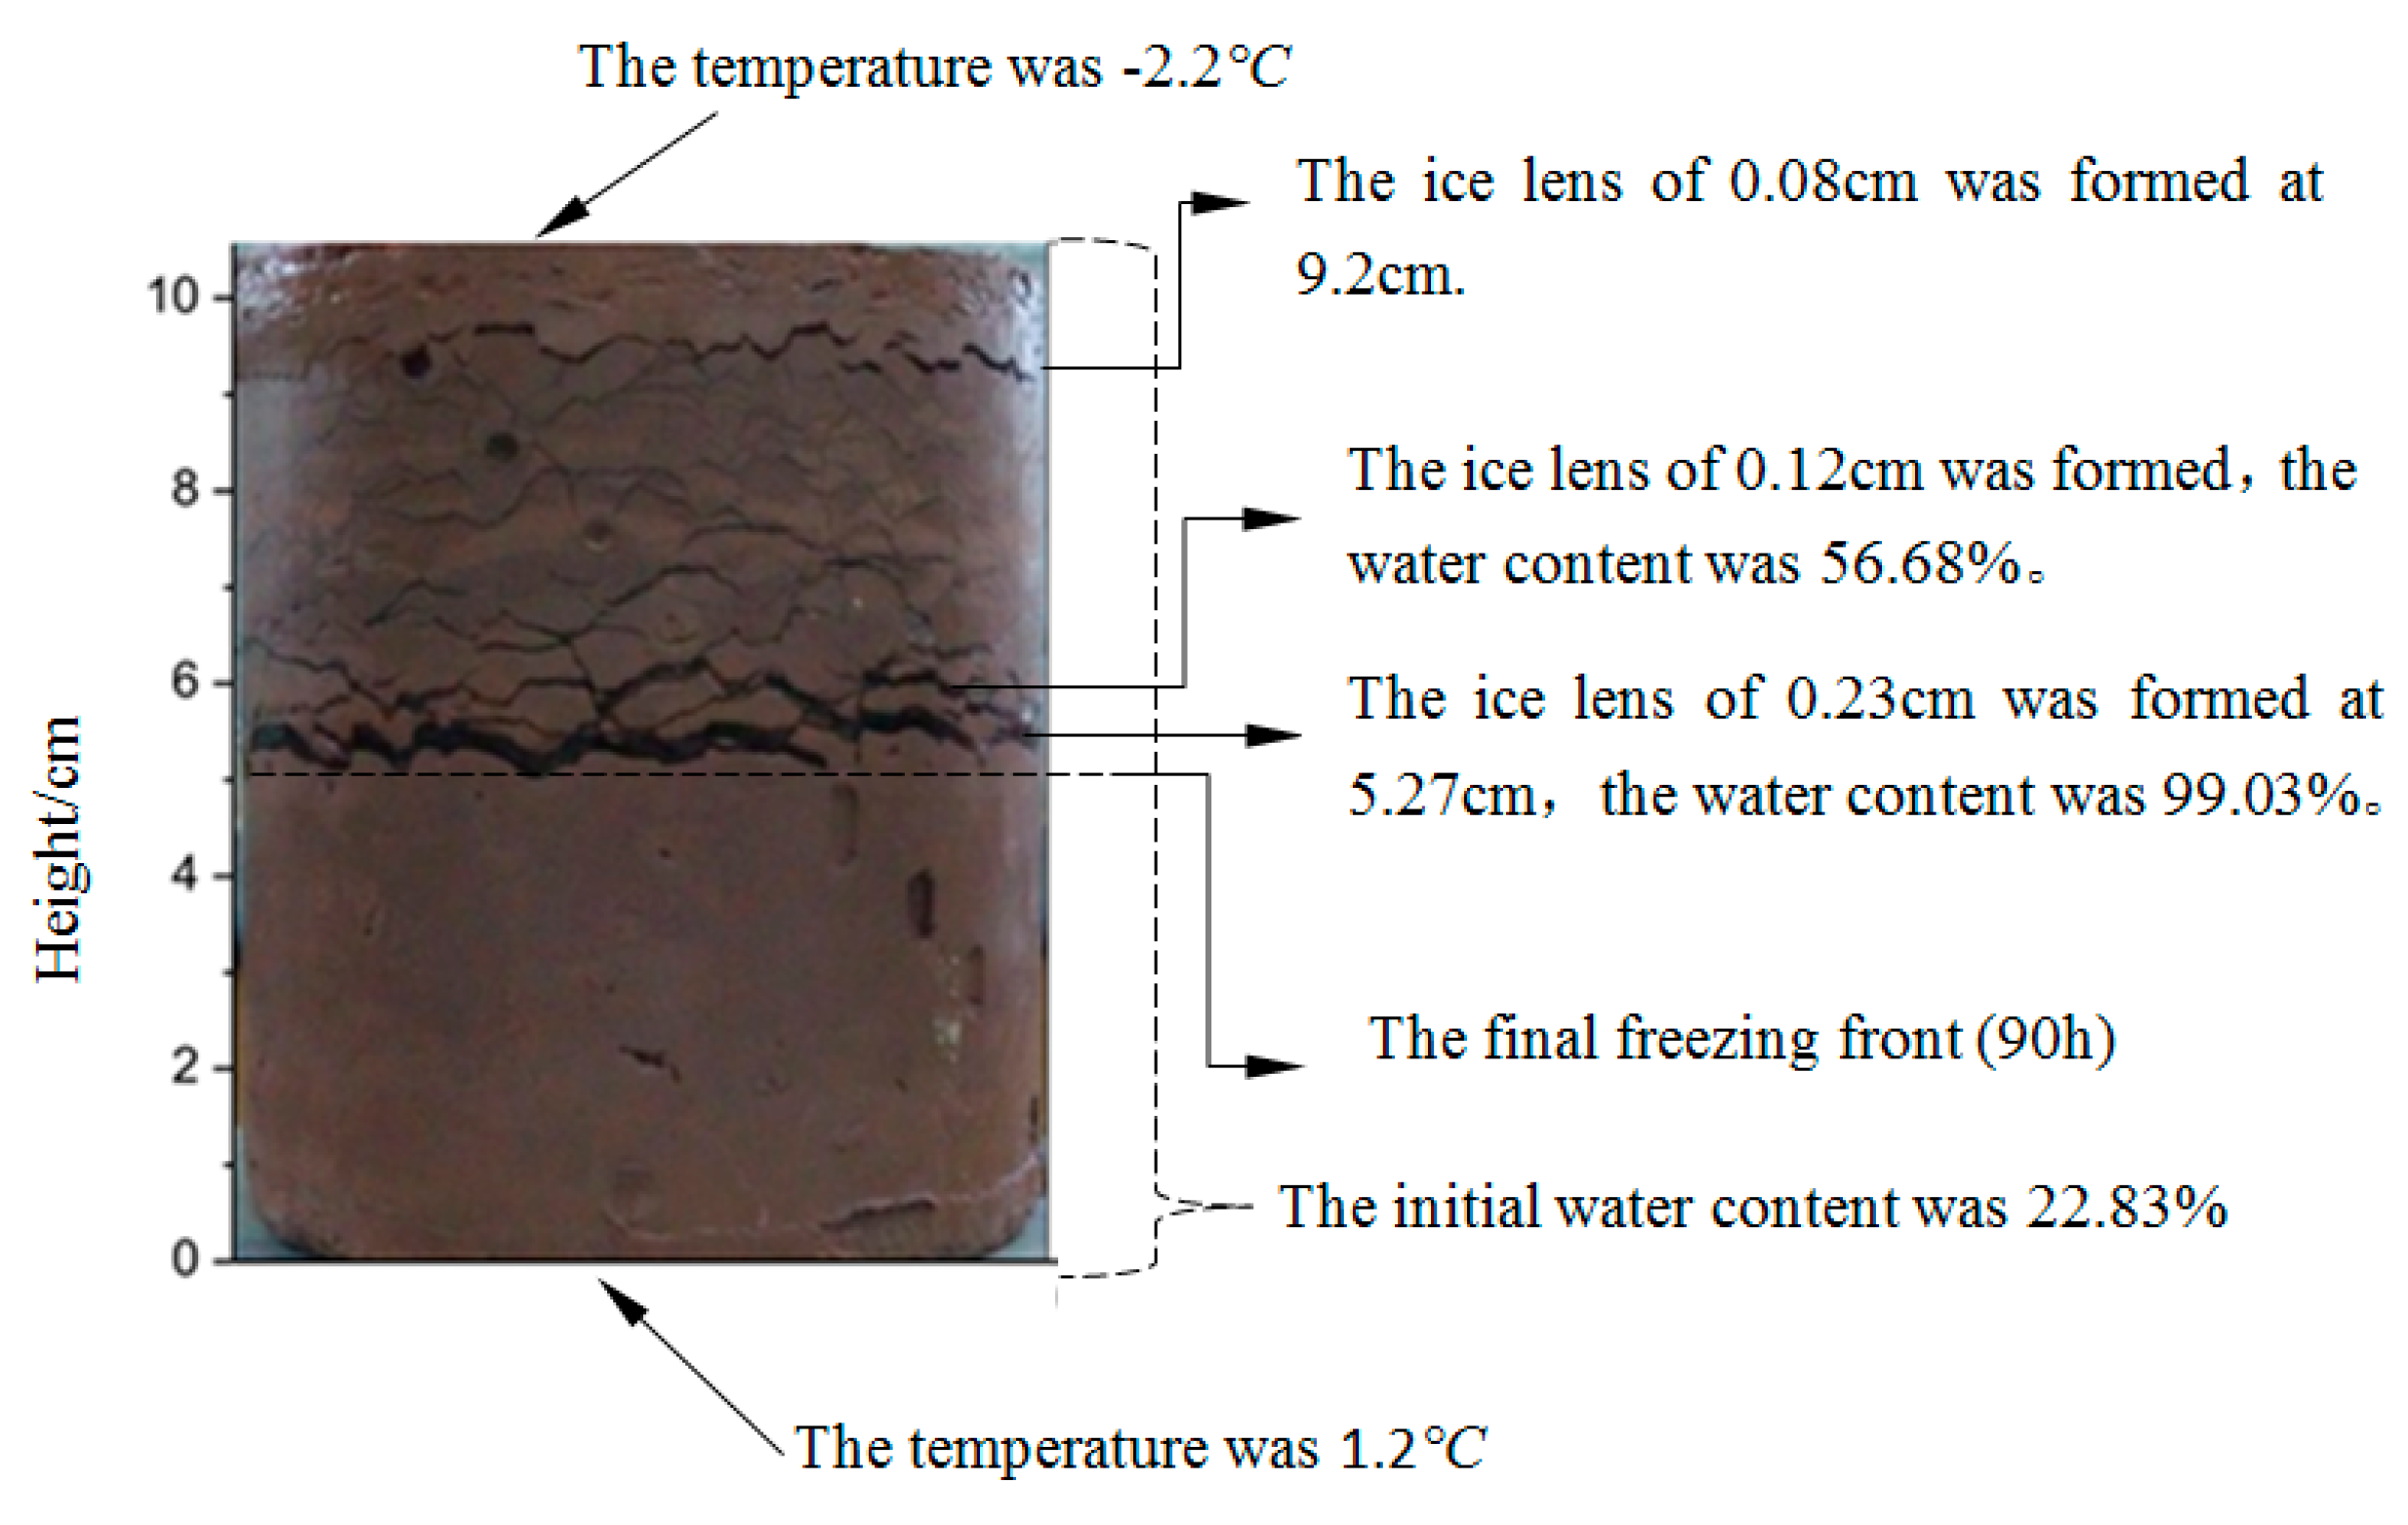
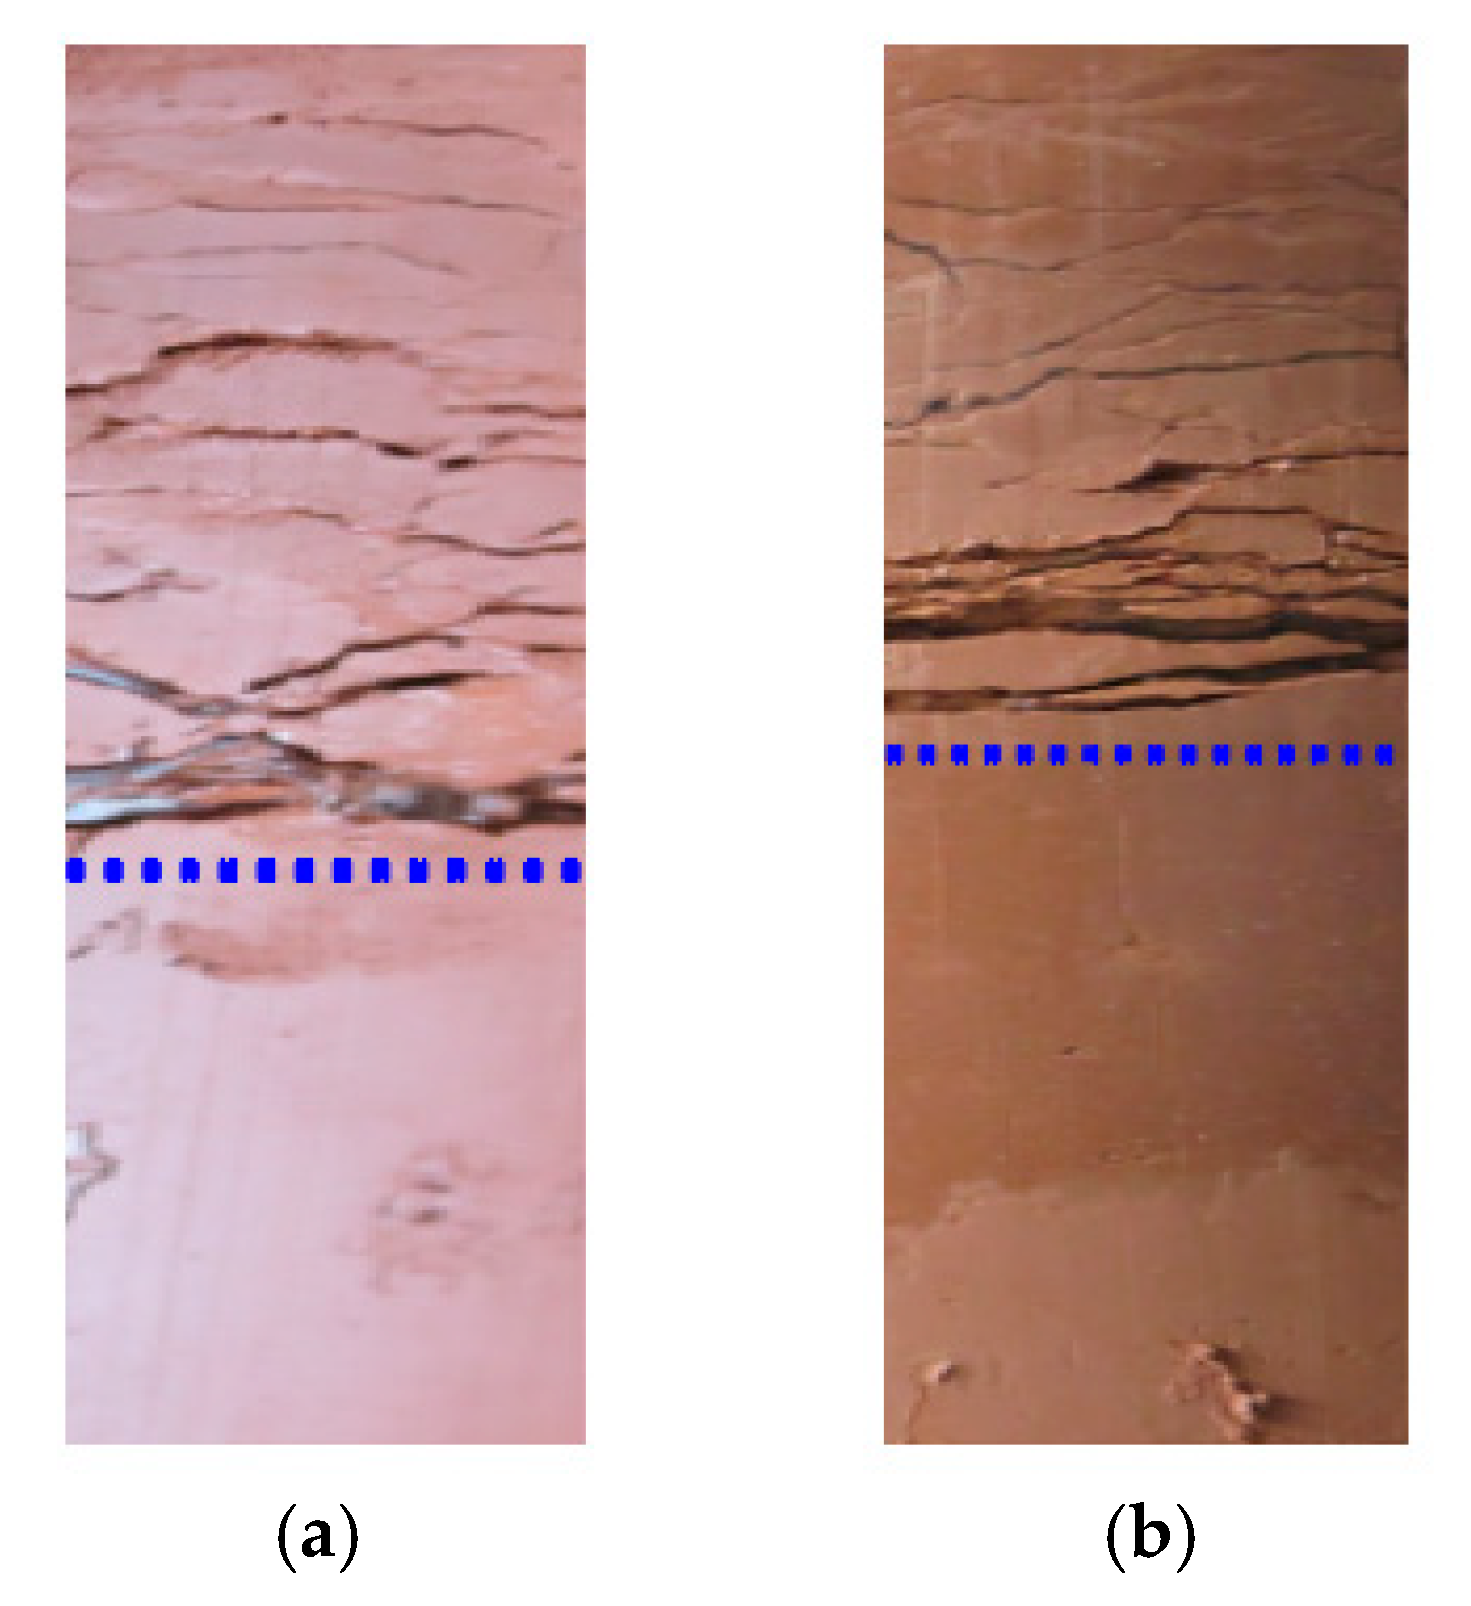
Both horizontal and vertical cracks were observed at the surface of the soil column during testing, as shown in Figure 1. In the frozen zone above the freezing front, most of the cracks were horizontal cracks. No cracks were observed in the unfrozen zone. The ice lenses were distributed discontinuously layer by layer. Initially, the soils located near the upper cold end were quickly frozen, which resulted in the formation of ice lenses with a thickness of 0.08 cm located at a height of 9.2 cm. At 90 h, the freezing front remained at the height of 5.27 cm, where thicker ice lenses were formed and the water content was 99.03%.
2.2. Basic Assumptions for Ice Segregation on One-Side Freezing of Soil Columns in an Open System
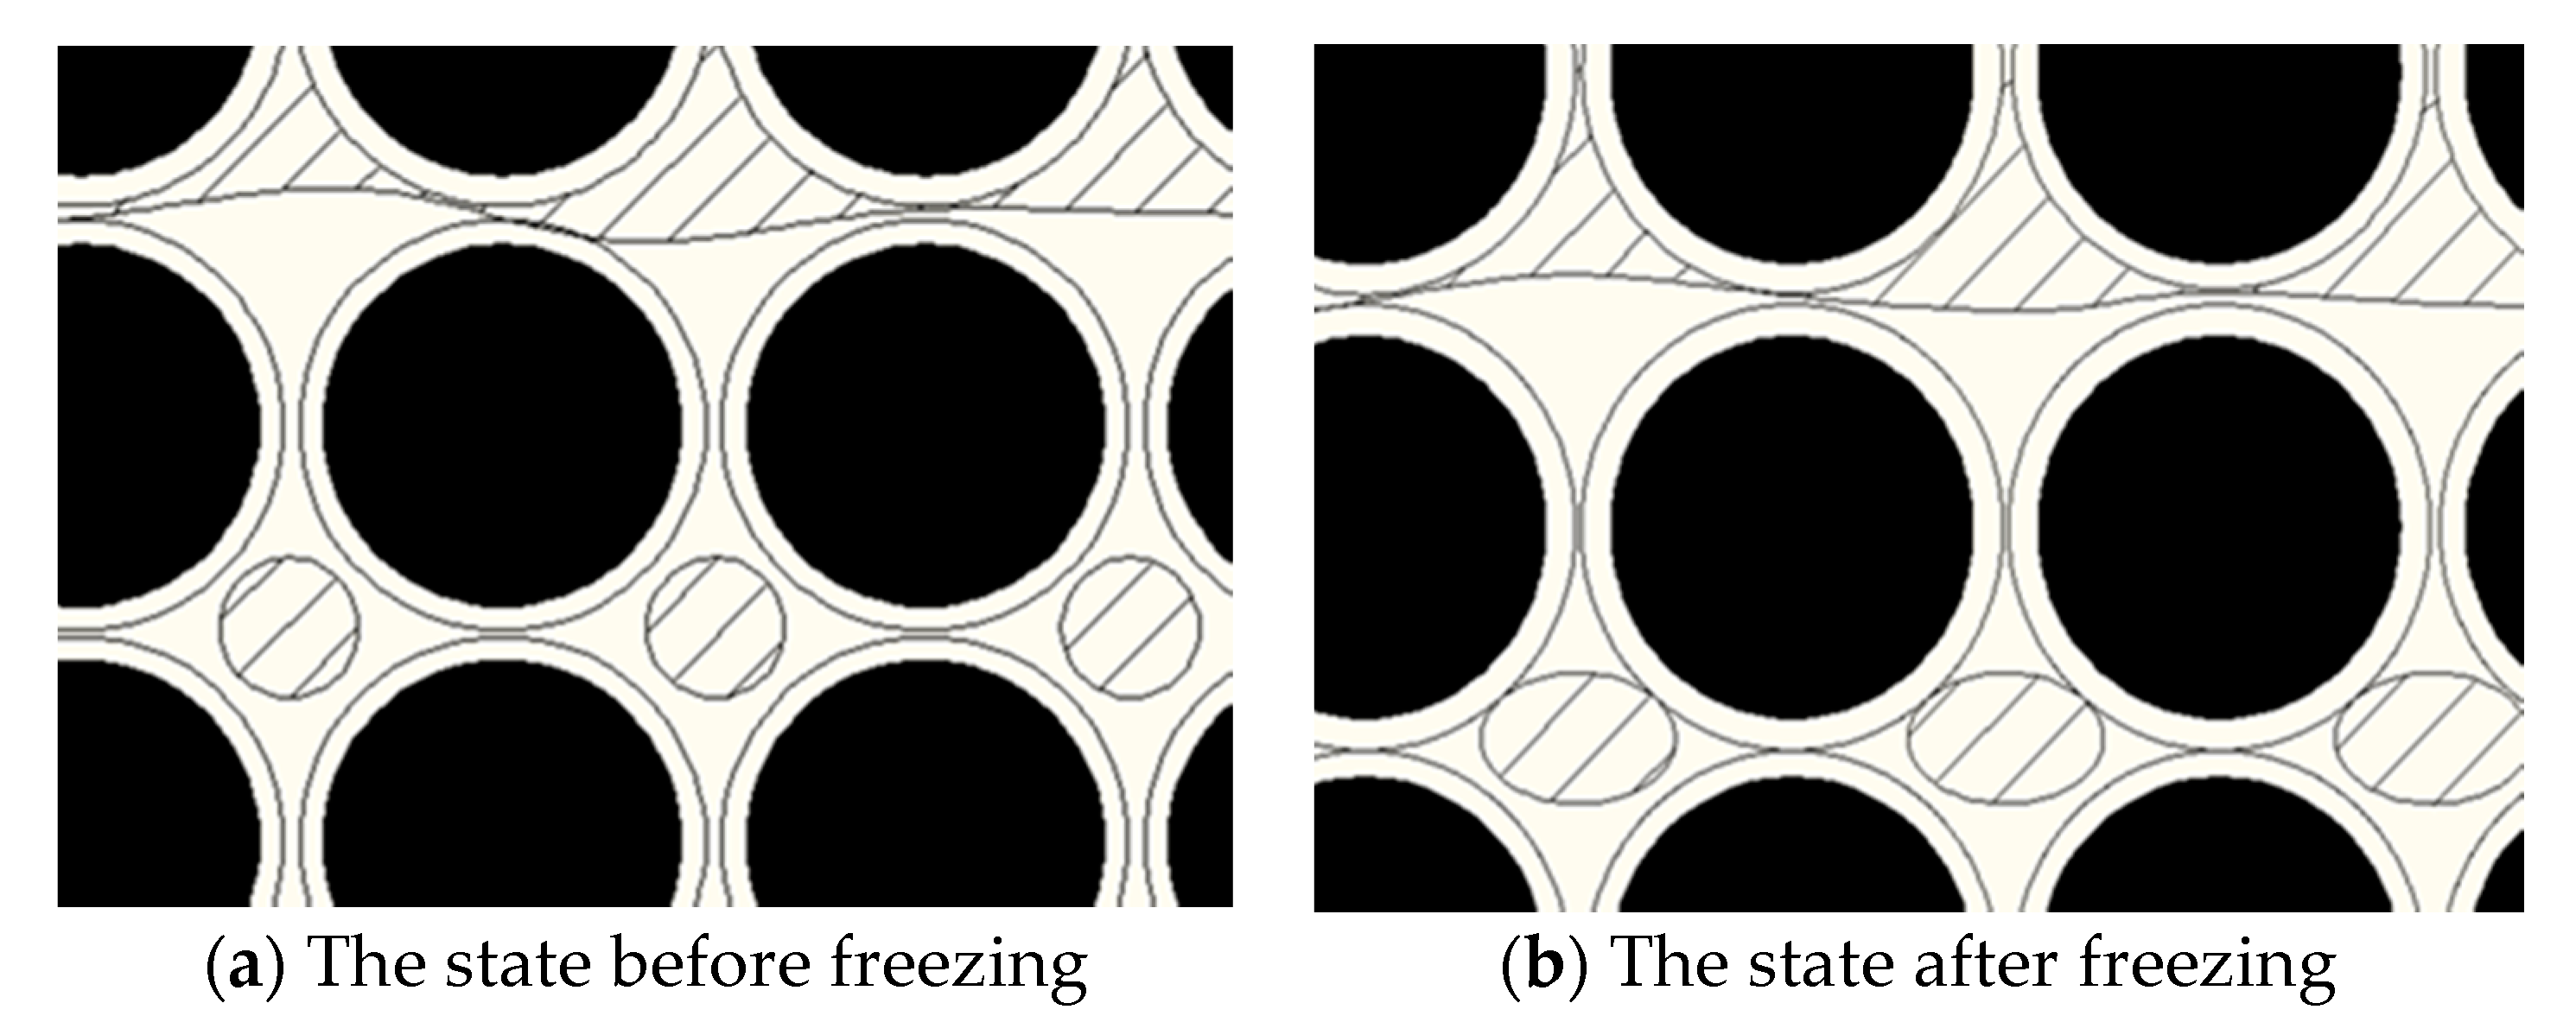
A delay occurred between the moments for the change rate of frost heave and the temperature to stabilize [19]. This conclusion provides the theoretical basis for water transforming into ice below xsep, which is the position where the ice lenses are formed, as shown in Figure 2, where the upper zone is cold, and the lower zone is warm. Figure 2a,b presents the states of the open system before and after freezing, respectively, where the circles filled with black shadow represent soil grains; the circles or ellipses with slashed shadow represent ice crystals; and the slashed shadow area represents the ice block. The annulus outside the filled circle represents the thin unfrozen water film; the curve represents the potential position xsep of the ice lens; and the other symbols represent the unfrozen water.
Below the freezing zone, the negative pore water pressure is induced by phase change due to reduced temperature, and the zone therein is compressed. According to the principle of effective stress for saturated soil [21,22,23], the effective stress in an unfrozen zone near a freezing fringe increases.
In this study, to illuminate how the ice lenses were formed and layered, the following assumptions were made: (i) among the soil grains, unfrozen water always exists in the freezing process; (ii) unfrozen water migrates along the unfrozen water film; and (iii) when the unfrozen water film becomes thinner to a certain extent, the soil grains adsorb water more strongly, which reduces the migration of unfrozen water significantly.
2.3. Initial Stage of Freezing Process
When the freezing process begins, the temperature of soil grains at the cold end is extremely low; therefore, ice crystals formed rapidly and developed with a great gradient. The cryogenic suction, defined as the maximum between the ice pressures, water pressures, or zero, is associated with the potential that develops between the ice and unfrozen water phases, is sufficiently large to compress the soil and reduce the void ratio in these conditions. Therefore, a water-resisting layer can be rapidly formed by the unfrozen water film between the ice crystal and soil grains, which can impede water migrating up, as shown in Figure 2b. Above the water-resisting layer, the unfrozen water transforms into ice crystals until ice and water coexist in phase equilibrium. Under these conditions, however, ice lenses cannot be formed because of insufficient water supplement. In addition, cryogenic suction appears near the cold end and far away the warm cold, which barely drives water to move up from the bottom (or warm) end where water is supplied in a short duration. This can be explained as follows. The soil column of the experiment can drain at the bottom. When the cryogenic suction appears owing to the low temperature, it primarily absorbs water from the zone near the cold end of the soil column instead of the warm end occurring to the position of the cryogenic suction near the cold end and faraway the warm end. However, because the water supplement system is composed of a Mariotte flash connected with the bottom plate tube, the cryogenic suction cannot effectively drive water to move up until the formation of a water-resisting layer composed of an unfrozen film between the ice crystal and soil grains, which can separate or cut off the cold end of the soil column and result in an effective cryogenic suction on its warm end.
2.4. Formation of First Layer of Ice Lenses
Considering the path of moisture migration, the formation of the first layer of ice lenses is summarized and analyzed in terms of two approaches in this section.
2.4.1. Migration of Water outside Unfrozen Water Film
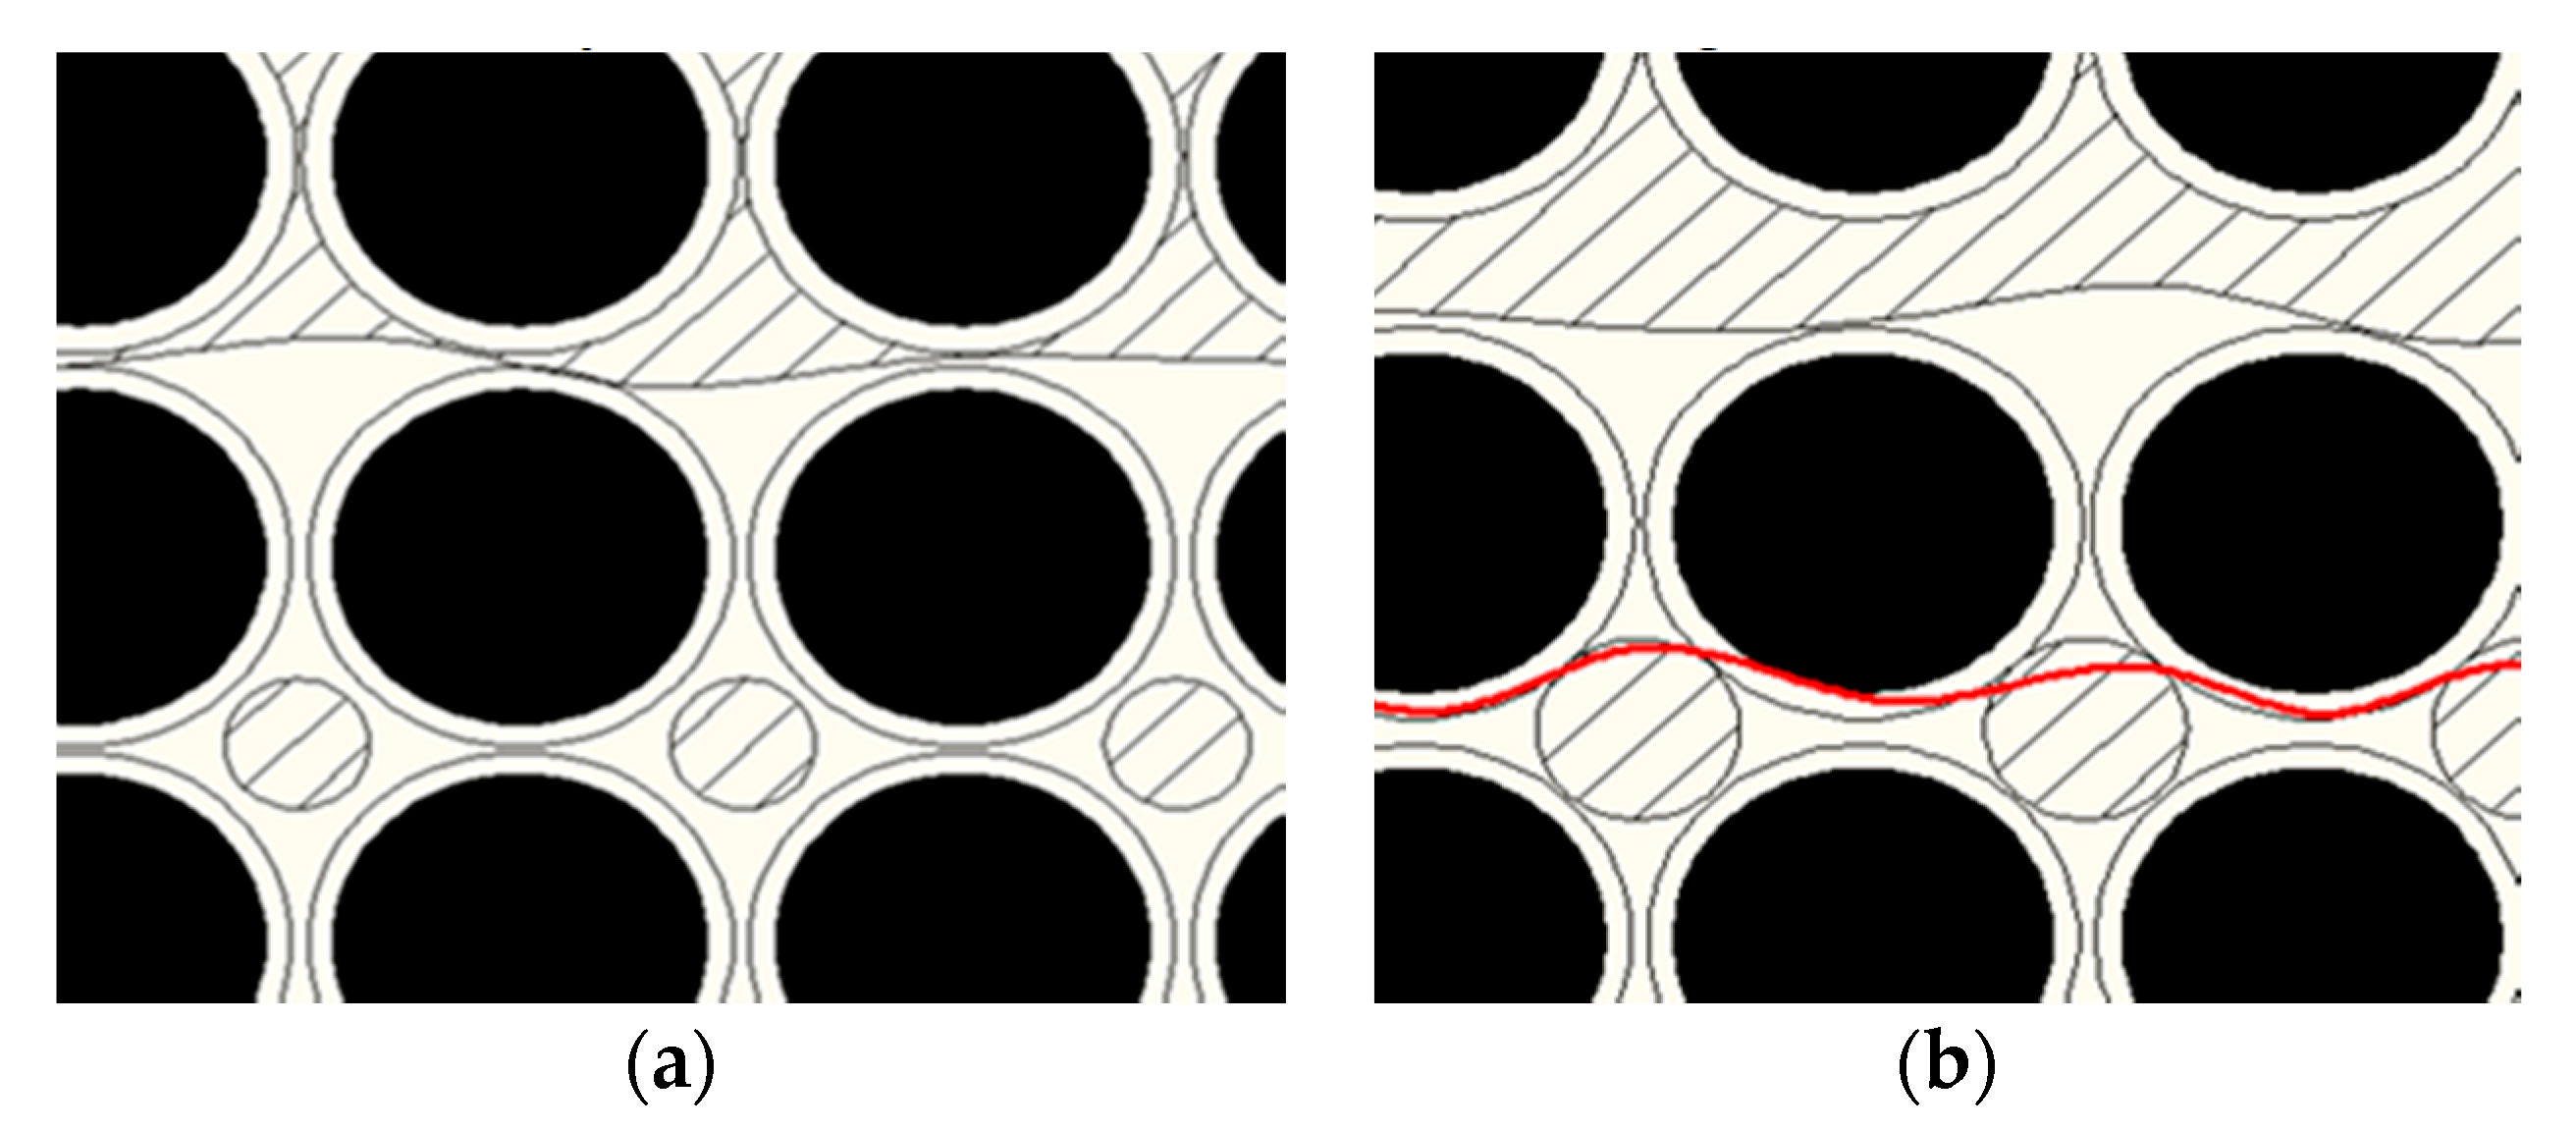
After some of the soil column froze, the temperature gradient decreased, the growth rate of ice crystals at the freezing fringe decelerated, and the cryogenic suction decreased. At this moment, the void ratio could remain large, compared with the initial void ratio, owing to the phase change; therefore, the water migrated to outside the unfrozen water film, which might result in a much longer duration for the formation of a water-resisting layer composed of a thinner unfrozen water film between ice crystals and soil grains; hence, ample water gathered toward the freezing fringe. When the temperature was below the freezing temperature, the water around the freezing front migrating from the unfrozen zone turned into ice, which contributed to frost heave. Ice lenses formed, provided that the ice crystals connected with each other, as shown in Figure 3b. It should be noted that the thickness of the ice lens depends on both the duration required for forming the water-resisting layer and the water supplementation; therefore, the first ice lens, but not the final one, has a sufficiently low temperature to form ice crystals and hence, separate soil grains.
2.4.2. Migration of Water inside Unfrozen Water Film
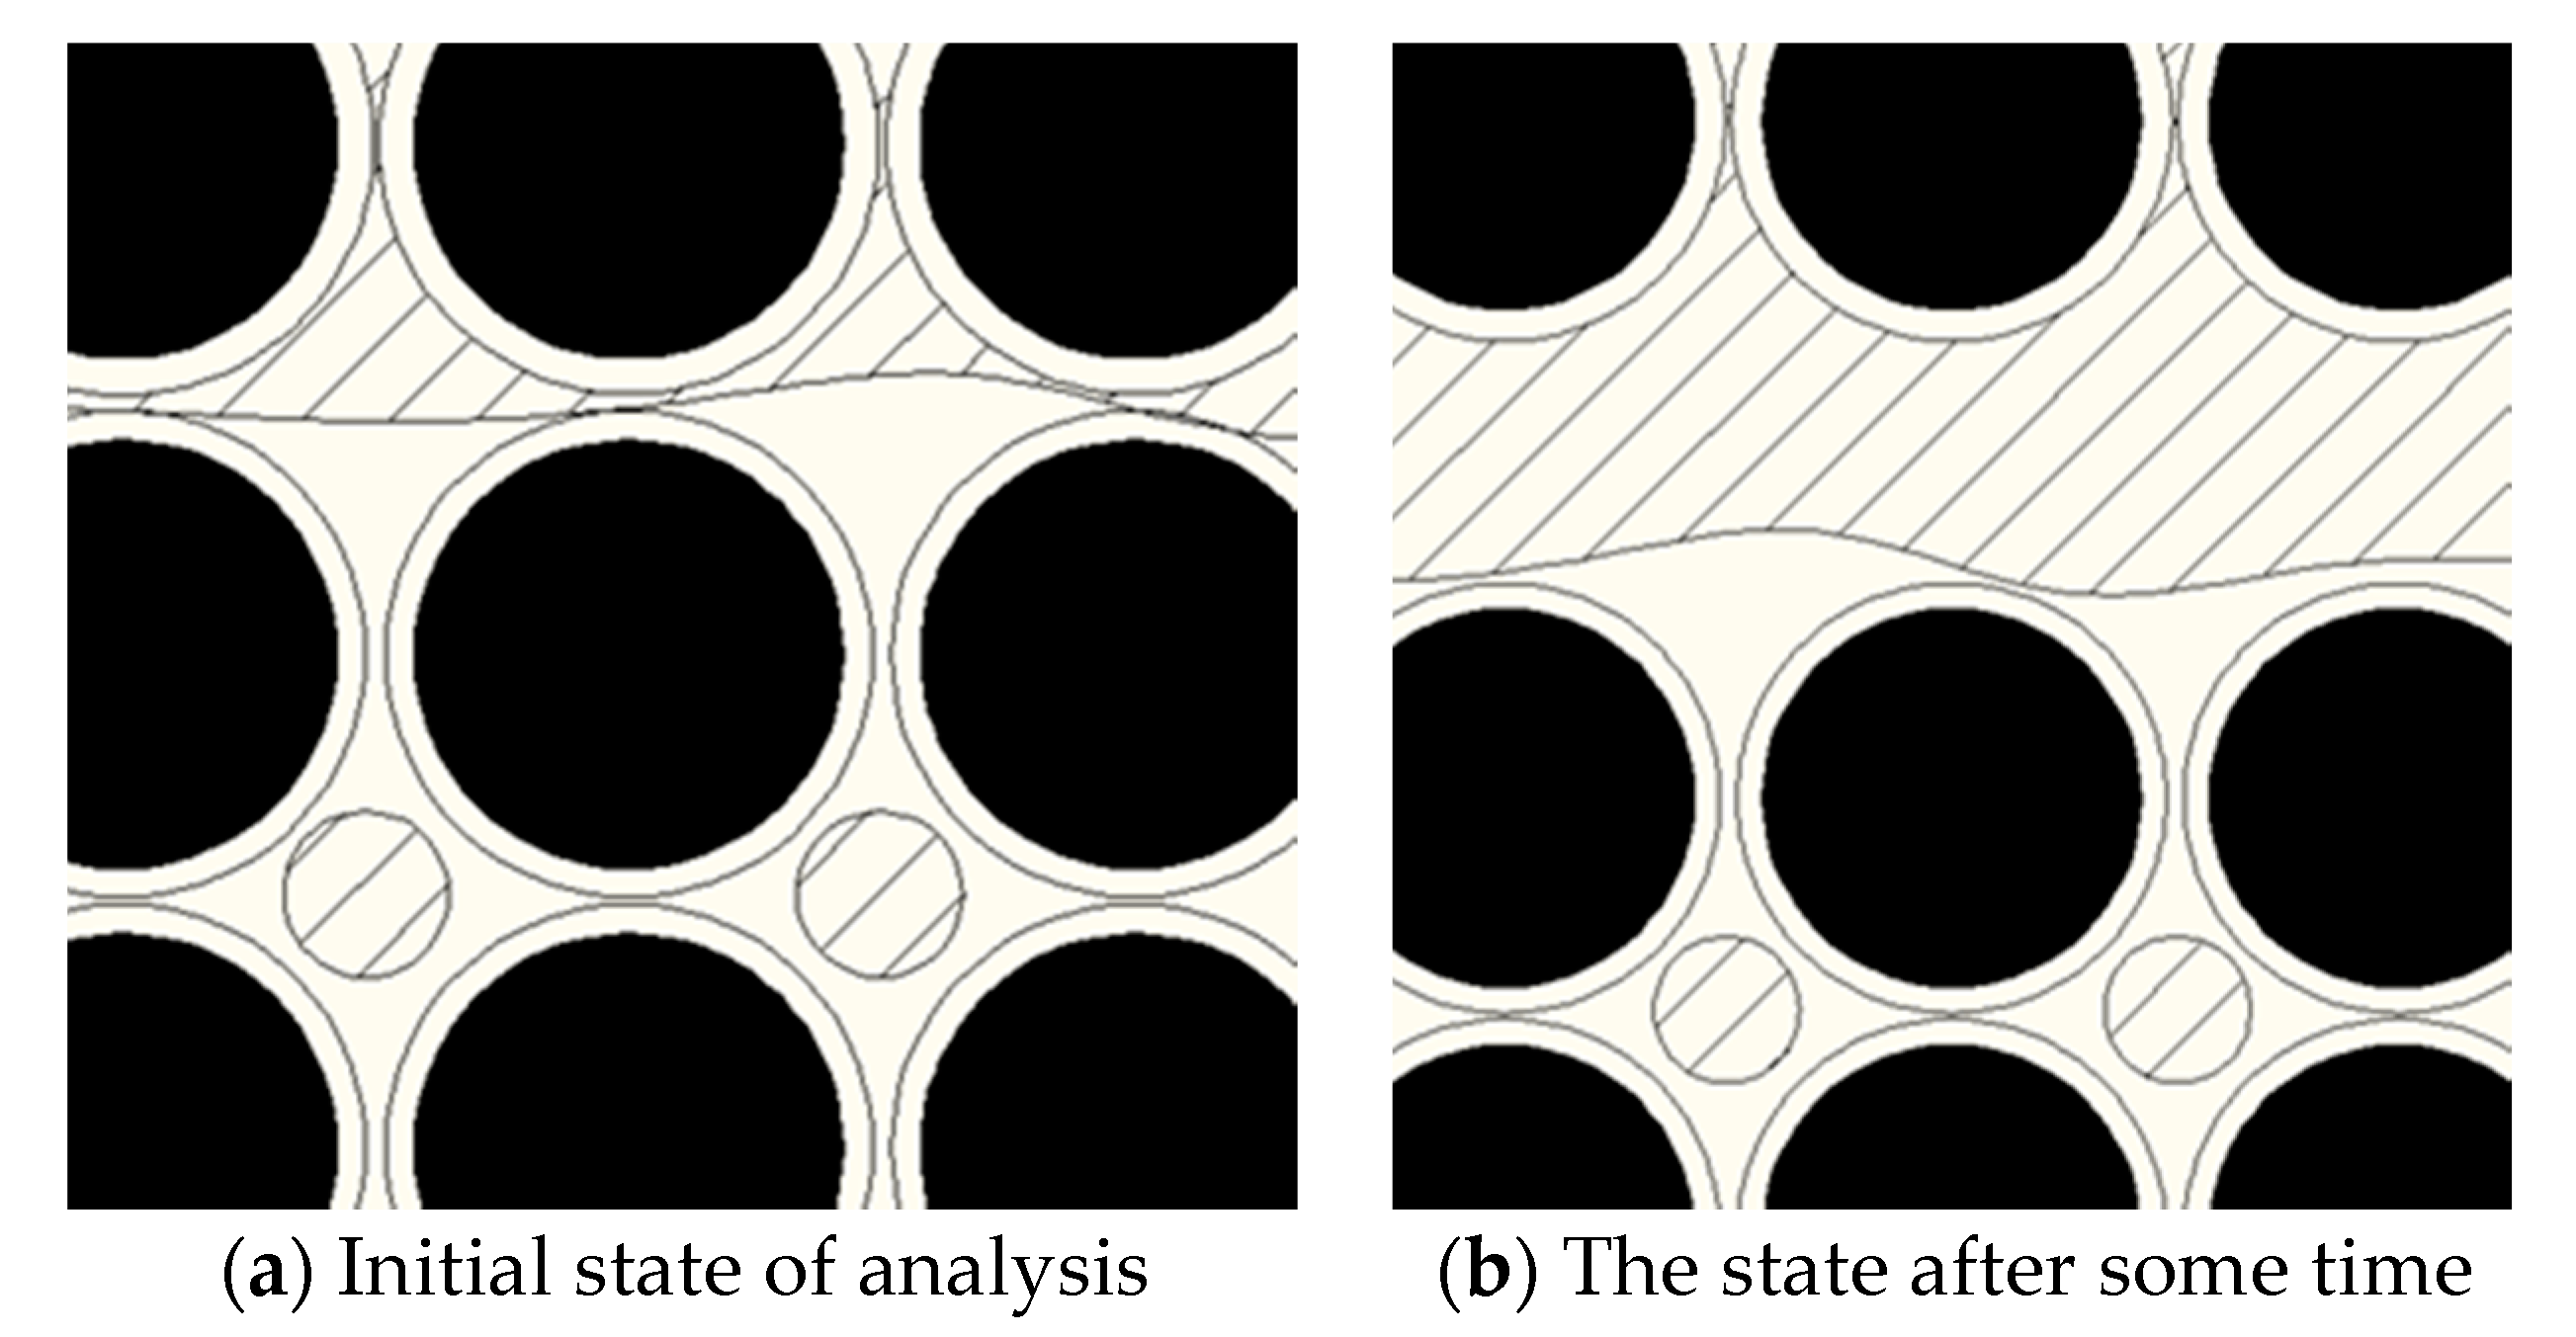
As in Assumption (iii), when the unfrozen water film becomes thin to a certain extent, the soil grains adsorb water more strongly, and the migration of unfrozen water becomes extremely slow. However, when the void ratio of soils does not reach the separate void ratio esep, the thin unfrozen water films between the soil grains will connect with each other to form water channels, as shown in Figure 4a. In this case, although the ice crystals can separate the soil grains, they do not connect into one unit. Therefore, water may migrate inside the unfrozen water film, as depicted by the curves with arrows in Figure 4a, and at the moment when ice lenses cannot be formed. When the temperature is sufficiently low, water transforms to ice, which increases the void ratio larger and destroys the water migrating channel; hence, a water-resisting layer can be formed, which results in the formation of ice lenses accompanied by water immigration. The Clapeyron equation provides the relationship among temperature, water pressure, and ice pressure when ice and water coexist in phase equilibrium [24,25,26], as follows:
where L is the latent heat of fusion; and are the absolute pressures of pore water and pore ice, respectively; is the temperature in Kelvin; ad is the freezing temperature in Kelvin. Equation (1) expresses the cryogenic suction.
As this process continues, the water releases latent heat and the temperature increases. Therefore, the absolute pressure of the pore ice decreases. Furthermore, the water channel remains the same, along which abundant water will migrate to the potential position xsep, where ice lenses can be formed. Once the temperature is less than the freezing temperature of the soils tested, the migrating water turns into ice crystals and ice lenses will be formed and gradually becomes thicker. Whether the ice crystals in the state of separate void ratio esep can separate the soil grains depends on the temperature at which the separate force is resulted and whether the flow channel of the water supplement is maintained well. When the separate force can separate the soil grains and the water supplied is insufficient, the critical state cannot be maintained and the water-resisting layer formed stops the growth of ice lens. However, if sufficient water is supplied and the critical state at esep remains, the water-resisting layer cannot be formed and hence the ice lens will not grow. If the separate force cannot separate the soil grains, it implies that this ice lens is the final layer.
2.5. Formation of Second Layer of Ice Lens
When the water-resisting layer is formed, the water supplement is impeded. When all the water gathered near to position xsep turns into an ice lens under cryogenic suction, the growth of ice lenses stops, which means that the first ice lens is formed completely. Subsequently, during the proceeding freezing process, the second layer of ice lens may appear, but its position will not be adjacent to the first one, which can be attributed to the following reasons.
During soil freezing, the ice crystals and soil grains adsorb water owing to the reduction in free water near them. The external water cannot be driven there rapidly, which results in a negative excess pore water pressure, known as the additional force driving the migration of water from the unfrozen zone to the freezing fringe. According to the effective pressure principle [22,23], the effective stress increases, which results in the sliding or rolling of soil grains. Because the formation of the first or above layer ice lens requires some time, the effective stress applied to the soil grains will result in a smaller void ratio during this period. When a low temperature is applied to these soils, a larger force is required to separate the soil grains at a relatively highly compressed state. Therefore, it is difficult for ice lenses to form therein. In addition, because of the smaller void ratio, only a short time is required for the ice crystal to grow sufficiently to combine with the unfrozen water film between the soil grains to form a water-resisting layer. Because of insufficient water supplementation, ice lenses cannot be formed.
Owing to the reasons mentioned above, the soils located below the first layer of the ice lens will be longer along the soil column, where ice lenses cannot be formed. For the soils located below the first ice lens, where the ice crystals can separate the soil grains easily, some lengths are weakly compressed and have a small displacement. At that moment, the water-resisting layer of subjacent ice crystals is not formed, and the water gathered therein turns into ice crystals, thereby releasing some latent heat, which results in a temperature increase. Both the cryogenic suction and reducing tendency of the void ratio decrease, thereby delaying the formation of the next water-resisting layer. Accompanied with the ample water gathered therein, a second layer of ice lens can be formed. Therefore, some distance appears between the first and second layers of the ice lenses, as shown in Figure 1.
2.6. Ending of Ice Lens Formation
It is noteworthy that the approaches for predicting the formation of ice lenses, which have been used by many scholars [4,12,13,14,19], are more suitable for the formation of the final layer of ice lens during the freezing of soil column. Indicators to judge whether ice lens can be formed may be the temperature, sum of the total stress and separation strength, pore water pressure, pore ice pressure, pore pressure, and critical void ratio. The pore pressure is the combination of pore water pressure and pore ice pressure. The separation strength or separate pressure was first presented by Gilpin [5], i.e., in the range of 20–150 kPa [9], for which, when the ice pressure exceeds the overburden pressure plus the separate strength, the separation of soil grains is initiated. Two primary methods of ending the growth of ice lens are summarized herein. The first method is to halt the growth of ice lens. With the freezing front propagating in the soil column, the temperature increases; when it is above the freezing temperature of the soils tested, the next ice lens cannot be formed, as shown in Figure 5. The other method is that, when the void ratio is less than or equal to the critical value and the separate force cannot break this state, the next ice lens cannot be formed; under these conditions, water will migrate toward the freezing front and turn into ice crystals, resulting in a thicker ice lens until the cryogenic suction induced by the low temperate disappears. According to this rationale, some phenomena occurring during freezing can be explained. Lai et al. [19] conducted two experiments under different conditions, in which the initial water content was approximately 20.59% and the initial temperature in the soil columns +1.5 °C. The controlled temperatures at the warm and cold ends were +1.5 °C and −1.6 °C, respectively. The experiment duration was 90 h. Conditions I and II involve overburden pressures of 50 and 100 kPa, respectively. It is believed that the higher overburden pressure hinders the soils to reach the critical void ratio; in this case, a lower temperature is required to form ice lens such that ice crystals can grow to separate the soil grains. The temperature profile is almost linear in both the fully frozen and unfrozen sections of the column. Therefore, the phenomena appear as shown in Figure 6, where the position of the freezing front in Condition I with an overburden pressure of 50 kPa is lower than that in Condition II with 100 kPa.
3. Numerical Example and Analysis
In this section, a coupled thermo–hydro–mechanical model is used to elucidate the analysis on the experimental results of one-side freezing of soil columns in an open system, mentioned previously in Section 2. The moisture migration and change in void ratio during freezing are described herein, as well as associated problems in mathematics [12].
3.1. Coupled Thermo–Hydro–Mechanical Equations
3.1.1. Moisture Transfer
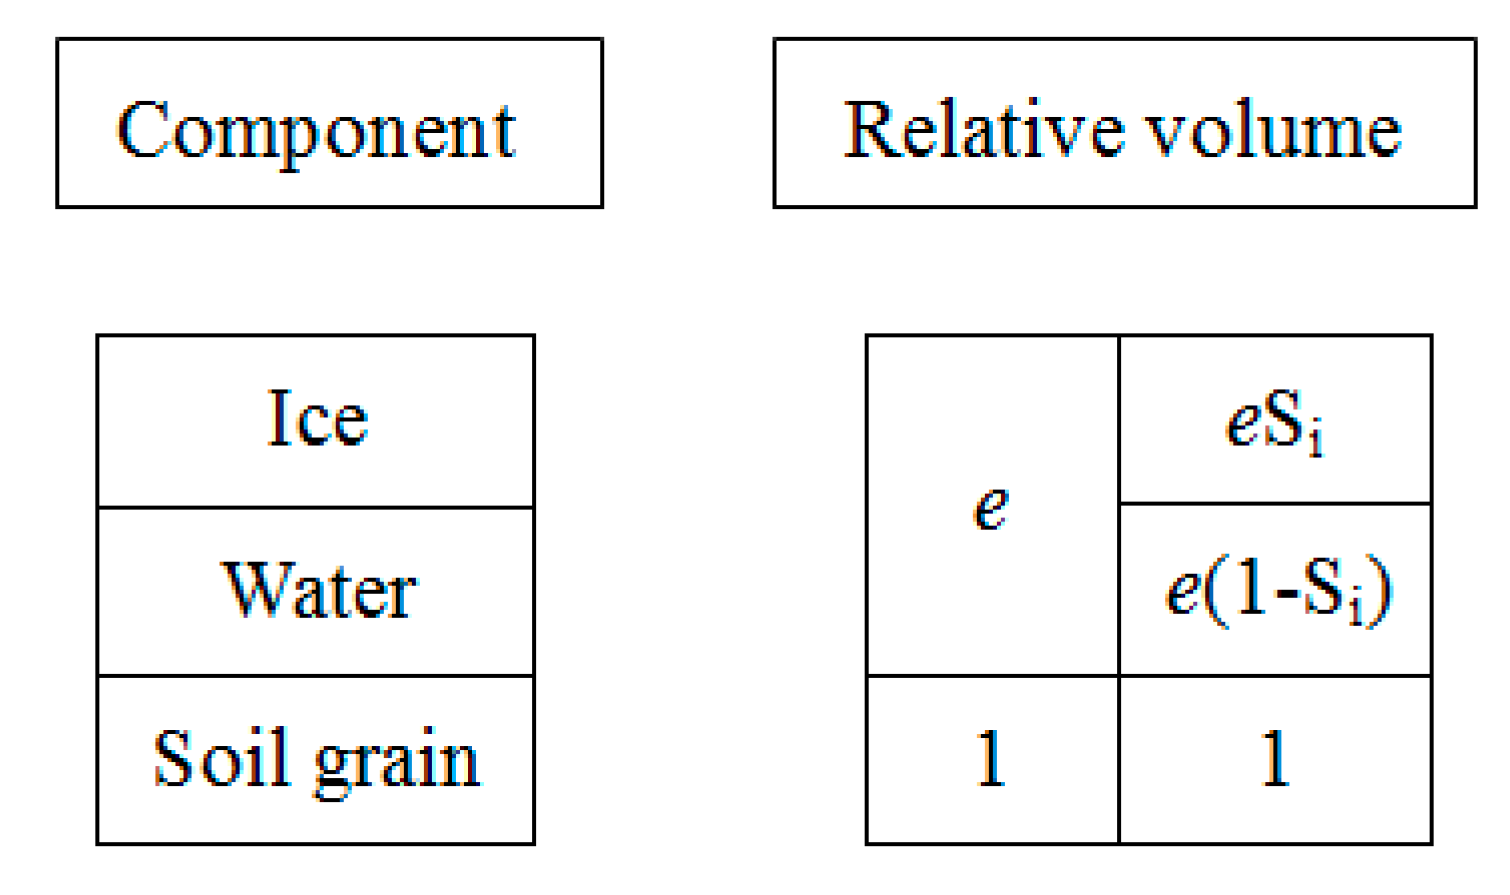
Figure 7 shows a three-phase diagram of saturated freezing soils. In the figure, e is the void ratio and Si is the ratio of the pore ice volume to the pore volume. In freezing soils, Si is a function of temperature [1], which can be written as
where T0 is the freezing temperature of pore water and α is an experimental parameter.
The law of mass conservation of the moisture of freezing soils can be expressed as
According to Figure 7, the masses of ice mi and water mw in the unit volume of soils with length dx are
and
where and are the densities of ice and water, respectively.
Darcy’s law is adopted to describe the pore water flow as follows:
In freezing soil, hydraulic conduction can be assumed as a function of temperature [12], expressed as
where k0 is the hydraulic conductivity of unfrozen soil and xsep is the position where an ice lens forms.
From Equation (1), we can obtain , and, considering that , , the water head driving the unfrozen water to migration can be expressed as
where is the atmospheric pressure; L is the latent heat of fusion; χ is the pore water pressure coefficient; and Ppor is the pore pressure, expressed as
where es refers to the void ratio at which the effective stress within the soil column is zero; γ is the unit weight of the soil; γ0 is the initial unit weight of the soil; and l is the height of the soil mass.
Substituting Equations (3)–(5) into Equation (2), we can obtain
which is the equation of mass conservation.
3.1.2. Equation of Thermal Diffusion
Between the frozen and unfrozen zones, the latent heat caused by phase transition per unit time can be regarded as an inner heat source expressed as . In unit time, the heat removed by water flow is . The law of conservation of energy yields the equation of thermal diffusion as follows:
where C, Cs, Cw, and Ci are the volumetric heat capacities of soil, soil grains, water, and ice, respectively, which can be correlated, as shown in Equation (13) below. , , , and are the coefficients of the heat capacities of soil, soil grains, water, and ice, respectively, which can be correlated, as shown in Equation (14) below [9].
Substituting Equation (6) into Equation (12), we can obtain
3.1.3. Force Equilibrium
The equation of static balance is as follows:
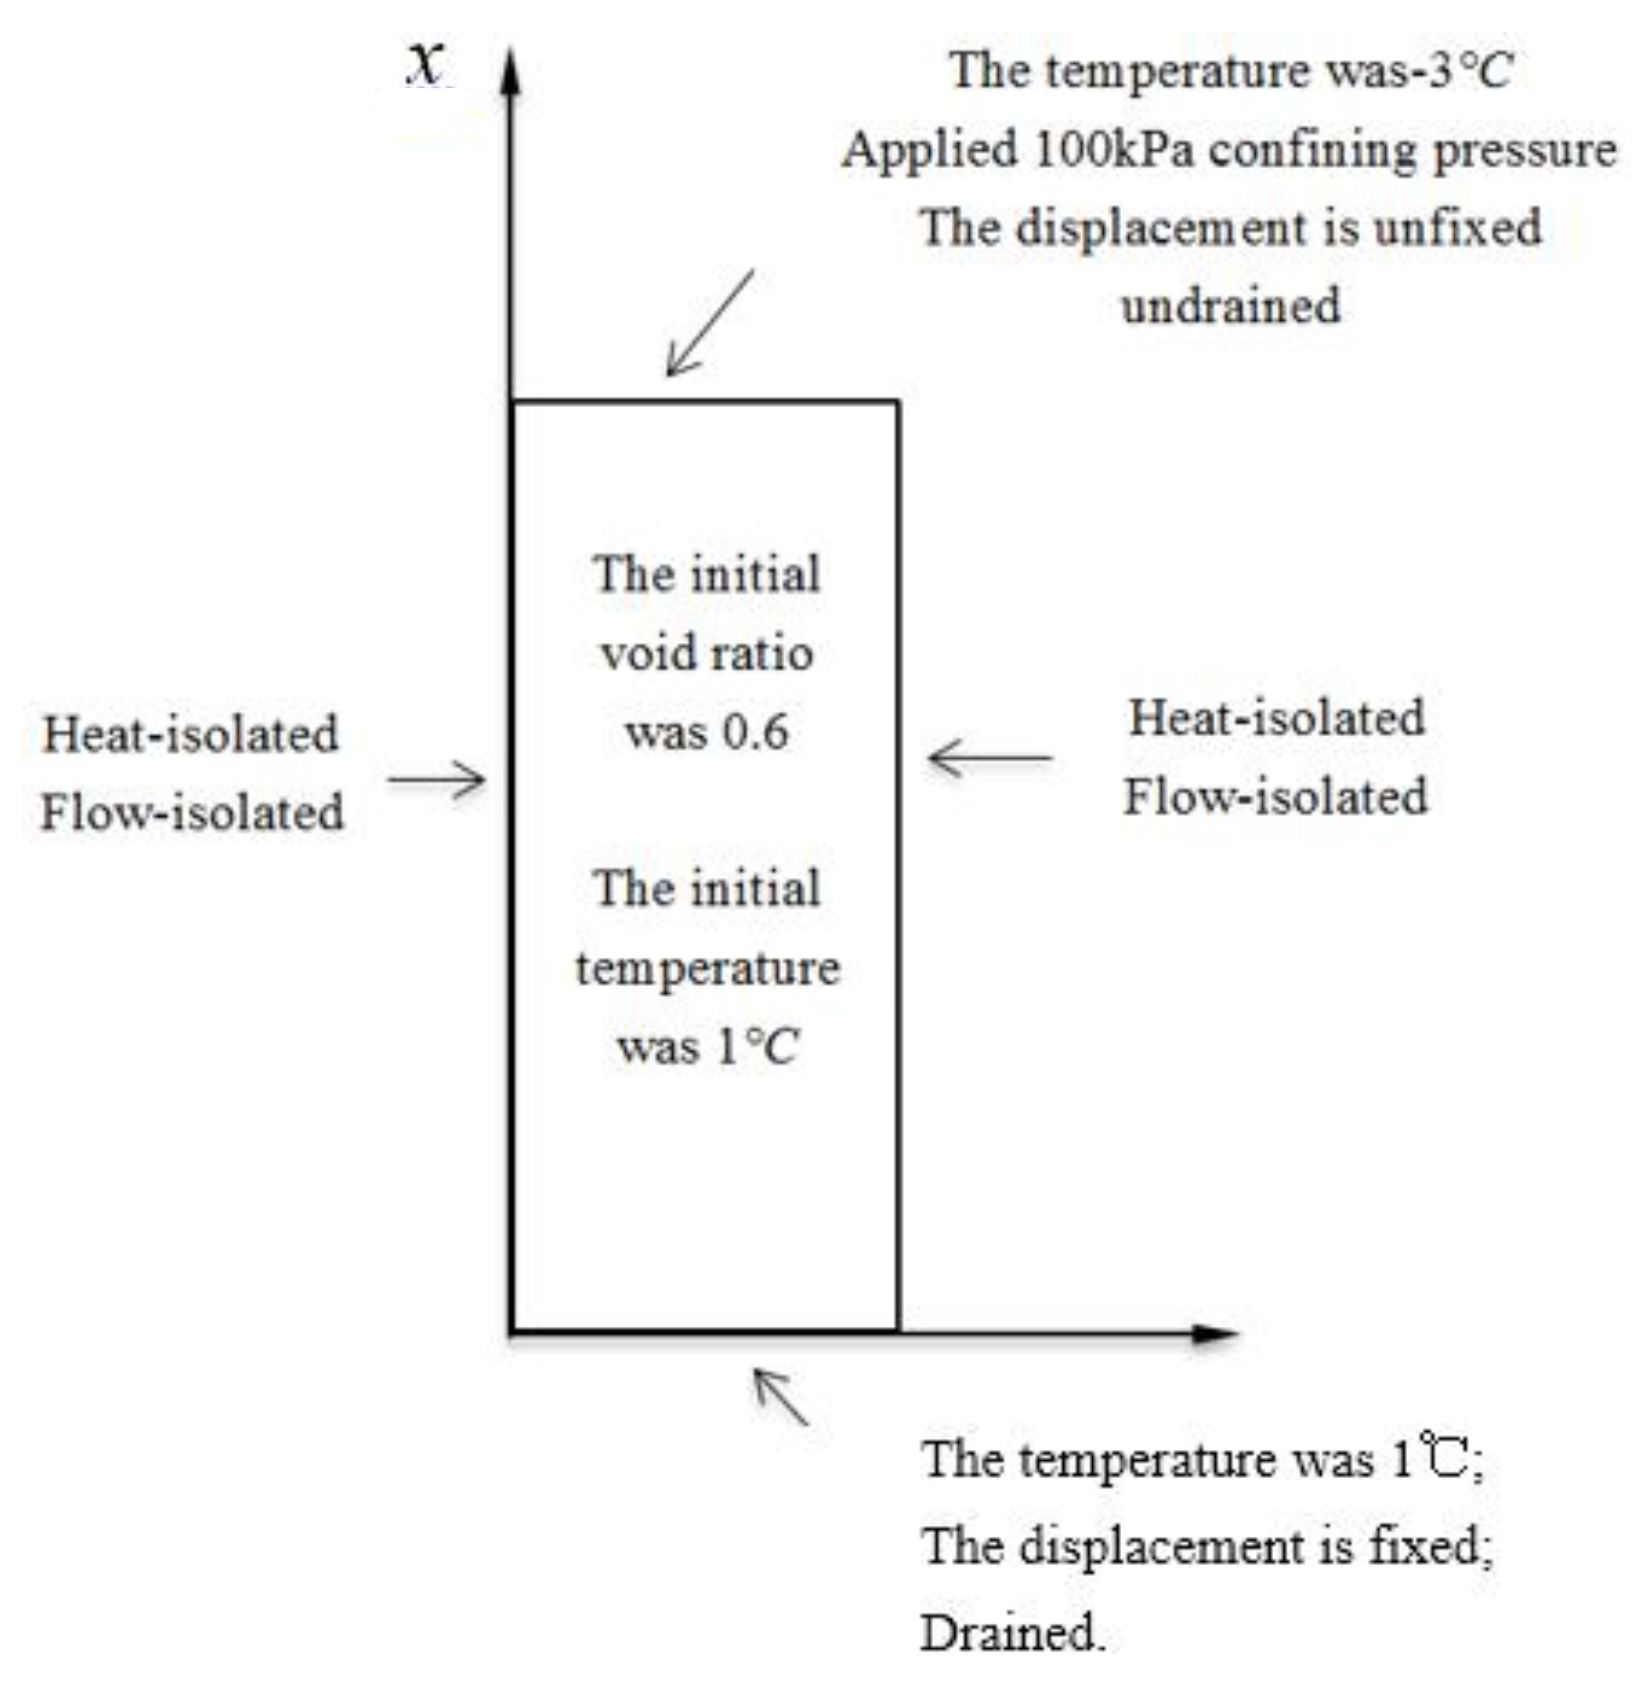
where σ is the total stress of the soil and x is the height of a certain point in the soil column, as shown in Figure 8.
The relation between the displacement u and stain can be expressed in terms of the void ratio e under unidirectional freezing, as follows:
A typical process of coupled water, heat, and stress occurring in a soil column of height 12 cm is considered herein. The initial void ratio of the soil column is 0.6, and the initial temperature of the soil column is 1 °C. When the freezing process began, the top surface temperature was maintained at −3 °C and the bottom temperature remained at 1 °C; its side wall was both heat and flow isolated, and an overburden load of 100 kPa was applied on the top surface. At the bottom, water was supplied from the outside. Disregarding the effect of confining pressure, the process of coupled water, heat, and stress can be viewed as a one-dimensional process, as shown in Figure 8.
3.2. Numerical Simulation and Analysis of Moisture Migration and Layering of Ice Lens
From the deduction above, a coupled thermo–hydro–mechanical model can be summarized and described mathematically as follows.
The governing equations are:
The boundary values are:
The initial values are:
Model parameter calibration: This problem was modeled using COMSOL Multiphysics simulation software. The parameters and their values are shown in Table 1; , , and in Equation (7) are parameters related to permeability, which can be determined according to different types of soil; , , and are densities of the soil particle, ice, and water, respectively; , , and are coefficients of heat conductivity of the soil particle, ice, and water, respectively; , , and are volumetric heat capacities of the soil particle, ice, and water, respectively, which can be determined according to different types of soil; and , g, , and esp are constant. The parameters employed herein are based on [19,20].
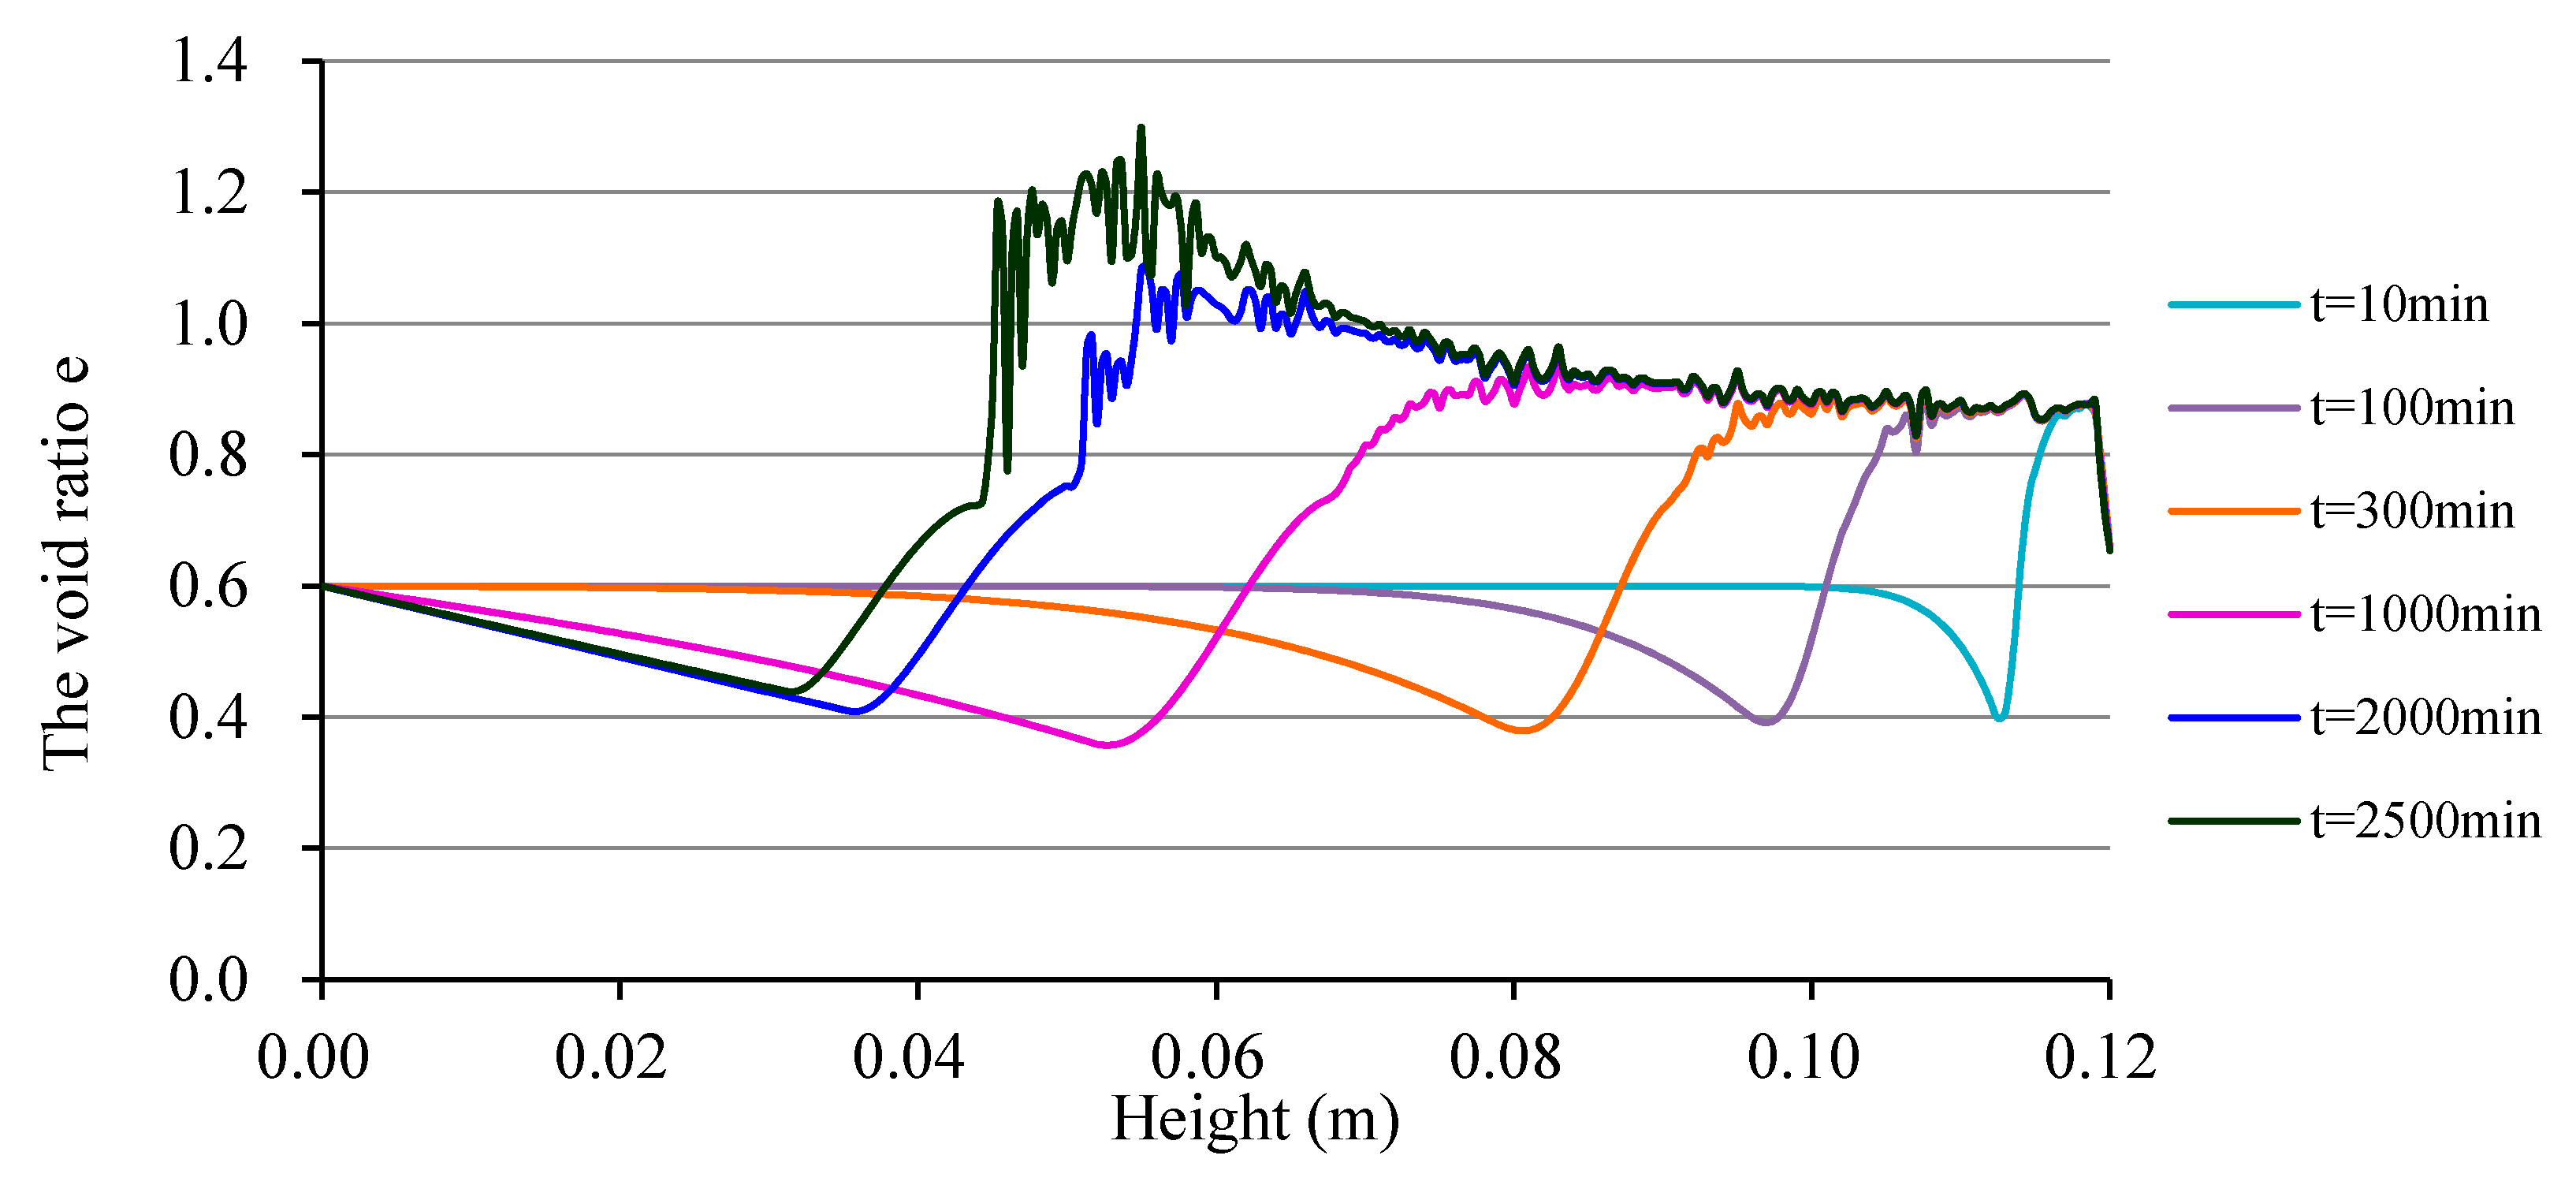
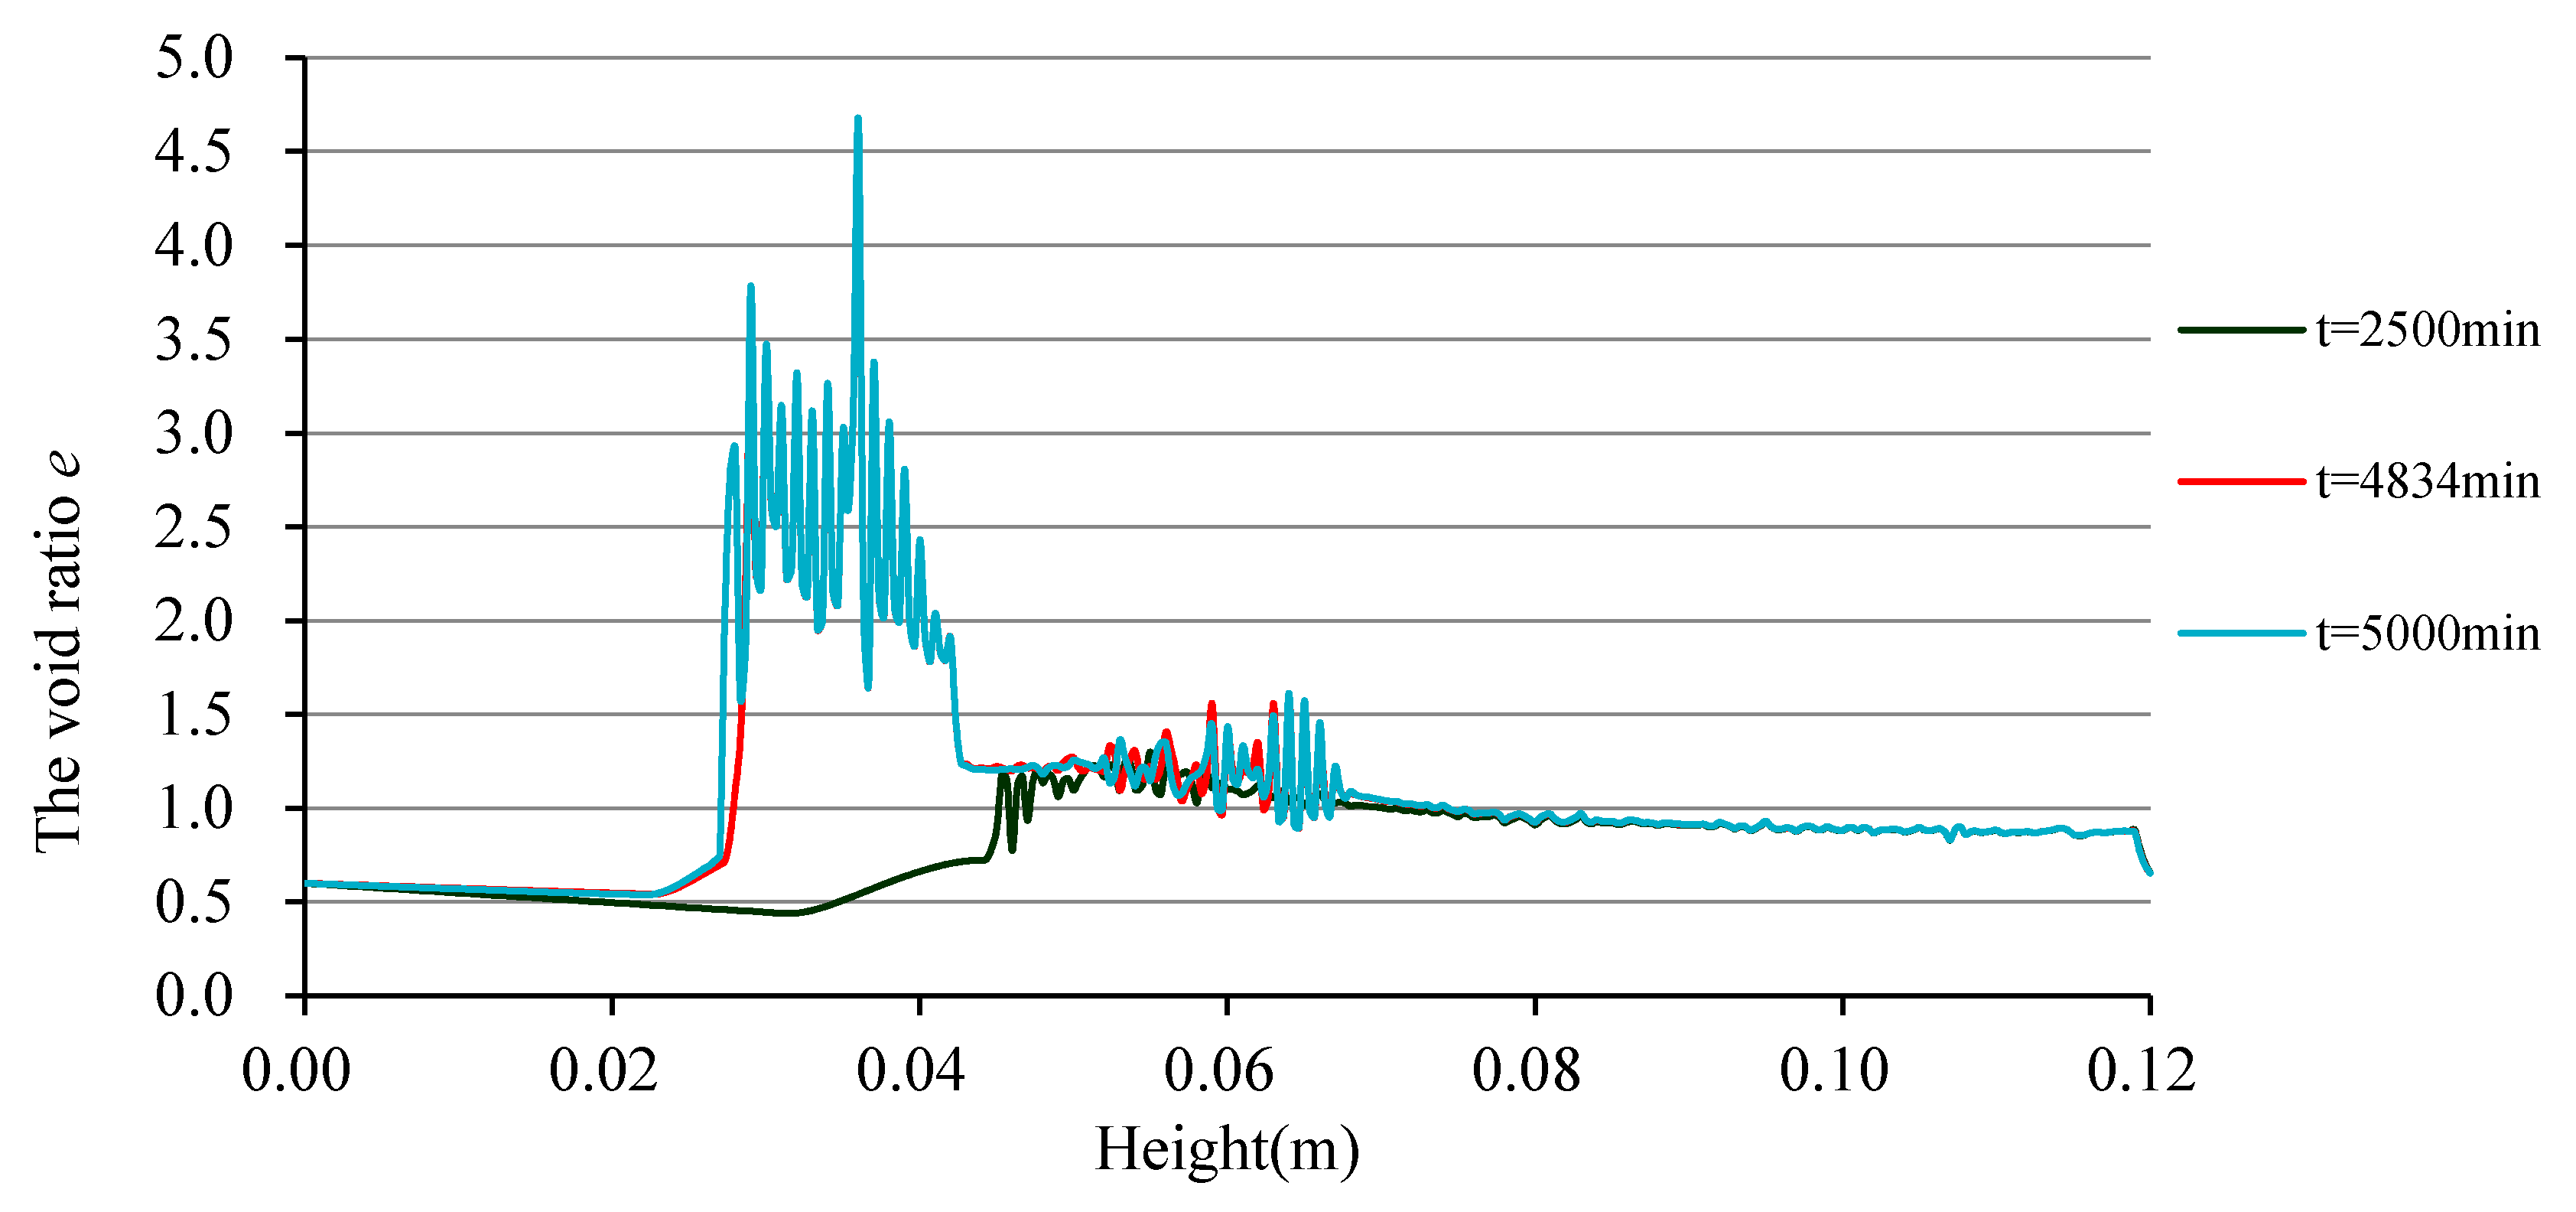
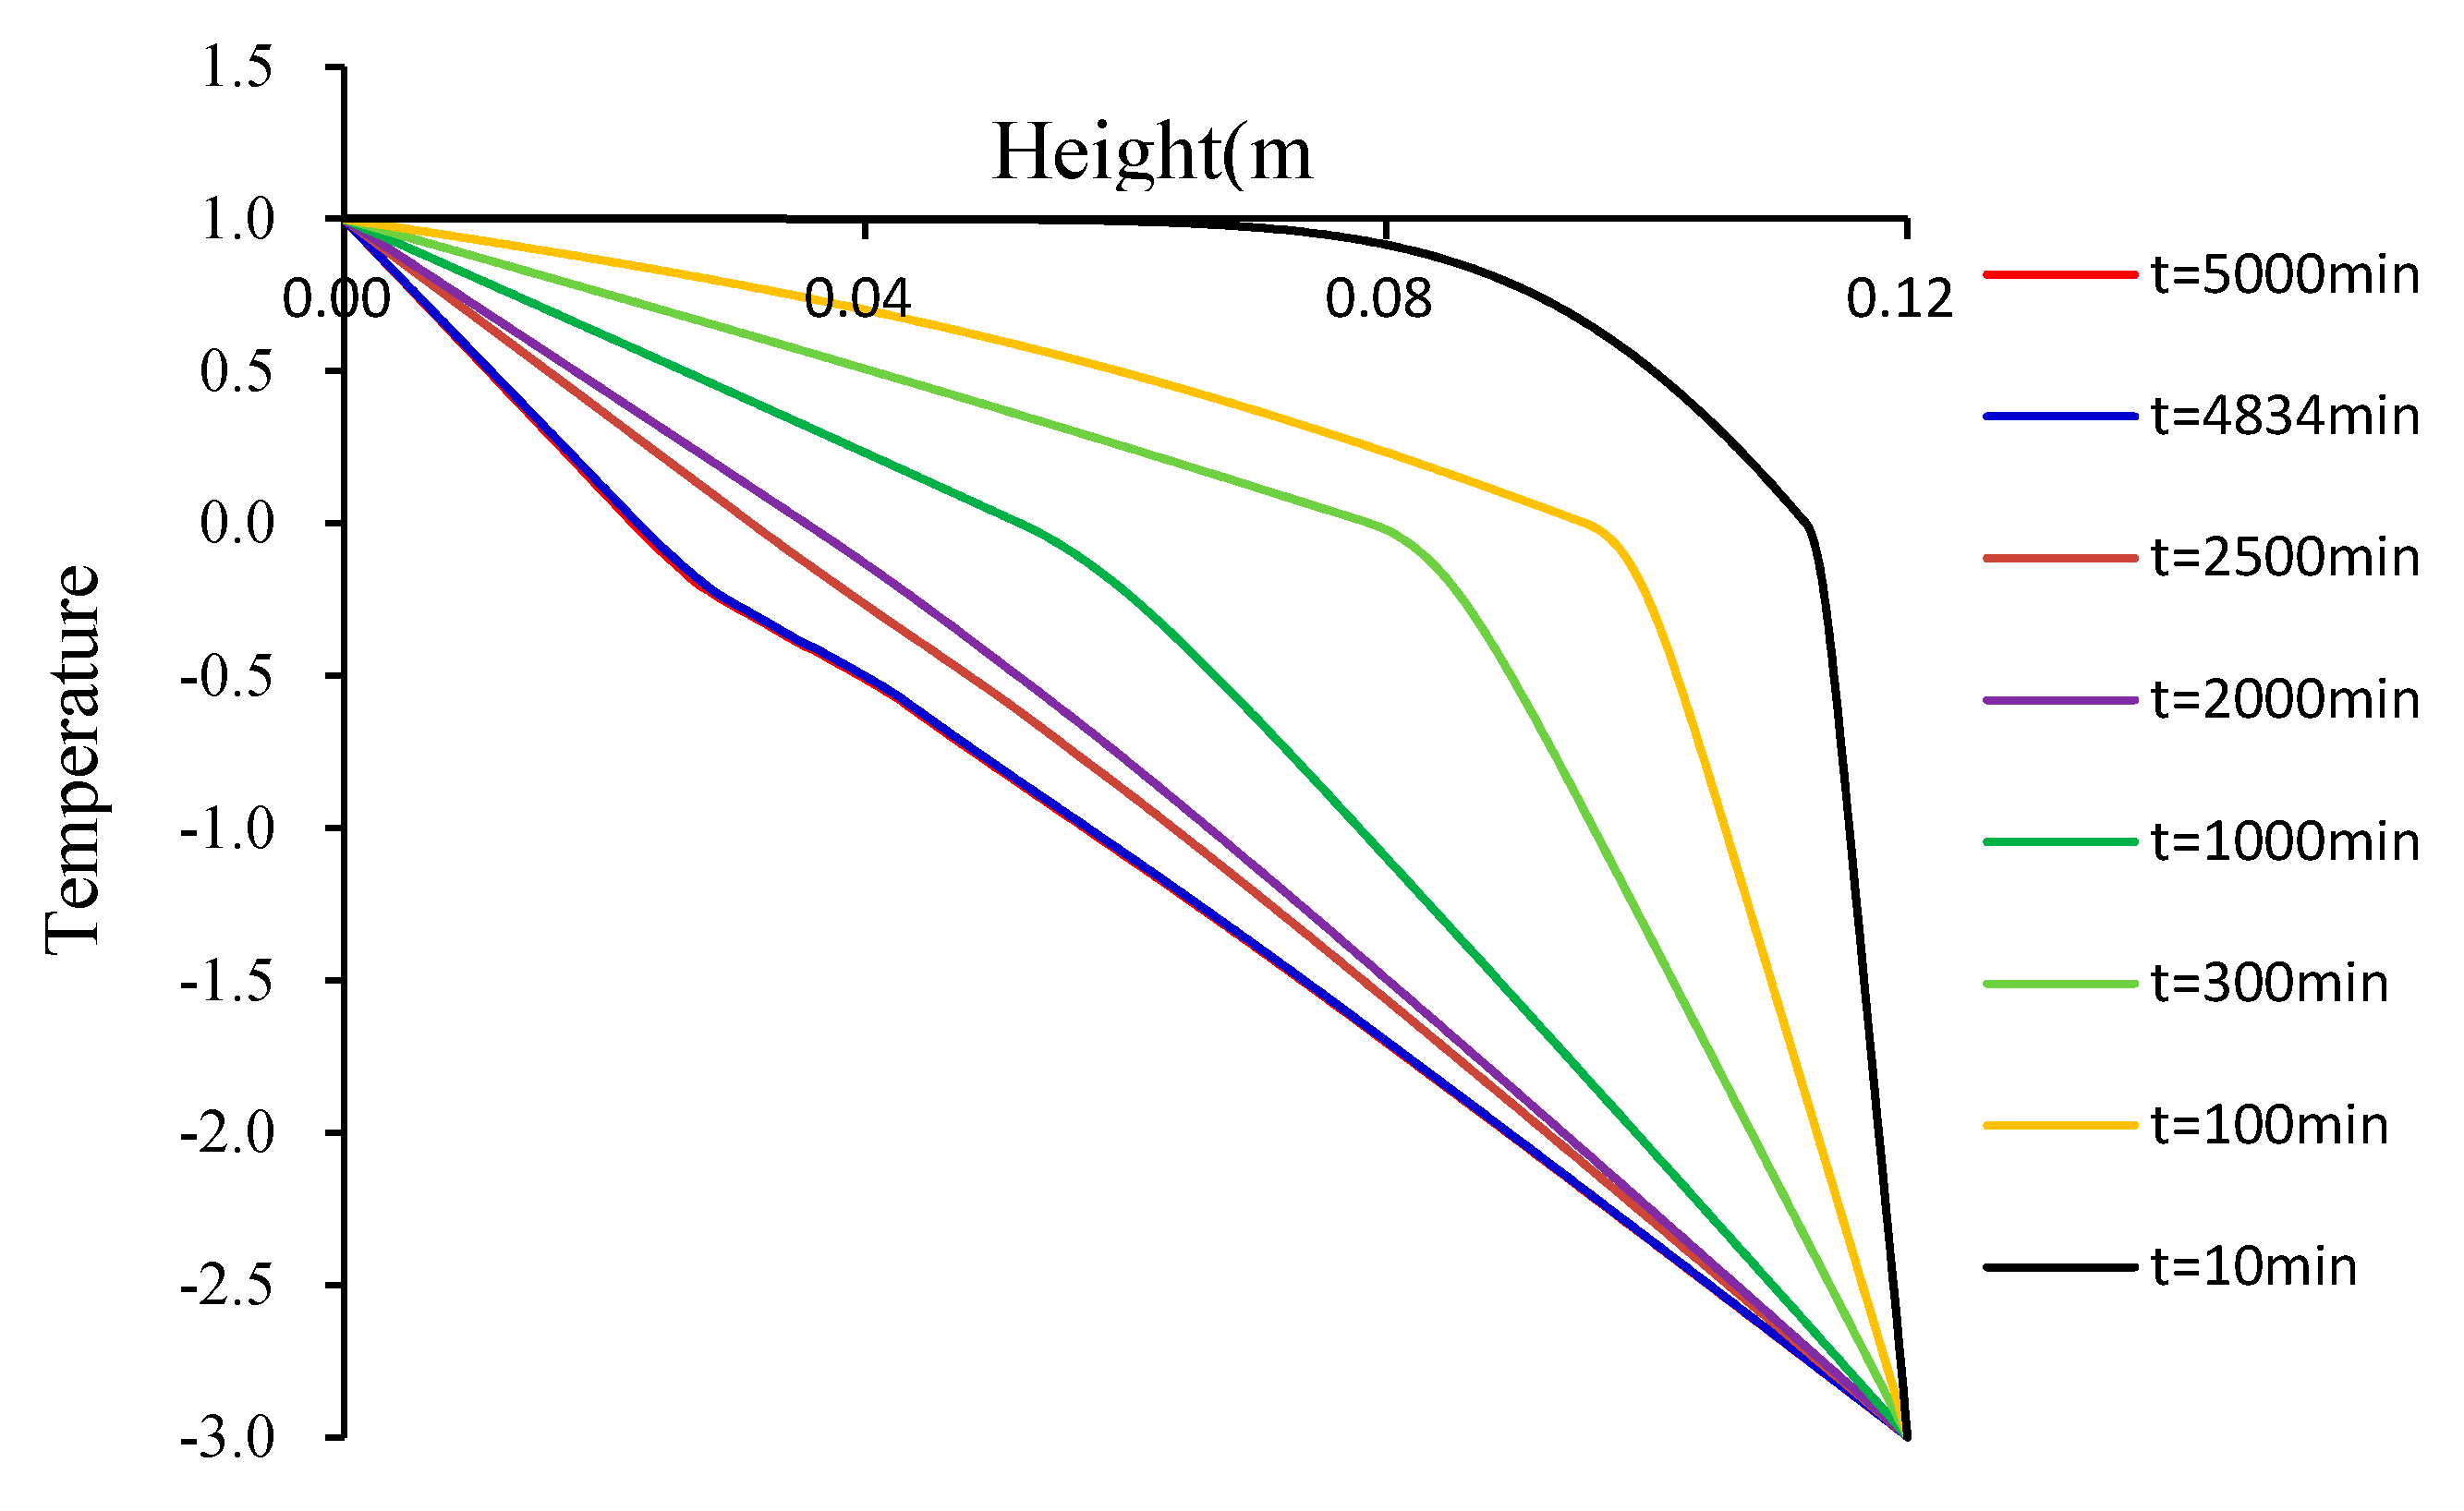
Figure 9 shows the distribution of void ratio at different freezing durations until the first ice lens begins to form. The criterion for the formation of ice lens can be expressed as [12], in which ei is the separate void ratio at which the soil grains were separated. At 2500 min, the void ratio at a height of 0.058 m was greater than 1.2; therefore, an ice lens began to form. As time progressed, more ice lenses formed and grew, as shown in Figure 10. For instance, at t = 10 min in the initial freezing stage, a large negative pore water pressure caused by phase transformation owing to the low temperature appeared in the unfrozen zone, where the cryogenic suction effect might occur, and the void ratio decreased (accompanied by soil compression) within the frozen fringe. However, the void ratio of the soils above the position xsep increased owing to the volume expansion caused by water turning into ice crystals. At this stage, the temperature gradient was greater, and the freezing front advanced downward rapidly such that the water-resisting layer formed rapidly, which impeded the amount of water migrating therein. Therefore, ice lenses could not be formed. As freezing continued, the formation of the water-resisting layer decelerated, and the void ratio of soils above position xsep increased gradually. Because the water-resisting layer was formed before water was impeded from moving up, the void ratio above the water-resisting layer barely changed. Because the soil was compressed when the current void ratio was less than 0.6 of the initial void ratio , we focused on the void ratio distribution, which was less than 0.6 at 10, 100, 300, and 1000 min, indicating the enhanced effect of the soil compression and the widened range of compression zone along the soil column. This may be attributed to two factors. One is the temperature distribution, as shown in Figure 11, in which, as freezing time prolongs, the lengths of the frozen and unfrozen zones increase and decrease, respectively. The low temperature can cause a significant cryogenic suction. The other factor is the localized compression [19]. When the cryogenic suction increases, the soils immediately below xsep will be compressed and have a low void ratio that may counteract with the upward water; consequently, the soil may be compressed. By observing the change in void ratio at 2500, 4834, and 5000 min, as shown in Figure 10, it is clear that the compression effect is weakened, and the range of compression becomes narrow owing to the decreasing amount of variation in temperature and the weakening unsaturation. Comparing the void ratios at 2000 and 2500 min, it is clear that the changes in void ratio above 0.058 m align with each other and change little as freezing continues. Therefore, ice lenses will be formed at positions under 0.058 m. Comparing the void ratios at 4834 and 5000 min, it is clear that no ice lenses are formed between the positions at 0.045 and 0.058 m; however, beyond this soil range, ice lenses are formed. Analyzing the change in the void ratio, it is clear that the soils at 0.058 m were compressed the most owing to the first formation of ice lens. Subsequently, the effect of the first ice lens was weakened, and the change in void ratio decreased until the second ice lens was formed. This change is consistent with our hypothesis for the separation of ice proposed in Section 2.
3.3. Criterion for Formation of Ice Lens ahead of the Final Layer of Ice Lens
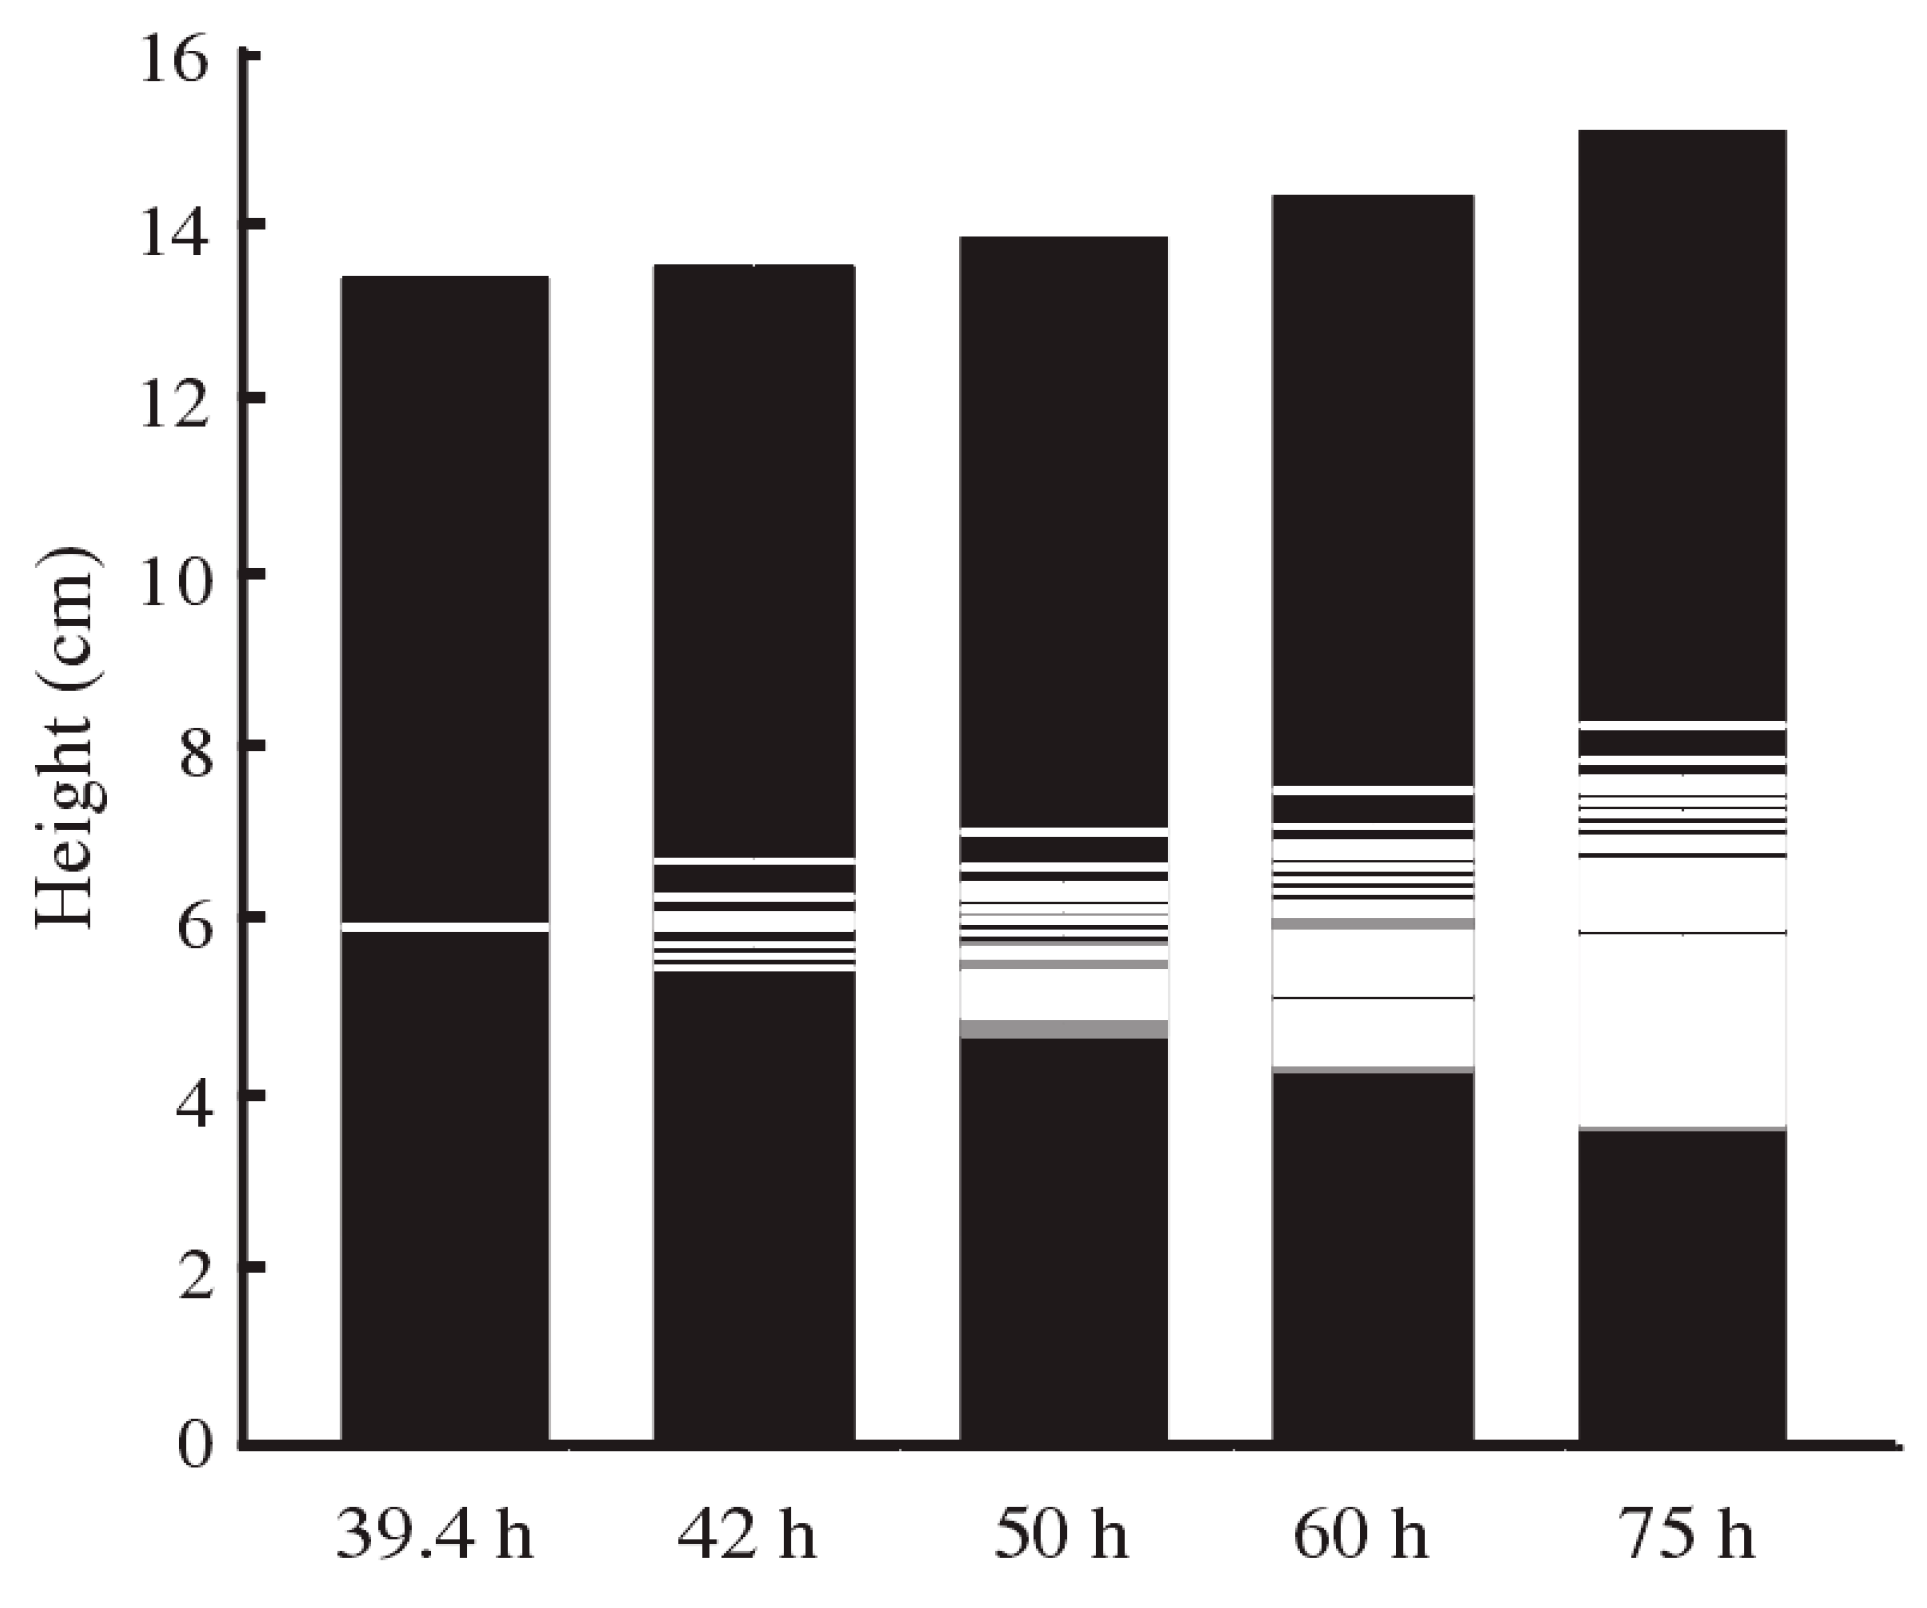
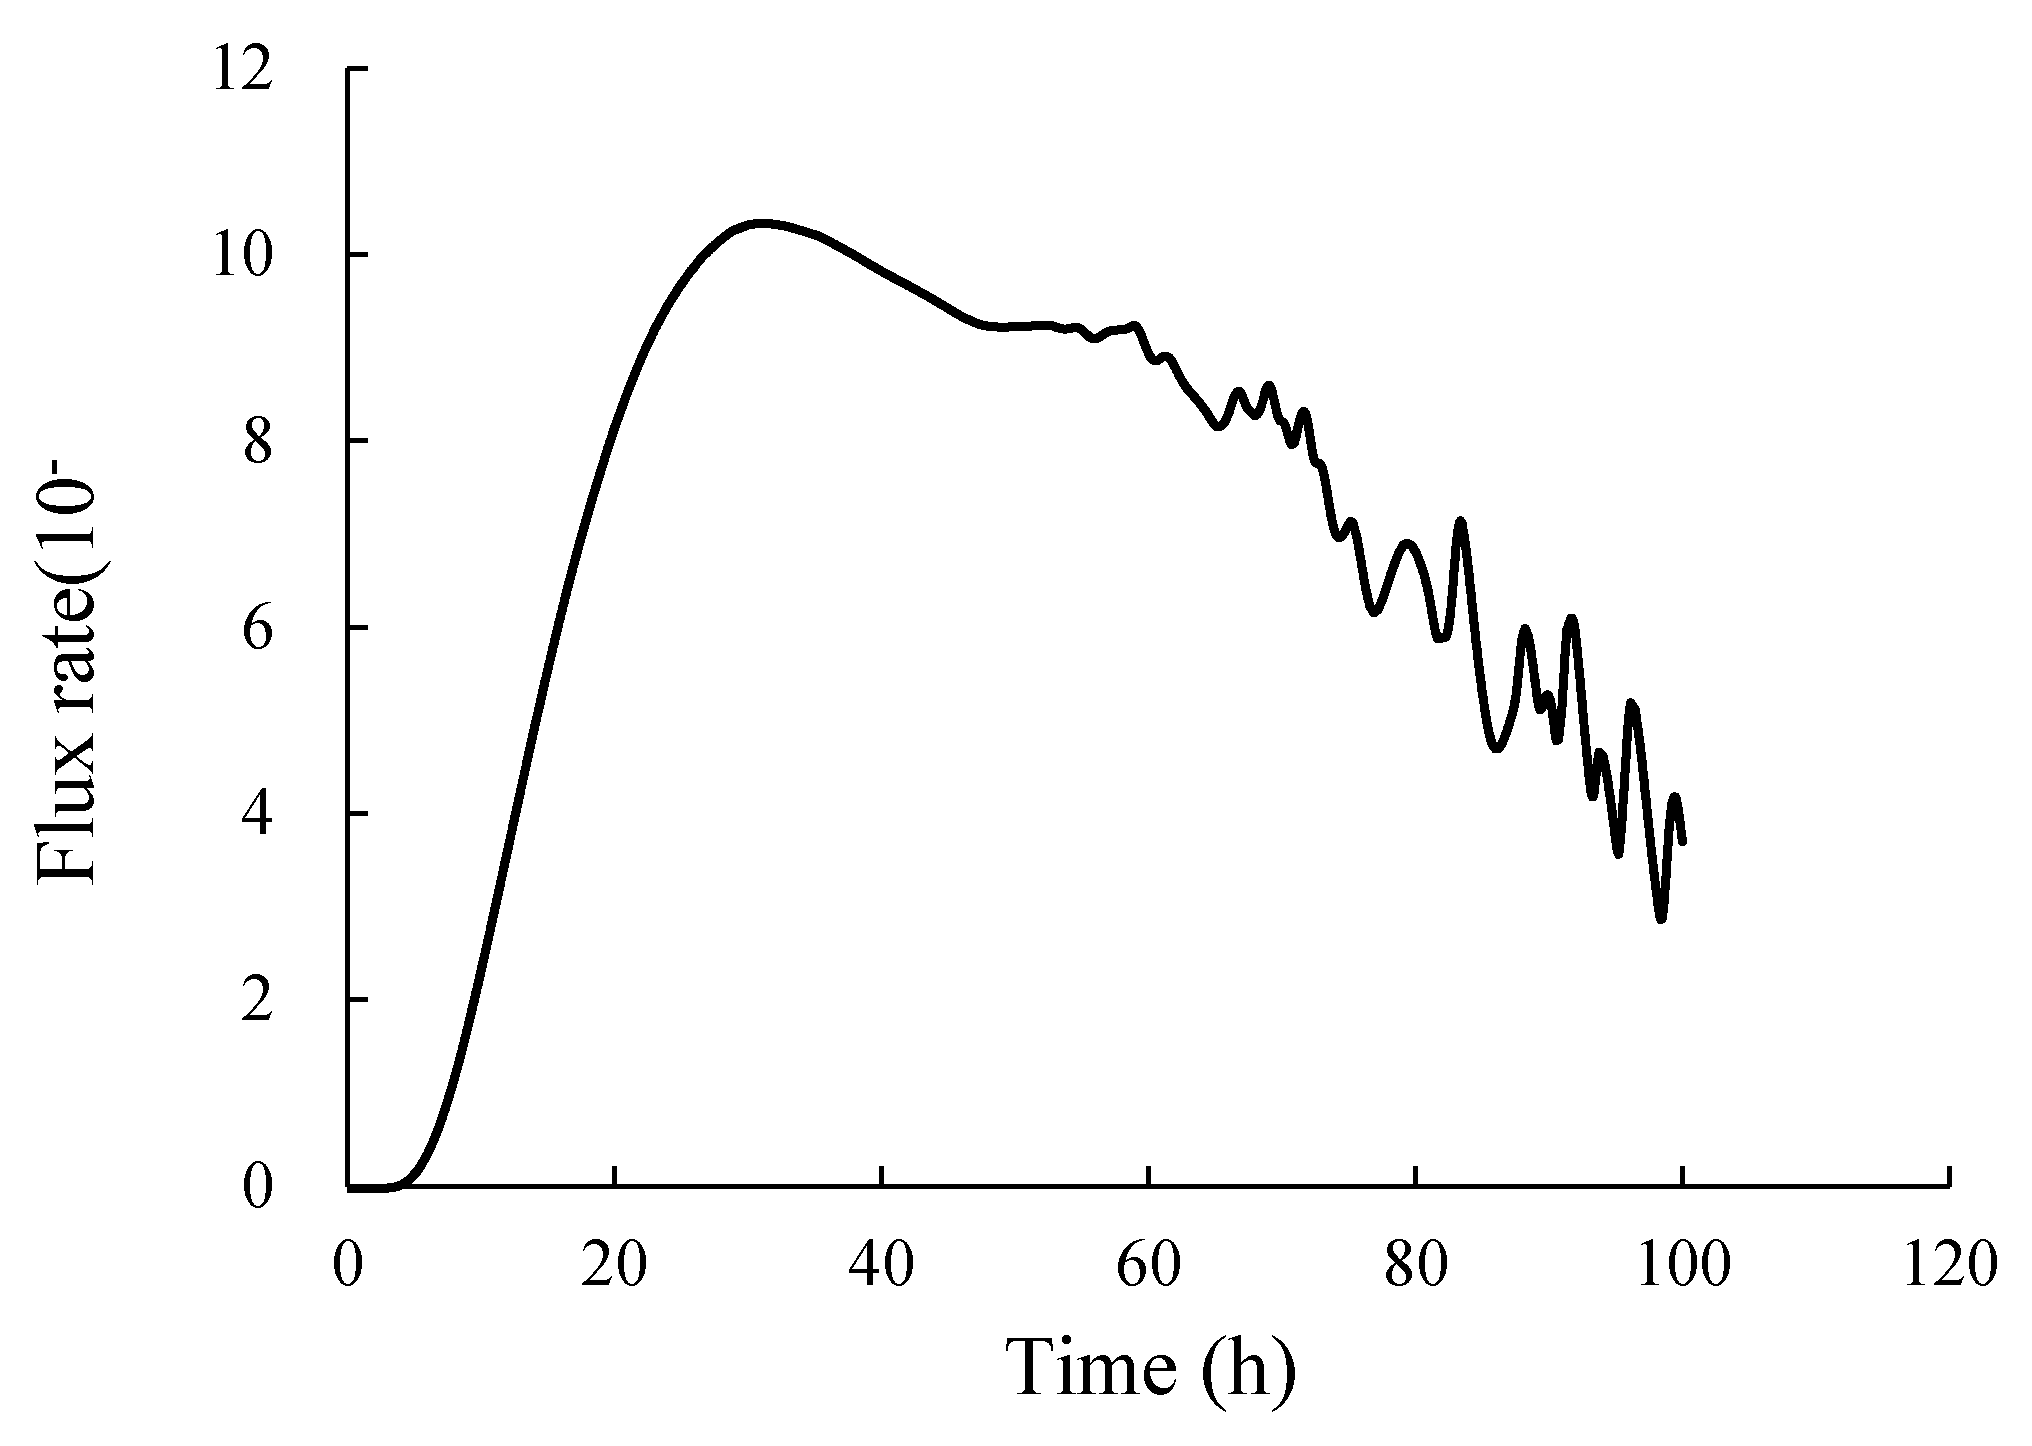
From the micro level, the cryogenic suction induced by low temperatures can be described as a water head ψ that can drive unfrozen water to migrate toward the frozen zone. However, the flowing channel may be narrowed or obstructed by ice crystals or soil grains, and this effect can be described by the changing hydraulic conduction. We believe that, when the temperature is lower than the freezing temperature of the soils, the ice crystals transformed from the unfrozen water can separate the soil grains in the ice crystals ahead of the final ice lens layer. Therefore, we suggest a flux rate expressed as to be the criterion for the formation of the ice lens ahead of the final ice lens layer. As shown in Figure 12 and Figure 13, when the first ice lens was formed, the flux rate reached the maximum value. When the flux rate remained at a high level, the ice crystals transformed from the unfrozen water could separate the soil grains to form the ice lens.
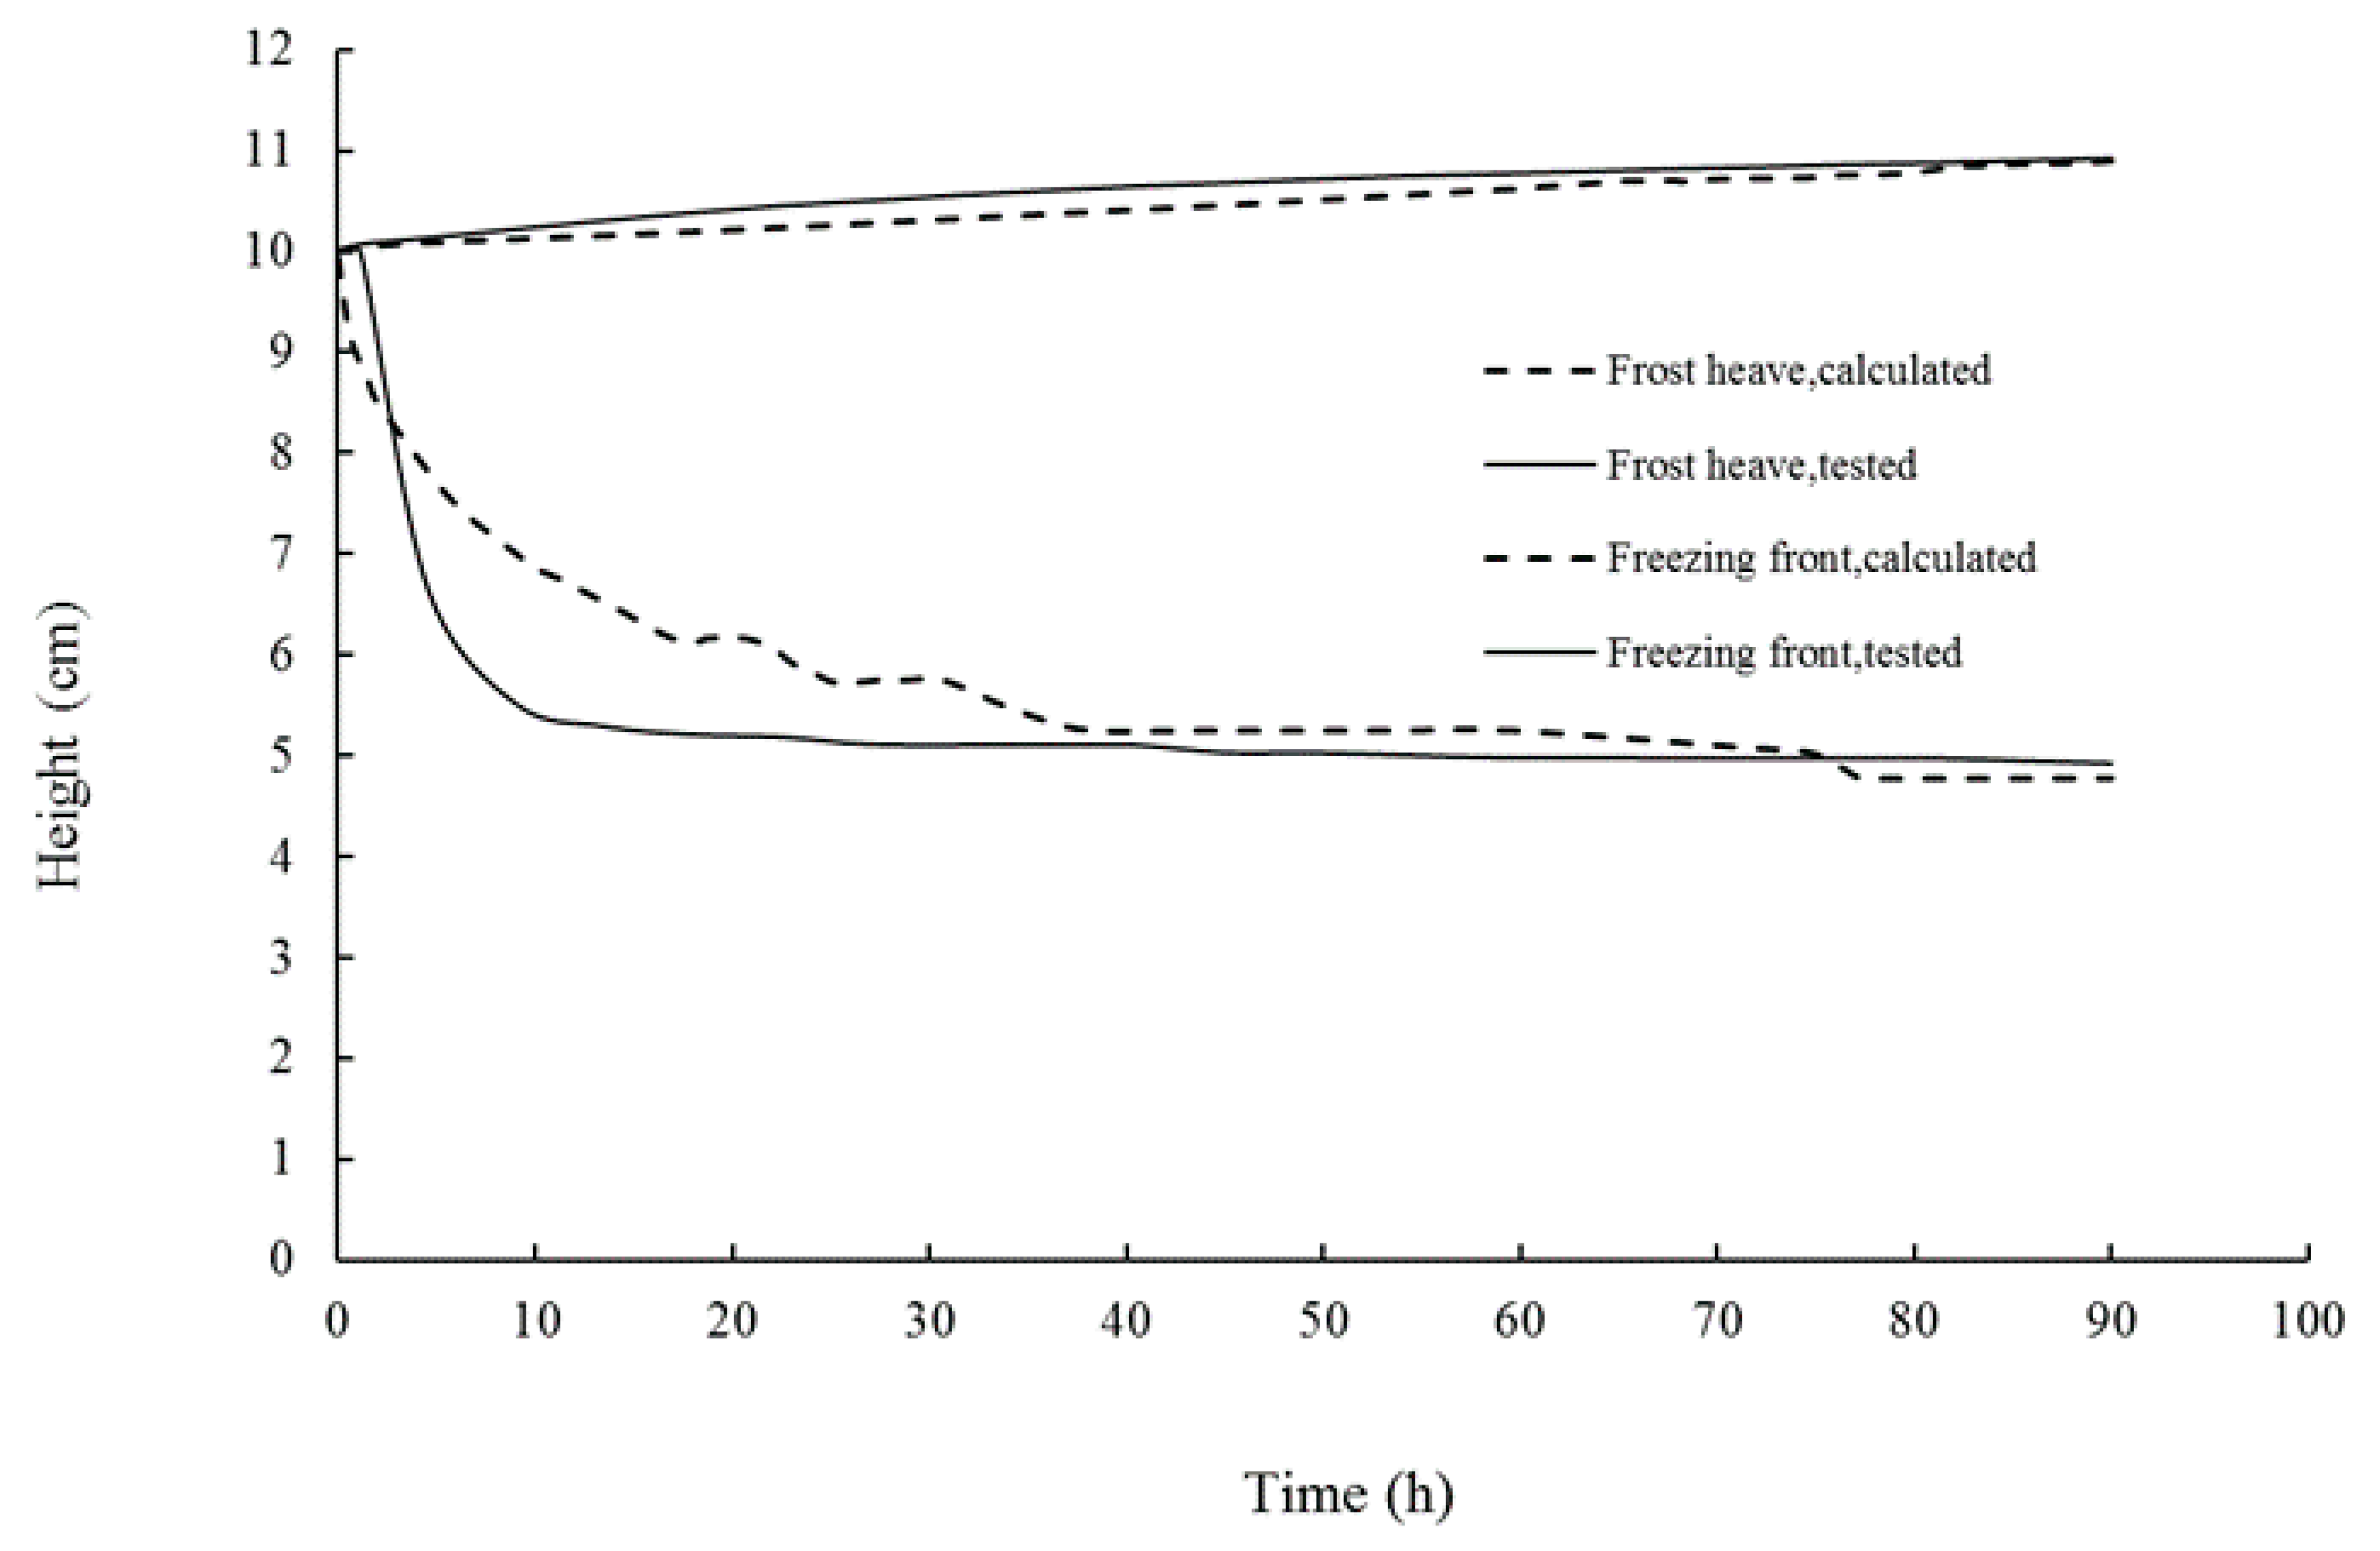
Figure 14 presents the calculated results of frost heave and freezing fronts, which are compared herein with the test results of Condition I provided by Lai et al. [19]. The test conditions are the same as those described in Section 2.1, but the initial height of the soil column is 10 cm, the overburden load is 50 kPa, and the temperatures at the upper (cold) end and bottom (warm) ends are +1.5 and −1.6 °C, respectively. The calculated parameters are presented in Table 2. As shown in Figure 14, the calculated results agree relatively well with the test results of heave frost and freezing fronts during freezing.
4. Conclusions
Ice lens could not form at the cold end of a soil column because of interruptions in water supplementation owing to the fast development of a water-resisting layer in the initial stage of freezing. Before the last ice lens was formed, the formation of ice lenses primarily relied on the duration for forming a water-resisting layer, which comprised soil grains and ice crystals. The formation of the final ice lens was dependent on the properties of soils and the separation forces caused by the growth of ice crystals. After the ice lens was formed, it thickened gradually, but the rate decreased as freezing continued.
The formation of ice lens layers can be explained based on the following two factors: (i) the unfrozen soils next to the forming ice lens was compressed; and (ii) when the void ratio was less than the critical void ratio, the separate force depending on the low temperature separated the soil grains and destroyed the water channel composed of an unfrozen water film.
The water head ψ and hydraulic conduction k can describe the migration of unfrozen water. When the temperature was lower than the freezing temperature of soils, the ice crystals ahead of the final layer of ice lens that was transformed by unfrozen water could separate the soil grains. Therefore, the flux rate is recommended as the criterion for the formation of ice lenses, which are ahead of the final ice lens layer.
When performing the freezing test, the soil column is enclosed by a cylinder, which is resin material and has very weak capability of heat conduction. Actually, the cylinder can affect the freezing process through the contact between the frozen soil and specimen cylinder, but it is neglected by many researchers due to the smaller heat conduction. Therefore, we also do not consider this action. If new materials are produced with almost zero heat conduction, the test results will be better. The flux rate shown in Figure 13 is also affected by freezing conditions such as temperature, overburden pressure, the temperatures at the two ends, and soil type. SP introduced by Konrad et al. (1980) is one of the better indices, which considers the influence of water intake rate and temperature gradient, and, considering the convenient approach of measurement when performing the test, we select the flux rate as the criterion for the formation of ice lenses, which is easily used and also verified with test results, as shown in Figure 14. We know that it is not easy to find the best criterion for the formation of ice lenses, which is our aim to pursue in the future study.
Author Contributions
Conceptualization, P.C., E.L., and H.L.; methodology, P.C. and E.L.; validation, E.L. and H.L.; formal analysis, P.C.; investigation, P.C. and E.L.; resources, E.L.; writing—original draft preparation, P.C. and H.L.; and writing—review and editing, E.L. All authors have read and agreed to the published version of the manuscript.
Funding
This research was funded by the National Natural Science Foundation of China (NSFC) (Grant No. 41790431).
Acknowledgments
We thank the anonymous reviewers for their careful review, contributions, and critiques, which led to the improvement of the article.
Conflicts of Interest
The authors declare no conflict of interest.
References
- Xu, X.Z.; Wang, J.C.; Zhang, L.X. Physics of Frozen Soil; Science Press: Beijing, China, 2010. (In Chinese) [Google Scholar]
- Konrad, J.M.; Morgenstern, N.R. The segregation potential of a freezing soil. Can. Geotech. J. 1981, 18, 482–491. [Google Scholar] [CrossRef]
- Miller, R.D. Lens initiation in secondary heaving. Proceedings of the International Symposium on Frost. Action Soils 1977, 2, 68–74. [Google Scholar]
- Konrad, J.M.; Morgenstern, N.R. A mechanistic theory of ice lens formation in fine grained soils. Can. Geotech. J. 1980, 1, 473–486. [Google Scholar] [CrossRef]
- Gilpin, R.R. A model for the prediction of ice lensing and frost heave in soils. Water Resour. Res. 1980, 16, 918–930. [Google Scholar] [CrossRef]
- Taber, S. Frost heaving. J. Geol. 1929, 42, 8–61. [Google Scholar] [CrossRef]
- Beskow, G. Soil freezing and frost heaving with special application to roads and railroads. Sver. Geol. Unders Ser. C 1935, 375, 91–123. [Google Scholar]
- Edlefsen, N.E.; Anderson, A.B.C. Thermodynamics of Soil Moisture; University of California: Berkeley, CA, USA, 1943. [Google Scholar]
- Nixon, J.F. Discrete ice lens theory for frost heave in soils. Can. Geotech. J. 1991, 28, 843–859. [Google Scholar] [CrossRef]
- Watanable, K. Experimental study on microstructure near freezing front during soil freezing. Trans. -Jpn. Soc. Irrig. Drain. Reclam. Eng. 1997, 5, 3–8. [Google Scholar]
- Thomas, H.R.; Cleall, P.; Li, Y.; Harris, C.; Kern-Luetschg, M. Modelling of cryogenic processes in permafrost and seasonally frozen soils. Geotechnique 2009, 59, 173–184. [Google Scholar] [CrossRef]
- Zhou, J.Z.; Li, D.Q. Numerical analysis of coupled water, heat and stress in saturated freezing soil. Cold Reg. Sci. Technol. 2012, 72, 43–49. [Google Scholar] [CrossRef]
- O’Neill, K. The physics of mathematical frost heave models: A review. Cold Regions Sci. Technol. 1983, 6, 275–291. [Google Scholar] [CrossRef]
- Michalowski, R.L.; Zhu, M. Frost heave modelling using porosity rate function. Int. J. Numer. Anal. Methods Geomech. 2006, 30, 703–722. [Google Scholar] [CrossRef] [Green Version]
- Nishimura, S.; Gens, A.; Olivella, S.; Jardine, R. THM-coupled finite element analysis of frozen soil: Formulation and application. Geotechnique 2009, 59, 159–171. [Google Scholar] [CrossRef] [Green Version]
- Zhou, M.; Meschke, G. A three-phase thermo-hydro-mechanical finite element model for freezing soils. Int. J. Numer. Anal. Methods Geomech. 2009, 37, 3173–3193. [Google Scholar] [CrossRef]
- Zhang, Y.; Michalowski, R.L. Thermal-Hydro-Mechanical Analysis of Frost Heave and Thaw Settlement. J. Geotech. Geoenviron. Eng. 2015, 141. [Google Scholar] [CrossRef]
- Liu, E.; Lai, Y.; Wong, H.; Feng, J. An elastoplastic model for saturated freezing soils based on thermoporomechanics. Int. J. Plast. 2018, 107, 246–285. [Google Scholar] [CrossRef]
- Lai, Y.M.; Pei, W.S.; Zhang, M.Y.; Zhou, J.Z. Study on theory model of hydro-thermal–mechanical interaction process in saturated freezing silty soil. Int. J. Heat Mass Transf. 2014, 78, 805–819. [Google Scholar] [CrossRef]
- Pei, W.S. Study of the hydro-thermal-mechanial interaction process of frozen soil and its numerical simulation. Ph.D. Thesis, University of Chinese Academy of Sciences, Beijing, China, 2015. [Google Scholar]
- Terzaghi, K. A fundamental Fallacy in earth pressure computations. J. Boston Soc. Civil Eng. 1936, 23, 71–88. [Google Scholar]
- Bishop, A.W. The Principle of Effective Stress. Tecnisk Ukeblad 1959, 36, 859–863. [Google Scholar]
- Kadivar, M.; Manahiloh, K.N. Revisiting parameters that dictate the mechanical behavior of frozen soils. Cold Regions Sci. Technol. 2019, 163, 34–43. [Google Scholar] [CrossRef]
- Black, P.B. Applications of the Clapeyron Equation to Water and Ice in Porous Media; US Army Corps of Engineers, Cold Regions Research & Engineering Laboratory: Hanover, NH, USA, 1995. [Google Scholar]
- Chen, F.X.; Song, Z.P.; Li, N. Study on moisture migrating force model of freezing soil base on adsorption-flim moisture migration mechanism. J. Water Resour. Archit. Eng. 2006, 4, 1–4, (In Chinese with English abstract). [Google Scholar]
- Kay, B.D.; Groenevelt, P.H. On the interaction of water and heat transport in frozen and unfrozen soils:I. Basic theory; the vapor phase. Soil Sci. Soc. Am. J. 1974, 38, 395–400. [Google Scholar] [CrossRef]
Figure 1.
State of the sample after 90 h [20].
Figure 1.
State of the sample after 90 h [20].

Figure 2.
Schematic of freezing soil under a great temperature gradient: soil grains, the circles filled with black shadow; ice crystals, the circles or ellipses with slashed shadow; the ice block, the slashed shadow area; the thin unfrozen water film, the annulus outside the filled circle; the curve represents the potential position xsep of the ice lens; and the other symbols represent the unfrozen water.

Figure 3.
Schematic of freezing soil under a suitable temperature gradient: soil grains, the circles filled with black shadow; ice crystals, the circles or ellipses with slashed shadow; the ice block, the slashed shadow area; the thin unfrozen water film, the annulus outside the filled circle; the curve represents the potential position xsep of the ice lens; and the other symbols represent the unfrozen water. (a) Initial state of analysis; and (b) the state after some time.

Figure 4.
Schematic of freezing soil whose void ratio is less than esep or equals to esep: soil grains, the circles filled with black shadow; ice crystals, the circles or ellipses with slashed shadow; the ice block, the slashed shadow area; the thin unfrozen water film, the annulus outside the filled circle; the curve represents the potential position xsep of the ice lens; and the other symbols represent the unfrozen water.

Figure 5.
Schematic of freezing soil whose temperature gradient is small: soil grains, the circles filled with black shadow; ice crystals, the circles or ellipses with slashed shadow; the ice block, the slashed shadow area; the thin unfrozen water film, the annulus outside the filled circle; the curve represents the potential position xsep of the ice lens; and the other symbols represent the unfrozen water.

Figure 6.
Ice lens distributions of soil columns at the end of Conditions I and II [19]: (a) Condition I with overburden pressure of 50 kPa; and (b) Condition II with overburden pressure of 100 kPa.
Figure 6.
Ice lens distributions of soil columns at the end of Conditions I and II [19]: (a) Condition I with overburden pressure of 50 kPa; and (b) Condition II with overburden pressure of 100 kPa.

Figure 7.
Three-phase sketch of saturated freezing soils.

Figure 8.
The boundary and initial conditions.

Figure 9.
Distribution of void ratio at different durations of freezing.

Figure 10.
Distribution of void ratio at different durations of freezing.

Figure 11.
Distribution of temperature at different times.

Figure 12.
Histogram of ice lenses distribution at different durations of freezing (the white parts are ice lenses).
Figure 12.
Histogram of ice lenses distribution at different durations of freezing (the white parts are ice lenses).

Figure 13.
The curve of flux rate versus time.

Figure 14.
Comparisons of frost heaves and freezing fronts tested and calculated.


Table 1.
The calculated parameters.
| Parameter | Value | Parameter | Value |
|---|---|---|---|
| −5 | () | 1.20 | |
| −8 | () | 2.22 | |
| 2.5 | () | 0.58 | |
| 101 | () | 2160 | |
| () | 2.7 | () | 4180 |
| () | 0.917 | () | 1874 |
| () | 1.0 | L() | 334.56 |
| g() | 9.8 | esp | 1.2 |
| () | 0 |
Table 2.
The calculated parameters.
| Parameter. | Value | Parameter | Value |
|---|---|---|---|
| −5 | () | 1.50 | |
| −8 | () | 2.22 | |
| 5.7 | () | 0.58 | |
| 101 | () | 2360 | |
| () | 2.36 | () | 4180 |
| () | 0.917 | () | 1874 |
| () | 1.0 | L() | 334.56 |
| g() | 9.8 | esp | 1.2 |
| () | 0 |
© 2020 by the authors. Licensee MDPI, Basel, Switzerland. This article is an open access article distributed under the terms and conditions of the Creative Commons Attribution (CC BY) license (http://creativecommons.org/licenses/by/4.0/).
Share and Cite
MDPI and ACS Style
Chen, P.; Luo, H.; Liu, E. Moisture Transfer and Formation of Separate Ice in the Freezing Process of Saturated Soils. Water 2020, 12, 1044. https://doi.org/10.3390/w12041044
AMA Style
Chen P, Luo H, Liu E. Moisture Transfer and Formation of Separate Ice in the Freezing Process of Saturated Soils. Water. 2020; 12(4):1044. https://doi.org/10.3390/w12041044
Chicago/Turabian StyleChen, Peishuai, Huiwu Luo, and Enlong Liu. 2020. "Moisture Transfer and Formation of Separate Ice in the Freezing Process of Saturated Soils" Water 12, no. 4: 1044. https://doi.org/10.3390/w12041044
Note that from the first issue of 2016, this journal uses article numbers instead of page numbers. See further details here.