Sociohydrologic Systems Thinking: An Analysis of Undergraduate Students’ Operationalization and Modeling of Coupled Human-Water Systems


School of Natural Resources, University of Nebraska-Lincoln, Lincoln, NE 68583, USA
*
Author to whom correspondence should be addressed.
Water 2020, 12(4), 1040; https://doi.org/10.3390/w12041040
Submission received: 18 February 2020
/
Revised: 24 March 2020
/
Accepted: 24 March 2020
/
Published: 7 April 2020
(This article belongs to the Special Issue Water Literacy and Education)
Abstract
:One of the keys to science and environmental literacy is systems thinking. Learning how to think about the interactions between systems, the far-reaching effects of a system, and the dynamic nature of systems are all critical outcomes of science learning. However, students need support to develop systems thinking skills in undergraduate geoscience classrooms. While systems thinking-focused instruction has the potential to benefit student learning, gaps exist in our understanding of students’ use of systems thinking to operationalize and model SHS, as well as their metacognitive evaluation of systems thinking. To address this need, we have designed, implemented, refined, and studied an introductory-level, interdisciplinary course focused on coupled human-water, or sociohydrologic, systems. Data for this study comes from three consecutive iterations of the course and involves student models and explanations for a socio-hydrologic issue (n = 163). To analyze this data, we counted themed features of the drawn models and applied an operationalization rubric to the written responses. Analyses of the written explanations reveal statistically-significant differences between underlying categories of systems thinking (F(5, 768) = 401.6, p < 0.05). Students were best able to operationalize their systems thinking about problem identification (M = 2.22, SD = 0.73) as compared to unintended consequences (M = 1.43, SD = 1.11). Student-generated systems thinking models revealed statistically significant differences between system components, patterns, and mechanisms, F(2, 132) = 3.06, p < 0.05. Students focused most strongly on system components (M = 13.54, SD = 7.15) as compared to related processes or mechanisms. Qualitative data demonstrated three types of model limitation including scope/scale, temporal, and specific components/mechanisms/patterns excluded. These findings have implications for supporting systems thinking in undergraduate geoscience classrooms, as well as insight into links between these two skills.
1. Introduction
A hallmark of environmental problem solving is the complicated interweaving of components with varying rates and magnitudes of response to change [1]. Exacerbating the challenging nature of these contemporary problems is the interconnectivity of human and natural components of a system, such as the effect of human activity on water systems. One way of addressing these types of problems is through systems thinking, which is a key component of science and environmental literacy [2,3]. Learning how to think about interactions between systems, the far-reaching effects of a system, intended and unintended human interactions with system processes, and the dynamic nature of systems, are all important systems thinking skills. Yet, requiring students to solve problems that either do not exist or have low impact is not engaging, does not contribute to active learning for students, and can minimize the benefits of systems thinking. It is therefore critical to systems thinking skill development to engage students in authentic learning opportunities grounded in real-world scenarios where students can gain experience thinking about, explaining, and making decisions about complex coupled human-natural systems.
An integrated sociohydrologic system is an ideal context through which students could develop systems thinking skills. Sociohydrologic systems (SHS), are water systems that include both human and natural dimensions. However, research has shown students are challenged by reasoning about both natural and human dimensions of SHS (e.g., [4,5,6,7,8,9]). To support students’ systems thinking about SHS, we developed and implemented a new interdisciplinary undergraduate course. The course, Water in Society, engages students in systems thinking through the lens of water. In the course, students engage in reasoning and decision-making about real-world sociohydrologic issues, an important component of water literacy [10], interpreted as a subcomponent of scientific literacy. However, although systems thinking-based problem-solving has the potential to benefit student learning, gaps exist in our understanding of students’ use of systems thinking to operationalize and model SHS, as well as their metacognitive evaluation of systems thinking.
Studying student use of systems thinking through operationalization, modeling, and metacognitive evaluation of an SHS is valuable because the way students learn about hydrologic systems can directly impact their conception of such systems [10]. Learning how students use systems thinking is also important from an informed populace standpoint; decision making and implementing changes in human actions to benefit the hydrologic system is critical to the overall earth system [11]. How can we identify the ways in which students, in the context of an interdisciplinary sociohydrologic issue, (1) use systems thinking to operationalize a problem, (2) communicate the system through a robust systems thinking model, and (3) evaluate the limitations of their work? We hypothesize that systems thinking-based explanation and modeling are correlated skills that can help students reason about a SHS. To test this hypothesis, we collected and analyzed data from three consecutive years of the course, Water in Society, to respond to the following study questions:
- How do students perform on a sociohydrologic issue systems thinking modeling and writing assignment?
- To what extent is the systems thinking model score predictive of the writing assignment score on a sociohydrologic issue?
- How do students evaluate their own systems thinking models of a real-world sociohydrologic issue?
1.1. Teaching and Learning about Water
Students’ experiences of, formal education about, and resulting ideas concerning hydrologic systems change over time. Transitioning from spontaneous experiences with water to more nuanced ideas about water systems and the role that humans play in them requires students to connect concepts such as conservation of matter with fundamental hydrologic concepts [7]. Formal education from kindergarten through to grade 12 (K-12) helps students build basic knowledge about water and, for many, may be their last experiences with water-related content in formal classroom settings. Misconceptions that are not addressed in the K-12 grades may continue to be expressed as scientifically inaccurate ideas surrounding water in undergraduate students [8,12,13,14] and potentially in adult life [15].
Undergraduate students’ understanding of water systems should develop as students learn more about related systems, processes, and phenomenon. However, not all students are required to take classes where they are exposed to water-related concepts and, therefore, may not develop robust conceptual understanding of water. As a result, misconceptions surrounding evaporation, atmospheric water, and conservation of matter relating to water through the hydrologic cycle may persist [13]. Students also illustrate varying levels in their ability to think about the unseen components of the hydrologic systems and associated repercussions such as hydrogeochemical processes or the interactions of groundwater [9]. Those parts of the cycle, which are invisible or difficult to observe directly, such as hydrologic cycle phase changes, often represent an obstacle to undergraduates when considering the water cycle [9]. For example, students have been found to demonstrate misconceptions of as many as seven different aspects of just one phase change—evaporation [16]. On the other hand, others compartmentalize the water cycle as separate from the carbon and rock cycles, despite the explicit linkages between them [11], or compartmentalize parts of the water cycle such as atmospheric water cycling as separate from geosphere water cycling [13]. Compounding their misconceptions is the difficulty in applying content to students’ everyday lives and the often-theoretical nature of models used to teach hydrologic content [17]. In response to these challenges of needing more formal hydrologic cycle instruction, the invisible nature of some hydrologic cycle components, and the difficulty in applying theory to practice in life, students may turn to their previous experiences with the hydrologic cycle to fill in the gaps [10]. Experiences in the form of education, social structures, and other cultural factors could all work to shape student systems thinking [10]. In order to be able to reason effectively about water-related issues in the future, students need more opportunities and support to develop skills related to water literacy.
1.2. Theoretical Framework for Systems Thinking
Systems thinking is the study of the interplay between the subsystems comprising an overall system [18]. Effective systems thinking requires both the application of scientific knowledge and its associated epistemic dimensions. These epistemic dimensions take the form of contextualization and integration of human actions [19]. Systems thinking requires the learner to contextualize a multifaceted issue by interweaving varying levels of the problem with different earth system components. Students must integrate themselves, or, at the very least, humans and their actions, as inherent catalysts of change within a system. Taking the dimension of integration a step further, the perspective of the learners must be reconciled with the context and content of the system if a decision or hypothesis is a desired outcome [19]. Learning to connect content, context, interactions, and human integration into systems thinking requires directed learning surrounding the related skills.
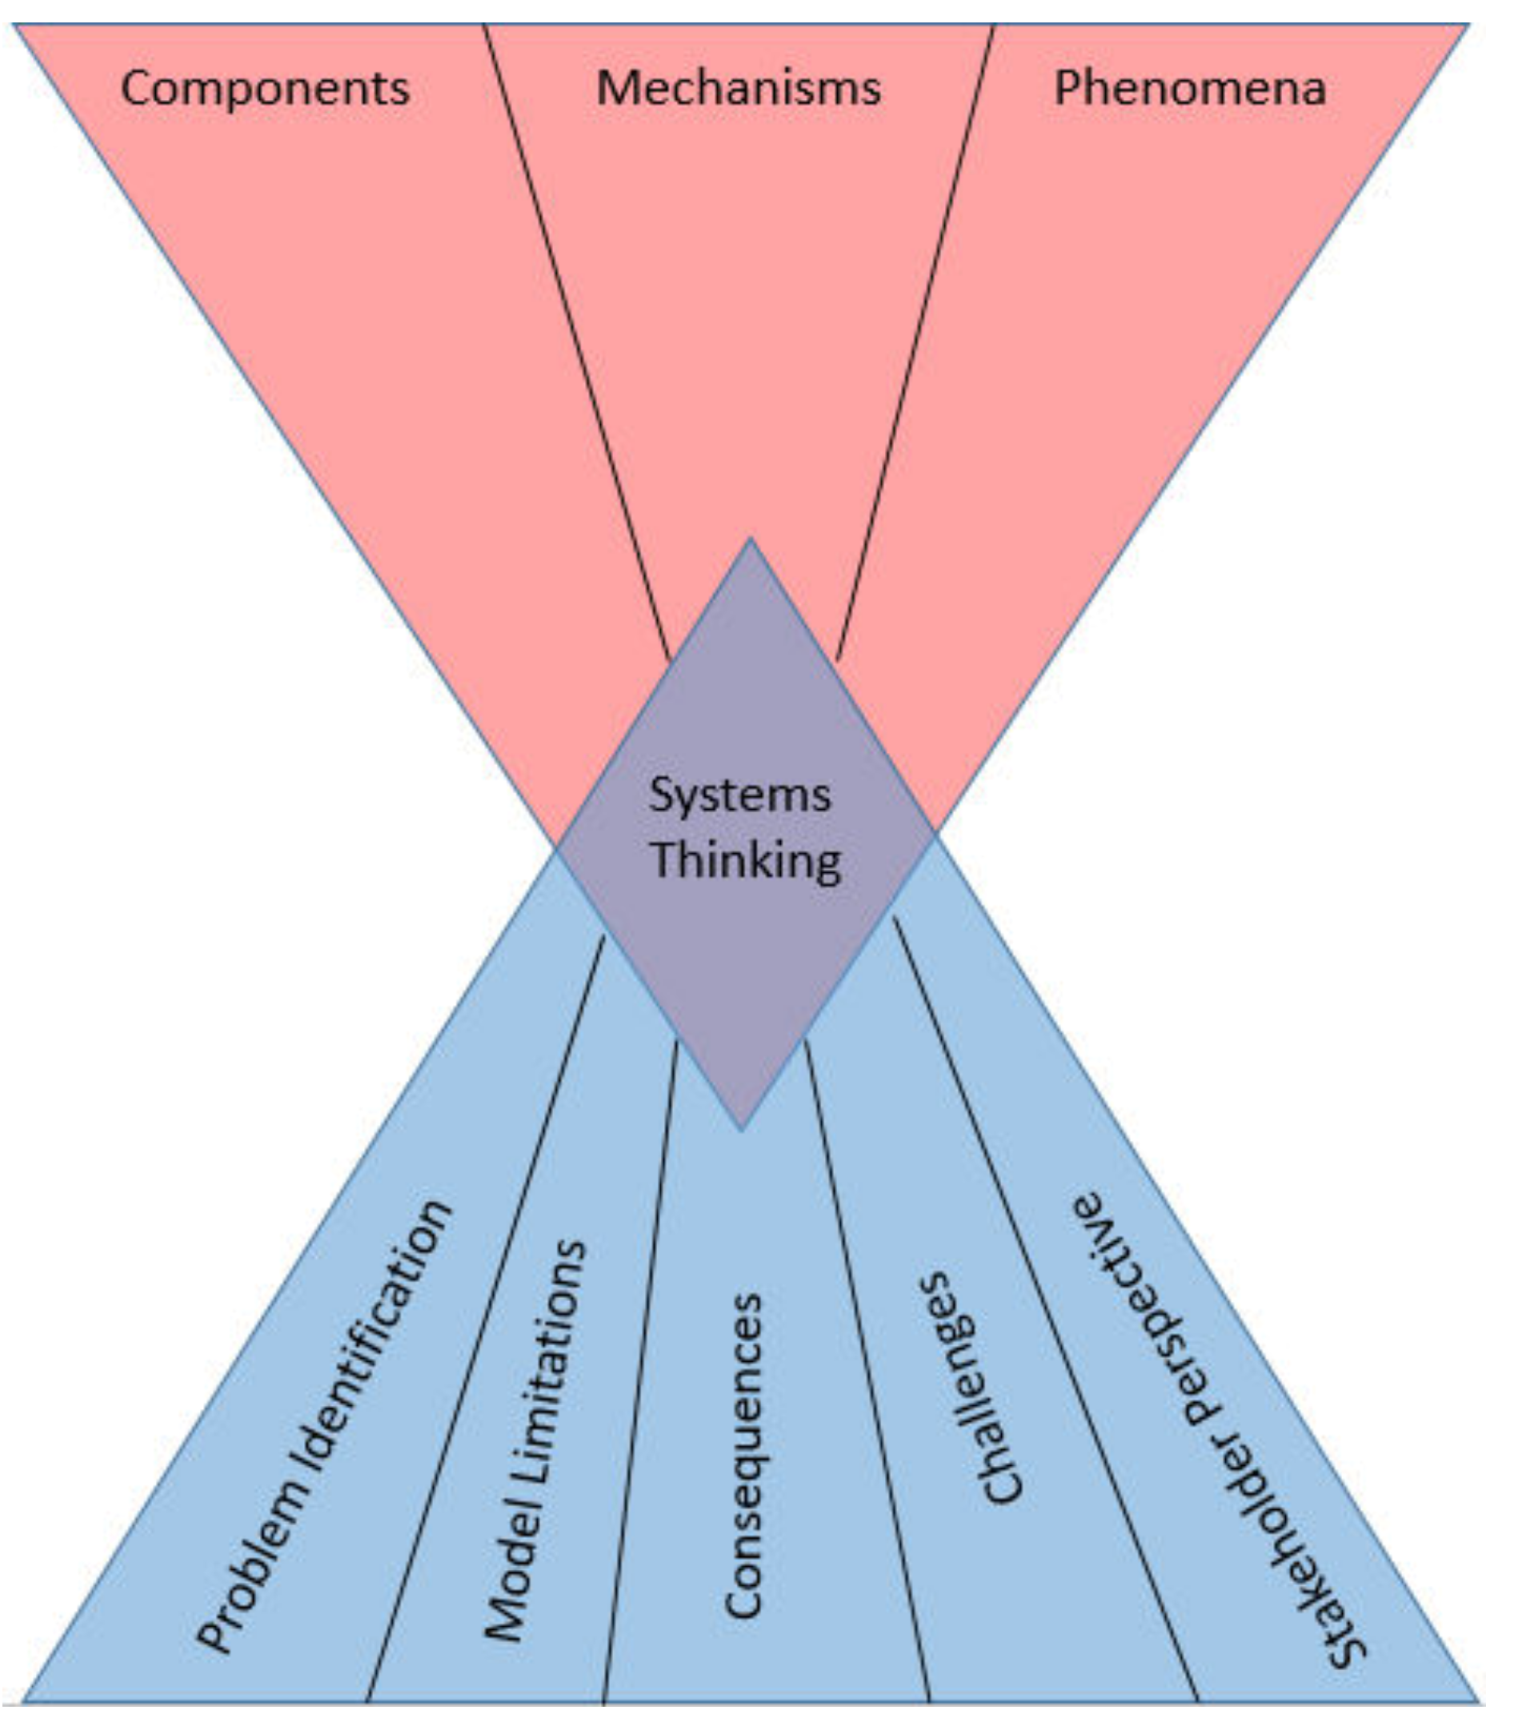
Here, we draw upon two conceptual frameworks for systems thinking. First, within the context of a systems thinking model, students explore the interlocking phenomenon/patterns, mechanisms, and components through a visual representation [20] (Table 1). Second, five components of systems thinking are expressed through a framework reflecting the inherent features of systems [21] (Table 2). Both the systems thinking modeling and written dimensions contribute to the overall theoretical framework as one amplifies the other (Figure 1). These two linked skills help students by serving as a placeholder for ideas, thereby helping alleviate some of the mental load of systems thinking.
As modeling is a key component of systems thinking, model evaluation is then also a necessary practice. Specifically, model evaluation is a component of a more comprehensive schema stemming from our K-12 and undergraduate research and development (e.g., [22,23]). Model evaluation includes all of the ways in which students compare, confirm accuracy, revise [24,25], and identify fit [26].
1.3. Supporting Students’ Systems Thinking
Students need opportunities to develop systems thinking in formal classroom contexts. However, although systems thinking is a critical outcome for students, research has shown that it is arguably underemphasized in undergraduate geoscience courses [27] and, even when it is emphasized, students often struggle to engage in this practice productively [11,28,29,30]. However, there are many ways in which formal learning environments can be designed to support students’ developing systems thinking abilities. For example, first, instructors can help students learn systems thinking skills through explicit instruction and practice with the requisite cognitive skills. When the development of systems thinking is broken down into specific cognitive skills, it becomes apparent that students must be taught each of these skills [12], how to link them, and be given opportunities to practice using all seven of these faculties at one time. Due to the interlinking nature of systems thinking, it is helpful to teach students to systems think with increasingly difficult systems, or by increasing the complexity of a single system.
Second, models students generate by hand or digitally can be used as scaffolds to student learning and thinking about systems [13,31]. The ability to see the system helps students by alleviating some of the mental burden of simultaneously thinking about and visualizing the components of a system. One reason for the difficulty of systems thinking is that many different thought processes must all occur simultaneously, including finding patterns, visualization, quantification, operationalization, and hypothesizing [12]. Multiple layers, players, and systems have to be considered when using systems thinking to evaluate a problem or test a hypothesis. It can be challenging to overcome the difficulty of keeping many chains of thought moving all at the same time.
Another way to enhance systems thinking fluency is by spending time discussing the mechanisms and patterns surrounding components to help students make system connections [13]. Sometimes it is difficult for students to conceptualize how all of the seemingly disparate components of a system might be connected. The more students engage in discussion about areas of difficulty, the more detail they may be able to include in their systems thinking models. Transfer is the ability to use information from one scenario in a seemingly disparate way in another scenario, and can be useful to consider for students in the systems thinking process [13]. Students who are engaged in active learning surrounding systems thinking can demonstrate a more robust understanding of the system, as demonstrated by a more detailed and inclusive systems thinking model product [4]. Development of a robust systems thinking model is enhanced when theories, ideas, and content from other areas merge in one cohesive model.
2. Materials and Methods
2.1. Water in Society
Participants and data for this study came from the course, Water in Society [32], an elective, interdisciplinary, three-credit introductory water course at the University of Nebraska. Students learn about the increasingly linked components of the food–energy–water nexus (FEW-Nexus) and complete several projects related to course material. Throughout the course, students learn to use and complete assignments surrounding two computer-based water models, participate in large and small group discussions, and complete a capstone systems thinking assignment that integrates course goals and content. Averaging 55 students per year, the course has been offered annually in the spring semester for each of the past 3 years. This study focuses on three consecutive course offerings of spring 2017 (Year 1), 2018 (Year 2), and 2019 (Year 3), each including the same instructional team, goals, organization, and assessments.
During the systems thinking unit, students completed a worksheet in which they learned the basic process and associated terms of systems thinking. They listened to a short recording about climate and wrote down everything they identified as relevant to or influencing climate. These terms were then sorted into the categories of flux, storage, and feedback. Next, students evaluated a systems thinking model of the climate recording, and revised it as needed in accordance with their notes and through small group discussions. During the following class period, students formed small groups and made a systems thinking model of a recreational lake of their choosing. They were instructed to include the components, mechanisms, and overall processes contributing or resulting from the systems. Upon completion, students participated in a gallery-walk, in which the models were hung on the walls of the classroom for all students to view. This provided an opportunity for students to evaluate one another’s systems thinking models and provide and receive feedback. Finally, students developed a list of all of the processes, components, and reservoirs of the Raccoon River water crisis as a warmup for the systems thinking assignment they would complete.
2.2. Participants
Participants in Year 1 (n = 35), Year 2 (n = 48), and Year 3 (n = 46), were undergraduate students enrolled in the course. Approximately equal numbers of male and female students enrolled in the course, with science, technology, engineering, and mathematics (STEM) majors comprising the majority of students across the three study years. A large proportion of the learners were international students, contributing to the diverse populations of learners represented by the participants. Student demographics are presented in Table 3.
2.3. Data Collection
Systems Thinking Assignment
In the course, students completed a systems thinking assignment in which they were provided with information about a contemporary sociohydrological issue grounded in the Raccoon River near Des Moines, Iowa (IA). The river scenario affecting the city of Des Moines in the state of Iowa (IA) was selected because it is a regionally relevant sociohydrologic issue (SHI). Broadly, the Des Moines, IA, water crises is the result of a tangled web of competing interests. The Raccoon and Des Moines Rivers provide much of the city’s water, from which nitrates and phosphates are removed prior to human use. Some feel that farmers upstream are benefiting from a Clean Water Act loophole that identifies farm runoff as non-point source pollution. However, farming is one of the primary economic drivers of the state and any future water quality regulations probably would be difficult to implement and enforce [33]. A lawsuit was filed by the Des Moines Water Works board against upstream counties of northern Iowa [33] and the state has passed the Water Quality Bill containing a two-pronged approach directing money at projects related to helping (1) farmers problem-solve to reduce fertilizer runoff and (2) municipal water facility improvements [34]. On a national scale, the Raccoon River is in the Mississippi River watershed and contributes to the Gulf of Mexico dead zone [35]. This reduced water quality is also detrimental to local water resources, contributing to increased algal blooms in Iowa lakes.
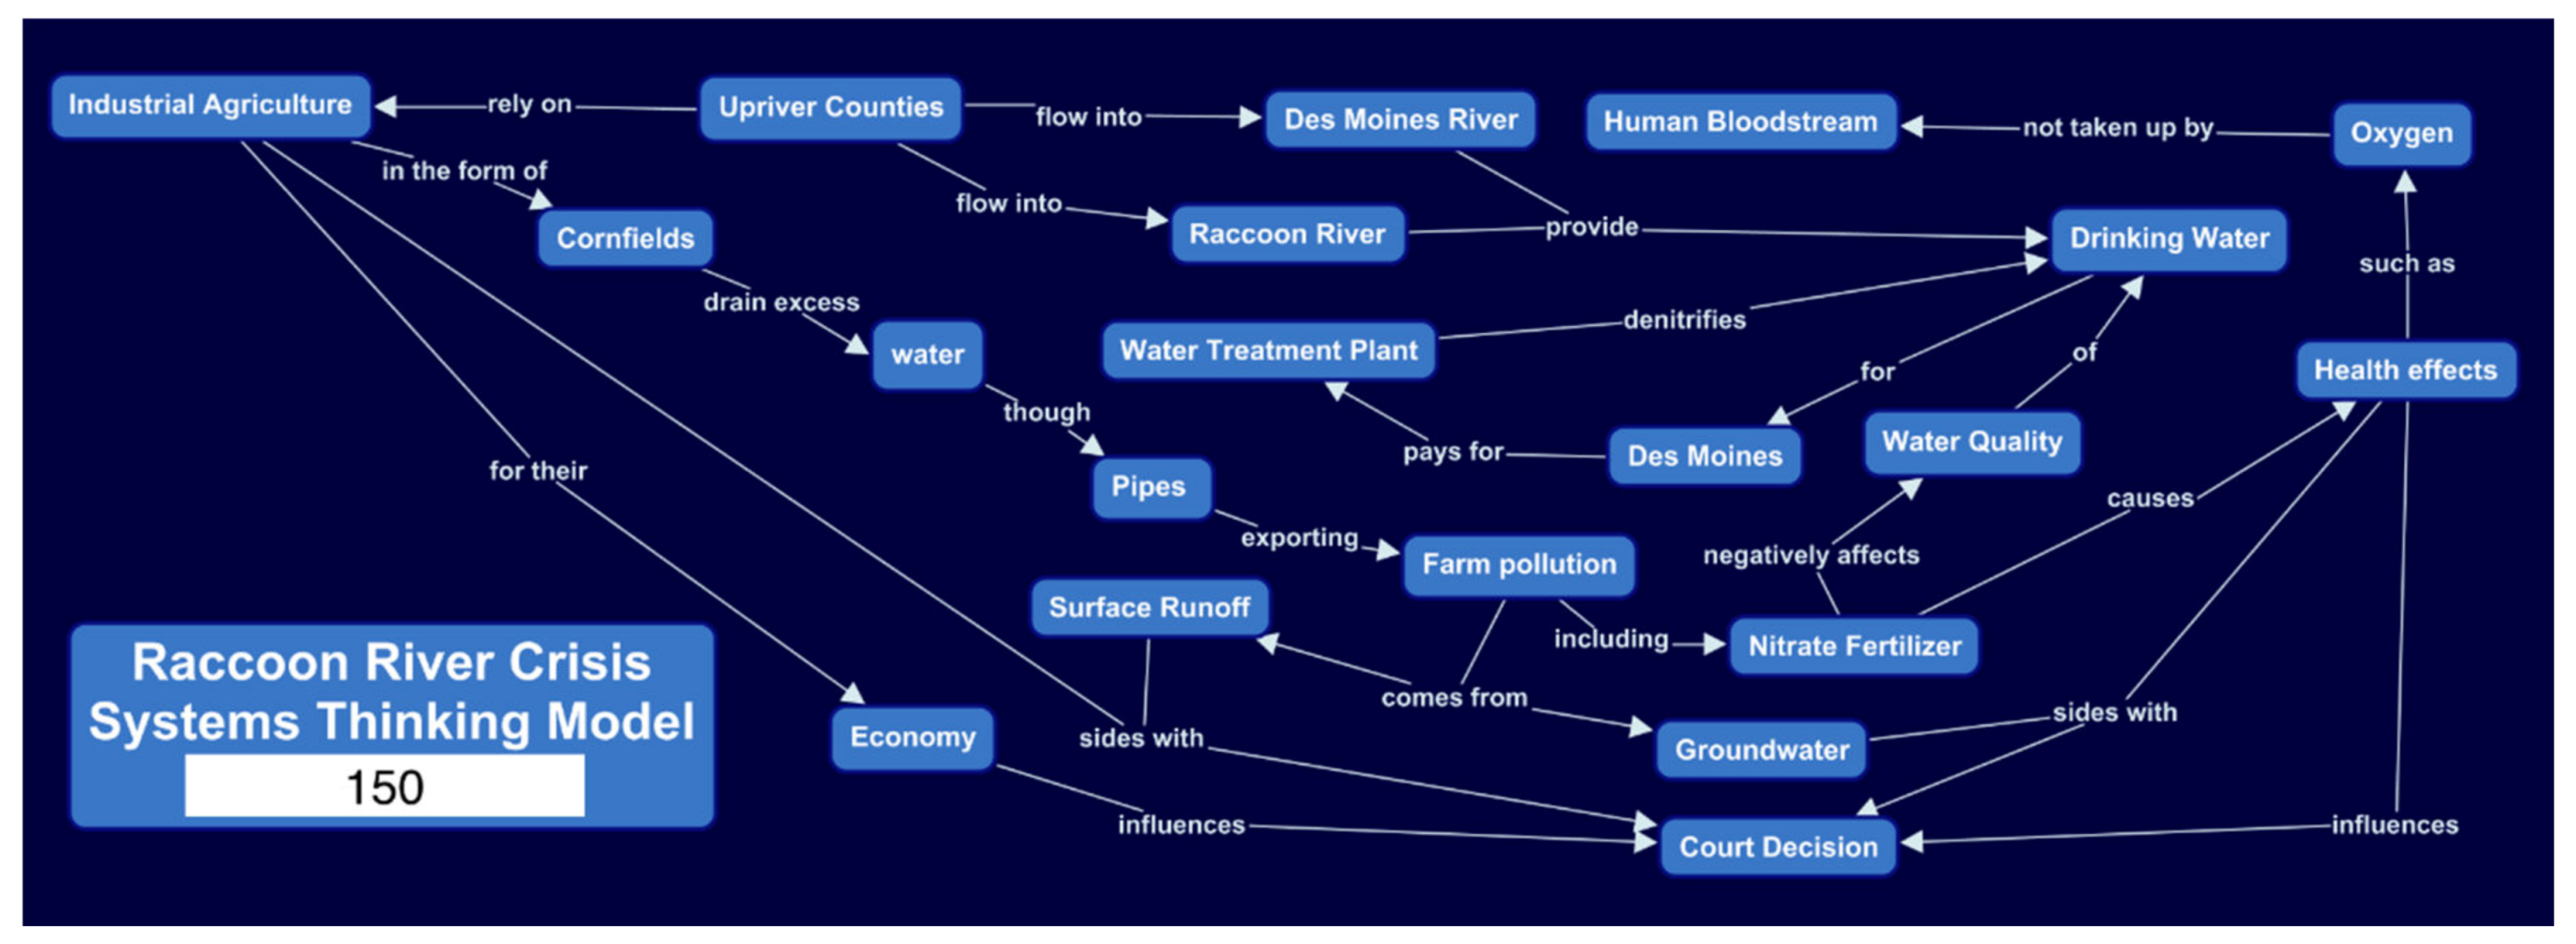
As part of the assignment, students were to generate a systems thinking model (box-and-arrow diagram) (Figure 2) and write an accompanying newspaper article-style description. Students’ goal for the assignment was to describe the system in a way that enabled the citizens of Des Moines to understand the problem and associated processes. For the systems thinking model, students were to identify components of the water crisis within boxes, then demonstrate interconnectedness between the components through a series of arrows or lines. Labelling each arrow or line with a process demonstrates the relationship between connected components. Students were encouraged to include as many details, including processes and components, as they could find that were relevant to the system and helpful in describing it to a potential reader (Table 1).
For the newspaper article description of the Des Moines, IA, water crisis, students were to explain their model to readers and supply additional information not captured within their model. The article was required to include an overview of the system including major components, feedback, and processes with their interconnectivity described for readers (Table 2). A discussion of non-negotiable systems components and processes was to be included, along with a description of what could happen within the system if nothing is done to alleviate the problem. To further demonstrate understanding of the human component, students needed to address how various stakeholder groups would benefit or not benefit from various interacting components and processes. Finally, students were to include a description of the limits of the model including ideas that it did not contain or show. Discussing the limits of their model is important because it can be used as a way to qualitatively measure student self-evaluation.
2.4. Data Analysis
2.4.1. Quantitative Analyses
A scoring rubric, modified from Grohs and colleagues [21], was applied to the written article component of the systems thinking assignment. Written systems thinking articles were scored according to the depth of discussion surrounding five key categories: problem identification, stakeholder awareness, unintended consequences, implementation challenges, and model limitations, ranging from 0 to 3 (see Appendix A). The modeling component of the systems thinking assignment was scored using the rubric from Jordan, Sorensen, and Hmelo-Silver [20] (Table 1). Models were scored according to a simple count of the number of occurrences of phenomenon, mechanisms, or components found in each. Numeric scores were calculated for each article and model.
Inter-rater reliability was established between two coders for all of the data from each year of the study for both models and written components. Rounds of coding for both the models and written components included 10% of the data sample and a review of discrepancies between coders, continuing until percent agreement reached 0.9 for the models and 0.85 for the written component, with discussion following each round of coding, resulting in percent agreement of 1.0 for both the written and components and models. Cohen’s kappa was calculated after the final round of coding for the models (k = 0.79) and the written assignments (k = 0.81) [36]. Model scores were analyzed quantitatively in comparison to article scores to explore relationships between students’ written systems thinking understanding and modular representation.
2.4.2. Qualitative Analyses
For this component of the study, student self-evaluation identified as model limitations in the written article scoring rubric were grouped by emergent theme. Identification of self-evaluation themes allowed for comparison between rubric score levels and pattern identification among students. For this study, students’ written articles were analyzed for the described limitations of their systems thinking model. Limitations were categorized on the basis of the type of limitation: scope/scale; temporal; or a specific component, mechanism, or pattern that was excluded from the model. Only one round of coding was needed to reach a percent agreement of 0.93 with 10% of the data coded and discussion following coding until agreement reached 1. Cohen’s kappa was calculated after this first and final round of coding for the model limitations (k = 0.89) [36]. The coded self-evaluation data supports and helps explain the results from the qualitative analyses.
3. Results
3.1. Research Question 1
In research question 1, we asked, “How do students perform on an SHI systems thinking modeling and writing assignment?” Statistical analyses were conducted using mean scores on students’ drawn models and newspaper articles across all 3 years. For students’ drawn model scores, there was a significant effect of model category on overall model score at the p < 0.05 level (F(2, 384) = 91.67, p < 0.05). Post hoc comparisons using Tukey’s honestly significant difference (HSD) test indicated that the mean score for components was significantly higher than the mean score for mechanisms, which was also higher than the mean score for phenomenon/patterns (Table 4) (see Appendix B). These results suggest that students included more components than mechanisms or patterns in their drawn models of the system. The model category, mechanisms, correlates with, components (r(127) = 0.24, p < 0.05), but not phenomenon/patterns. This observation indicates that as students included more mechanisms in their models, the quantity of components increased in their drawn models as well.
Statistical analyses were also conducted using the written systems thinking newspaper article scores. There was a significant effect of article category on overall model score (F(5, 768) = 401.6, p < 0.05). Results show that students scored the highest on problem identification from their written newspaper article and scored the lowest on their description of unintended consequences. Post hoc comparisons using Tukey’s HSD test indicated that the mean score for problem identification was significantly higher than all of the other categories (Table 5) (see Appendix B). Although the category of implementation challenges is not significantly different from limitations or stakeholder awareness, students scored higher on it than on unintended consequences, indicating that students were best at articulating the problem within the system and least proficient in describing the unintended consequences of the system. Although stakeholder awareness and model limitations also represented areas of improvement for students, model limitations was distinct because it was correlated with all of the categories (stakeholder awareness, r(127) = 0.178, p < 0.05; unintended consequences, r(127) = 0.422, p < 0.05; implementation challenges, r(127) = 0.0543, p < 0.05) except problem identification. Overall, these findings indicated that as students incorporate more ideas about model limitations, their overall article score increases.
3.2. Research Question 2
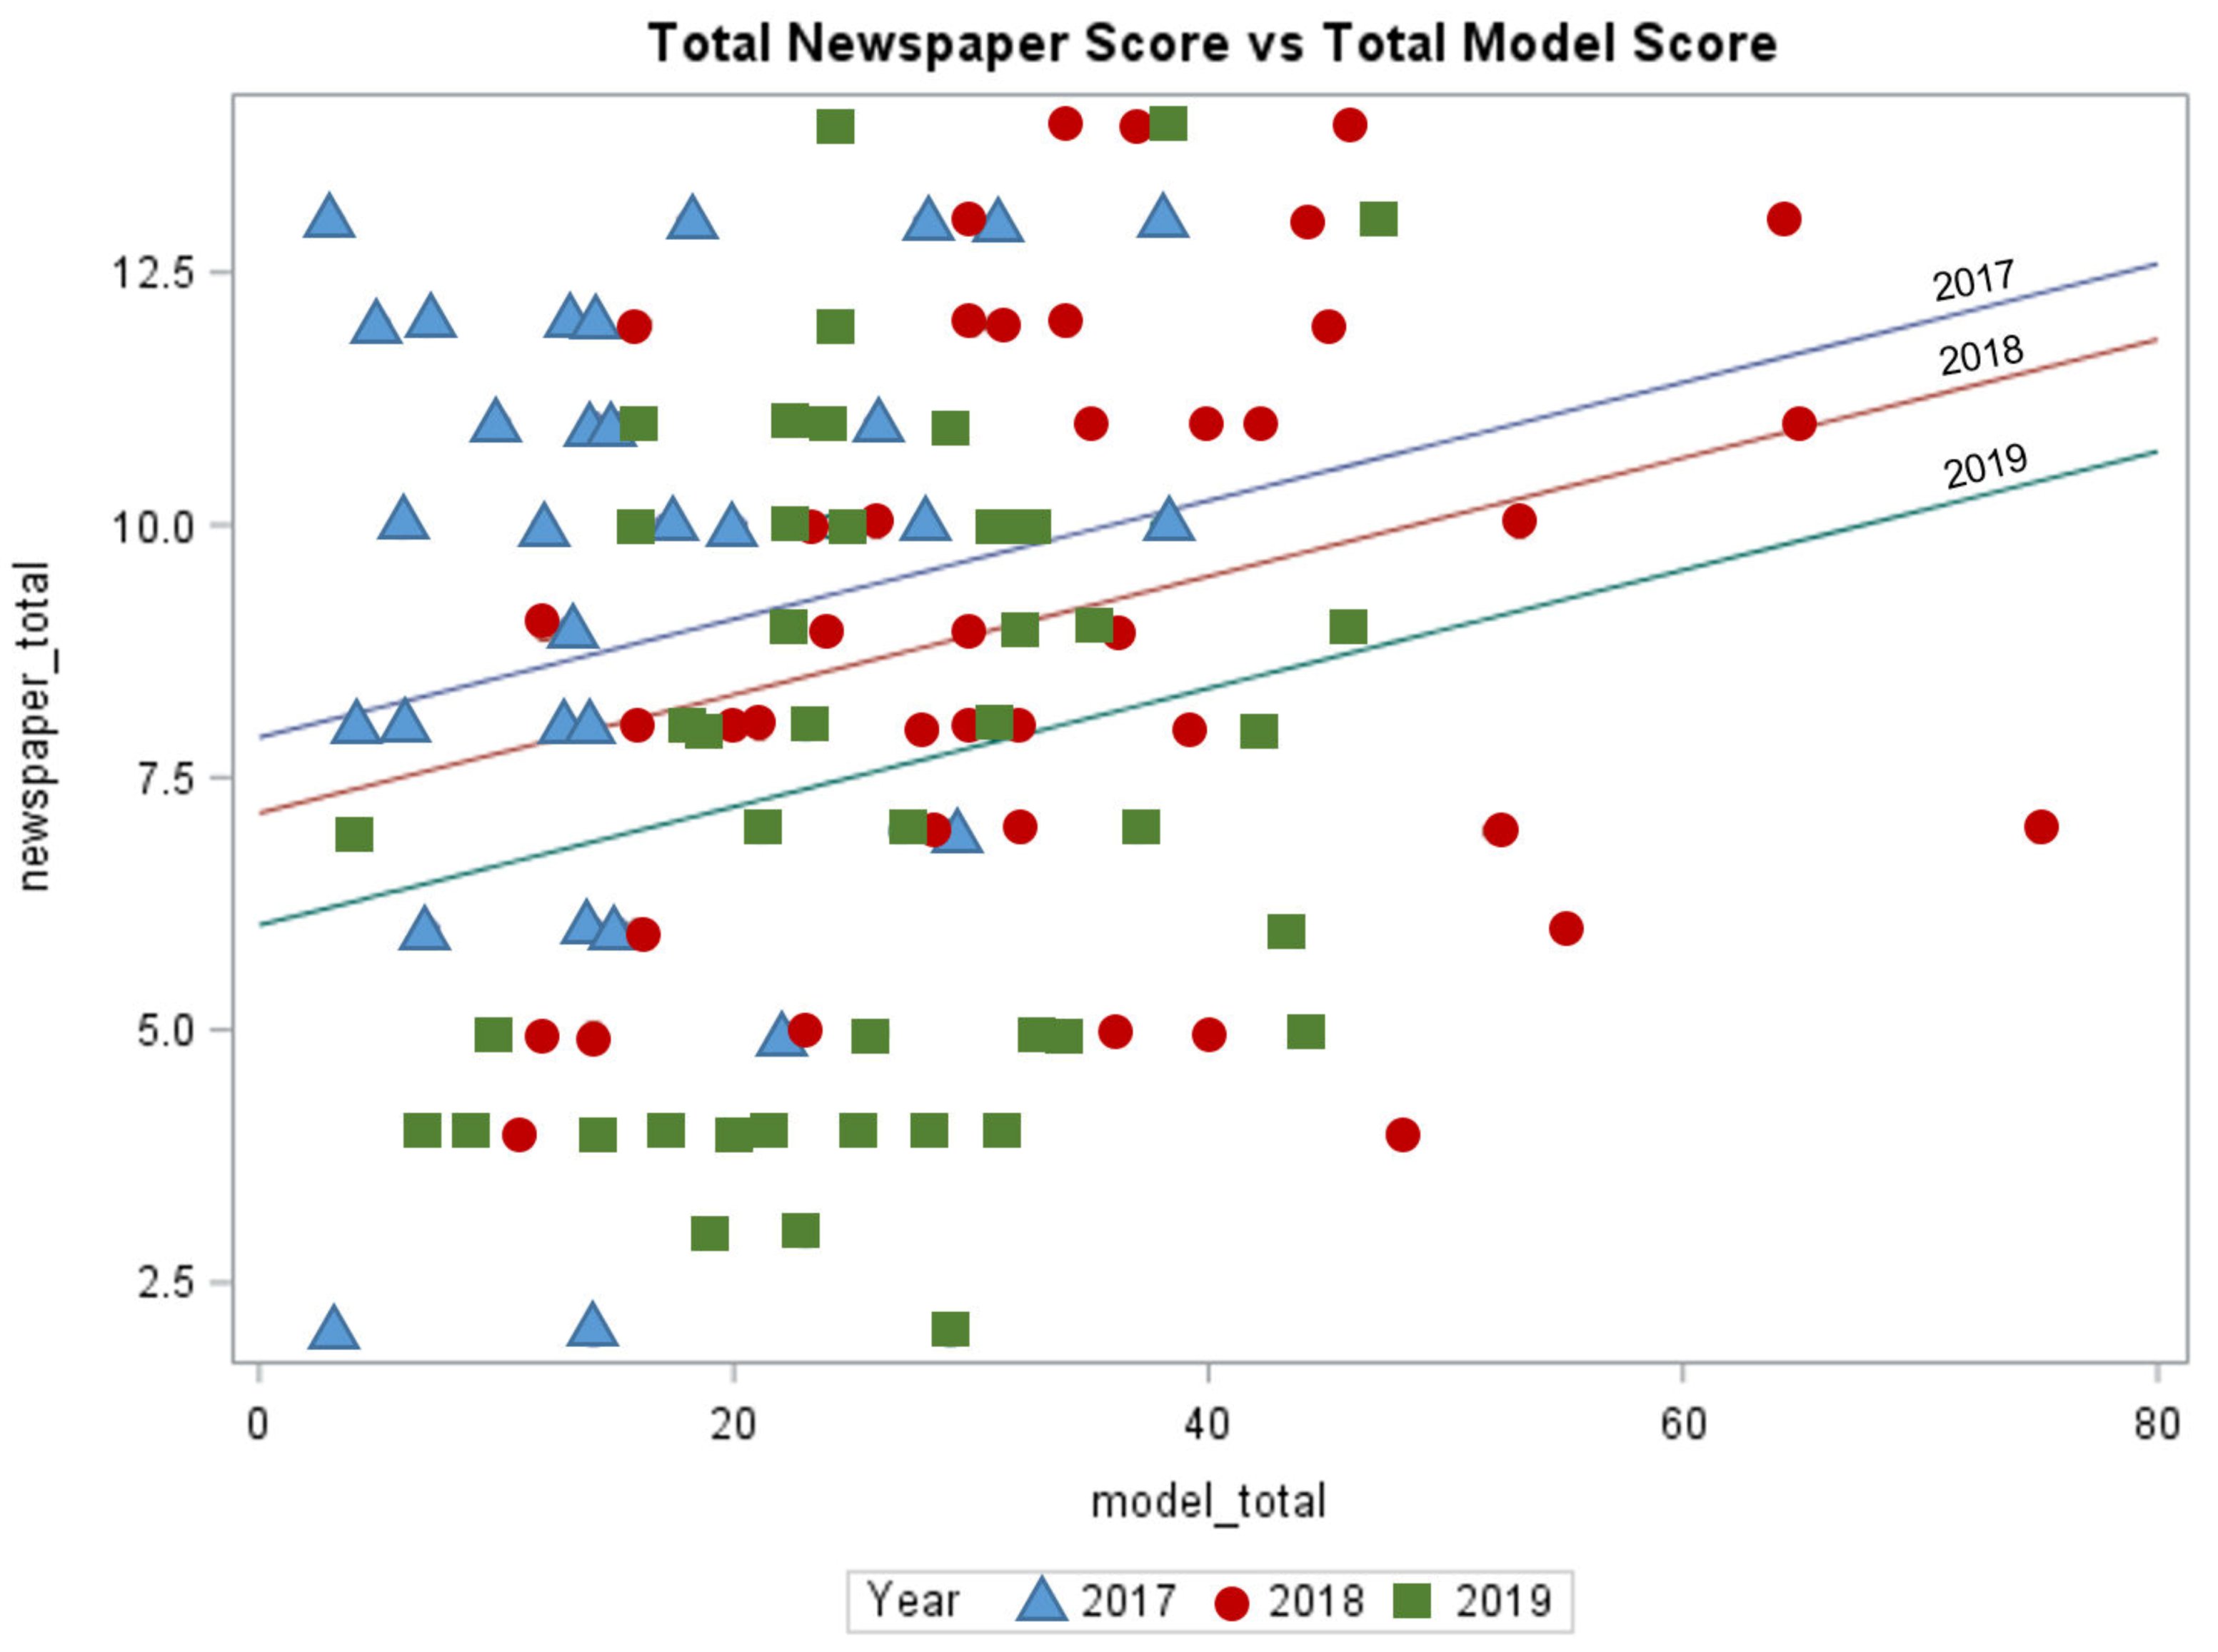
For research question 2, we asked, “To what extent is the systems thinking model score predictive of the writing assignment score on a sociohydrologic issue?” Written article, model scores, and cumulative systems thinking assignment scores for each year were also compared to one another to gain further insight into the relationships between the two systems thinking tasks. A regression analysis and analysis of variance (ANOVA) were performed, results of which suggest that students who score better on the drawn model also perform better on the written article (t(125) = 6.60, p = 0.01, η2 = 0.88) (Figure 3). We also analyzed the effect of year on total systems thinking score, which is the drawn model and written article combined, through a regression and an ANOVA analysis (r(125) = 3.19, p = 0.04, η2 = 0.57; F(2, 126) = 19.8, p < 0.001). Both analyses indicate that there were statistical differences between total systems thinking scores for each year of the course (see Appendix C). An ANOVA of the effect of year on the total systems thinking score revealed that regression lines of expected scores overlain with observed scores for each year demonstrate the slope remaining constant for varying intercepts for each year (β = 0.058). The way we approached the year was taking this as a blocking effect. This allows us to assume and model that the years are acting differently.
The systems thinking scores across years were significantly different from each other. The higher total model and total article scores were all from 2019, whereas the lower total model and total article scores were from both 2017 and 2018. These outstanding points could have resulted from changes made to other course components and overall differences between student populations from year to year. However, the overall regression for model effect was greater than that for year effect on the systems thinking score. This allowed us to end up with a model including a year effect. Where the intercept starts was different because some years were naturally more variable, and the slope remained the same for the total systems thinking score for each year. Overall scores differed between years, but the relationship between the drawn model and written article scores did not. The fundamental relationship was the same no matter where they started or ended.
3.3. Research Question 3
For research question 3, we asked, “How do students evaluate their own systems thinking models of a real-world sociohydrologic issue?” This qualitative data served to augment the quantitative results from research questions 1 and 2. A positive correlation existed between the limitations score and the overall written assignment score (r(127) = 0.71, p < 0.001; F(1, 128) = 7.51, p < 0.05). Correlations were neither found between the limitations written assignment score and overall model score, nor the individual scores for mechanisms, components, and phenomenon/patterns. Students who included a more robust discussion of limitations also performed better on the overall written assignment. Out of the 129 students who completed the systems thinking assignment, 22% failed to include a discussion of any limitations of their drawn model. Of the students who did discuss a drawn model limitation, following analyses, three themes emerged: scope/scale limitations; temporal limitations; and specific components, mechanisms, or phenomena excluded.
3.3.1. Scope and Scale Limitations
First, analyses revealed responses categorized as those having to do with the limitations of the capacity to deal with concepts such the limits to the assignment itself, limited available information, or a limited level of specificity. Students commented on the limitations inherent within the assignment itself, including ideas such as the physical space the assignment uses, the quantity of factors, and the ability to effectively communicate their ideas about a “wicked problem”. For example, one student responded about these types of limitations, writing, “Part of the issue of showing all data is that there can never be enough space to show connections without it becoming incredibly confusing to understand and intricate” (ST_55). Other students echoed this message of scope and sale limitations by writing, “It does not show all aspects of this issue, it only shows the ones that are easy to portray” (ST_9). Similarly, a student wrote that, “The model would have to be expanded tenfold to be able to incorporate all of the human interactions in this system” (ST_6). Students felt that they were not able to effectively discuss all of the influences and aspects of the Raccoon River Water Crisis without compromising the intelligibility of their drawn models. Sometimes students combined multiple ideas into one response such as, “The limit of the model is that there are so many components involved and the model does not clearly explain the how much each party contribute” (ST_129). This response demonstrates both the concepts of scope and scale—the idea of scope as a nearly infinite quantity of components that they would need to include in their model for it to be accurate. The idea of scale is also alluded to; some components had larger impacts than others within the system, which this student noted was not defined within the model. For the model, students were not specifically asked to prioritize components, mechanisms, or phenomena. Similarly, some components of the system remained unmeasured or undocumented (e.g., microplastics), further limiting the overall scope and scale of the model.
However, some felt that they did not have all of the information they needed to effectively convey the scope and scale of the Raccoon River Water Crisis system. For example, one student responded to model limitations by stating, “I think the systems thinking model is limited just because of all the ‘hidden’ things that haven’t been in the news articles” (ST_130). This acknowledges that there are components that are missing from their available information sources, which could have contributed to their model’s accuracy. Another student described a lack of quantitative data as a limiting factor of their model, “I was limited due the fact that there are no numbers that shows how one component affect the other” (ST_124). This response indicates that the level of precision of their model was hampered by the lack of quantitative data available. This level of specificity as a scope and scale limitation was less common in student responses. However, several students commented on scope and scale specificity limitations in reference to names and overall dynamics.
Some students explored the idea of scope and scale specificity through their discussion of limitations related to grain size. One student listed a generalized statement of limited scope and scale by writing, “Broadly, farmers, wildlife, government and environmental groups are not specific. They are listed as large groups although there are probably many different opinions and perspectives within these groups” (ST_96). This type of limitation demonstrates that although the student chose not to break down groups into subgroups, they acknowledged that in doing so, their model may be misleading. A student spoke to this idea as using the model for approximating the scenario without including every specific detail available. They wrote,
The model we use to estimate what is going on is likely to be limited to not putting into consideration every little factor that is involved in this process and it is likely to make assumptions about some processes involved but it is going to help us with estimating what is going on with the river and its system.(ST_61).
This type of response indicates that even though the models were limited in scope and scale, as well as the fact that some of the details were glossed over, the models were still valuable as proxies for the scenario overall.
3.3.2. Temporal Limitations
Temporal limitations were primarily described as those having to do with not knowing what will happen in the future with the system. In a written response containing a temporal limitation, one student said,
I think that the system model gives more of a past and present description instead of the future description and although that’s good, I think it would be even better if the future was also deeply analyzed because it would help in determining the rate at which the problem needs solved.(ST_63)
This response indicated that students were aware of the past, present, and future dimensions of a system and acknowledge that their models are limited without the future possibilities. A few students spoke to future possibilities as limiting factors within their models. A student with this type of response wrote, “It may take years of research to learn what species got affected by the algae in the river, and what health effects it had on people” (ST_45). Responses like this one demonstrate that without the ability to either know or predict future effects of the Raccoon River water crisis on different parts of the system, models will be limited to past and present data, which may not encompass all of the system changes, including specific components, mechanisms, or phenomena.
3.3.3. Specific Components, Mechanisms, or Phenomena Excluded
Most often, in their discussion of model limitations, students listed a specific component/mechanism/phenomenon that was missing from their drawn model. The most common of these three categories was specific components that were excluded from the model. For example, one student wrote, “I find limitation with the way that there is not shown part of the city population in contaminating the rivers, it seems like all blame is for the farmers who use fertilizers on their farms” (ST_139). Student responses such as this indicate that they realized their models were limited in the specific perspectives included. Other students shared similar sentiments, stating that their models were limited in the lack of farmer perspectives included. Another specific component students cited as missing from their interpretation was monetary values. A student responded to the model limitations by writing, “My model does not show economic struggles of the area and how the money in this city is currently being used” (ST_8). This student demonstrated awareness of the importance of money in finding a solution, but also the effect that lack of money can have on different stakeholders. Similarly, a student wrote that, “It doesn’t include all the possible solutions, or the specific amount of money that’s been put towards fixing the crisis” (ST_90). Responses such as this indicate that students were aware of prior solutions and expenses and that there could be other solutions that have not been tried. Often, student responses had a dimension of more than one type of limitation.
Overall, students described fewer mechanisms as missing from their systems thinking models. The students that did include a mechanism as missing from their model largely focused on two processes—economics and environmental processes. One student writing about economic processes missing from their model wrote,
It also doesn’t show the complex economic processes. Companies in Des Moines help farmers with tractors and agribusiness and sales and this causes a growth in the population of Des Moines. People work on large farms that contribute to the Des Moines economy and grows Des Moines further. This kind of large scale economic and industrial feedback is very intricate…(ST_6)
Students writing about detailed processes such as this exhibited a robust understanding of the problem’s social and scientific components. Students who wrote about environmental processes as a limitation of their model also included ideas about socioscientific components, “The graph also doesn’t specify how the water may flow, even through the ground, reaching other areas that aren’t polluting or receiving benefits from the state” (ST_113). Students incorporating knowledge from across the semester of hydrologic and human interactions demonstrated their depth of learning and attainment of course learning goals.
Phenomena or patterns were also identified as specific model limitations that were discussed in the written newspaper articles. The majority of responses in this category of limitation surrounded the idea of polluted water flowing from the Raccoon River to the dead zone in the Gulf of Mexico and harming wildlife. One student wrote about all of these ideas in summary by stating,
The model is missing the dead zone and the environmental portion of the issue. To make the model better, it would have to include these environmental effects. Including the animal species and the systems that function in that environment. Another way to make this model stronger, would be to add the communities that would also be affected in the Gulf.(ST_121)
Students demonstrate their ability to view the contribution of one geographic area to the degradation of another. Another student wrote, “… but it does little to show the far-reaching effects of this problem as a whole. Nitrates from these and other fields around the United States pollute the Gulf of Mexico, and countless other waterways” (ST_25). This response took the idea of phenomena generalizability to a higher level by describing how the model was limited by leaving out this aspect and including the idea that this is happening in other parts of the country and affecting other waterways.
4. Discussion
In the context of water systems, students express a variety of levels of understanding and often alternative conceptions across the continuum of K-12 and undergraduate formal education [9,14,16] and beyond [15]. Systems thinking is a way to help students utilize water systems concepts to engage in problem solving, which is a critical part of science and environmental literacy [2,3]. Students need opportunities to develop the epistemic dimensions of contextualizing the system and integrating themselves into the system [19]. Learning to consider how seemingly separate systems interact to cause a phenomenon, as well as the integration of human actions into such systems, is important when using systems thinking. Yet, this important skill is often difficult for students to learn effectively [16,28,29,30]. Providing students with the specific instruction in this skill [1] and opportunities to practice systems thinking with increasingly challenging scenarios can be an effective way to address this need. Engaging students in generating models of a system is a method to scaffold learning about complex issues [2,31], including sociohydrologic issues. This study provides valuable insights into students’ use of models, written descriptions, and evaluations of a real-world water-related issue using systems thinking.
First, study findings showed that the students who drew a more robust diagrammatic model were also better able to operationalize the system through writing. This trend and empirically supported relationship was consistent across the 3 years of the course, though at varying levels. We hypothesize that this was due to explicit instruction surrounding the development of a systems thinking model and the benefits gained from thinking about the system in both visual and descriptive contexts. The literature indicates that specific instruction in systems thinking is helpful in increasing student systems reasoning [2,3], whereas diagrammatic models also serve as a scaffold [20]. Students can hold ideas in the drawn model, freeing up cognitive space for more nuanced connections between systems in their written article. Additionally, affording students opportunities to practice these skills in successively more interwoven and ill-defined systems can be an effective strategy for learning this skill [4,12]. Pedagogical practices such as these may have enabled students to better clarify the components, mechanisms, and phenomena involved in the Raccoon River crisis in order to describe it more thoroughly in a written format. These findings contribute to the understanding of how to help students develop understanding of sociohydrologic systems through the context of a systems thinking modeling and writing assignment.
Second, results provided finer-grain insights into elements of systems thinking that students emphasize in relation to SHS. Students emphasized components more strongly in their diagrammatic models than mechanisms or phenomenon/patterns (Figure 2). When students reason about an SHS, their values and experiences inform their ideas and decisions [5]. Student experiences with water frame, particularly their firsthand experiences, may have directly contributed to the emphasis of components in diagrammatic models. System components are tangible and easy to visualize, making them more readily transferrable to diagrams than mechanisms or phenomenon/patterns. Providing students with a specific system can help them productively constrain their model to the most salient parts [25], in this case through an emphasis on the tangible parts of the SHS.
In the context of the written article, students emphasized problem identification most and unintended consequences least. Similar to components in a diagrammatic model, students more thoroughly identified the problem within the SHS. Problem identification includes the mechanics and circumstances of the problem [21]. In identifying the problem, students expressed more robust descriptions of the overall issue; doing so likely requires less context and nuance than probing the unintended consequences and implementation challenges of potential solutions. This pattern of more fully exploring the problem in the article and the components of the diagrammatic model could be a product of these being more concrete and therefore easier to analyze.
Third, study findings illustrated trends in one of the elements of modeling and systems thinking—students’ model evaluation. The majority of students included some form of model limitation in their article, and these limitations fell into three categories of temporal, scope/scale, and specific component/mechanism/phenomena. Additionally, findings indicated that as students provided more thorough descriptions of the ways in which their model was limited, their overall written assignment score increased. These findings surrounding evaluation contributed to a wider body of teaching and learning work in water education across the K-16 continuum [6,12,23,26]. The ability to critique one’s work highlights the following constraints: mental, physical, and temporal, all of which contribute to the final product [21]. Model evaluation can take place during or after the development of a systems thinking model. The repeated process of revising one’s work and thinking of an idea as malleable are ways that students can harness the benefits of metacognition to systems thinking [21]. Evaluating a model for its constraints is one of the types of critical thinking that students need in order to develop scientific literacy [22,24]. All physical models are incomplete renderings of the natural world. Models are useful comparisons to the real-world, and their effect is maximized when students evaluate their own and others’ models in comparison to experts’ models [24]. Students need opportunities to think about model constraints and their effect when using models to solve real-world problems.
5. Conclusions
“…All things are not knowable and that the whole is indeed greater than the sum of its parts” [18]. Systems thinking is complicated, and demanding students to be able to consider all of the possibilities and pieces that are potentially related to a system is unrealistic. However, it is important for students to know and experience that it is neither the case that any one part of a system is greater than the whole system, nor does a model require inclusion of every potential component or process within a systems thinking model in order for it to be useful. Models are inherently simplified versions of complex systems and valued for their applicability to particular problems. However, models do give students the opportunity to hypothesize and experiment with varying outcomes of a model in the pursuit of a suite of potential solutions.
This study highlights (1) undergraduate students’ systems thinking-based reasoning about water systems [31], (2) advances in research focused on students’ use of systems thinking to reason about water systems [2], and (3) students’ ability to critically evaluate drawn systems thinking models [20,28]. The study findings suggest that teaching students to use systems thinking to reason about an SHS is only one part of the challenge. Students need encouragement to include as many details surrounding the components, mechanisms, and phenomena as possible in their models so they have more to discuss when they write about them. Linking this need with the use of systems thinking, students can develop experience and techniques in areas such as problem identification, stakeholder awareness, unintended consequences, implementation challenges, and model limitations surrounding an SHS [21]. Explicitly defining each of these categories and allowing students to explore interconnectivity between them in small and large group settings using primary and secondary sources can be beneficial to students of all backgrounds and levels of proficiency. Combining the skills of diagramming a system and writing a description of the system could be powerful in increasing student systems thinking skills overall.
Misconceptions surrounding water, particularly the components and processes—which are more inaccessible and hard to visualize—persist [13], and these processes are often thought of as discreet from other, related geoscience processes [10,11]. Students may have relied on experiences to identify components of the system, and they may have had fewer experiences with the mechanisms and phenomena of the system; thus leading to fewer mechanisms and phenomena in their drawn models. Study findings also suggest that students need more practice both drawing and describing systems thinking models, opportunities that may not be commonplace in undergraduate geoscience courses [27]. Specific curriculum and instruction to support growth in reasoning about the complexities and interactions between water systems are needed to help students develop ideas about their application to daily lives [7,8,17]. Purposefully designing undergraduate learning experiences to support systems thinking can help to increase the quality of systems thinking models and thereby student understanding of them. Focusing on specific concepts such as feedback loops is helpful to students in developing these linkages [29]. Using systems thinking also helps students learn about their individual responsibility to use water wisely given the uncontrollable nature of cycles [30]. Learning gains in systems thinking are developed through the use of best practice strategies including active learning opportunities in group settings and through iterative practice with increasingly more complex scenarios. Providing space for students to consider the role of humans in SHSs is valuable because they move forward as future decision makers and change agents.
Author Contributions
Conceptualization, D.L. and C.T.F.; methodology, D.L. and C.T.F.; software, D.L.; validation, D.L.; formal analysis, D.L.; investigation, D.L. and C.T.F.; resources, C.T.F.; data curation, D.L.; writing—original draft preparation, D.L.; writing—review and editing, D.L. and C.T.F.; visualization D.L.; supervision, C.T.F.; project administration, C.T.F.; funding acquisition, C.T.F. All authors have read and agreed to the published version of the manuscript.
Funding
This work was supported by the National Science Foundation (DUE-1609598). Any opinions, findings, and conclusions or recommendations expressed in this material are those of the author(s) and do not necessarily reflect the views of the National Science Foundation.
Acknowledgments
We would like to thank Holly White and all of the students for their contribution to this study.
Conflicts of Interest
The authors declare no conflict of interest.
Appendix A

Table A1.
Systems thinking writing rubric [21].
Table A1.
Systems thinking writing rubric [21].
| Component | 0 | 1 | 2 | 3 |
|---|---|---|---|---|
| Problem identification | No response provided or respondent was unable to identify a relevant problem. | The problem statement identified was only technical or only contextual (economic, political, environmental, social, time, etc.) in scope. | The problem statement (A) defined both technical and contextual aspects but did not acknowledge interaction and complexity between issues, (B) identified technical aspect or contextual aspect only, and acknowledged interactions and complexities between issues. | The problem statement identified both technical and contextual aspects and acknowledged interactions and complexity between issues |
| Stakeholder awareness | No response was provided or respondent only provided a list of stakeholders but no discussion on the role that the stakeholders will play in identifying and implementing possible solutions. | The response included a list of stakeholders; discussion of role of stakeholders was limited only to one group of stakeholders (community, power/politics, experts) providing input in discussions to identify possible solutions. | The response listed an array of various stakeholders (community, power/politics, experts). Discussion of the role of stakeholders included (1) one group of stakeholders being engaged in activities to identify and implement possible solutions, or (2) more than one group of stakeholders providing input in discussions to identify possible solutions. | The response listed an array of various stakeholders (community, power/politics, experts). Discussion of the role of stakeholders included all stakeholders iteratively giving input and engaging with each other to identify and implement possible solutions. The discussion explicitly included listening to the community voice and getting buy-in from the community. |
| Unintended consequences | No response was provided, or response did not show potential unintended consequences | The response identified potential unintended consequences that covered one or more aspects: technical and/or contextual (economic, political, environmental, social, time, etc.), but did not consider interaction of different aspects and issues. | The response identified several potential unintended consequences. Response considered/implied issue interaction of several aspects, but there was notable focus on a single aspect. | The response identified several potential unintended consequences. Responses considered and discussed issue interaction between aspects and considered both short- and long-term consequences. |
| Implementation challenges | No response was provided or response did not identify any potential implementation challenges | The response identified potential simple, short-term implementation challenges focused on one aspect: technical or contextual (economic, political, environmental, social, time, etc.). | The response identified potential implementation challenges that were (1) focused on one aspect long-term, (2) focused on one aspect and considered both short- and long-term challenges, or (3) considered both technical and contextual aspects and short-term challenges. | The response identified several potential challenges that considered both technical and contextual aspects and the possible interaction between aspects; response recognized possible barriers due to trade-offs between short- and long-term plans. |
| Model limitations | No response was provided or response did not identify any potential limitations of the model. | The response identified potential model limitations focused on one aspect: technical or contextual (economic, political, environmental, social, time, etc.). | The response identified several potential model limitations. Response considered/implied several reasons for limitations, but there was notable focus on a single aspect. | The response identified several potential model limitations. Responses considered and discussed model limitations and their potential model impacts. |
Appendix B
Table A2.
Model and article rubric components ANOVA analysis.
| df | SS | MS | F | P | ||
|---|---|---|---|---|---|---|
| Model Components | ||||||
| Components | Between groups | 2 | 1122.98 | 561.49 | 12.99 | <0.05 |
| Within groups | 125 | 5404.99 | 43.24 | |||
| Total | 127 | 6527.97 | ||||
| Mechanisms | Between groups | 2 | 1746.59 | 873.29 | 17.88 | <0.05 |
| Within groups | 126 | 6154.41 | 48.84 | |||
| Total | 128 | 7900.99 | ||||
| Phenomenon/patterns | Between groups | 2 | 107.93 | 53.97 | 10.86 | <0.05 |
| Within groups | 126 | 626.04 | 4.97 | |||
| Total | 128 | 733.97 | ||||
| Article Components | ||||||
| Problem identification | Between groups | 2 | 8.22 | 4.11 | 8.6 | <0.05 |
| Within groups | 126 | 60.26 | 0.48 | |||
| Total | 128 | 68.48 | ||||
| Stakeholder awareness | Between groups | 2 | 4.06 | 2.03 | 3.1 | <0.05 |
| Within groups | 125 | 81.93 | 0.66 | |||
| Total | 127 | 85.99 | ||||
| Unintended consequences | Between Groups | 2 | 7.74 | 3.87 | 3.37 | <0.05 |
| Within Groups | 123 | 141.25 | 1.15 | |||
| Total | 125 | 148.99 | ||||
| Implementation challenges | Between Groups | 2 | 8.53 | 4.26 | 3.04 | >0.05 |
| Within Groups | 123 | 172.69 | 1.4 | |||
| Total | 125 | 181.21 | ||||
| Limitations | Between Groups | 2 | 0.36 | 0.18 | 0.14 | >0.05 |
| Within Groups | 123 | 159.11 | 1.29 | |||
| Total | 125 | 159.47 |
Appendix C
Table A3.
Model and article rubric component mean, standard deviation, and Tukey’s HSD for 2017, 2018, and 2019.
Table A3.
Model and article rubric component mean, standard deviation, and Tukey’s HSD for 2017, 2018, and 2019.
| Model Components | n | Mean | Standard Deviation | Tukey’s HSD Comparisons | |||
|---|---|---|---|---|---|---|---|
| 2017 | 2018 | 2019 | |||||
| Components | 2017 | 35 | 9.8 | 6.19 | |||
| 2018 | 48 | 17.06 | 6.96 | <0.0001 | |||
| 2019 | 46 | 12.72 | 6.41 | 0.1207 | 0.0048 | ||
| Mechanisms | 2017 | 35 | 3.83 | 3.98 | |||
| 2018 | 48 | 13.1 | 9.56 | <0.0001 | |||
| 2019 | 46 | 9.61 | 5.42 | 0.001 | 0.044 | ||
| Phenomenon/patterns | 2017 | 35 | 1.8 | 1.69 | |||
| 2018 | 48 | 2.85 | 1.77 | 0.5514 | |||
| 2019 | 46 | 4.12 | 2.91 | 0.0002 | 0.0613 | ||
| Article Components | n | Mean | Std. Deviation | Tukey’s HSD Comparisons | |||
| 2017 | 2018 | 2019 | |||||
| Problem identification | 2017 | 35 | 1.94 | 0.87 | |||
| 2018 | 48 | 2.54 | 0.5 | 0.0005 | |||
| 2019 | 46 | 2.11 | 0.71 | 0.535 | 0.0082 | ||
| Stakeholder awareness | 2017 | 35 | 1.26 | 0.74 | |||
| 2018 | 48 | 1.71 | 0.77 | 0.0348 | |||
| 2019 | 46 | 1.46 | 0.89 | 0.5148 | 0.2884 | ||
| Unintended consequences | 2017 | 35 | 1.86 | 1.03 | |||
| 2018 | 48 | 1.38 | 1.16 | 0.1097 | |||
| 2019 | 46 | 1.17 | 1 | 0.0141 | 0.6343 | ||
| Implementation challenges | 2017 | 35 | 2.14 | 0.91 | |||
| 2018 | 48 | 1.88 | 1.16 | ||||
| 2019 | 46 | 1.43 | 1.38 | ||||
| Limitations | 2017 | 35 | 1.6 | 0.95 | |||
| 2018 | 48 | 1.58 | 1.18 | ||||
| 2019 | 46 | 1.41 | 1.24 | ||||
References
- Richmond, B. Systems thinking: Critical thinking skills for the 1990s and beyond. Syst. Dyn. Rev. 1993, 9, 113–133. [Google Scholar] [CrossRef] [Green Version]
- Hmelo-Silver, C.; Jordan, R.; Eberbach, C.; Sinha, S. Systems learning with a conceptual representation: A quasi-experimental study. Instr. Sci. 2016, 45, 53–72. [Google Scholar] [CrossRef]
- Yoon, S.A.; Hmelo-Silver, C. Introduction to special issue: Models and tools for systems learning and instruction. Instr. Sci. 2017, 45, 1–4. [Google Scholar] [CrossRef]
- Assaraf, O.B.Z.; Orion, N. Development of system thinking skills in the context of earth system education. J. Res. Sci. Teach. 2005, 42, 518–560. [Google Scholar] [CrossRef]
- Petitt, D.N.; Forbes, C.T. Values Use in Undergraduate Students’ Socio-Hydrological Reasoning: A Comparative Study. Nat. Sci. Educ. 2019, 48, 1–12. [Google Scholar] [CrossRef]
- Sabel, J.L.; Vo, T.; Alred, A.; Dauer, J.M.; Forbes, C.T. Undergraduate students’ scientifically-informed decision-making about socio-hydrological issues. J. Coll. Sci. Teach. 2017, 46, 64–72. [Google Scholar] [CrossRef]
- Covitt, B.A.; Gunckel, K.L.; Anderson, C.W. Students’ Developing Understanding of Water in Environmental Systems. J. Environ. Educ. 2009, 40, 37–51. [Google Scholar] [CrossRef]
- Gunckel, K.L.; Covitt, B.A.; Salinas, I.; Anderson, C.W. A learning progression for water in socio-ecological systems. J. Res. Sci. Teach. 2012, 49, 843–868. [Google Scholar] [CrossRef]
- Sibley, D.F.; Heidemann, M.; Merrill, J.; Parker, J.; Szymanski, D.W.; Anderson, C.W. Box Diagrams to Assess Students’ Systems Thinking about the Rock, Water and Carbon Cycles. J. Geosci. Educ. 2007, 55, 138–146. [Google Scholar] [CrossRef]
- Shepardson, D.P.; Wee, B.; Priddy, M.; Schellenberger, L.; Harbor, J.; Harbor, J. Water Transformation and Storage in the Mountains and at the Coast: Midwest students’ disconnected conceptions of the hydrologic cycle. Int. J. Sci. Educ. 2009, 31, 1447–1471. [Google Scholar] [CrossRef]
- Batzri, O.; Assaraf, O.B.Z.; Cohen, C.; Orion, N. Understanding the Earth Systems: Expressions of Dynamic and Cyclic Thinking Among University Students. J. Sci. Educ. Technol. 2015, 24, 761–775. [Google Scholar] [CrossRef]
- Vo, T.; Forbes, C.T.; Zangori, L.; Schwarz, C. Fostering Third-Grade Students? Use of Scientific Models with the Water Cycle: Elementary teachers? conceptions and practices. Int. J. Sci. Educ. 2015, 37, 2411–2432. [Google Scholar] [CrossRef]
- Cardak, O. Science Students’ Misconceptions of the Water Cycle According to their Drawings. J. Appl. Sci. 2009, 9, 865–873. [Google Scholar] [CrossRef]
- Halvorson, S.J.; Wescoat, J.L. Problem-Based Inquiry on World Water Problems in Large Undergraduate Classes. J. Geogr. 2002, 101, 91–102. [Google Scholar] [CrossRef]
- Duda, M.D. (Ed.) Americans’ Knowledge of and Attitudes Toward Water and Water-Related Issues; Responsive Management National Office: Harrisonburg, VA, USA, 2005; Available online: https://www.responsivemanagement.com (accessed on 20 August 2019).
- Coştu, B.; Ayas, A.; Niaz, M. Promoting conceptual change in first year students’ understanding of evaporation. Chem. Educ. Res. Pract. 2010, 11, 5–16. [Google Scholar]
- Canpolat, N. Turkish Undergraduates’ Misconceptions of Evaporation, Evaporation Rate, and Vapour Pressure. Int. J. Sci. Educ. 2006, 28, 1757–1770. [Google Scholar] [CrossRef]
- Bawden, R.J.; Macadam, R.D.; Packham, R.J.; Valentine, I. Systems thinking and practices in the education of agriculturalists. Agric. Syst. 1984, 13, 205–225. [Google Scholar] [CrossRef]
- Bawden, R. Knowing systems and the environment. In The SAGE Handbook of Environment and Society; SAGE Publications Ltd.: London, UK, 2007; pp. 224–234. [Google Scholar]
- Jordan, R.; Sorensen, A.E.; Hmelo-Silver, C. A Conceptual Representation to Support Ecological Systems Learning. Nat. Sci. Educ. 2014, 43, 141–146. [Google Scholar] [CrossRef]
- Grohs, J.; Kirk, G.; Soledad, M.; Knight, D. Assessing systems thinking: A tool to measure complex reasoning through ill-structured problems. Think. Ski. Creat. 2018, 28, 110–130. [Google Scholar] [CrossRef]
- Lally, D.; Forbes, C.T. Modelling water systems in an introductory undergraduate course: Students’ use and evaluation of data-driven, computer-based models. Int. J. Sci. Educ. 2019, 41, 1999–2023. [Google Scholar] [CrossRef]
- Zangori, L.; Vo, T.; Forbes, C.T.; Schwarz, C. Supporting 3rd-grade students model-based explanations about groundwater: A quasi-experimental study of a curricular intervention. Int. J. Sci. Educ. 2017, 39, 1–22. [Google Scholar] [CrossRef] [Green Version]
- Coll, R.K.; France, B.; Taylor, I. The role of models/and analogies in science education: Implications from research. Int. J. Sci. Educ. 2005, 27, 183–198. [Google Scholar] [CrossRef]
- Gouvea, J.; Passmore, C. Models of ‘versus’ models for. Sci. Educ. 2017, 26, 49–63. [Google Scholar] [CrossRef]
- Pluta, W.J.; Chinn, C.A.; Duncan, R.G. Learners’ epistemic criteria for good scientific models. J. Res. Sci. Teach. 2011, 48, 486–511. [Google Scholar] [CrossRef]
- Lally, D.; Forbes, C.T.; McNeal, K.S.; Soltis, N.A. National Geoscience Faculty Survey 2016: Prevalence of systems thinking and scientific modeling learning opportunities. J. Geosci. Educ. 2019, 67, 174–191. [Google Scholar] [CrossRef]
- Jordan, R.C.; Brooks, W.; Hmelo-Silver, C.; Eberbach, C.; Sinha, S. Balancing broad ideas with context: An evaluation of student accuracy in describing ecosystem processes after a system-level intervention. J. Boil. Educ. 2013, 48, 57–62. [Google Scholar] [CrossRef]
- Kastens, K.A.; Manduca, C.A.; Cervato, C.; Frodeman, R.; Goodwin, C.; Liben, L.S.; Titus, S. How geoscientists think and learn. Eos Trans. Am. Geophys. Union 2009, 90, 265–266. [Google Scholar] [CrossRef]
- Rates, C.A.; Mulvey, B.; Feldon, D.F. Promoting Conceptual Change for Complex Systems Understanding: Outcomes of an Agent-Based Participatory Simulation. J. Sci. Educ. Technol. 2016, 25, 610–627. [Google Scholar] [CrossRef]
- Danish, J.; Saleh, A.; Andrade, A.; Bryan, B. Observing complex systems thinking in the zone of proximal development. Instr. Sci. 2016, 45, 5–24. [Google Scholar] [CrossRef]
- Forbes, C.T.; Brozovic, N.; Franz, T.; Lally, D.; Petitt, D. Water in Society: An interdisciplinary course to support undergraduate students’ water literacy. J. Coll. Sci. Teach. 2018, 48, 36–42. [Google Scholar]
- Rodgers, G.; Eller, D. Environmentalists say ruling could slow water quality efforts. Des Moines Register. Available online: https://www.desmoinesregister.com/ (accessed on 27 January 2017).
- Pfannenstiel, B.; Eller, D. Key achievement or drop in the bucket? What $282 million water quality bill means for Iowans. Des Moines Register. Available online: https://www.desmoinesregister.com/ (accessed on 28 January 2018).
- Royte, E. The simple river-cleaning tactics that big farms ignore. National Geographic. Available online: https://news.nationalgeographic.com/ (accessed on 7 December 2017).
- Lombard, M.; Snyder-Duch, J.; Bracken, C.C. Content analysis in mass communication: Assessment and reporting of intercoder reliability. Hum. Commun. Res. 2002, 28, 587–604. [Google Scholar] [CrossRef]
Figure 1.
Theoretical framework of systems thinking skills.

Figure 2.
Students’ most often included system components in their model.

Figure 3.
Observed values by year with associated regression lines.

Table 1.
Elements of a systems thinking model [20].
Table 1.
Elements of a systems thinking model [20].
| Element | Definition | Example |
|---|---|---|
| (P)henomenon or Pattern | Final product(s) or process(es) resulting from the system | Eutrophication, unsafe water |
| (M)echanism | Processes involved with the system | Leaching, increasing taxes, lobbying |
| (C)omponent | Things and organizations involved with the system | Nitrogen, taxpayers, farm, government |
Table 2.
Components of systems thinking [21].
Table 2.
Components of systems thinking [21].
| Component | Description |
|---|---|
| Problem identification | The mechanics and the circumstances of the problem. |
| Stakeholder awareness | The different people and roles they play in the system and potential solutions. |
| Unintended consequences | Unintended and intentional consequence exploration in both immediate and delayed temporal scales. |
| Implementation challenges | Including the non-negotiable processes and components, both mechanical and circumstantial in nature, accompanied by the exchanges that occur when trying to problem solve for multiple layers and players in a system. |
| Model limitations | The product of self-evaluating the comprehensiveness of one’s systems thinking model. |
Table 3.
Student demographics from 2017, 2018, and 2019.
| Year | Female | Male | Freshmen | Sophomore | Junior | Senior/+ | STEM Major | Non-STEM Major |
|---|---|---|---|---|---|---|---|---|
| 2017 | 15 | 20 | 9 | 10 | 9 | 7 | 26 | 9 |
| 2018 | 27 | 21 | 2 | 24 | 13 | 9 | 44 | 4 |
| 2019 | 19 | 27 | 5 | 16 | 16 | 9 | 42 | 4 |
Table 4.
Tukey’s honestly significant difference (HSD) comparisons for article and model components.
Table 4.
Tukey’s honestly significant difference (HSD) comparisons for article and model components.
| Model Component | n | Mean | Standard Deviation (SD) | Tukey’s HSD Comparisons | ||
|---|---|---|---|---|---|---|
| Components | Mechanisms | Phenomenon/Patterns | ||||
| Components | 129 | 13.54 | 7.15 | |||
| Mechanisms | 129 | 9.34 | 7.86 | <0.0001 | ||
| Phenomenon/pattern | 129 | 3.01 | 2.39 | <0.0001 | <0.0001 | |
Table 5.
Tukey’s HSD comparisons for article and model components.
| Article Component | n | Mean | SD | Tukey’s HSD Comparisons | ||||
|---|---|---|---|---|---|---|---|---|
| Problem Identification | Stakeholder Awareness | Unintended Consequences | Implementation Challenges | Model Limitations | ||||
| Problem identification | 129 | 2.22 | 0.73 | |||||
| Stakeholder awareness | 129 | 1.5 | 0.82 | <0.0001 | ||||
| Unintended consequences | 129 | 1.43 | 1.1 | <0.0001 | 0.9883 | |||
| Implementation challenges | 129 | 1.79 | 1.21 | 0.0058 | 0.1379 | 0.04 | ||
| Model limitations | 129 | 1.53 | 1.14 | <0.0001 | 0.9992 | 0.9484 | 0.2294 | |
© 2020 by the authors. Licensee MDPI, Basel, Switzerland. This article is an open access article distributed under the terms and conditions of the Creative Commons Attribution (CC BY) license (http://creativecommons.org/licenses/by/4.0/).
Share and Cite
MDPI and ACS Style
Lally, D.; Forbes, C.T. Sociohydrologic Systems Thinking: An Analysis of Undergraduate Students’ Operationalization and Modeling of Coupled Human-Water Systems. Water 2020, 12, 1040. https://doi.org/10.3390/w12041040
AMA Style
Lally D, Forbes CT. Sociohydrologic Systems Thinking: An Analysis of Undergraduate Students’ Operationalization and Modeling of Coupled Human-Water Systems. Water. 2020; 12(4):1040. https://doi.org/10.3390/w12041040
Chicago/Turabian StyleLally, Diane, and Cory T. Forbes. 2020. "Sociohydrologic Systems Thinking: An Analysis of Undergraduate Students’ Operationalization and Modeling of Coupled Human-Water Systems" Water 12, no. 4: 1040. https://doi.org/10.3390/w12041040
Note that from the first issue of 2016, this journal uses article numbers instead of page numbers. See further details here.