Groundwater Circulation in Fractured and Karstic Aquifers of the Umbria-Marche Apennine


Department of Pure and Applied Sciences, University of Urbino, 61029 Urbino, Italy
*
Author to whom correspondence should be addressed.
Water 2020, 12(4), 1039; https://doi.org/10.3390/w12041039
Submission received: 4 March 2020
/
Revised: 2 April 2020
/
Accepted: 3 April 2020
/
Published: 7 April 2020
(This article belongs to the Special Issue Recent Advances in Karstic Hydrogeology)
Abstract
:The Umbria-Marche Apennine has a large number of springs that drain water stored in carbonate formations. Spring groundwater constitutes a crucial freshwater resource for many countries, regions, and cities around the world. This study aimed to understand the hydrological mechanisms behind groundwater circulation and their relationship to the structural and stratigraphic settings of specific aquifers. Recession analysis and time series analysis were applied to the daily discharge of six springs monitored over eight years. Both analyses indicated the presence of two types of aquifers: aquifer with unimodal behavior and aquifer with bimodal behavior. The first are characterized by two hydrodynamic sub-regimes, in which fracture networks control the baseflow and conduit networks control the quickflow. In contrast, other springs present only one hydrodynamic sub-regime related to fracture network drainage. Time series analysis confirms the results of recession analysis, showing a large memory effect and a large response time, implying the dominance of the baseflow sub-regime. These results indicate that the Maiolica Formation is characterized by a high degree of fracturation and slight karstification, which control infiltration and percolation, whereas the Calcare Massiccio Formation regulates groundwater circulation in the deeper zones of the aquifer, characterized by a high degree of karstification through moderately developed conduit networks.
1. Introduction
To construct a distributive model of groundwater circulation in a carbonate aquifer, the definition of realistic hydraulic and geometric parameters is essential [1,2,3]. Carbonate aquifers differ from other types of hydrogeological systems in their complex behavior, stemming from strong spatial heterogeneity and temporal variation [4]. This heterogeneity is linked to the hydraulic properties of the through media, such as low-permeability of rock matrix or high permeability of conduit networks, especially when karstified. However, in most cases, spring discharge time series data can be obtained and used to perform an analysis of hydrograph recession curves, which are an often-used method in the interpretation of the characteristics and flow attributes of an aquifer [5,6,7].
Some hydrograph analytical techniques are based on the analysis of slow hydrograph recession segments using the Maillet and Boussinesq equations [8,9]. Therein, deviations from the calculated exponential trends may indicate the presence of hydraulic anisotropies and, therefore, highlight the close relationship between spring hydrographs and hydro-structural geometry [10,11,12,13].
Other authors proposed characterizing the recession process by employing different mathematical functions. Drogue [14] described the whole recession process by using one single hyperbolic formula, where the recession coefficient, α, is not equivalent to the coefficient used by Maillet [9]. In contrast, Mangin [10] distinguished two processes that influence recession curves: discharge from the non-saturated zone with a non-linear flood recession and discharge from the saturated zone with a linear baseflow recession. Kovács et al. [12] showed that the recession coefficient allows for obtaining important information about aquifer hydraulic parameters and conduit network characteristics. One main advantage of recession curve analysis is that a set of empirical, quantitative parameters attributed to drainage mechanisms can be calculated [15].
Analysis of individual recession periods sometimes generates inconsistences related to the complexity of groundwater circulation and the processes acting on the system [16]. Therefore, a master recession curve (MRC) is commonly used for simultaneously analyzing a set of hydrograph recessions at a particular catchment [17,18,19,20,21,22].
Malík and Vojtková [23] performed a recession curve analysis to evaluate the karstification degree and the hydrodynamic behavior of an aquifer. With given recession coefficients and initial discharge values, both runoff and partial runoff segments (sub-regimes) can be fully described. In karst hydrogeology, the term “sub-regime” refers to the changing conditions of a groundwater system, its characteristic behavior, or the controlling of natural processes, which usually occur in a regular pattern [24].
Apart from recession analysis, univariate and bivariate analyses can also be performed on spring hydrographs. Valuable indirect information regarding karst systems can be obtained by performing a time series analysis [25]. Mangin [26] developed a specific methodology for studying the input-output relationships in karst aquifers, as well as for performing auto-correlation (univariate analysis) and cross-correlation (bivariate analysis). This methodology was based on a systemic approach and was applied and elaborated further by several authors [27,28,29,30]. In karst hydrogeology, auto-correlation functions (ACF) of spring discharge (Q) are generally used to assess the interdependence of spring discharge and evaluate the so-called “memory effect” [31], whereas the cross-correlation function (CCF) is widely used to analyze the linear relationship between input (rainfall or snowmelt, P) and output (Q).
A hydrogeological study of aquifer spring provides key information for the sustainable management of water resources exploitable by different end-users (e.g., hydrogeologists, hydraulic engineers, well drillers, environmental decision-makers).
The present work aims to characterize the behavior and groundwater circulation of the Umbria-Marche carbonate aquifers (northern Apennines) on a regional scale. MRCs were constructed and used (i) to define the mechanisms controlling flow path distribution within carbonate hydro-structures, (ii) to discretize the possible sub-regimes, and (iii) to define the karstification degree of each carbonate complex analyzed. The statistical methods applied to the time series gave information about the characteristics of the carbonate systems under study. Particular emphasis was given to the hydro-geological interpretation of the functions and their relationships with the structural setting in this portion of the Apennine ridge.
2. Materials and Methods
2.1. Study Area
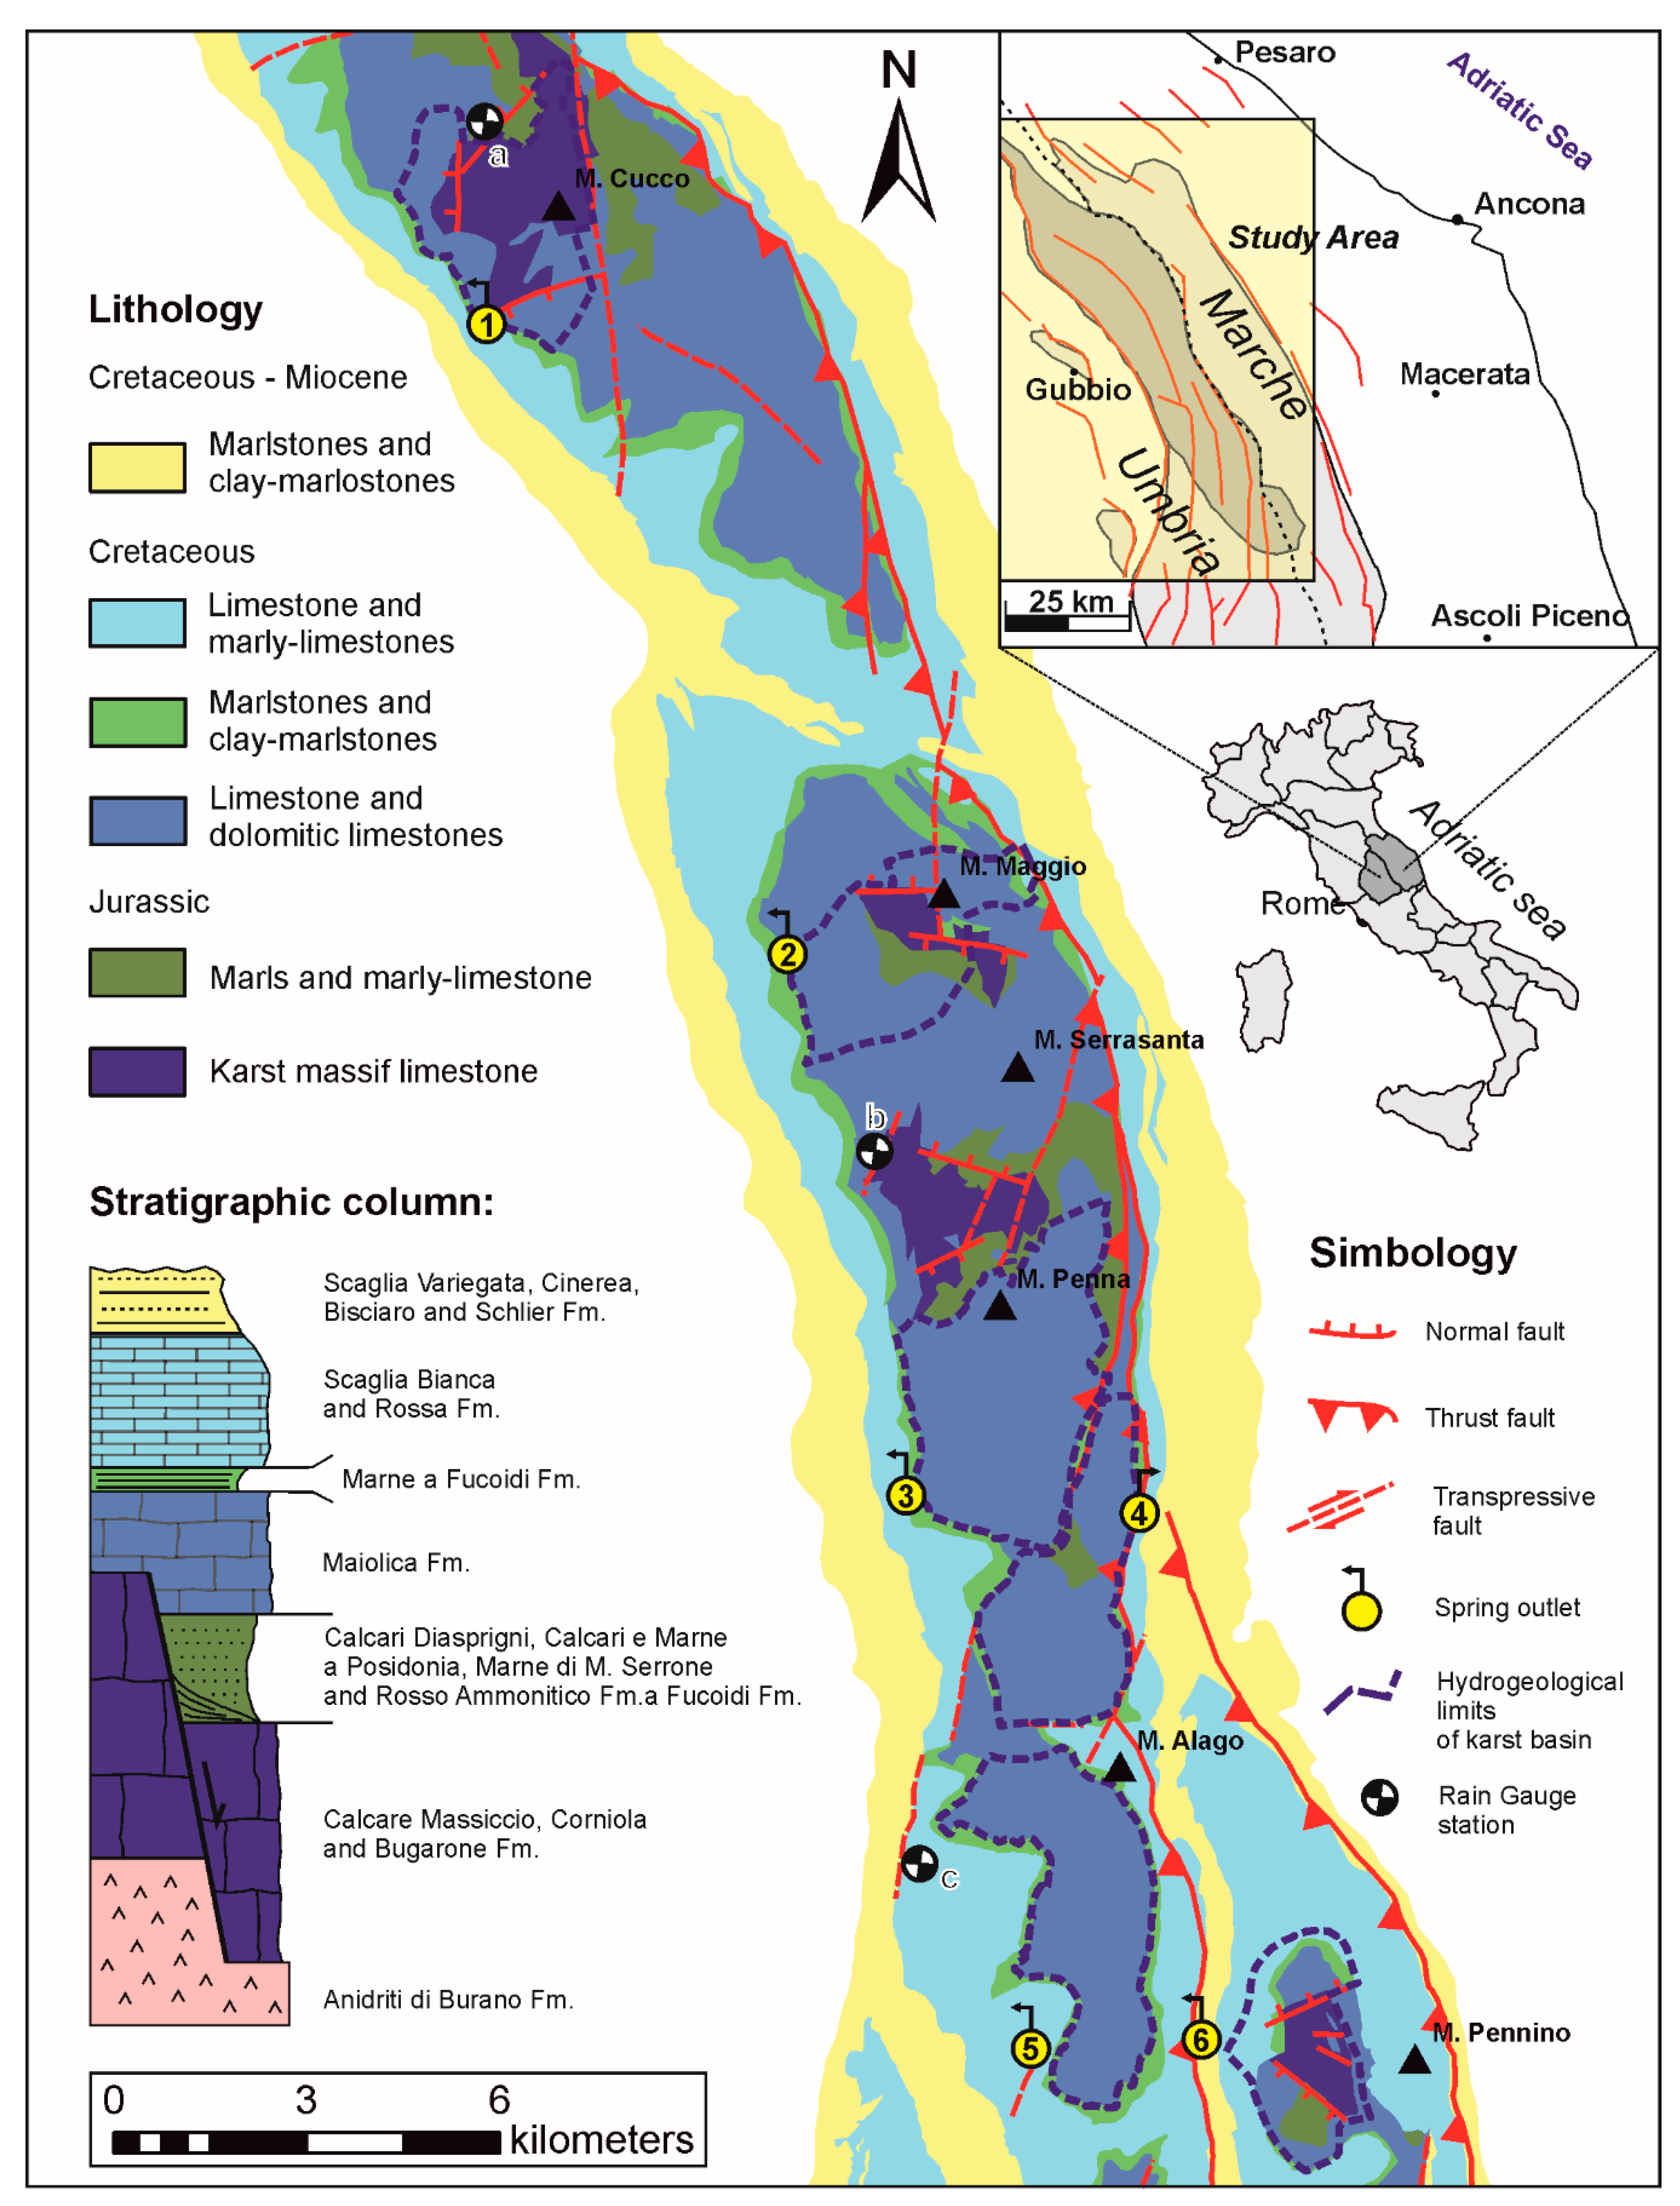
The Apenninic chain of Central Italy is a mountain range characterized by the presence of extensive outcrops of thick Mesozoic limestone sequences. The study area includes a large sector that starts at the M. Cucco anticline and terminates at the M. Pennino anticline. The outcropping geological formations are mainly composed of calcareous and marly lithotypes (from Triassic to Cretaceous in age) belonging to the Umbria-Marche Succession [32,33]. From a structural point of view, the Umbria-Marche Apennines can be considered a typical thin-skinned thrust belt in which a hierarchy of multiple, superimposed detachments occurred over a main, basal detachment at the level of Triassic evaporites that act as an aquiclude. The Apenninic arch has a vergency towards ENE [34,35] and is characterized by SW dipping thrust and by fault systems with a N-S and E-W strike.
The evaporitic level is overlaid by the Mesozoic carbonatic sequence consisting of three superimposed aquifers of different permeabilities controlled mainly by fissures, joints, and karst conduits (see the hydrogeological map in Figure 1) [36,37,38,39,40,41]. Starting from the bottom, these aquifers are the basal aquifer of the Massiccio Complex, the middle aquifer of Maiolica Complex and the upper aquifer of the Scaglia Complex. The Calcare Massiccio aquifer, with a thickness ranging between 700 and 900 m, represents the most important hydrogeological complex in the Umbria-Marche limestone ridge. It is characterized by a regional flow through highly-developed fissures and karst conduits. The Maiolica aquifer is separated from the basal aquifer by a sequence (from 100 to 350 m thick) of Upper Jurassic and calcareous marls (Calcari ad Aptici, Diasprini, Posidonia, Rosso Ammonitico Fms.) that act as an aquiclude. This sequence can be substituted locally by the very thin (20–100 m) Bugarone Calcareous Fm., which transforms it into an aquitard from a hydrological point of view. The Maiolica Complex is rather thick (200–400 m) and is constituted of more limited karstification but a high degree of fracturation. This aquifer is overlain by the Marne a Fucoidi Fm., a low permeability formation that acts as a regional aquiclude [36].
Finally, the Marne a Fucoidi Fm. is overlain by the Scaglia aquifer complex, which consists of alternating limestone and marly limestone layers with chert nodules and ribbons [16]. This complex is characterized by a high fracturation degree and a significant thickness (200–400 m), which affords it high storage capacity of infiltration water. Above, the aquifer is capped by a low permeability clayey-marly-calcareous sequence (Scaglia Variegata, Scaglia Cinerea, Bisciaro and Schlier Fms), usually enclosing an independent aquifer [42]. Eighty percent of the groundwater resource of the Umbria-Marche hydrogeological domain surfaces at liner springs [36], i.e., when a stream or river is directly fed by groundwater of saturated hydrogeological system.
The outcropping area of hydrogeological complexes playing an active role in groundwater recharge, thanks to their high capability of infiltration [43]. The extension of recharge area of each spring has been defined on lithological and structural geological data and compared with the literature data [44,45,46,47,48]. Recharge area of Scirca spring has been localized using multi-tracer tests from the karstic conduits [44] and correspond to specific lithological and geological structures [46]. The Vaccara, Boschetto, and Capo d’Acqua recharge areas have been calculated in the water balance of the Mountains of Gualdo [47]. Finally, the recharge area of the Bagnara spring corresponds to the outcrop of the core structure; this interpretation seems to be confirmed by the hydrochemical characteristics of the water (calcium bicarbonate with few increases of sulphates), which would indicate a fed due to the deep aquifer of Mt Pennino [48].
The area under study, about 220 km2, includes the following main reliefs: Mt. Cucco (1566 m a.s.l.), Mt. Maggio (1362 m a.s.l.), Mt. Serrasanta (1423 m a.s.l.), Mt. Penna (1432 m a.s.l.), Mt. Burella (1095 m a.s.l.), and Mt. Pennino (1572 m a.s.l.). Each relief represents a distinct hydrostructure with internal aquifer systems connected to one or more springs in their recharge areas (Table 1).
2.2. Data Acquisition
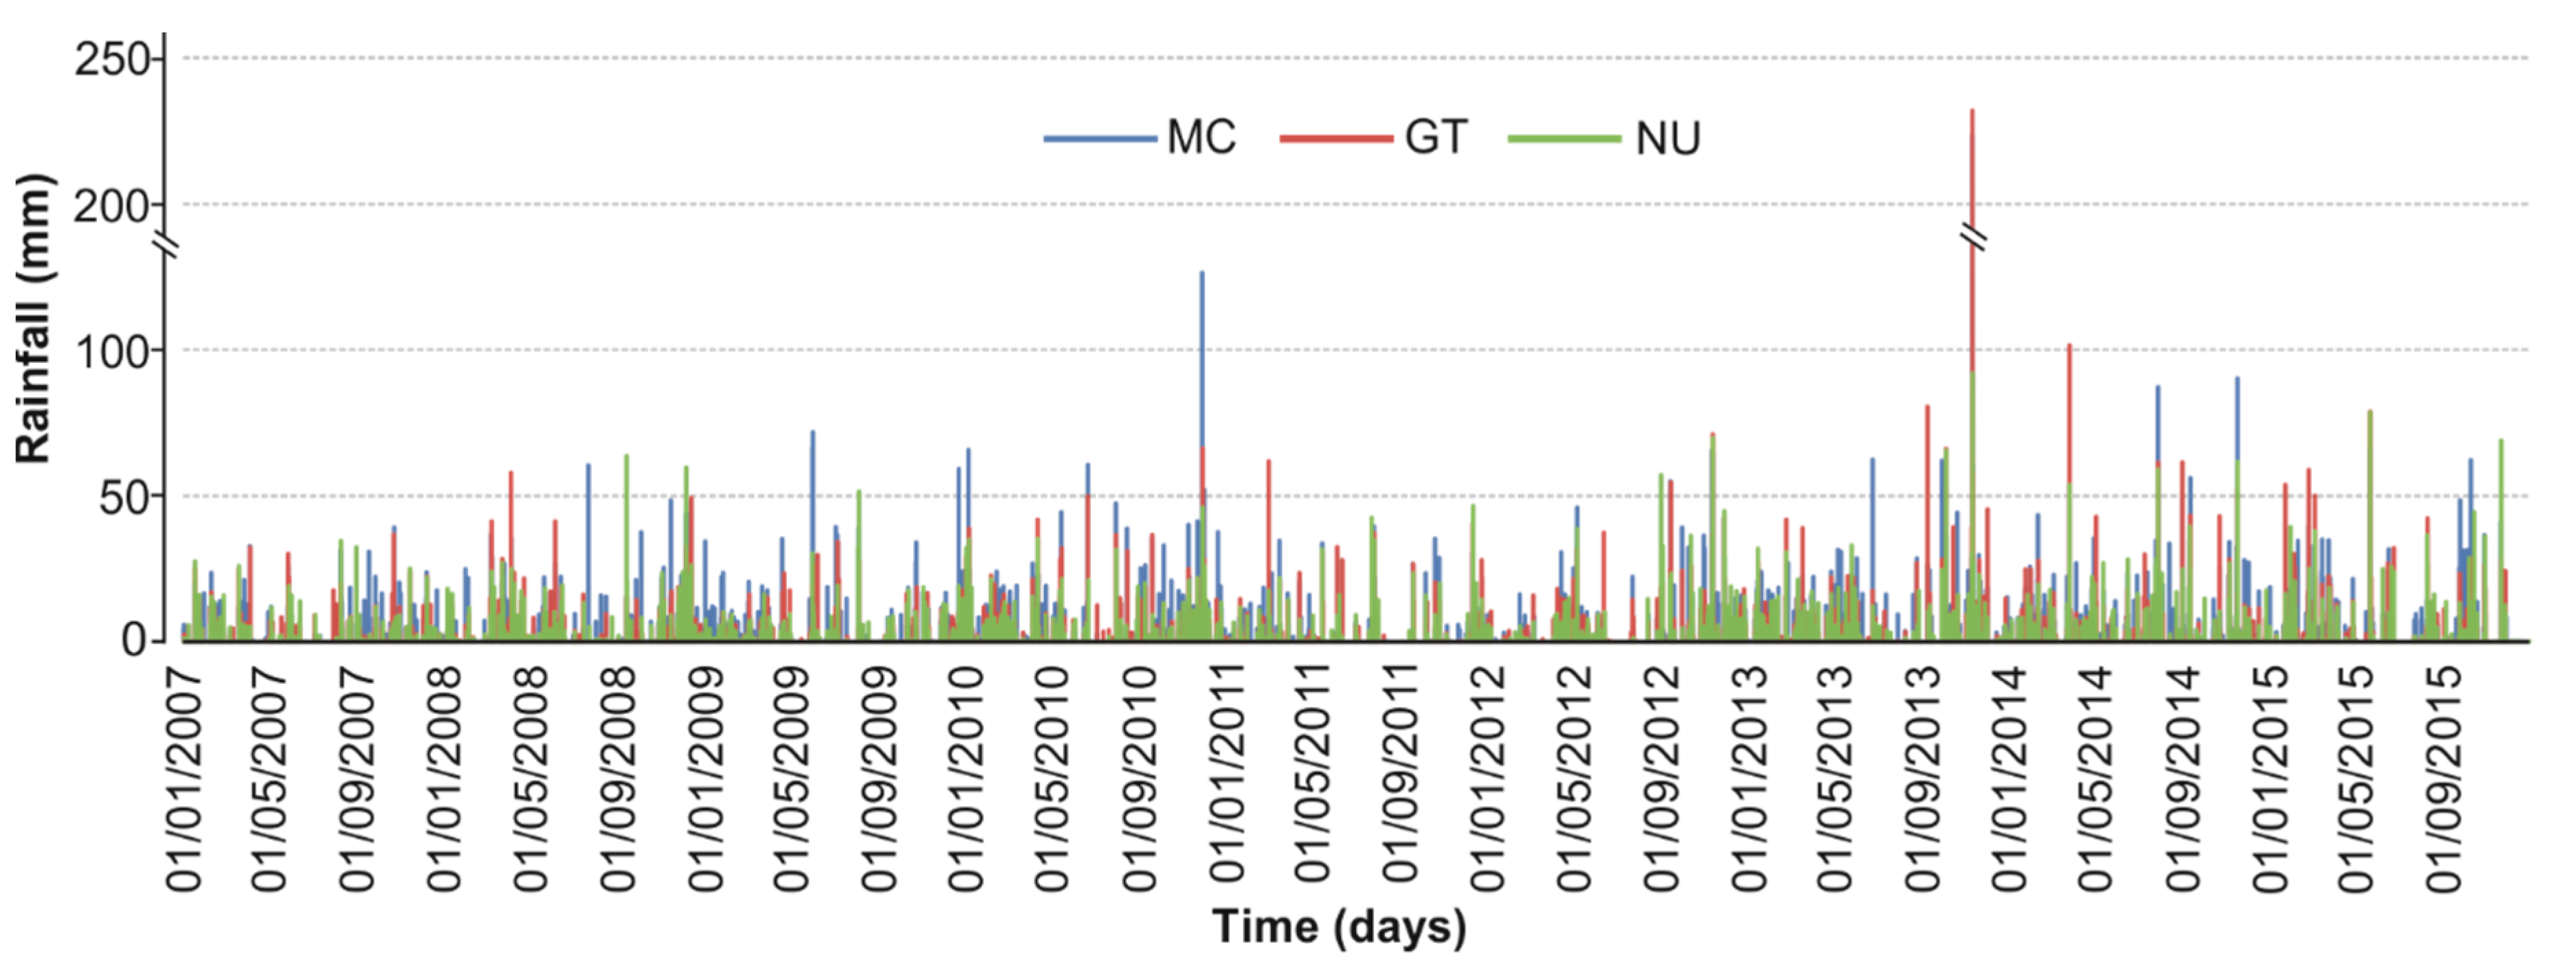
The rainfall data (mm) has been collected by automated rain gauges provided by the Hydrographic Service of Umbria Region; in particular, only three rain gauge stations located within the study area were considered (Table 2) and the data were collected over eight years (from 01 January 2007 to 31 December 2015). Snowfall was recorded by only the MC station (located at 1116 m a.s.l.); therefore, the available dataset was not enough to cover the entire study area.
The UM area has a typical subcontinental climate characterized by a dry and warm summer and a wet period during autumn, winter, and spring. The monthly rainfall reaches a maximum during November and a minimum in July and August. In the more elevated zones (above 1000 m a.s.l.), the precipitation can present as snow during winter (mainly in January–February), with a thickness of a few decimeters, which can have a significant effect on groundwater aquifer recharge (Figure 2).
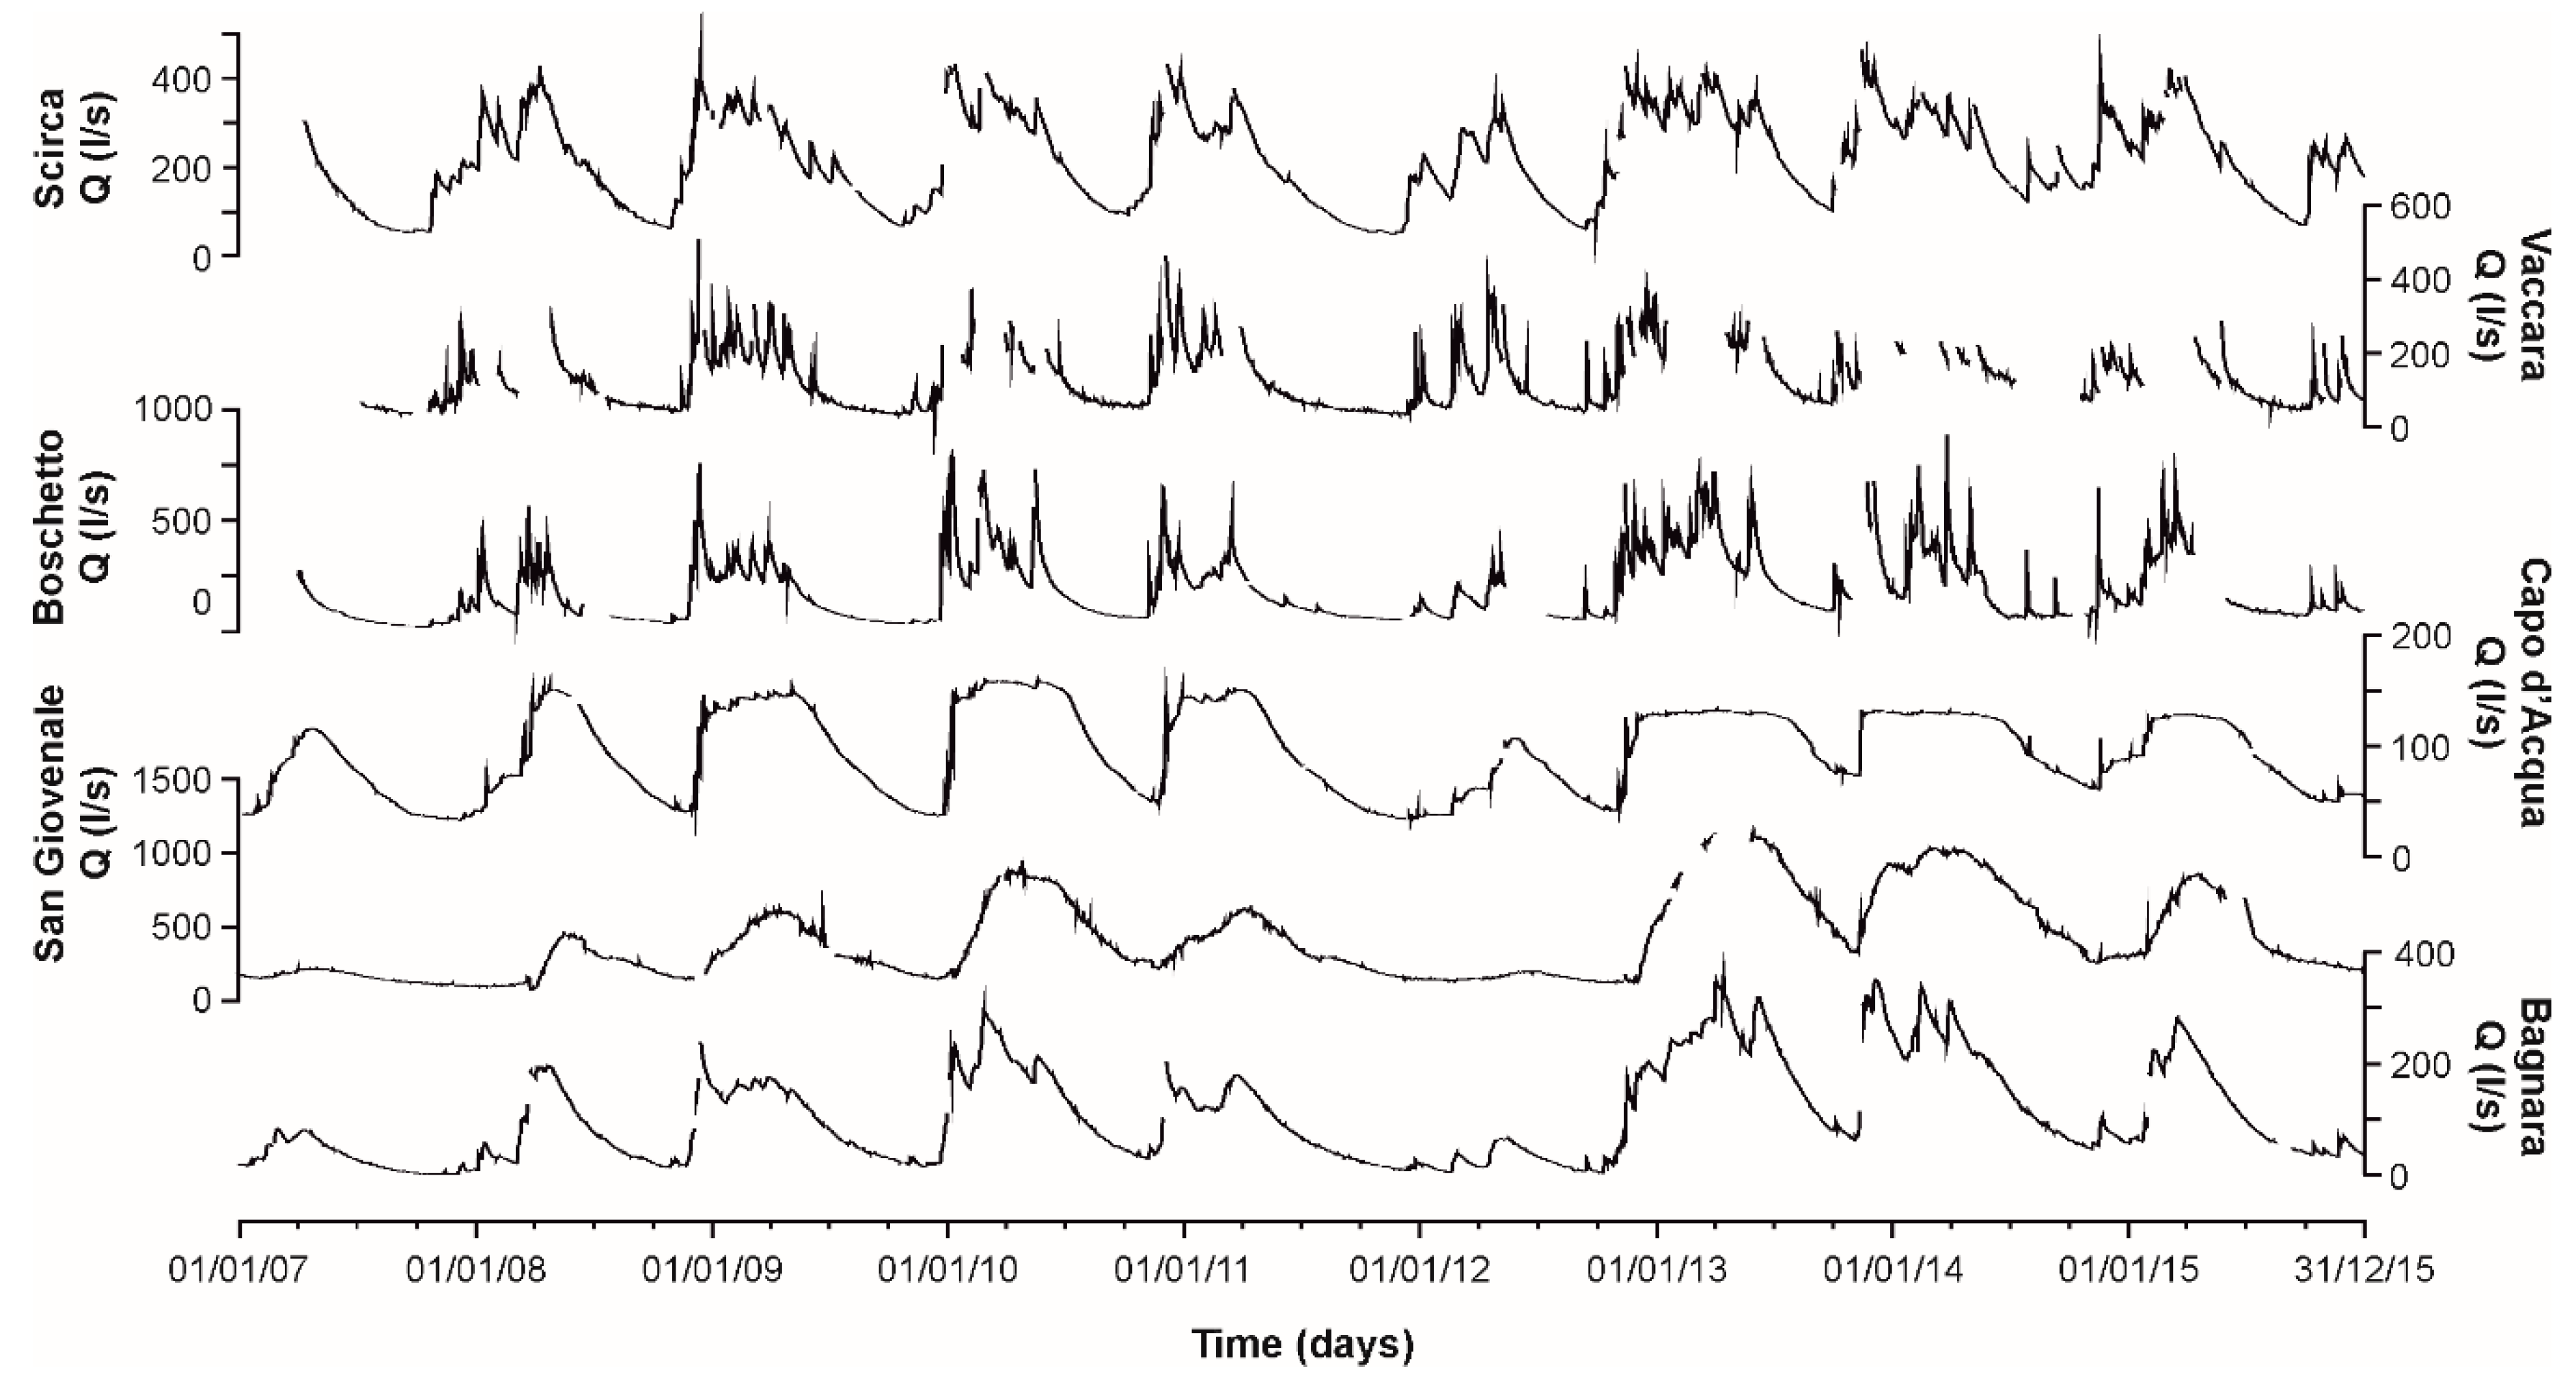
The discharge of six carbonate springs (Scirca, Vaccara, Boschetto, Capo d’Acqua, San Giovenale, and Bagnara) of the Umbria-Marche Apennines monitored by ARPA Umbria (www.arpa.umbria.it), with an acquisition time interval of one day, was analyzed. All springs treated were captured for potable purposes and were measured by eight channel electromagnetic and ultrasound systems. The monitoring systems recorded the minimum, mean, and maximum value each hour, and the dataset was computed at the end of the day and transmitted as daily mean. Figure 3 shows a subset of about eight years of the available data. Due to a lack of continuity in data recording, some gaps are present in the time series. The statistical analyses of dataset quality are presented in Table 3.
2.3. Recession Analysis
Recession analysis focuses on the recession curve, which is the portion of the hydrograph immediately following a stream peak (and rainfall event), when flow diminishes. In this study, the Maillet exponential equation was used (Equation (1)) because it generates good fits for analyzing hydrograph recession curves and accurately describes recession over long time periods [12,13,49]:
where Qt is the discharge at time t and Q0 is the discharge at time t = 0. Specifically, the modified Maillet equation was used, which can be expressed by a sum of several exponential components that represent the presence of possible sub-regimes [13,18,50,51,52]:
where i represents the media i in the aquifer, Q0i represents the discharge of media i at t = 0, and n represents the number of sub-regimes or flow components. A karst aquifer can always be divided into different sub-regimes based on the different hydraulic conductivities of the media that comprise it [52,53,54]. Therefore, the modified Maillet equation can be written as:
where Qq and Qb are the initial discharges, and αq and αb are the recession coefficients of the quickflow and baseflow, respectively.
Analyzing the hydrographs of each aquifer system (Figure 3) has shown that the recession curves do not exhibit the same trends within the time series analyzed, making it impossible to use a single interpolating curve to characterize all aquifer systems. Therefore, a procedure for dividing the curve into single segments with different slopes was needed. The Master Recession Curve methodology enables one to work simultaneously with numerous recession periods, making the influence exerted by precipitation negligible and obtaining realistic parameters of each aquifer system. Hence, MRCs were calculated using the freeware software RC 4.0 of the HydroOffice [21], applying the manual method tool to create a graphical analysis and to divide curves into different segments having homogeneous trends, thereby enabling separate analysis. The conceptual model applied is that of a linear reservoir [8,9], which follows Maillet’s exponential recession function shown above.
2.4. Time-Series Analysis
The ACF evaluates a time series by quantifying the linear dependency of successive values over a specified time period (lag time) [55]. It can be written as follows [28,50]:
For k > 0,
where r(k) is the auto-correlation function, C(k) is the correlogram, k is the time lag (k = 0 to m), n is the length of the time series, xt is the value of the studied variable at time t, and m is the cutting point [56]. The cutting point determines the interval within which the analysis is conducted. The correlogram reflects the “memory effect” of a system [26,50,57,58], i.e., the time needed for the system to “forget” its initial conditions, and corresponds to the lag time required for the ACF to reach 0.2 [54,55,59]. The CCF is used to examine the dependence of output series y (discharge) on the input series x (precipitation) and can be calculated using the following equation [27]:
For k > 0,
where k is the time lag, n is the length of the time series, xt and yt are input and output time series, respectively, rxy (k) is the cross-correlation function, σx and σy are the standard deviations of the time series, and Cxy (k) is the cross-correlogram [56].
Both of ACF and CCF analyses are performed using correlograms. A steep slope in the correlogram means a fast response of the aquifer to a rainfall event and indicates a higher karstification degree. In particular, CCF analysis can provide strong support for the identification of the main rainfall contribution and the travel time through the main infiltration pathways [60]. The results can be compared using recession coefficients estimated by hydrograph analysis.
3. Results
3.1. Discharge Time Series Description
Monitoring in the field has provided the time series of daily average discharge of six springs covering about eight years, from 2007 to 2015. The hydrographs in Figure 3 show that the springs are reactive, i.e., that the discharges vary after rainfall events throughout the year. However, the response of each spring reflects the spatial distribution of permeability in each respective aquifer and their hydrogeological characteristics [61]. The amplitude of the discharge variations depends both on the size of the recharge area and on the porosity and heterogeneity characteristics of the carbonate reservoir.
The Scirca spring is located in the SW limb of the Mt. Cucco anticline, at 575 m a.s.l. The spring’s catchment area is about 8 km2 and its discharge averages 214.9 l/s [44]. The time-series of the Scirca spring is rather continuous and the hydrograph passes from quick- to baseflow conditions, with the corresponding rapid decrease in water level, generally in early summer.
The waters of the Vaccara spring, set at an elevation of 468 m a.s.l, drains the SW limb of Mt. Maggio. The spring has a large recharge area of 6.2 km2 and a mean discharge of about 119 l/s. The time-series is rather incomplete (24% of data is missing). The gaps in data are due to instrumental errors. The spring’s hydrograph shows a very fast response to recharge events and rather clear passages from quick- to baseflow during dry periods.
The hydrograph for Boschetto spring was very similar to that of Vaccara spring, exhibiting clear differences between baseflow and quickflow regimes. This spring is located on Mt. Penna at 538 m a.s.l. and has a mean discharge of about 185 l/s, which is about 65 l/s more than the Vaccara spring. This difference can be explained by Boschetto spring’s larger recharge area (about 11.5 km2).
The Capo d’Acqua spring is located on the same hydrostructure as Boschetto spring but drains the other side of the relief (NE limb of Mt. Penna). This spring has an average discharge of 94.2 l/s and does not show a clear passage from quickflow to baseflow regimes because of a significant lag in discharge response following infiltration. The estimated catchment area is about 7.4 km2.
The San Giovenale spring drains the greatest amount of water of all other carbonate systems in this study, with an average discharge of 394.7 l/s. The estimated recharge area is about 10.5 km2 and the karst system shows the same behavior as the Capo d’Acqua spring. Differences between quick- and baseflow regimes are not observable and the decrease in water level is very slight and delayed. The high average discharge of the San Giovenale spring cannot be explained by the size of the recharge area. Most likely, this carbonate system is supplied by non-negligible groundwater flows from the Colfiorito plain [43].
The hydrograph of Bagnara spring shows characteristics intermediate between those of the Scirca, Vaccara and Boschetto springs, and those of the San Giovenale and Capo d’Acqua springs. This karst aquifer shows a fast response to infiltration in a quickflow regime and a slight decrease in discharge during the baseflow regime. This behavior indicates a very marked spatial heterogeneity in porosity along the aquifer.
Thus, the Scirca, Vaccara, Boschetto, and Bagnara springs show a quick response to a rainfall event characterized by steep peaks followed by rapid decreases in water level. This behavior is characteristic of all karst systems with a well-developed network of fractures and conduits. The San Giovenale and Capo d’Acqua springs, on the other hand, show a delayed response to rainfall events, with a slow decrease in discharge over time. This behavior is typical of a poorly-developed karst systems, where groundwater circulation occurs through the matrix and fracture networks.
3.2. MRCs Analysis
Recession curve analysis was performed on hydrographs from six aquifer springs located in the Umbria-Marche Apennines. Different shapes of a spring’s recession curve are attributable to drainage from different components of the groundwater system, reflecting karstification degree [15]. The karstification of soluble rock can be considered the most important geological phenomenon influencing the hydraulic behavior of carbonate aquifers. The presence of different lithologies in the catchment area can highlight these hydraulic differences [62].
The Master Recession Curve methodology was used to work simultaneously with numerous recession periods (Figure 4), making the influence exerted by precipitation negligible and allowing to obtain an average value representative of the entire recharge area [16].
Changes in the slope of the recession curve have been attributed to aquifer heterogeneity [63,64], whereas recession curves that can be expressed by one exponent represent homogeneous conductivity and storage properties. The discharge of the aquifer can be considered approximately constant and specific for each aquifer-spring system when the changes of hydraulic conditions (transmissivity, water table area) are not appreciable during the emptying associate with the recession limb of the hydrograph [65]. Therefore, recession analysis using the MRC methodology has allowed to identify two groups with different hydraulic behavior: aquifers with unimodal behavior (having one sub-regime) and aquifers with bimodal behavior (having two sub-regimes). All the aquifer springs analyzed have a good fit with the exponential equation of Maillet [9], indicating that the more appropriate conceptual model is that of a linear reservoir [8,9].
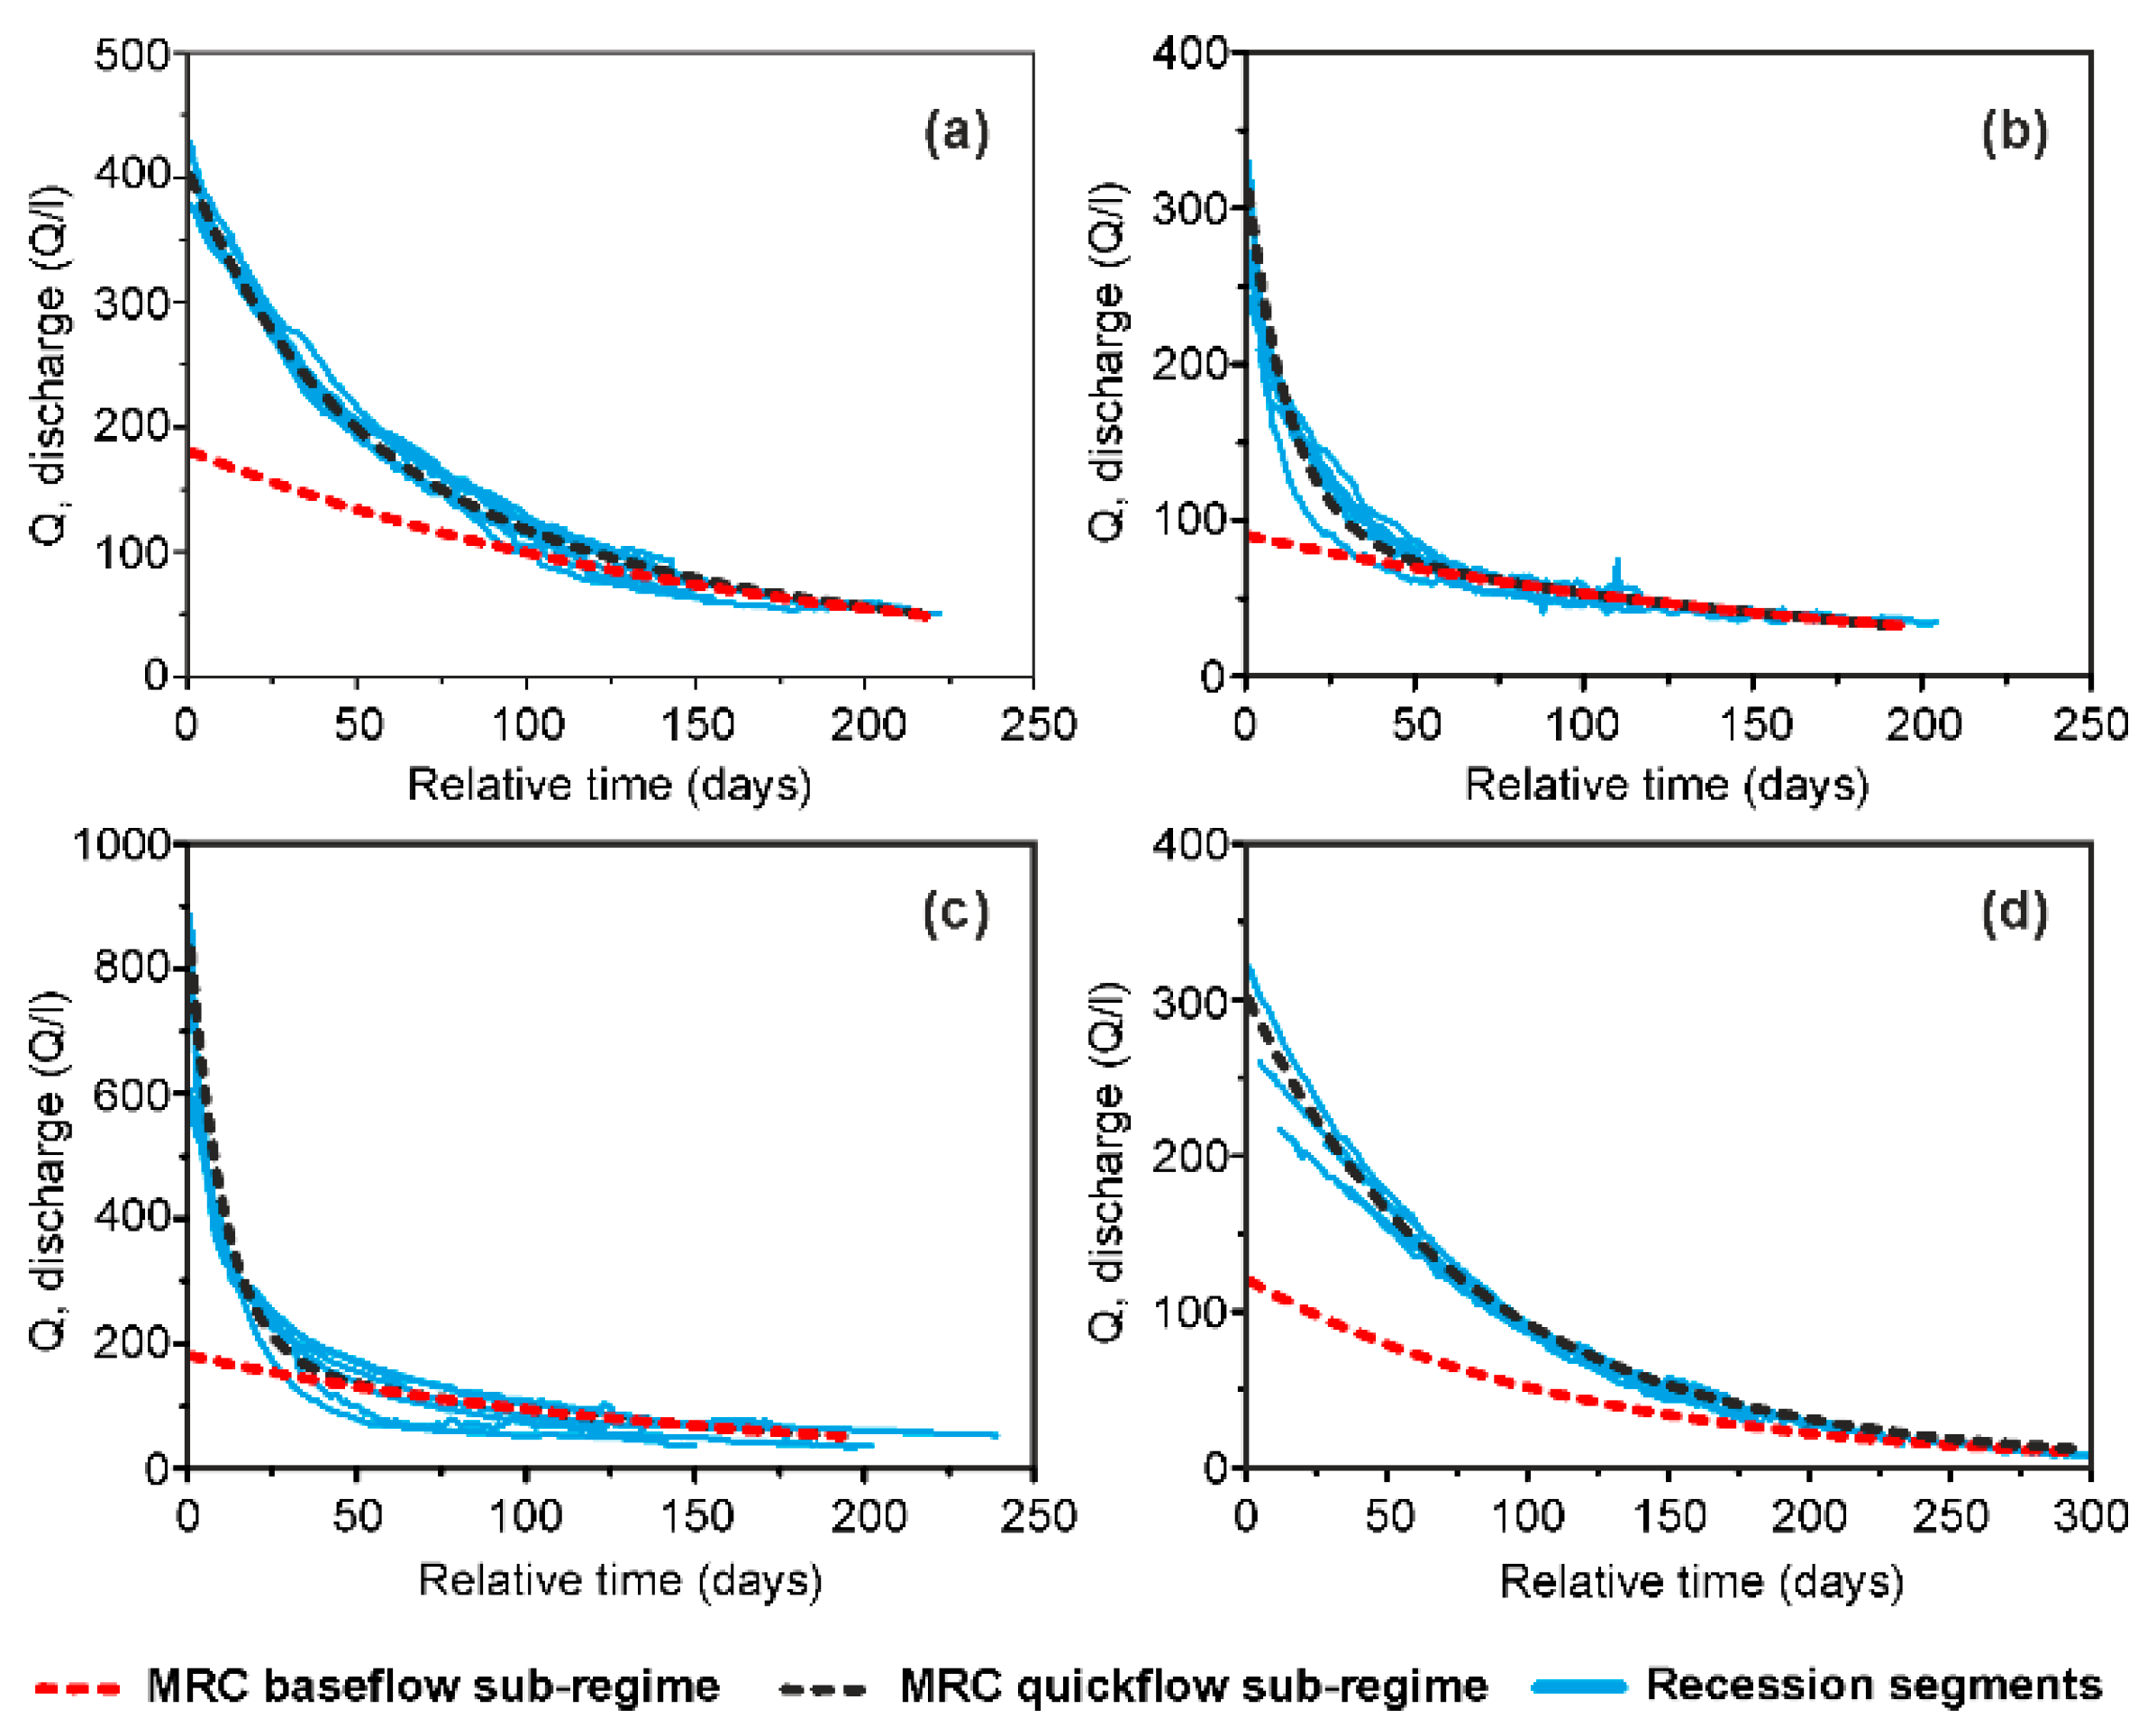
A recession curve analysis was conducted on records from eight years, resulting in about seven intervals (individual recessional discharge sets). These partial recession curve records were assembled to create a master recession curve of each spring (Figure 4 and Figure 5). Table 4 and Table 5 present the recession coefficients, discharge range, duration of sub-regime of measured recession curves, and the number of assembled individual recessional discharge successions used to create an MRC of each spring.
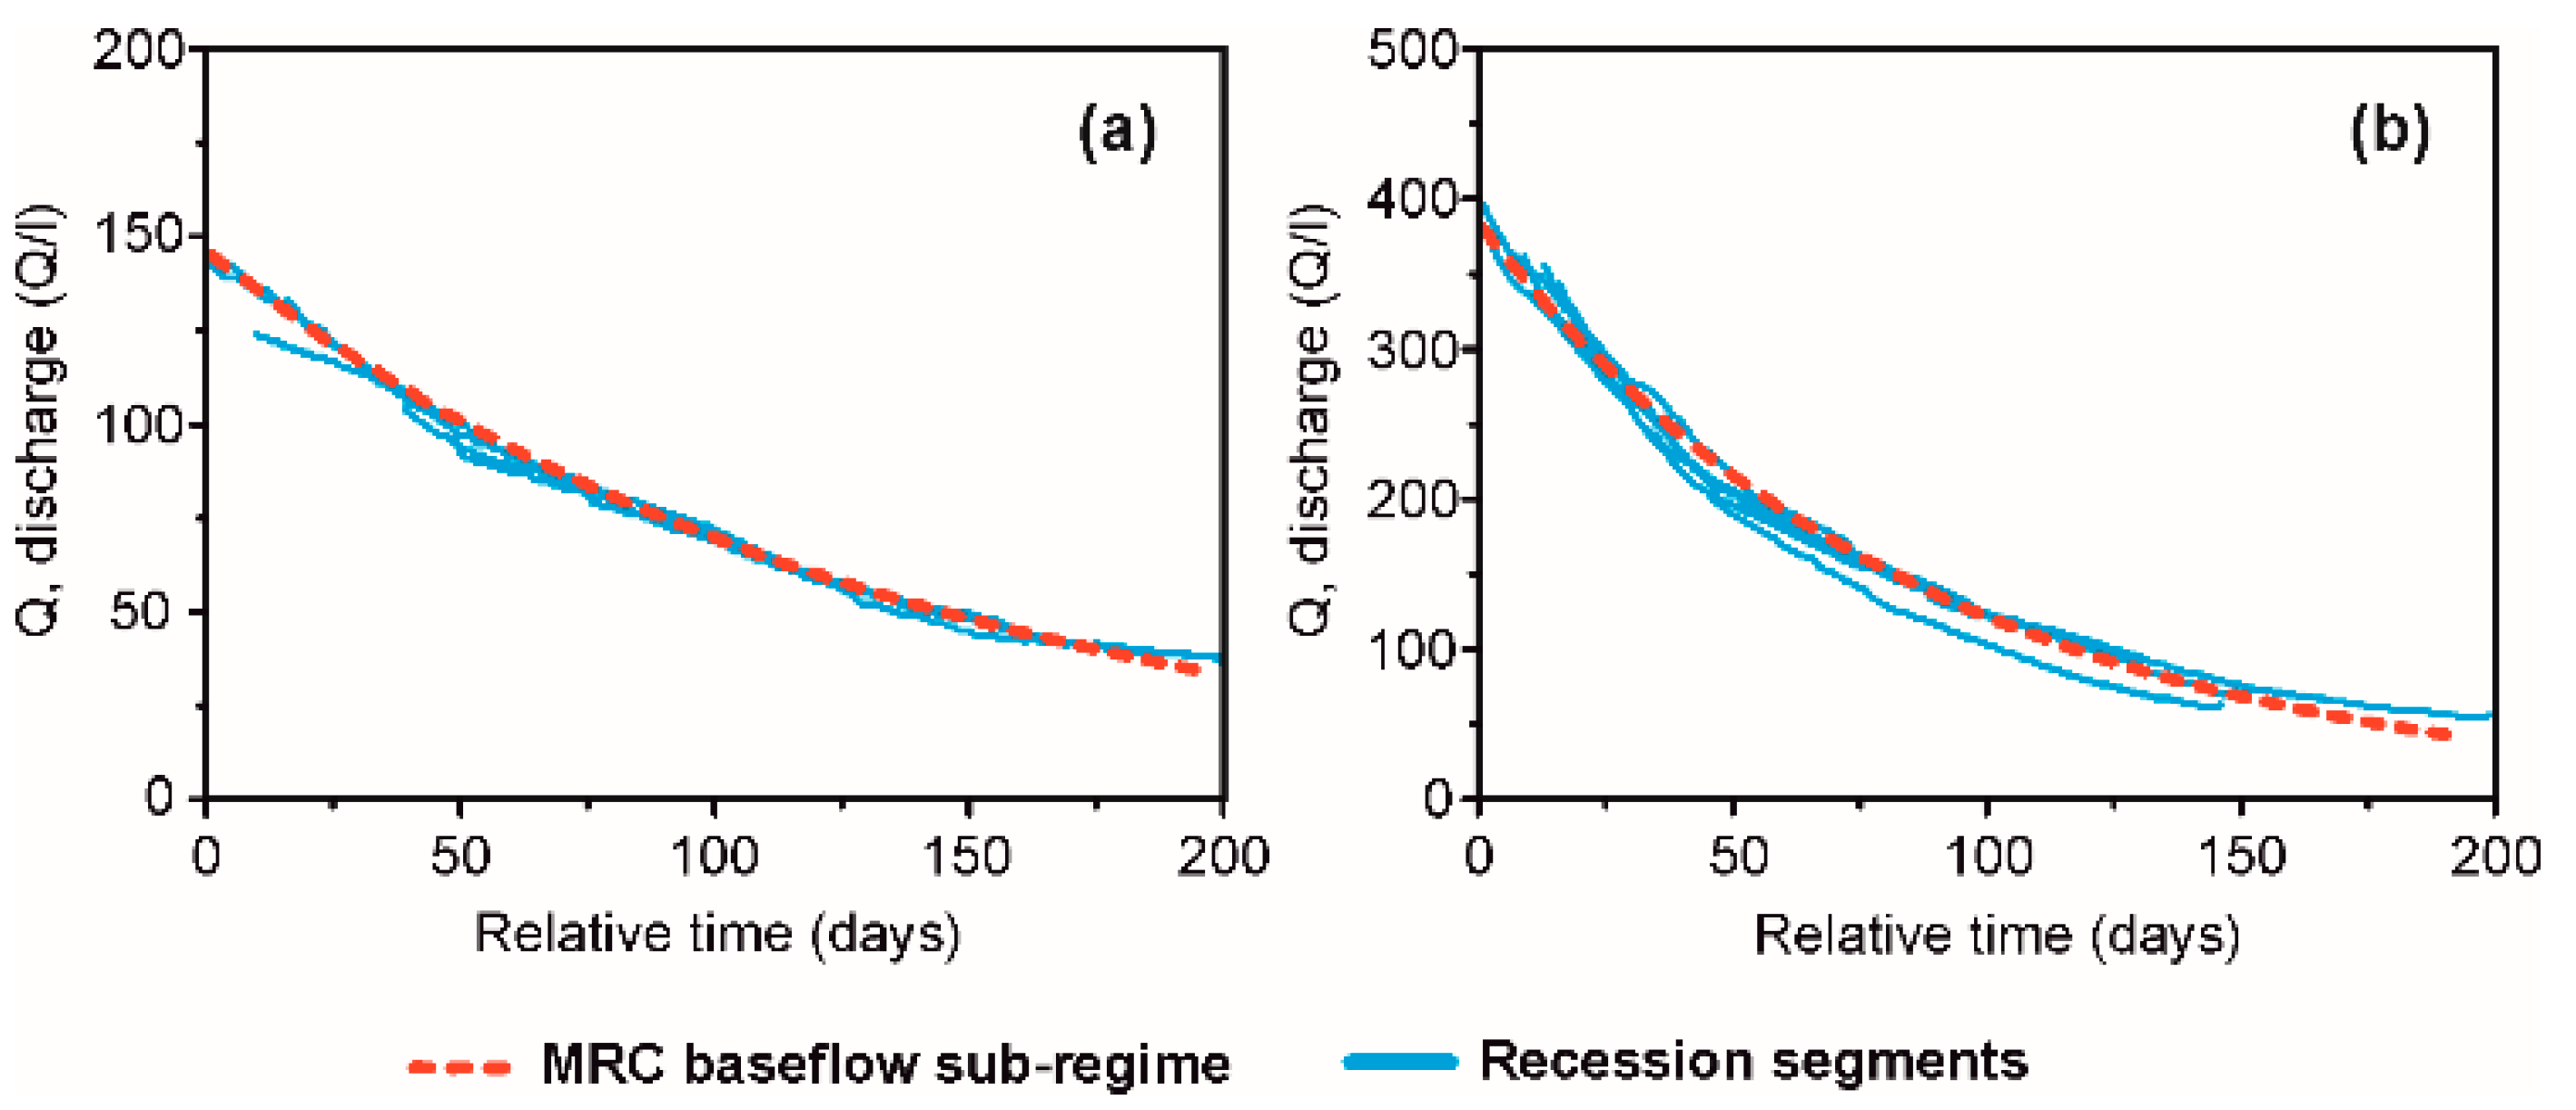
For the Scirca, Vaccara, Boschetto, and Bagnara springs, the results showed a significant degree of curve separation in two segments, characterized by different recession constants (Figure 4). Indeed, the values of the recession coefficients of quickflow sub-regimes (αq) are rather high, ranging from 0.015 d−1 (Bagnara spring) to 0.1 d−1 (Boschetto spring). This may be caused by the change of hydraulic or geometric characteristics of the aquifer during the depletion process [65]. According to Amit et al. [11], the exponential term with the largest slope represents a rapid depletion of flow channels with the highest hydraulic conductivity.
The transition from quickflow to baseflow occurs after 150 and 180 days in the Scirca and Bagnara (Figure 4a,d) springs, indicating that fast drainage is the dominant component for most of the years. In contrast, the baseflow sub-regime is the dominant component of Vaccara and Boschetto springs, with a sub-regime transition occurring after about 30 and 50 days in Boschetto and Vaccara springs (Figure 4b,c), respectively. The parameters of these springs reflect the structural properties of their aquifers, such as karstification degree, fracture networks, and conduit networks.
The Capo d’Acqua and San Giovenale springs present a unimodal behavior because their MRCs can be expressed by one exponent (Figure 5). This means that their aquifer systems are characterized by homogeneous conductivity and storage properties. However, these two springs differ in their recession coefficients. Capo d’Acqua spring has a recession coefficient of 0.0074 d−1, a value with the same order of magnitude as baseflow recession coefficients of the previously described springs with bimodal behavior. An exponential term with a small slope corresponds to slow depletion of a flow network with low hydraulic conductivity [11]. The recession coefficient of San Giovenale spring (0.0115 d−1), on the other hand, is very similar to quickflow components of aquifer springs with bimodal behavior.
The recession period estimated by the MRC method is 200 days for both carbonate systems (Table 6). The difference between the two aquifers is in their dominant components (quickflow vs. baseflow sub-regimes). Capo d’Acqua spring is dominated by a baseflow sub-regime, where drainage is controlled by matrix and fracture network porosity, while San Giovenale spring has a quickflow-dominated sub-regime, characterized by a fast drop in water level controlled by fracture and conduit networks.
3.3. Time-Series Analysis: Autocorrelation and Cross-Correlation
3.3.1. Autocorrelation Function (ACF)
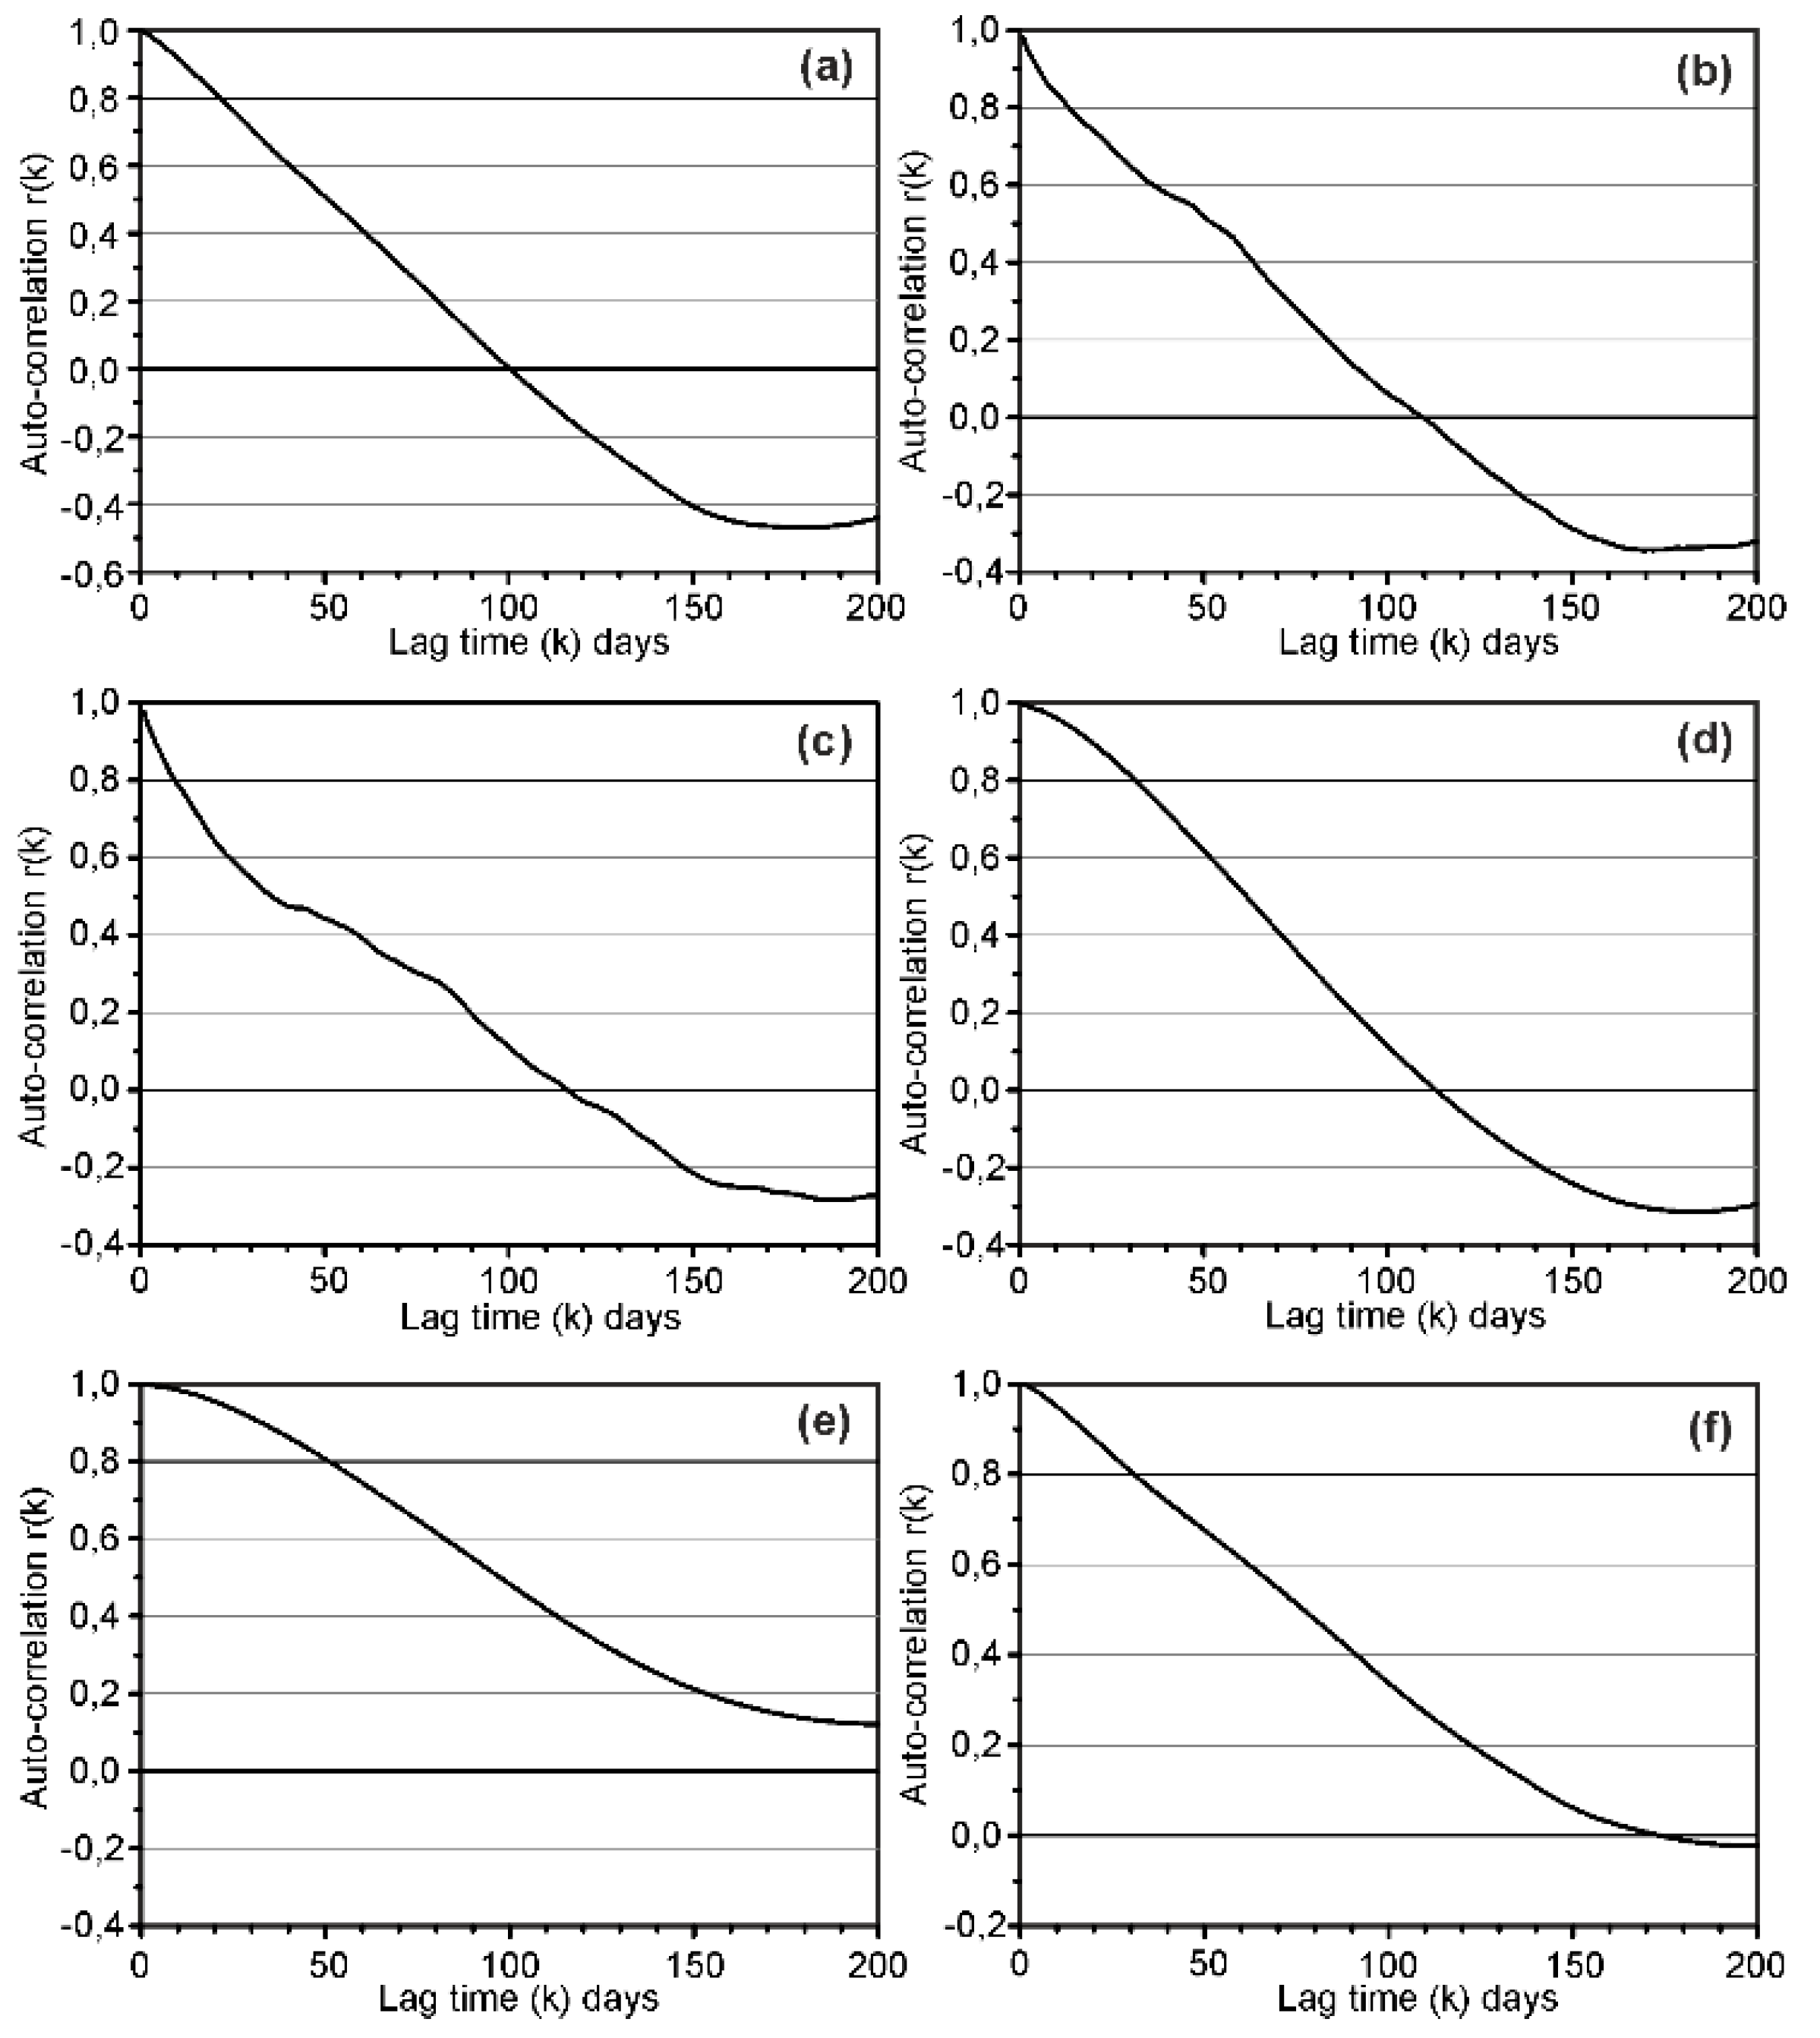
The autocorrelation function treatment quantifies the linear dependency of successive values over a specific time period and reflects the memory of the system [61]. The values estimated using this method are shown in Table 6. The daily time series correlograms for each spring are shown in Figure 6. The correlogram of the Scirca spring shows a rapid and regular ACF slope that reaches rk = 0.2 after 80 days. The shape of the autocorrelation functions and the high memory effect implies a significant storage capacity, probably linked to a well-developed fracture network.
The ACF of the Vaccara spring further confirms its bimodal behavior. First, it displays a rapid decrease in the first days (10 days), comportment associated with a quickflow sub-regime; then, its slope levels out, reaching rk = 0.2 at a much slower rate after 90 days, a response characteristic of a baseflow sub-regime. In the case of the Boschetto spring, the decrease in the autocorrelation function is uneven and marked by two discrete components. The first drops quickly, within about 20 days, while the second decreases more slowly and reaches rk = 0.2 at 89 days, indicating a strong duality of these karst systems. The Bagnara spring shows a very slight decrease in ACF with no steps. The estimated memory effect is high, with a value of about 121 days, indicating a higher storage capacity and high filtration potential of this aquifer systems. The correlogram of Capo d’Acqua spring discharge displays a regular decrease in the slope of the ACF, reaching rk = 0.2 with the same time lag as the other systems seen thus far (90 days). This suggests the prevalence of the baseflow component, probably due to a fractured matrix. The ACF for the flow rates at San Giovenale spring diminishes very slowly when the time lag increases. This karst system shows a memory effect of 150 days, presenting great inertia and indicating that the aquifer has a large storage capacity, which is drained very slowly.
3.3.2. Cross-Correlation Function (CCF)
The delays between inputs and outputs of various springs are useful information in the regional study of a carbonate aquifer because they give an estimate of the variation in pressure pulse transfer times and of particle travel times through the aquifer [29]. The delays are also significant in the modeling of the aquifer and indicate the karstification degree of a karst system.
The wet and dry periods, which induce high and low flow periods in the spring discharge series, appear more difficult to define in the rainfall time-series [66]. The lowest values of the rainfall cause the most intense droughts in the spring discharge series, as shown for example by the period included between June 2011 and March 2012.
Rainfall data of different rain gauge stations were used in relation to correspondent hydrostructure and proximity to them. Therefore, the MC station has been used for the Scirca spring, the GT station has been used for the Vaccara, Boschetto, and Capo d’Acqua springs, and the NU station has been used for the San Giovenale and Bagnara springs.
The CCFs between the rainfall and discharge time series of each spring are shown in Figure 7, while the relative parameters (maximum cross-correlation coefficients and their related time lag) of the time-series analysis are listed in Table 6. The cross-correlograms show rather low rxy(k) values (between 0.18 to 0.27). This indicates that the precipitation signal is significantly reduced between its entry into the system and the time when it reaches the water table via the unsaturated zone [29].
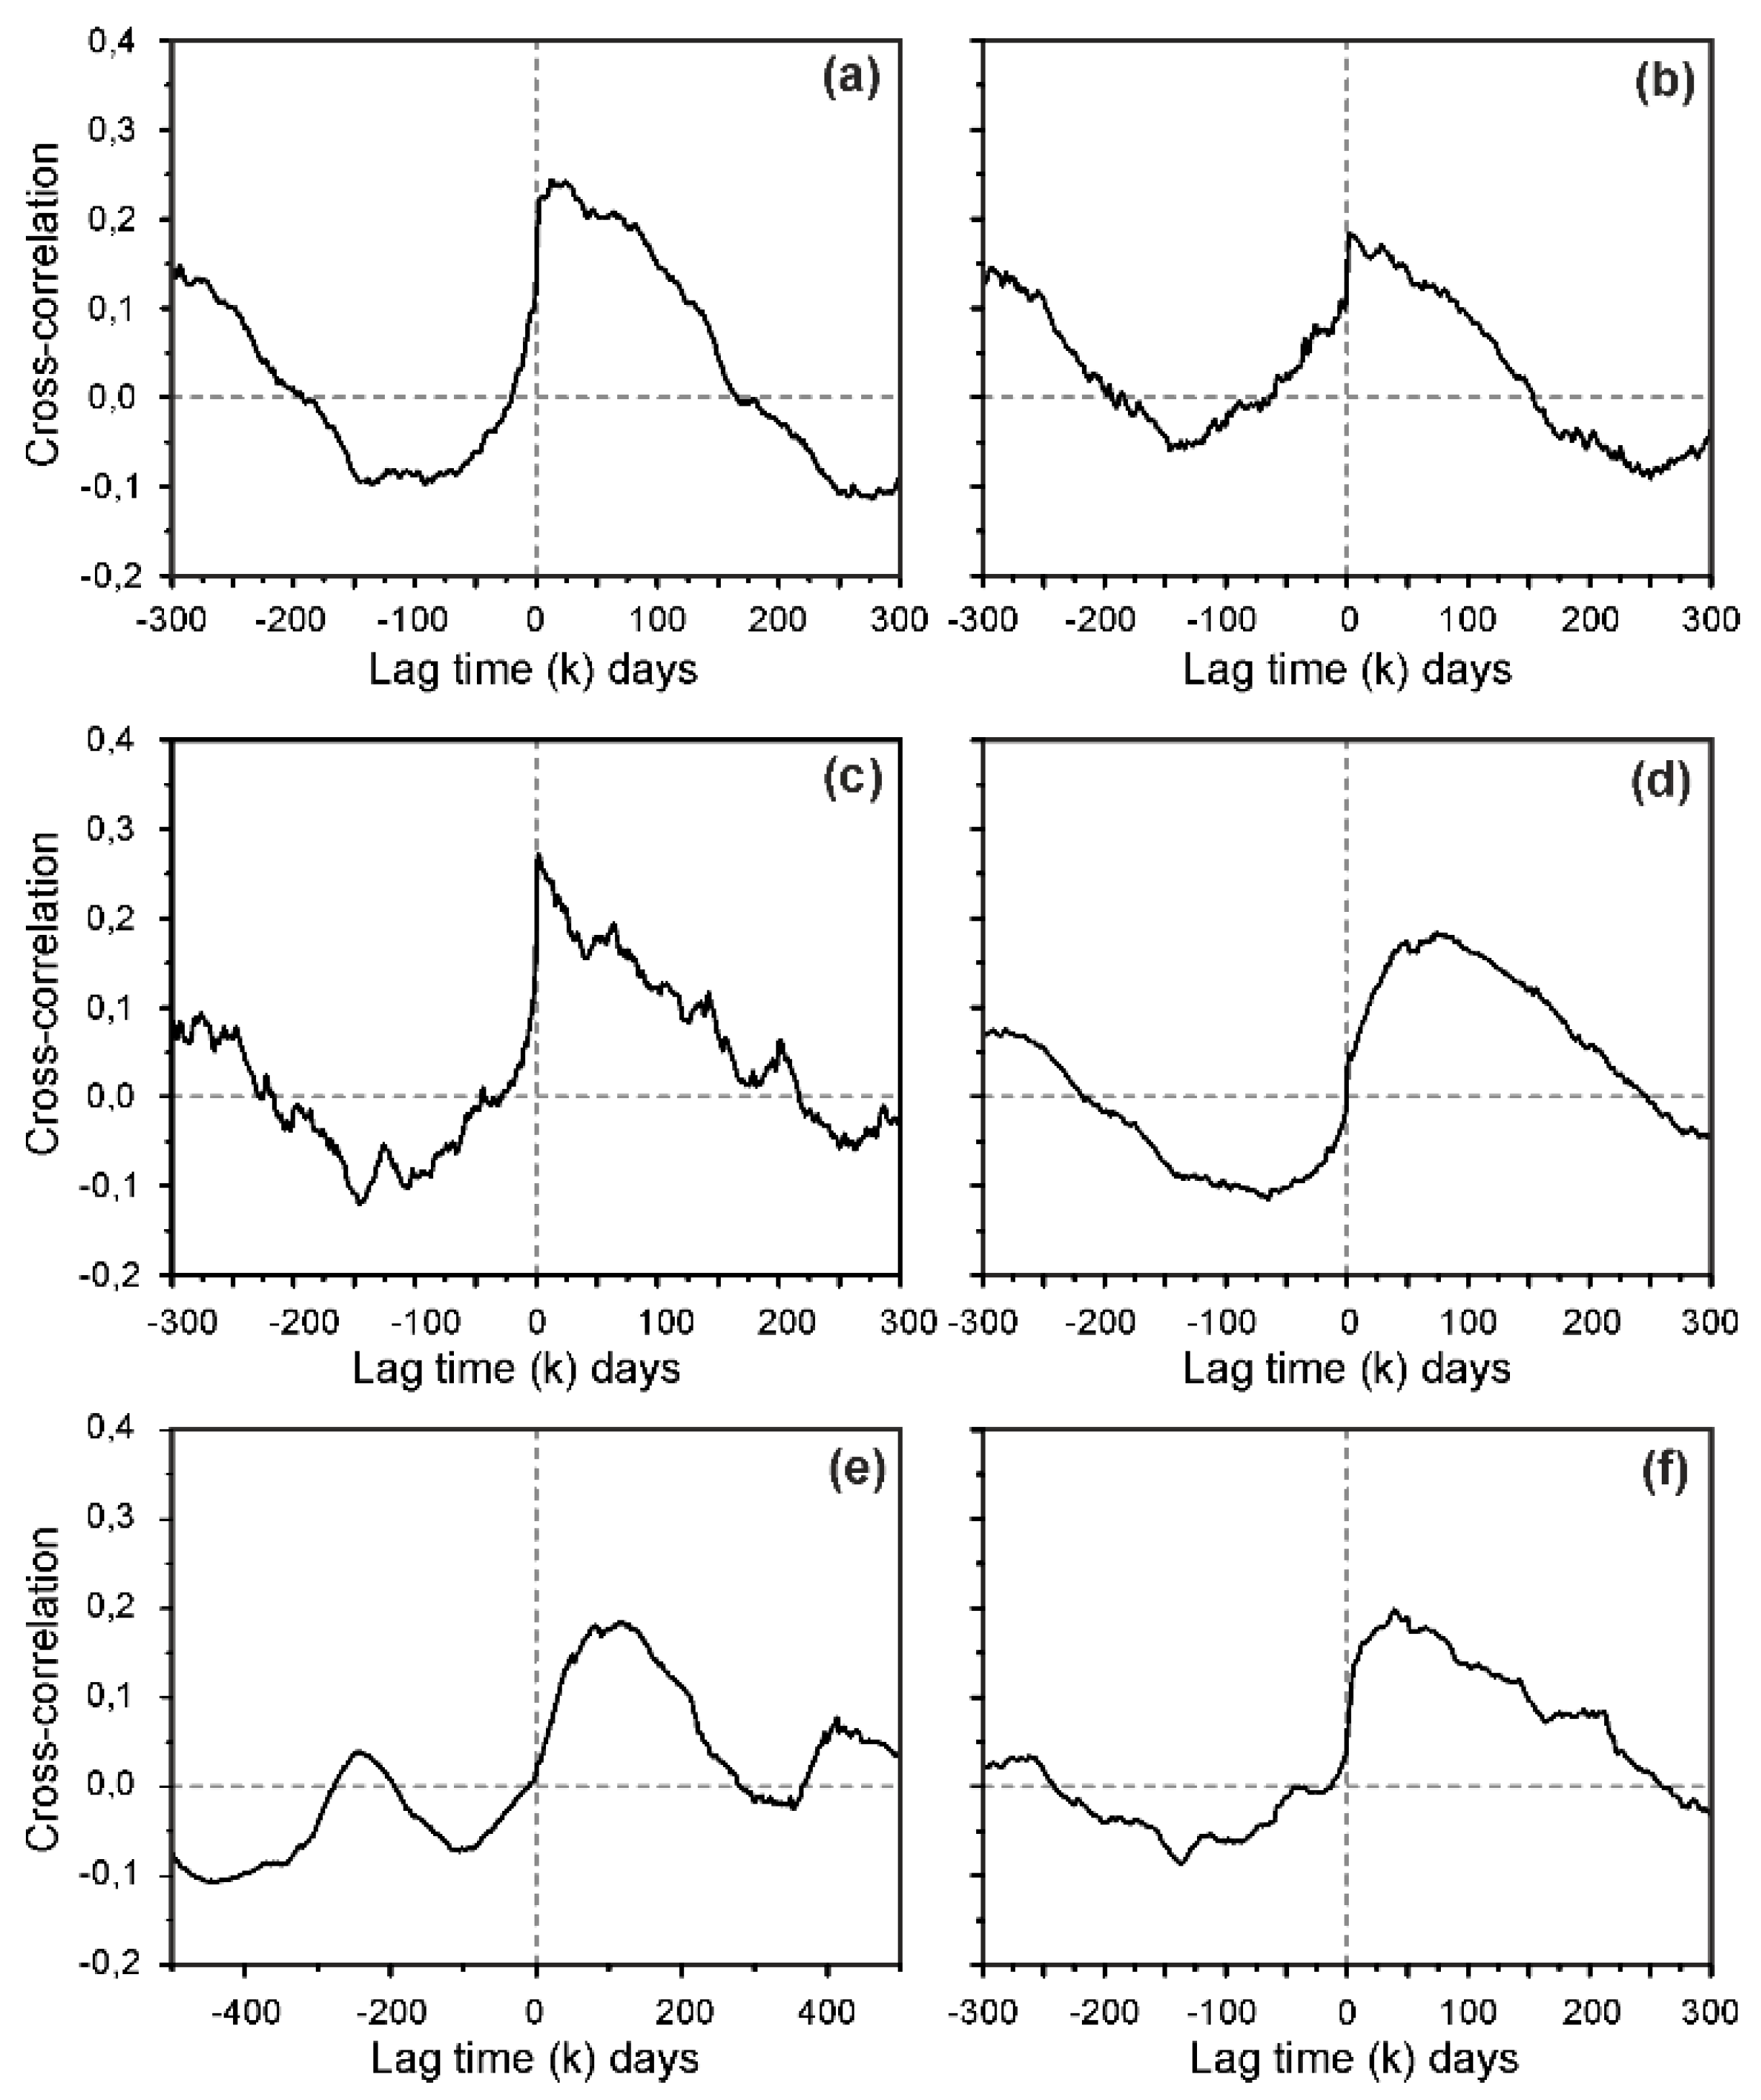
Cross-correlograms of the Boschetto, Scirca, and Vaccara springs are each characterized by a sharp peak (0.27, 0.24, and 0.18, respectively) that diminishes rather rapidly in the first days, reflecting a short response time (2 days for Boschetto and Vaccara springs and 13 days for Scirca spring). Subsequently, the CCFs gradually decrease with a gentle slope for about 50 days. This shape indicates the duality of the aquifers, with the sharp peaks indicating a transmissive function and the slight decreases indicating a capacitive function [61].
Cross-correlation functions of the Capo d’Acqua, San Giovenale and Bagnara springs show much more regular unimodal trends than the previously described springs. In fact, CCFs decrease rather slowly with a gentle slope. They have barely perceptible mean response delays, with cross-correlation coefficients ranging between 0.18 to 0.20. This behavior corresponds to that of a barely karstified system, similar to a porous medium in which there is no quickflow.
The response times of these carbonate systems are 39 days for the Bagnara spring, 74 days for the Capo d’Acqua spring, and 119 days for the San Giovenale spring. These results indicate a gradual emptying of the hydric system with a large storage capacity that regulates the input flow (baseflow sub-regime).
Finally, in the CCFs of both the Boschetto and Bagnara springs, a series of peaks were observed after the initial peak (64, 142, and 201 days for the Boschetto spring, 68, 145, and 232 days for the Bagnara spring). It appears that these may have been caused by one or more additional flow components within the aquifers. An explanation for this behavior must be sought in the slight control exercised by the system on the input function. Moreover, further limitations in the rainfall-discharge relationship exist, since spring discharge can depend on the rainfall of the previous year [60].
4. Discussion
The recession coefficient is one of the most important parameters for understanding aquifer characteristics. In this study, the Master Recession Curve method was applied to recession periods that are mainly controlled by the rate of decline in the water table [67]. Different recession coefficients reflect flow regimes with different hydraulic conductivities [5]. Therefore, the recession coefficient is always used to identify the structural properties (matrix, fractures, and conduit networks) and the karstification degree of a karst aquifer [23,52,53,54,68,69].
Applying the MRC method to the six springs allowed to define two main structural types of the karst systems in question (aquifer heterogeneity): systems with a unimodal behavior (characterized by a single flow component, αb) and systems with a bimodal behavior (characterized by two flow components, αq and αb). The number of flow phases depends mainly on the degree of karstification [70].
The recession analysis (illustrated in the equation in Figure 8) exposed different groups of aquifer systems. Bimodal aquifers have mean recession coefficient values during the quickflow sub-regime of about an order of magnitude higher than recession coefficients estimated during baseflow conditions. The MRCs displayed values between 5.3 × 10⁻³ (αb of Vaccara spring) and 0.1 day−1 (αq of Boschetto spring). This is in agreement with Mangin [10] and Amit et al. [11] and confirms the presence of two types of flow (fast and slow), as verified by the two main slopes exhibited by the recession curves. The exponential term with the largest slope, αq, represents a fast depletion (quickflow sub-regime) of flow channels with high transfer capacity, while the largest α-value likely reflects extensive fracturing and intrakarst connectivity [11].
The Capo d’Acqua and San Giovenale springs (unimodal aquifer systems) present only one type of flow, which, however, have very different magnitudes. In fact, the Capo d’Acqua spring was characterized by an exponential term with a small slope, about 7.4 × 10⁻³ day−1 (analogous to bimodal aquifers during baseflow conditions), whereas the San Giovenale spring showed a depletion coefficient of 1.15 × 10⁻² day−1, which is the lowest value, but bears the same magnitude as bimodal aquifers under a quickflow sub-regime. Therefore, the drainage of the Capo d’Acqua spring occurs as a diffusive flow in low hydraulic conductivity conditions, most likely controlled by a dense fracture network in the rock matrix. In contrast, the discharge of the San Giovenale spring occurs in intermediate flow conditions (diffusive-turbulent) through a well-developed fracture network with the possible presence of karst conduits of a limited extent.
The analysis emphasizes the role played by the structural geological setting, revealing a net demarcation of the dominantly calcareous cores of anticlines, surrounded by the impermeable Marne a Fucoidi belt and containing variably extensive basal aquifers in line with Mastrorillo and Pettita [71].
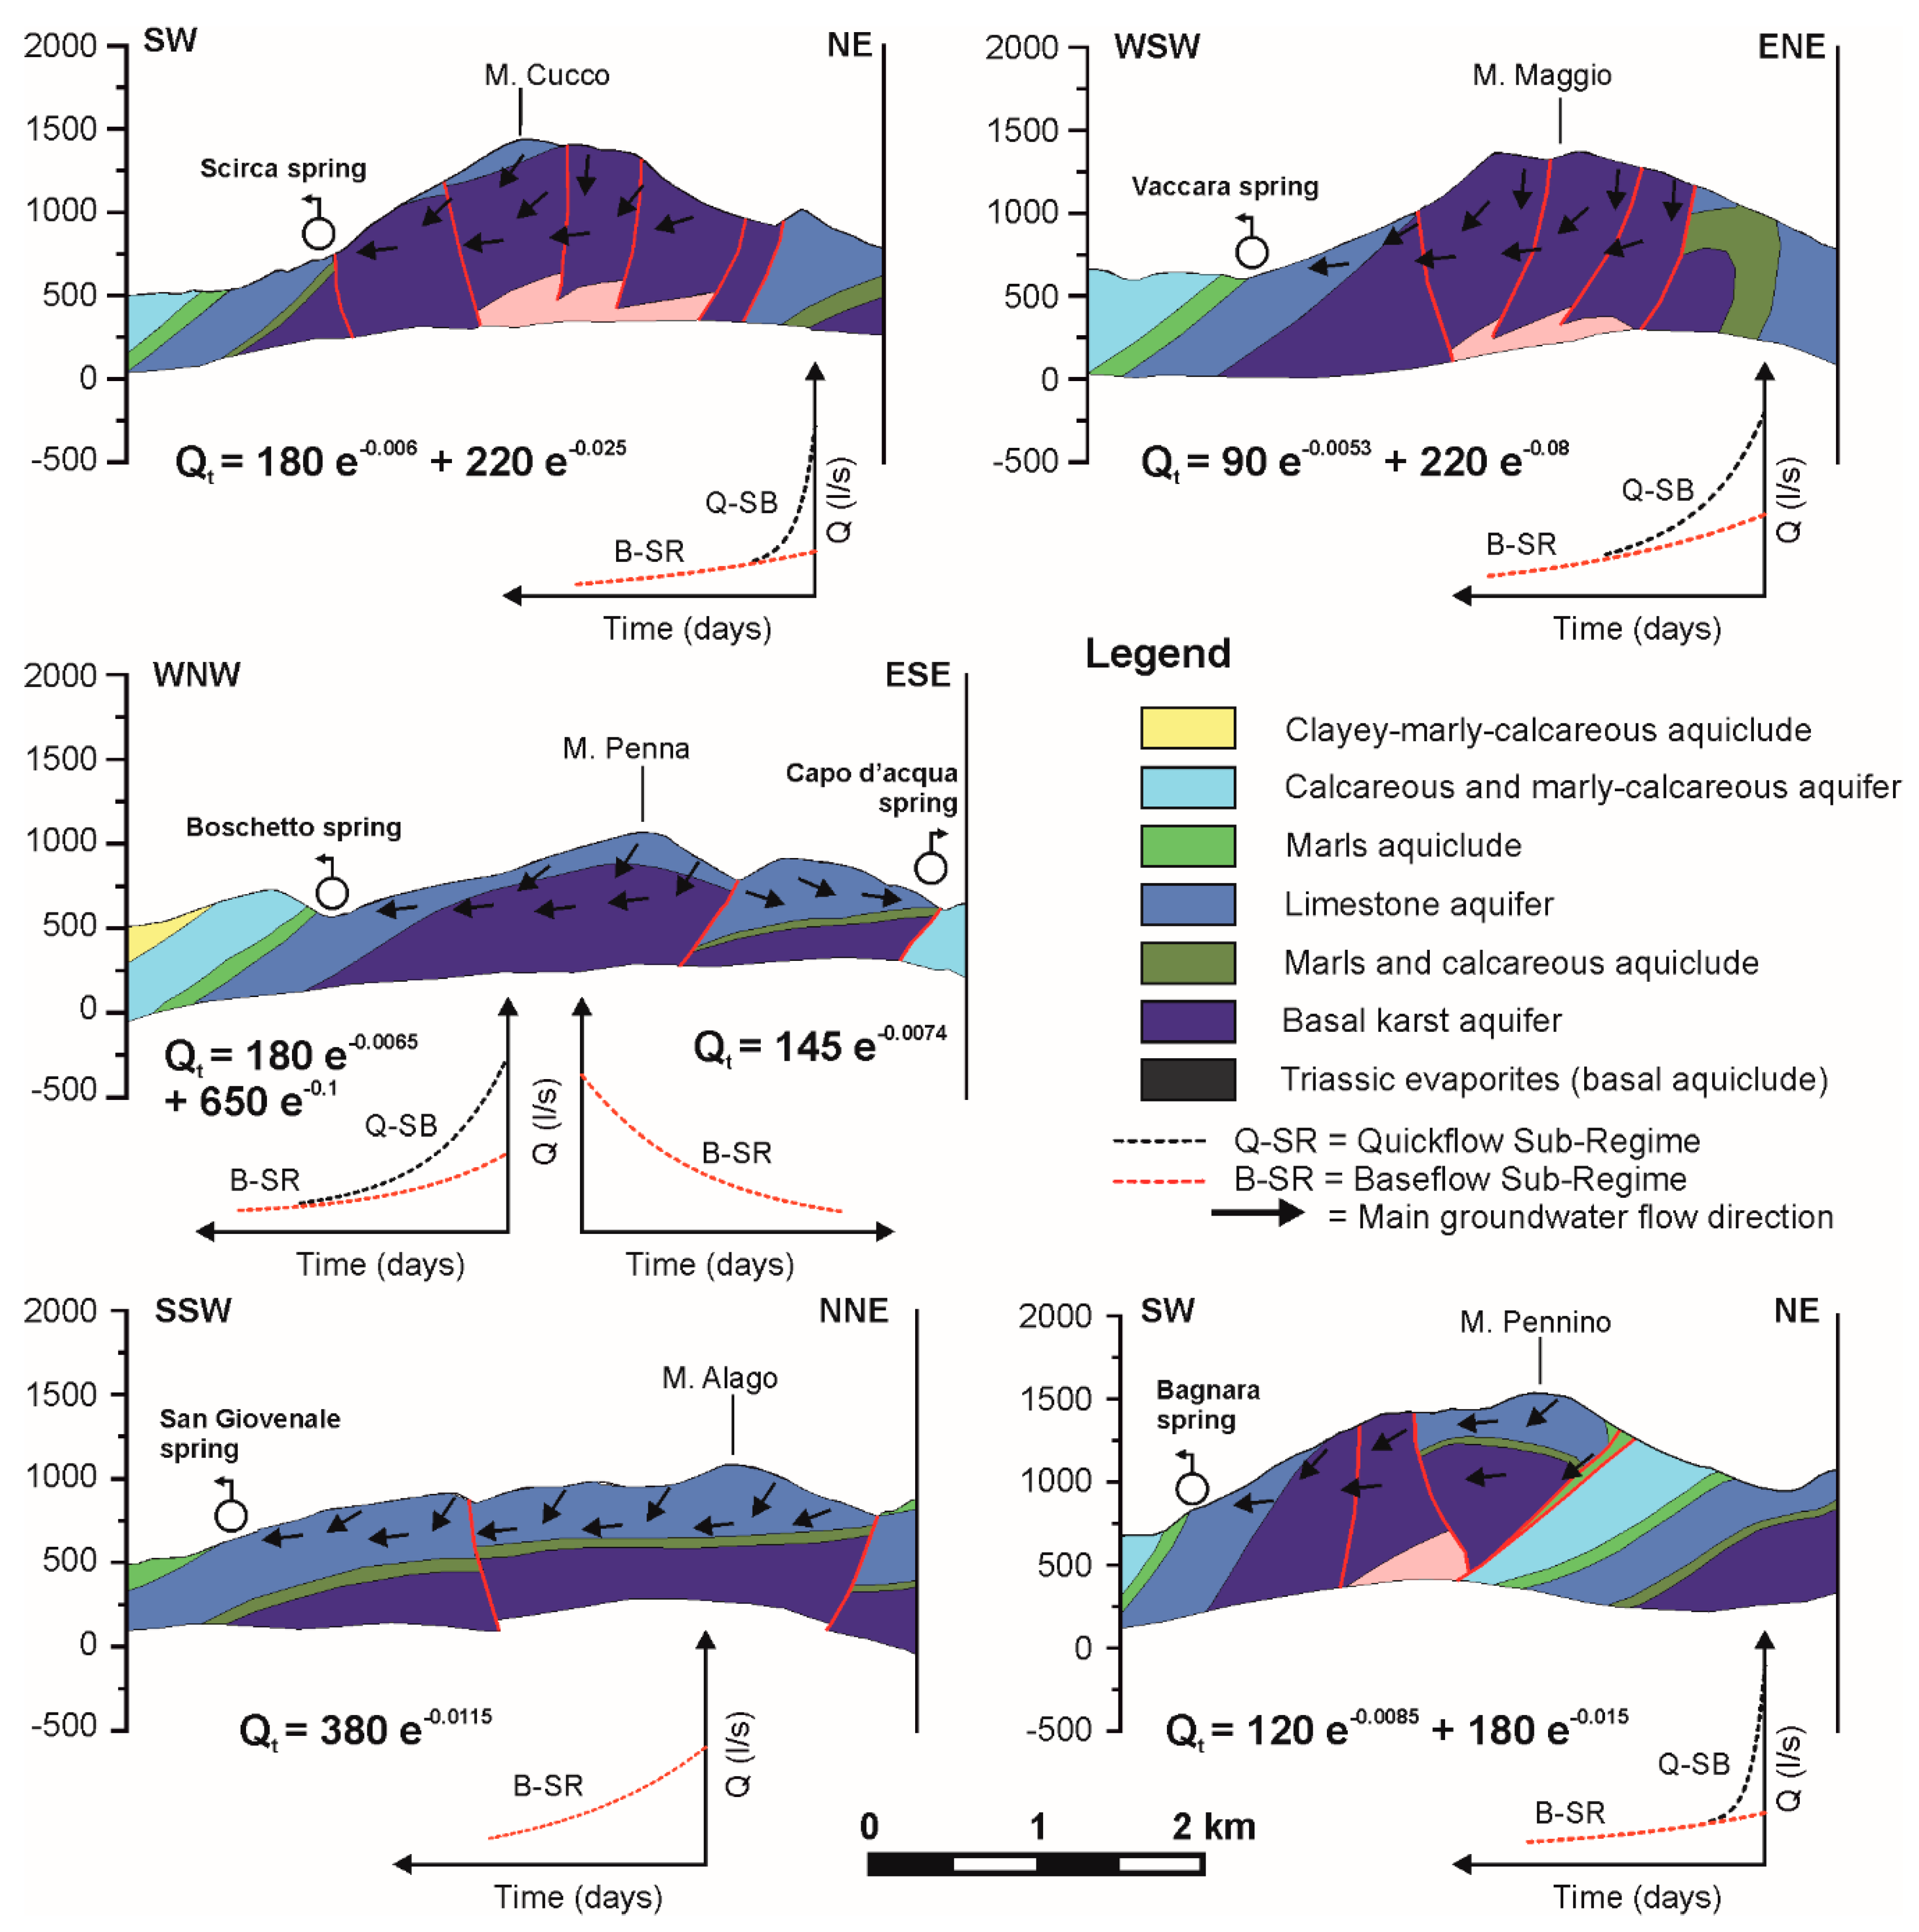
A summary of the equations describing discharge and the relative karstification degree estimated using a 10-degree scale in accordance with Malìk and Vojtková [23] for the six analyzed springs is shown in Table 7. The Boschetto and Bagnara springs showed a karstification degree of 4.0, a value only slightly higher than those of the Scirca and Vaccara springs, both of which showed a karstification degree of 3.7. These aquifer springs are characterized by aquifers with irregularly developed fissure networks dominated by open micro-fissures, which are probably associated with shallow infiltration zones (upper portion of the aquifer) mainly characterized by drainage of the Maiolica Complex. In addition, the presence of karst conduits of a limited extention in the basal portion of the aquifer linked to drainage of the Massiccio Complex, where karstic processes are very common, is very likely. In extreme cases, even short-term turbulent flow might occur in this type of rock environment. From a geological point of view, these aquifers are characterized by a hydraulic connection between the Massiccio Complex and the overlying Maiolica Complex (Figure 8). Moreover, in the Mt Pennino hydrostructures, the hydraulic continuity between Scaglia aquifer complex and the below basal aquifer is not excluded [48].
The Capo d’Acqua and San Giovenale springs showed a single exponential flow component with values of recession coefficients (α > 0.007) associated with a karstification degree of 2.3 (much lower than carbonate aquifers with the duality of discharge). Malík and Vojtková [23] described the karst systems with this karstification degree as characterized by a recharge area with tectonic faults filled with crushed material with higher permeability and lower buffering capability in relation to discharge. As shown in Figure 7, the water discharged by the Capo d’Acqua and San Giovenale springs is drained only by the Maiolica Complex. These aquifers are confined below by an aquiclude of Upper Jurassic and calcareous marls. The Maiolica complex, as well as the basal aquifer, can be characterized as a less developed karst network. Additionally, the Capo d’Acqua and San Giovenale systems are characterized by shallow aquifers, where drainage is controlled almost exclusively by fracture networks.
Hence, in terms of regional hydrogeology, the Umbria-Marche carbonate domain generally has deeper groundwater flowing through hydrogeological complexes consisting of the Calcare Massiccio, Corniola, and Maiolica formations [72]. Furthermore, the structural, geological, and geomorphological conditions have favored the emplacement of a drainage network transversal to the axes of the carbonate ridges [73].
Employing the daily time series data of each spring, an interpretation of auto-correlation and cross-correlation functions proved to be a valuable tool in the study of these aquifer systems, although individual analysis has not shown the same results, because the two hydrodynamic systems (bimodal and unimodal) were not recognized in some cases. The auto-correlation functions (Figure 6) display regular correlogram curves in most cases. Only the Vaccara and Boschetto springs present sharp drop offs in their ACFs in the first 10–20 days, followed by components with much gentler slopes, with a decorrelation time of about 90 days. This confirms the bimodal behavior in the springs indicated by recession analysis. Such behavior points to the existence of an appreciable quickflow component in the initial days, linked to karst conduits that quickly drain the aquifer after a rainfall event, and a dominant baseflow sub-regime in the later days, controlled by the emptying of fracture networks. This complex and heterogeneous framework suggests that, when a rainfall event occurs, rainwater reaches the springs through different flowpaths in both unsaturated and saturated zones. Once rainwater reaches the saturated zones, the hydraulic head raises instantaneously and causes a rapid discharge increase [74].
In contrast, univariate analysis of the Scirca and Bagnara springs does not reflect the duality of aquifer systems indicated by recession analysis. The auto-correlation functions show regular, very gentle slopes with a decorrelation time of 80 days for the Scirca spring and 121 days for the Bagnara spring. The memory effect is therefore rather high for both systems, in which the baseflow component should dominate [75]. The explanation for this is probably that the karst features are mainly located in the unsaturated zone [44].
The correlograms of the San Giovenale and Capo d’Acqua springs, on the other hand, are in agreement with the recession analysis, presenting one flow hydrodynamic component (unimodal behavior). The time lag of the Capo d’Acqua spring has a similar value to those seen thus far, about 90 days. Considering the small recharge area and the limited thickness of the Capo d’Acqua aquifer, the aquifer system is characterized only by a flow component under baseflow conditions and is associated with a low karstification degree. The auto-correlation function of the San Giovenale spring presents the highest memory effect of all aquifer systems analyzed, reaching rk = 0.2 after about 150 days. This great inertia indicates a low karstification degree and, consequently, the large storage capacity of the system. From a hydrogeological point of view, the aquifer is characterized by a large recharge area (10.5 km2) and a rather limited thickness (Figure 7d), due to drainage that occurs only into the Maiolica complex.
The analysis of cross-correlation functions produced approximately the same results as those of recession analysis, and partially the same as those of the auto-correlation analysis, although the coefficients estimated between spring discharges and rainfall events were rather low (0.18–0.27). In fact, the CCFs of Scirca, Vaccara, and Boschetto springs indicated a bimodal character, showing a discrete peak with a delay of a few days. This can be interpreted as a rapid response of the aquifer to a rainfall occurrence.
In contrast, the CCFs of the Capo d’Acqua, San Giovenale, and Bagnara springs show a long impulsional response, which exceeds 200 days, with a rather high delay ranging from 39 days (Bagnara spring) to 119 days (San Giovenale spring). This indicates a powerful memory of the systems and the dominance of baseflow at the expense of quickflow.
5. Conclusions
In order to define the characteristics of groundwater circulation in carbonate hydrostructures of the Umbria-Marche Apennine, the discharge time-series from 1 January of 2007 to 31 December of 2015 (eight years) of six aquifer springs were analyzed, using different methodologies (MRC “master recession curve” analysis, ACF “auto-correlation function” analysis, and CCF “cross-correlation analysis”). The carbonate aquifers analyzed simulated drainage under linear reservoir conditions, where discharge followed the exponential form of the modified Maillet equation, although not all systems showed the same structural properties. In fact, two types of aquifers were observed: a carbonate aquifer with bimodal behavior and a carbonate aquifer with unimodal functionality. These substantial differences can be attributed to the different structural and geological settings of individual hydrostructures, which control the different components of groundwater systems [5].
In the hydrostructures, springs represent the “spill-over” of the deep regional flow. The recharge areas of springs and deep flow are separated by dynamic groundwater divides, which move horizontally as the water table falls or rises [76].
Specifically, the discharges of the Scirca, Vaccara, Boschetto, and Bagnara springs were characterized by two hydrodynamic sub-regimes (bimodal behavior), where the fracture networks and micro-fissures (rock matrix) controlled the slow drainage (baseflow sub-regime) with an αb of about 10−3, and the conduit networks controlled the fast drainage (quickflow sub-regime) with an αq of one order of magnitude lower than that of the matrix. This reflects the karstification degree (3.7–4, according to the classification of Malík and Vojtková [23]), where conduit networks of limited extent were characterized by rare interconnected systems and surrounded by a fractured rock mass with irregularly developed and moderately opened fissures. These carbonate aquifers were defined by the hydrostratigraphic contact between the Maiolica Complex and the Massiccio Complex. The Capo d’Acqua and San Giovenale springs, on the other hand, presented unimodal behavior, showing a single exponential flow component with values of recession coefficients lower than other, previously seen aquifer systems. This is explained by groundwater circulation that happens only within the Maiolica complex, where the karst is scarcely developed, and water moves through fracture networks [77].
When the recession coefficient increased with time, a more rapid decrease of discharge was found and little available water could be supplied. This is what happened during the quickflow components of the aquifer with bimodal behavior (Scirca, Vaccara, Boschetto, and Bagnara springs). In contrast, when the recession coefficient decreased continuously with time, the decrease of the discharge was slower than the exponential recession, and the aquifer provided more available water during long dry periods [78]. This is represented by the aquifer with unimodal behavior (San Giovenale and Capo d’Acqua spring) and by a baseflow component of the aquifer with bimodal behavior.
Both auto-correlation and cross-correlation functions showed approximately the same results as the recession analysis. Bimodal aquifers showed a steep slope and a short lag time (2–13 days) followed by a gentle slope, whereas unimodal aquifers showed a somewhat uniform decrease with high delay times. In addition, both the CCF and the ACF indicate a large memory effect (over 80 days) and large response time (over 100 days), implying the dominance of the baseflow sub-regime. This suggests great inertia, showing how the aquifers filter the information given by rainfall events very well. Consequently, the analyzed aquifer systems highlight large storage capacity (very important for the water management) and the attenuation character.
Taking into consideration the results achieved, it can be concluded that the structural and hydrogeological setting influences the structural properties of aquifers and, consequently, the groundwater circulation within the Apenninic carbonate sequence. The hydrostructures contained within the Maiolica Complex present a high fracturation degree and a slightly karstified rock mass, which exerts the dominant influence over infiltration and percolation. Here, groundwater circulation occurs within fracture networks and discharge is dominated by baseflow sub-regimes (probably with a Darcian flow), resulting in unimodal functionality. The aquifers contained within the Massiccio Complex, on the other hand, have a higher karstification degree, which controls water circulation characterized by different flow components. This complex is affected by moderately developed conduit networks, especially in the deeper aquifer zones, which results in a quickflow sub-regime and, therefore, dual behavior.
Due to these specific characteristics, fractured and karst aquifers are of increasing interest because they represent a significant percentage of the world’s water supply. Aquifers are extremely vulnerable to the various sources of pollution; hence, the exploitation, maintenance of water quality, and the protection of fractured and karst aquifers are of vital importance. Therefore, the knowledge of recession coefficient is very helpful in water management.
Author Contributions
Conceptualization, A.T. and M.M.; methodology, M.M. and A.T.; software, A.T; validation, M.M.; formal analysis, A.T.; investigation, A.T. and M.M.; resources, M.M.; data curation, A.T. writing—original draft preparation, A.T.; writing—review and editing, A.T. and M.M.; funding acquisition, M.M.; All authors have read and agreed to the published version of the manuscript.
Funding
This research was supported by the University of Urbino. Department research budget 2019, resp.M.M.
Acknowledgments
The authors would like to express their gratitude to Daniela Piacentini for the data analysis discussion. We are also grateful to the ARPA Umbria and Hydrographic Service of Umbria Region for the data support for this study.
Conflicts of Interest
The authors declare no conflict of interest.
References
- Király, L. Modeling karst aquifers by the combined discrete channel and continuum approach. Bull. d’Hydrogéol. l’Univ. Neuchâtel. 1998, 16, 77–98. [Google Scholar]
- Kiraly, L. Karstification and Groundwater Flow. In Evolution of Karst: From Prekarst to Cessation; Zalozba ZRC: Postojna, Ljubljana, 2002; pp. 155–190. [Google Scholar]
- Kiraly, L.; Morel, G. Remarques sur l’hydrogramme des sources karstiques simulé par modéles mathe’matiques. Bull. Cent. d’Hydrogéol. Univ. Neuchatel. (Suisse) 1976, 1, 37–60. [Google Scholar]
- Kovács, A.; Perrochet, P. A quantitative approach to spring hydrograph decomposition. J. Hydrol. 2008, 352, 16–29. [Google Scholar] [CrossRef]
- Bonacci, O. Karst springs hydrographs as indicators of karst aquifers. Hydrol. Sci. J. 1993, 38, 51–62. [Google Scholar] [CrossRef]
- Brodie, R.S.; Hostetler, S. A review of techniques for analysing base flow from stream hydrographs. In Proceedings of the NZHS-IAH-NZSSS 2005 Conference, Aukland, New Zeland, 28 November–2 December 2005. [Google Scholar]
- Kresic, N.; Bonacci, O. Spring discharge hydrograph. In Groundwater Hydrology of Springs: Engineering, Theory, Management, and Sustainability, 1st ed.; Kresic, N., Stevanovic, Z., Eds.; Elsevier: Burlington, VT, USA, 2010; Volume 4, pp. 129–163. [Google Scholar] [CrossRef]
- Boussinesq, J. Essai sur la théorie des eaux courantes, Mémoires présentés par divers savants à l’Académie des Sciences. XXIII 1877, 1, 1–680. [Google Scholar]
- Maillet, E. Essais d’Hydraulique souterraine et fluviale, Librairie Scientifique; Primary Source Edition; A. Hermann: Paris, French, 1905; p. vi-218. [Google Scholar]
- Mangin, A. Contribution a l’etude hydrodynamique des aquifères karstiques. Ann. Speleol. 1975, 26, 283–339. [Google Scholar]
- Amit, H.; Lyakhovsky, V.; Katz, A.; Starinsky, A.; Burg, A. Interpretation of spring recession curves. Groundwater 2002, 40, 543–551. [Google Scholar] [CrossRef]
- Kovács, A.; Perrochet, P.; Király, L.; Jeannin, P.Y. A quantitative method for the characterisation of karst aquifers based on spring hydrograph analysis. J. Hydrol. 2005, 303, 152–164. [Google Scholar] [CrossRef] [Green Version]
- Fiorillo, F. The recession of spring hydrographs focused on karst aquifers. Water Resour. Manag. 2014, 28, 1781–1805. [Google Scholar] [CrossRef]
- Drogue, C. Analyse statistique des hydrogrammes de décrues des sources karstiques. J. Hydrol. 1972, 15, 49–68. [Google Scholar] [CrossRef]
- Malík, P. Assessment of regional karstification degree and groundwater sensitivity to pollution using hydrograph analysis in the Velka Fatra Mts., Slovakia. Environ. Geol. 2007, 51, 707–711. [Google Scholar] [CrossRef]
- Giacopetti, M.; Materazzi, M.; Pambianchi, G.; Posevac, K. Analysis of mountain springs discharge time series in the Tennecola stream catchment (central Apennine, Italy). Environ. Earth Sci. 2017, 2017, 20. [Google Scholar] [CrossRef]
- Nathan, R.J.; McMahon, T.A. Evaluation of automated techniques for base flow and recession analyses. Water Resour Res. 1990, 26, 1465–1473. [Google Scholar] [CrossRef]
- Tallaksen, L. A review of baseflow recession analysis. J. Hydrol. 1995, 165, 349–370. [Google Scholar] [CrossRef]
- Posavec, K.; Bačani, A.; Nakić, Z. A visual basic spreadsheet macro for recession curve analysis. Groundwater 2006, 44, 764–767. [Google Scholar] [CrossRef]
- Posavec, K.; Parlov, J.; Nakić, Z. Fully automated objective-based method for master recession curve separation. Groundwater 2010, 48, 598–603. [Google Scholar] [CrossRef]
- Gregor, M.; Malík, P. Construction of master recession curve using genetic algorithms. J. Hydrol. Hydromech. 2012, 60, 3–15. [Google Scholar] [CrossRef] [Green Version]
- Fiorotto, V.; Caroni, E. A new approach to master recession curve analysis. Hydrol. Sci. J. 2013, 58, 966–975. [Google Scholar] [CrossRef] [Green Version]
- Malík, P.; Vojtková, S. Use of recession-curve analysis for estimation of karstification degree and its application in assessing overflow/underflow conditions in closely spaced karstic springs. Environ. Earth Sci. 2012, 65, 2245–2257. [Google Scholar] [CrossRef]
- Malík, P. Evaluating discharge regimes of karst aquifer. In Karst Aquifers-Characterization and Engineering; Stevanovic, Z., Ed.; Springer: Berlin, Germany, 2015; pp. 205–247. [Google Scholar] [CrossRef]
- Box, G.P.E.; Jenkins, G.M. Time Series Analysis: Forecasting and Control; Holden-Day: San Francisco, CA, USA, 1970. [Google Scholar]
- Mangin, A. Pour une meilleure connaissance des systmes hydrologiques h partir des analyses corrflatoire et spectrale. J. Hydrol. 1984, 67, 25–43. [Google Scholar] [CrossRef]
- Padilla, A.; Pulido-Bosch, A. Study of hydrographs of karstic aquifers by means of correlation and cross-spectral analysis. J. Hydrol. 1995, 168, 73–89. [Google Scholar] [CrossRef]
- Larocque, M.; Mangin, A.; Razck, M.; Banton, O. Contribution of correlation and spectral analyses to the regional study of a large karst aquifer (Charente, France). J. Hydrol. 1998, 205, 217–231. [Google Scholar] [CrossRef]
- Panagopoulos, G.; Lambrakis, N. The contribution of time series analysis to the study of the hydrodynamic characteristics of the karst systems: Application on two typical karst aquifers of Greece (Trifilia, Almyros Crete). J. Hydrol. 2006, 329, 368–376. [Google Scholar] [CrossRef]
- Jemcov, I.; Petrič, M. Measured precipitation vs. effective infiltration and their influence on the assessment of karst systems based on results of the time series analysis. J. Hydrol. 2009, 379, 304–314. [Google Scholar] [CrossRef]
- Kresic, N.; Stevanovic, Z. Groundwater Hydrology of Springs: Engineering, Theory, Management and Sustainability, 1st ed.; Butterworth-Heinemann: Burlington, NJ, USA, 2010. [Google Scholar]
- Centamore, E.; Deiana, G. La Geologia delle Marche. Studi Geol. Camerti 1986, Special Volume, 1–145. [Google Scholar]
- Ciarapica, G.; Passeri, L. The paleographic duplicity of the Apennines. Boll. Soc. Geol. Ital. 2002, 121, 67–75. [Google Scholar]
- Menichetti, M.; De Feyter, A.J.; Corsi, M. Crop 03dIl tratto della Val Tiberina-Mare Adriatico. Sezione geologica e caratterizzazione tettonico-sedimentaria delle avanfosse della zona umbro-marchigiano-romagnola. Studi Geol. Camerti. 1991, 1, 279–293. [Google Scholar]
- Barchi, M.; De Feyter, A.; Magnani, M.B.; Minelli, G.; Pialli, G.; Sotera, B.M. The structural style of the Umbria-Marche fold and thrust belt. Soc. Geol. Ital. Mem. 1998, 52, 557–578. [Google Scholar]
- Boni, C.; Bono, P.; Capelli, G. Schema idrogeologico dell’Italia Centrale. Mem. Soc. Geol. Ital. 1986, 35, 991–1012. [Google Scholar]
- Capaccioni, B.; Didero, M.; Paletta, C.; Salvadori, P. Hydrogeochemistry of groundwaters from carbonate formations with basal gypsiferous layers: An example from Mt Catria-Mt Nerone ridge (Northern Apennines, Italy). J. Hydrol. 2001, 253, 14–26. [Google Scholar] [CrossRef]
- Nanni, T.; Vivalda, P. The aquifers of the Umbria-Marche Adriatic region: Relationship between structural setting and groundwater chemistry. Boll. Soc. Geol. Ital. 2005, 124, 523–542. [Google Scholar]
- Boni, C.; Petitta, M. Studio Idrogeologico per L’identificazione e la Caratterizzazione Degli Acquiferi che Alimentano le Sorgenti dei Corsi D’acqua Perenni dei Monti Sibillini, Esteso All’intera Area del Parco Nazionale; Rapporto definitivo; Contratto di studio e ricerca. Autorità di Bacino del Fiume Tevere—Parco Nazionale dei Monti Sibillini—Dipartimento Scienze della Terra Università di Roma “La Sapienza”; Università “La Sapienza”di Roma: Roma, Italy, 2007. [Google Scholar]
- Boni, C.; Petitta, M. Redazione informatizzata della cartografia idrogeologica tematica del territorio della Regione Umbria. Tech. Note 2008, 2008, 131. [Google Scholar]
- Boni, C.; Baldoni, T.; Banzato, F.; Cascone, D.; Petitta, M. Hydrogeological study for identification, characterisation and management of groundwater resources in the Sibillini Mountains National Park (central Italy). Ital. J. Eng. Geol. Environ. 2010, 2, 21–39. [Google Scholar] [CrossRef]
- Mastrorillo, L. Elementi strutturali e caratteristiche idrogeologiche della dorsale carbonatica umbro-marchigiana. Mem. Soc. Geol. Ital. 2001, 56, 219–226. [Google Scholar]
- Mastrorillo, L.; Baldoni, T.; Banzato, F.; Boscherini, A.; Cascone, D.; Checcucci, R.; Petitta, M.; Boni, C. Quantitative hydrogeological analysis of the carbonate domain in the Umbria region. Ital. Eng. Geol. Environ. 2009, 1, 137–155. [Google Scholar]
- Menichetti, M.; Salvatori, F.; Reichembach, G. Contribution des essais de multitracages à la definition de l’hydrostructure carbonatique de Monte Cucco et de la source Scirca-Italie-Apennin Central. Ann. Sci. l’Univ. Besancon Geol. Mem. Hors Ser. 1988, 6, 347–364. [Google Scholar]
- Boni, C.; Mastrorillo, L.; Preziosi, E. Simulazione numerica di acquiferi carbonatici: L’esempio della struttura Monte Maggio–Monte Penna (Nocera Umbra). Geol. Romana 1994, 30, 27–35. [Google Scholar]
- Dragoni, W.; Mottola, A.; Cambi, C. Modeling the effects of pumping wells in spring management: The case of Scirca spring (central Apennines, Italy). J. Hydrol. 2013, 493, 115–123. [Google Scholar] [CrossRef]
- Cambi, C.; Di Matteo, L.; Dragoni, W.; Valigi, D.; Frondini, F.; Boscherini, A.; Checcucci, R. Hydrogeological map of Gualdo Mountains North-Eastern Umbria. Explanatory Notes. Water budget of Jurassic and low Cretacicous hydrogeological complexes. Umbria Reg. Proj. Piano Ambient. 2006. [Google Scholar] [CrossRef]
- Ardizzone, F.; Dragoni, W.; Marchetti, G.; Mariani, M.; Vacca, G. Definizione delle aree di salvaguardia della sorgente di Bagnara di Nocera Umbra. In Proceedings of the 3° Convegno Nazionale Sulla Protezione e Gestione Delle Acque Sotterranee Per il III Millennio, Parma, Italy, 13–15 October 1999; p. 3. [Google Scholar]
- Dewandel, B.; Lachassagne, P.; Bakalowicz, M.; Weng, P.; Al-Malki, A. Evaluation of aquifer thickness by analysing recession hydrographs. Application to the Oman ophiolite hard-rock aquifer. J. Hydrol. 2003, 274, 248–269. [Google Scholar] [CrossRef]
- Eisenlohr, L.; Király, L.; Bouzelboudjen, M.; Rossier, Y. Numerical versus statistical modelling of natural response of a karst hydrogeological system. J. Hydrol. 1997, 202, 244–262. [Google Scholar] [CrossRef]
- Forkasiewicz, J.; Paloc, H. Le régime de tarissement de la Foux de la Vis. Etude preliminaire. Chron. d’Hydrogeol. 1967, 3, 61–73. [Google Scholar]
- Ghasemizadeh, R.; Hellweger, F.; Butscher, C.; Padilla, I.; Vesper, D.; Field, M.; Alshawabkeh, A. Review: Groundwater flow and transport modeling of karst aquifers, with particular reference to the North Coast Limestone aquifer system of Puerto Rico. Hydrogeol. J. 2012, 20, 1441–1461. [Google Scholar] [CrossRef] [PubMed] [Green Version]
- White, W.B. Conceptual models for karstic aquifers. Speleogenes. Evol. Karst Aquifers 2003, 1, 1–6. [Google Scholar]
- Katsanou, K.; Lambrakis, N.; Tayfur, G.; Baba, A. Describing the karst evolution by the exploitation of hydrologic time-series data. Water Resour. Manag. 2015, 29, 3131–3147. [Google Scholar] [CrossRef] [Green Version]
- Mayaud, C.; Wagner, T.; Benischke, R.; Birk, S. Single event time series analysis in a binary karst catchment evaluated using a groundwater model (Lurbach system, Austria). J. Hydrol. 2014, 511, 628–639. [Google Scholar] [CrossRef] [Green Version]
- Box, G.E.P.; Jenkins, G.M.; Reinsel, G.C. Time Series Analysis: Forecasting and Control, 3rd ed.; Prentice Hall Inc.: Englewood Cliffs, NJ, USA, 1994. [Google Scholar]
- Mangin, A. Utilisation des analyses correlatoire et spectrale dans l’approche des systemes hydrologiques. Comptes Rendusd Acad. Sci. 1981, 293, 401–404. [Google Scholar]
- Mangin, A.; Pulido-Bosch, A. Aplicacion de los analisis de correlatorie spectral en el estudio de los acuiferos karsticos. Tecniterrae 1983, 51, 53–65. [Google Scholar]
- Lo Russo, S.; Amanzio, G.; Ghione, R.; De Maio, M. Recession hydrographs and time series analysis of springs monitoring data: Application on porous and shallow aquifers in mountain areas (Aosta Valley). Environ. Earth Sci. 2015, 73, 7415–7434. [Google Scholar] [CrossRef]
- Fiorillo, F.; Doglioni, A. The relation between karst spring discharge and rainfall by cross-correlation analysis (Campania, Southern Italy). Hydrogeol. J. 2010, 18, 1881–1895. [Google Scholar] [CrossRef]
- Delbart, C.; Valdés, D.; Barbecot, F.; Tognelli, A.; Chouchoux, L. Spatial organization of the impulse response in a karst aquifer. J. Hydrol. 2016, 537, 18–26. [Google Scholar] [CrossRef]
- Fiorillo, F.; Malik, P. Hydraulic behavior of Karst Aquifers. Water 2019, 11, 1563. [Google Scholar] [CrossRef] [Green Version]
- Riggs, H.C. The base-flow recession curve as an indicator of groundwater. Int. Assoc. Sci. Hydrol. Publ. 1964, 63, 352–363. [Google Scholar]
- Petras, I. An approach to the mathematical expression of recession curves. Water SA 1986, 12, 145–150. [Google Scholar]
- Fiorillo, F. Tank-reservoir drainage as a simulation of the recession limb of karst spring hydrographs. Hydrogeol. J. 2011, 19, 1009–1019. [Google Scholar] [CrossRef]
- Fiorillo, F.; Pagnozzi, M. Recharge processes of karst massifs: Example from southern Italy. Environ. Earth Sci. 2015, 1, 103–111. [Google Scholar]
- Mohammadi, Z.; Shoja, A. Effect of annual rainfall amount on characteristics of karst spring hydrograph. Carbonates Evaporites 2014, 29, 279–289. [Google Scholar] [CrossRef]
- Bailly-Comte, V.; Martin, J.B.; Jourde, H.; Screaton, E.J.; Pistre, S.; Langston, A. Water exchange and pressure transfer between conduits and matrix and their influence on hydrodynamics of two karst aquifers with sinking streams. J. Hydrol. 2010, 386, 55–66. [Google Scholar] [CrossRef]
- Padilla, A.; Pulido-Bosch, A.; Mangin, A. Relative importance of baseflow and quickflow from hydrographs of karst spring. Groundwater 1994, 32, 267–277. [Google Scholar] [CrossRef]
- Fu, T.G.; Chen, H.S.; Wang, K.L. Structure and water storage capacity of a small karst aquifer based on stream discharge in southwest China. J. Hydrol. 2016, 534, 50–62. [Google Scholar] [CrossRef]
- Mastrorillo, L.; Petitta, M. Hydrogeological conceptual model of the Upper River basin aquifers (Umbria-Marche Apennines). Ital. J. Geosci. 2014, 133, 396–408. [Google Scholar] [CrossRef]
- Boni, C.; Mastrorillo, M.; Cascone, D.; Tarragoni, C. Carta Idrogeologica Delle Dorsali Interne Umbro-Marchigiane (Scala 1:50.000); GNDCI-CNR: Rome, Italy, 2005; Volume 2865. [Google Scholar]
- Centamore, E.; Micarelli, A. L’ambiente fisico delle Marche: Stratigrafia. Regione Marche, Assessorato Urbanistico; S.E.L.C.A.: Firenze, Italy, 1991. [Google Scholar]
- Chiaudani, A.; Di Curzio, D.; Rusi, S. The snow and rainfall impact on the Verde spring behavior: A statistical approach on hydrodynamic and hydrochemical daily time-series. Sci. Total Environ. 2019, 689, 481–493. [Google Scholar] [CrossRef] [PubMed]
- Pulido-Bosch, A.; Padilla, A.; Dimitrov, D.; Machkova, M. The discharge variability of some karst springs in Bulgaria studied by time series analysis. Hydrol. Sci. J. 1995, 40, 517–532. [Google Scholar] [CrossRef]
- Cambi, C.; Valigi, D.; Di Matteo, L. Hydrogeological study of data-scarce limestone massifs: The case of Gualdo Tadino and Monte Cucco structures (central Apennines, Italy). Boll. Geofis. Teor. Appl. 2010, 51, 345–360. [Google Scholar]
- Angelini, P.; Dragoni, W. The problem of modelling limestone spring: The case of Bagnara (North Apennines, Italy). Groundwater 1997, 35, 612–618. [Google Scholar] [CrossRef]
- Fiorillo, F.; Revellino, P.; Ventafridda, G. Karst aquifer draining during dry period. J. Cave Karst Stud. 2012, 74, 148–156. [Google Scholar] [CrossRef]
Figure 1.
Simplified hydrogeological map of the study area at a regional scale (Northern Apennines), illustrating different geological and hydrogeological elements: a partial stratigraphic column of the Umbria-Marche stratigraphic succession spanning the Upper Triassic to the Upper Miocene; the locations of the studied aquifer springs: (1) Scirca spring, (2) Vaccara spring, (3) Boschetto spring, (4) Capo d’acqua spring, (5) San Giovenale spring, and (6) Bagnara spring; the hydrogeological recharge area boundaries; the locations of the rain gauge stations used: (a) Mt Cucco station, (b) Gualdo Tadino station, and (c) Nocera Umbra station.

Figure 2.
Daily rainfall data provided by of the Hydrographic Service of Umbria Region for three rain gauge stations: MC (Monte Cucco), GT (Gualdo Tadino), and NU (Nocera Umbra).
Figure 2.
Daily rainfall data provided by of the Hydrographic Service of Umbria Region for three rain gauge stations: MC (Monte Cucco), GT (Gualdo Tadino), and NU (Nocera Umbra).

Figure 3.
Discharge time series of the Umbria-Marche carbonate springs (data from ARPA Umbria).

Figure 4.
Master Recession Curves of springs with bimodal behavior. (a) Scirca spring; (b) Vaccara spring; (c) Boschetto spring and (d) Bagnara spring.
Figure 4.
Master Recession Curves of springs with bimodal behavior. (a) Scirca spring; (b) Vaccara spring; (c) Boschetto spring and (d) Bagnara spring.

Figure 5.
Master Recession Curves of springs with unimodal behavior. (a) Capo d’Acqua spring and (b) San Giovenale spring.
Figure 5.
Master Recession Curves of springs with unimodal behavior. (a) Capo d’Acqua spring and (b) San Giovenale spring.

Figure 6.
Auto-correlation functions of the analyzed aquifer springs; (a) Scirca spring, (b) Vaccara spring, (c) Boschetto spring, (d) Capo d’Acqua spring, (e) San Giovenale spring, and (f) Bagnara spring.
Figure 6.
Auto-correlation functions of the analyzed aquifer springs; (a) Scirca spring, (b) Vaccara spring, (c) Boschetto spring, (d) Capo d’Acqua spring, (e) San Giovenale spring, and (f) Bagnara spring.

Figure 7.
Cross-correlation functions of the analyzed aquifer springs; (a) Scirca spring, (b) Vaccara spring, (c) Boschetto spring, (d) Capo d’Acqua spring, (e) San Giovenale spring, and (f) Bagnara spring.
Figure 7.
Cross-correlation functions of the analyzed aquifer springs; (a) Scirca spring, (b) Vaccara spring, (c) Boschetto spring, (d) Capo d’Acqua spring, (e) San Giovenale spring, and (f) Bagnara spring.

Figure 8.
Geological sketch of flow dynamics in the carbonate hydrostructures: geological cross-section, graphics of recession curves (MRC analysis), and their relative equations describing karst spring discharge.
Figure 8.
Geological sketch of flow dynamics in the carbonate hydrostructures: geological cross-section, graphics of recession curves (MRC analysis), and their relative equations describing karst spring discharge.


Table 1.
General characteristics of the carbonate complexes and their related catchment areas (geographic coordinates are expressed in WGS84 UTM Zone 33N).
Table 1.
General characteristics of the carbonate complexes and their related catchment areas (geographic coordinates are expressed in WGS84 UTM Zone 33N).
| Hydro- Structures | Spring | Latitude | Longitude | Spring Altitude (m a.s.l.) | Recharge Area (km2) |
|---|---|---|---|---|---|
| Mt Cucco | Scirca | 323,040.1821 | 4,774,571.7434 | 575 | 8.0 |
| Mt Maggio | Vaccara | 325,711.2678 | 4,774,969.1254 | 468 | 6.2 |
| Mt Penna | Boschetto | 324,530.5164 | 4,782,340.2809 | 538 | 11.5 |
| Mt Penna | Capo d’Acqua | 316,236.3956 | 4,802,705.2176 | 570 | 7.4 |
| Mt Burella | San Giovenale | 301,037.8923 | 4,823,140.7066 | 480 | 10.5 |
| Mt Pennino | Bagnara | 321,608.1134 | 4,783,863.2012 | 630 | 4.9 |
Table 2.
Location and characteristics of rain gauge station (geographic coordinate system is expressed in WGS84 UTM Zone 33).
Table 2.
Location and characteristics of rain gauge station (geographic coordinate system is expressed in WGS84 UTM Zone 33).
| Rain Gauge Station | Gauge Station Code | Latitude | Longitude | Monitored Period | Station Altitude (m a.s.l.) |
|---|---|---|---|---|---|
| Mt Cucco | MT-13015 | 316,280.8388 | 4,805,532.5274 | 2007–2015 | 1116 |
| Gualdo Tadino | GT-27422 | 321,232.2980 | 4,789,176.7740 | 2007–2015 | 563 |
| Nocera Umbra | NU-12907 | 320,698.8825 | 4,775,721.4408 | 2007–2015 | 542 |
Table 3.
General characteristics of the time-series of the analyzed aquifer springs.
| Spring | Monitored Period | No. of All Data | No. Miss Data | Time-Series Lag (%) |
|---|---|---|---|---|
| Scirca | 2007–2015 | 3186 | 107 | 3.4 |
| Vaccara | 2007–2015 | 3097 | 754 | 24.3 |
| Boschetto | 2007–2015 | 3194 | 246 | 7.7 |
| Capo d’Acqua | 2007–2015 | 3232 | 55 | 1.7 |
| San Giovenale | 2007–2015 | 2107 | 180 | 5.8 |
| Bagnara | 2007–2015 | 3240 | 47 | 1.5 |
Table 4.
Characteristics of recession curves of springs with bimodal behavior and their related sub-regimes (baseflow or quickflow).
Table 4.
Characteristics of recession curves of springs with bimodal behavior and their related sub-regimes (baseflow or quickflow).
| Spring | No. of Recession Segments | Qb1 (l/s) | αb (d−1) | tb (day) | Qq2 (l/s) | αq (d−1) | tq (day) |
|---|---|---|---|---|---|---|---|
| Scirca | 8 | 180 | 0.0060 | 225 | 220 | 0.025 | 150 |
| Vaccara | 7 | 90 | 0.0053 | 200 | 220 | 0.080 | 60 |
| Boschetto | 7 | 180 | 0.0065 | 200 | 650 | 0.100 | 50 |
| Bagnara | 6 | 120 | 0.0085 | 300 | 180 | 0.015 | 200 |
1 b = baseflow; 2 q = quickflow.
Table 5.
Recession curve characteristics of aquifer springs with unimodal behavior.
| Spring | No. of Recession Segments | Q (l/s) | α (d−1) | tr (day) |
|---|---|---|---|---|
| Capo d’acqua | 4 | 145 | 0.0074 | 200 |
| San Giovenale | 6 | 380 | 0.0115 | 200 |
Table 6.
Time series analysis parameters: system memory effect, maximum discharge/rainfall cross-correlation coefficient, and time lag for maximum cross-correlation coefficient (Q discharge).
Table 6.
Time series analysis parameters: system memory effect, maximum discharge/rainfall cross-correlation coefficient, and time lag for maximum cross-correlation coefficient (Q discharge).
| Aquifer Spring | Memory Effect (days) | Cross-Correlation Coef. | Time LagSS (days) |
|---|---|---|---|
| Scirca | 80 | 0.24 | 13 |
| Vaccara | 90 | 0.18 | 2 |
| Boschetto | 89 | 0.27 | 2 |
| Capo d’Acqua | 90 | 0.18 | 74 |
| San Giovenale | 150 | 0.18 | 119 |
| Bagnara | 121 | 0.20 | 39 |
Table 7.
Karstification degrees of spring recharge areas according to recession curve parameters, after [15,23].
| Spring | Characteristics of Recession Curve Parameters | Karstification Degree |
|---|---|---|
| Scirca | αb > 0.0043 αc < 0.060 | 3.7 |
| Vaccara | αb = 0.0041 to 0.018 αc = 0.055 to 0.16 | 4.0 |
| Boschetto | αb = 0.0041 to 0.018 αc = 0.055 to 0.16 | 4.0 |
| Bagnara | αb > 0.0043 αc < 0.060 | 3.7 |
| Capo d’Acqua | α > 0.007 | 2.3 |
| San Giovenale | α > 0.007 | 2.3 |
© 2020 by the authors. Licensee MDPI, Basel, Switzerland. This article is an open access article distributed under the terms and conditions of the Creative Commons Attribution (CC BY) license (http://creativecommons.org/licenses/by/4.0/).
Share and Cite
MDPI and ACS Style
Tamburini, A.; Menichetti, M. Groundwater Circulation in Fractured and Karstic Aquifers of the Umbria-Marche Apennine. Water 2020, 12, 1039. https://doi.org/10.3390/w12041039
AMA Style
Tamburini A, Menichetti M. Groundwater Circulation in Fractured and Karstic Aquifers of the Umbria-Marche Apennine. Water. 2020; 12(4):1039. https://doi.org/10.3390/w12041039
Chicago/Turabian StyleTamburini, Andrea, and Marco Menichetti. 2020. "Groundwater Circulation in Fractured and Karstic Aquifers of the Umbria-Marche Apennine" Water 12, no. 4: 1039. https://doi.org/10.3390/w12041039
Note that from the first issue of 2016, this journal uses article numbers instead of page numbers. See further details here.