Hydrological Characterization of Watering Ponds in Rangeland Farms in the Southwest Iberian Peninsula


GeoEnvironmental Research Group, University of Extremadura, 10071 Cáceres, Spain
*
Author to whom correspondence should be addressed.
Water 2020, 12(4), 1038; https://doi.org/10.3390/w12041038
Submission received: 10 January 2020
/
Revised: 7 March 2020
/
Accepted: 2 April 2020
/
Published: 6 April 2020
(This article belongs to the Section Hydrology)
Abstract
:Watering ponds are an important source of drinking water supply for livestock in semi-arid rangelands. Understanding the hydrological functioning of this kind of infrastructures is crucial for efficient water management in areas where water resources are often scarce. In this line, we have analyzed temporal patterns of water availability in a set of watering ponds located in Iberian rangelands and their relationship with temporal rainfall variability. In addition, the effectiveness of the ponds for conserving stored water during dry periods and some influencing factors (pond size and catchment area) have also been assessed. The results showed a high correlation between water availability and precedent rainfall, confirming, on the one hand, the capacity of storage of these infrastructures and, on the other hand, the importance of temporal rainfall patterns in their hydrological behavior. Our findings point to a minimum pond area of 2000 m2 and a catchment area/storage capacity ratio around 100 m−1 in order for watering ponds can face the dry summer period with certain guarantees, at least in regular hydrological years. Nonetheless, the vulnerability shown by the majority of the watering ponds in times of drought limits their usefulness as unique sources of water supply in many farms.
1. Introduction
Water is a key resource in the rangelands of the Iberian Peninsula due to its scarcity. The regular water stress in summertime, induced by the Azores anticyclone, is accompanied by the existence of occasional long dry periods that negatively affect pasture production and water availability for livestock [1,2]. Under these circumstances, farm owners have been forced to adopt different strategies to ensure a continuous supply of water for livestock, such as the drilling of boreholes or the construction of watering ponds [1].
The collection and storage of rainwater (water harvesting) through the construction of small reservoirs has been a technique utilized by farmers for thousands of years, particularly in arid and semi-arid areas, where this form of storing water has been evidenced as crucial for keeping the resilience and sustainability of livestock husbandry [3,4,5,6]. In fact, there is currently a renewed interest in the development of this kind of infrastructure due to its multiple benefits [6,7].
In the particular case of the Iberian Peninsula, the construction of watering ponds for livestock has been an increasing phenomenon in the last decades [8,9]. However, the real effectiveness of these infrastructures remains unknown in terms of their capacity for water storage, particularly in the driest years. The literature on livestock watering ponds has been so far focused on their role in the preservation of biodiversity, neglecting their function as drinking troughs, for which they were actually built [10]. The hydrological functioning of these infrastructures must be understood so that they can be located, designed, and managed properly [11].
The dynamics of water storage in ponds is controlled by the balance between water inputs and outputs. The inputs can come from three sources: (1) direct rainfall onto the pond, (2) water that comes through the surface runoff from both the upstream flow and the area directly drained by the pond along its shore, and (3) subsurface water from both the upstream flow and the area directly drained by the pond along its shore. The outputs include: (1) the outflow to downstream when water is evacuated through the spillway, (2) water consumed by animals, (3) water losses by evaporation, and (4) water losses due to infiltration through both the bed and the dam of the pond. The hydrological processes that regulate these inputs and outputs are those that determine the variability of the water level of the ponds [12].
The hydrological functioning of small water bodies has been a topic widely addressed by the scientific community. Small wetlands and natural temporary ponds are those that have received the most attention [13,14,15,16,17,18,19,20,21,22,23], and there are also numerous works studying artificial ponds used for crop irrigation [24,25,26,27,28,29,30]. In contrast, there are few studies focused on watering ponds for livestock. Authors such as Estrada-Ávalos [31], Duesterhaus et al. [11], and Magliano et al. [32] have analyzed the water dynamics in this type of pond in farms of the north of Mexico, Kansas (USA), and Dry Chaco (Argentina), respectively. However, the hydrological behavior of these infrastructures in Mediterranean areas has not been studied yet (to our knowledge).
Regarding the effectiveness of livestock watering ponds, information is scarce. The United States Department of Agriculture (USDA) published a handbook focused on planning, design, and construction of ponds intended for various uses [33]. This handbook provides some guidelines for the optimum design of these ponds in the USA, including minimum values required for parameters such as the maximum water depth of the ponds or the catchment area, so that the ponds can maintain enough water to meet the use requirements throughout the year. However, few studies have been conducted on livestock watering ponds in real operating situations. Some authors that addressed this issue in semi-arid regions [31,34] found extraordinarily high values of seepage rates (up to 80 mm/day) that led the ponds to keep water only for short periods of time, which questions their usefulness. Nevertheless, these seepage rates contrast to regular values reported for this type of pond, which rarely exceed 5 mm/day [11,35,36]. Therefore, there is limited knowledge about the effectiveness of these ponds operating under normal conditions.
In this study, the structural and functional attributes of a sample of representative livestock watering ponds in the southwest of the Iberian Peninsula and the temporal patterns of their water regime were investigated, with the objectives (1) to determine the influence of temporal rainfall variability on water availability in the ponds; (2) to assess the capacity of the ponds to conserve stored water (i.e., their effectiveness) during the regular dry season and during drought events; (3) to examine the influence of factors such as pond size and catchment area on the effectiveness of the ponds; and (4) to test whether simple analyses, primarily based on precipitation data and aerial photographs available from public sources, can be used reliably in these and other rangeland areas to suggest minimum values for the above factors, which can serve as a guide for the design of watering ponds.
It is expected that the conclusions of this study may be helpful for a better understanding of the hydrological behavior of watering ponds of Iberian rangelands, as well as the factors that determine their efficiency in terms of water supply. It should be useful for farmers when they have to make decisions about the water management of their farms, including planning and design.
2. Materials and Methods
2.1. Study Area
The geographical scope of this research covers the rangelands of the south–west (SW) Iberian Peninsula (Figure 1a), occupying more than six million hectares [37] and mainly grazed by sheep, cattle, and pigs in privately owned farms [38,39]. These rangelands are formed either by treeless natural grasslands or by grasslands with a disperse tree cover and densities that typically vary from 15 to 80 trees/ha [39]. The dominant tree species are the evergreen oaks Quercus ilex var. rotundifolia and Q. suber. Occasionally, a shrub layer is also developed. Tree-covered rangelands are called dehesas and montados in Spanish and Portuguese languages, respectively. At present, livestock rearing is the dominant land use in these areas, although other uses, such as forestry (cork and wood production), agriculture, and hunting, are also found.
Climate of most of rangelands in SW Iberia is Mediterranean, with a humid season from October to May and a very pronounced dry and hot season (July–September), particularly in July and August. Rainfall shows high temporal variability, both annually and inter-annually [41].
Figure 2 shows a typical annual distribution of the monthly amounts of rainfall and reference evapotranspiration for the study area (data correspond to the meteorological station of the city of Cáceres, with mean annual rainfall and reference evapotranspiration of 541 mm and 1451 mm, respectively, for the period from October 1997–September 2018; its geographical location can be consulted in Figure 1b). With an aridity index of 0.37, the climate can be considered semi-arid [42].
For this work, two private farms were selected, representative of the dehesa land use system: Parapuños and La Brava (Table 1; Figure 1b). Both farms share the dominant topographical, lithological, and edaphic characteristics of the rangelands in SW Iberia: gently undulating erosion surfaces, incised by small river channels with periodic discharge, giving rise to increasing slope gradients as approaching major rivers; dominant bedrocks are slates and greywacke, with Leptosols and Cambisols being the dominant soils [44,45]. Research carried out previously in those farms, together with the good relationship established with the landowners, constituted further criteria for selecting those sites.
In each of the study farms, all watering ponds were surveyed using recent aerial photographs, complemented by field examination and farmers’ interviews. A total of seven ponds were identified in Parapuños and 10 in La Brava (Figure 1c,d).
2.2. Rainfall Data
Daily rainfall data for the period October 1997–September 2018 were collected from several meteorological stations in the vicinity of the study farms, belonging to the Spanish Agency for Meteorology (AEMET). Table 2 shows some information about the meteorological stations used in this research. Their geographical locations are shown in Figure 1b. For the farm La Brava, the reference data were provided by the meteorological station Aliseda (La Umbría), meanwhile for the farm Parapuños, the station Monroy was used. Missing data in the daily series of these stations were completed by using simple lineal regressions from the data registered in nearby meteorological stations (auxiliary stations). In all cases, the data collected in the auxiliary stations showed a good correlation with those of the reference stations (Table 2).
The mean values of the total annual rainfall obtained from these datasets were 520 mm in the farm La Brava and 534 mm in the farm Parapuños. Figure 3 represents the monthly rainfall data for the two study areas in the period October 2001–September 2018.
2.3. Water Availability and Maximum Surface and Storage Capacity of the Ponds
Water availability in the ponds was analyzed by using aerial photographs of high resolution (orthophotos) available online from the Spanish National Geographic Information Center (CNIG, [47]) and Google Earth. Aerial images of the study farms were checked for watering ponds, and it was discovered that most of them appear in the images captured since 2002. Therefore, all the images corresponding to both farms were gathered. Table 3 presents the information on resolution, dates, and sources of the images used in this research, and Figure 3 includes the date of each image together with the rainfall data. In all aerial images, the flooded area (A) for each pond was digitized and quantified by using the software packages ArcGIS v10.5 (ESRI) and Google Earth Pro. In addition, the flooded area corresponding to the maximum capacity of each pond (Amax) was also digitized and quantified. The limits of these surfaces were estimated from the aerial images through photointerpretation, identifying previously flooded areas by changes in the hue of the image. As representative variable of water availability in the ponds, the A/Amax ratio, was used.
In order to estimate the maximum volumes of the ponds (Vmax), detailed bathymetries of some of the study ponds were obtained. P4, B6, and B8 ponds were chosen for this purpose, and the topographic surveys were carried out by terrestrial laser scanning for P4 and structure-from-motion photogrammetry [48] for B6 and B8 in late summer, when the ponds had a low water level. Digital elevation models (DEMs) derived from the respective bathymetries were used to calculate the Vmax values for the surveyed ponds, while for the rest of the study ponds (including B8, since it was enlarged in 2019, just before it was surveyed), the Vmax values were estimated from the respective values of Amax, using the following equation:
where V is the storage volume of the pond, expressed in m3, when the flooded area is A (in m2). This relationship was derived by fitting a power function (goodness of fit: R2 = 0.98; p < 0.001) to the V and A data obtained every 10 cm depth from the bathymetries of ponds P4, B6 and B8. This is a commonly used approach when the water bodies share a similar geomorphological context [19,49,50,51,52,53], as in this case.
V = 0.0031 × A1.793,
2.4. Influence of Temporal Rainfall Variability on Water Availability in the Ponds
For each pond, simple linear regression analyses were carried out between the observed A/Amax ratio and antecedent rainfall (P), considering the values corresponding to the dates when the aerial images used in this study were taken. In order to analyze the influence of the temporal scale, the following periods of accumulation for P were considered: from 1 to 12 months (starting from the date of each image and backwards), i.e., a total number of 12 linear regressions were conducted for each pond. For each case, the coefficient of determination (R2) and the statistical significance at three different levels of confidence (p < 0.05, p < 0.01 and p < 0.001) were calculated.
Aimed at characterizing the temporal scale of greatest relevance in the hydrological functioning of each pond, the variable representative rainfall accumulation period (RAPR) was defined. It was determined for each pond through the weighted mean value of the accumulation periods (in months) which show significant correlations (p < 0.05) between the A/Amax ratio and P, using as weighting factors the values of R2 obtained for each accumulation period.
In order to limit the influence of antecedent evapotranspiration on the variability observed in the A/Amax ratio it was decided to consider only those available images that were taken during the summer period (June–September). By doing this, it was assured that precedent conditions regarding evapotranspiration rates were relatively similar for all observations. Only a few images corresponding to the wet season had to be discarded (image of the farm La Brava taken in April 2006 and those of the farm Parapuños taken in March 2003 and April 2006).
2.5. Hydrological Response of Ponds to Droughts
The standard precipitation index (SPI; [54]) is an index widely used to characterize meteorological drought [55,56]. This index was used to identify and characterize drought events from the daily rainfall series of the study sites (Section 2.2). The monthly values of the SPI computed over several timescales (3, 6, 9, and 12 months) were obtained for each of the study sites by using the “SPI Generator” application developed by the National Drought Mitigation Center [57] (Figure 4). The identification and characterization of drought events was carried out according to the criteria proposed by McKee et al. [54], that is: a drought event occurs (for any of the timescales) when the SPI reaches a value of −1 or less; the values of the SPI represent the drought intensity for each month that the event continues, which does not end until the SPI becomes positive; while the positive sum of the SPI values for all months within a drought event can be considered as a proxy of the drought magnitude.
A total number of eight aerial images, among all those collected, were available at moments when a drought event was occurring (Figure 4). The A/Amax ratios observed in the ponds that appear in those images were analyzed, together with the intensity and magnitude of the respective drought events, to assess the hydrological response of watering ponds to drought.
2.6. Influence of Pond Size
The effect of the size of the ponds (Amax) on their hydrological response was analyzed from two different points of view. On the one hand, the relationship between this variable and the effectiveness of the ponds, understood as their capacity to conserve stored water during dry periods, was analyzed. For this purpose, the reliability of the ponds (Rpond), defined as the probability of ponds having enough water to meet the demands [58,59], was used as a proxy of their effectiveness. The following equation, adapted from the one proposed by Baek and Coles [59], was used to calculate the reliability of each of the study ponds:
where NT is the total number of observations of the flooded area (A) made on aerial images taken during summer dates (since the existence of the pond), and Nfailure is the number of such observations for which A = 0.
Rpond = (NT − Nfailure)/NT,
On the other hand, in order to assess how the size of the pond influences its response to the temporal variability of rainfall, the relationship between Amax and RAPR was analyzed.
Additionally, a K-means cluster analysis was performed with the variables RAPR and Rpond aimed at classifying each pond into two homogeneous groups based on their hydrological behavior. It was also checked whether the variable Amax (along with a threshold value to be determined) could be used as a criterion of assignation for the two remaining groups.
2.7. Influence of Catchment Area
The catchment area (Sc) was determined for each pond from digital elevation models (DEMs), with pixel size of 5 m, available online at the CNIG Download Center [47], by using the tool of watershed delimitation of the extension ArcSWAT v2012, embedded in ArcGIS. The influence of this variable on the hydrological response of the ponds was analyzed through the existing relationship between the A/Amax ratio observed in the ponds that appear in a particular image and their corresponding values of the Sc/Vmax ratio. Of the different components of the water balance of the ponds, only the surface and subsurface flows from upstream are influenced by the catchment area. Hence, in order to be able to assess the influence of Sc on the variability observed in the A/Amax ratio, significant water inflows had to take place during a recent period prior to the observations (dates of aerial images). In Iberian rangelands, runoff is highly influenced by antecedent soil moisture conditions and, for runoff to occur in the channels, a considerable amount of antecedent rainfall has to be registered [41,60]. The only images that met such conditions were those taken in March 2003 and April 2006 (Figure 3), but only the latter allowed the analysis of a sufficiently representative number of observations (16 ponds in 2006 vs. 5 ponds in 2003, Table 2). Since Parapuños and La Brava farms registered similar amounts of antecedent rainfall in April 2006, the set formed by all the ponds of both farms was considered for the analysis.
Additionally, a minimum value of the Sc/Vmax ratio was also estimated in order to serve as guidance for assessing the suitability of the ponds from the point of view of their effectiveness. For this, the following approach was applied: the ratio between the capacity of a pond (Vmax) and its catchment area (Sc) can be interpreted as the amount of runoff (expressed in meters) that should be uniformly generated in the catchment for the pond to be filled up (assuming no water losses during the process of filling). From the point of view of the effectiveness of the ponds, the optimal situation would be ponds being capable to store all the runoff water generated during the wet season and reaching their maximum volume at the end of this season. Hence, knowing the annual values of discharge (Dannual) and considering the most discharge is produced during the wet season, it was possible to estimate the corresponding values of the Sc/Vmax ratio which enable the ponds to be filled up by runoff water, using this equation:
where Dannual is expressed in mm and (Sc/Vmax)req in m−1. The values of Dannual used were derived from the discharges recorded in two small experimental catchments located in SW Iberia. One of these catchments (with an area of 99.5 ha) belongs to the Parapuños farm (one of the two study farms of this research), for which annual discharge data were available for a total of 14 hydrological years in the period between 2000 and 2018. The other one (Guadalperalón, with 35.4 ha) is located 5 km south and shows similar characteristics (climate, vegetation, landscape, and land use) to those of Parapuños. The annual discharge data available for the Guadalperalón catchment corresponded to 5 hydrological years in the period between 1991 and 1997. A description of the equipment and methods used to obtain the discharge data can be found in [41,60,61]. Finally, the relationship between the values of (Sc/Vmax)req obtained from Equation (3) and the respective annual rainfall data (Pannual) was analyzed, in order to estimate a minimum reference value of the Sc/Vmax ratio required for the study area.
(Sc/Vmax)req = 1000/Dannual,
2.8. Statistical Analyses
Relationships between the variables were represented graphically using dispersion diagrams, including best fit curves. The significance of differences between groups was determined using the ANOVA test or, in case of non-normality and lacking homoscedasticity of the data, the Mann–Whitney test was applied. All analyses were carried out with the software package IBM SPSS Statistics.
2.9. Uncertainties Considerations
The methodology proposed in this study relies on the assumption that rainfall is the main driver of the pond’s water regime and that the temporal patterns of antecedent rainfall can explain most of the variability observed in the water availability in the ponds. The validity of this assumption was assessed according to the obtained results (Section 3.2). Of course, the rest of the processes involved in the water balance of the ponds also have some influence on their water regime, but this influence was minimized as much as possible (as was the case of evapotranspiration losses; Section 2.4) or was considered to be small enough to not have a significant impact on the results, as was the case of the losses derived from water consumption by livestock and seepage losses. Regarding the former, assuming (conservatively) that ponds are the only source of water supply in the farms, the estimated annual amounts of water ingested by livestock (Table 1) would represent approximately 1.3% and 4.3% of the storage capacity of the ponds (at farm level) in La Brava and Parapuños farms, respectively, which evidence a minor role of these losses in the water balance of the ponds, while the presence of slates provides a highly impermeable bottom to the ponds, ensuring very low seepage losses.
In any case, it should be clarified that it is not the object of this study to quantify or model the different components of the water balance of the ponds, but rather to propose a methodology focused on a single process (precipitation) that can be used in any area, in an affordable way, to provide some reference values of certain key parameters required for proper location and sizing of livestock watering ponds. Some considerations on the applicability of this methodology to other regions are exposed in the discussion section.
On the other hand, the limited availability of data led us to make some simplifications that can generate substantial uncertainties in the results. In particular, Equation (1) was obtained from a small sample of ponds and its application for the calculation of the maximum volume (Vmax) of those ponds not surveyed can lead to considerable errors in this variable. In order to provide some guidance values of the expected error magnitude, the Vmax values for the surveyed ponds derived from their respective bathymetries were compared with those estimated by Equation (1), resulting in differences of +15% (pond P4), −23% (pond B6), and −15 % (pond B8). Therefore, based on the highest of these differences, the repercussions that variations of ±25% on the estimated Vmax values would have on the results, in those analyzes affected by this variable, were evaluated (Section 3.5).
The simplifications used to obtain Equation (3) also constitute another source of uncertainty. The assumption of absence of water losses in the ponds leads to the values of (Sc/Vmax)req obtained by Equation (3) being underestimated. On the other hand, the use of discharge data obtained from other catchments can also lead to a certain degree of uncertainty in this variable, since the catchment area is an important factor that is not taken into account. Nevertheless, this analysis is not intended to provide accurate values of (Sc/Vmax)req, but rather a minimum reference value that complements as far as possible the analysis made from the observations of the A/Amax ratios in the aerial images from 2006. Some additional considerations regarding these simplifications can be found in the discussion section.
3. Results
3.1. Characterization of the Watering Ponds
All the ponds identified in the study farms are man-made, formed by dams built in small river channels with intermittent flow. Commonly, the soil and weathered bedrock were excavated, creating an impermeable bottom for the ponds. Most of the ponds on the study farms have earth dams, except for P3 and B4, which have a concrete wall with a vertical embankment in contact with the water.
Table 4 offers data related with the studied ponds: maximum surface area, capacity, and catchment area. The ponds showed surface areas (at their maximum storage capacity) between 304 and 7946 m2 (mean value: 2503 m2) and estimated capacities between 88 and 30,502 m3 (mean value: 5315 m3). In every case the catchment areas have been maintained in their natural state and vary considerably in size, ranging from 25,300 to 349,162 m2 (mean value: 108,686 m2).
At the farm scale, pond density per km2 was 0.97 in La Brava and 0.88 in Parapuños, occupying a surface area of 0.16% and 0.32% of the total farm area of La Brava and Parapuños, respectively. The total storage capacity at the farm scale was estimated to be approximately 70,000 m3 in La Brava and 20,000 m3 in Parapuños, the equivalent to 7.5 mm and 2.6 mm of uniformly distributed precipitation over each farm, respectively. These values, which only represent 1.4% and 0.5% of annual mean rainfall in each farm, seem to reflect a minor role played by watering ponds in the hydrological balance of the farms.
3.2. Influence of Temporal Rainfall Variability on Water Availability in the Ponds
The coefficients of determination (R2) obtained by linear regressions between the ratio A/Amax and the amount of antecedent rainfall (P) with accumulation periods ranging from 1 to 12 months are presented in Figure 5a. In order to facilitate the interpretation of the results, these are summarized in the table shown in Figure 5b, not including those values of R2 which were not significant (p > 0.05). Additionally, the table rows were ordered depending on size. The level of statistical significance of each regression was also included, as well as the obtained RAPR values for each pond. As examples, Figure 6 presents the scatter plots of the most significant regressions obtained for each pond. The strong correlations obtained for the majority of the ponds confirm rainfall as the principal driving factor of the hydrological regime of watering ponds in the study area.
For the small ponds (Amax < 2000 m2), the highest coefficients of determination were obtained for accumulation periods of P between 2 and 5 months (Figure 5b). This fact suggests water availability in small ponds is fundamentally determined by rainfall occurring in a relatively short period of time before the date of the aerial images. In contrast, for ponds with surface areas larger than 2000 m2, the best fits were obtained for accumulation periods of P in excess of 6 months, indicating that the hydrological behavior of these ponds was influenced mainly by the rainfall occurring throughout the wet period.
3.3. Hydrological Response of Ponds to Droughts
The boxplots of Figure 7 represent the values of the A/Amax ratio observed in the ponds that appear in those images taken during any of the drought events identified in the study sites (Figure 4), together with the intensity and magnitude of such drought events. Most observations made under drought conditions corresponded to the dry season. The only drought event (DE) that was observed during the wet season was the one corresponding to the images of April 2006 (DE 2006-B and DE 2006-P). However, at that time, this drought event was in its terminal phase, with a very low intensity and only noticeable at the 9 and 12 months timescales. The abundant rainfall recorded during the months prior to the observations (Figure 3) would explain the limited impact observed on water availability in the ponds (Figure 7).
Instead, the observations corresponding to the dry season covered a set of drought events of different durations, intensities, and magnitudes, allowing a more significant analysis. A first conclusion derived from the analysis of such observations was that, regardless of the magnitude and intensity of the drought events, low values of the A/Amax ratio were generally observed in the ponds under any of the drought situations, almost always remaining below 0.4. Taking into account that this value of the A/Amax ratio corresponds approximately to a pond filling level (V/Vmax) of 0.2 (according to Equation (1)), these results evidence a high vulnerability of the ponds to drought.
Drought impact on water availability in the ponds was especially noticeable in those observations of late summer (DE 2009P’, DE 2012-B, and DE 2017-B), for which the lowest A/Amax ratios were obtained. In this regard, it is noteworthy that even a small-magnitude drought event, such as the one recorded in 2017, can produce very low pond filling levels at the end of the dry season.
On the other hand, it is also remarkable that all the ponds with a surface area (Amax) of less than 1900 m2 presented A/Amax ratios < 0.4 during drought situations. This fact constitutes a first clue to take into account for establishing a desired minimum size for watering ponds in the study area.
3.4. Influence of Pond Size
In order to determine the influence of pond size (Amax) on the representative rainfall accumulation period (RAPR), a regression analysis was carried out, resulting in a good fit (R2 = 0.722; p < 0.001) to the potential line represented in Figure 8a. All ponds larger than 2000 m2 had RAPR values greater than 7 months (8.2 months on average), whereas representative periods of the small ponds (<2000 m2) were all between 2 and 6 months (4 months on average). Using the pond size of 2000 m2 as grouping criteria, mean values of RAPR of both groups were significantly different (p < 0.001) (Figure 8b).
The regression analysis performed between pond reliability (Rpond) and pond size (Amax) also offered a good fit (R2 = 0.714; p < 0.001) (Figure 9a). The majority of the ponds presented acceptable reliability values (>0.8), but very low values were obtained for the smallest ponds. The comparison between mean values of Rpond grouped according Amax (grouping criteria = 1900 m2) resulted in a significant difference (Figure 9b). Thus, ponds larger than 1900 m2 offered, on average, a reliability of 0.94, whereas the small ones (<1900 m2) presented a mean reliability of 0.72.
Table 5 presents the results of the cluster analysis carried out with the variables RAPR and Rpond. The grouping variable Amax could be successfully applied for classification, pointing to a value of approximately 2000 m2 as the cutoff point for assignment the group.
3.5. Influence of Catchment Area
The relationship between the ratios A/Amax and Sc/Vmax, based on the values observed in the aerial images of 2006, is presented in Figure 10a. Except for the anomalous value of pond P2, high values of water availability were observed in ponds with Sc/Vmax ratios in excess of 90 m−1. Contrarily, ponds with Sc/Vmax ratios of less than 50 m−1 presented significantly lower filling (except for pond B1). The difference between both groups of ponds can be observed in the boxplot of Figure 10b, where the results of the Mann–Whitney test are also presented.
The high A/Amax ratio detected for pond B1 (0.92), despite having a fairly low Sc/Vmax ratio, can be explained by its exceptionally high storage capacity (more than four times higher than the mean of the study ponds; Table 4), which could allow the pond to accumulate water remaining from previous, more rainy years.
On the contrary, pond P2, despite having the highest Sc/Vmax ratio, presented on the same date an A/Amax ratio below 0.4. The small size of this pond and the extraordinarily high extension of its catchment in relation to the pond capacity presumably lead to frequent overflows, impeding the ability to take advantage of all the runoff produced in the contributing basin.
By way of illustration, Figure 10a includes the logarithmic tendency which was obtained in the regression analysis between A/Amax and Sc/Vmax ratios, excluding previously the values corresponding to ponds B1 and P2 (significant at p = 0.002).
Regarding the possible errors associated with the estimation of the maximum volumes of the ponds, an excessive uncertainty was observed for ponds with very high Sc/Vmax ratios (B9 and P2; Figure 10a) but, in general, it remained in acceptable proportions for the regular values of this variable and, in any case, it was compatible with the purpose of the analysis.
Figure 11a presents the annual rainfall and discharge data of the experimental catchments Parapuños and Guadalperalón for 19 hydrological years, which were collected during the period from 1991 to 2018. The relationship between both variables adjusts significantly to an exponential function (R2 = 0.726; p < 0.001). Figure 11b offers the results of the regression analysis between the values of (Sc/Vmax)req, obtained with Equation (3), and annual rainfall for the same hydrological years. A good fit of the data to an exponential function was obtained (R2 = 0.726; p < 0.001). The effect of above and below average annual rainfall on the required Sc/Vmax ratio can be clearly observed in Figure 11b. In the humid years, in which high values of discharges were registered, the obtained values for (Sc/Vmax)req remained below 20 m−1. Hence, during humid years, ponds that have a Sc/Vmax ratio ≥20 m−1 could reach high filling levels at the end of the rainy season. Contrarily, the dry years always presented low discharges (Figure 11a), requiring in most cases Sc/Vmax ratios in excess of 100 m−1 for filling the ponds. For rainfall amounts close to the annual mean values of the study farms (520–534 mm), the results point to required values of the Sc/Vmax ratio between 25 and 50 m−1.
4. Discussion
Watering ponds constitute the principal source of water for livestock in the SW Iberian Peninsula [1]. Most of these ponds consist of small earth dams which collect surface runoff of intermittent streams, with pond sizes that rarely exceed 1 ha [8,9]. These characteristics coincide with those observed in the present study (Table 4) and with livestock watering ponds of other regions [11,31,32,62,63,64]. The limited size of this type of infrastructures and its distribution in various points of the farms are measures that provide greater flexibility in the management of the grazing resources [65]. In the study area, the catchments of the ponds are maintained in their natural untouched state. This feature distinguishes these watering ponds from those of other countries (for example Australia or United States), where it is common to interfere in the catchment aimed at increasing runoff [3,4,65].
The values of pond density observed in this study (approximately 1 pond/km2) are in the order of those reported by Magliano et al. [32] in western Paraguay or by Chumchal et al. [66] in the southeast of the Great Plains (USA). However, studies carried out in other regions observed considerably higher pond densities (e.g., 10.8 ponds/km2 in southern Australia [67]) or much lower values (e.g., 0.1 ponds/km2 in central Argentina [32] and northern Mexico [31]).
Regarding the proportion of the surface of the farms occupied by ponds, values in the range of 0.2–0.3% were observed, in line with those reported by Casas et al. [9], in the southern part of the study area. Downing et al. [68] obtained a high correlation (R2 = 0.8) between the proportion of the surface of the farms occupied by ponds and the mean annual precipitation in various regions of the world. In areas with low rainfall (Pannual between 450 and 650 mm), the equation of the regression curve reported by these authors predicted values in the range of 0.1–0.2%, which are similar to the ones obtained in the present study and by Casas et al. [9] for rangelands in SW Iberia, confirming the primary role played by precipitation in the abundance of this type of infrastructures. These values represent a low presence of ponds on farms, in comparison with values of up to 4% observed by Downing et al. [68] in humid climates.
The high spatial and temporal variability of the hydrological processes in semi-arid areas makes it difficult to study and to model the hydrological response of catchments in these regions [69,70]. In the particular case of SW Iberian Peninsula, various studies carried out in small catchments representative of dehesas [41,60,61] analyzed the influence of rainfall variability on runoff generation. At the event scale, these studies evidenced the importance of antecedent soil moisture conditions on channel flow production. However, at an annual scale, high correlations were obtained between discharge and rainfall (R2 > 0.9; p < 0.001), contrasting strongly dry years with very low runoff coefficients (0.01–0.08), with less frequent humid years which produced high amounts of discharge, with runoff coefficients ranging from 0.12 to 0.23.
In the same line, the strong correlations observed in this study between water availability in the ponds and antecedent rainfall (Figure 5 and Figure 6) confirm rainfall as the principal driving factor of the hydrological regime of watering ponds in the study area. Other studies on small water bodies carried out in arid and semi-arid areas point in the same direction. For example, in a region of central Argentina, Magliano et al. [32] obtained a strong correlation (R2 = 0.86; p < 0.0001) between the magnitude of rainfall events and the water gains of a livestock watering pond. Chamaille-Jammes et al. [71] analyzed the relationship between annual rainfall and water availability in various types of water sources (including natural temporary ponds) in an African savannah (Hwange National Park, Zimbabwe). In 12 of the 24 analyzed ponds, positive and significant correlations (p < 0.05) between rainfall and the presence of water in the ponds were obtained. Castañeda and Herrero [72], in a study carried out in natural salt lakes in Monegros (NE Spain), obtained significant correlations (p < 0.05) between the antecedent rainfall accumulated during a period of 3 and 6 months and the water depths observed in the lakes. However, the reported coefficients of determination (R2) were lower than those obtained in the present study. These differences can be explained by the important role played by groundwater flow in the hydrological functioning of these wetlands [73], in contrast to the ponds analyzed in this study, in which the interaction with groundwater is limited to scarce filtrations which may be produced through the underlying slate bedrock.
The analysis of water availability in ponds in the images taken on dates when there was a drought situation revealed that almost all these ponds presented A/Amax ratios less than 0.4 (i.e., filling levels <20%) (Figure 7). These low levels of water availability in the ponds represent a problematic situation from the point of view of their role as the main water supply for livestock, not only because of the imminent risk of supply failure, but also because water quality generally deteriorates as the water level in the ponds decreases [10,74,75], with the consequent risk to animal health. This high vulnerability to drought observed in the majority of the ponds, together with the high frequency and severity of these events in the SW Iberian Peninsula [76], questions the use of ponds as the only source of water supply in the farms. This conclusion is in agreement with the results obtained by Pulido-Fernández and Schnabel [1] in a study carried out on a large number of extensive livestock farms in the SW Iberian Peninsula, which revealed that two out of every three farms suffered occasional problems with water supply. Although the ponds were the main source of supply, the majority of the ranchers were forced to also use alternative sources during the dry periods, mainly wells.
Moreover, it has been demonstrated that the size of the ponds and their catchment area constitute crucial factors in the effectiveness of these infrastructures in the study farms. The analyses carried out at sub-annual timescales revealed that the accumulation periods (AP) of antecedent rainfall that best explained the hydrological response of the ponds depend largely on pond size (Figure 5b and Figure 8). While water availability in small ponds was more influenced by AP between 2 and 5 months, the hydrological response of large ponds was more strongly determined by AP in excess of 6 months. These results have important implications on the effectiveness of the ponds. Since the dry season in the study area usually lasts for more than 3 to 4 months, it is expected that the smallest ponds will reach very low water levels (or dry out) at the end of the summer, regardless of rainfall occurring in the previous months. The low values of reliability observed in these ponds (Figure 9) support this supposition. Instead, large ponds could remain operational throughout the dry season, if it rains enough during the humid season. The aerial images taken in August 2010 permitted a contrast to these conclusions, since rainfall during the previous humid season was abundant and the summer was particularly dry. Indeed, despite the abundant rainfall registered during the humid season, all the ponds with a surface area of less than 2000 m2 presented values of the A/Amax ratio below 0.4, while the majority of the ponds larger than 2000 m2 had A/Amax ratios in excess of 0.4. The exceptions to the latter were ponds B7, P3, and P5, whose relatively low Sc/Vmax ratios could explain the low values of water availability observed in these cases.
The different analyses carried out (Table 5; Figure 5b, Figure 8 and Figure 9) point to a minimum Amax value of about 2000 m2 in order to secure water availability in the ponds during the dry season in the study area, at least in normal rainfall years. According to the pond’s bathymetries performed for this study, an Amax of 2000 m2 corresponds to a maximum depth of the ponds between 2.5 and 3.4 meters. These values match approximately those recommended by the USDA for ponds in areas of the USA with mean annual rainfall amounts in the range of 500–600 mm [33].
The catchment area is a determining factor in the amount of rainfall collected by the ponds [12], which was confirmed by the obtained relationship between water availability in the ponds (A/Amax) and the Sc/Vmax ratio (Figure 10a). Thus, this factor was also expected to have an outstanding influence on the capacity of the ponds to maintain water during the dry season. In this regard, an analysis based on annual rainfall and discharge data recorded in experimental catchments pointed to required Sc/Vmax ratios between 25 and 50 m−1 for normal rainfall years (Figure 11b). However, the data presented in Figure 10, derived from the analysis of the aerial images of 2006 (taken at the end of the humid season of a normal rainfall year), suggest required values of the Sc/Vmax ratio between 50 and 100 m−1. These differences between the results obtained by both approaches were expected, since Equation (3) was derived under the assumption of absence of water losses in the ponds (evaporation, filtrations, and overflows), which leads to the values of (Sc/Vmax)req obtained by Equation (3) being underestimated. On the other hand, considering that in the study area dry years are more frequent than humid ones [60], it would be advisable for Sc/Vmax ratios to be around 100 m−1. The USDA handbook [33] recommends somewhat lower values of this ratio (25–50 m−1) for areas in the USA with mean annual rainfall amounts in the order of 500–600 mm. These differences are reasonable, considering that the required Sc/Vmax ratios highly depend on the peculiarities of the catchments’ hydrological behaviors in each region.
Another limitation of the calculation of the (Sc/Vmax) req by means of Equation (3) is that it does not take into account the water volumes that may remain in the ponds at the end of the dry season. Contrary to water losses in the ponds, the accumulation of the remaining water from previous years would result in a reduction of the required Sc/Vmax ratio. This effect could be particularly significant in the largest ponds, which rarely dry totally (Figure 9). In fact, this may possibly be the reason for the anomalous value of the A/Amax ratio observed for pond B1 (the largest study pond) in Figure 10a. This effect could also be appreciated, although less clearly, for pond B2, the second in size, with an estimated volume of more than twice the mean of the investigated ponds. Despite having the lowest Sc/Vmax ratio, pond B2 presented a relatively high A/Amax value (close to 0.7; Figure 10a).
The influence of the catchment area on pond effectiveness was also observed in the anomalous behavior of some ponds which, regarding their size, should have presented reliability values different than those observed (Figure 9). For example, the only pond with an Amax > 2000 m2 that presented a reliability smaller than 0.8 was B3, which has a very low Sc/Vmax ratio (5 m–1) in comparison to the rest of the ponds. Worth noting are the cases of ponds P1, P4, and P6, which presented high reliability values, although their sizes were smaller than 2000 m2. These anomalies could be explained by the high Sc/Vmax ratios of these ponds (118, 162, and 112 m–1, respectively), that would allow them not only to reach the start of the dry season with a high filling level (as observed, for example, in 2006; Figure 10a), but also to take advantage more efficiently of the small amounts of runoff that could be generated during the summer. This could also be the cause of the relatively good performance under drought conditions that was observed in ponds P1 and P4 (these were the only ponds in which values of the A/Amax ratio above 0.4 were observed while summer drought events were occurring; Figure 7).
4.1. Applicability to Other Regions
Although the values proposed in this study for the desirable size of the ponds and their catchment areas are referred to rangeland areas of SW Iberia, the methods used to estimate these values can be applied to other regions. The necessary inputs (basically: daily precipitation data, orthophotos, and DEMs/cartographies of the pond catchments) are usually easy to obtain, which makes this a particularly suitable procedure in areas with data scarcity.
Obtaining the maximum volumes of the ponds (Vmax) would require some field data (pond bathymetries), unless a regional V–A relationship for ponds is available, but this variable is only necessary for the analysis of the required catchment area (Section 2.7). Lacking such data, an alternative analysis to that shown in Figure 10 could be applied, using the Sc/Amax ratio instead of the Sc/Vmax ratio. On the other hand, the few aerial images available in this study for the analysis of the required catchment area (only the 2006 images allowed a significant analysis; Section 2.7) led us to develop a complementary analysis (Figure 11), based on field-recorded discharge data, in order to support the conclusions derived from Figure 10, but this analysis would not have been necessary if a larger number of aerial images (or more ponds photographed on the same date) had been available.
In any case, some considerations should be taken into account if these methods were to be applied to other regions. Firstly, a basic premise in this study was that the antecedent rainfall can explain most of the variability observed in water availability in the ponds. Although this hypothesis must be validated through high (and statistically significant) correlations between the A/Amax ratios observed in the ponds and the antecedent rainfall, it is expected to be applicable to other regions with a climate comparable to that of SW Iberia, provided that the influence of the rest of the factors can be minimized. In this regard, using only the aerial images corresponding to a same season can be a way of ensuring relatively similar antecedent evapotranspiration rates for all observations, thus limiting the influence of this process on the results.
Regarding the losses associated with water consumption by animals, it should be verified that these represent a minor component in the water balance of the ponds. The small annual amounts of water ingested by livestock that were estimated in our study case (Section 2.9) are in line with the data reported by other studies, in which these losses did not account for more than 3% of the total losses from the ponds [11,31].
A similar consideration can be made in respect to seepage losses. Although in this type of infrastructure seepage losses are usually considered to be small relative to other inputs and outputs [35,36,77], some studies revealed cases in which seepage was the main loss of the ponds [31,34]. Therefore, the assumption of small seepage losses should be carefully checked for each case.
4.2. Future Research
The obtained results give rise to future research which tackles more thoroughly the hydrological dynamics of livestock watering ponds in the study area. For example, the hydrological modeling of ponds and their catchments would allow establishment in a more reliable way the combinations of Amax and the Sc/Vmax ratio that would optimize the efficiency of these infrastructures, taking into account, not only the historical climate series, but also climate projections for different climate change scenarios. Furthermore, continuous monitoring of both the water level in the ponds and the climatic variables at a local scale would allow analysis in more detail of the other components of the hydrological balance of the ponds which were not considered in this study. In this sense, water losses produced by evapotranspiration, seepage, and consumption by livestock are of particular interest.
5. Conclusions
The high correlations observed in this study between water availability in the ponds and the antecedent rainfall point to precipitation as the main driving factor of the hydrological regime of livestock watering ponds. The accumulation periods of antecedent rainfall that best explained the hydrological response of the ponds depended largely on their size. While water availability in the small ponds (<2000 m2) was greatly influenced by rainfall accumulation periods between 2 and 5 months, in the large ones (>2000 m2), the best correlations were obtained for rainfall accumulation periods in excess of 6 months, evidencing that the hydrological behavior of the latter was influenced by rainfall that occurred during the whole humid season.
The size of the ponds and the surface area of their catchments have also proven to be key factors in the effectiveness of the watering ponds. In this sense, the obtained results suggest that for an adequate exploitation of ponds aimed at supplying drinking water for livestock, these should not only be designed with a minimum dimension (approximately 2000 m2 in the study area), but should also be located in places where their catchments have sufficient extension so that the ponds can reach a filling level that guarantees water supply during the summer dry season. For the study area and during normal hydrological years, the data suggest a required value of the Sc/Vmax ratio of approximately 100 m−1.
Under conditions of rainfall scarcity, the majority of the ponds presented critical levels of water availability, evidencing a high vulnerability to droughts. In view of this result, it is clear that relying exclusively on watering ponds as water supply system on farms would pose a risk.
Author Contributions
Conceptualization, U.M.-C., S.S., M.P.-F.; methodology, U.M.-C., S.S., M.P.-F.; software, U.M.-C.; validation, S.S., U.M.-C.; formal analysis, U.M.-C., S.S.; writing—original draft preparation, U.M.-C.; writing—review and editing, S.S.; supervision, S.S.; funding acquisition, M.P.-F., S.S. All authors have read and agreed to the published version of the manuscript.
Funding
This work has been financially supported by the Research Project IB16052 “Desarrollo de un sistema de evaluación integral espacialmente distribuido para explotaciones de ganadería extensiva” funded by Junta de Extremadura (Regional Government of Extremadura) and the European Fund of Regional Development (European Union).
Acknowledgments
The authors would like to give especial thanks to Manuel Sánchez Fernández, Álvaro Gómez Gutiérrez, and Alberto Alfonso Torreño for helping us to do the bathymetries of the ponds and the maps of geographical locations.
Conflicts of Interest
The authors declare no conflict of interest.
References
- Pulido-Fernández, M.; Schnabel, S. La disponibilidad de agua en explotaciones de ganadería extensiva. In Aportaciones a la Geografía Física de Extremadura con especial referencia a las dehesas; Schnabel, S., Lavado-Contador, F., Gómez-Gutiérrez, A., García-Marín, R., Eds.; Fundicotex: Cáceres, Spain, 2010; pp. 221–235. [Google Scholar]
- Lozano-Parra, J.; Maneta, M.P.; Schnabel, S. Climate and topographic controls on simulated pasture production in a semiarid Mediterranean watershed with scattered tree cover. Hydrol. Earth Syst. Sci. 2014, 18, 1439–1456. [Google Scholar] [CrossRef] [Green Version]
- Frasier, G.W. Harvesting water for agricultural, wildlife and domestic uses. J. Soil Water Conserv. 1980, 35, 125–128. [Google Scholar]
- Boers, T.M.; Benasher, J. A review of rainwater harvesting. Agric. Water Manag. 1982, 5, 145–158. [Google Scholar] [CrossRef]
- Lasage, R.; Verburg, P.H. Evaluation of small scale water harvesting techniques for semi-arid environments. J. Arid Environ. 2015, 118, 48–57. [Google Scholar] [CrossRef]
- Ayantunde, A.A.; Cofie, O.; Barron, J. Multiple uses of small reservoirs in crop-livestock agro-ecosystems of Volta basin: Implications for livestock management. Agric. Water Manag. 2018, 204, 81–90. [Google Scholar] [CrossRef]
- Van der Zaag, P.; Gupta, J. Scale issues in the governance of water storage projects. Water Resour. Res. 2008, 44. [Google Scholar] [CrossRef]
- Camacho, J.; Sánchez, E.; Aguilar, F.; Gómez, A.; Lozano, A. Manual práctico de balsas agrícolas. Diseño y gestión para su mejora ambiental; Agencia Andaluza del Agua. Conserjería de Medio Ambiente. Junta de Andalucía: Sevilla, Spain, 2011. [Google Scholar]
- Casas, J.; Toja, J.; Bonachela, S.; Fuentes, F.; Gallego, I.; Juan, M.; Leon, D.; Penalver, P.; Perez, C.; Sanchez, P. Artificial ponds in a Mediterranean region (Andalusia, southern Spain): Agricultural and environmental issues. Water Environ. J. 2011, 25, 308–317. [Google Scholar] [CrossRef]
- Canals, R.M.; Ferrer, V.; Iriarte, A.; Cárcamo, S.; Emeterio, L.S.; Villanueva, E. Emerging conflicts for the environmental use of water in high-valuable rangelands. Can livestock water ponds be managed as artificial wetlands for amphibians? Ecol. Eng. 2011, 37, 1443–1452. [Google Scholar] [CrossRef]
- Duesterhaus, J.L.; Ham, J.M.; Owensby, C.E.; Murphy, J.T. Water balance of a stock-watering pond in the Flint Hills of Kansas. Rangeland Ecol. Manag. 2008, 61, 329–338. [Google Scholar] [CrossRef]
- Hayashi, M.; van der Kamp, G. Water level changes in ponds and lakes: The hydrological processes. In Plant Disturbance Ecology. The Process and the Response; Johnson, E.A., Miyanishi, K., Eds.; Academic Press: San Diego, CA, USA, 2007; pp. 311–339. [Google Scholar]
- Manson, P.W.; Schwartz, G.M.; Allred, E.R. Some aspects of the hydrology of ponds and small lakes; Technical Bulletin 257; Agricultural Experiment Station, University of Minnesota: Saint Paul, MN, USA, 1968. [Google Scholar]
- Hayashi, M.; van der Kamp, G.; Rudolph, D.L. Water and solute transfer between a prairie wetland and adjacent uplands, 1. Water balance. J. Hydrol. 1998, 207, 42–55. [Google Scholar] [CrossRef]
- Pyke, C.R. Simulating vernal pool hydrologic regimes for two locations in California, USA. Ecol. Model. 2004, 173, 109–127. [Google Scholar] [CrossRef]
- Porphyre, T.; Bicout, D.J.; Sabatier, P. Modelling the abundance of mosquito vectors versus flooding dynamics. Ecol. Model. 2005, 183, 173–181. [Google Scholar] [CrossRef]
- Hill, A.J.; Neary, V.S.; Morgan, K.L. Hydrologic modeling as a development tool for HGM functional assessment models. Wetlands 2006, 26, 161–180. [Google Scholar] [CrossRef]
- Boone, R.B.; Johnson, C.M.; Johnson, L.B. Simulating vernal pool hydrology in central Minnesota, USA. Wetlands 2006, 26, 581–592. [Google Scholar] [CrossRef]
- Soti, V.; Puech, C.; Lo Seen, D.; Bertran, A.; Vignolles, C.; Mondet, B.; Dessay, N.; Tran, A. The potential for remote sensing and hydrologic modelling to assess the spatio-temporal dynamics of ponds in the Ferlo Region (Senegal). Hydrol. Earth Sys. Sci. 2010, 14, 1449–1464. [Google Scholar] [CrossRef] [Green Version]
- Garmendia, A.; Pedrola-Monfort, J. Simulation model comparing the hydroperiod of temporary ponds with different shapes. Limnetica 2010, 29, 145–152. [Google Scholar]
- Huang, S.; Young, C.; Abdul-Aziz, O.I.; Dahal, D.; Feng, M.; Liu, S. Simulating the water budget of a Prairie Potholes complex from LiDAR and hydrological models in North Dakota, USA. Hydrol. Sci. J. 2013, 58, 1434–1444. [Google Scholar] [CrossRef] [Green Version]
- Asare, E.O.; Tompkins, A.M.; Bomblies, A. A Regional Model for Malaria Vector Developmental Habitats Evaluated Using Explicit, Pond-Resolving Surface Hydrology Simulations. PLoS ONE 2016, 11. [Google Scholar] [CrossRef] [Green Version]
- Noorduijn, S.L.; Hayashi, M.; Mohammed, G.A.; Mohammed, A.A. A Coupled Soil Water Balance Model for Simulating Depression-Focused Groundwater Recharge. Vadose Zone J. 2018, 17. [Google Scholar] [CrossRef] [Green Version]
- Fox, P.; Rockstrom, J. Supplemental irrigation for dry-spell mitigation of rainfed agriculture in the Sahel. Agric. Water Manag. 2003, 61, 29–50. [Google Scholar] [CrossRef]
- Ngigi, S.N.; Savenije, H.H.G.; Thome, J.N.; Rockstrom, J.; de Vries, F. Agro-hydrological evaluation of on-farm rainwater storage systems for supplemental irrigation in Laikipia district, Kenya. Agric. Water Manag. 2005, 73, 21–41. [Google Scholar] [CrossRef]
- Li, Q.F.; Gowing, J. A daily water balance modelling approach for simulating performance of tank-based irrigation systems. Water Resour. Manag. 2005, 19, 211–231. [Google Scholar] [CrossRef]
- Panigrahi, B.; Panda, S.N.; Mal, B.C. Rainwater conservation and recycling by optimal size on-farm reservoir. Resour. Conserv. Recyc. 2007, 50, 459–474. [Google Scholar] [CrossRef]
- Moges, G.; Hengsdijk, H.; Jansen, H.C. Review and quantitative assessment of ex situ household rainwater harvesting systems in Ethiopia. Agric. Water Manag. 2011, 98, 1215–1227. [Google Scholar] [CrossRef]
- Carvajal, F.; Agüera, F.; Sánchez-Hermosilla, J. Water balance in artificial on-farm agricultural water reservoirs for the irrigation of intensive greenhouse crops. Agric. Water Manag. 2014, 131, 146–155. [Google Scholar] [CrossRef]
- Ouyang, Y.; Paz, J.O.; Feng, G.; Read, J.J.; Adeli, A.; Jenkins, J.N. A Model to Estimate Hydrological Processes and Water Budget in an Irrigation Farm Pond. Water Resour. Manag. 2017, 31, 2225–2241. [Google Scholar] [CrossRef]
- Estrada-Ávalos, J. Importance et fonctionnement des petits barrages dans une zone semi-aride du Nord-Mexique. Ph.D. Thesis, University of Montpellier, Montpellier, France, 1999. [Google Scholar]
- Magliano, P.N.; Murray, F.; Baldi, G.; Aurand, S.; Paez, R.A.; Harder, W.; Jobbagy, E.G. Rainwater harvesting in Dry Chaco: Regional distribution and local water balance. J. Arid Environ. 2015, 123, 93–102. [Google Scholar] [CrossRef] [Green Version]
- Deal, C.; Edwards, J.L.; Pellmann, N.; Tuttle, R.; Woodward, D. Ponds — Planning, Design, Construction; Agriculture Handbook Nº 590; United States Department of Agriculture (USDA), Natural Resources Conservation Service (NRCS): Washington, DC, USA, 1997.
- Masike, S. The impacts of climate change on cattle water demand and supply in Khurutshe, Botswana. Ph.D. Thesis, International Global Change Institute (IGCI), University of Waikato, Hamilton, New Zealand, 2007. [Google Scholar]
- Fowler, K.; Morden, R.; Lowe, L.; Nathan, R. Advances in assessing the impact of hillside farm dams on streamflow. Australas. J. Water Resour. 2015, 19, 96–108. [Google Scholar] [CrossRef]
- Habets, F.; Molenat, J.; Carluer, N.; Douez, O.; Leenhardt, D. The cumulative impacts of small reservoirs on hydrology: A review. Sci. Total Environ. 2018, 643, 850–867. [Google Scholar] [CrossRef] [Green Version]
- Joffre, R.; Rambal, S.; Ratte, J.P. The dehesa system of southern Spain and Portugal as a natural ecosystem mimic. Agrofor. Sys. 1999, 45, 57–79. [Google Scholar] [CrossRef]
- Plieninger, T.; Pulido, F.J.; Schaich, H. Effects of land-use and landscape structure on holm oak recruitment and regeneration at farm level in Quercus ilex L. dehesas. J. Arid Environ. 2004, 57, 345–364. [Google Scholar] [CrossRef]
- Campos, P.; Carranza, J.; Coleto, J.M.; Díaz, M.; Diéguez, E.; Escudero, A.; Ezquerra, F.J.; López, L.; Fernández, P.; Montero, G.; et al. Libro verde de la dehesa. Available online: https://www.researchgate.net/publication/229812274_Libro_Verde_de_la_Dehesa/link/551333600cf283ee0833738e/download (accessed on 31 October 2019).
- Plieninger, T.; Hartel, T.; Martin-Lopez, B.; Beaufoy, G.; Bergmeier, E.; Kirby, K.; Montero, M.J.; Moreno, G.; Oteros-Rozas, E.; Van Uytvanck, J. Wood-pastures of Europe: Geographic coverage, social-ecological values, conservation management, and policy implications. Biol. Conserv. 2015, 190, 70–79. [Google Scholar] [CrossRef]
- Schnabel, S.; Gómez-Gutiérrez, A. The role of interannual rainfall variability on runoff generation in a small dry sub-humid watershed with disperse tree cover. Cuadernos de Investigación Geográfica 2013, 39. [Google Scholar] [CrossRef] [Green Version]
- UNEP. World Atlas of Desertification, 1st ed.; Middleton, N., Thomas, D.S.G., Eds.; Edward Arnold: London, UK, 1992. [Google Scholar]
- Allen, R.G.; Pereira, L.S.; Raes, D.; Smith, M. Crop. evapotranspiration: Guidelines for computing crop water requirements; FAO Irrigation and drainage paper nº 56; Food and Agriculture Organization of the United Nations (FAO): Rome, Italy, 1998. [Google Scholar]
- Pulido-Fernández, M.; Schnabel, S.; Lavado-Contador, F.J.; Miralles-Mellado, I.; Ortega-Perez, R. Soil organic matter of Iberian open woodland rangelands as influenced by vegetation cover and land management. Catena 2013, 109, 13–24. [Google Scholar] [CrossRef]
- Schnabel, S.; Dahlgren, R.A.; Moreno-Marcos, G. Soil and Water Dynamics. In Mediterranean Oak Woodland Working Landscapes: Dehesas of Spain and Ranchlands of California; Campos, P., Huntsinger, L., Oviedo Pro, J.L., Starrs, P.F., Diaz, M., Standiford, R.B., Montero, G., Eds.; Springer: Dordrecht, The Netherlands, 2013; pp. 91–121. [Google Scholar]
- Luke, G.J. Consumption of water by livestock; Resource Management Technical Report No. 60; Department of Agriculture and Food, Government of Western Australia: Perth, Australia, 1987.
- CNIG. Centro de descargas del Centro Nacional de Información Geográfica (CNIG), Ministerio de Fomento, Gobernment of Spain. Available online: https://centrodedescargas.cnig.es/CentroDescargas/index.jsp (accessed on 1 December 2019).
- Westoby, M.J.; Brasington, J.; Glasser, N.F.; Hambrey, M.J.; Reynolds, J.M. ‘Structure-from-Motion’ photogrammetry: A low-cost, effective tool for geoscience applications. Geomorphol. 2012, 179, 300–314. [Google Scholar] [CrossRef] [Green Version]
- Liebe, J.R.; van de Giesen, N.; Andreini, M.; Walter, M.T.; Steenhuis, T.S. Determining watershed response in data poor environments with remotely sensed small reservoirs as runoff gauges. Water Resour. Res. 2009, 45. [Google Scholar] [CrossRef] [Green Version]
- Annor, F.O.; van de Giesen, N.; Liebe, J.; van de Zaag, P.; Tilmant, A.; Odai, S.N. Delineation of small reservoirs using radar imagery in a semi-arid environment: A case study in the upper east region of Ghana. Phys. Chem. Earth 2009, 34, 309–315. [Google Scholar] [CrossRef] [Green Version]
- Huang, S.L.; Young, C.; Feng, M.; Heidemann, K.; Cushing, M.; Mushet, D.M.; Liu, S.G. Demonstration of a conceptual model for using LiDAR to improve the estimation of floodwater mitigation potential of Prairie Pothole Region wetlands. J. Hydrol. 2011, 405, 417–426. [Google Scholar] [CrossRef] [Green Version]
- Rodrigues, L.N.; Sano, E.E.; Steenhuis, T.S.; Passo, D.P. Estimation of Small Reservoir Storage Capacities with Remote Sensing in the Brazilian Savannah Region. Water Resour. Manag. 2012, 26, 873–882. [Google Scholar] [CrossRef]
- Gal, L.; Grippa, M.; Hiernaux, P.; Peugeot, C.; Mougin, E.; Kergoat, L. Changes in lakes water volume and runoff over ungauged Sahelian watersheds. J. Hydrol. 2016, 540, 1176–1188. [Google Scholar] [CrossRef]
- McKee, T.B.; Doesken, N.J.; Kleist, J. The relationship of drought frequency and duration to time scales. In Proceedings of the 8th Conference on Applied Climatology, Anaheim, CA, USA, 17–22 January 1993. [Google Scholar]
- Svoboda, M.; Hayes, M.; Wood, D. Standardized Precipitation Index User Guide; WMO-No. 1090; World Meteorological Organization: Geneva, Switzerland, 2012. [Google Scholar]
- Van Loon, A.F. Hydrological drought explained. Wiley Interdiscip. Rev.-Water 2015, 2, 359–392. [Google Scholar] [CrossRef]
- NDMC. SPI Program. Available online: https://drought.unl.edu/droughtmonitoring/SPI/SPIProgram.aspx (accessed on 1 March 2020).
- Khastagir, A.; Jayasuriya, N. Optimal sizing of rain water tanks for domestic water conservation. J. Hydrol. 2010, 381, 181–188. [Google Scholar] [CrossRef]
- Baek, C.W.; Coles, N.A. Defining reliability for rainwater harvesting systems. In Proceedings of the 19th International Congress on Modelling and Simulation (Modsim2011), Perth, Australia, 12–16 December 2011. [Google Scholar]
- Ceballos, A.; Schnabel, S. Hydrological behaviour of a small catchment in the dehesa landuse system (Extremadura, SW Spain). J. Hydrol. 1998, 210, 146–160. [Google Scholar] [CrossRef]
- Schnabel, S.; Lozano-Parra, J.; Gomez-Gutierrez, A.; Alfonso-Torreno, A. Hydrological dynamics in a small catchment with silvopastoral land use in SW Spain. Cuadernos de Investigacion Geografica 2018, 44, 557–580. [Google Scholar] [CrossRef] [Green Version]
- Mati, B.M.; Muchiri, J.M.; Njenga, K.; Penning de Vries, F.; Merrey, D.J. Assessing water availability under pastoral livestock systems in drought-prone Isiolo District, Kenya; Working Paper 106; International Water Management Institute (IWMI): Colombo, Sri Lanka, 2005. [Google Scholar]
- Nathan, R.; Lowe, L. The hydrologic impacts of farm dams. Austral. J. Water Resour. 2012, 16, 75–83. [Google Scholar]
- Bichsel, D.; De Marco, P.; Bispo, A.A.; Ilg, C.; Dias-Silva, K.; Vieira, T.B.; Correa, C.C.; Oertli, B. Water quality of rural ponds in the extensive agricultural landscape of the Cerrado (Brazil). Limnology 2016, 17, 239–246. [Google Scholar] [CrossRef]
- Pallas, P. Water for animals; Food and Agriculture Organization of the United Nations (FAO): Rome, Italy, 1986. [Google Scholar]
- Chumchal, M.M.; Drenner, R.W.; Adams, K.J. Abundance and size distribution of permanent and temporary farm ponds in the southeastern Great Plains. Inland Waters 2016, 6, 258–264. [Google Scholar] [CrossRef] [Green Version]
- Nathan, R.; Morden, R.; Jordan, P. Assessing the impact of farm dams on streamflows, Part I: Development of simulation tools. Austral. J. Water Resour. 2005, 9, 1–12. [Google Scholar] [CrossRef]
- Downing, J.A.; Prairie, Y.T.; Cole, J.J.; Duarte, C.M.; Tranvik, L.J.; Striegl, R.G.; McDowell, W.H.; Kortelainen, P.; Caraco, N.F.; Melack, J.M.; et al. The global abundance and size distribution of lakes, ponds, and impoundments. Limnol. Oceanogr. 2006, 51, 2388–2397. [Google Scholar] [CrossRef] [Green Version]
- Pilgrim, D.H.; Chapman, T.G.; Doran, D.G. Problems of Rainfall-Runoff Modeling in Arid and Semiarid Regions. Hydrol. Sci. J.-J. Des. Sci. Hydrol. 1988, 33, 379–400. [Google Scholar] [CrossRef]
- Beven, K. Runoff generation in semi-arid areas. In Dryland rivers: Hydrology and geomorphology of semi-arid channels; Bull, L.J., Kirkby, M.J., Eds.; John Wiley & Sons: New York, NY, USA, 2002; pp. 57–105. [Google Scholar]
- Chamaille-Jammes, S.; Fritz, H.; Murindagomo, F. Climate-driven fluctuations in surface-water availability and the buffering role of artificial pumping in an African savanna: Potential implication for herbivore dynamics. Austral. Ecol. 2007, 32, 740–748. [Google Scholar] [CrossRef]
- Castañeda, C.; Herrero, J. The water regime of the Monegros playa-lakes as established from ground and satellite data. J. Hydrol. 2005, 310, 95–110. [Google Scholar] [CrossRef] [Green Version]
- Castañeda, C.; Garcia-Vera, M.A. Water balance in the playa-lakes of an arid environment, Monegros, NE Spain. Hydrogeol. J. 2008, 16, 87–102. [Google Scholar] [CrossRef] [Green Version]
- Farmer, D.; Coles, N. Assessing storage reliability of farm dams; Resource Management Technical Report no. 245; Department of Agriculture and Food, Government of Western Australia: Perth, Australia, 2003.
- Mosley, L.M. Drought impacts on the water quality of freshwater systems; review and integration. Earth-Sci. Rev. 2015, 140, 203–214. [Google Scholar] [CrossRef]
- Dominguez-Castro, F.; Vicente-Serrano, S.M.; Tomas-Burguera, M.; Pena-Gallardo, M.; Begueria, S.; El Kenawy, A.; Luna, Y.; Morata, A. High spatial resolution climatology of drought events for Spain: 1961–2014. Internat. J. Climatol. 2019, 39, 5046–5062. [Google Scholar] [CrossRef]
- Hughes, D.A.; Mantel, S.K. Estimating the uncertainty in simulating the impacts of small farm dams on streamflow regimes in South Africa. Hydrol. Sci. J.-J. Des. Sci. Hydrol. 2010, 55, 578–592. [Google Scholar] [CrossRef]
Figure 1.
(a) Approximate extension of rangelands in south–west Iberia (based on [40]); (b) Location of the study farms and the meteorological stations; and location of the watering ponds in the farms La Brava (c) and Parapuños (d).
Figure 1.
(a) Approximate extension of rangelands in south–west Iberia (based on [40]); (b) Location of the study farms and the meteorological stations; and location of the watering ponds in the farms La Brava (c) and Parapuños (d).

Figure 2.
Annual distribution of mean monthly rainfall and reference evapotranspiration (ET0) in the city of Cáceres for the period October 1997–September 2018 (data provided by the Spanish Agency for Meteorology, AEMET). ET0 was calculated using daily data based on the modified Penman–Monteith equation as described in the FAO-56 Manual [43].

Figure 3.
Monthly rainfall for the farms La Brava (a) and Parapuños (b) in the period October 2001–September 2018. The vertical red lines mark the dates in which the aerial images used in this study were taken.
Figure 3.
Monthly rainfall for the farms La Brava (a) and Parapuños (b) in the period October 2001–September 2018. The vertical red lines mark the dates in which the aerial images used in this study were taken.

Figure 4.
Monthly standard precipitation index (SPI) values computed over 3, 6, 9, and 12 month timescales for the farms La Brava (a) and Parapuños (b) in the period September 2001–September 2018. The vertical pointed lines mark the dates in which the aerial images used in this study were taken. The drought events (DE) matching such dates are indicated.

Figure 5.
Coefficients of determination (R2) obtained by linear regression analyses between the ratio A/Amax and antecedent precipitation for different accumulation periods (1–12 months) (a and b) and levels of statistical significance (b): * (p < 0.05); ** (p < 0.01); *** (p < 0.001). Figure (b) also includes the obtained RAPR values for each pond.

Figure 6.
Results of the linear regression analyses between the A/Amax ratios observed in each pond and the corresponding antecedent rainfall (P). Selected are the relations for which the accumulation period of P (AP) presented the highest correlation for each of the ponds.
Figure 6.
Results of the linear regression analyses between the A/Amax ratios observed in each pond and the corresponding antecedent rainfall (P). Selected are the relations for which the accumulation period of P (AP) presented the highest correlation for each of the ponds.

Figure 7.
Boxplot of mean (symbol x) and quartiles of the observed A/Amax ratios in the study ponds. Each box corresponds to each of the aerial images that were taken during drought events (DE’s). The intensity and magnitude of such DE’s, corresponding to the observation dates and computed over several timescales, are also indicated (drought magnitude was calculated through the positive sum of the SPI values for all months from the beginning of the drought event until the observation date). Empty cells indicate that, for the corresponding timescale, no drought event was occurring on the observation date.

Figure 8.
(a) Relationship between the representative rainfall accumulation period (RAPR) and the size of the ponds (Amax); (b) Boxplot showing mean (symbol x) and quartiles of RAPR grouped according Amax. The values of F and p of the ANOVA test are also included.
Figure 8.
(a) Relationship between the representative rainfall accumulation period (RAPR) and the size of the ponds (Amax); (b) Boxplot showing mean (symbol x) and quartiles of RAPR grouped according Amax. The values of F and p of the ANOVA test are also included.

Figure 9.
(a) Relationship between reliability (Rpond) and the size of the ponds (Amax); (b) Boxplot of mean (symbol x) and quartiles of Rpond grouped according Amax. The values of U and p of the Mann–Whitney test are also included.
Figure 9.
(a) Relationship between reliability (Rpond) and the size of the ponds (Amax); (b) Boxplot of mean (symbol x) and quartiles of Rpond grouped according Amax. The values of U and p of the Mann–Whitney test are also included.

Figure 10.
(a) Relationship between the observed A/Amax ratios in the ponds (from images of 2006) and the respective values of the Sc/Vmax ratio. Error bars are included for Vmax variations of ±25% with respect to the values estimated by Equation (1). The results of the regression analysis are presented in the graph (ponds B1 and P2 were not considered in this analysis, see text for explanation); (b) Boxplot depicting mean values (symbol x), quartiles, and outliers of the A/Amax ratios observed for ponds with Sc/Vmax ratios below and above 90 m−1. The U and p values of the Mann–Whitney test are also shown.

Figure 11.
(a) Relationship between annual discharges (Dannual) and annual rainfall (Pannual) and (b) relationship between (Sc/Vmax)req and Pannual for a total of 19 years within the period from 1991 to 2018.
Figure 11.
(a) Relationship between annual discharges (Dannual) and annual rainfall (Pannual) and (b) relationship between (Sc/Vmax)req and Pannual for a total of 19 years within the period from 1991 to 2018.


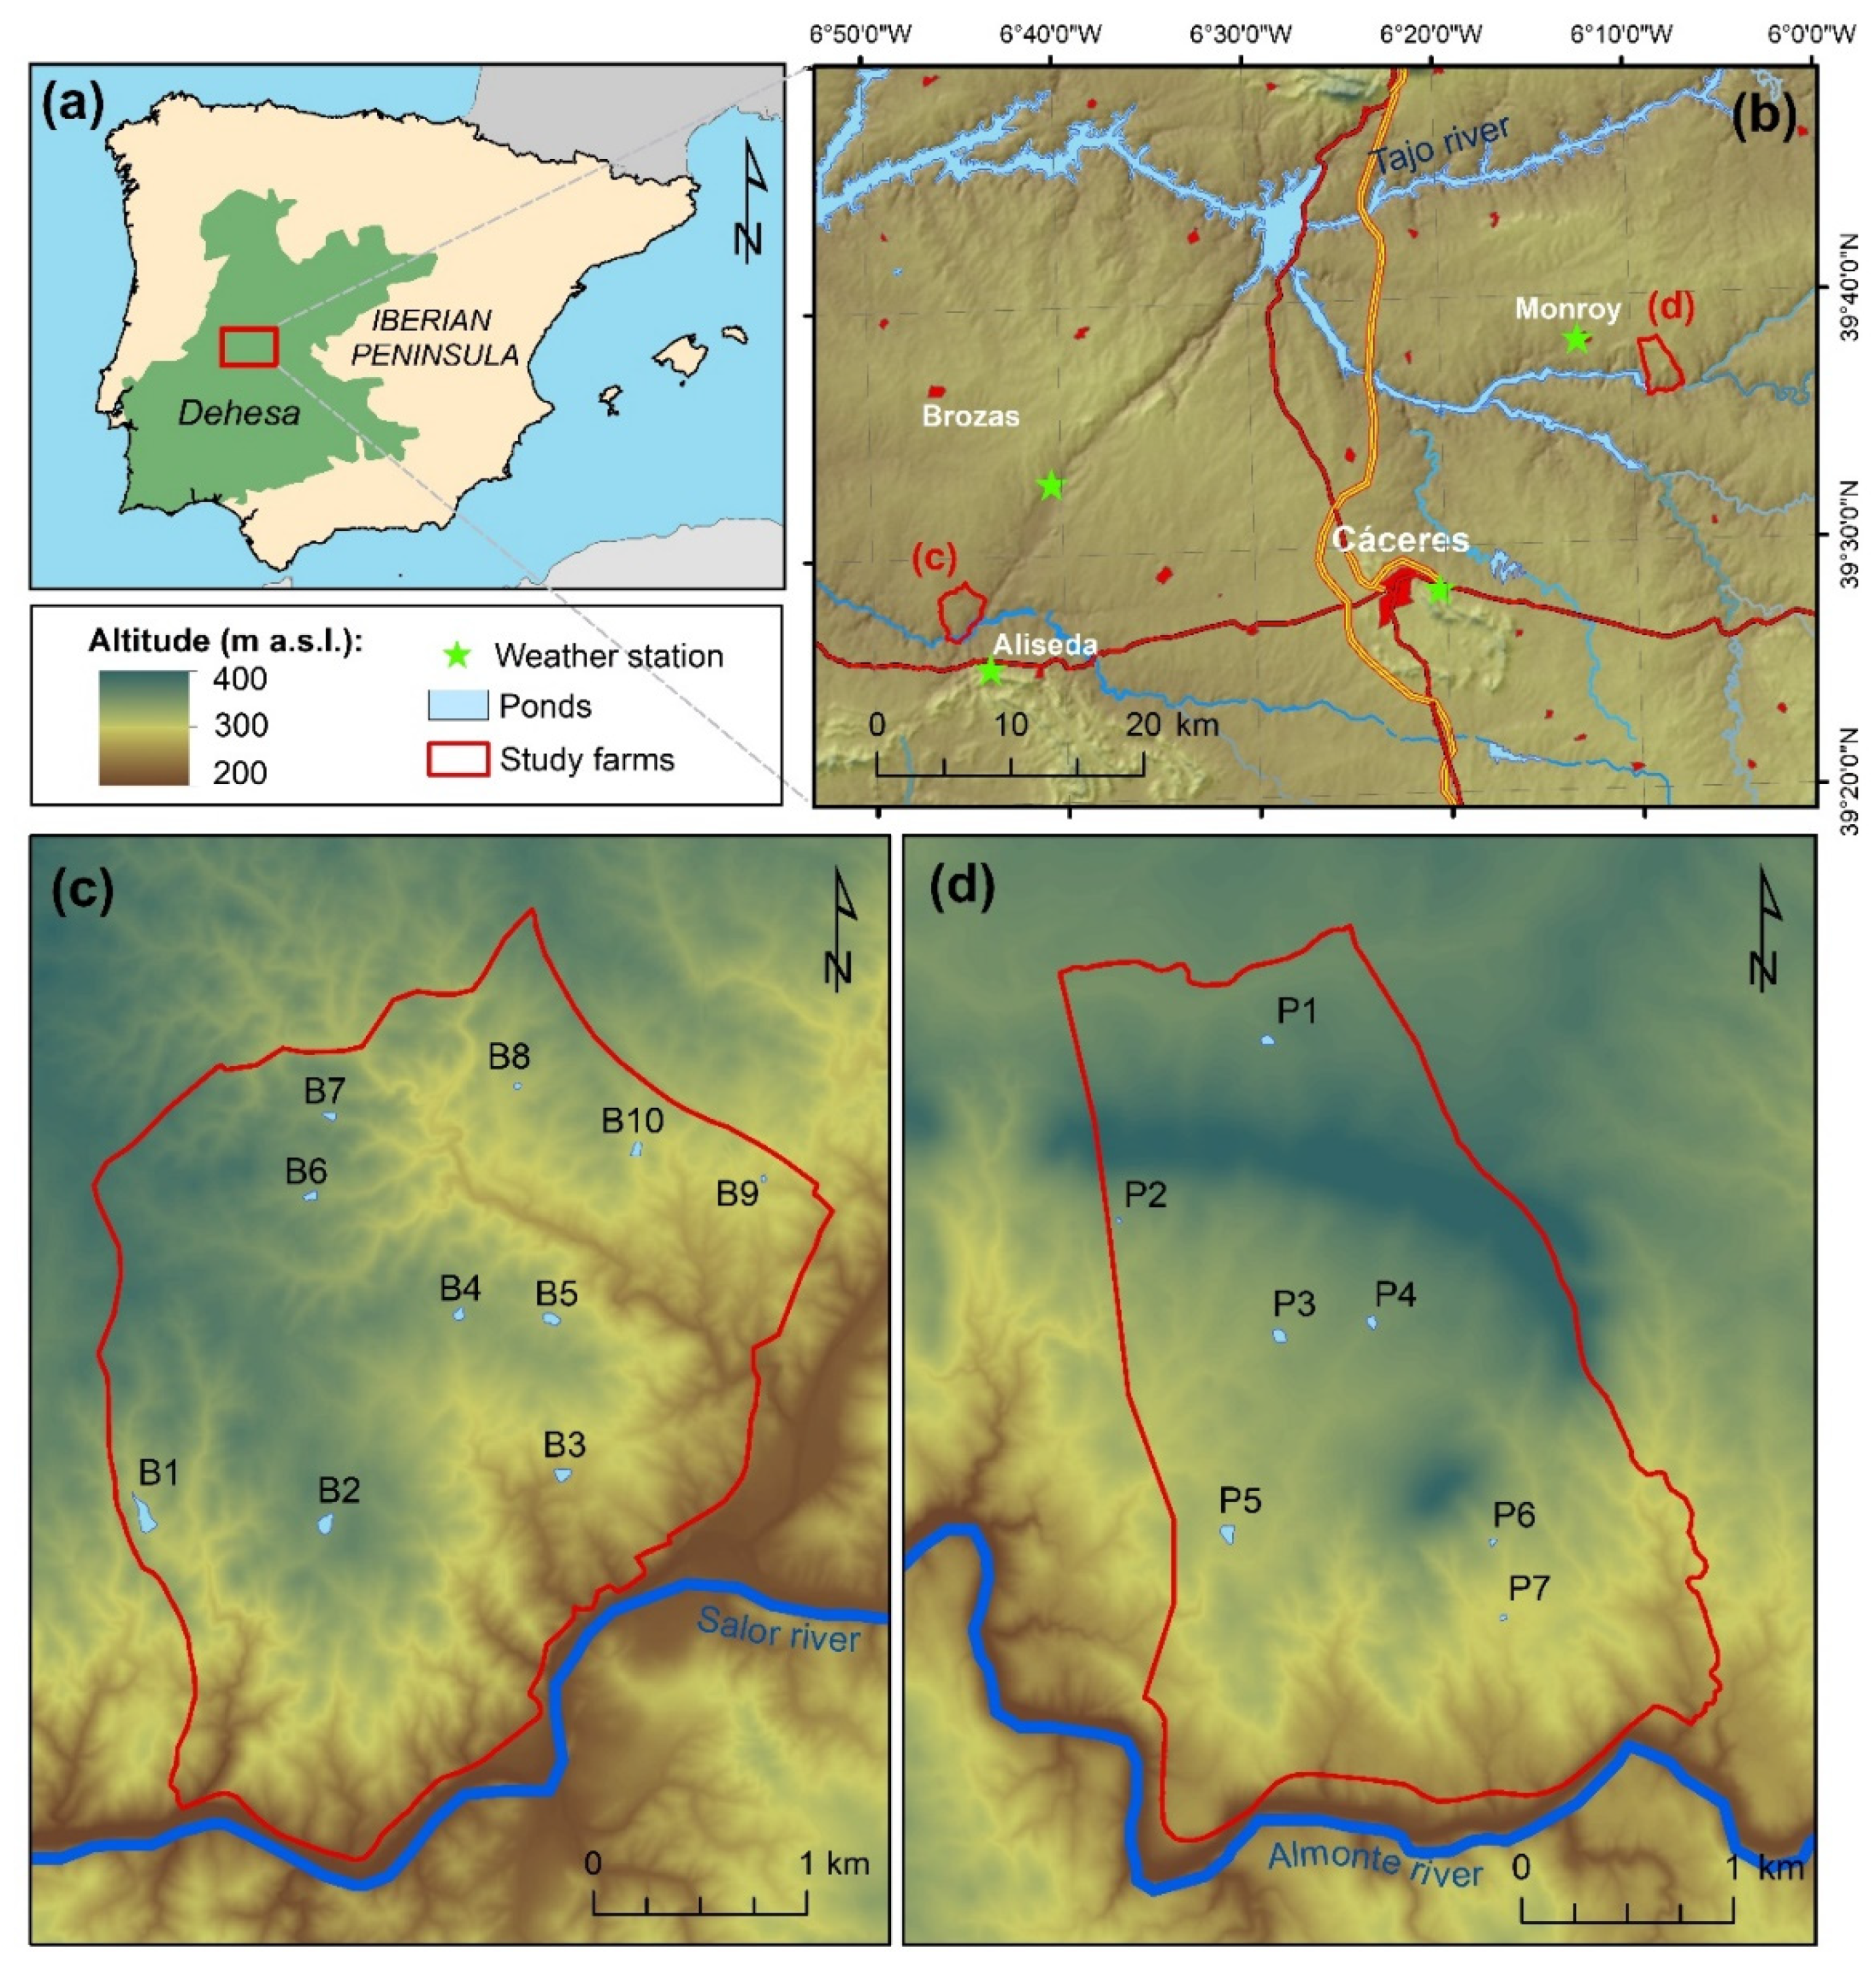
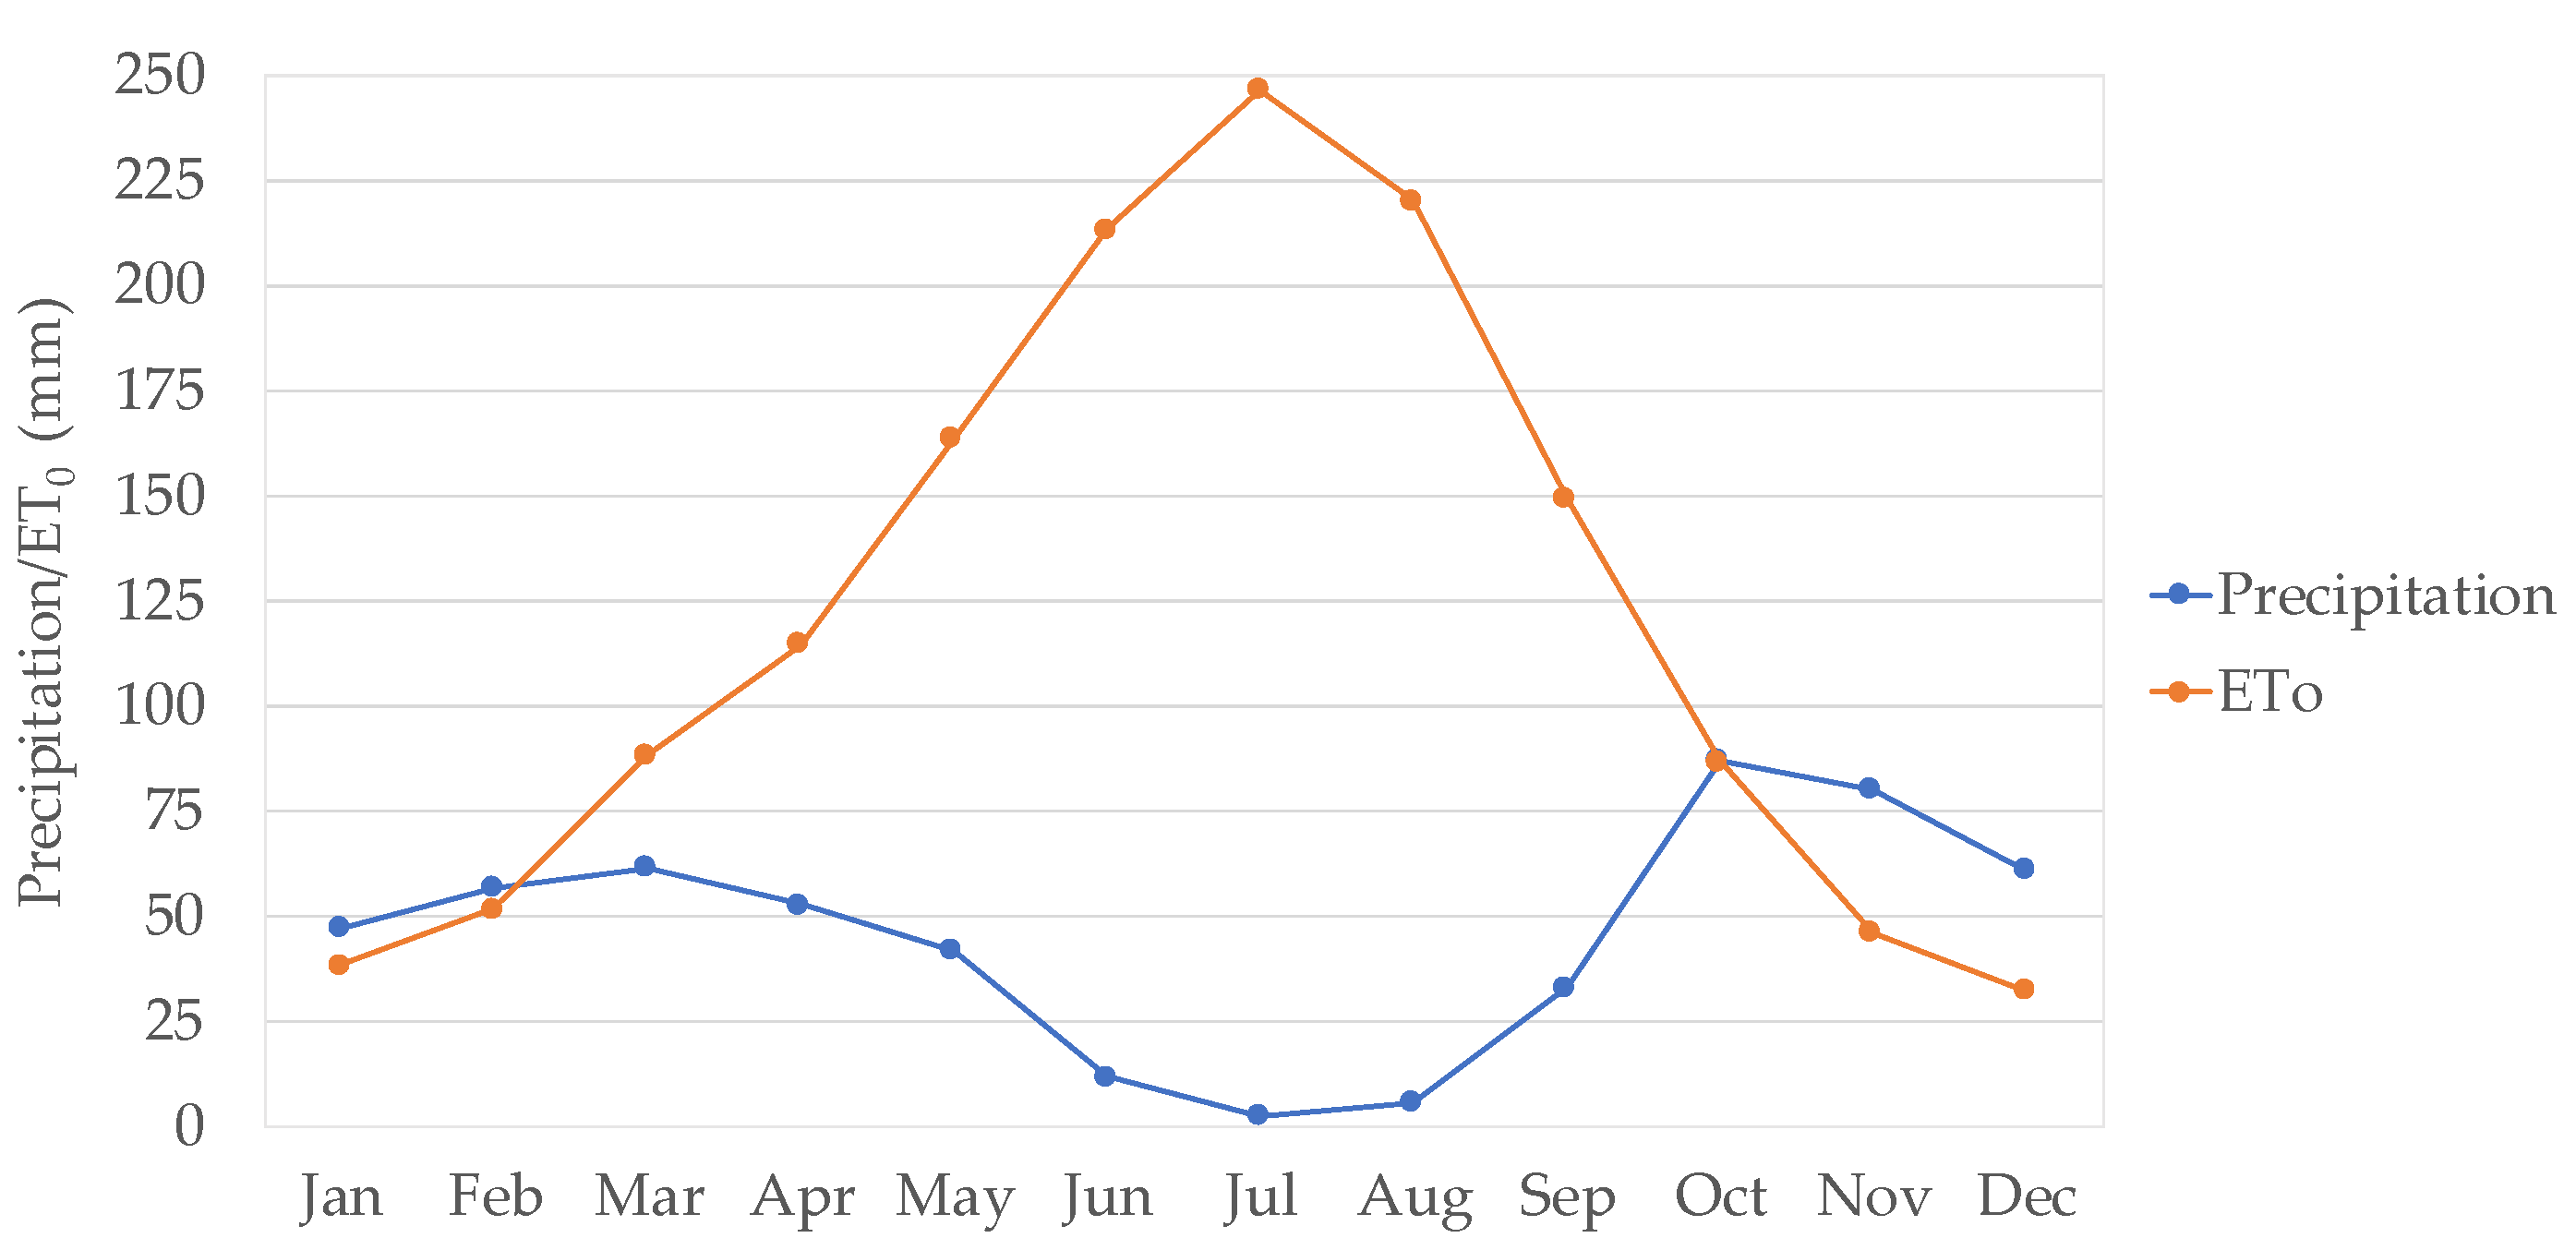
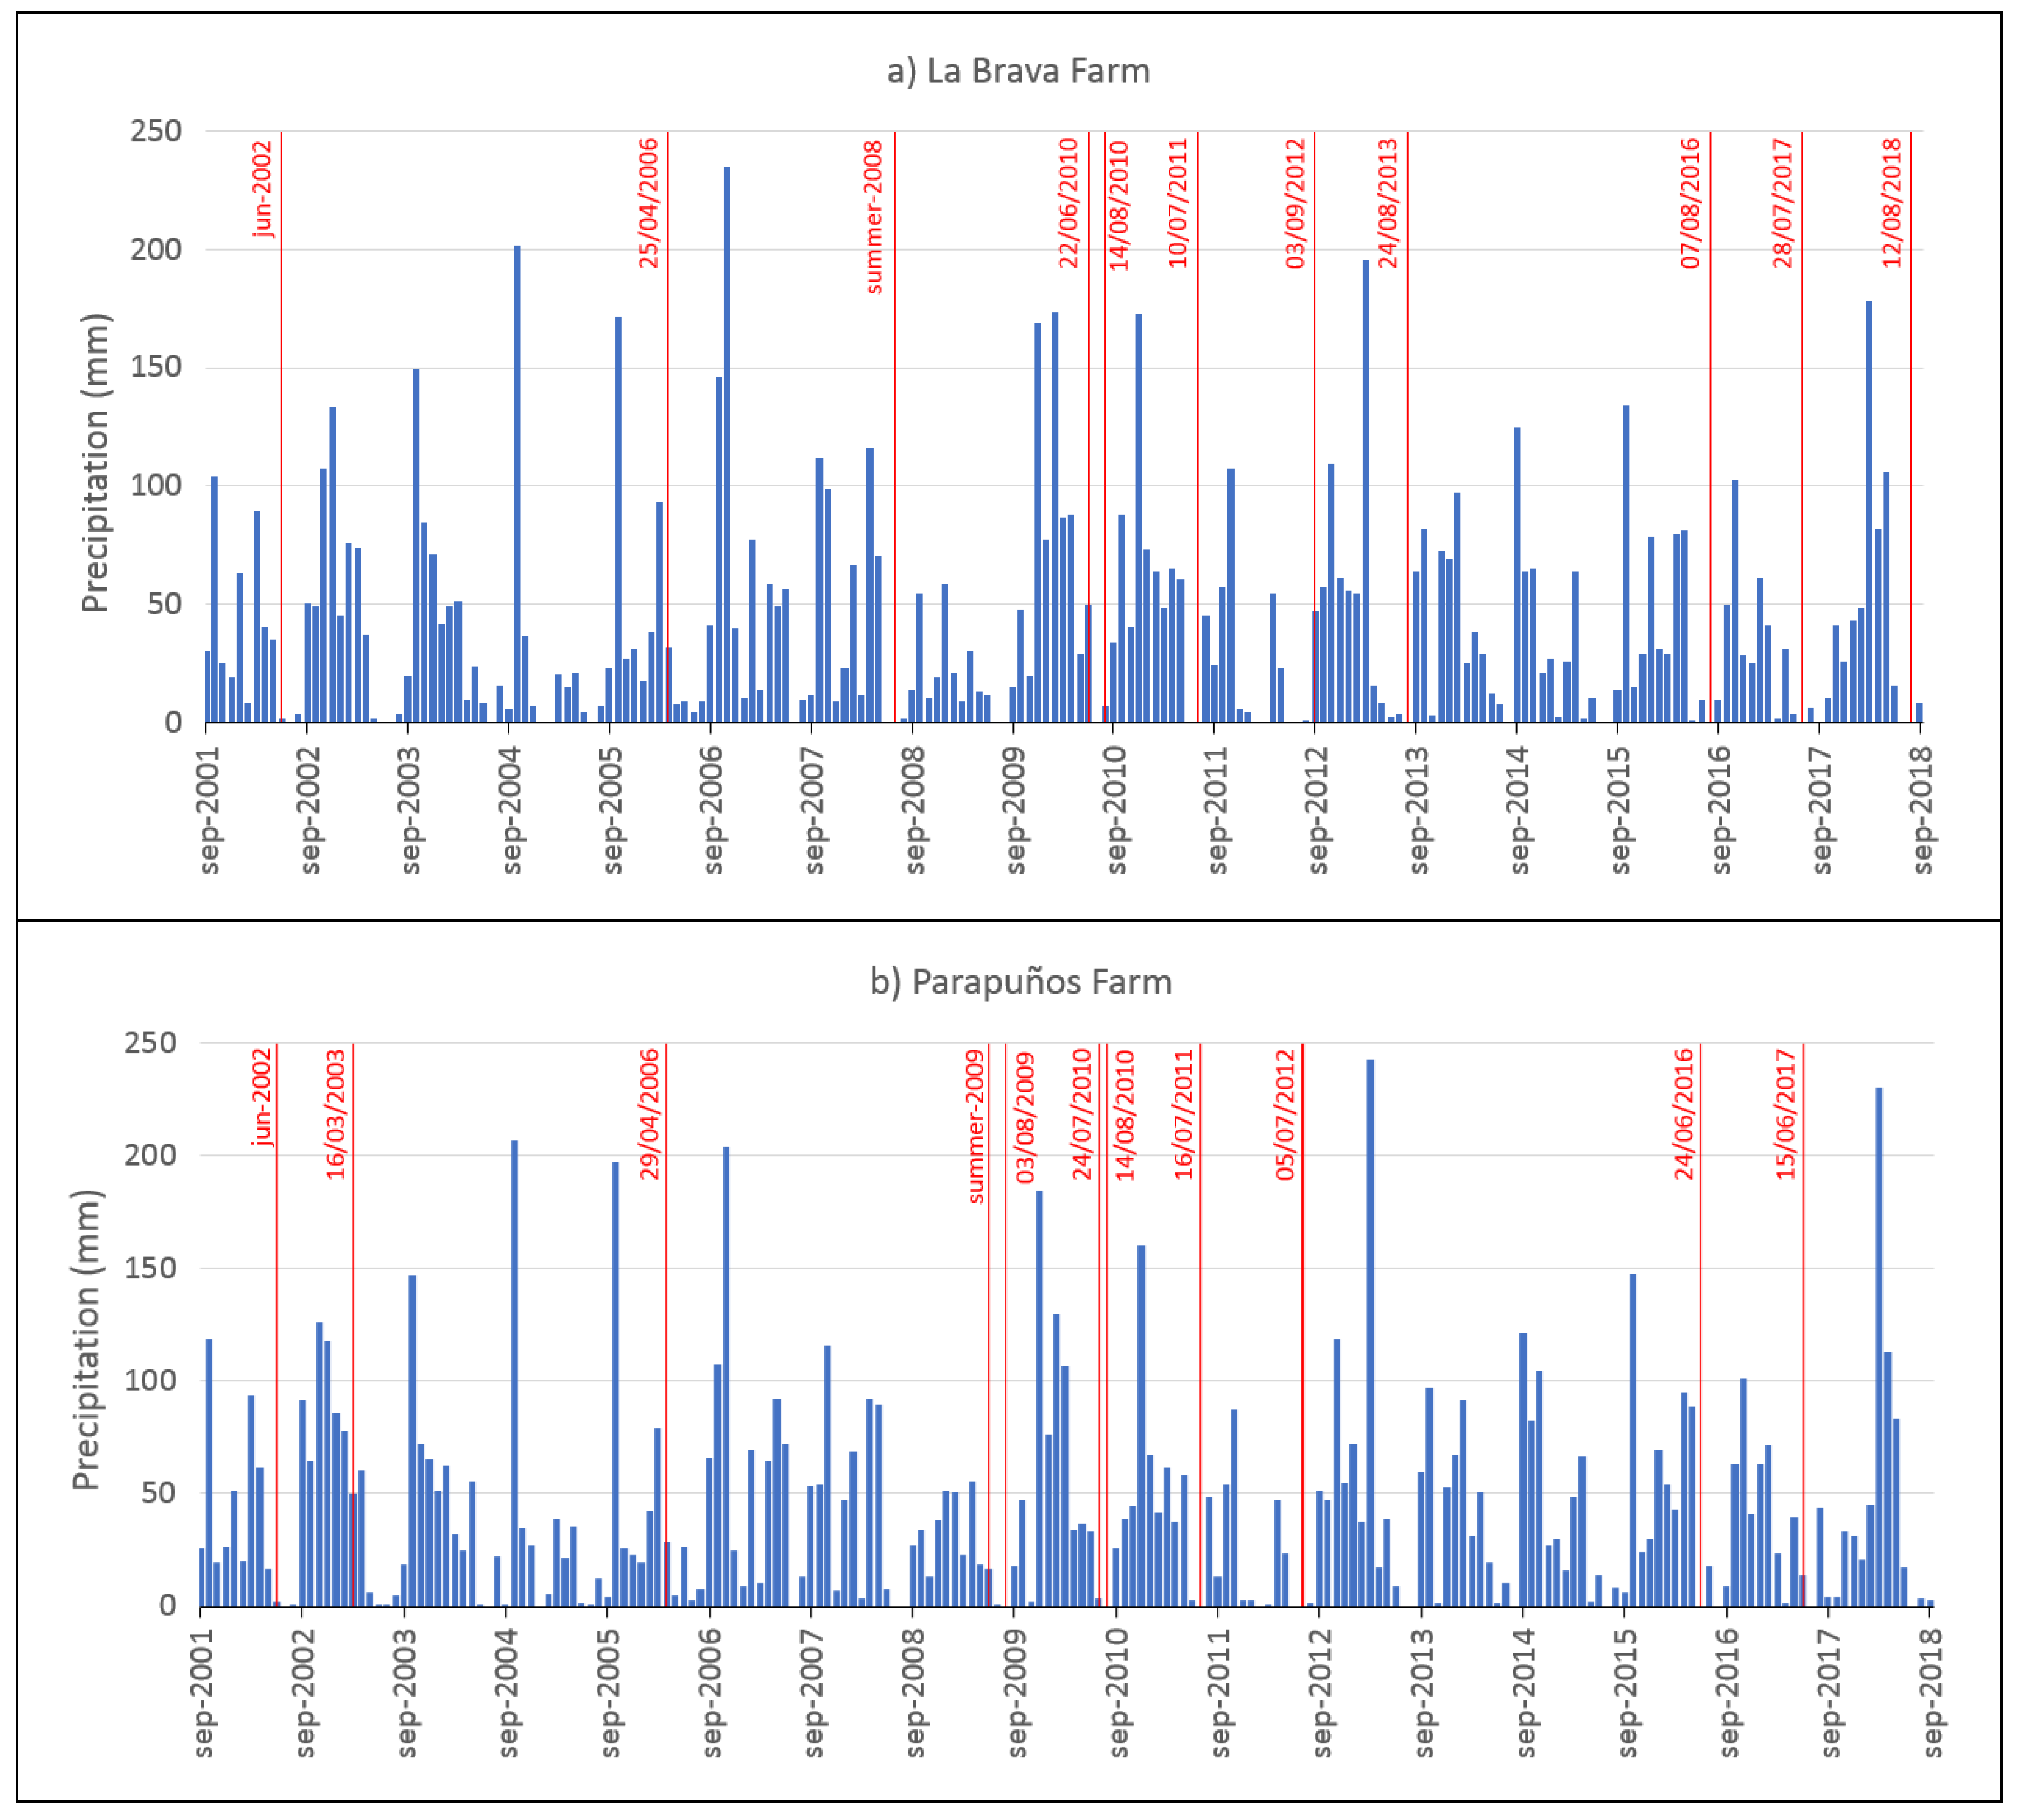
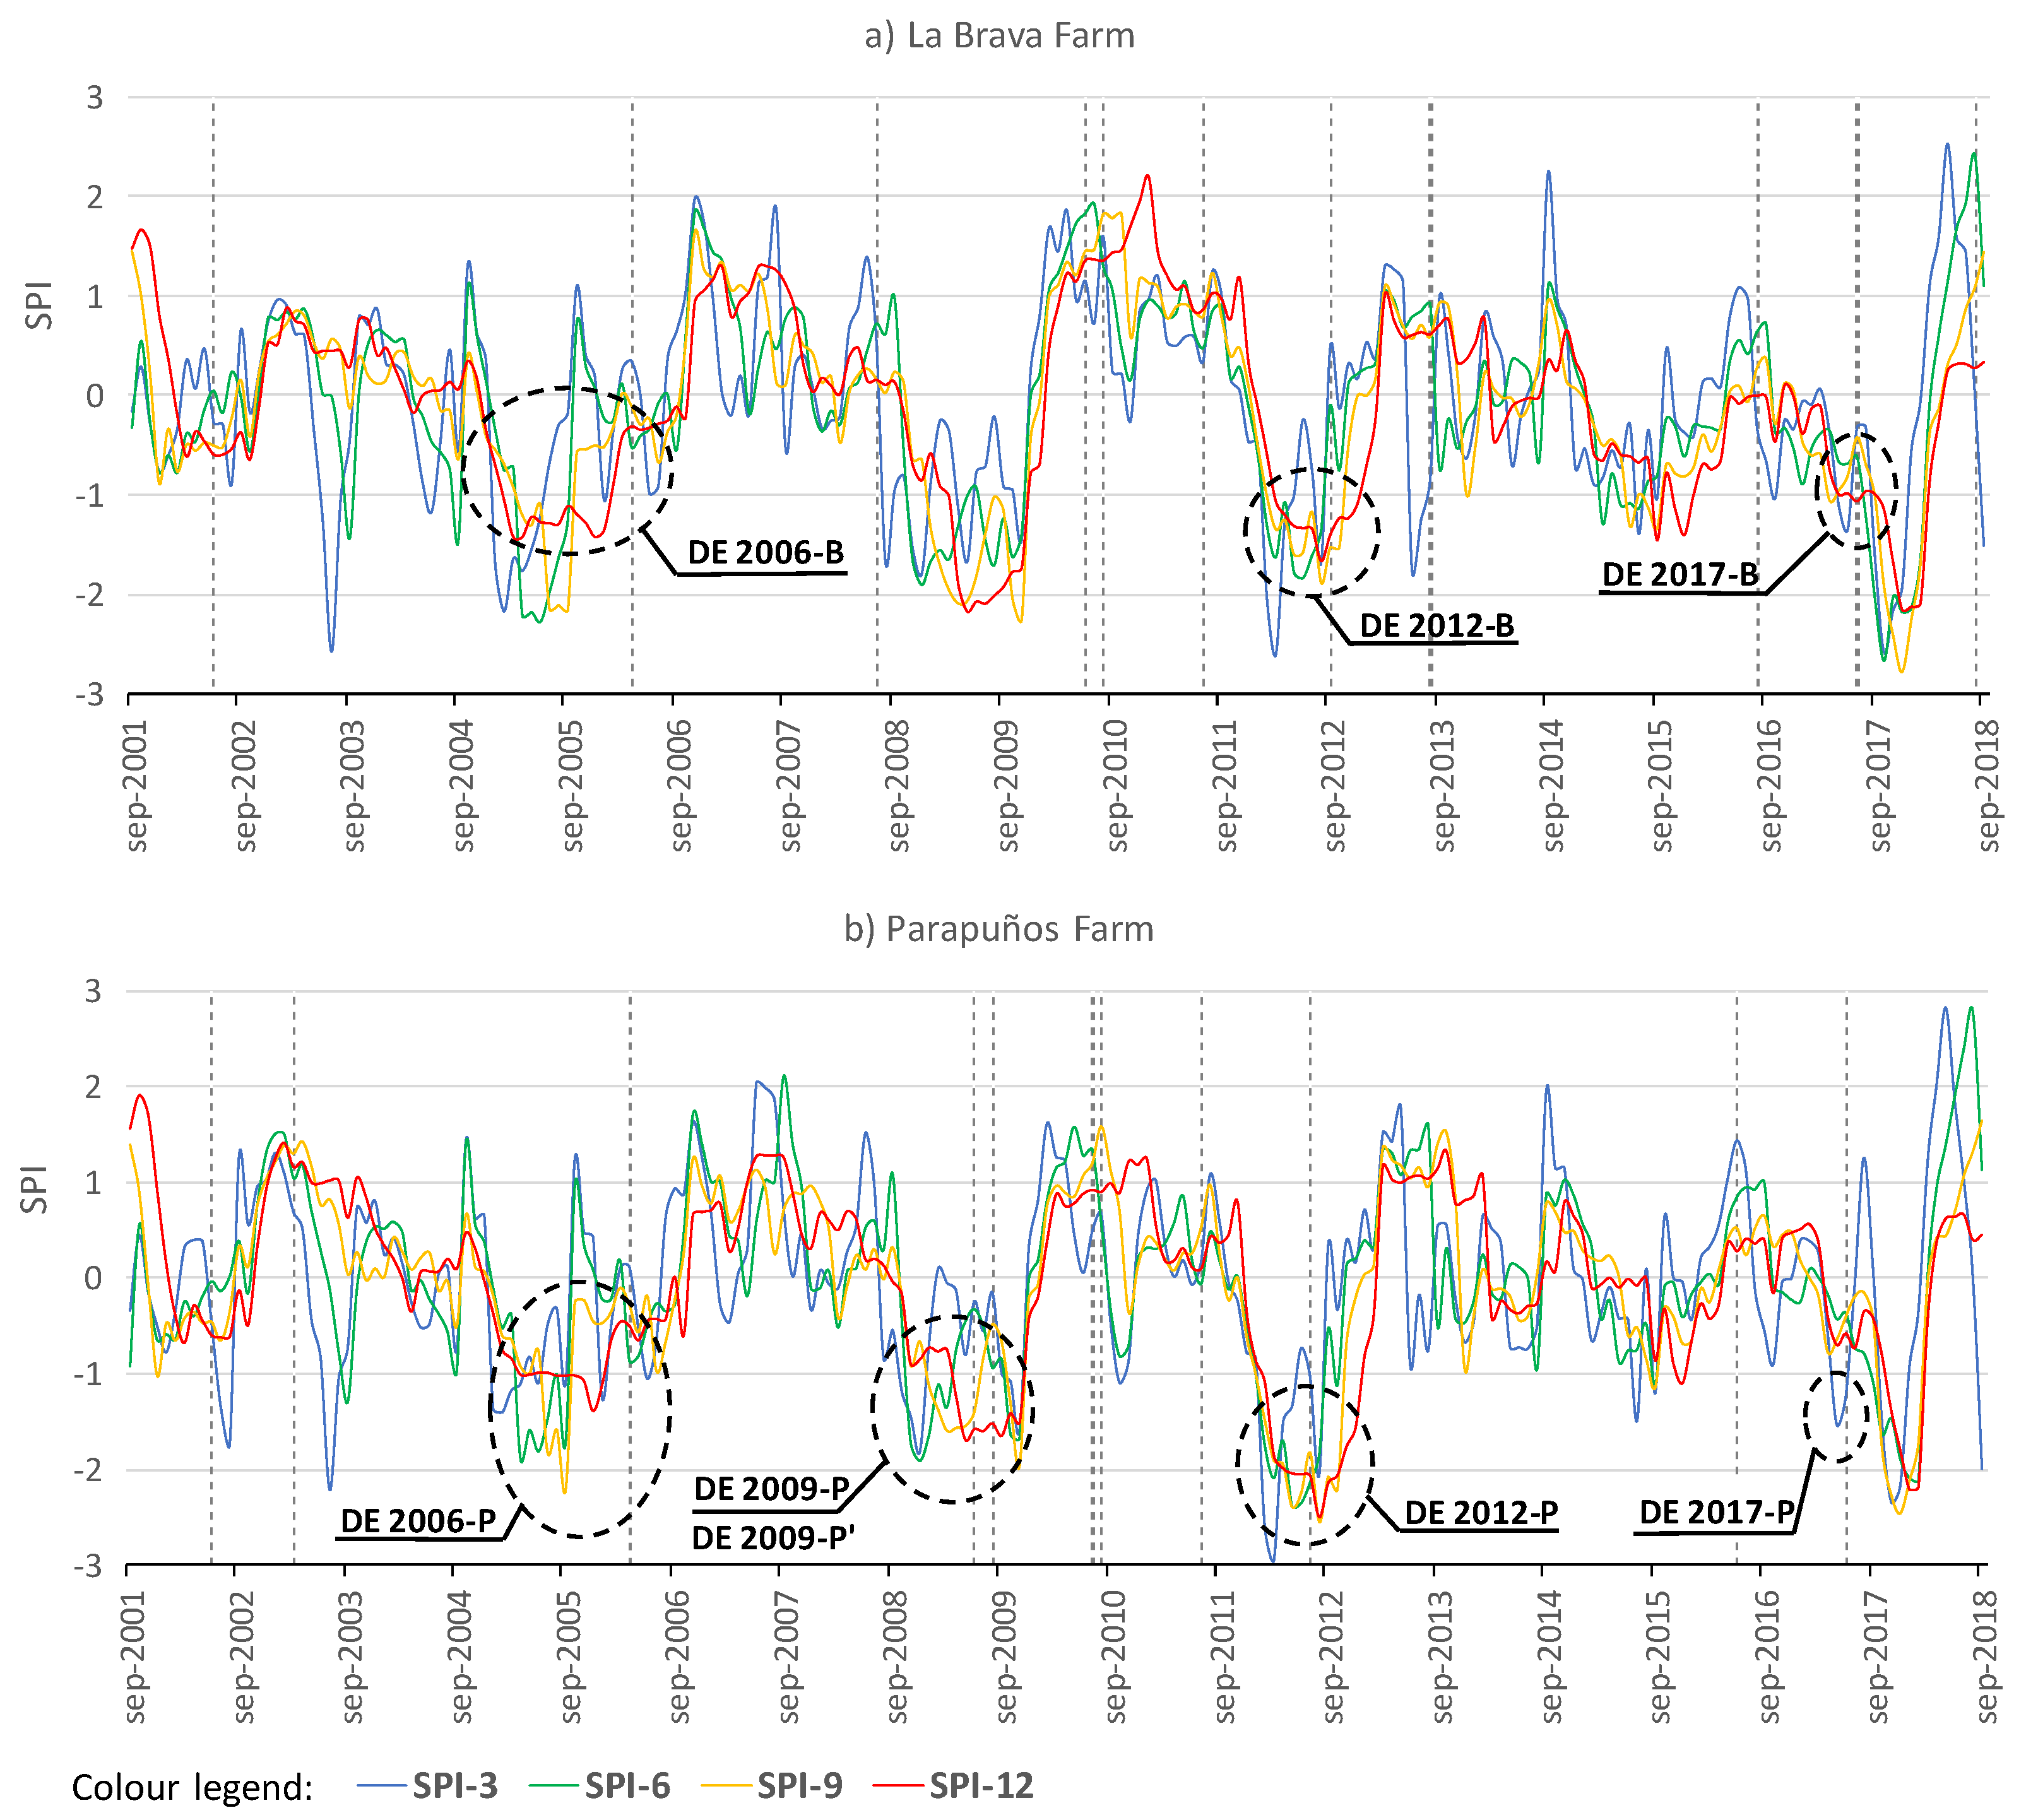
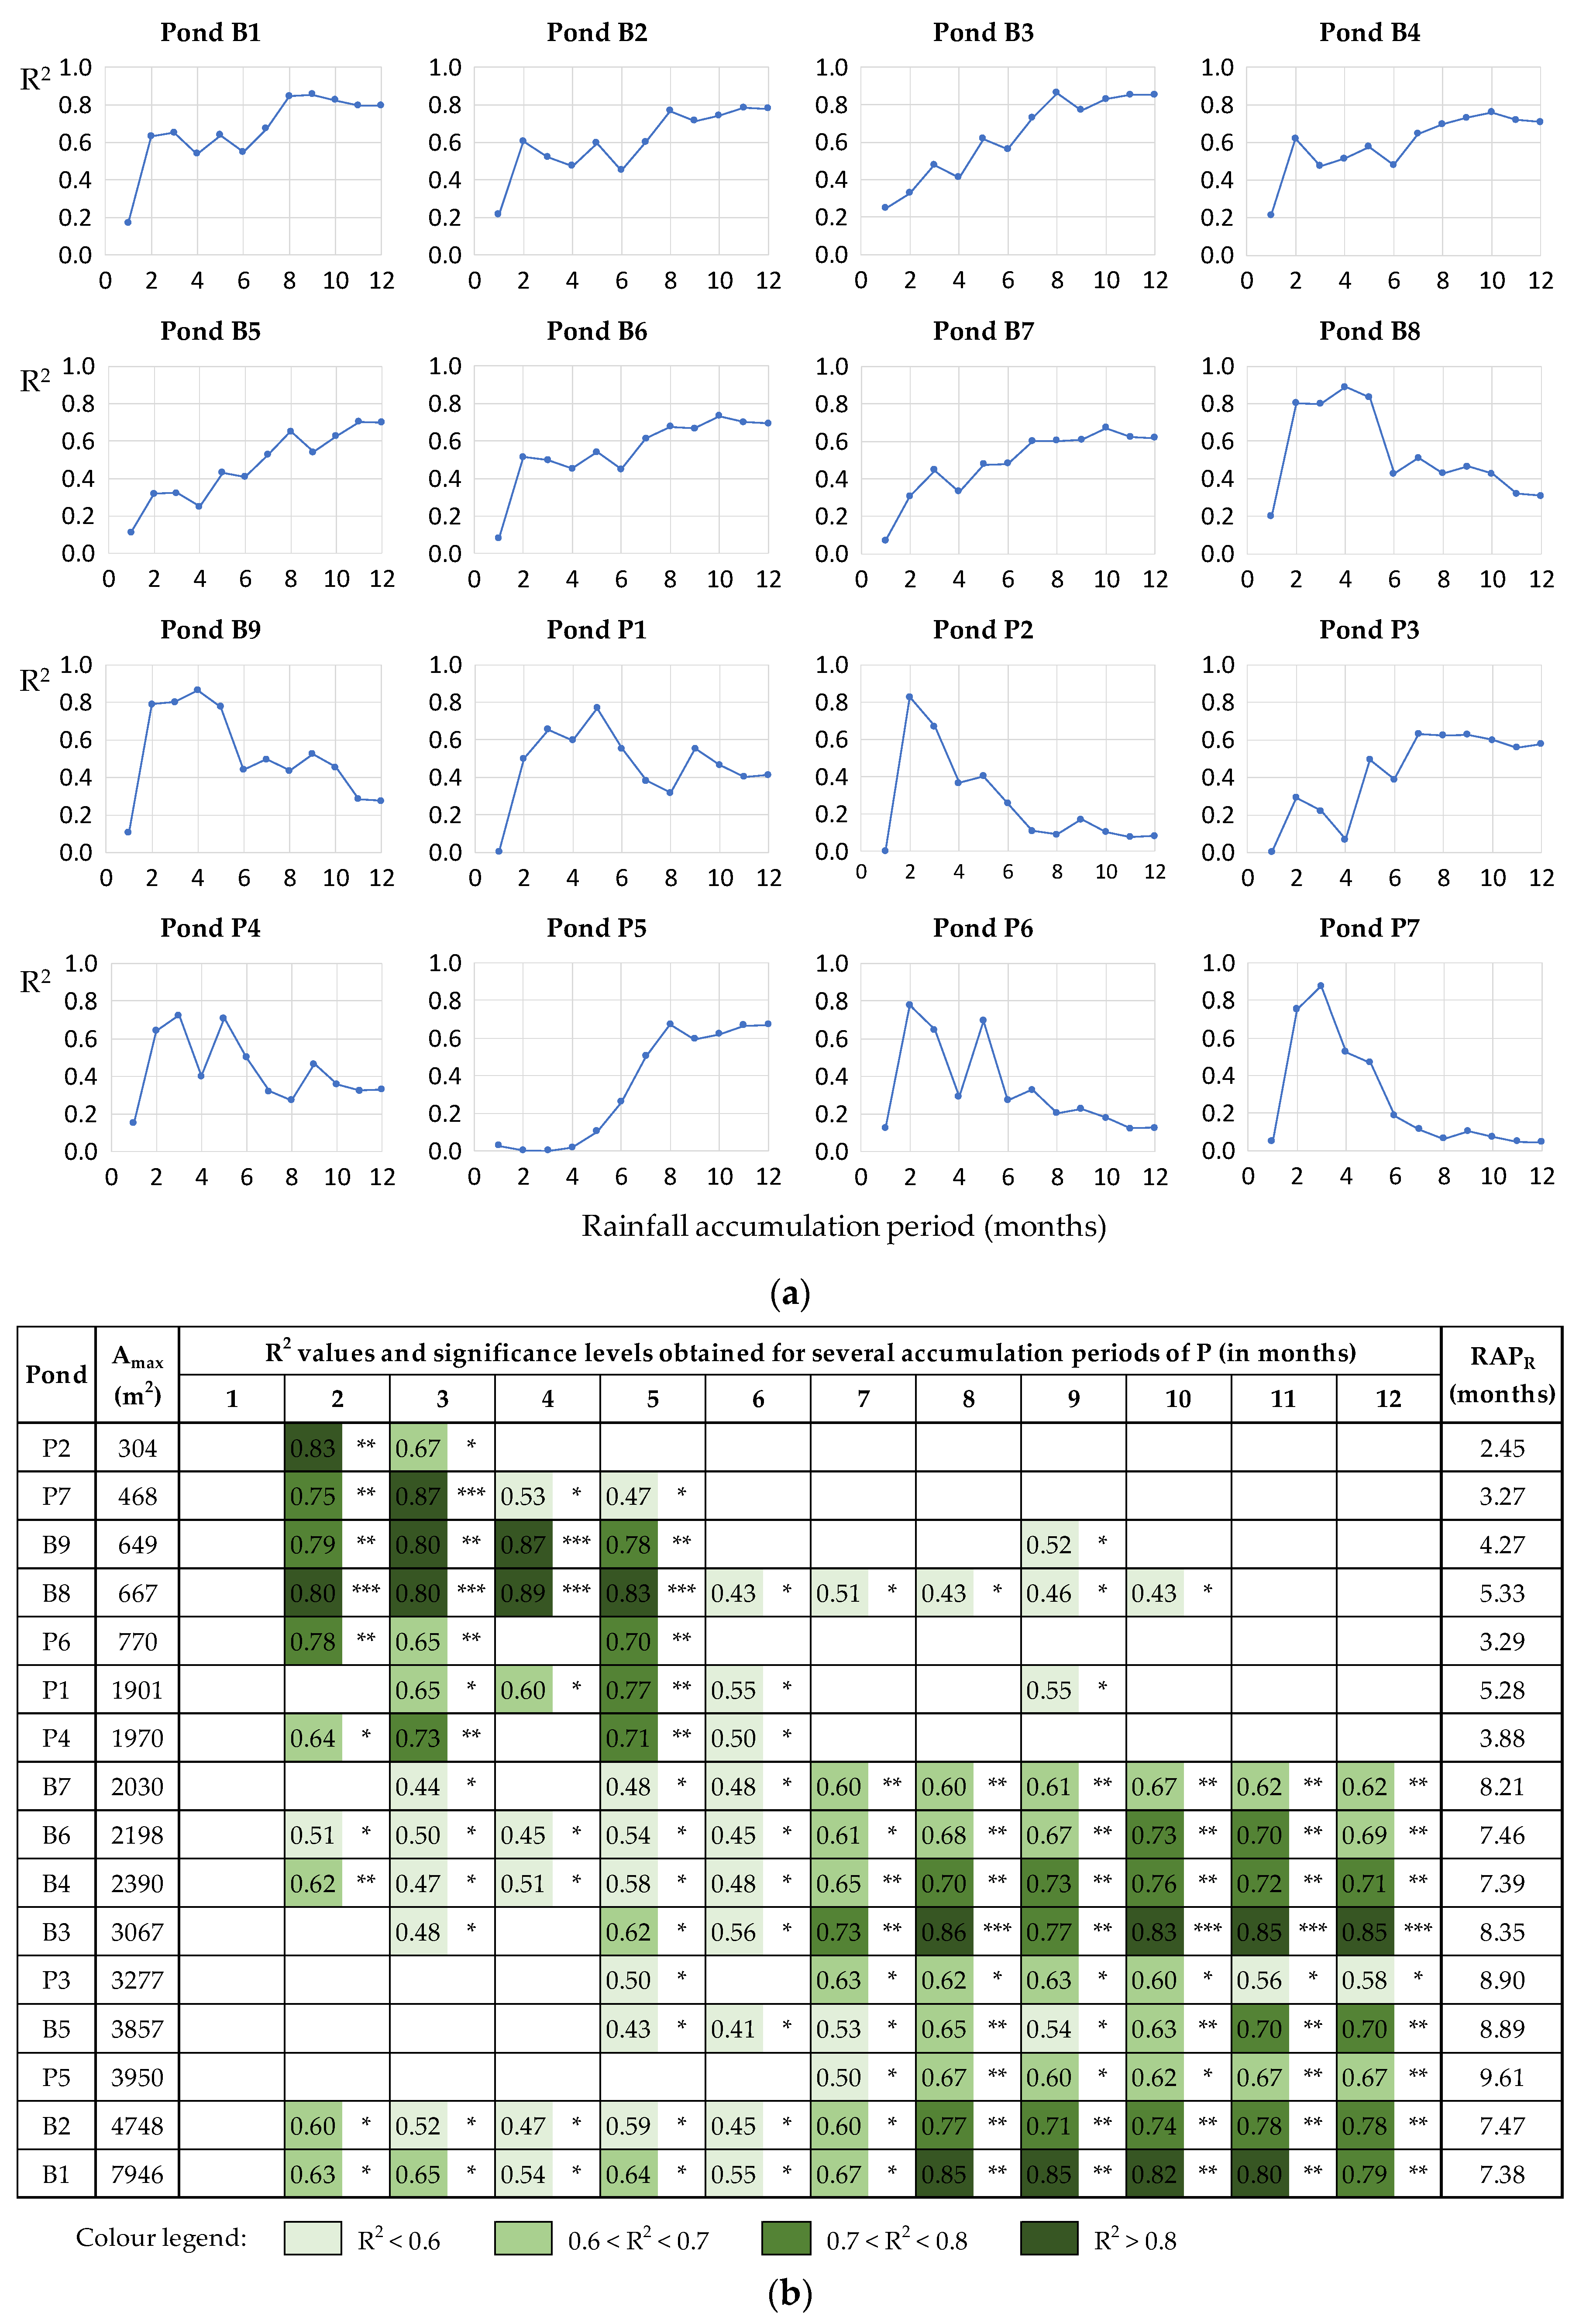
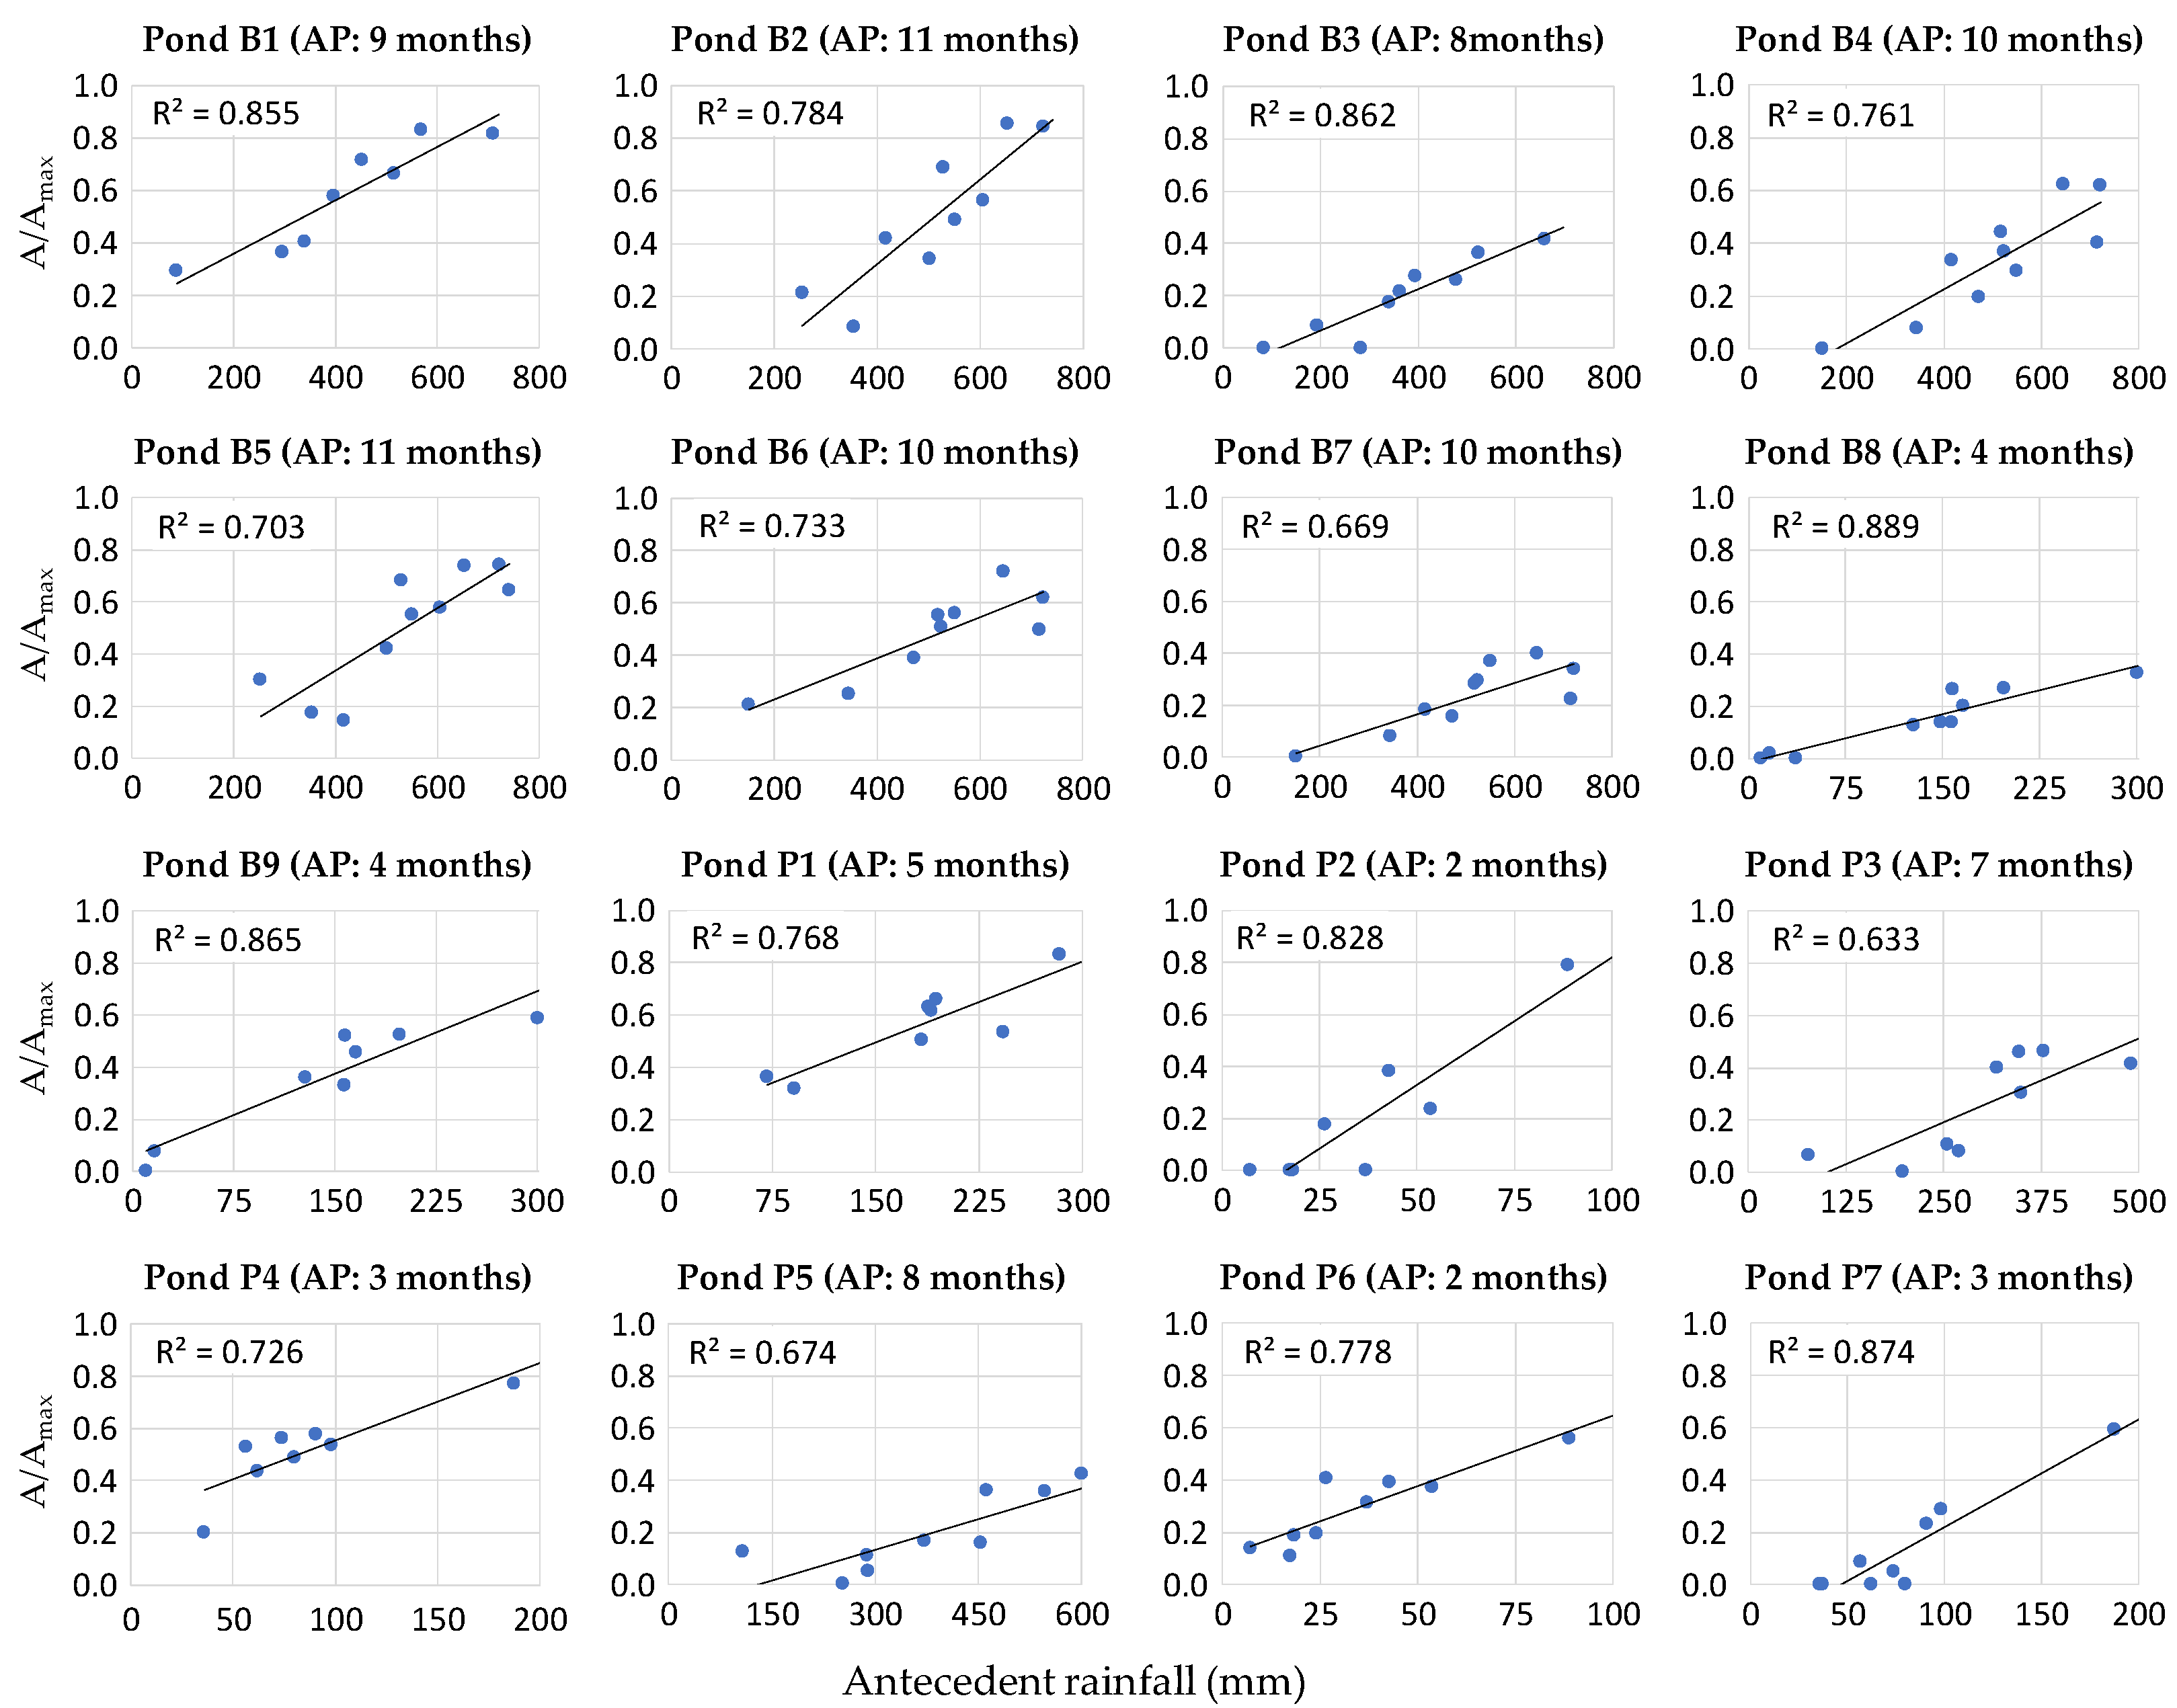
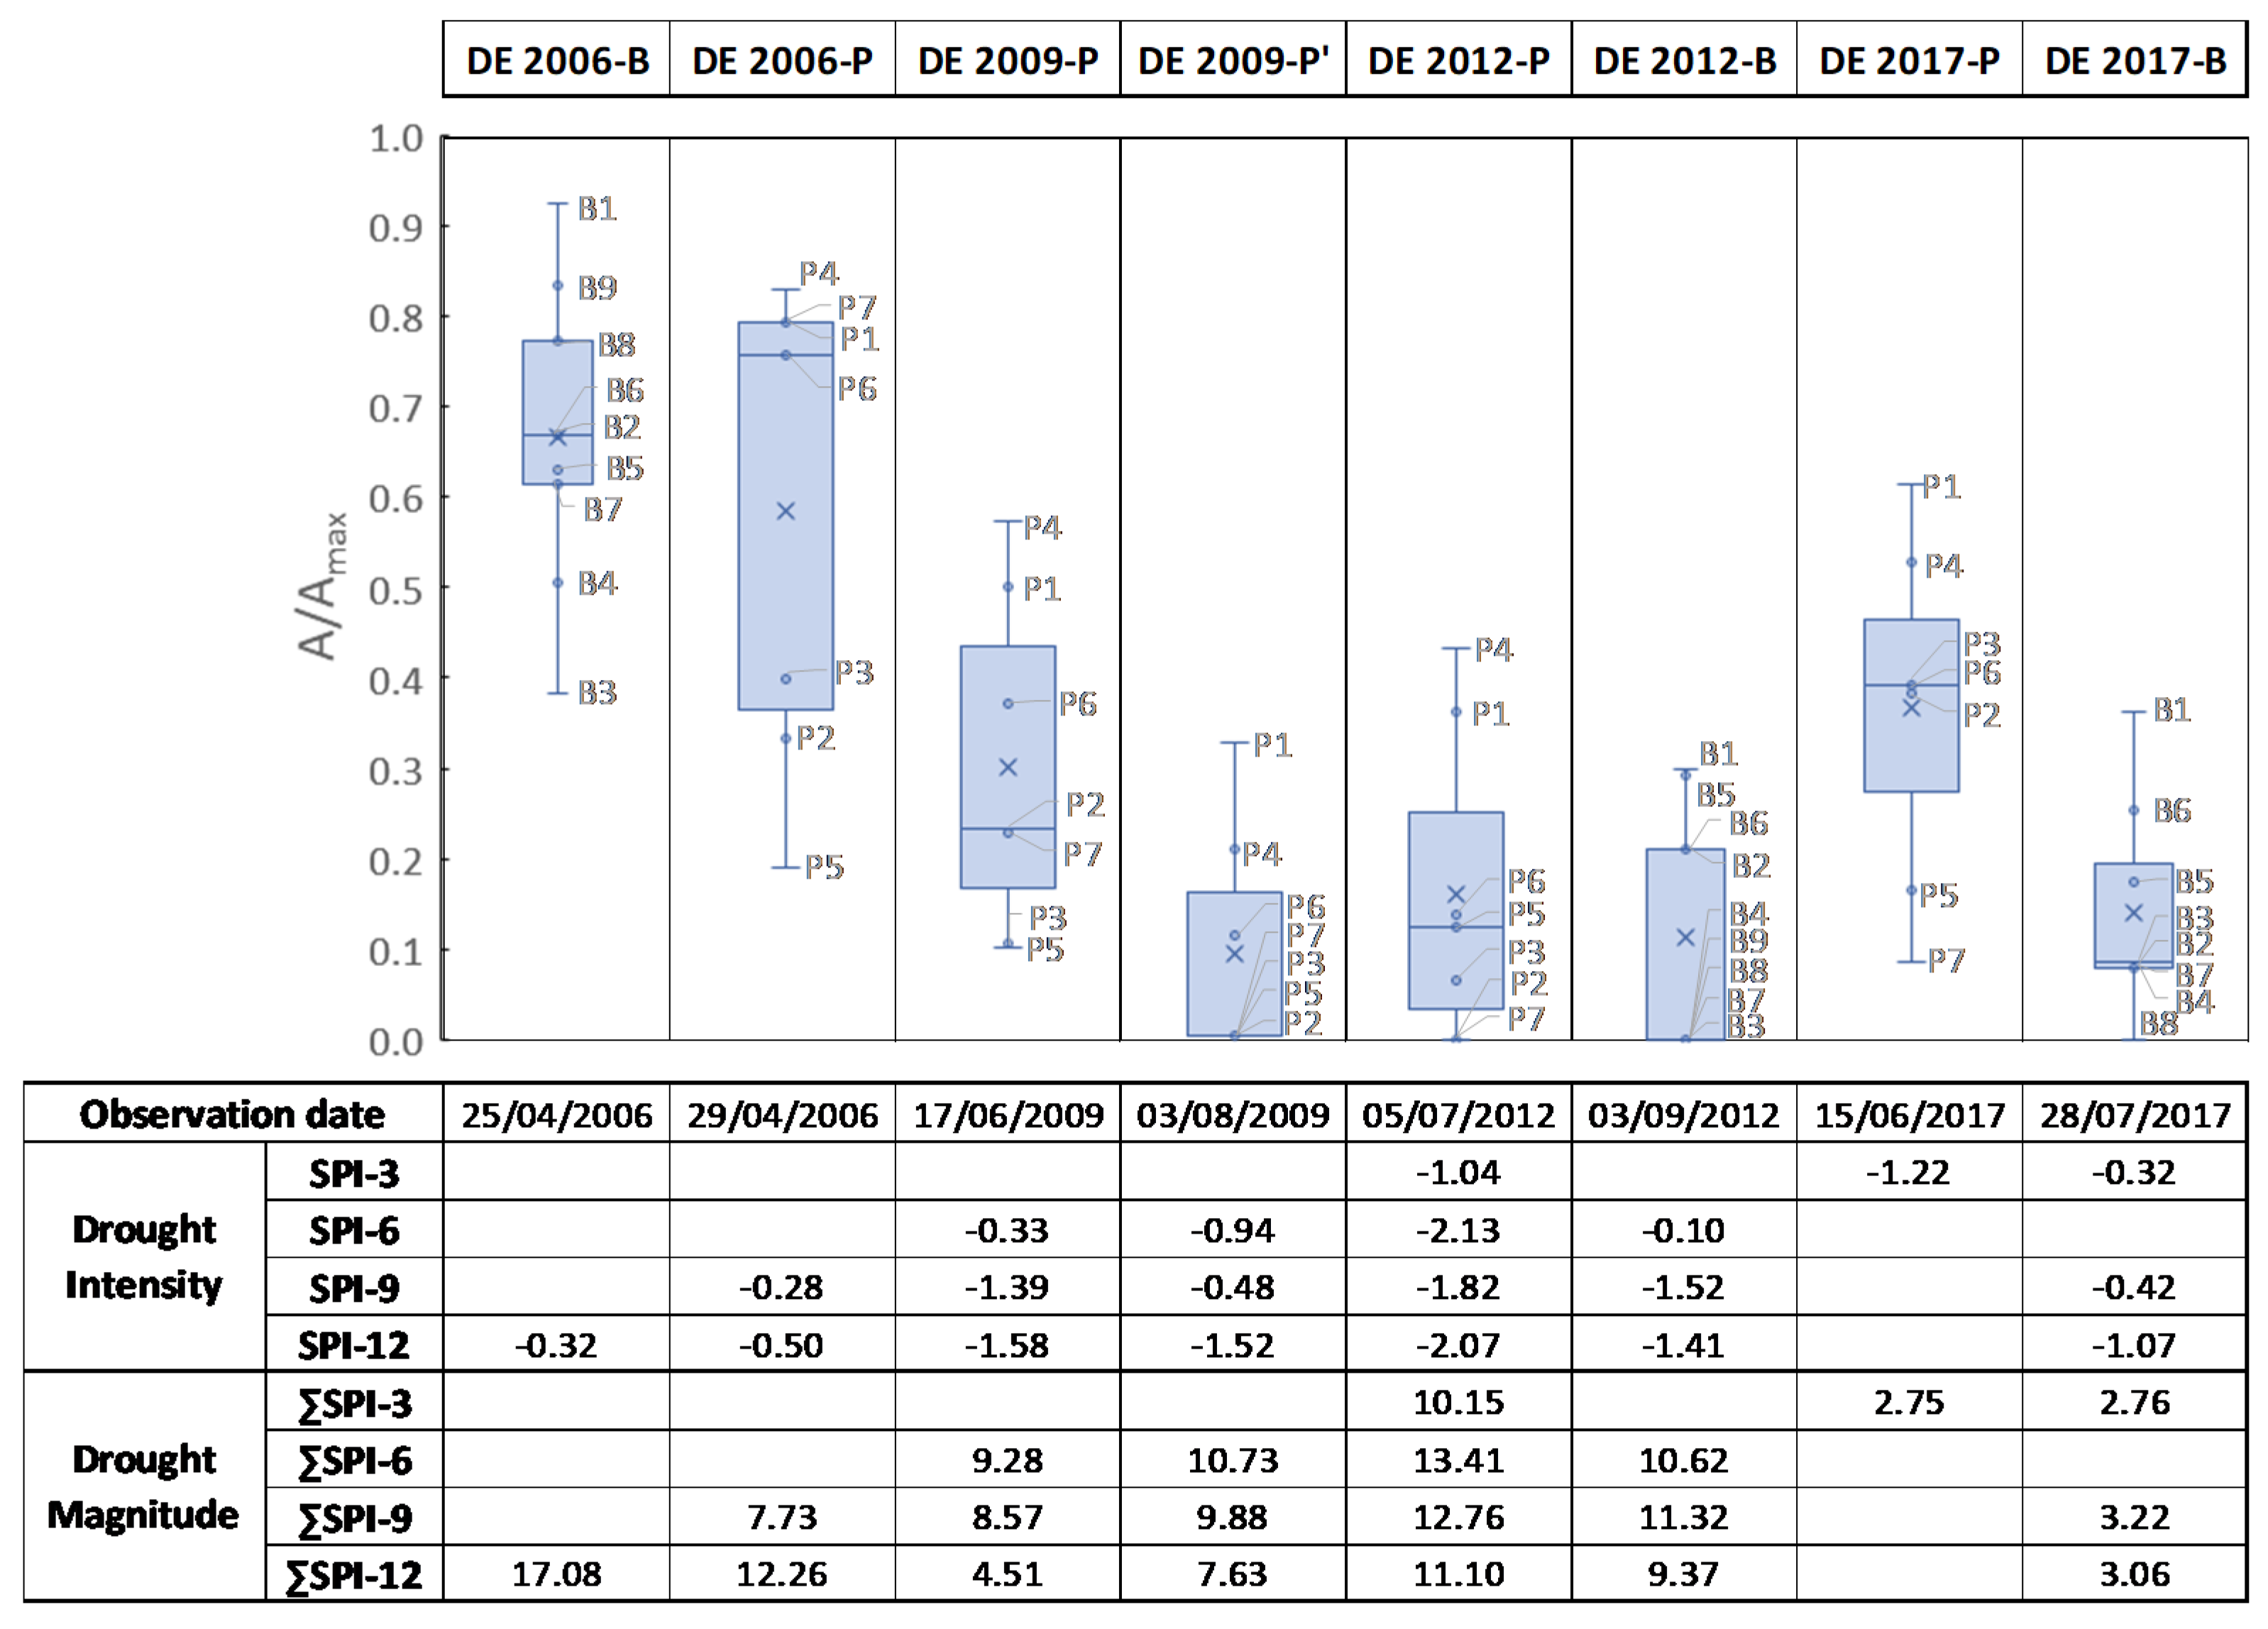
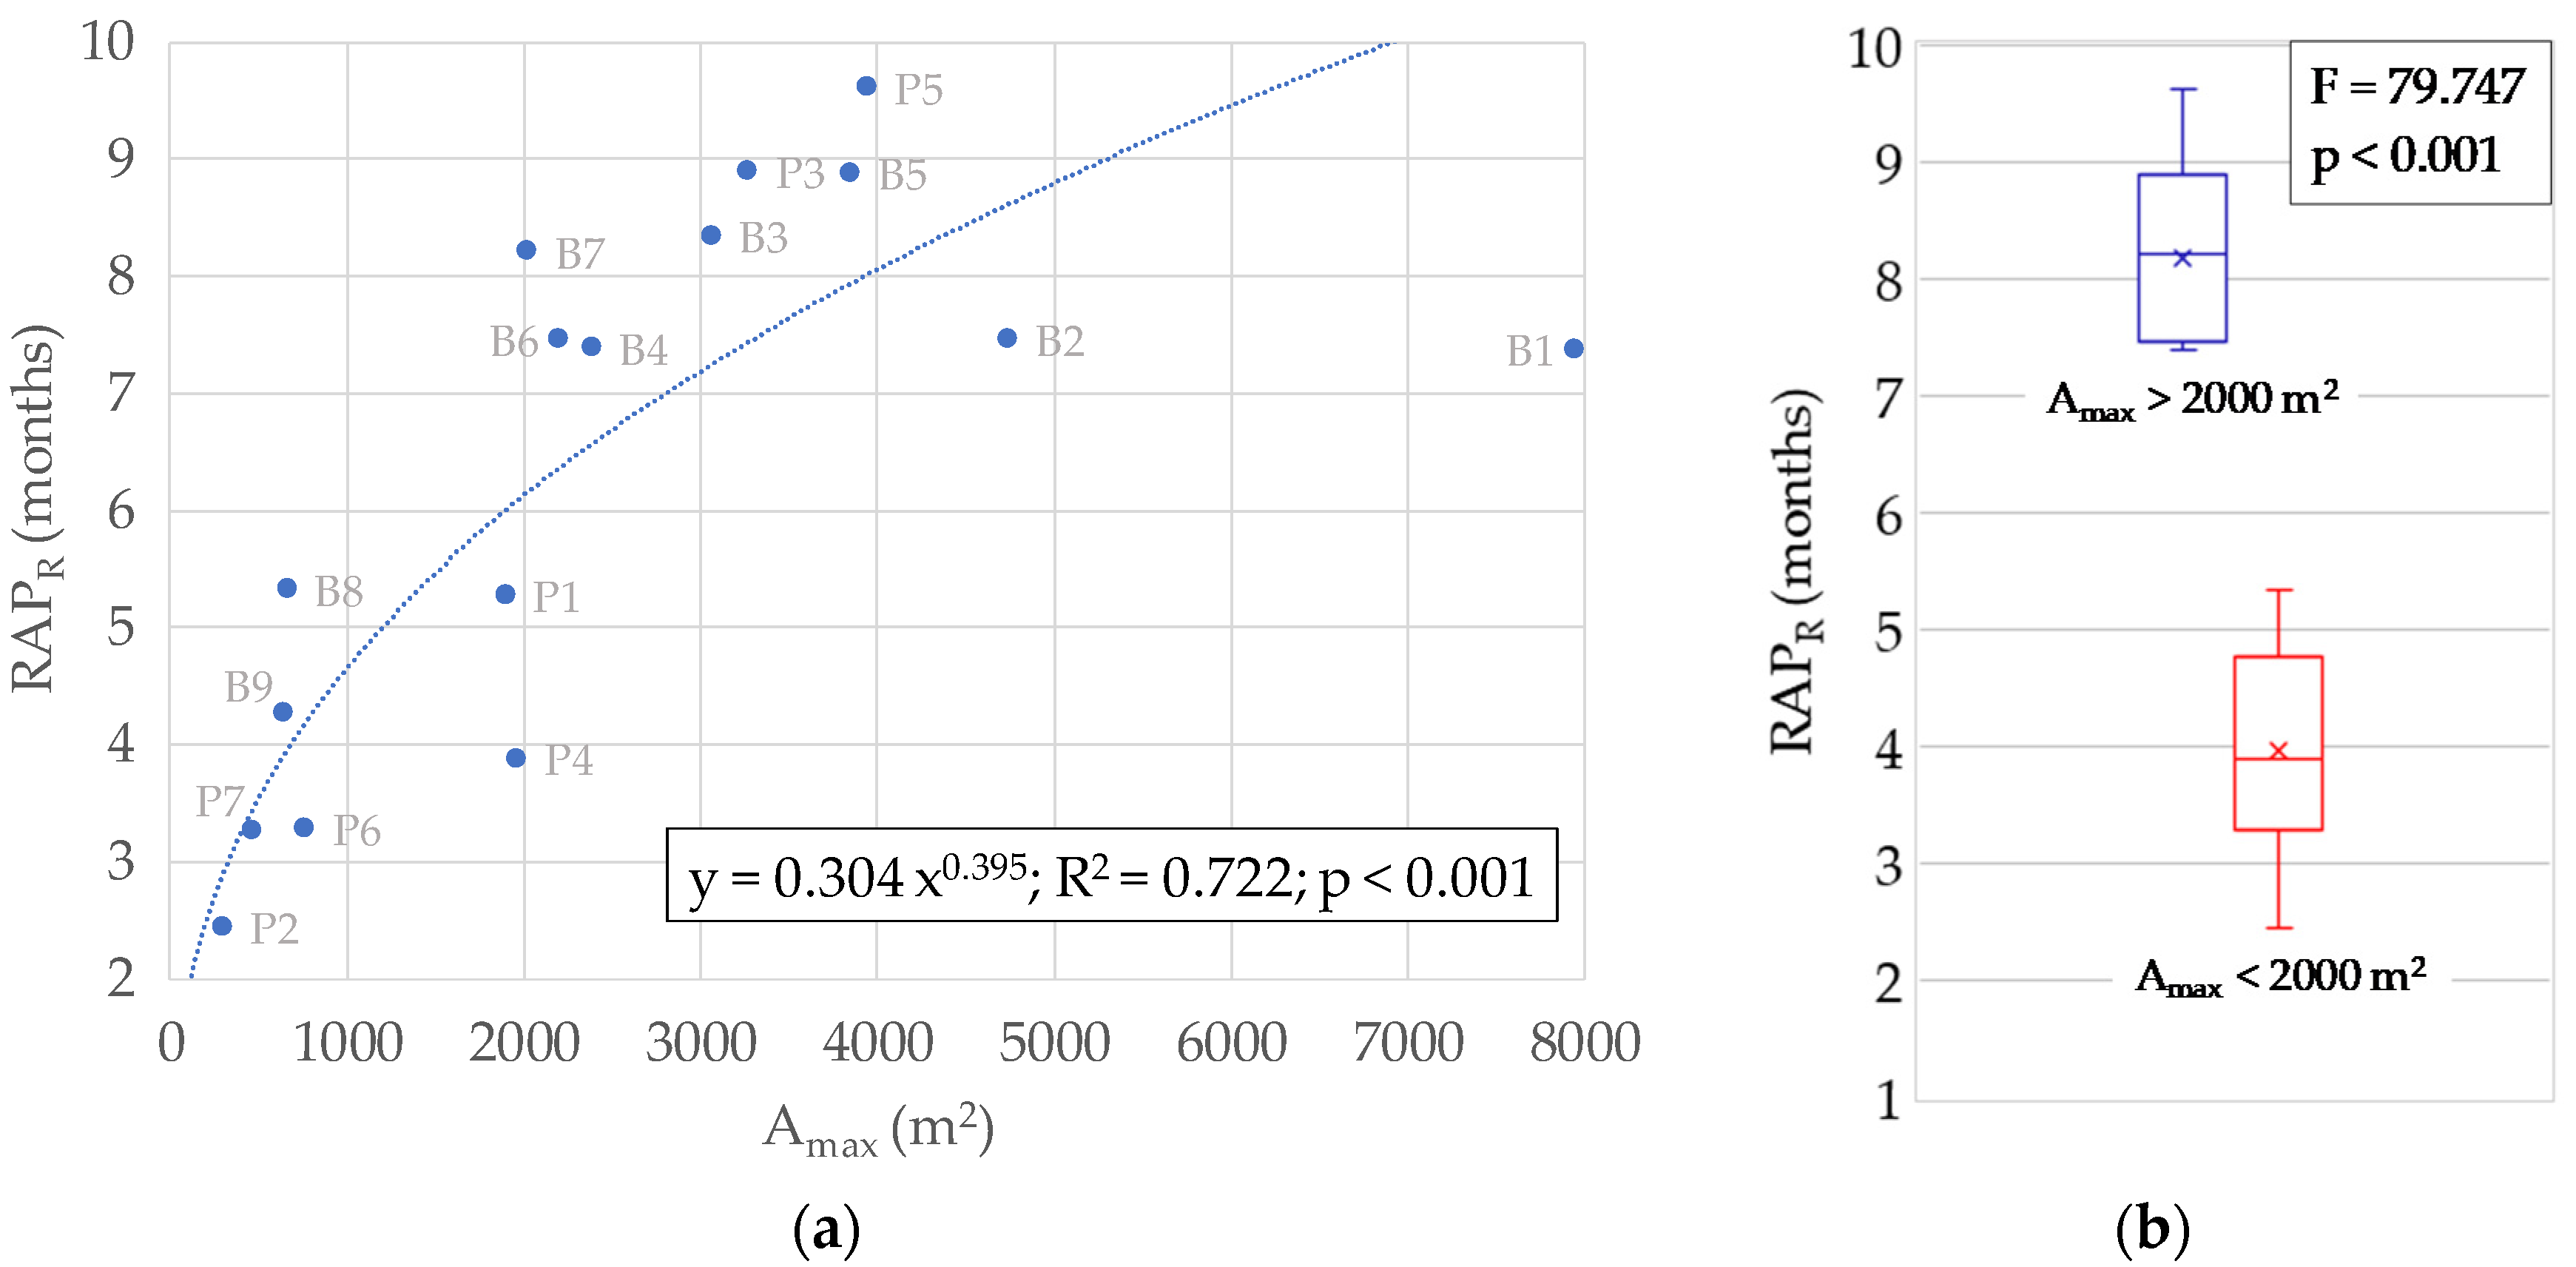
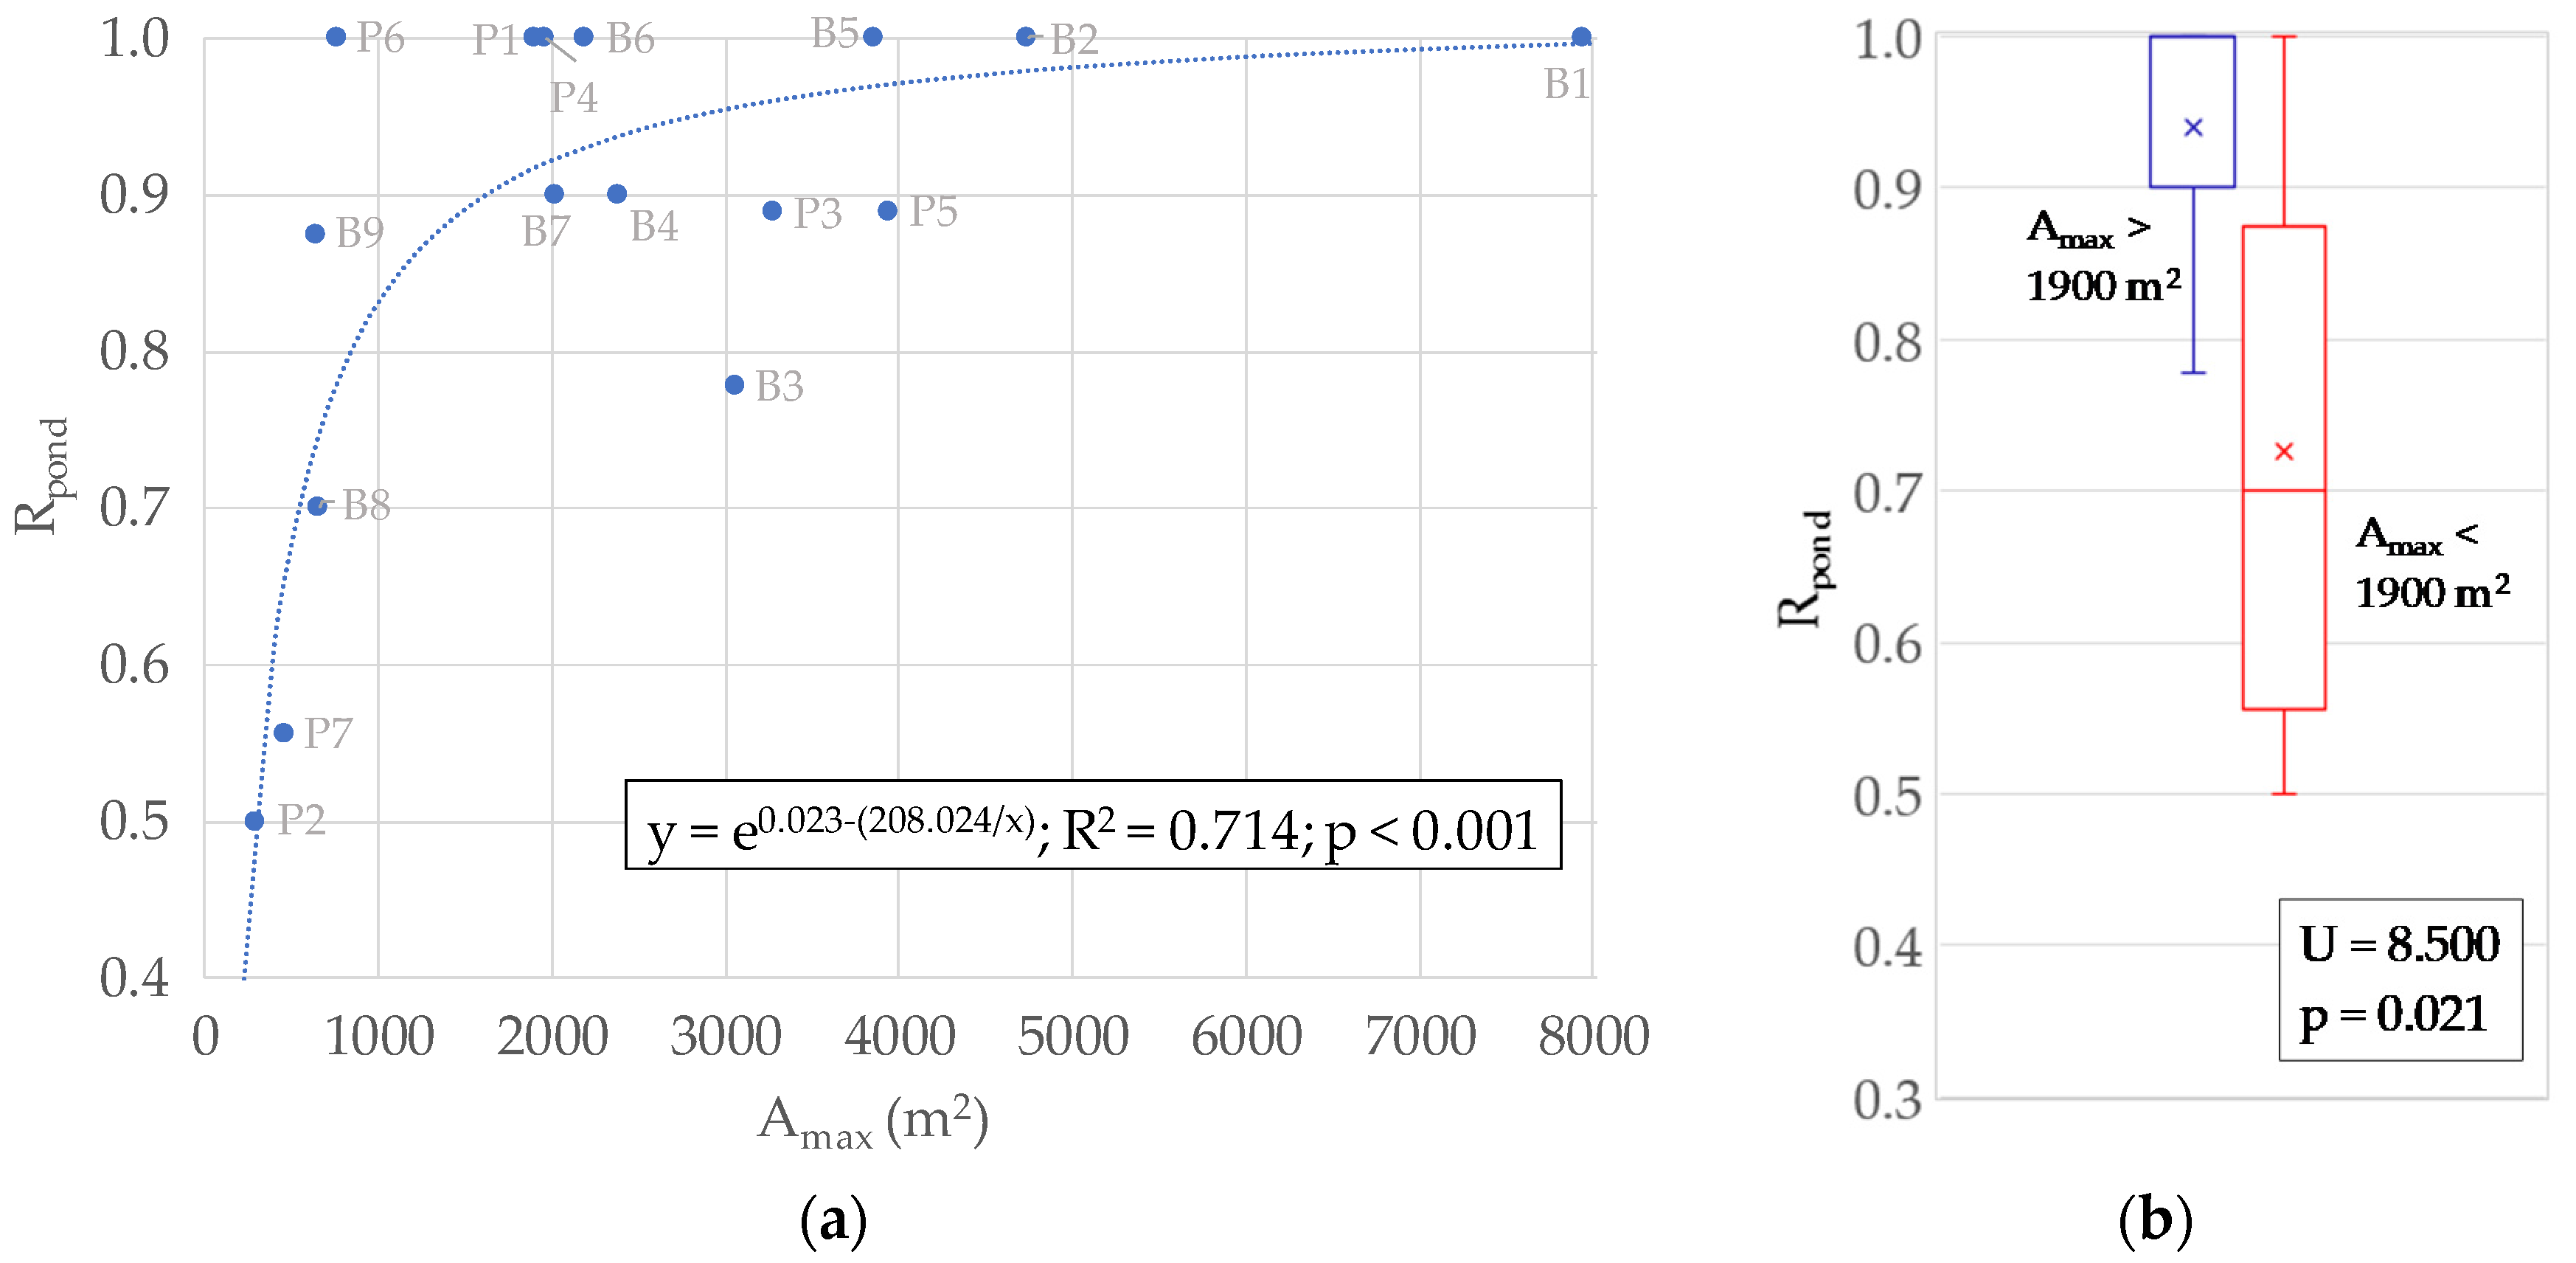
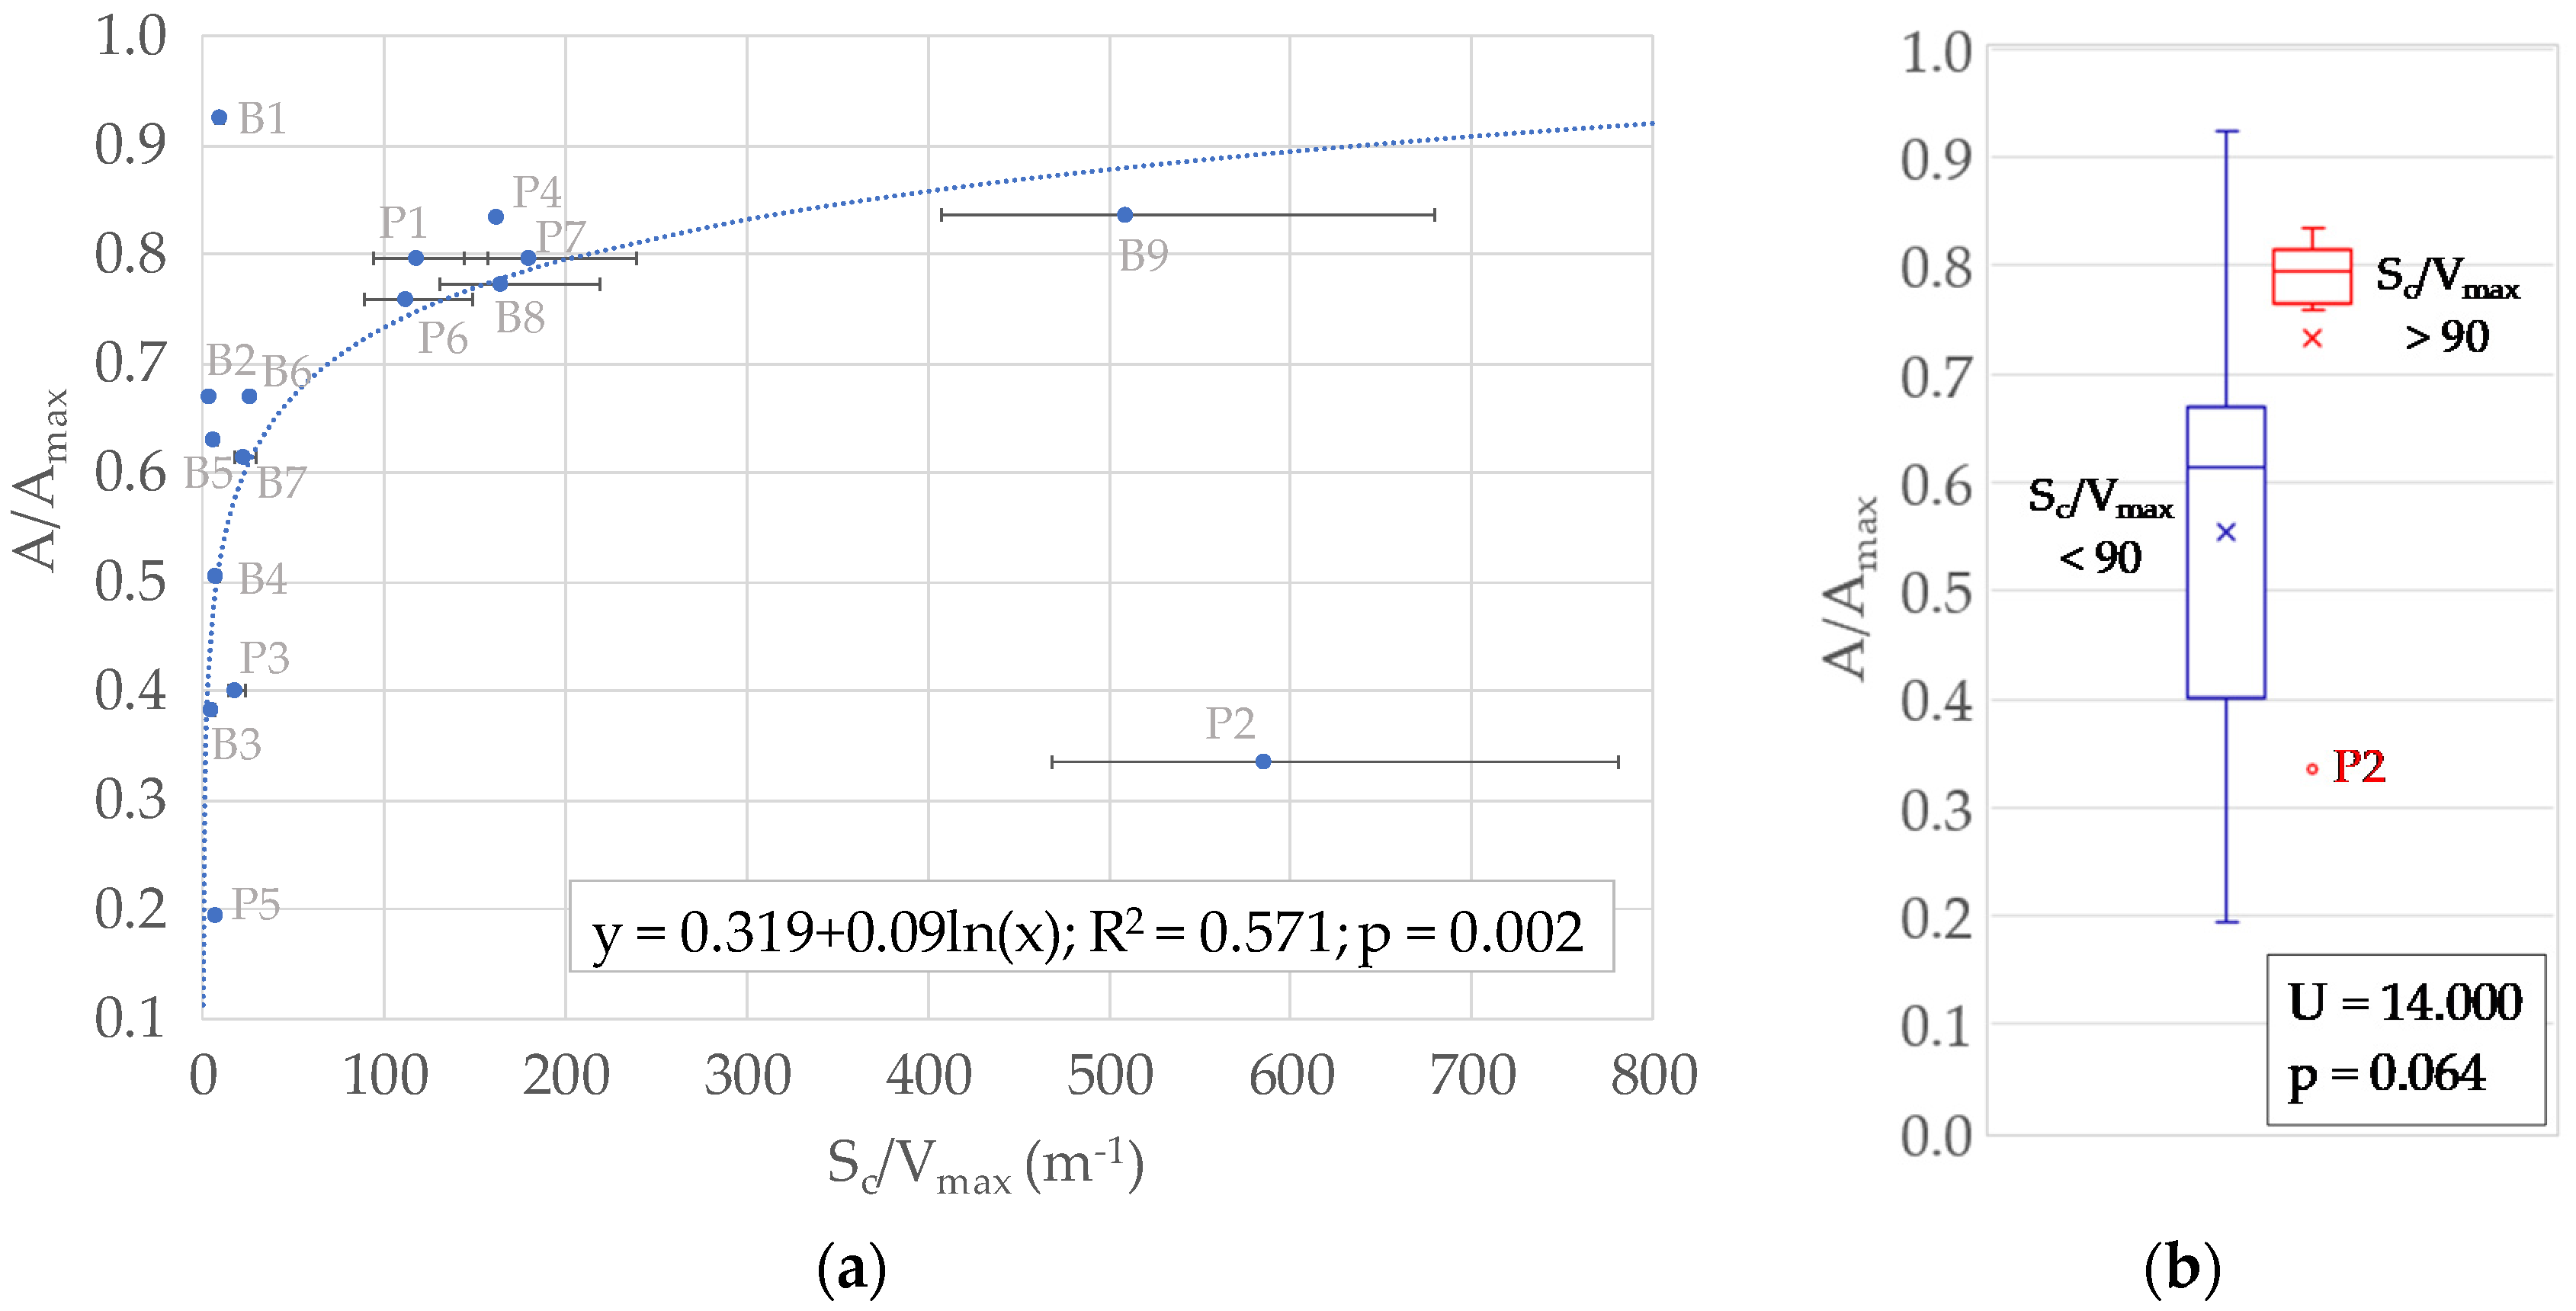
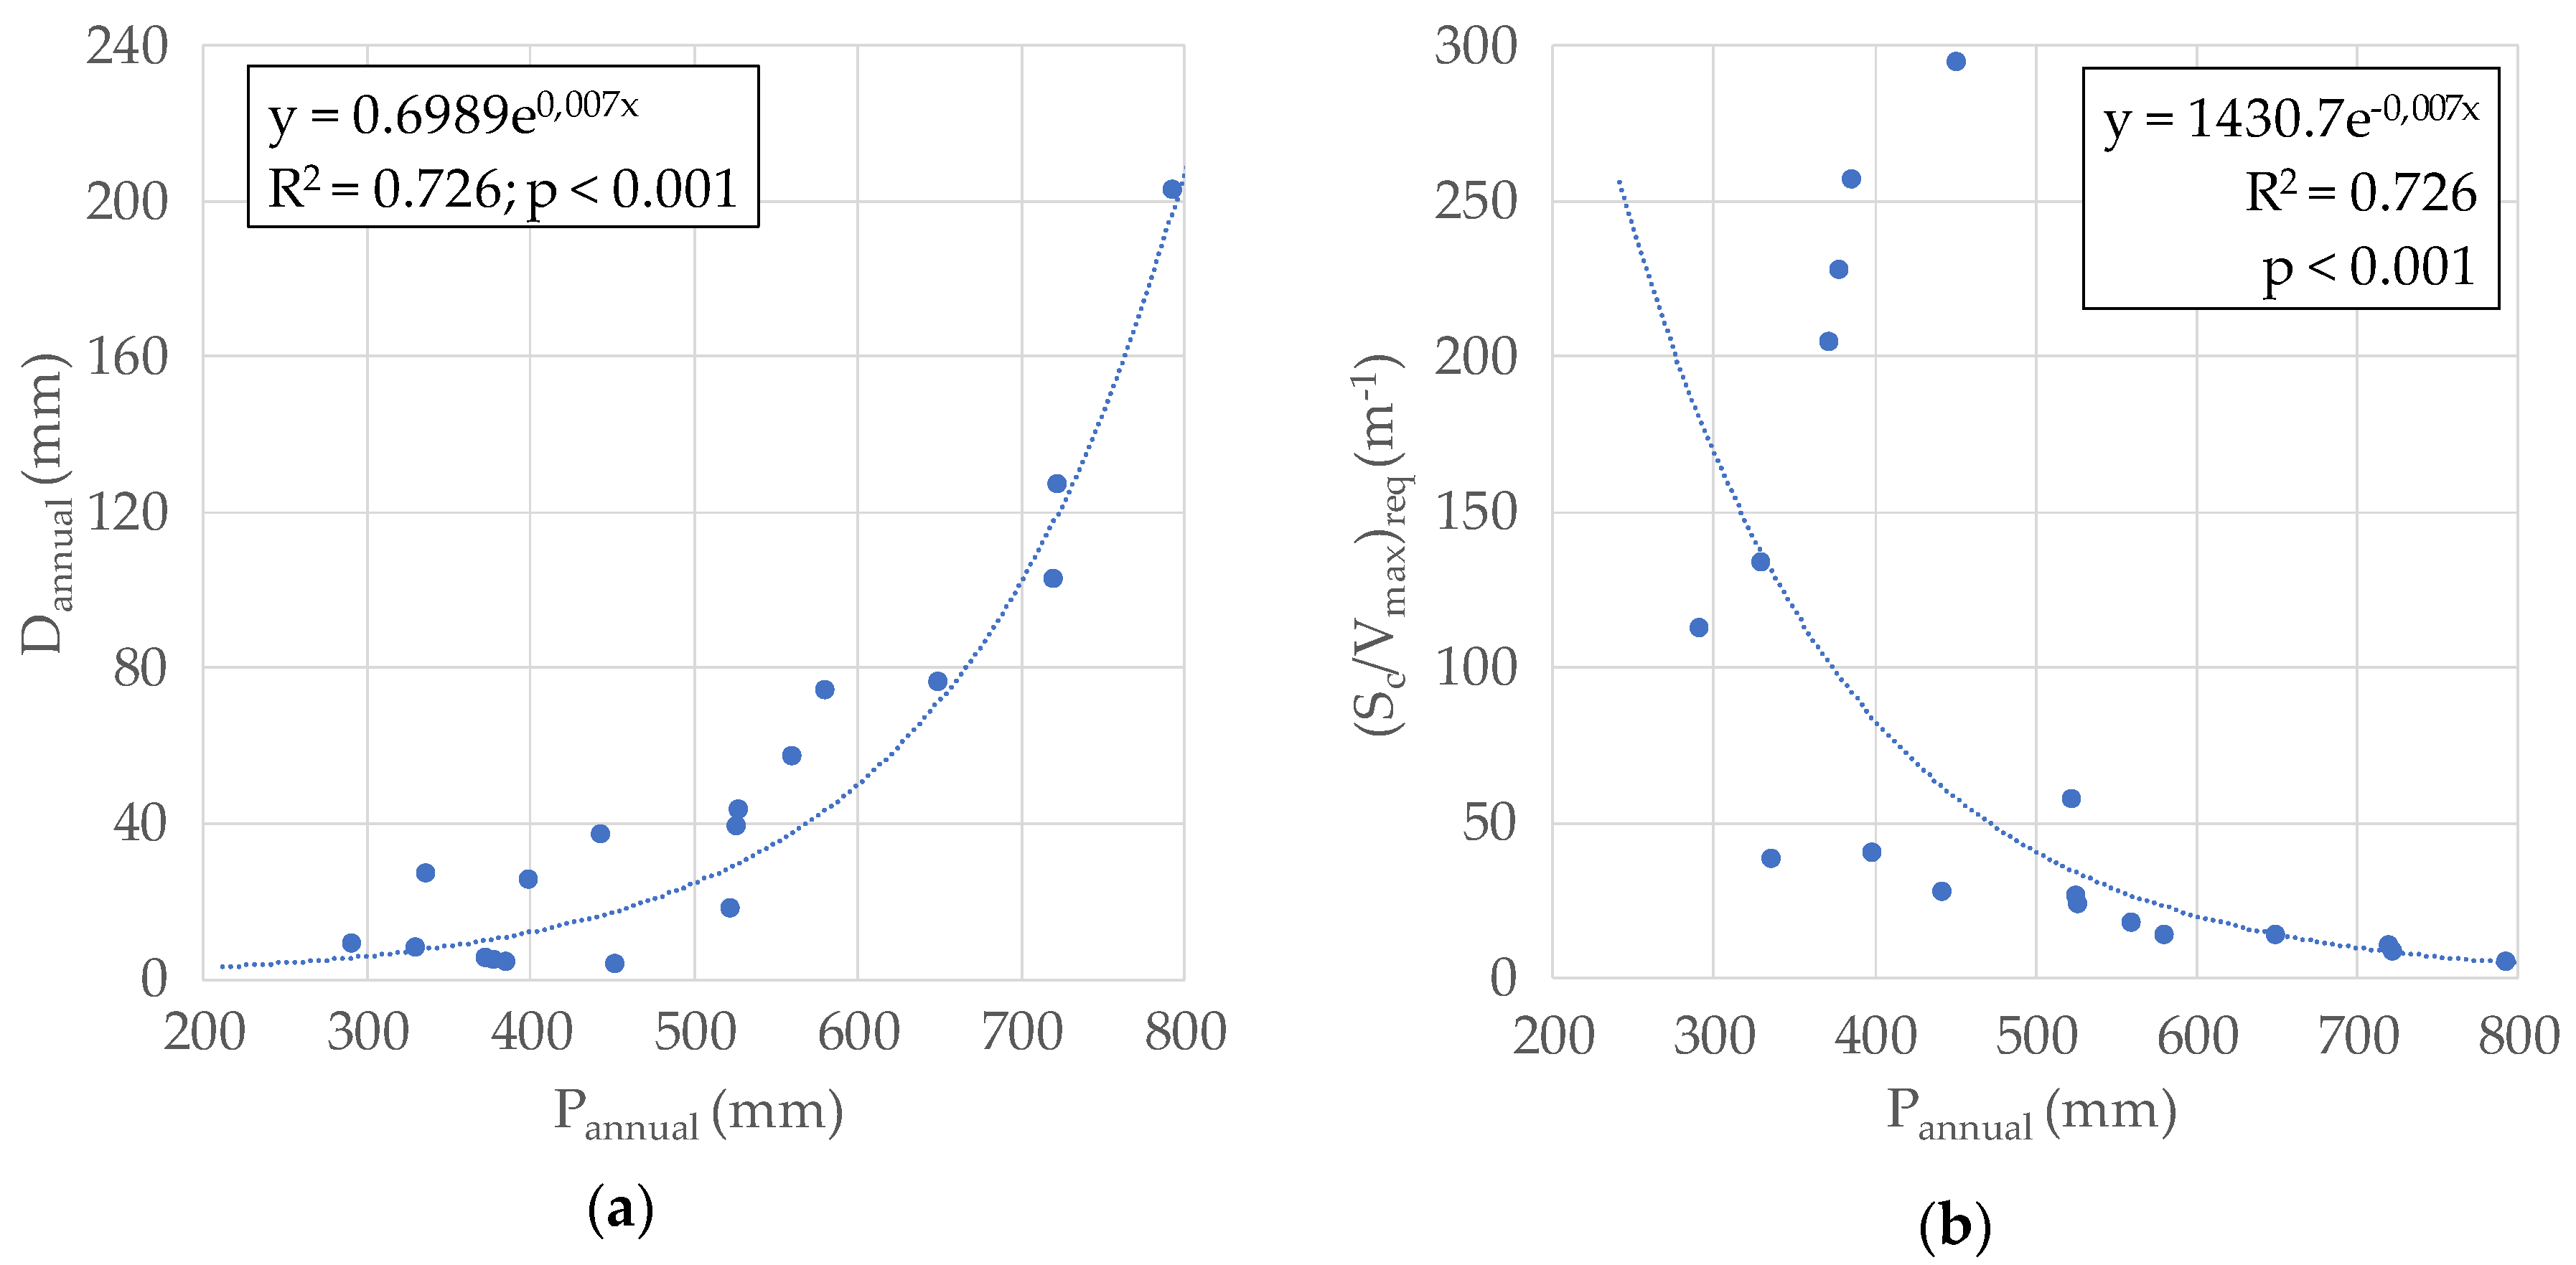
Table 1.
Characteristics of the study farms. Livestock water intake was estimated according to the methodology proposed by Luke [46], considering the number and type of animals of each study farm and the average maximum daily temperatures recorded in the city of Cáceres for the period 1997–2018.
Table 1.
Characteristics of the study farms. Livestock water intake was estimated according to the methodology proposed by Luke [46], considering the number and type of animals of each study farm and the average maximum daily temperatures recorded in the city of Cáceres for the period 1997–2018.
| Study Farm | Area (ha) | Livestock Population (2019 data) | Livestock Water Intake (m3/year) | |||
|---|---|---|---|---|---|---|
| Sheep | Goats | Pigs | Cows | |||
| La Brava | 926 | 60 | 100 | 135 | 897 | |
| Parapuños | 797 | 1200 | 38 | 880 | ||
Table 2.
Meteorological stations used for characterizing rainfall in the study farms (Ref.: reference station; Aux.: auxiliary station; Z: Altitude above sea level; D: Distance to the study farm; r: Pearson correlation coefficient of daily rainfall between reference and auxiliary sites).
Table 2.
Meteorological stations used for characterizing rainfall in the study farms (Ref.: reference station; Aux.: auxiliary station; Z: Altitude above sea level; D: Distance to the study farm; r: Pearson correlation coefficient of daily rainfall between reference and auxiliary sites).
| Name | Role | Longitude | Latitude | Z (m) | D (km) | r |
|---|---|---|---|---|---|---|
| Aliseda (La Umbría) | Ref. (La Brava) | 6°43’56’’ W | 39°25’31’’ N | 370 | 4 | 0.81 |
| Brozas (Araya de Arriba) | Aux. (La Brava) | 6°40’30’’ W | 39°32’56’’ N | 335 | 10 | |
| Monroy | Ref. (Parapuños) | 6°12’46’’ W | 39°38’16’’ N | 378 | 5 | 0.76 |
| Cáceres | Aux (Parapuños) | 6°20’20’’ W | 39°28’17’’ N | 394 | 23 |
Table 3.
Aerial images used in this study (available in December 2019).
| Acquisition Date | Ponds that Appear in the Image | Resolution | Source |
|---|---|---|---|
| June 2002 | B2, B3, B4, B5, B7, B8, B9 | 0.50 m | CNIG |
| June 2002 | P1, P2, P3, P4, P5, P6, P7 | 0.50 m | CNIG |
| March 2003 | P1, P2, P3, P4, P5 | Unknown | Google Earth |
| April 2006 | B1, B2, B3, B4, B5, B6, B7, B8, B9 | 0.50 m | CNIG |
| April 2006 | P1, P2, P3, P4, P5, P6, P7 | 0.50 m | CNIG |
| Summer 2008 | B1, B2, B3, B4, B5, B6, B7, B8, B9 | 0.25 m | CNIG |
| Summer 2009 | P1, P2, P3, P4, P5, P6, P7 | 0.50 m | CNIG |
| August 2009 | P1, P2, P3, P4, P5, P6, P7 | Unknown | Google Earth |
| June 2010 | B1, B2, B3, B4, B5, B6, B7, B8, B9 | 0.50 m | CNIG |
| July 2010 | P1, P2, P3, P4, P5, P6, P7 | 0.25 m | CNIG |
| August 2010 | B4, B5, B6, B7, B8, B9, P3, P5, P6, P7 | Unknown | Google Earth |
| July 2011 | B1, B2, B3, B4, B5, B6, B7, B8, B9 | Unknown | Google Earth |
| July 2011 | P1, P2, P3, P4, P5, P6, P7 | Unknown | Google Earth |
| July 2012 | P1, P2, P3, P4, P5, P6, P7 | 0.50 m | CNIG |
| September 2012 | B1, B2, B3, B4, B5, B6, B7, B8, B9 | 0.25 m | CNIG |
| August 2013 | B1, B2, B3, B4, B5, B6, B7, B8, B9 | Unknown | Google Earth |
| June 2016 | P1, P2, P3, P4, P5, P6, P7 | 0.25 m | CNIG |
| August 2016 | B1, B2, B3, B4, B5, B6, B7, B8, B9 | 0.25 m | CNIG |
| June 2017 | P1, P2, P3, P4, P5, P6, P7 | Unknown | Google Earth |
| July 2017 | B1, B2, B3, B4, B5, B6, B7, B8, B9 a | Unknown | Google Earth |
| August 2018 | B1, B2, B3, B4, B5, B6, B7, B8, B9 a, B10 b | Unknown | Google Earth |
a Pond B9 was enlarged in 2017. In order to maintain consistency between the observations of the images before 2017, the images of 2017 and 2018 were not used for this pond. b B10, constructed in 2018, was discarded in the hydrological analyses.
Table 4.
Characteristics of the study ponds: maximum pond area (Amax), pond capacity (Vmax), and catchment area (Sc).
Table 4.
Characteristics of the study ponds: maximum pond area (Amax), pond capacity (Vmax), and catchment area (Sc).
| Farm | Pond | Amax (m2) | Vmax (m3) | Sc (m2) |
|---|---|---|---|---|
| La Brava | B1 | 7946 | 30,502 | 275,275 |
| B2 | 4748 | 12,116 | 43,200 | |
| B3 | 3067 | 5534 | 28,300 | |
| B4 | 2390 | 3539 | 25,300 | |
| B5 | 3857 | 8347 | 51,650 | |
| B6 | 2198 | 3351 | 89,100 | |
| B7 | 2030 | 2641 | 58,650 | |
| B8 | 667 | 359 | 58,850 | |
| B9 | 649 | 342 | 174,025 | |
| B10 | 2353 | 3441 | 113,000 | |
| Parapuños | P1 | 1901 | 2347 | 275,826 |
| P2 | 304 | 88 | 51,348 | |
| P3 | 3277 | 6232 | 110,786 | |
| P4 | 1970 | 2158 | 349,162 | |
| P5 | 3950 | 8711 | 57,206 | |
| P6 | 770 | 464 | 51,875 | |
| P7 | 468 | 190 | 34,114 |
Table 5.
Results of the cluster analysis of K-means carried out for variables Rpond and RAPR.
| Cluster | Centers of the Final Clusters | Ponds in Each Cluster | Distance from the Cluster Center | |
|---|---|---|---|---|
| Rpond | RAPR (months) | |||
| 1 | 0.93 | 8.18 | B1 | 0.804 |
| B2 | 0.721 | |||
| B3 | 0.225 | |||
| B4 | 0.797 | |||
| B5 | 0.704 | |||
| B6 | 0.725 | |||
| B7 | 0.038 | |||
| P3 | 0.715 | |||
| P5 | 1.430 | |||
| 2 | 0.80 | 3.97 | B8 | 1.365 |
| B9 | 0.313 | |||
| P1 | 1.323 | |||
| P2 | 1.550 | |||
| P4 | 0.212 | |||
| P6 | 0.705 | |||
| P7 | 0.739 | |||
© 2020 by the authors. Licensee MDPI, Basel, Switzerland. This article is an open access article distributed under the terms and conditions of the Creative Commons Attribution (CC BY) license (http://creativecommons.org/licenses/by/4.0/).
Share and Cite
MDPI and ACS Style
Marín-Comitre, U.; Schnabel, S.; Pulido-Fernández, M. Hydrological Characterization of Watering Ponds in Rangeland Farms in the Southwest Iberian Peninsula. Water 2020, 12, 1038. https://doi.org/10.3390/w12041038
AMA Style
Marín-Comitre U, Schnabel S, Pulido-Fernández M. Hydrological Characterization of Watering Ponds in Rangeland Farms in the Southwest Iberian Peninsula. Water. 2020; 12(4):1038. https://doi.org/10.3390/w12041038
Chicago/Turabian StyleMarín-Comitre, Ubaldo, Susanne Schnabel, and Manuel Pulido-Fernández. 2020. "Hydrological Characterization of Watering Ponds in Rangeland Farms in the Southwest Iberian Peninsula" Water 12, no. 4: 1038. https://doi.org/10.3390/w12041038
Note that from the first issue of 2016, this journal uses article numbers instead of page numbers. See further details here.