Article

Predicting River Embankment Failure Caused by Toe Scour Considering 1D and 2D Hydraulic Models: A Case Study of Da-An River, Taiwan

1
National Science and Technology Center for Disaster Reduction, New Taipei City 23143, Taiwan
2
Department of Geosciences, National Taiwan University, Taipei 10617, Taiwan
*
Author to whom correspondence should be addressed.
Water 2020, 12(4), 1026; https://doi.org/10.3390/w12041026
Submission received: 27 February 2020 / Revised: 31 March 2020 / Accepted: 1 April 2020 / Published: 3 April 2020
(This article belongs to the Section Hydraulics and Hydrodynamics)

Abstract

:
Physically based numerical models can predict scour depth at embankments located in bend reaches. However, methodologies for utilizing these numerical models to assess the risk of reinforced concrete embankment failure are rarely investigated. Therefore, a new assessment methodology is proposed to predict the riverbank failure caused by bend scour. The methodology is primarily based on a bend scour simulation model that integrates a one-dimensional (1D) hydraulic model, a two-dimensional (2D) hydrodynamic finite-volume model, and an empirical equation of bend scour prediction. The model was first applied to the Shuiwei Embankment located in a river bend reach of Da-An River in Taiwan and verified against results from the 1D hydraulic model and field data. The model was then used to simulate 2D flow field and the temporal evolution of bend scour depth under different return period flood events to examine the relationships between river discharge, water level, shear stress, and bend scour depth. The influence of shear stress on the stability of toe protections was also investigated. The field data (from two events) and numerical solutions (four scenarios) were assessed to conceive two empirical equations for predicting shear stress and bend scour depth. A new assessment methodology was proposed using these two equations to predict the risk of river embankment failure during flood periods. The proposed methodology can be easily applied in other disaster-prone regions to mitigate the effects of disasters caused by bend scouring.

1. Introduction

The principal purpose of river embankments is to reduce flood risk and protect properties. Taiwan is located in the Pacific Ocean and is struck by three to four typhoons per year on average. Typhoon-induced floods frequently cause disasters. For example, Typhoon Morakot hit Taiwan in 2009, causing severe river embankment failures and numerous deaths. Several mechanisms may lead to river embankment failure during flooding periods, including overtopping, toe scouring of the foundation, seepage, or piping and slope sliding of river embankments [1,2,3,4]. To reduce the risk of riverbank failure disasters, studies on river embankment failures that involve considering different failure mechanisms are required.
Riverbank failure is a complex spatiotemporal process involving fluvial vertical and lateral erosion, seepage erosion, and geotechnical failure. Several empirical models and process-based models have been proposed to assess river embankment failure. Langendoen and Simon [5] applied the channel evolution model termed CONCEPTS (conservational channel evolution and pollutant transport system) to simulate the processes of river embankment failure in a bend reach on Goodwin Creek. Hossain et al. [6] employed a limit equilibrium stability analysis and steady-state seepage analysis to investigate river embankment failure in the Manu River. To account for seepage, Polemio and Lollino [7] adopted a finite element method to analyze the failure process of embankment slope stability in Apulia, Italy. Midgley et al. [8] proposed a bank stability and toe erosion model (BSTEM) to predict riverbank stability in the Barren Fork Creek streambank. The BSTEM can be used to estimate the timing of riverbank collapse and riverbank retreat from noncohesive and cohesive fluvial erosion. Huang et al. [9,10] employed a limit equilibrium method to assess river embankment stability in southern Taiwan for various flood return periods. In their adopted method, three failure mechanisms can be studied: overtopping, levee foundation scouring, and slope sliding. Hossain and Haque [11] employed numerical finite element software to evaluate the influence of short-term rainfall on embankment stability in the Jamuna River.
These studies have indicated that river embankment failure models are capable of simulating hydraulic or geotechnical processes involved in embankment failure. Furthermore, combinations of physically based numerical models and riverbank failure models have been used to predict river embankment failure. For example, Faeh [12] proposed a 2D depth-averaged model to simulate the overtopping breaching of embankments in the Elbe River. Jia et al. [13] presented a three-dimensional (3D) model of riverbank erosion in the Shishou bend of the middle Yangtze River. This 3D bank failure model simulates riverbank erosion of noncohesive material. Mizutani et al. [14] proposed a numerical model to simulate river embankment failure caused by overtopping flow that accounted for infiltration effects. Their proposed numerical model comprises three modules: 2D shallow-water flow with nonequilibrium, sediment transport, seepage flow, and 2D slope stability. Lai [15] presented a 2D morphodynamic model coupled with a riverbank erosion model, to model both vertical and lateral riverbank erosion. The model is robust and predicted bank retreat distance in studies in both the Middle Rio Grande and Cho-Shui River. Rousseau et al. [16] coupled the Telemac–Mascaret model with a geotechnical module to simulate riverbank erosion in the meandering river reach of the Medway Creek, London, Ontario. Stecca et al. [17] proposed a simplified algorithm for noncohesive riverbank erosion in the Selwyn River of New Zealand to reduce the 2D morphodynamic model to a cross-sectional model.
These studies have primarily focused on assessing earthen types of riverbank failure. Few studies have assessed embankment failure in reinforced concrete. In Taiwan, the Water Resource Agency (WRA) [18] reported that embankment toe scouring is the most common failure mechanism in reinforced concrete river embankments and frequently occurs in a bend reach. When modeling the bend scouring caused by floods, a challenge is to develop a numerical model that accurately consider physical processes of scour. Therefore, Guo et al. [19] proposed a simplified simulation method for simulating flood-induced embankment toe scouring in bend reaches. The method involves the use of two models: one predicts a 2D flow field and the other estimates the temporal evolution of bend scour depth near the embankment. The agreement between the simulated and field-measured bend scour depth against time at the Shuideliaw Embankment on the Cho-Shui River is good. However, further investigation of other rivers is required to assess the model applicability. Furthermore, field scouring data have become available and could be incorporated in a new bend scour computation equation. Moreover, methods for embankment toe protection could be considered for enhancing the practical applications of scour models in the riverbank failure assessment. In the present study, the simulation method by Guo et al. [19] will be extended to link with 1D model for predicting river embankment failure caused by toe scour.
The purpose of this paper is to present a novel bend scour simulation model based on the simulation method reported by Guo et al. [19]. The present scour model integrates the 1D module of the WASH123D (Watershed Systems of 1-D Stream-River Network, 2-D Overland Regime, and 3-D Subsurface Media) model [20], hereafter referred to as the WASH1D model, the SFM2D (shallow-water finite-volume model) [19], and a predictive equation of bend scour depth [21]. Through the boundary connection of 1D-2D models, it is possible to achieve more accurate flow and scouring at embankment toe and apply the 1D model elsewhere in the river reach. In this way, the computational time can be saved because the number of cross-sections in 1D model are relatively lower than those of computational grids in 2D model. The SFM2D model linked with WASH1D applied to the river flow is thus suitable for modelling the unsteady short-term toe scouring. Two bend scouring events that occurred in 2017 and 2018 in a braided reach of Da-An River, Taiwan, were selected as case study sites for evaluating the applicability of this integrated model. To adequately represent river bed topography in the scour model, an unmanned aerial system (UAS) was created and implemented to collect high-resolution topographic data as the basis for bend scour simulations. Furthermore, the effects of shear stress and bend scour depth on the risk of riverbank failure were studied. Correspondingly, a predictive methodology that considers methods of toe protection is proposed to assess river embankment failure.
The contributions of this study include (a) the application of the bend scour simulation model to the practical river flow simulation in the natural-irregular riverbed, (b) two proposed empirical equations for practical use in predicting shear stress and bend scour depth, and (c) the new proposed assessment methodology for rapidly predicting the risk of river embankment failure prior to field site investigation.

2. Bend Scour Simulation Model

According to Melville and Coleman [22], bend scour is defined as the short-term general scour. The special feature of bend flow leads to the presence of secondary currents and causes increased scour near the embankment toe. Field observations at a specific location could be helpful in assessing the magnitude of bend scour. In addition, numerical analysis has become popular in investigating scouring. Therefore, it is desirable to propose a bend scour simulation model that practically predict the flow field and temporal evolution of bend scouring so that simulation time efficiency is achieved. This may be performed by following the framework reported by Melville and Coleman [22].
Scour analysis can be undertaken at appropriate scales within the scale connection. The five appropriate scales are catchment scale, stream section scale, river structure far-field scale, river structure near-field scale, and local scour scale. Different analysis tools are used for different spatial scales. The bend scour simulation model proposed in this study is based on a boundary connection of the WASH1D model, SFM2D model, and empirical-based bend scour equation.
The linking procedure is conducted in the following steps: (a) The WASH1D model for unsteady river flow is employed at the stream section scale to simulate the flow parameters (river discharge, river velocity, and water level) as input data for 2D bend scour modeling at the river structure far-field scale, (b) the SFM2D model is employed to predict the flow velocity and water depth near the river structure, and (c) the collected results values are input into the empirical equation to predict the temporal evolution of the localized scour depth. Summaries of the models and the boundary connection of WASH1D and SFM2D are presented in this section.

2.1. WASH1D Model

The WASH123D model consists of three basic modules: a 1D river routing module, a 2D overland inundation module, and a 3D subsurface computation module. The model has been successfully employed for various applications, including channel flood routing [23,24], river discharge estimations [25,26], and 2D inundation simulations [27,28]. For 1D river routing, the WASH1D model solves the following continuity and momentum equations:
A t + Q x = S S + S R S E + S F + S 1 + S 2
Q t + V Q x = g A ( Z 0 + h ) x g A h c ρ Δ ρ x F X x + ( M S + M R M E + M F + M 1 + M 2 ) + B τ S P τ b ρ
where t is time; x is the axis along the river direction; A is the cross-sectional area of the river; Q is the flow rate of the river; SS is the human-induced source; SR is the source caused by rainfall; SE is the sink caused by evapotranspiration; SF is the source caused by exfiltration from the subsurface media; S1 and S2 are the source terms contributing to overland flow; V is the river velocity; g is gravity; Z0 is the bottom elevation; h is the water depth; ρ is the water density; Δρ = ρρ0 is the density deviation from the reference density (ρ0), which is a function of temperature and salinity as well as other chemical concentrations; c is the shape factor of the cross-sectional area; Fx is the momentum flux caused by eddy viscosity; MS is the external momentum–impulse from artificial sources or sinks; MR is the momentum–impulse from rainfall; ME is the momentum–impulse lost to evapotranspiration; MF is the momentum–impulse from the subsurface by exfiltration; M1 and M2 are the momenta–impulses from the overland flow; B is the top width of the cross-section; τS is the surface shear stress; P is the wet perimeter; τb is the bottom shear stress, which can be assumed proportional to the flow rate as τb/ρ = κV2 where κ = g(nM)2/(RH)1/3, where RH is the hydraulic radius and nM is the Manning roughness.
Equations (1) and (2) are solved using numerical methods, including a hybrid Lagrangian-Eulerian finite element method for dynamical wave model, conventional finite element method for diffusion wave model, and semi-Lagrangian method for kinematic wave model. In this paper, the kinematic wave model in WASH1D is adopted for numerical modelling. In addition, this study focuses on the river routing and bend scour simulation. Compared to upstream watershed, the effect of the rainfall and the exfiltration on river channel flow process is relatively small. For this reason, the source terms relating to rainfall, exfiltration, overland flow, and evapotranspiration are neglected herein. Only the sources of MS and SS are considered as lateral flows.
Three boundary conditions are implemented in the WASH1D model: (1) water depth, (2) river discharge, and (3) rating curves (water stage–discharge relationship). A related study provided a more detailed description of the WASH1D model [20].

2.2. SFM2D Model

To simulate typhoon-induced flood flow involving irregular riverbeds, a hydrodynamic SFM2D model was employed in the framework of the cell-centered finite volume method. In this model, the 2D depth-averaged shallow-water governing equations in conservation form are as follows [29,30]:
Q t + F I x + G I y = F V x + G V y + S
in which
Q = [ h , h u , h v ] T
F I = [ h u , h u 2 + 1 2 g h 2 , h u v ] T ;   G I = [ h v ,   h u v , h v 2 + 1 2 g h 2 ] T
F V = [ 0 , h T x x / ρ , h T x y / ρ ] T ;   G V = [ 0 , h T x y / ρ , h T y y / ρ ] T
S = [ 0 , g h ( s 0 x s f x ) , g h ( s 0 y s f y ) ] T ,
where Q is the vector of conserved variables; FI and GI are the inviscid flux vectors in the x and y directions, respectively; FV and GV are the viscous flux vectors in the x and y directions, respectively; S is the source term; u and v are the depth-averaged velocity components in the x and y directions, respectively; Txx, Txy, and Tyy are the depth-averaged turbulent stresses; s0x and s0y are the bed slopes in the x and y directions, respectively; and sfx and sfy are the friction slopes in the x and y directions, respectively.
For the divergence theorem and the rotational invariance of the governing equations [30], Equation (3) can be represented by
d Q d t + 1 A c e l l m = 1 M T ( θ ) 1 F ( Q ¯ ) L m = 1 A c e l l Ω S dW c e l l
where Acell is the area of the cell; dWcell is the area element; is the control volume; m is the index representing the side of the cell; M is the total number of sides for the cell; T(θ)−1 is the inverse of the rotation matrix corresponding to the m side; θ is the angle between the outward unit vector n and the x axis; n is the outward unit vector normal to the boundary of the control volume; Lm is the length of the m side of the cell; F ( Q ¯ ) = F I ( Q ¯ ) F V ( Q ¯ ) is the numerical flux; F I ( Q ¯ ) is the inviscid numerical flux; F V ( Q ¯ ) is the viscous numerical flux; Q ¯ = [ h , h u u , h v t ] T is the vector of conserved variables transformed from the original vector of conserved variables Q, in which u n = u cos θ + v sin θ and v t = v cos θ u sin θ are respectively the flow velocity components in normal and tangential directions.
The SFM2D model involves using appropriate algorithms to solve Equation (8). For the time integration and treatment of the source terms, the fractional splitting technique is used to obtain a well-balanced finite-volume scheme:
Q n + 1 = I ( Δ t ) H ( Δ t ) ( Q n )
where H ( Δ t ) and I ( Δ t ) are operators associated with solutions to the homogeneous and inhomogeneous parts, respectively; n is the time index; ∆t is the time step; Qn is the vector of conserved variables for a cell at time index n. Equation (9) is then solved with the Euler method for a homogeneous part and the hydrostatic reconstruction method for source terms. The upstream flux-splitting finite-volume (UFF) scheme proposed by Lai et al. [29] has been verified and is especially suitable for resolving shallow-water free-surface flow involving discontinuities as well as hybrid flow regimes. Therefore, the UFF scheme was utilized to compute numerical inviscid fluxes of mass and momentum. Further detailed descriptions of the SFM2D model have been reported [29,30].

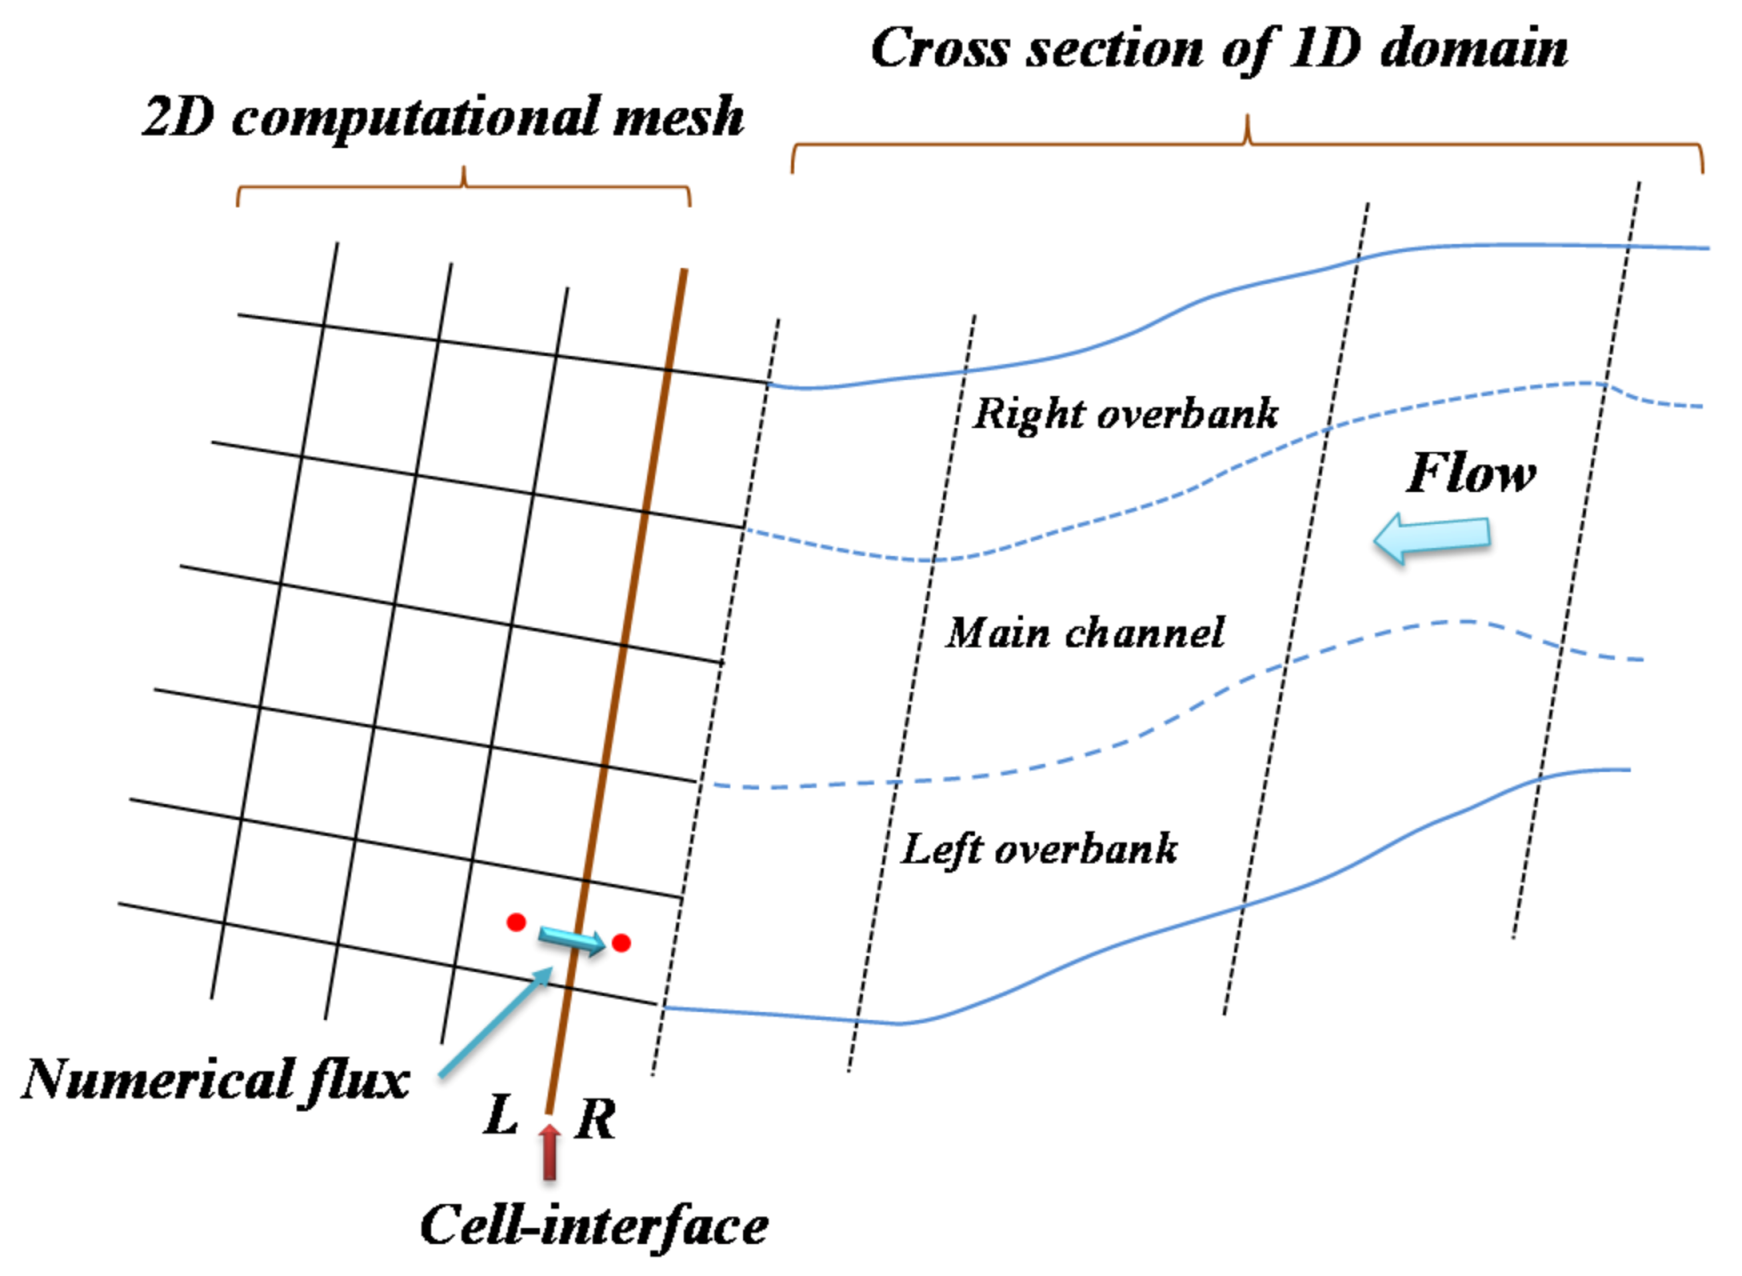
2.3. Boundary Connection of 1D and 2D Models

The 2D model is suitable for providing accurate hydraulic resolutions at the river reach containing river structures. When the length of river reach is quite long, the 2D model requires more computational grids and thus is time-consuming. Moreover, if the gauging stations failed, the measured data may not be obtained. Therefore, the measured data could be achieved from 1D numerical model, which is quite suitable for longer river reach with quite less computational time consumed.
The integration of 1D and 2D numerical models is becoming an increasingly efficient approach for creating river flood simulations [31,32,33,34,35]. The flux-based connection method in flow direction proposed by Bladé et al. [33] is employed in this study for its practical advantage. When the 1D river reaches flow into a 2D domain, the flux treatment at the connection boundary is necessary to ensure the mass conservation. As displayed in Figure 1, the variable with subscript L is the known state and the value with subscript R is the unknown solution at the boundary. The variables at initial time step condition represent the known variables ( h L 2 D , u n L 2 D and v t L 2 D ). Hence, the unknown variables ( h R 2 D , u n R 2 D and v t R 2 D ) can be computed based on different flow conditions.
Four conditions are implemented as follows:
  • When the inflow at the connection boundary is subcritical, the unknown unit width discharge ( h u n ) R 2 D has to be given. The three unknown variables ( h R 2 D , u n R 2 D , and v t R 2 D ) can be solved simultaneously from the following three equations [36,37]:
    ( h u n ) R 2 D = ( h u n ) R 1 D ,   ( u n ) L 2 D + 2 g h L 2 D = ( u n ) R 2 D + 2 g h R 2 D ,   ( v t ) R 2 D = ( v t ) L 2 D
    in which the unit width discharge ( h u n ) R 1 D could be given from the simulated results of the WASH1D model. Thus, the value of ( h u n ) R 1 D at the flow distribution in 2D computation cells can be achieved from the following equation calculations:
    ( h u n ) R 1 D = ( h u c , o l , o r ) R 1 D = Q c , o l , o r A c , o l , o r
    Q c , o l , o r = Q K c , o l , o r K c + K o l + K o r ,   K c , o l , o r = A c , o l , o r ( R H ) c , o l , o r 2 / 3 ( n M ) c , o l , o r
    where K is the conveyance, and the variables with subscript c, ol, and or denote the values at the main channel, left overbank, and right overbank, respectively.
  • When the outflow at the connection boundary is subcritical, the unknown water depth h R 2 D should be given. Thus, other two unknown variables ( u n R 2 D and v t R 2 D ) can be obtained from the following two relationships:
    ( u n ) R 2 D = ( u n ) L 2 D + 2 g ( h L 2 D h R 2 D ) ,   ( v t ) R 2 D = ( v t ) L 2 D
    in which water depth h R 2 D is obtained from the 1D simulated results (e.g., h R 2 D = h R 1 D ).
  • When the inflow at the connection boundary is supercritical, all three unknown variables (i.e., h R 2 D , u n R 2 D and v t R 2 D ) should be given from measured data. However, as the field data are not available, one can use the relation ( h R 2 D = h R 1 D ) and employ Equations (11) and (12) to achieve variables u n R 2 D and v t R 2 D .
  • When outflow at the connection boundary is supercritical, the transmissive boundary conditions are specified as follows:
    h R 2 D = h L 2 D ,   ( u n ) R 2 D = ( u n ) L 2 D ,   ( v t ) R 2 D = ( v t ) L 2 D
Employing the integration of 1D and 2D models, the main advantage of the above flux-based connection method is that the numerical fluxes and source terms are preserved to maintain stable solutions. For the numerical modelling, the Courant-Friedrichs-Lewy (CFL) condition is required to ensure numerical stability. Thus, the time step must be limited by [36,37]:
Δ t CFL min [ d L , R max ( u 2 + v 2 + g h ) L , R ]
where d L , R denotes the distances between the centroids of the two adjacent cells (e.g., L and R).

2.4. Empirical Equation for Bend Scour Prediction

Several empirical equations were developed and can be used to estimate bend scour depth [38,39,40]. However, most equations were obtained using laboratory data. Therefore, these laboratory-based equations may not be suitable for predicting bend scouring in the natural river.
The development of more reliable equations using field data are required. Lin and Lin [41] and Lu [42] have presented highly efficient numbered-brick method for directly measuring bend scour depths at embankment sites of Cho-Shui River and Da-Chia River. Furthermore, Hong [21] employed sand pots and wireless tracers to measure the short-term field evolution of bend scour at specific embankments at Da-Chia River and Da-An River. The field data obtained from these measurements enable numerical model verifications. The field data can also be used to develop more reliable empirical equations than those based on laboratory scour data.
To develop a reliable equation for the maximum scour depth in a river bend, Guo et al. [19] collected field data for short-term bend scour in Taiwan and proposed a practical computation equation. More bend scouring field data have become available; thus, the computation equation from Guo et al. [19] can be reconstructed. Hong [21] introduced a concept of effective flood peak duration (tp) to determine the following physical parameters:
d b s = ϕ ( q , t p , S 0 , σ g , W , R 0 )
where φ is an unknown function; q is the unit width discharge; dbs is the bend scour depth; S0 is the channel slope; σg is the geometric standard deviation of the particle size distribution; Rc (= Ro − 0.5 W) is the centerline radius of the bend, where Ro is the outer radius of the bend and W is the water surface width.
Su and Lu [43] defined that the effective peak flow duration is the time spent from critical flow discharge (Qc) to peak flow discharge (Qp) in the rising limb of a flood event. For practical application, Qc can be expressed as the width-full flow discharge. From the field study by Su and Lu [43], the higher duration value tends to cause embankment damage during flood-induced scouring. Thus, the effective peak–flow duration is one of the significant factors in affecting embankment toe failure.
On the basis of field data collected from Cho-Shui River, Da-Chia River, and Da-An River from 11 flood events, the reconstructed scour estimation equation can be expressed as follows [21]:
d b s R c = 0.114 ( q t p R c 2 ) 0.162 ( W R c ) 1.33 S 0 0.072 σ g 0.788
Equation (17) should enable more accurate predictions than laboratory-based equations because it is based on specific field data in Taiwan. In addition, it is easy to apply in 1D and 2D numerical algorithms because of the concept of approach flow [19]. The data ranges for Equation (17) are as follows: S0 = 0.486%–1.11%, Rc = 500–985 m, σg = 3.28–19.96, tp = 1.5–44 h, q = 8.90–23.88 m2/s, and W = 60–450 m, respectively. For modelling bend scour, physical variables expressed in Equation (17) are used to predict bend scour depth. The values of W and q can be obtained from WASH1D and SFM2D models. Others (e.g., σg, S0, Rc, tp) are achieved from the field data.

3. Bend Scour Simulation Results and Discussions

Figure 2 shows the methodological flow chart of bend scour simulations. Section 3.1 describes the study site, field data collection, and model setup for WASH1D and SFM2D models. Section 3.2 and Section 3.3 present the numerical modelling, including the performance verifications of WASH1D model and SFM2D model. In Section 3.3, comparisons of WASH1D and SFM2D concerning boundary connection are presented. In Section 4, the application of SFM2D model for river embankment failure assessment is given and the proposed assessment methodology is also discussed.

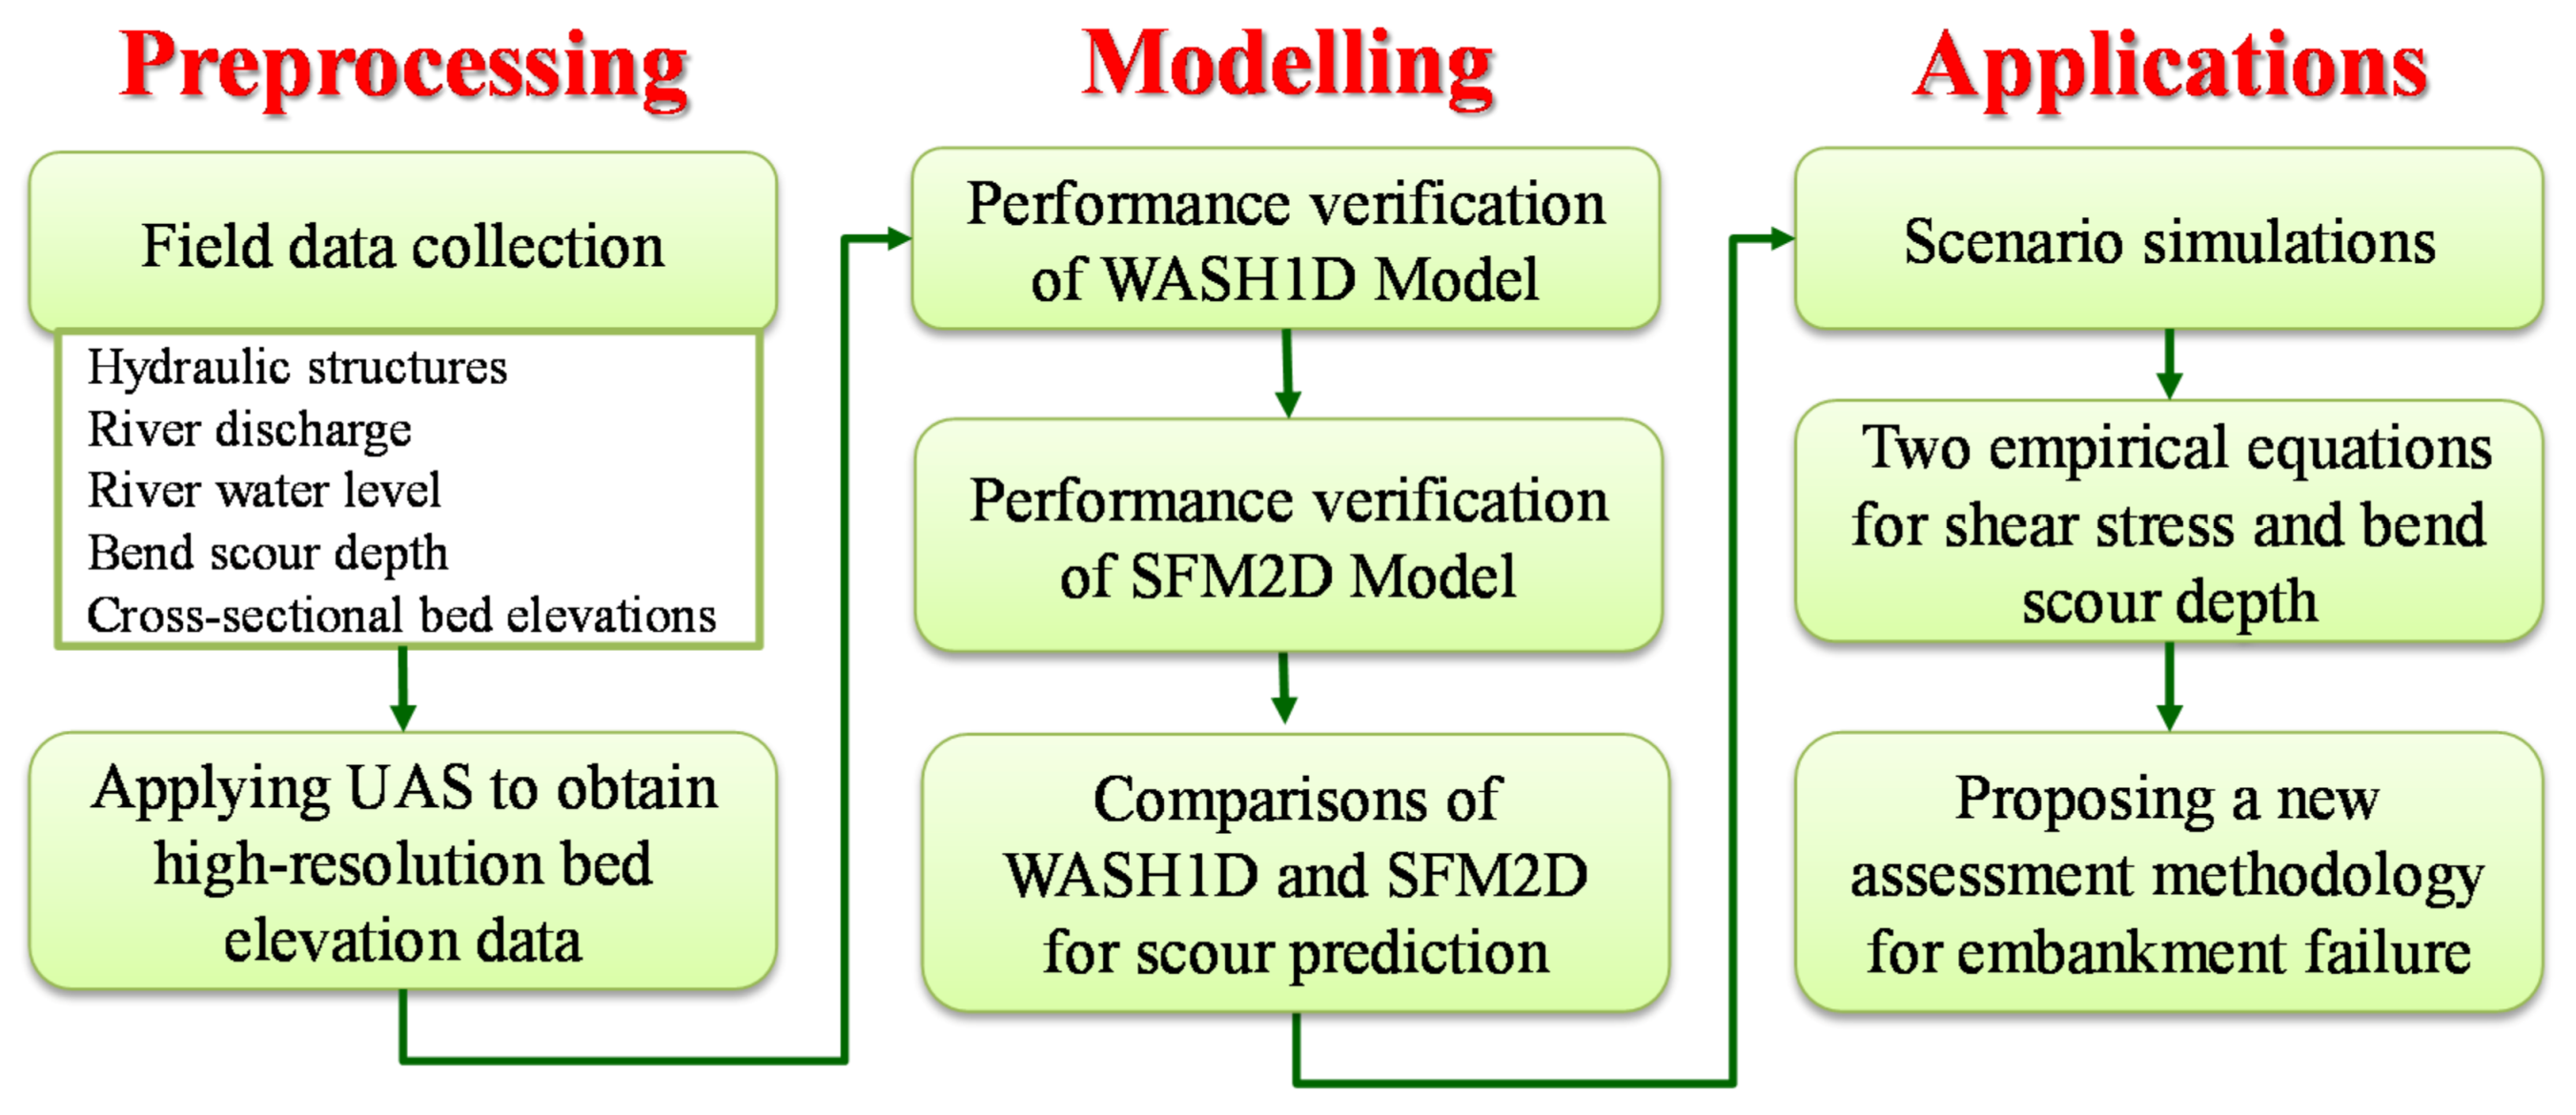
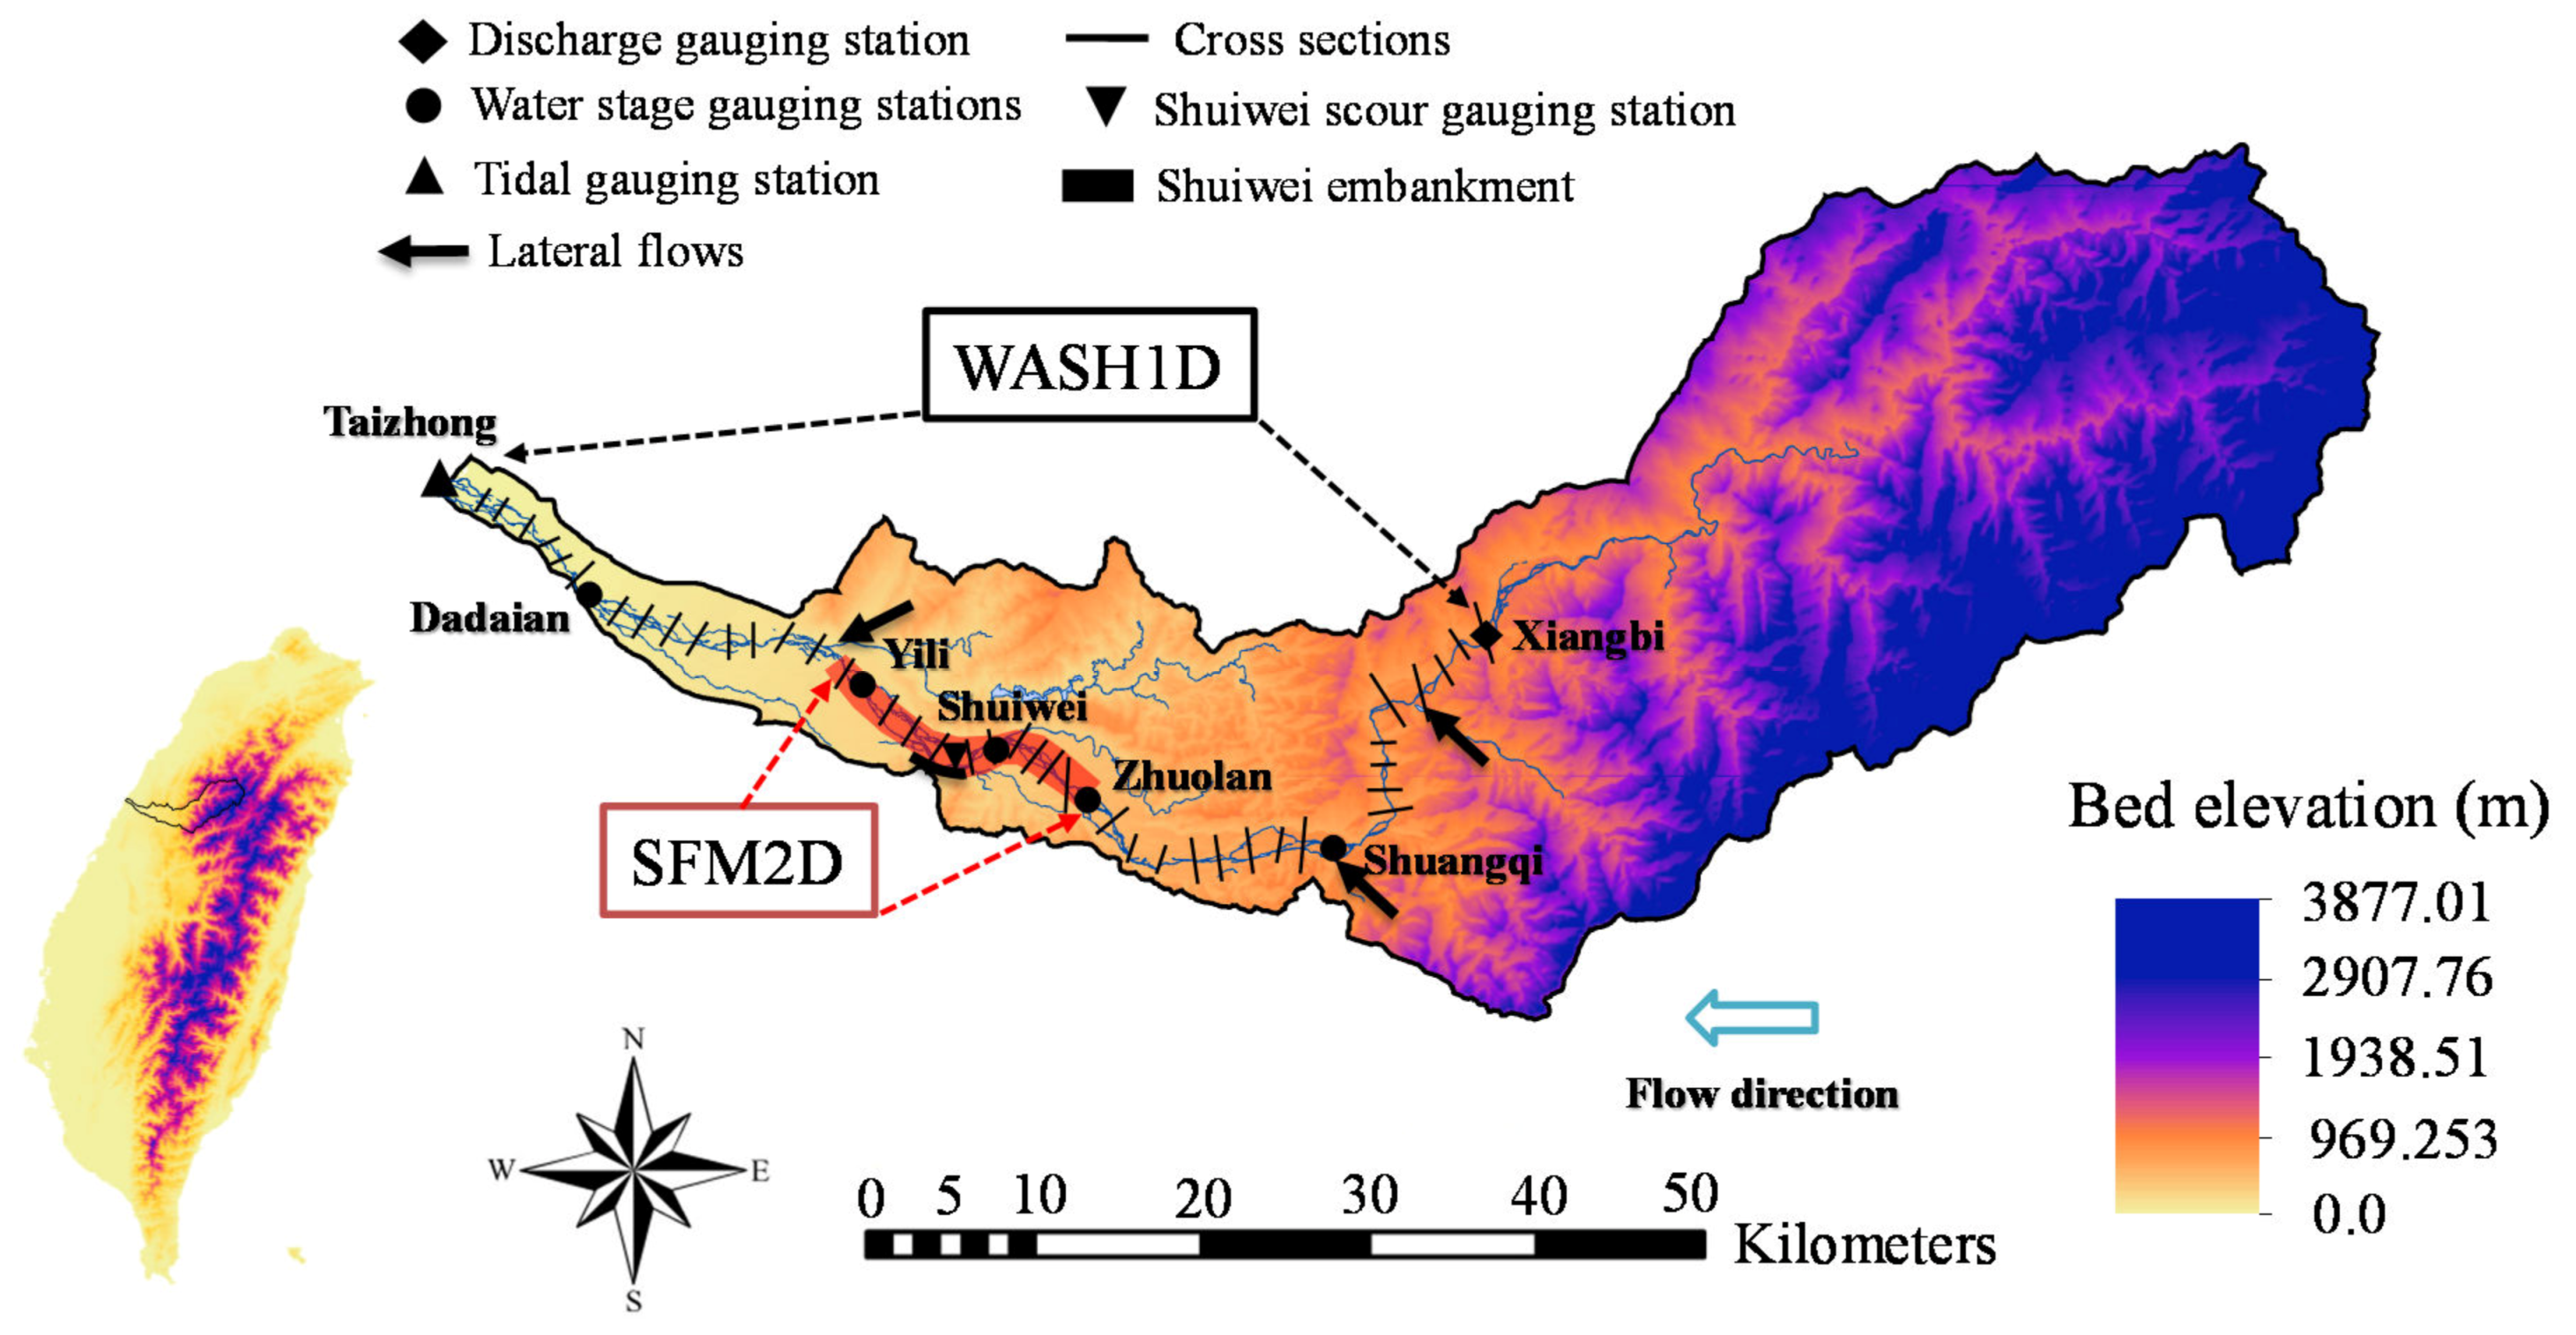
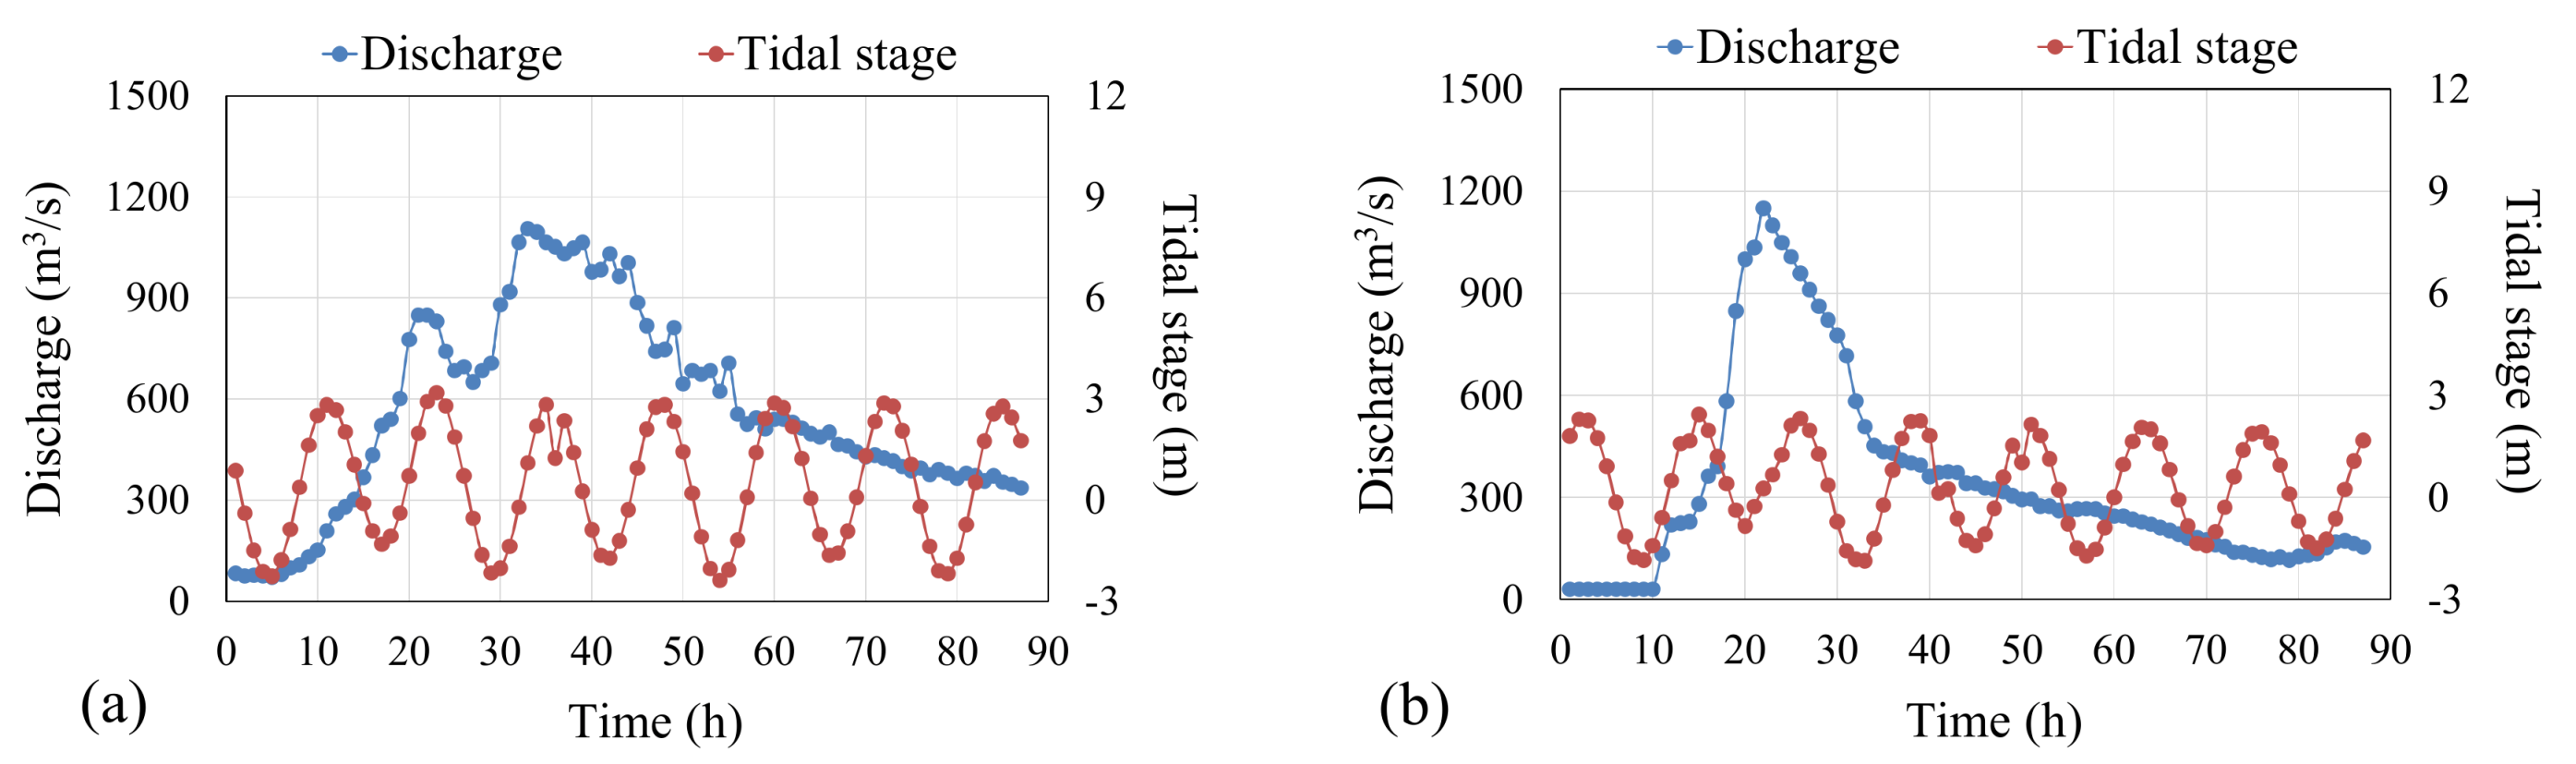
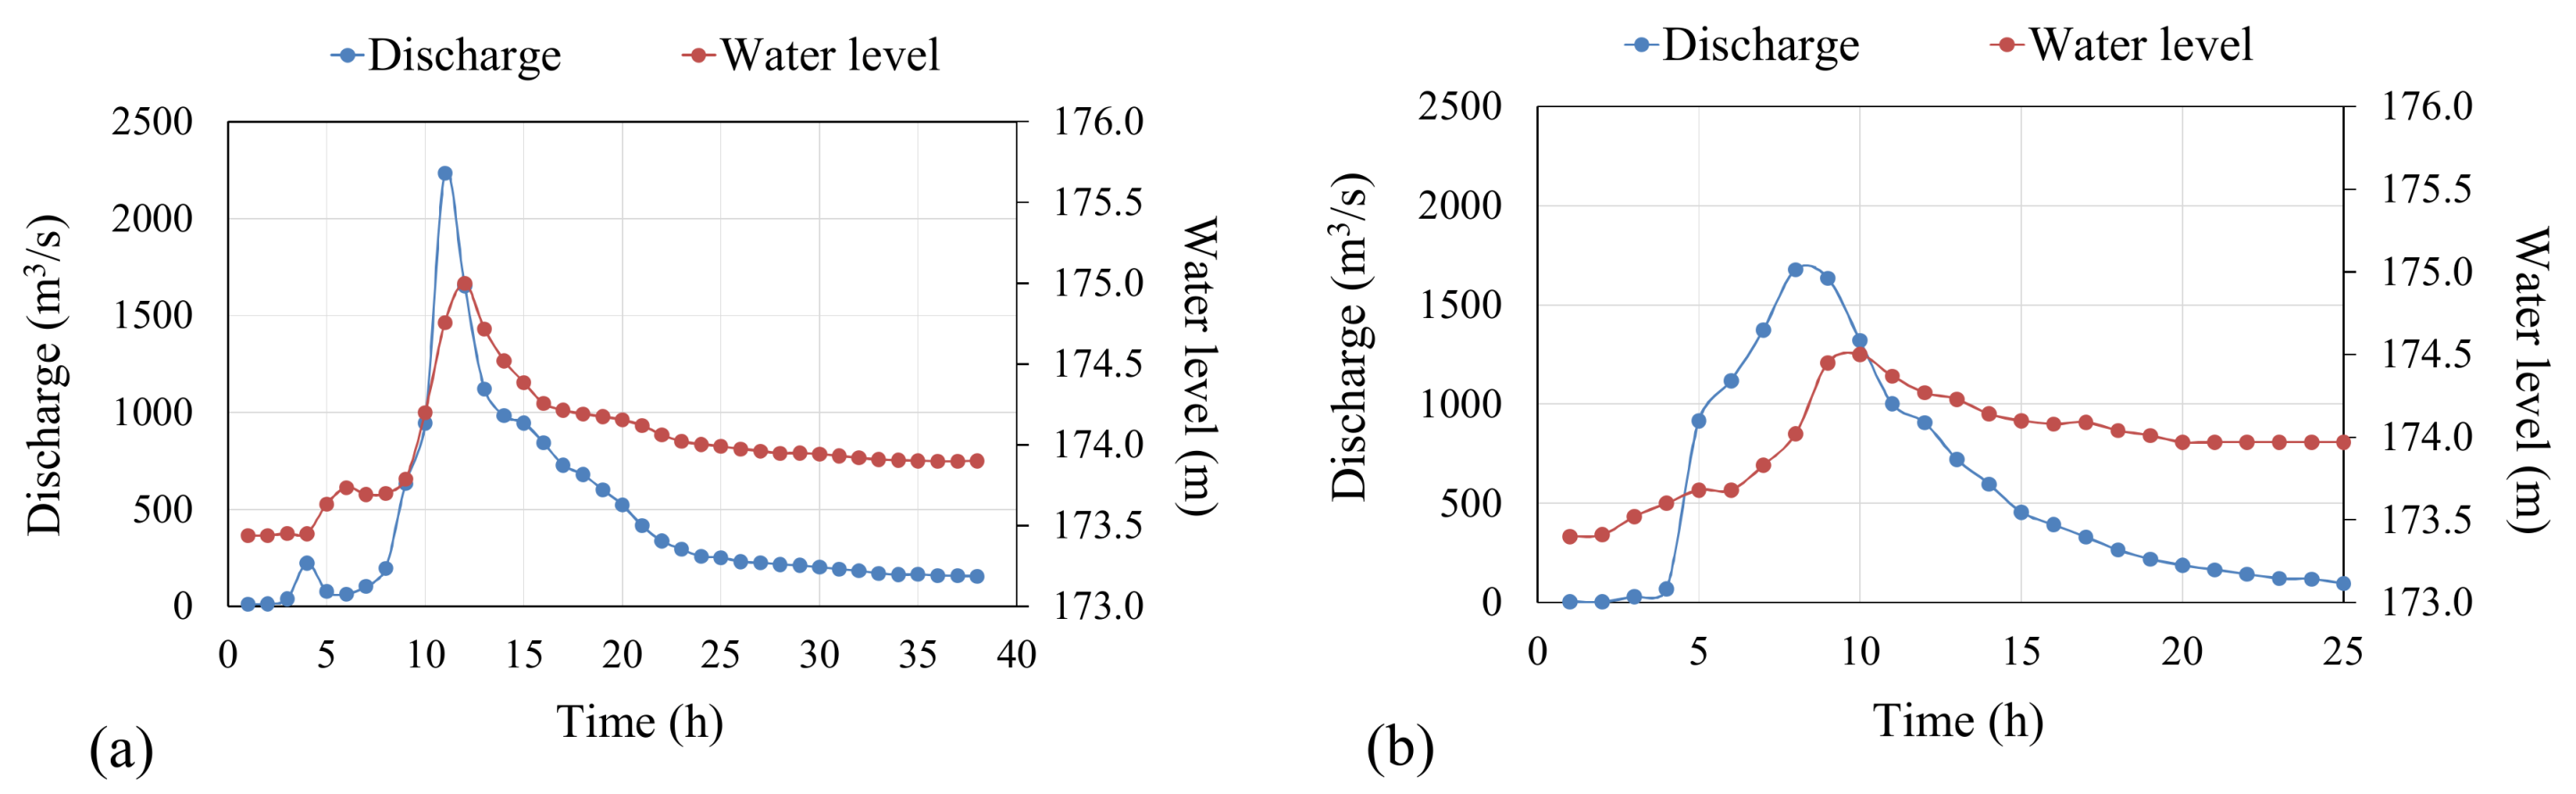
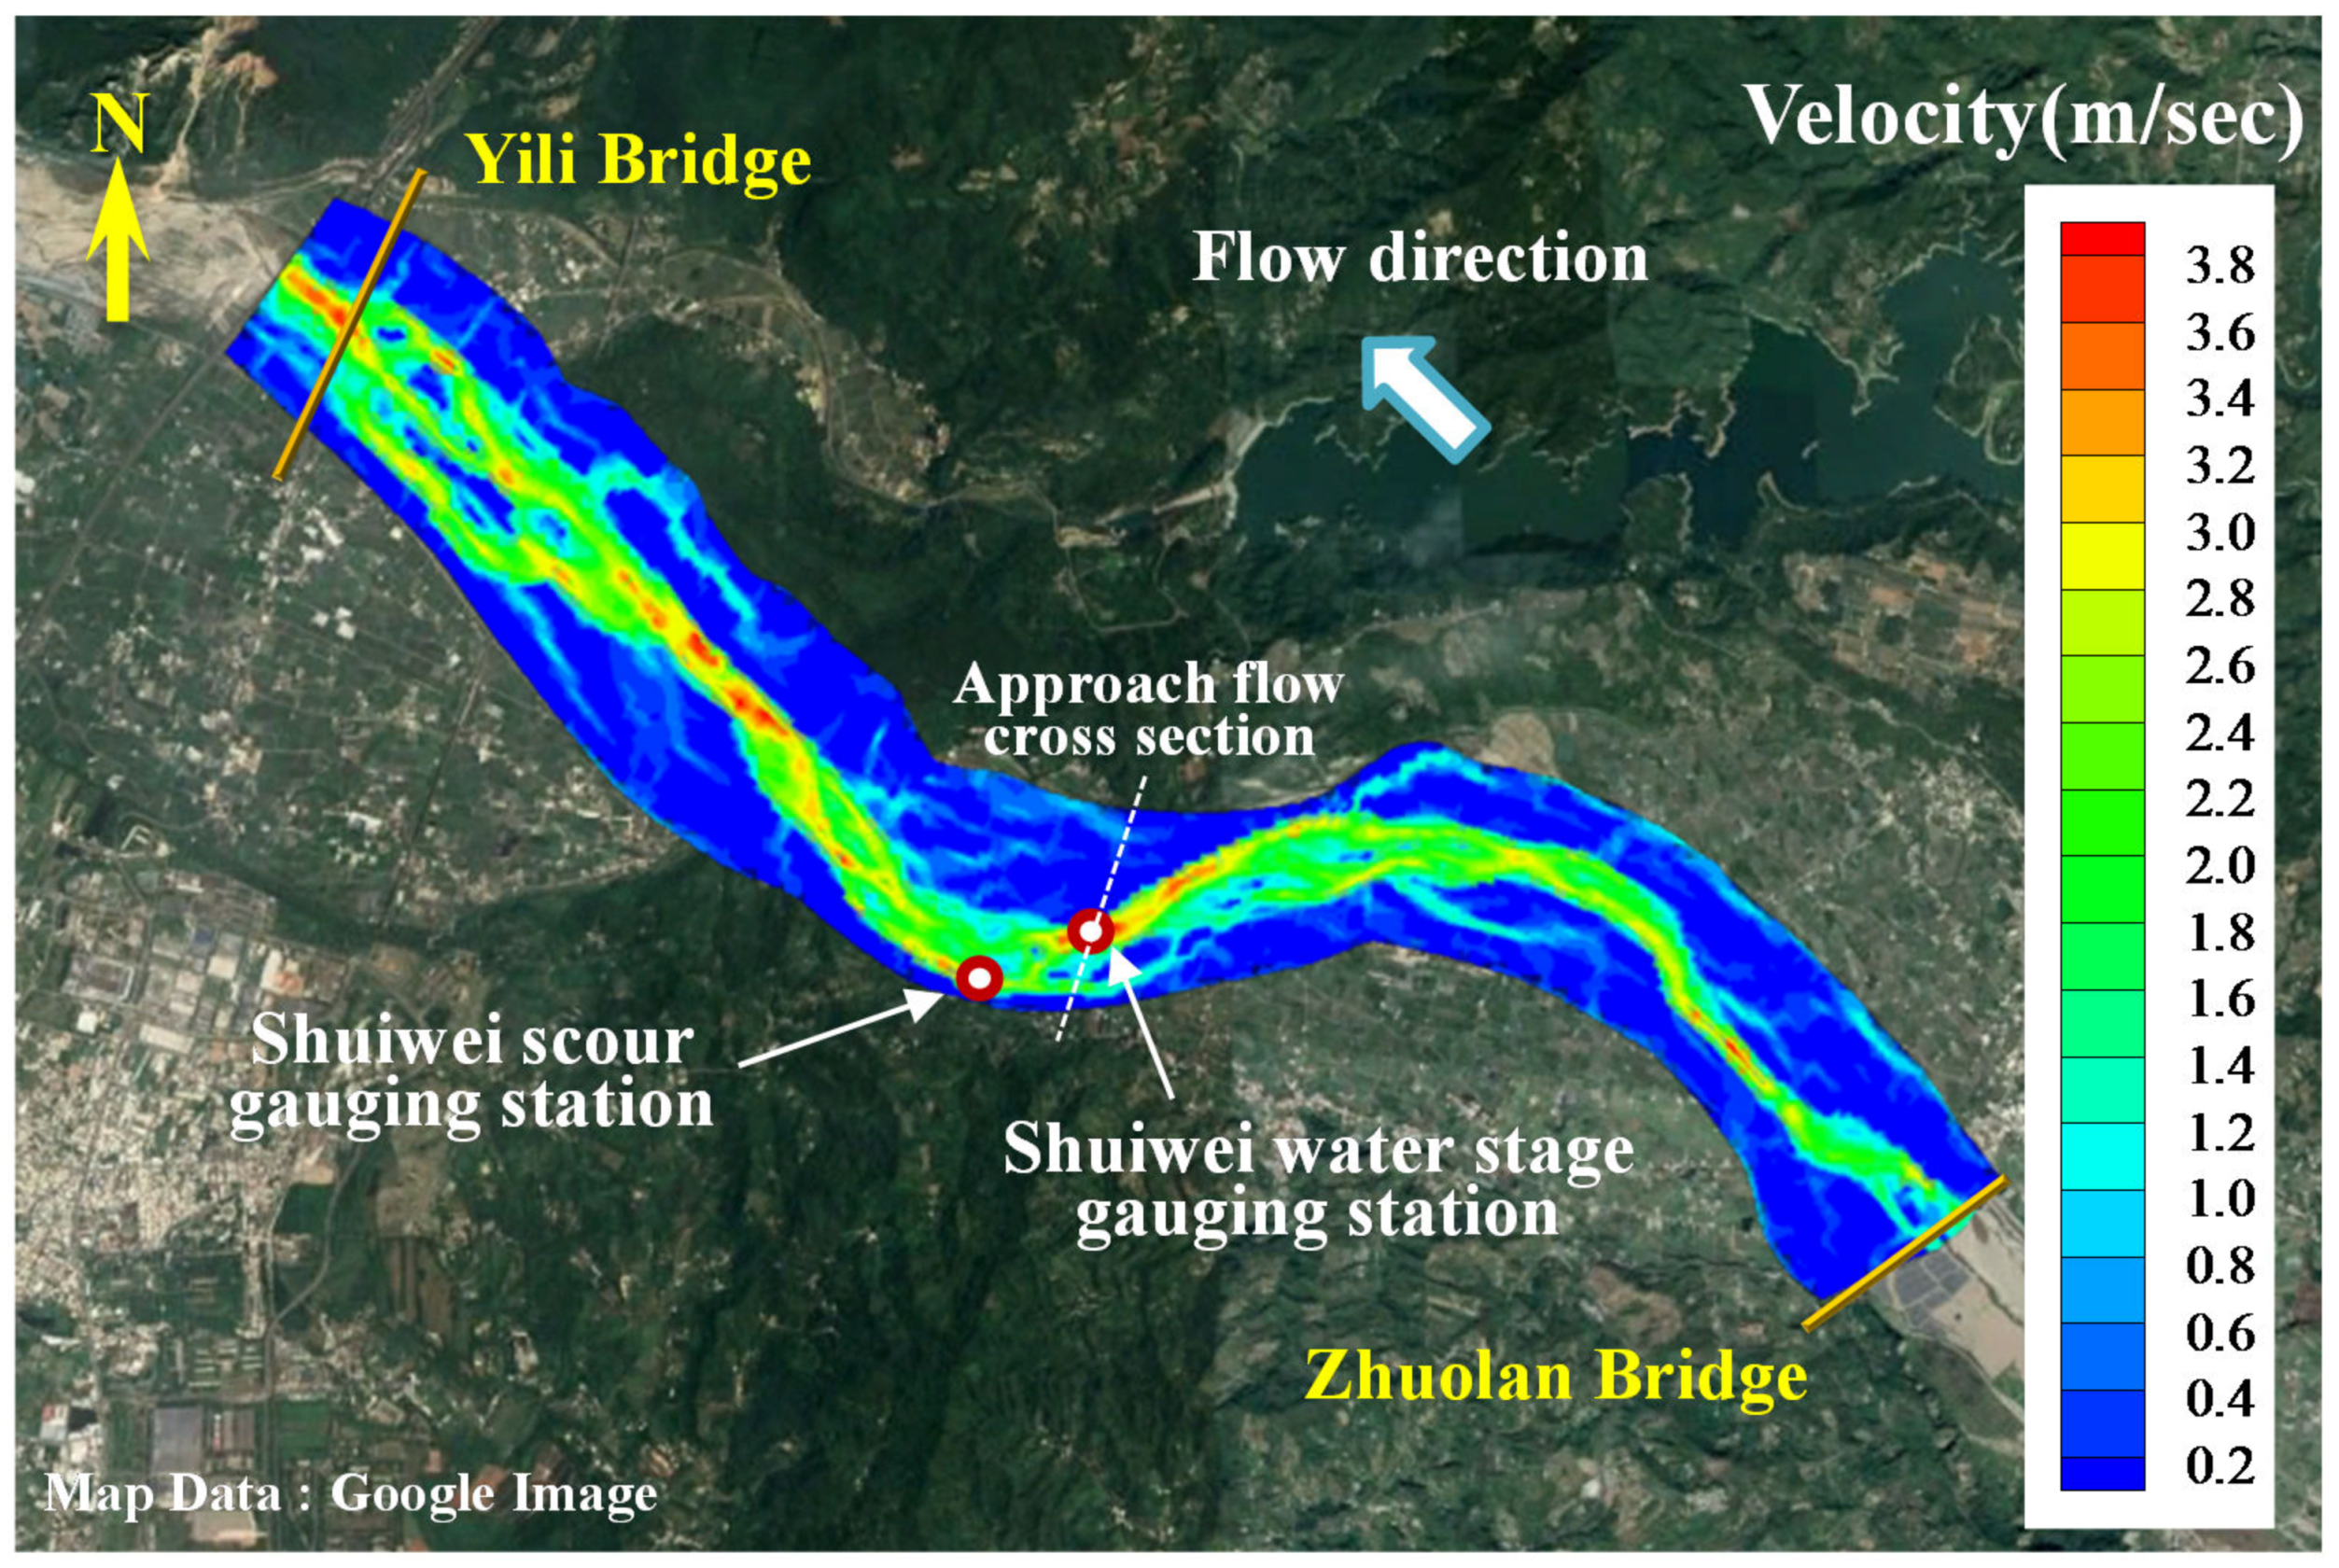
3.1. Study Site, Field Data, and Model Setup

This study was conducted in the Da-An River basin, which has a drainage area of 758 km2 and is located in central Taiwan. As displayed in Figure 3, the riverbed elevation ranges from 0 m to 3877 m. The average bed slope in the main channel reach of Da-An River is approximately 0.011. During typhoons, bend scours may form rapidly because of river flooding, causing severe damage to the river embankment toe. The survey data from the WRA [21] indicated that over three embankment failure incidents have been reported at the Shuiwei Embankment. Therefore, the Shuiwei Embankment was chosen as the study site for bend scour modeling.
The 1D hydraulic model is suitable for simulating the main channel processes in a longer river reach. As shown in Figure 3, the selected 1D simulation domain is a 65-km reach of Da-An River between Xiangbi and Taizhong gauging stations. The WASH1D model was employed to simulate the 1D hydraulic flow conditions. The geometric data of 74 cross-sections were collected for model setup.
Because the study area contains the Shuiwei Embankment located in a river bend reach, the SFM2D model was employed to resolve the further detailed 2D flow field and the bend scouring in a 10-km river reach from Zhuolan gauging station to 500 m downstream of the Yili gauging station. To accurately represent riverbeds, a UAS was employed in March 2019 to produce a high-resolution digital elevation model (DEM) with a spatial resolution of 1.0 m for bend scour modeling. As shown in Figure 4, the bed-elevation contour produced from the UAS DEM represents actual river bed topography.
The study area has different types of gauging stations. The measured data from these gauging stations were used for model inputs and verifications. Therefore, different field data were collected, including data on hydraulic structures, river discharge, river water level, tidal stage, bend scour depth, and cross-sectional bed elevation.
Two extreme typhoons, Saola (July 2012) and Soulik (July 2013), were selected for the verification of the WASH1D model. In the 1D simulation, the dynamic river discharge measured at Xiangbi gauging station was set as the upstream boundary and the tidal hydrograph measured at the Taizhong gauging station was set as the downstream boundary. Figure 5a,b display the measured hydrographs in the test events of Saola and Soulik, respectively, as the boundary conditions of simulations. Furthermore, three lateral flows converge onto the main river reach. However, measured data are not available for these lateral locations. Thus, the rainfall runoff model [44,45] was employed to produce the discharge hydrographs of lateral flows.
For bend scour modelling, two flood-induced bend scours that occurred in recent years (Typhoon Nesat, July 2017 and Typhoon Maria, July 2018) were selected and simulated. Two types of field data were collected [21,46]: water levels, measured at the Shuiwei water stage gauging station and bend scour depth, measured at the Shuiwei scour gauging station. The measured water levels and bend scour depths were adopted for model verifications. For upstream boundary conditions of 2D simulation, the measured river discharge hydrographs for these two events were available for Zhuolan gauging station. Therefore, using Equation (13) only the water level hydrographs created by the WASH1D model were imposed at the downstream boundary (500 m downstream of the Yili gauging station) of 2D simulation. Figure 6 presents the boundary conditions for the test events of Typhoons Nesat and Maria.
Once Equation (17) is used to predict bend scour depth, several physical variables should be given. Table 1 lists the field data collection for short-term bend scour induced by Typhoons Nesat and Maria. From survey field data, it is obviously shown that the bed slope and geometric standard deviation of the particle size distribution did not change significantly during these two floods. In addition, the effective flood peak duration and the centerline radius of the bend did change significantly before and after floods.
All of the 1D and 2D simulations were performed on an ASUS computer with Intel® Core™ i5-8500 CPU and 8.0 GB RAM from Taipei, Taiwan.

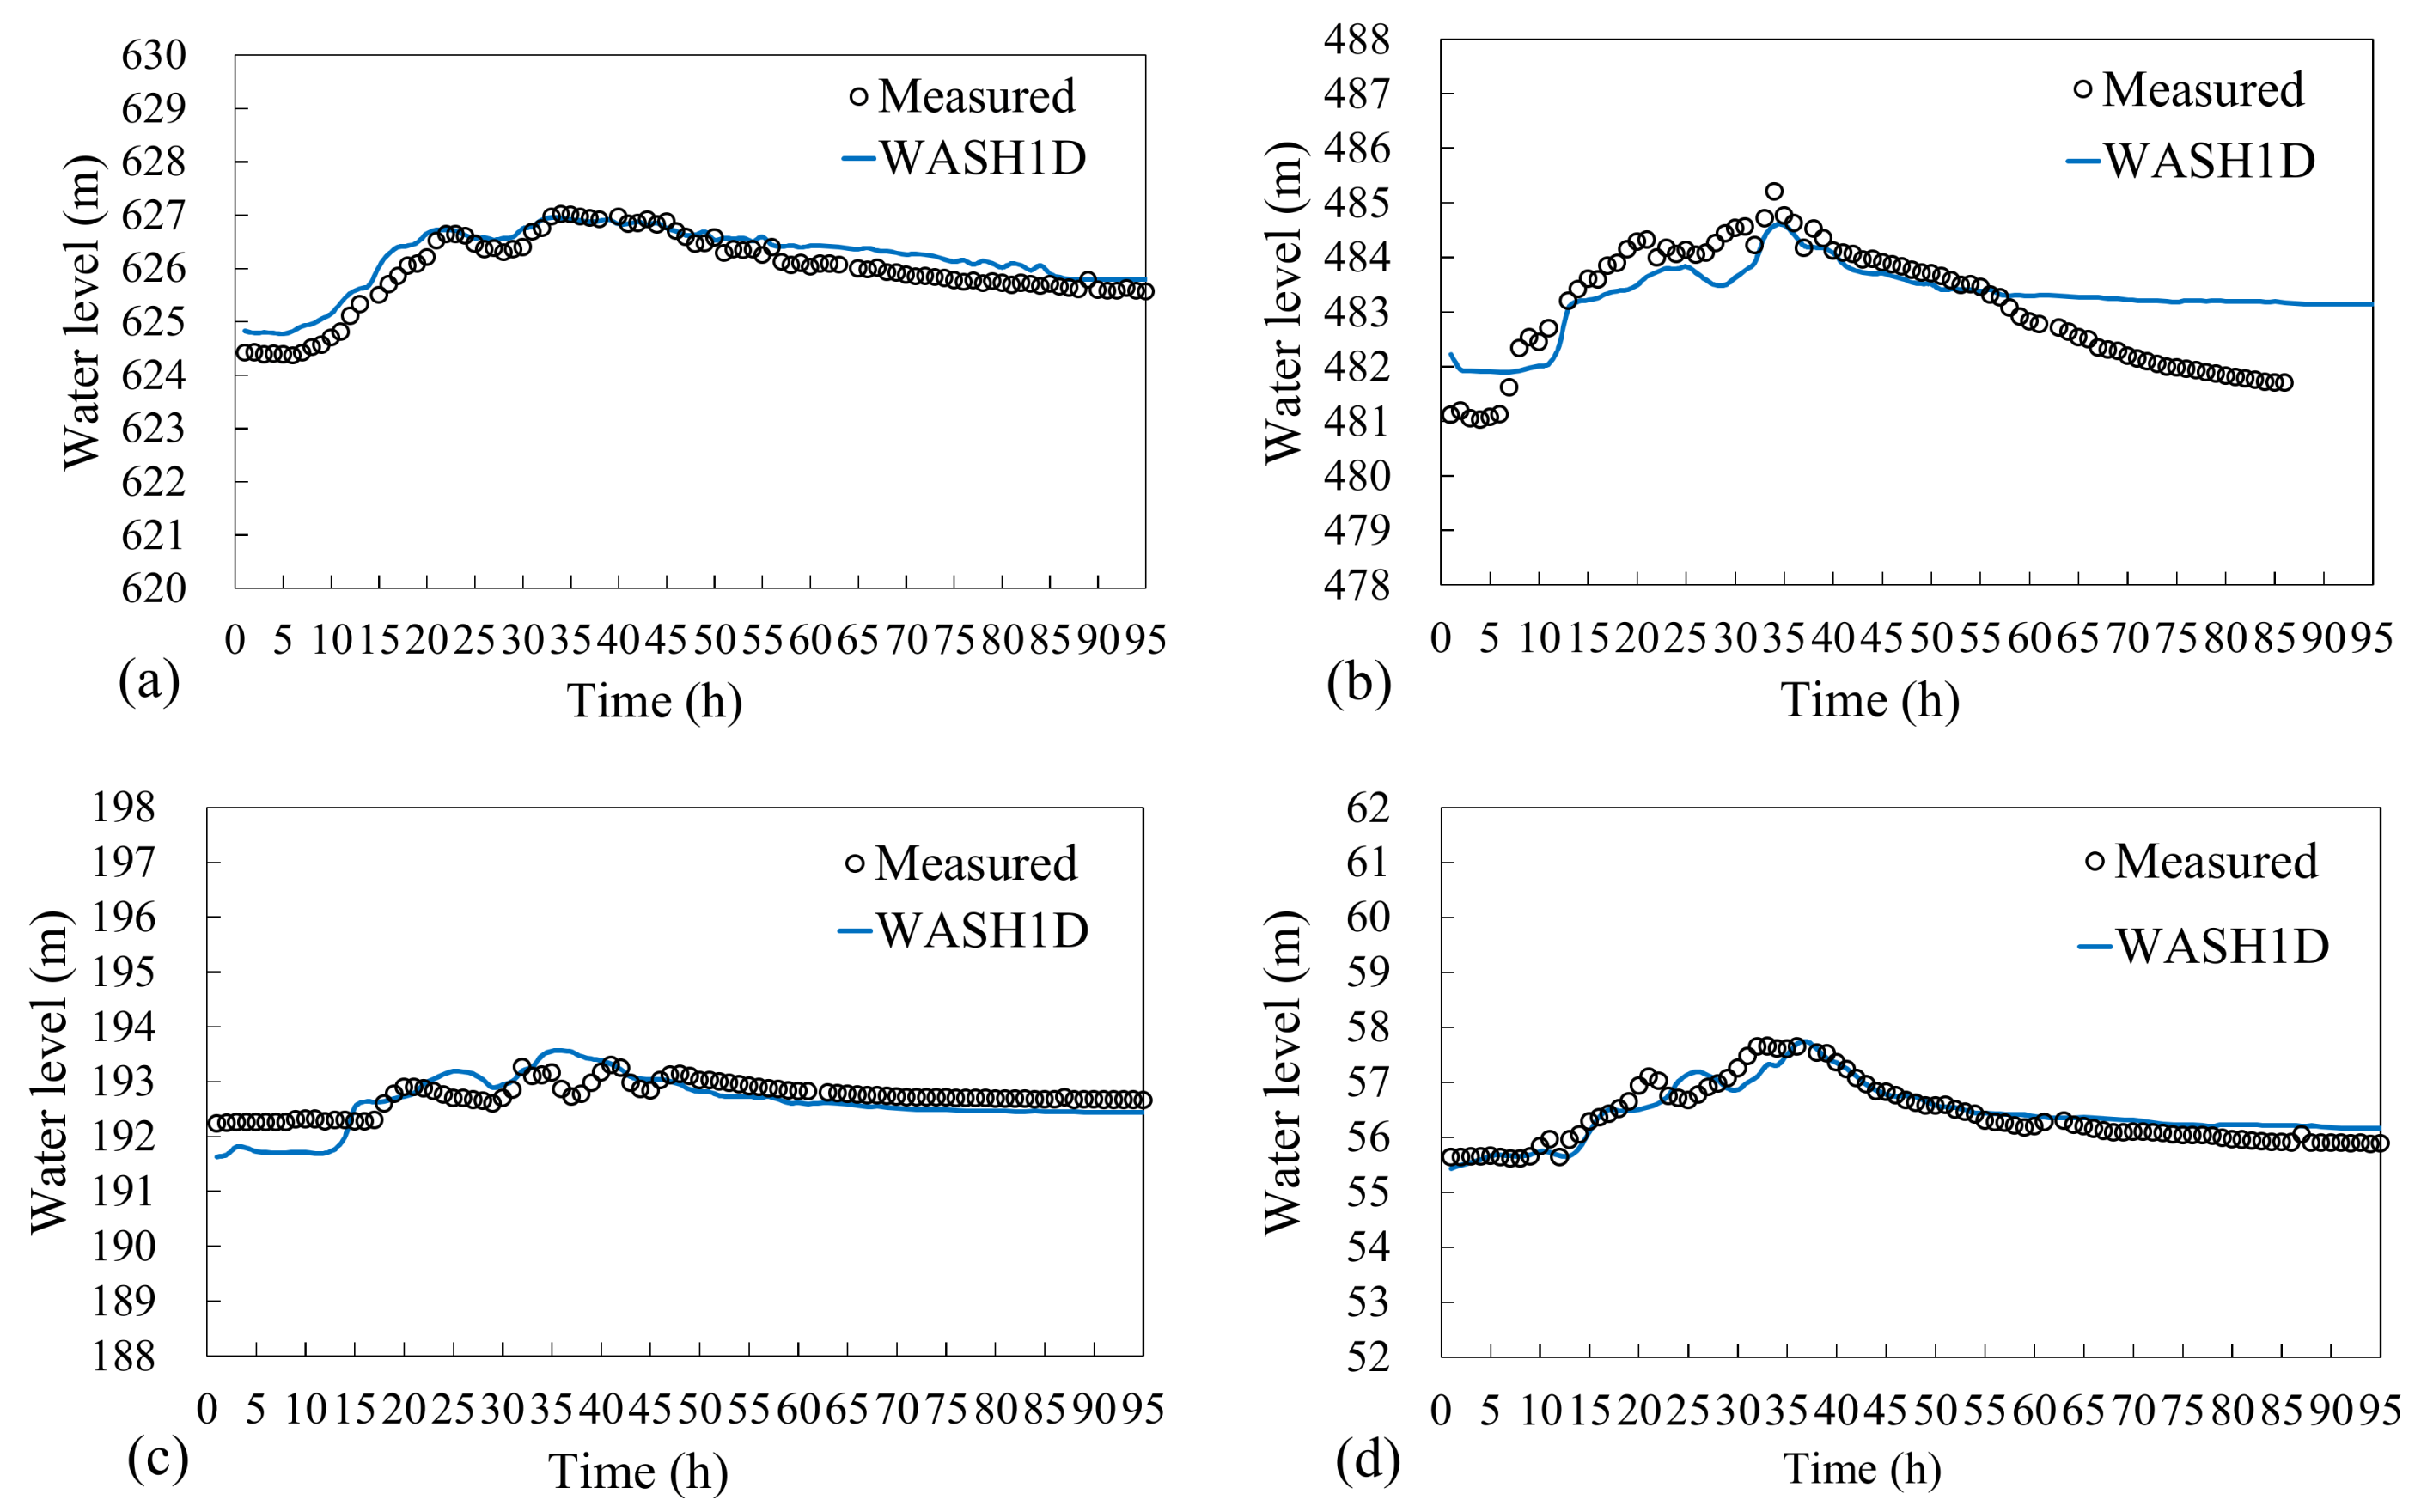
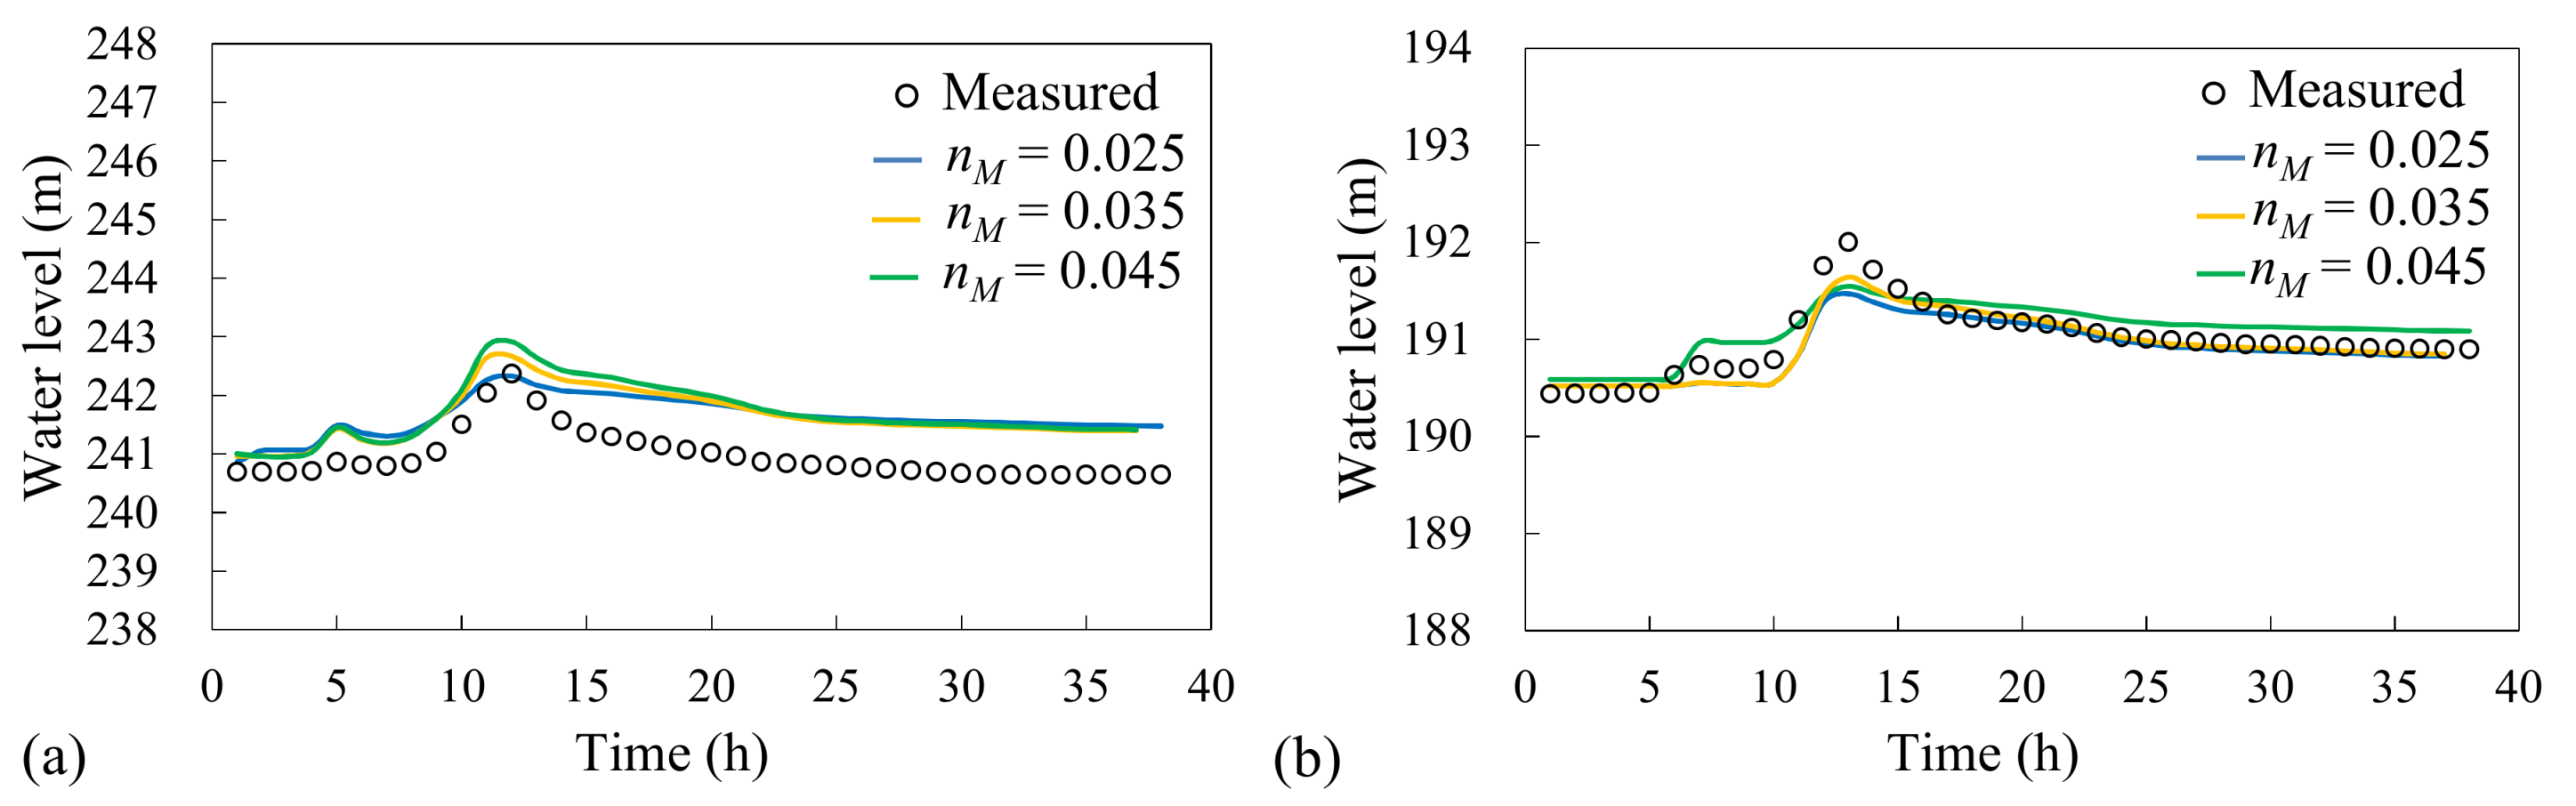
3.2. Performance Verification of WASH1D Model

Before bend scour modeling, the accuracy of the WASH1D model was verified to ensure the acquired flow solutions at the boundaries of the SFM2D simulation domain were of high quality.
The simulated water levels obtained from the WASH1D model were compared with the measured data, as displayed in Figure 7 and Figure 8, in which the abscissa represents the simulation time and the ordinate denotes the water level. The results reveal that the simulated water levels had acceptable agreement overall with the measurements.
To further evaluate the numerical performances of the WASH1D model for two flood events, the simulated water levels are transferred as simulated water depths using the lowest bed elevation in the cross-section and three criteria are employed [19]:
E h p ( % ) = | h p s i m h p m e a | h p m e a × 100 ,   E T p = | T p s i m T p m e a | T p m e a × 100 ,   R 2 = [ i = 1 N ( h i s i m h ¯ s i m ) ( h i m e a h ¯ m e a ) i = 1 N ( h i s i m h ¯ s i m ) 2 i = 1 N ( h i m e a h ¯ m e a ) 2 ]
in which Ehp is the peak water depth error; ETp is the error of time to peak water level; R2 denotes the coefficient of determination; h p s i m and h p m e a denote the simulated and measured peak water depths, respectively; T p s i m and T p m e a are the simulated and measured time to the peak water depth, respectively; h i s i m and h i m e a are the simulated and measured water depths at each time; and h ¯ s i m and h ¯ m e a denote the average simulated and measured water depths.
From the quantitative results listed in Table 2, the simulation performance at Xiangbi station for the Typhoon Saola event had the smallest Ehp (1.64%). The overall performance for Ehp was less than 18.24%. Furthermore, the overall performance regarding the R2 coefficient for two flood events was larger than 0.75. The quantitative results for the three criteria indicated that the WASH1D model achieved satisfactory overall numerical accuracy in modeling 1D river flow.

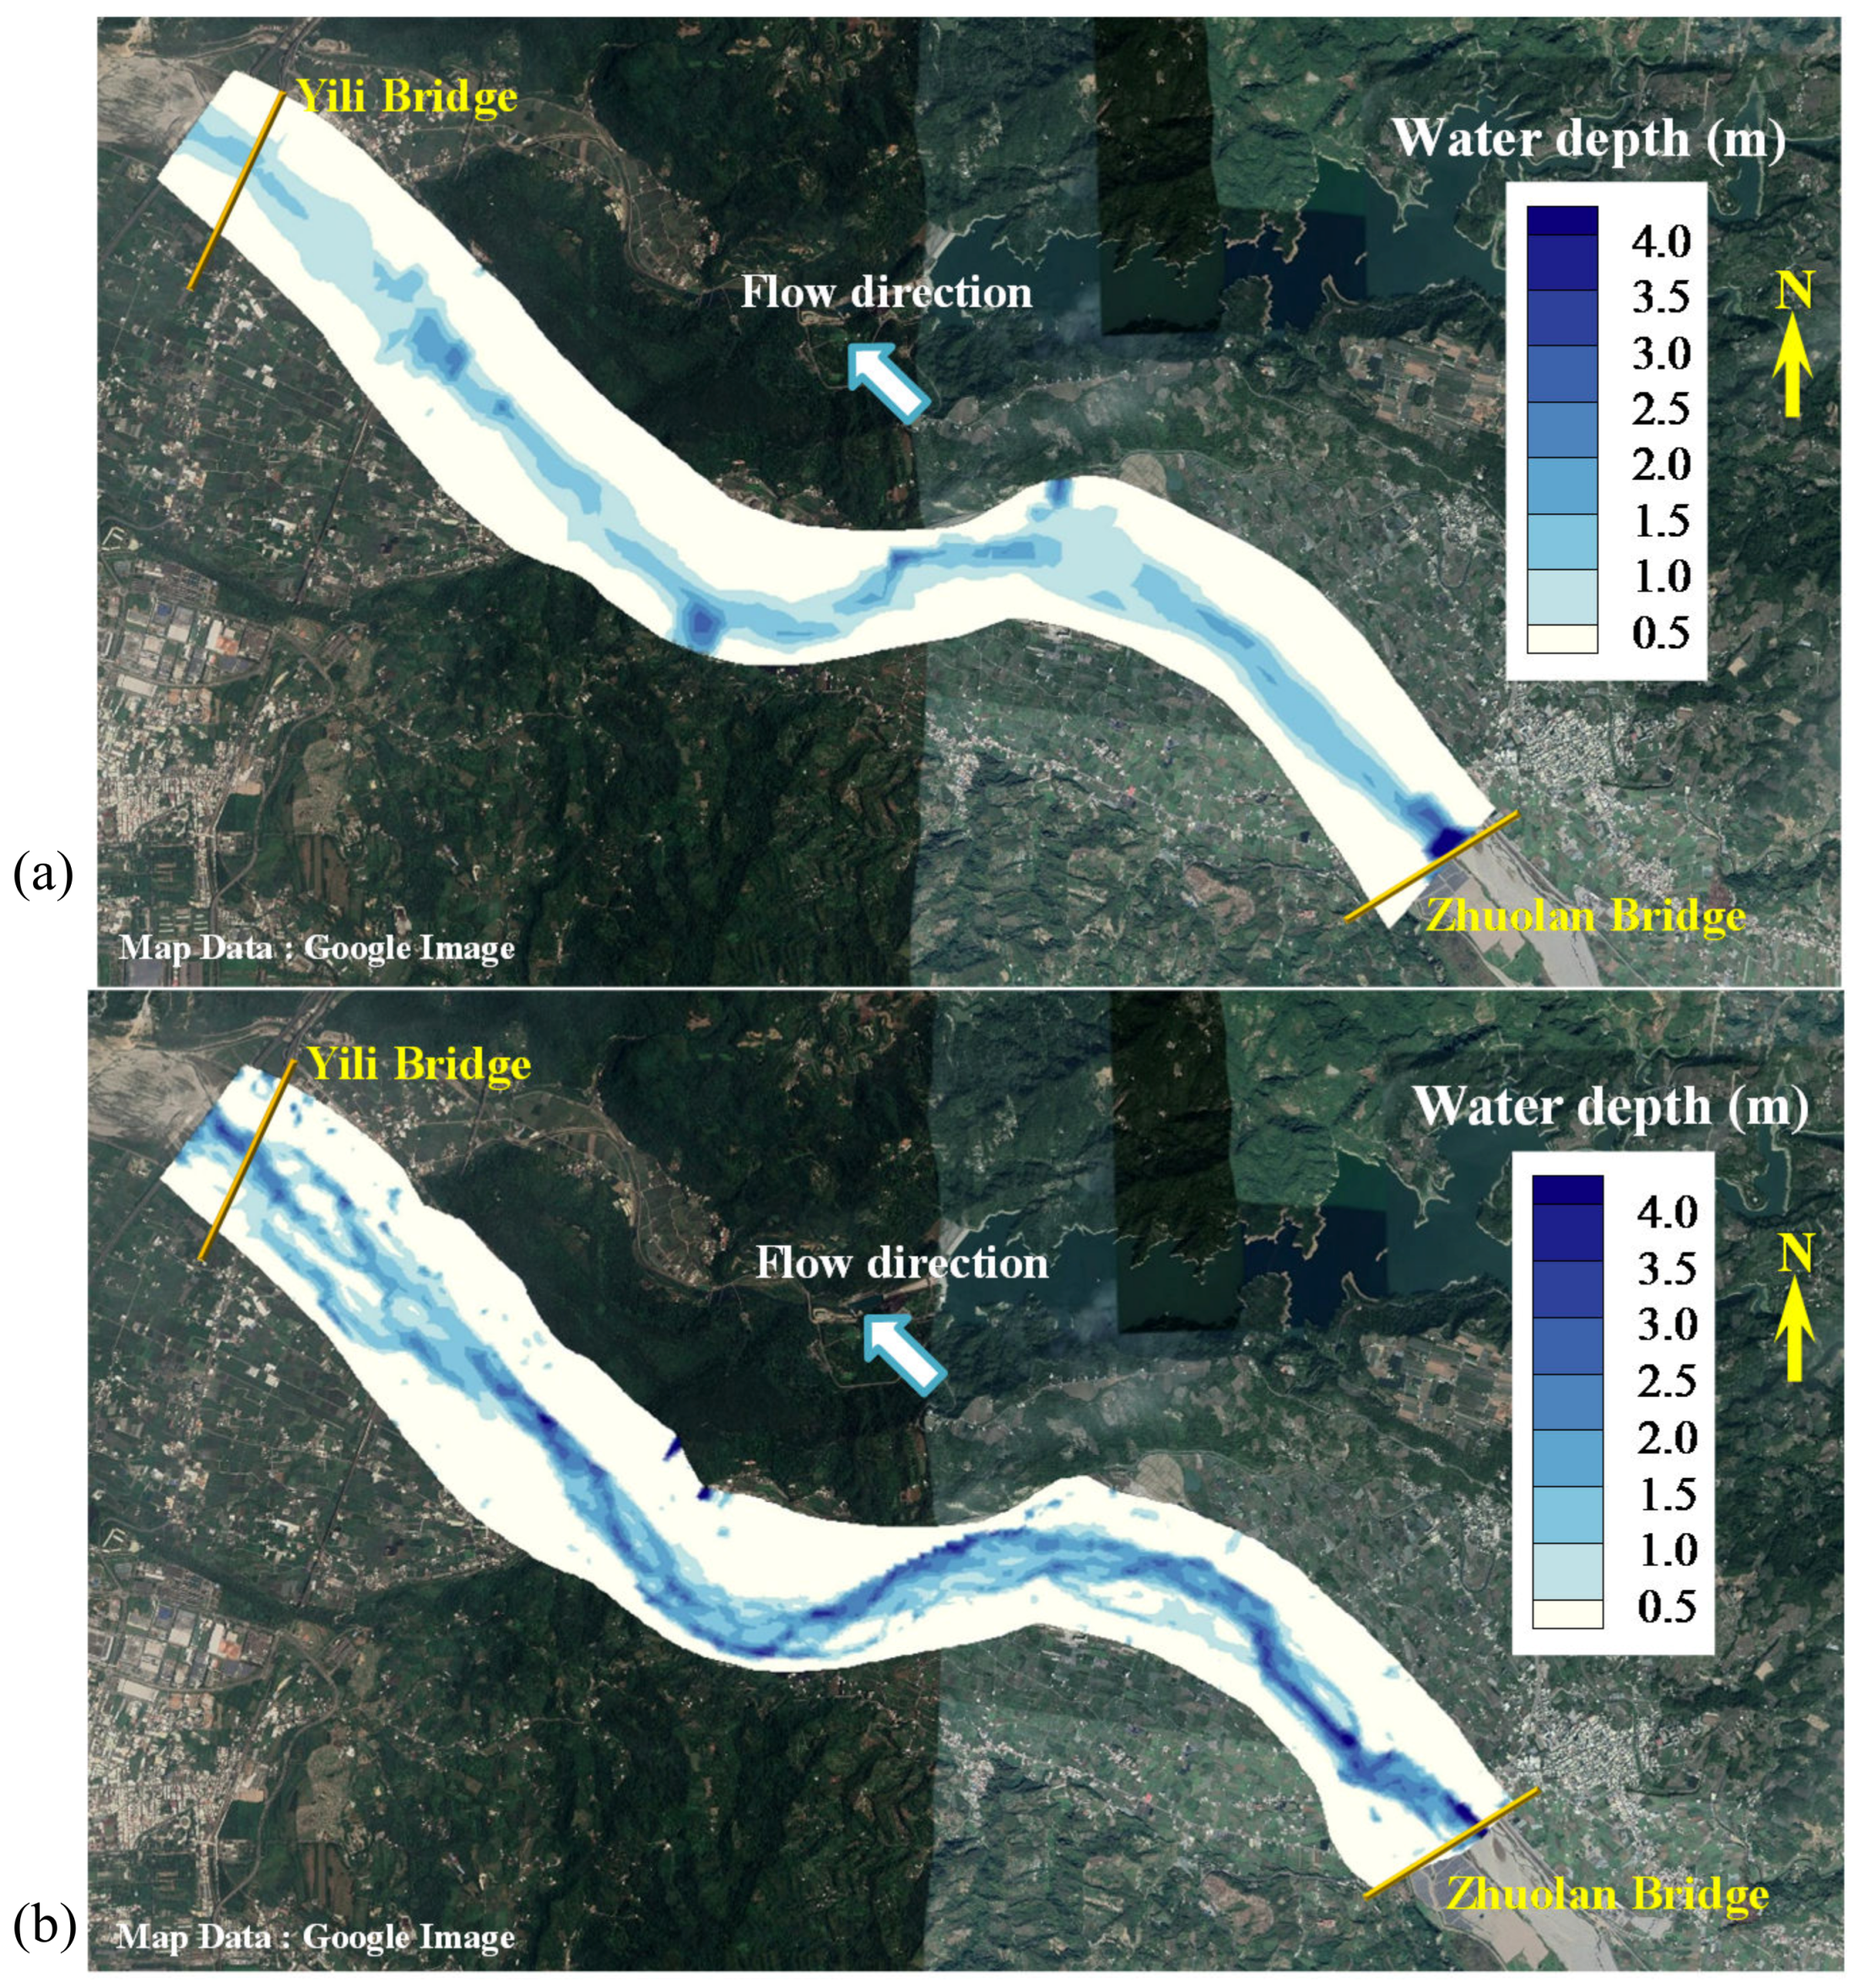
3.3. Performance Verification of SFM2D Model

Since the bed-elevation data was measured in March 2019, the measured water levels in Typhoons Saola (2012) and Soulik (2013) may not be suitable for calibration due to the river bed changes in 2012 to 2019. Therefore, the measured data in Typhoon Nesat (July 2017) was selected for the verification of the SFM2D model. The dimensions of the SFM2D simulation domain is 10 km in along flow direction and 0.75 km in cross-section direction. The SMS (Surface-water Modelling System) software was used to produce the nonrectangular computational mesh with 7465 elements and 7910 nodes. The minimal and maximum grid size in cross-section direction is 18.5 m and 42.6 m, respectively. The influence of CFL on simulated result was tested and the result indicated that CFL may not affect the simulated water levels significantly. Thus, the CFL is set to be 0.8 herein (i.e., computational time step = 0.1 s).
The main parameter of the SFM2D model which needs calibration is the Manning roughness. The measured water levels at Yili station and Shuiwei scour gauging station in Typhoon Nesat are employed to calibrate the value of the Manning roughness coefficient. Figure 9 shows the influence of the Manning roughness on simulated water levels. The final calibrated value of the Manning roughness is 0.025, resulting in an acceptable match between the simulated and measured water-level hydrographs. Table 3 shows the simulated results using the Manning roughness value of 0.025. The overall performance of the R2 coefficient was larger than 0.8. The overall performance of the Ehp may smaller than 19%.
Furthermore, the resolution of the adopted computational grid could affect the accuracy of bend scour modeling. Hence, the effect of computational mesh on the simulated result is performed. Two different computational meshes are tested, including coarse (1230 elements and 1364 nodes) and fine meshes (7465 elements and 7910 nodes). The time step is taken as 0.1 s. Figure 10 shows the contour plots of simulated water depths based on two computational meshes for Typhoon Nesat. Employing the fine computational mesh, the simulated water depth approaches to more reasonable resolution.
The simulated results and the CPU time are summarized in Table 4. The CPU time consumed by coarse mesh is relatively smaller but the simulated water depth by coarse mesh does not produce accurate resolution, leading to larger errors with Ehp of 57.65% and 34.13% at Yili and Shuiwei scour stations, respectively.

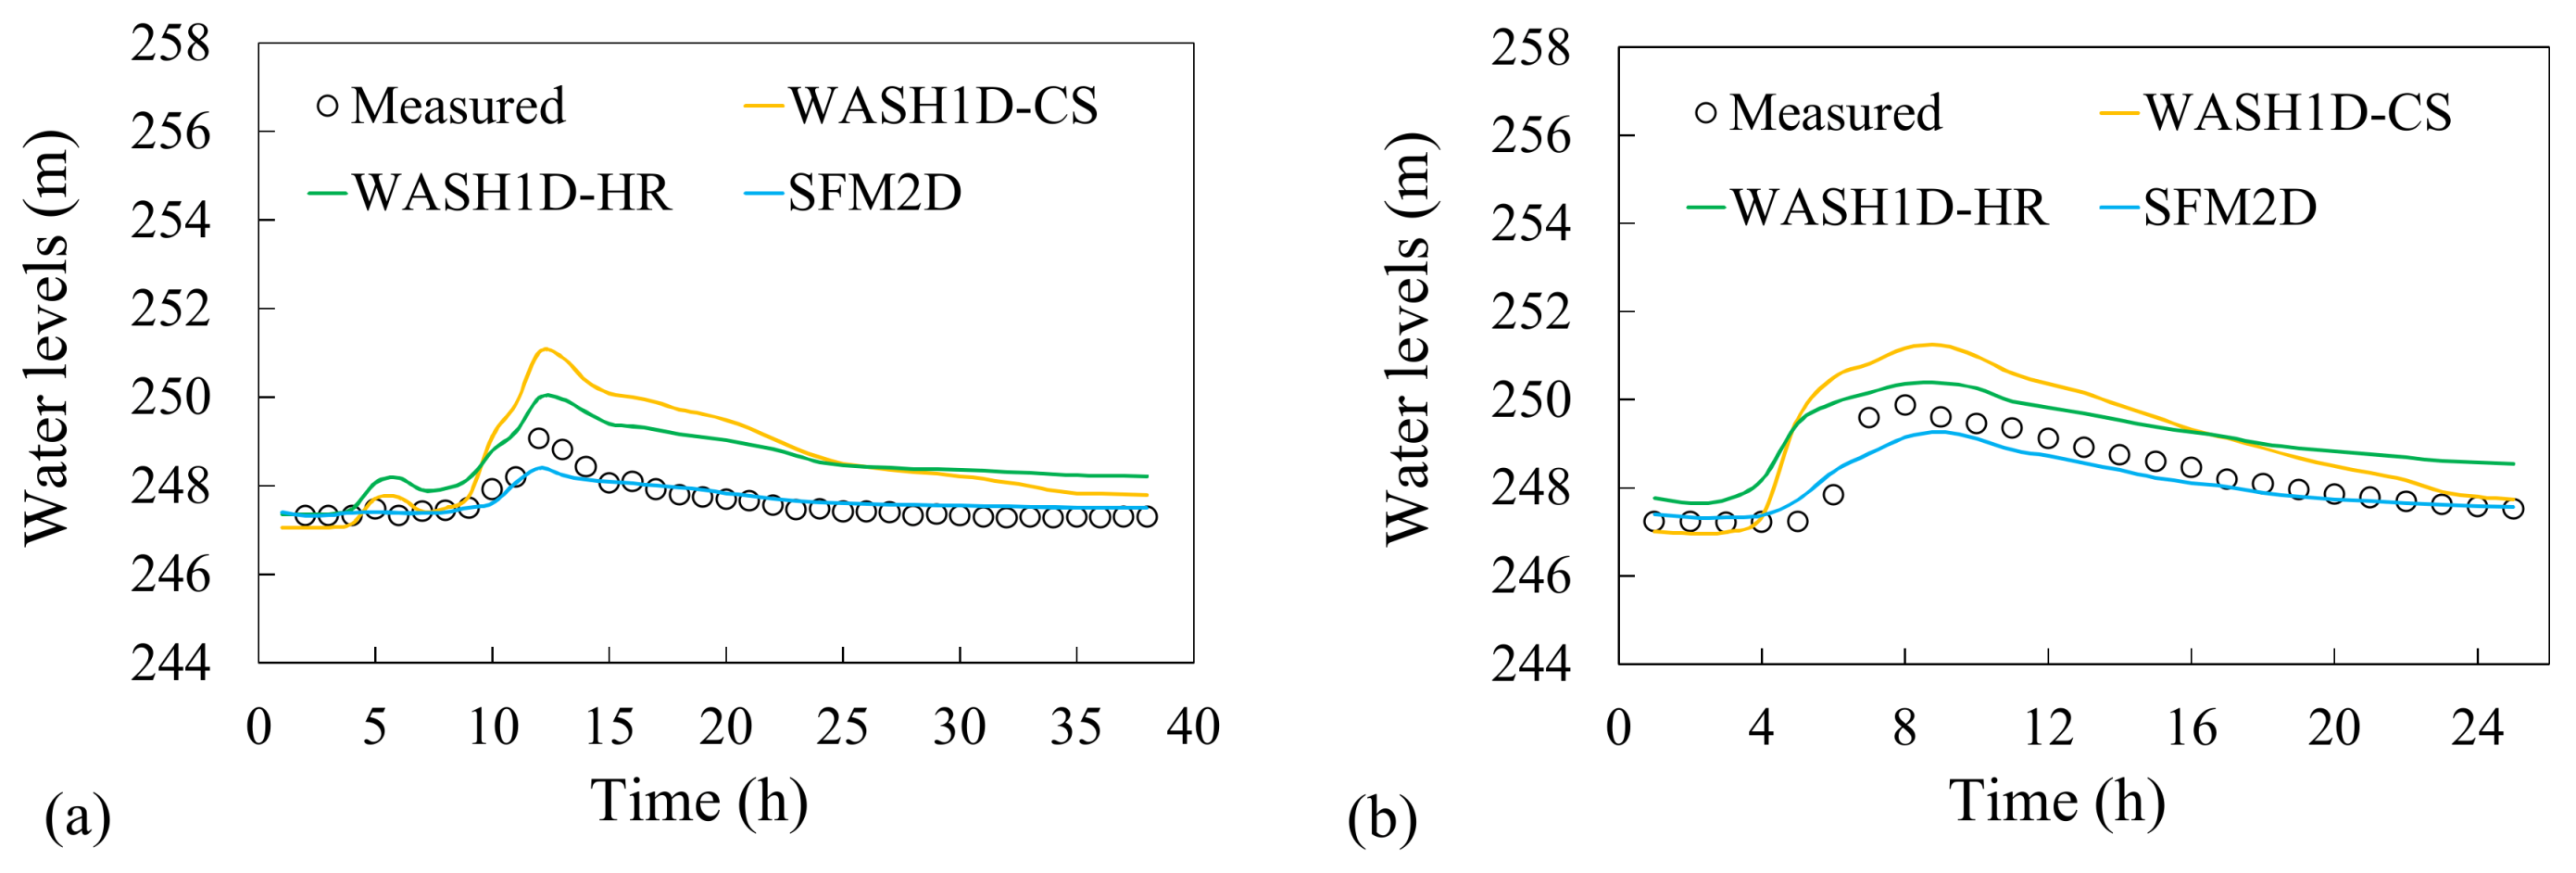
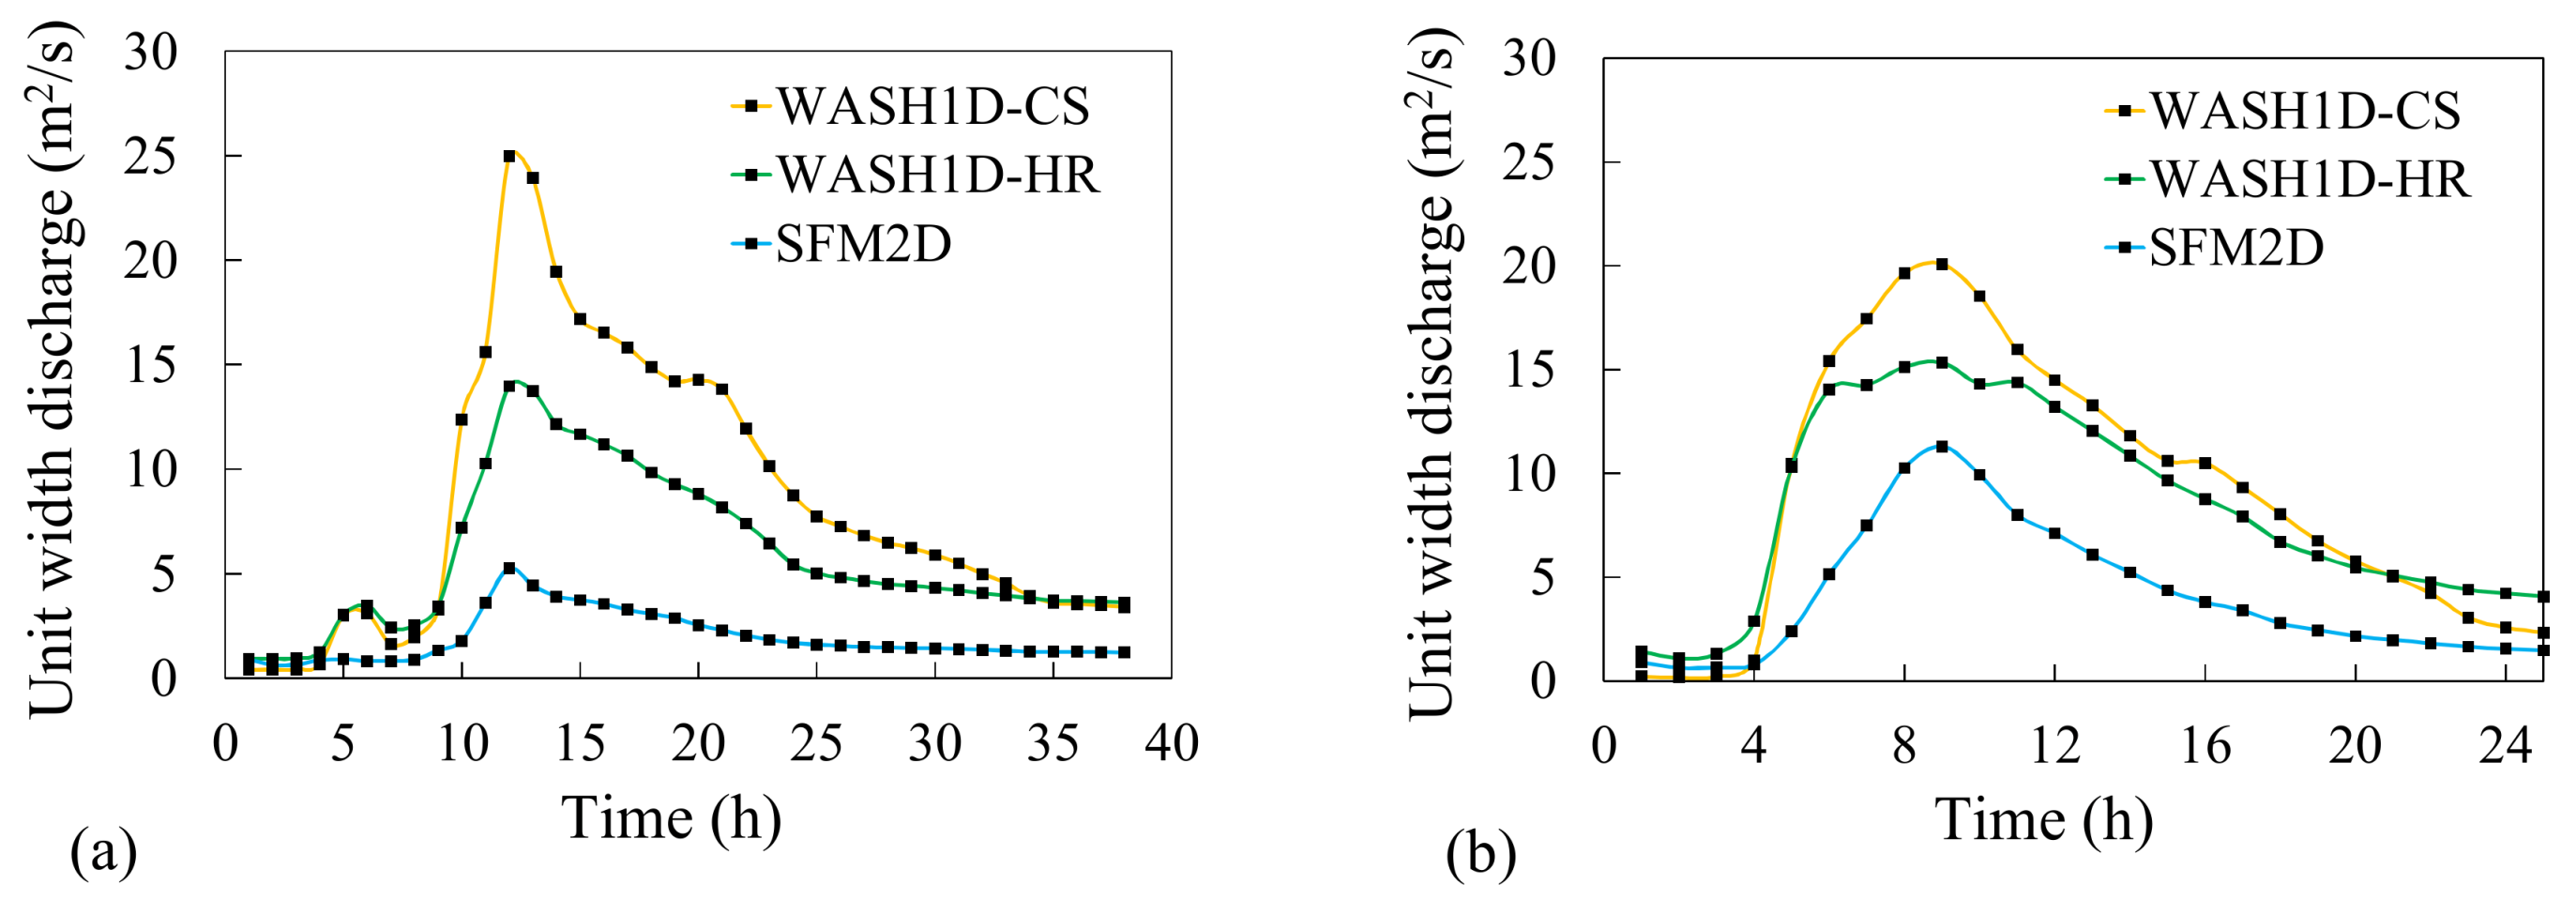
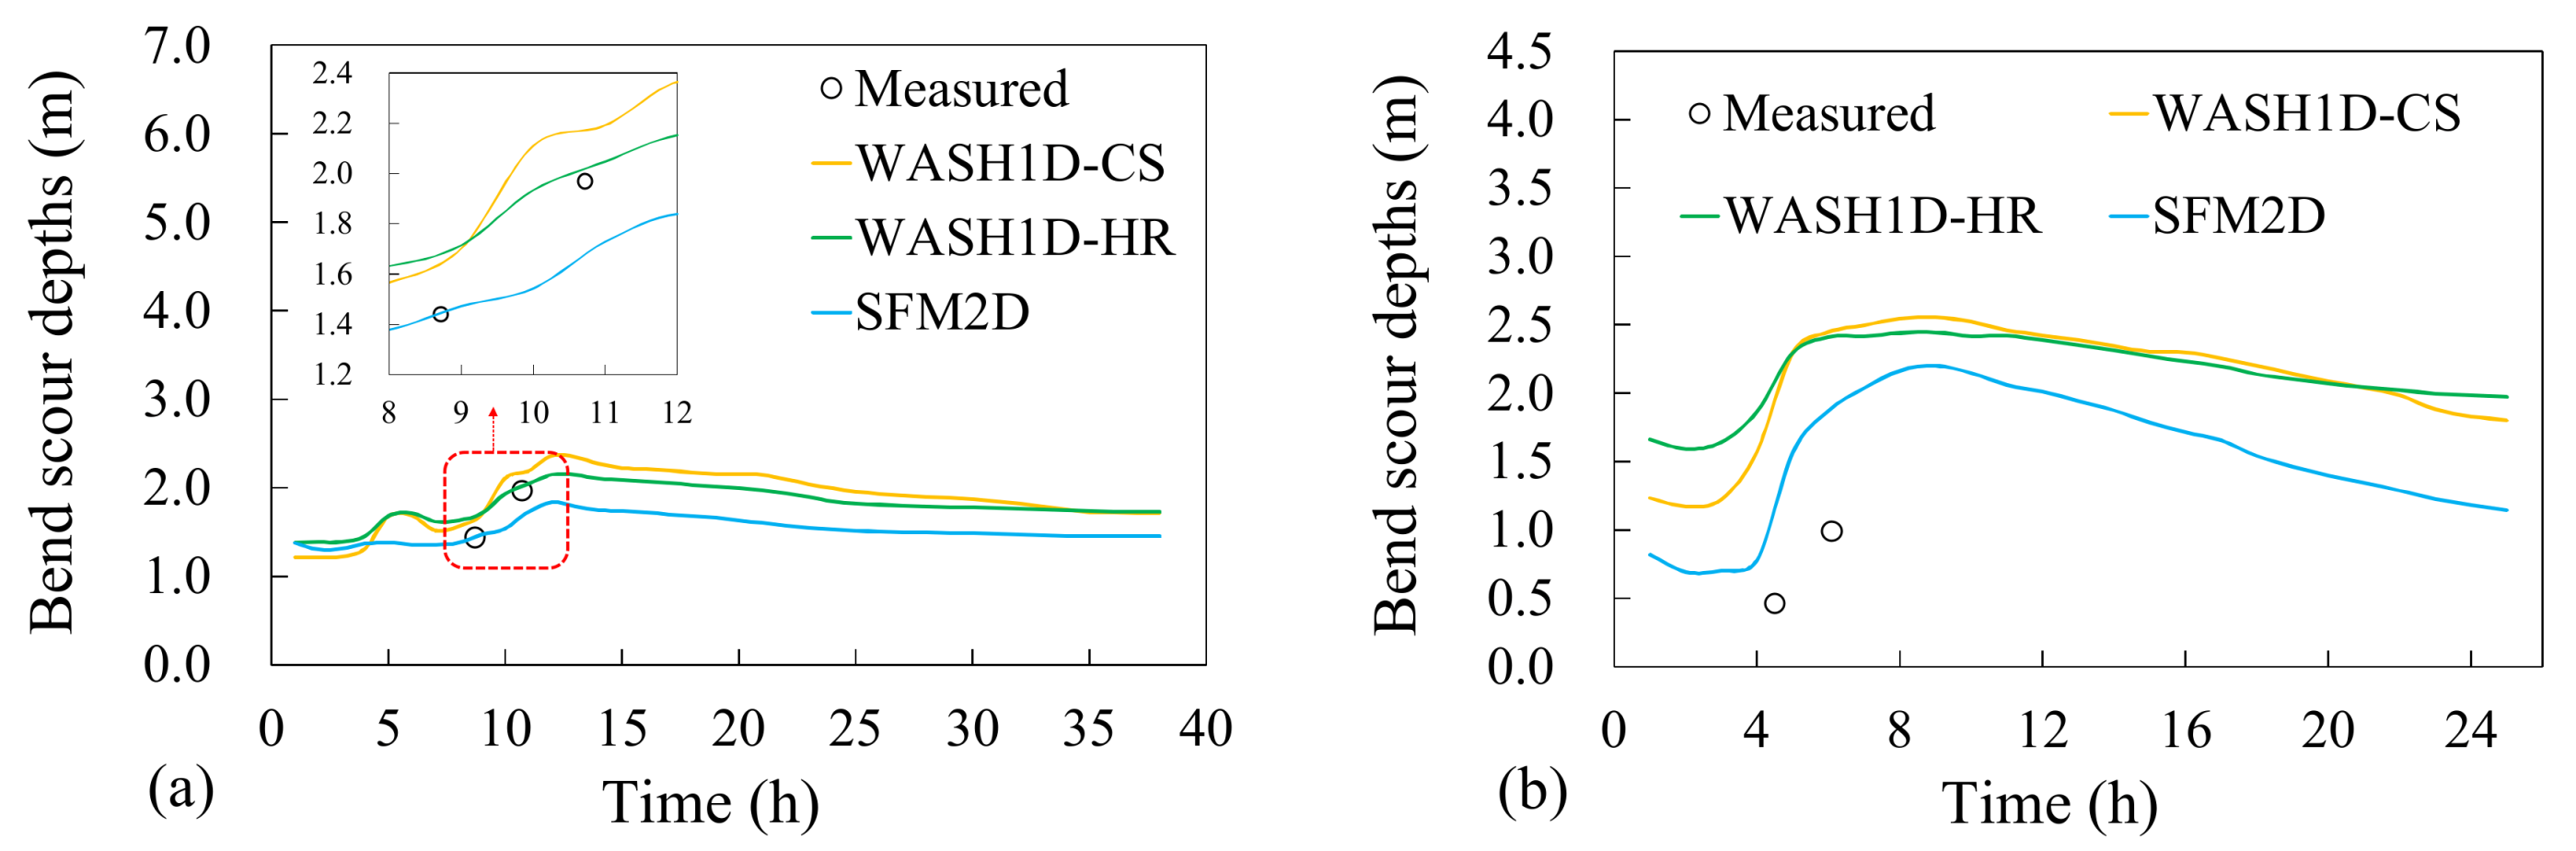
3.4. Comparisons of WASH1D and SFM2D Models for Scour Prediction

After the accuracies of the WASH1D and SFM2D models were verified, bend scour modeling was performed. The prediction bend scour depth at the embankment toe generally depends on the approach flow conditions considered with different numerical models. Therefore, the following three approaches are presented and compared:
  • WASH1D-CS approach, which is constructed using cross-sectional bed-elevation data.
  • WASH1D-HR approach, formed using high-resolution bed-elevation data. The high-resolution DEM was used to recreate the cross-sectional topography for the WASH1D model.
  • SFM2D model based on high-resolution bed-elevation data.
Equation (17) is employed in all three approaches. The boundary connection of Equation (13) is used in the SFM2D model herein for bend scour simulations. In addition, employing Equation (17) for bend scour prediction requires the approach flow conditions (q and W) as inputs. According to the report by Hong [21], the design purpose of Shuiwei water stage gauging station is to provide the approach flow condition. Therefore, the location at Shuiwei water stage gauging station could be approach flow cross section. The numerical performances of WASH1D-CS, WASH1D-HR, and SFM2D in resolving approach flow cross section have to be verified.
For SFM2D model, the computational time step is 0.1 s, the Manning roughness is 0.025, and the fine mesh mentioned in Section 3.3 is employed herein. As shown in Figure 11, the SFM2D model has the best numerical performance of the three presented approaches. Furthermore, the WASH1D-CS approach has the most overprediction. These differences may be partly due to the uncertainty of model resolution.
Table 5 compares the simulated results with the measured data based on three criteria. For these two flood events, the SFM2D model had the most favorable numerical performance for Ehp, ETp, and R2, whereas the WASH1D-CS approach obtained the most erroneous solution. Figure 12 displays the simulated velocity contours under the peak flood condition of Typhoon Nesat obtained using the SFM2D model. The SFM2D model achieves a reasonable velocity component in the main channel, which is faster than those in the floodplain. These results indicate that incorporating high-resolution data into simulations could improve numerical performance.
Figure 13 shows simulated unit width discharges based on three approaches. For SFM2D model, the output solution of simulated unit width discharge is located at Shuiwei water stage gauging station. However, the numerical framework of WASH1D-CS and WASH1D-HR are not based on the 2D computational grids. Hence, the approach flow cross section shown in Figure 12 is adopted as the output sections of WASH1D-CS and WASH1D-HR. After obtaining unit width discharges, one substitutes the approach flow conditions (q and W) with parameters (σg, S0, Rc, tp) into Equation (17) to obtain the bend scour depth at each simulation time step.
Comparisons of the measured and simulated bend scour depths over time at the Shuiwei scour observation station for Typhoons Nesat and Maria are presented in Figure 14a,b, respectively. For Typhoon Maria, all three approaches overpredicted results. The differences between the 1D and 2D models may depend on the typhoon event. To further investigate the differences between the 1D and 2D models, an error norm was employed, defined as follows:
E d b s = | ( d b s ) i s i m ( d b s ) i m e a | | ( d b s ) i m e a |
where ( d b s ) i s i m and ( d b s ) i m e a are the simulated and measured bend scour depths at each simulation time, respectively. Among the three approaches tested, the results displayed in Table 6 demonstrated that the SFM2D was the most preferable because of its optimal numerical performance. In addition, the CPU time consumed by WASH1D and SFM2D for Typhoon Maria are 0.042 h and 1.27 h, respectively.

4. Model Application for River Embankment Failure Assessment

In disaster-prone regions, accurate and realizable predictions of the riverbank failure risk posed by scouring are vital to mitigating the effects of disasters. However, riverbank failures caused by scouring often occur suddenly and without warning. Directly monitoring the safety of embankment during floods is very difficult. Several numerical models can be employed to predict the risk of failure; however, these models require the inputting of certain parameters as well as the preprocessing of the model setup. Therefore, an alternative and efficient methodology would be valuable for rapidly assessing the risk of embankment failure prior to field site investigation.
The simulated results presented in Section 3 demonstrate that the proposed SFM2D model with fine mesh achieves acceptable performance for bend scour simulations. The model was applied to investigate the influence of river discharge or water level on the risk of riverbank failure. On the basis of the analysis results, an assessment methodology without calibrated parameters was proposed. The procedures of this new assessment methodology consist of two approaches, as displayed in Figure 15.

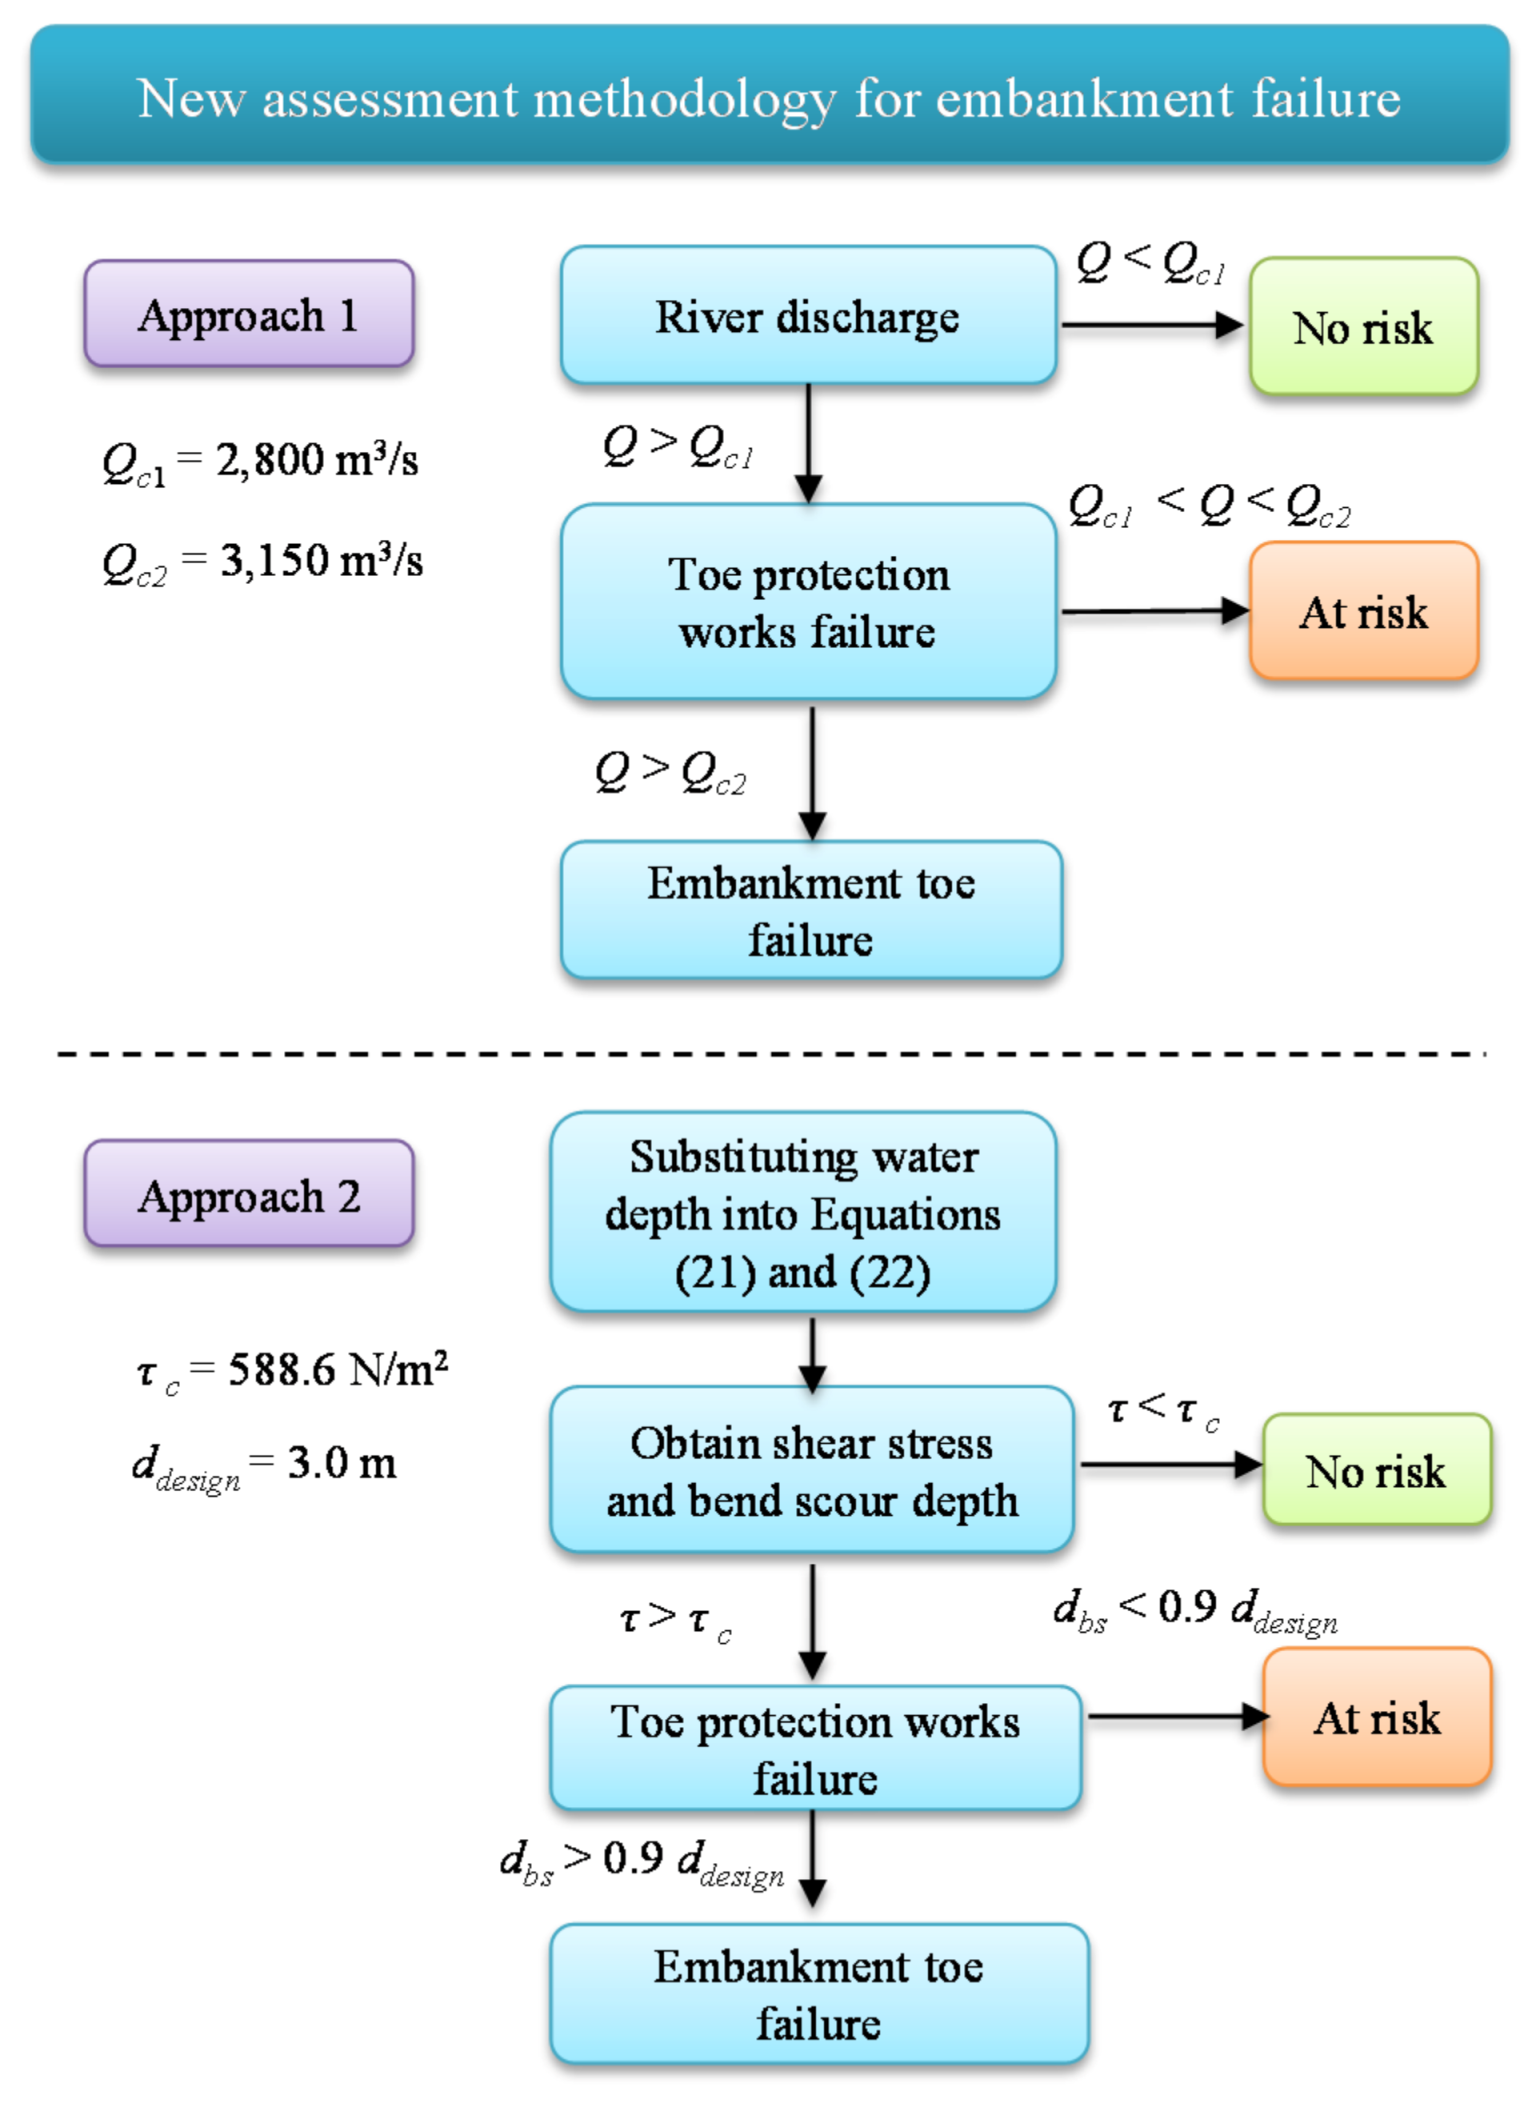
4.1. New Assessment Methodology: Approach 1

Approaches to river embankment toe protection are crucial for preventing embankment toe scouring. Once typhoon-induced floods cause the failure of embankment toe protections, the embankment toe becomes directly damaged by scouring. If the embankment toe is eroded until the scoured bed level is smaller than the riverbed level of the embankment toe foundation, the embankment toe could fail. Therefore, embankment toe protections must be considered in riverbank failure assessments.
When the shear stress acting on riverbank toe protections exceeds critical shear stress, the riverbank toe protections erode and may fail. The shear stress considers the actual force of the river flow on the embankment toe foundation. Hence, it is a more reasonable predictor of scour potential than river velocity. According to non-uniform flow theory, the shear stress can be simplified as follows [15]:
τ = ρ g h ( s fx ) 2 + ( s fy ) 2
in which the water depth and friction slopes in the x and y directions in every computational grid are simulated using SFM2D model. Figure 16 illustrates the river shear stress contour plot under the peak flow condition for Typhoon Maria. The results reveal that the simulated value of shear stress at the Shuiwei Embankment under peak-flood condition is 345.91 N/m2, which is smaller than the critical value of 588.6 N/m2 [47]. Thus, the embankment toe protections were stable.
To further investigate the relationships between shear stress and river discharge, four discharge values for 1.11-, 2-, 5-, and 10-year return period floods with peak discharges of 950, 2630, 4780, and 6490 m3/s were employed to conduct scenario simulations. As displayed in Figure 17, the simulated results of shear stress and the river discharge for four scenarios were combined with the field data under two events, revealing the relationships between river discharge, shear stress, and bend scour depth. In Figure 17, two field data of bend scour depth for Typhoons Nesat and Maria are considered. It is noted that the field data for shear stress is not available, thus the shear stress for Typhoons Nesat and Maria and four scenario cases are obtained from the simulated results under peak-flood condition. On the basis of this relationship curve, the critical flow discharge at the embankment toe protection works was estimated to be 2800 m3/s for a critical shear stress of 588.6 N/m2. Furthermore, the warning value of river discharge for riverbank failure was selected based on the failure event during Typhoon Soulik, which caused serious damage to the Shuiwei Embankment under peak flow with a discharge of 3120 m3/s.
Approach 1 in the proposed assessment methodology is principally based on river discharge. The two threshold values of river discharge detailed in Figure 15 were used as the indicators to aid with the risk identification of riverbank failure. If river discharge is larger than Qc1 of 2800 m3/s, the embankment toe protection works may fail. Therefore, without protection, the river embankment is at risk. Furthermore, sustained river discharge higher than a Qc2 value of 3150 m3/s may lead to failure of the riverbank toe foundation.

4.2. New Assessment Methodology: Approach 2

Water depth data are more easily obtained than river discharge. Therefore, the second approach proposed employs water depth as the input. The aim of this study was to develop two deterministic equations that could be considered useful tools for estimating shear stress and bend scour depth, respectively. Because the collected field data are limited, the simulated results from four numerical experiments in Section 4.1 were integrated into the model as well as field data of two events. As described in Section 4.1, the shear stress for Typhoons Nesat and Maria is not available, thus is obtained from the proposed model at peak flow simulation. In addition, the water depth hu in the upstream straight reach is a suitable information as input that can be obtained from approach flow cross section, as shown in Figure 12.
Employing the four simulated and two field values comprised of hu, Rc, and shear stress, a predictive regression equation to determine shear stress based on water depth is proposed as follows.
τ τ c = 253.91 ( h u R c ) 0.9749
Equation (21) provides acceptable results regarding measured versus computed data (R2 value of 0.95), as illustrated in Figure 18.
Applying the four simulated and two field data comprised of hu, Rc, W, and bend scour depth, the local scour depth, created by river flood flow in a bend reach, can be proposed as follows:
d b s h u = 0.8653 ln ( W R c ) + 1.3421
The results detailed in Figure 19 demonstrate that the predictions agree well with the integrated data, producing an R2 value of 0.87.
Following Equations (21) and (22), the procedure for approach 2 to assess riverbank failure is as follows:
  • Combine Equations (21) and (22) with water depth values to estimate the shear stress and bend scour depth.
  • The estimated shear stress can then be compared with the critical value.
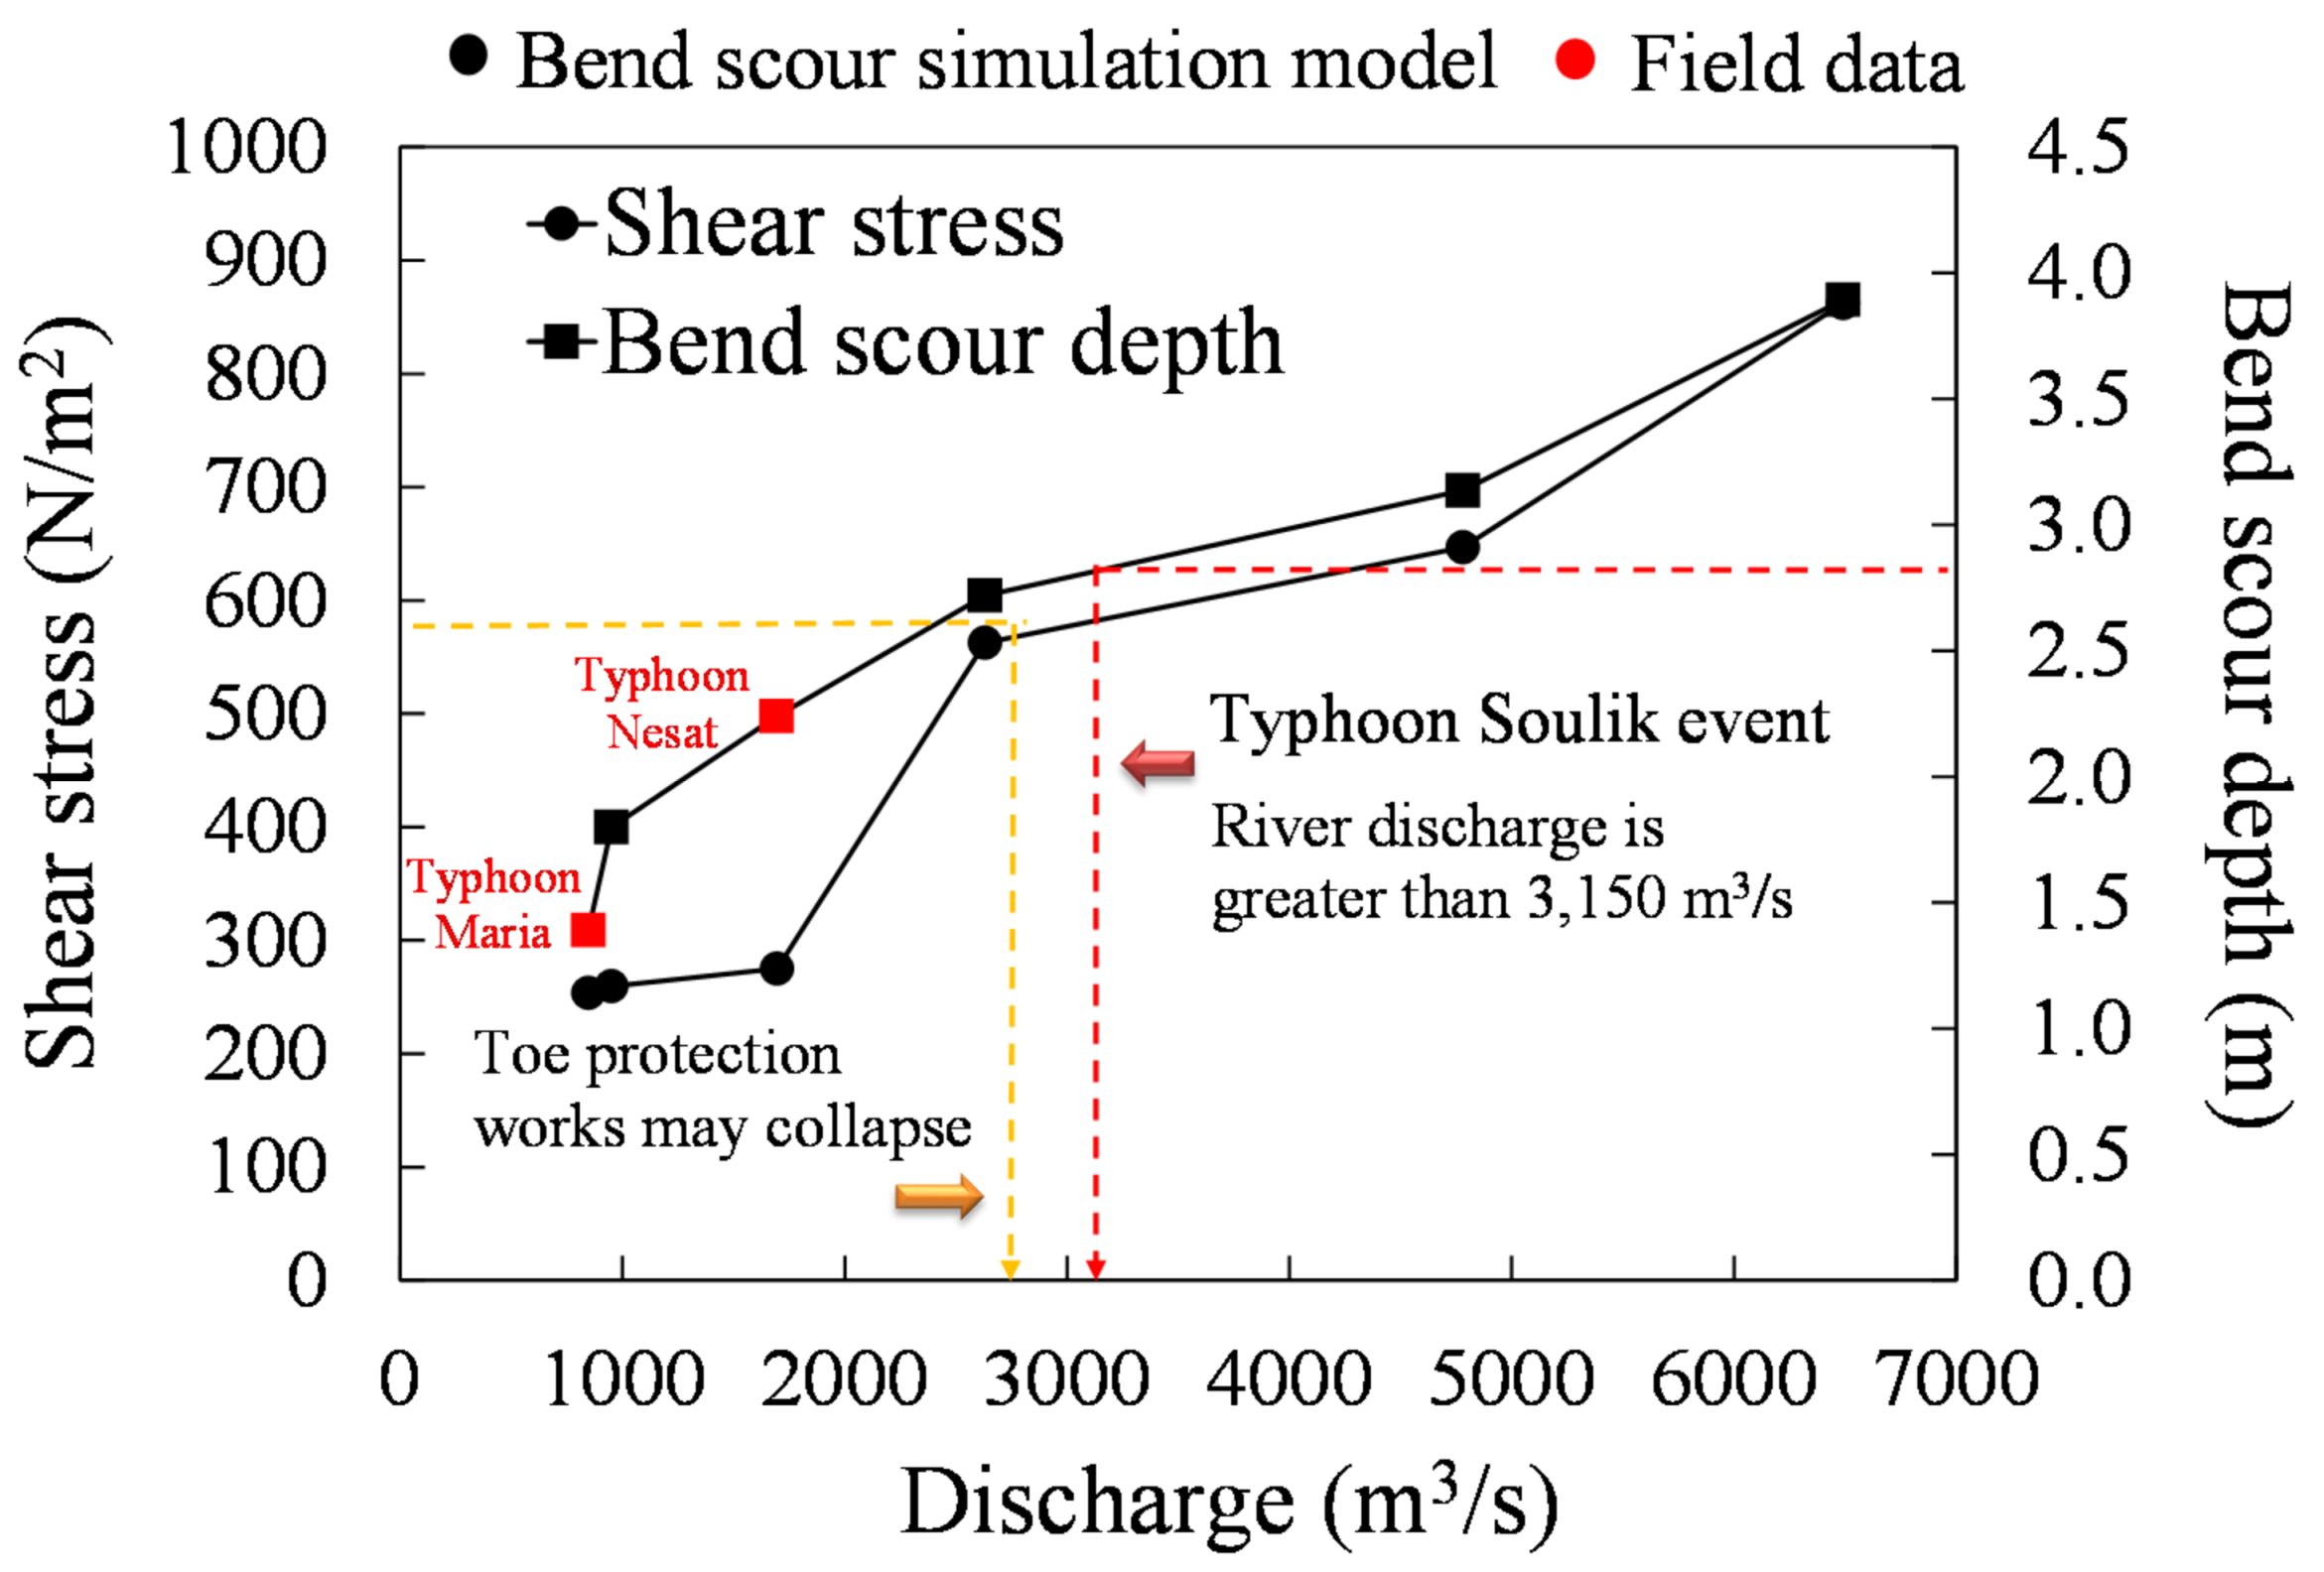
  • If the estimated shear stress is larger than the critical value of 588.6 N/m2, the riverbank toe protection works may fail.
  • The estimated bend scour depth can be compared with the designed value. If the estimated bend scour depth is larger than the designed value, the riverbank may fail.
In summary, the proposed methodology incorporates the integration of the available field data and numerical results from the SFM2D model. The methodology avoids the use of calibrated parameters by only inputting flow conditions (e.g., river discharge or water depth). Therefore, it can be used to provide a rapid assessment of the risk of embankment failure. The methodology is expected to provide an effective strategy to assist river managers in decision-making.

5. Conclusions

A new methodology is proposed that can be used to assess the risk of river embankment failure caused by bend scouring prior to field site investigations. The proposed bend scour simulation model integrates the WASH1D and SFM2D models with high-resolution bed elevation data. The proposed scour model was applied to simulate bend scour at the Shuiwei Embankment in Da-An River, Taiwan, and was verified against the field data from Typhoons Nesat and Maria. Furthermore, two empirical equations were proposed for predicting shear stress and bend scour depth. A practical assessment methodology was therefore developed on the basis of these two equations. The methodology involves considering the effects of shear stress and bend scour depth on the risk of riverbank failure.
The main conclusions and contributions of this paper are as follows.
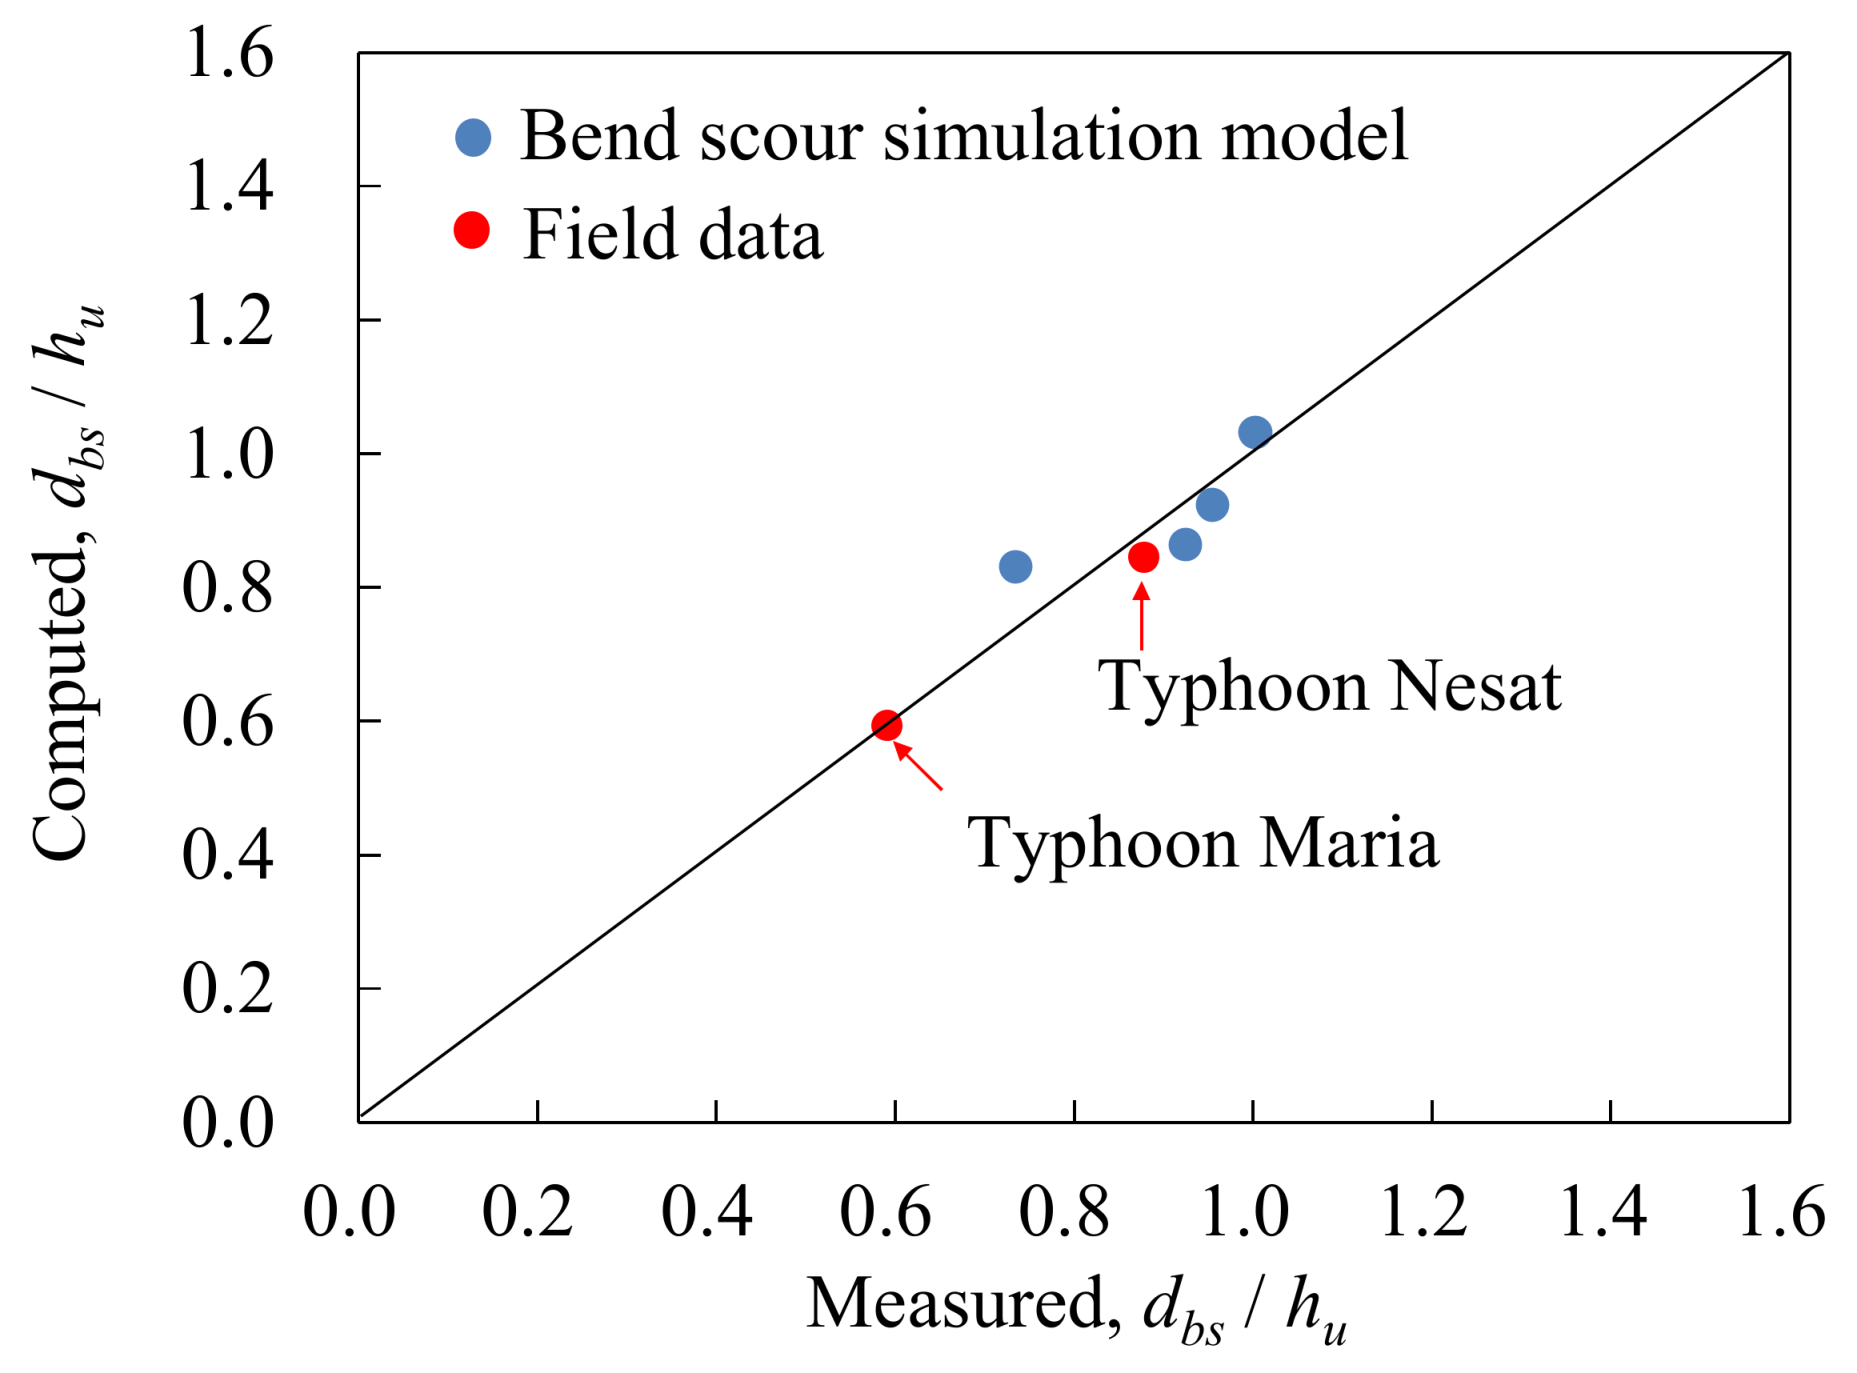
  • The integrations of WASH1D, SFM2D, and bend scouring computation equations create a bend scour simulation model. The applications of the integrated model indicated that the model was able to successfully resolve the temporal process of bend scour caused by typhoon-induce floods.
  • Based on high-resolution bed-elevation data, three approaches (namely WASH1D-CS, WASH1D-HR, and SFM2D) were presented and compared. The results demonstrate that the SFM2D model produces reasonable scour predictions with acceptable accuracy for water level and bend scour depth.
  • A new methodology for assessing embankment failure is proposed. The novel aspects of the proposed methodology include the consideration of toe protections and two new predictive equations. The former is implemented to enhance the reliability of riverbank failure assessments. The latter provides more specific deterministic results.
Due to the limitation of computing resources, the resolution of the used computational mesh is much lower than that of bed-elevation data. However, from the simulated results presented in Figure 10b and Figure 12, the proposed model achieves the reasonable water depth and velocity solutions in the main channel and floodplain. As shown in Table 5 and Table 6, the analyses of three criteria from simulated results indicate that the numerical performance of the model is acceptable. The more detailed test on the sensitivity analysis of computational mesh requires further study.
The advantage regarding the proposed methodology in terms of applicability is that it can easily be implemented in other river reaches. The method is particularly helpful for river managers in Taiwan and could be integrated into monitoring systems.

Author Contributions

Conceptualization, C.-H.C., W.-D.G. and W.-B.C.; methodology, validation and formal analysis, W.-D.G.; investigation and data curation, S.-H.Y., C.-H.L. and S.-C.L.; writing—original draft preparation, W.-D.G., writing—review and editing, C.-H.C., W.-D.G. and W.-B.C.; supervision, H.C. All authors have read and agreed to the published version of the manuscript.

Funding

This research was partially supported by the project entitled “The Application to Slopeland Disaster Prevention Technology in 2020” from the Soil and Water Conservation Bureau (SWCB), Taiwan.

Acknowledgments

The authors would like to thank the Water Resources Agency, Ministry of Economic Affairs, Taiwan for providing the field scour data at the Shuiwei embankment in Da-An River.

Conflicts of Interest

The authors declare no conflict of interest.

References

  1. Ojha, C.; Singh, V.; Adrian, D. Influence of porosity on piping models of levee failure. J. Geotech. Geoenviron. Eng. 2001, 127, 1071–1074. [Google Scholar] [CrossRef]
  2. Vrijling, J.K.; Schweckendiek, T.; Kanning, W. Safety standards of flood defenses. In Proceedings of the 3rd International Symposium on Geotechnical Safety and Risk, Munich, Germany, 2–3 June 2011. [Google Scholar]
  3. Dos Santos, R.N.C.; Caldeira, L.M.M.S.; Serra, J.P.B. FMEA of a tailings dam. Georisk 2012, 6, 89–104. [Google Scholar] [CrossRef]
  4. Zhang, L.M.; Xu, Y.; Liu, Y.; Peng, M. Assessment of flood risks in Pearl River Delta due to levee breaching. Georisk 2013, 7, 122–133. [Google Scholar] [CrossRef]
  5. Langendoen, E.J.; Simon, A. Modeling the evolution of incised streams. II: Streambank erosion. J. Hydraul. Eng. 2008, 134, 905–915. [Google Scholar] [CrossRef]
  6. Hossain, M.B.; Sakai, T.; Hossain, M.Z. River embankment and bank failure: A study on geotechnical, characteristics and stability analysis. Am. J. Environ. Sci. 2011, 7, 102–107. [Google Scholar] [CrossRef]
  7. Polemio, M.; Lollino, P. Failure of infrastructure embankments induced by flooding and seepage: A neglected source of hazard. Nat. Hazards Earth Syst. Sci. 2011, 11, 3383–3396. [Google Scholar] [CrossRef] [Green Version]
  8. Midgley, T.L.; Fox, G.A.; Heeren, D.M. Evaluation of the bank stability and toe erosion model (BSTEM) for predicting lateral retreat on composite streambanks. Geomorphology 2012, 145–146, 107–114. [Google Scholar] [CrossRef] [Green Version]
  9. Huang, W.C.; Weng, M.C.; Chen, R.K. Levee failure mechanisms during the extreme rainfall event: A case study in Southern Taiwan. Nat. Hazards 2014, 70, 1287–1307. [Google Scholar] [CrossRef] [Green Version]
  10. Huang, W.C.; Yu, H.W.; Weng, M.C. Levee reliability analyses for various flood return periods—A case study in southern Taiwan. Nat. Hazards Earth Syst. Sci. 2015, 15, 919–930. [Google Scholar] [CrossRef]
  11. Hossain, A.T.M.S.; Haque, S.A. Influence of short term rainfall on the Jamuna river west bank protection flood embankment stability at Bahuka, Sirajgonj, Bangladesh—A Case Study. IOSR J. Environ. Sci. Toxicol. Food Technol. (IOSR-JESTFT) 2019, 13, 60–68. [Google Scholar]
  12. Faeh, R. Numerical modeling of breach erosion of river embankments. J. Hydraul. Eng. 2007, 133, 1000–1009. [Google Scholar] [CrossRef]
  13. Jia, D.D.; Shao, X.; Wang, H.; Zhou, G. Three-dimensional modeling of bank erosion and morphological changes in the Shishou bend of the middle Yangtze River. Adv. Water Resour. 2010, 33, 348–360. [Google Scholar] [CrossRef]
  14. Mizutani, H.; Nakagawa, H.; Yoden, T.; Kawaike, K.; Zhang, H. Numerical modelling of river embankment failure due to overtopping flow considering infiltration effects. J. Hydraul. Res. 2013, 51, 1–15. [Google Scholar] [CrossRef] [Green Version]
  15. Lai, Y.G. Modeling stream bank erosion: Practical stream results and future needs. Water 2017, 9, 950. [Google Scholar] [CrossRef] [Green Version]
  16. Rousseau, Y.Y.; De Wiel, M.J.V.; Biron, P.M. Simulating bank erosion over an extended natural sinuous river reach using a universal slope stability algorithm coupled with a morphodynamic model. Geomorphology 2017, 295, 690–704. [Google Scholar] [CrossRef] [Green Version]
  17. Stecca, G.; Measures, R.; Hicks, D.M. A framework for the analysis of noncohesive bank erosion algorithms in morphodynamic modeling. Water Resour. Res. 2017, 53, 6663–6686. [Google Scholar] [CrossRef]
  18. Lin, C. Study on Related Countermeasures of Scour Vulnerable Levees along Cho-Shui River; Fourth River Management Office, Water Resources Agency, Ministry of Economic Affairs: Changhua County, Taiwan, 2007. [Google Scholar]
  19. Guo, W.D.; Hong, J.H.; Chen, C.H.; Su, C.C.; Lai, J.S. A simplified simulation method for flood-induced bend scour—A case study near the Shuideliaw embankment on the Cho-Shui River. Water 2017, 9, 324. [Google Scholar] [CrossRef] [Green Version]
  20. Yeh, G.T.; Shih, D.S.; Cheng, J.R. An integrated media, integrated processes watershed model. Comput. Fluids 2011, 45, 2–13. [Google Scholar] [CrossRef]
  21. Hong, J.H. Real-time Monitoring for Embankment Scour along River Bends; Water Resources Planning Institute, Water Resources Agency, Ministry of Economic Affairs: Taichung, Taiwan, 2018. [Google Scholar]
  22. Melville, B.W.; Coleman, S.E. Bridge Scour; Water Resources Publications: Highlands Ranch, CO, USA, 2000. [Google Scholar]
  23. Shih, D.S.; Yeh, G.T. Using a characteristic-based particle tracking method to solve one-dimensional fully dynamic wave flow. Comput. Geosci. 2018, 22, 439–449. [Google Scholar] [CrossRef]
  24. Yu, L.; Chua, L.H.C.; Shih, D.S. An ensemble approach for typhoon runoff simulation with perturbed rainfall forecasts in Taiwan. In Proceedings of the 11th International Conference on Hydroinformatics, New York, NY, USA, 17–21 August 2014. [Google Scholar]
  25. Basri, H.; Sidek, L.M.; Shih, D.S.; Lloyd, H.C.; Azad, W.H.; Abdul Razad, A.Z. One dimensional shallow water equation streamflow modeling using WASH123D model. Int. J. Eng. Technol. 2018, 7, 880–884. [Google Scholar] [CrossRef] [Green Version]
  26. Shih, D.S.; Hsu, T.W.; Chang, K.C.; Juan, H.L. Implementing coastal inundation data with an integrated wind wave model and hydrological watershed simulations. Terr. Atmos. Ocean. Sci. 2012, 23, 513–525. [Google Scholar] [CrossRef] [Green Version]
  27. Yang, T.H.; Chen, Y.C.; Chang, Y.C.; Yang, S.C.; Ho, J.Y. Comparison of different grid cell ordering approaches in a simplified inundation model. Water 2015, 7, 438–454. [Google Scholar] [CrossRef] [Green Version]
  28. Liu, P.C.; Shih, D.S.; Chou, C.Y.; Chen, C.H.; Wang, Y.C. Development of a parallel computing watershed model for flood forecasts. Procedia Eng. 2016, 154, 1043–1049. [Google Scholar] [CrossRef] [Green Version]
  29. Lai, J.S.; Guo, W.D.; Lin, G.F.; Tan, Y.C. A well-balanced upstream flux-splitting finite-volume scheme for shallow-water flow simulations with irregular bed topography. Int. J. Numer. Methods Fluids 2010, 62, 927–944. [Google Scholar] [CrossRef]
  30. Guo, W.D.; Lai, J.S.; Lin, G.F.; Lee, F.Z.; Tan, Y.C. Finite volume multi-stage scheme for advection-diffusion modeling in shallow water flow. J. Mech. 2011, 27, 415–430. [Google Scholar] [CrossRef]
  31. Miglio, E.; Perotto, S.; Saleri, F. Model coupling techniques for free surface flow problems: Part I. Nonlin. Anal. 2005, 63, 1885–1896. [Google Scholar] [CrossRef]
  32. Finaud-Guyot, P.; Delenne, C.; Guinot, V.; Llovel, C. 1D-2D coupling for river flow modelling. Comptes Rendus Mécanique 2011, 339, 226–234. [Google Scholar] [CrossRef] [Green Version]
  33. Bladé, E.; Gómez-Valentín, M.; Dolz, J.; Aragón-Hernández, J.L.; Corestein, G.; Sánchez-Juny, M. Integration of 1D and 2D finite volume schemes for computations of water flow in natural channels. Adv. Water Resour. 2012, 42, 17–29. [Google Scholar] [CrossRef]
  34. Yin, J.; Yu, D.; Yin, Z.; Wang, J.; Xu, S. Multiple scenario analyses of Huangpu River flooding using a 1D/2D coupled flood inundation model. Nat. Hazards 2013, 66, 577–589. [Google Scholar] [CrossRef]
  35. Morales-Hernández, M.; Petaccia, G.; Brufau, P.; García-Navarro, P. Conservative 1D–2D coupled numerical strategies applied to river flooding: The Tiber (Rome). Appl. Math. Modell. 2016, 40, 2087–2105. [Google Scholar] [CrossRef]
  36. Anastasiou, K.; Chan, C.T. Solution of the 2D shallow water equations using the finite volume method on unstructured triangular meshes. Int. J. Numer. Methods Fluids 1997, 24, 1225–1245. [Google Scholar] [CrossRef]
  37. Guo, W.D.; Lai, J.S.; Lin, G.F. Hybrid flux-splitting finite-volume scheme for the shallow water flow simulations with source terms. J. Mech. 2007, 23, 399–414. [Google Scholar] [CrossRef]
  38. Galay, V.J.; Yaremko, E.K.; Quazi, M.E. River Bed Scour and Construction of Stone Riprap Protection in Sediment. Transport. Gravel Bed Rivers; John Wiley and Sons, Ltd.: New York, NY, USA, 1987. [Google Scholar]
  39. Thorne, C.R. Bank Processes on the Red River between Index, Arkansas and Shreveport, Louisiana; Final Report to the US Army European Research Office, contract number DAJA45-88-C-0018; Department of Geography, Queen Mary College: London, UK, 1988. [Google Scholar]
  40. USA Army Corps of Engineering (USACE). Hydraulic Design of Flood Control. Channels; Engineering Manual 1110-2-1601; Department of the Army, Corps of Engineers, Office of the Chief of Engineers: Washington, DC, USA, 1994. [Google Scholar]
  41. Lin, G.H.; Lin, C. Research in Foundation Erosion of Hazard. Potential Levees in Jhuoshuei River; Fourth River Management Office, Water Resources Agency, Ministry of Economic Affairs: Changhua County, Taiwan, 2013. [Google Scholar]
  42. Lu, J.Y. Field Study of Short-Term Riverbed General Scour for Typhoon-induced Floods; Water Resources Planning Institute, Water Resources Agency, Ministry of Economic Affairs: Taichung, Taiwan, 2014. [Google Scholar]
  43. Su, C.C.; Lu, J.Y. Comparison of sediment load and riverbed scour during floods for gravel-bed and sand-bed reaches of intermittent rivers: Case study. J. Hydraul. Eng. 2016, 142, 05016001. [Google Scholar] [CrossRef]
  44. Yi, R.; Wang, R.Y. Applied Hydrology; National Compilation Committee: Taipei, Taiwan, 1988. [Google Scholar]
  45. Xia, H.M. Establishment of Flood-Warning System for Yen-Shui Creek Basin; Water Resources Office, Water Resources Agency, Ministry of Economic Affairs: Taipei, Taiwan, 2000. [Google Scholar]
  46. Su, C.C.; Hong, J.H.; Guo, W.D.; Wang, H.W. Internet of things for bend scour disaster warning system-a case study near Shuiwei Embankment in Daann River. J. Chin. Inst. Civ. Hydraul. Eng. 2019, 31, 301–314. [Google Scholar]
  47. Yang, J.C. Study of Revetment Safety Monitoring and Analysis Modeling in Urban Area Drainage Systems; Water Resources Planning Institute, Water Resources Agency, Ministry of Economic Affairs: Taichung, Taiwan, 2014. [Google Scholar]
Figure 1. Framework of 1D-2D model integration.
Water 12 01026 g001
Figure 2. Methodological flow chart for bend scour simulations.
Water 12 01026 g002
Figure 3. Location of this study site displaying the simulation domain of WASH1D and SFM2D.
Water 12 01026 g003
Figure 4. Model setup for WASH1D and SFM2D models.
Water 12 01026 g004
Figure 5. Boundary conditions for the test events of Typhoons (a) Saola and (b) Soulik.
Water 12 01026 g005
Figure 6. Boundary conditions for the test events of Typhoons (a) Nesat and (b) Maria.
Water 12 01026 g006
Figure 7. Comparisons of the measured and simulated water levels at (a) Xiangbi, (b) Shuangqi, (c) Yili, and (d) Dadaian gauging stations for Typhoon Saola (July 2012).
Water 12 01026 g007
Figure 8. Comparisons of the measured and simulated water levels at (a) Xiangbi, (b) Shuangqi, (c) Yili, and (d) Dadaian gauging stations for Typhoon Soulik (July 2013).
Water 12 01026 g008
Figure 9. Comparisons of the measured and simulated water levels at (a) Shuiwei scour and (b) Yili gauging stations for Typhoon Nesat (July 2017).
Water 12 01026 g009
Figure 10. Contour plots showing the water depths based on (a) coarse and (b) fine computational meshes for Typhoon Nesat.
Water 12 01026 g010
Figure 11. Comparisons of the measured and simulated water levels obtained using three approaches at the Shuiwei gauging station for (a) Typhoon Nesat and (b) Typhoon Maria.
Water 12 01026 g011
Figure 12. Contour plot illustrating the flow velocity under peak-flood condition for Typhoon Nesat.
Water 12 01026 g012
Figure 13. The simulated unit width discharges based on three approaches at Shuiwei water stage gauging station for (a) Typhoon Nesat and (b) Typhoon Maria.
Water 12 01026 g013
Figure 14. Comparisons of the measured and simulated bend scour depths obtained using three approaches at Shuiwei scour gauging station for (a) Typhoon Nesat and (b) Typhoon Maria.
Water 12 01026 g014
Figure 15. Procedure of the proposed assessment methodology for predicting reinforced concrete embankment failure.
Water 12 01026 g015
Figure 16. Contour plot illustrating shear stress under peak-flood condition for the Typhoon Maria event.
Water 12 01026 g016
Figure 17. Relationships between shear stress, bend scour depth, and river discharge under peak-flood condition.
Water 12 01026 g017
Figure 18. Computed and measured τ/τc with an R2 value of 0.95.
Water 12 01026 g018
Figure 19. Computed and measured dbs/hu with an R2 value of 0.87.
Water 12 01026 g019
Table 1. Field data collection for bend scour induced by Typhoons Nesat and Maria [21,46].
Flood Eventstp (h)S0(%)σg Rc (m)
Typhoon Nesat1.51.093.28489
Typhoon Maria3.01.093.28434
Table 2. Simulated results for three criteria of two flood events obtained using the WASH1D model.
EventsStationsThree Criteria
Ehp (%)ETp (%)R2
Typhoon Saola (July 2012)Xiangbi1.642.940.97
Shuangqi15.072.940.76
Yili13.8212.10.80
Dadaian3.0712.10.93
Typhoon Soulik (July 2013)Xiangbi18.2400.97
Shuangqi16.1914.30.78
Yili14.5900.75
Dadaian17.9123.80.93
Table 3. Simulated results for three criteria of Typhoon Nesat obtained using the SFM2D model.
StationsThree Criteria
Ehp (%)ETp (%)R2
Yili18.1800.92
Shuiwei scour2.4100.82
Table 4. Simulated results using two different computational meshes for Typhoon Nesat.
Computational MeshCPU Time (h)Ehp (%)
YiliShuiwei Scour
Coarse mesh
(1230 elements and 1364 nodes)
0.4657.6534.13
Fine mesh
(7465 elements and 7910 nodes)
1.8518.182.41
Table 5. Simulated results at the Shuiwei water gauging station obtained using the three presented approaches.
EventsApproachesThree Criteria
Ehp (%)ETp (%)R2
Typhoon Nesat (July 2017)WASH1D-CS108.4200.88
WASH1D-HR57.6700.85
SFM2D20.8100.91
Typhoon Maria (July 2018)WASH1D-CS56.818.330.89
WASH1D-HR26.678.330.88
SFM2D12.738.330.96
Table 6. Performance comparisons of three approaches for Typhoons Nesat and Maria.
EventsEdbs by Different Approaches
WASH1D-CSWASH1D-HRSFM2D
Typhoon Nesat (July 2017)0.1420.1040.080
Typhoon Maria (July 2018)2.0222.0961.097

