Diffusion of Electronic Water Payment Innovations in Urban Ghana. Evidence from Tema Metropolis


1
School of Geography and the Environment, University of Oxford, Oxford OX1 3QY, UK
2
Centre for Development Informatics, Global Development Institute, University of Manchester, Arthur Lewis Building, Manchester M13 9PL, UK
3
UK Centre for Ecology and Hydrology, Maclean Building, Benson Lane, Crowmarsh Gifford, Wallingford, Oxford OX10 8BB, UK
4
Faculty of Theology, University of Munich, Geschwister Scholl Platz 1, 80539 Munich, Germany
5
Ghana Water Company Limited, Tema Region, Stadium Road, Tema, P.O. Box 163, Ghana
*
Author to whom correspondence should be addressed.
Water 2020, 12(4), 1011; https://doi.org/10.3390/w12041011
Submission received: 4 February 2020
/
Revised: 17 March 2020
/
Accepted: 26 March 2020
/
Published: 2 April 2020
(This article belongs to the Section Water Resources Management, Policy and Governance)
Abstract
:Recent advances in mobile technologies, especially in the utility payment space, are having an increasingly profound impact on our daily lives and offer advantageous services in the utility sectors. This paper examines the prevalence and patterns of customer uptake of an electronic water payment (EWP) system and its implications for water delivery in the Tema Metropolitan Area, Ghana. Data for the study comprised a survey of 250 utility customers and the review of a 12-month water use and customer payment database from a water supply company. Results indicate that although customers were aware of EWP’s existence, overall uptake was very low. EWP awareness and intention to use EWP were not significantly associated with customers’ gender, phone/mobile money ownership, educational status, and water usage. However, age, employment status, income, and means of receiving monthly bills were found to be statistically different in relation to the awareness of EWP. These findings offer several implications for water service and utility providers to market mobile payment solutions and to increase the consumer uptake of these services and payment options.
1. Introduction
Globally, urban water service provision is becoming increasingly challenging as a result of escalating demands from population growth, urbanisation, and climate change [1,2,3]. For instance, global estimates have shown that nearly 844 million people lack access to a secure water source, and more than three (3) billion people do not have piped water on their premises [4]. In most urban areas, water service providers constantly face ineffective water delivery due to increasing demand [5]. In sub-Saharan Africa, geographically-limited infrastructures in an era of urban expansion, insufficient operational financing to serve low income populations, and high levels of water loss are the factors limiting improved water provision [6,7,8]. Many studies have reported that operational inefficiencies, i.e., poor management and infrastructure that affect urban utility providers in Africa, account for about USD 1 billion [9,10]. Others [7,11] have argued that the main drivers for poor operational performance and cost-recovery among most water service providers (WSPs) in Africa are due to the under-collection of revenue from customers and petty corruption in the water sector. As Rouse [8] posited, effective revenue collection is vital for WSPs to achieve cost recovery, which is critical for utilities’ ability to sustain and expand services. Despite extensive studies [11,12] on the benefits of good governance and accountability in ensuring quality services, most service providers continue to grapple with these seemingly insurmountable challenges.
To overcome these significant challenges that are fundamental to water service provision and especially water payments, innovative approaches and technological applications are imperative [13]. For instance, recent advances in mobile technologies, especially in the utility payment space, are having an increasingly profound impact on our daily lives and offer interesting and advantageous services in the utility sectors [14]. Previous empirical research has suggested that the adoption of technological systems such as mobile-enabled water payment hold great prospects in breaking out of the vicious cycle of poor operational cost performance and the need of water users [15,16]. Incorporating electronic water payments (EWPs) is expected to help WSPs expand services to low-income areas through improved revenue collection, a reduced administrative burden of bill processing, and greater customers’ convenience regarding bill payments [9,15]. Additionally, EWPs help break the monthly billing cycle of WSPs, as these pose problems to customers [17]. With considerable amount of research reported in Africa [14,15,16,17,18] on mobile-enabled payments on revenue collection and increasing service quality in the water sector, the Ghanaian experience presents an interesting case study due to the unique innovations in its electronic water payment system. Additionally, these studies on mobile water payments have mainly provided insights into water payment systems along East African country (e.g., Kenya, Tanzania, Zambia, and Uganda) lines with little or no emphasis on intra-country dynamics prevailing in West African countries.
Ghana, like most developing countries, continues to be overwhelmed by a constellation of challenges in the water sector [19]. For instance, the irregular and non-payment of water bills, poor billing, and the difficulty in monitoring the corrupt practices of meter readers increase the operational costs of service providers [20]. Though the urban utility provider (Ghana Water Company Limited) has instituted other measures such as creating more payment points and contracting private collectors and banks, these structures have proven ineffective [20,21,22]. A response to improving revenue collection and cost recovery is the introduction of a new electronic payment system through different platforms (mobile money, mobile banking, customer mobile app and e-payment services) to provide customers the needed convenience in paying their water bills (Ghana Water Company Limited [23]). Recognising the level of mobile phone penetration (130.9%) [24], mobile connectivity (67%), and mobile financial services (40%) in Ghana, the GWCL (Ghana Water Company Limited) has rolled out and operationalised this new system into the financial digitised ecosystem [24,25]. In the Ghanaian case, the adoption of new payment systems includes not all but more electronic channels; mobile money, Visa and Master Card payments (mobile banking), mobile apps, and other e-payment services, which are particularly striking in the African context (see Table 1).
Despite the level of digitalised systems in Ghana in service provision, there is a dearth of empirical evidence examining the patterns and adoption of digitised financial instruments, especially in the water sector. Against this backdrop and contributing to the scant but growing research on digitised payments in service delivery, an attempt to understand the unique elements of electronic water payments from customers’ perspective is crucial due to a relative knowledge gap on this topic in Ghana. With a global increase in smart water grids and payments discourse [15,16,17,18,26], the aim of this present study was to examine the prevalence and patterns of electronic water payment adoption in urban Ghana. A better understanding of this prevailing system is crucial to provide baseline evidence to inform water and public policy discourse in both Ghana and other Global South countries with similar water delivery systems.
2. Materials and Methods
2.1. Study Design and Context
This paper is part of a larger study [27] that was conducted between June and July 2018 examining the adoption of electronic water payment among stakeholders in urban Ghana. The study employed a mixed methods approach comprising a cross-section of water customers who participated in an EWP system project. In this paper, only the quantitative aspect of the broader study is reported. The study was conducted in the Tema Metropolitan Area (the Tema region (which includes Tema Metropolis) used in this study was based on GWCL boundaries and demarcation rather than the political boundary extent), situated 30 kilometres east of Accra, the capital city of Ghana [28]. According to national census in 2010, Tema had a population of 292,773, representing a total number of 70,797 households [28]. In terms of water supply systems, Tema holds an important history because it hosts most industrial and commercial consumers. Additionally, it is one of the largest of the thirteen water supply regions operated by GWCL nationwide with a customer strength of approximately 94,000 connections among eleven (11) smaller manageable GWCL districts. The choice of this region was informed by a number of reasons. First, Tema is the first GWCL region in Ghana where the electronic billing system was piloted. Second, the existence relatively well-organized digital water use and payment records of the Tema Central district positioned the region as a suitable setting for this investigation (Tema Central District is one of the districts in the Tema region). Third, the region hosts people from diverse socio-economic backgrounds (low, medium, and high-income groups) characteristic of most urban areas in sub-Saharan Africa.
2.2. Sampling and Data Collection
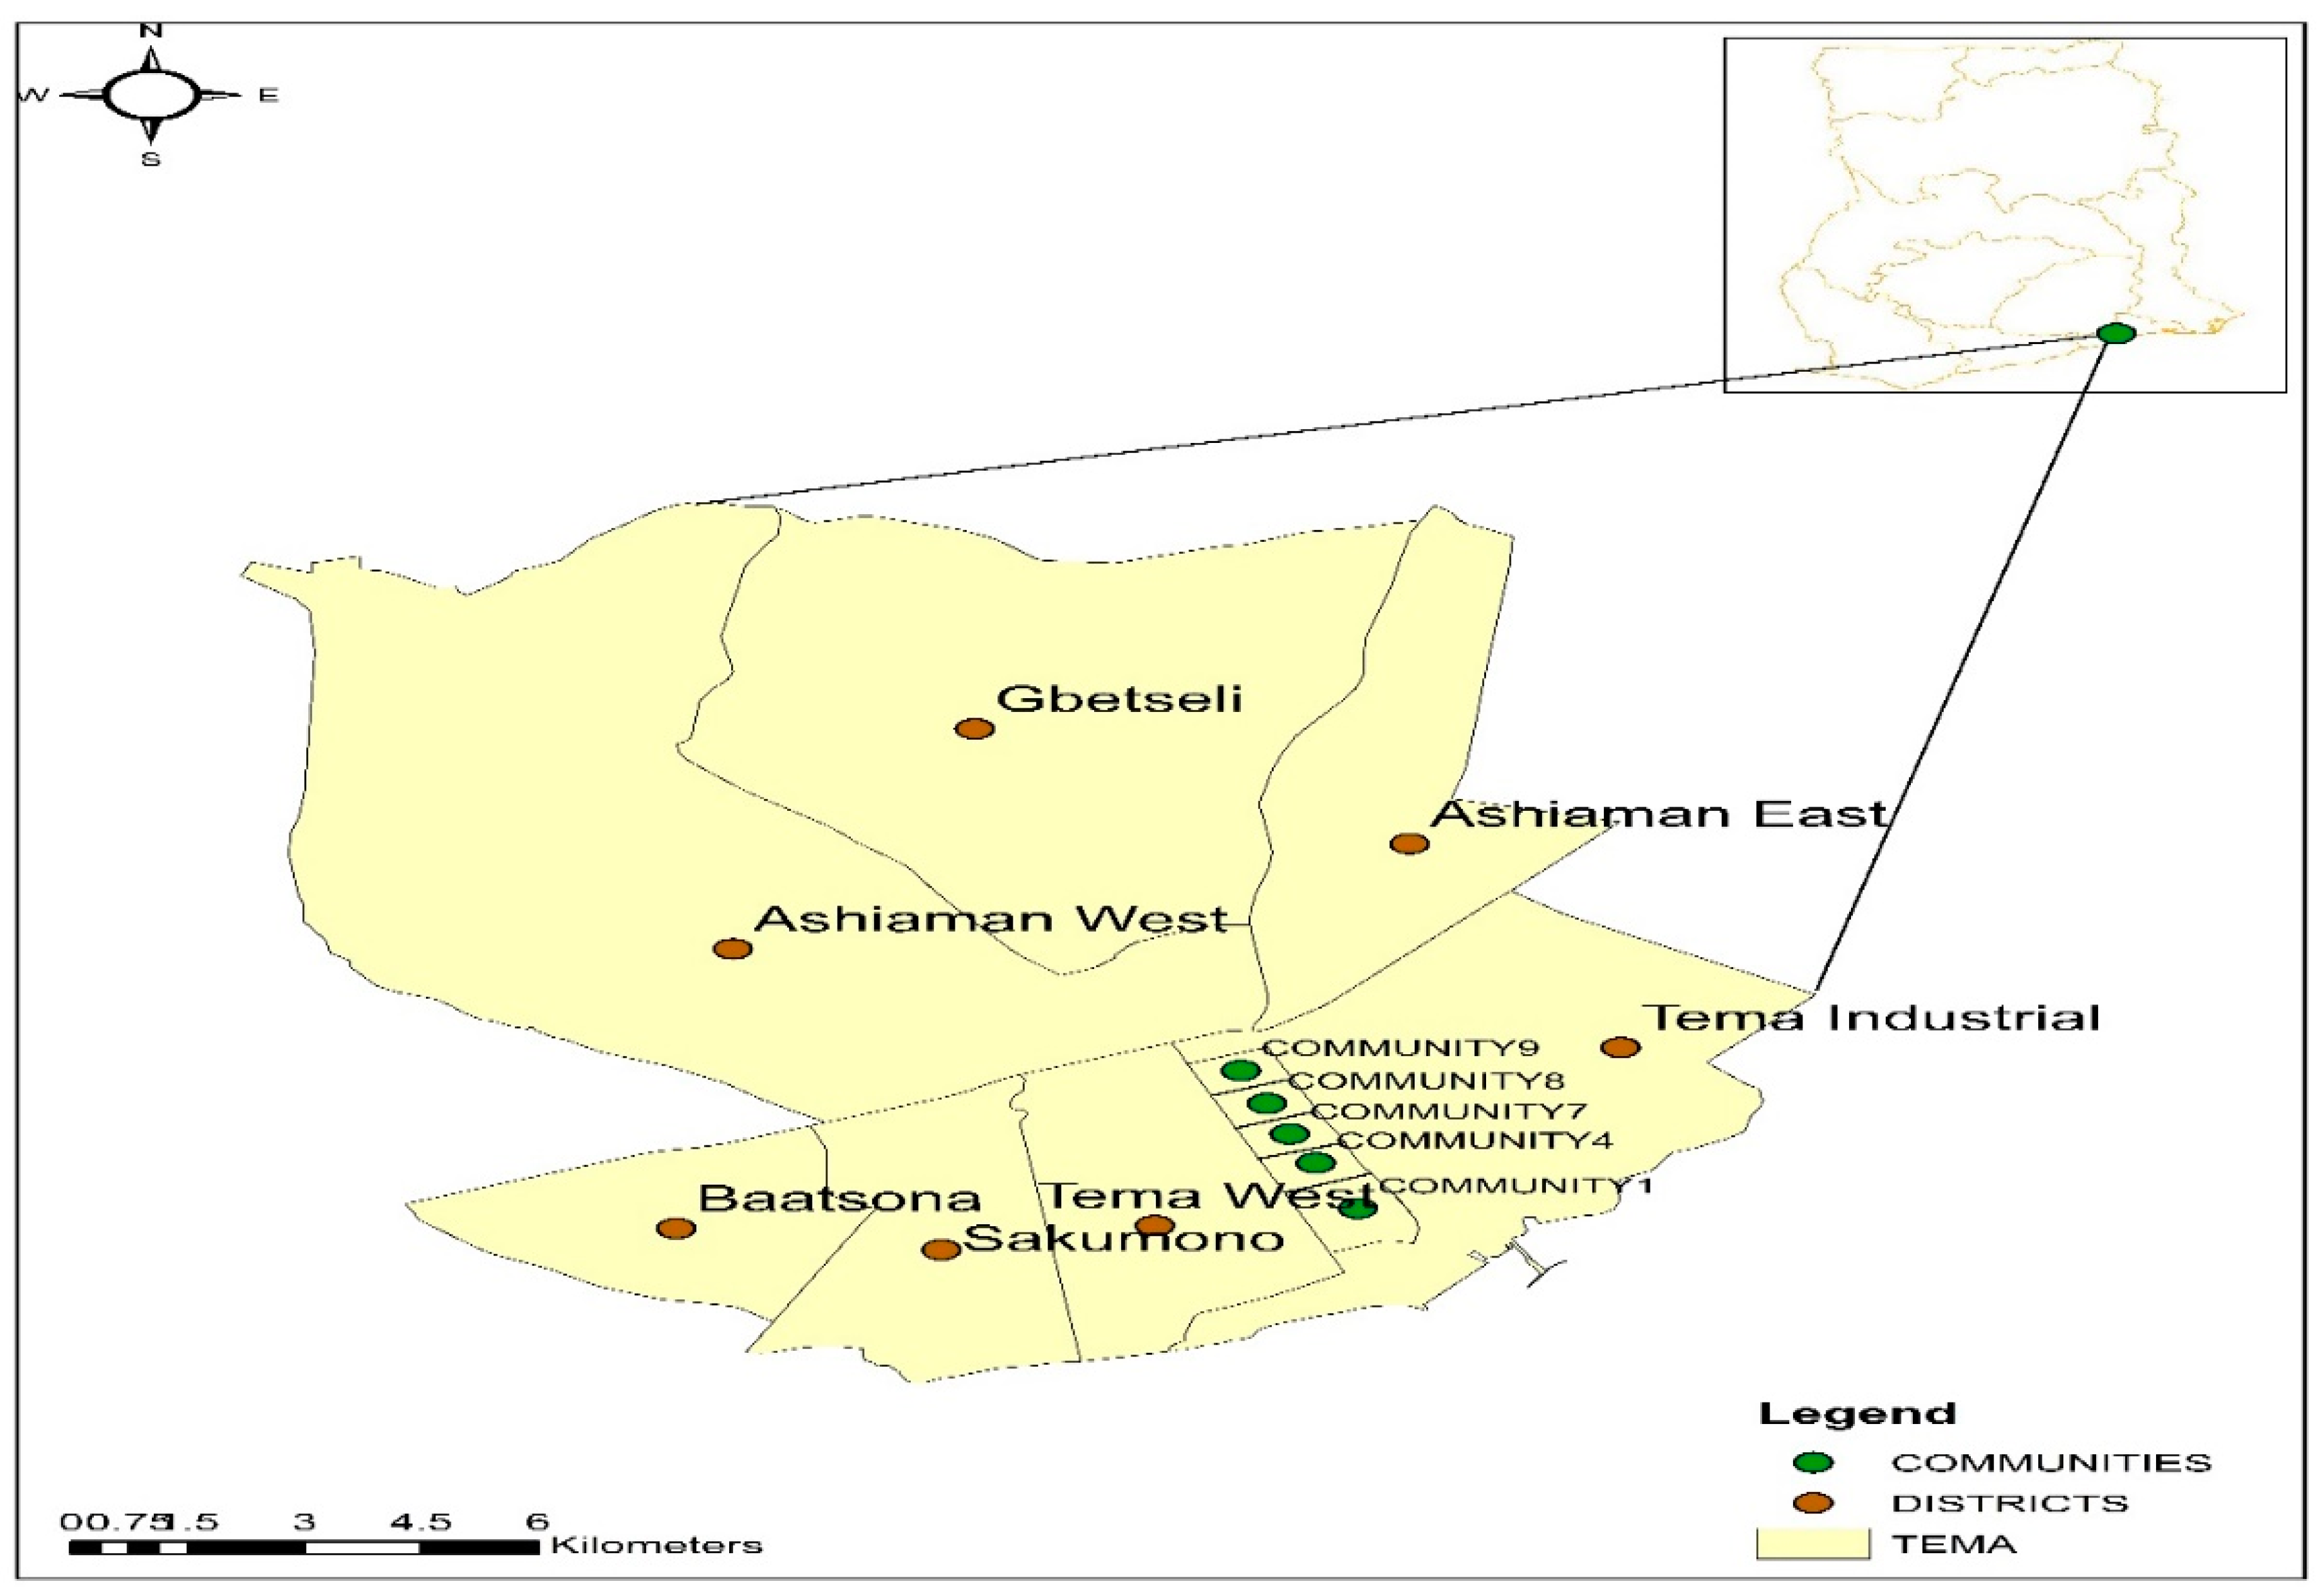
The study adopted a multi-stage sampling approach. First was a random selection of Tema Central District from a list of GWCL districts in Tema operational region (see Figure 1). Using this technique, 250 respondents (only GWCL-connected households) were systematically sampled, based on local advice from GWCL. In the district, a systematic survey of every 5th household in a street of Tema Central was sampled. We began by randomly selecting a household in the Tema Central area, after which every 5th household was surveyed until a total of 250 households were reached. Researchers made efforts to interview appropriate household heads or mainly people who were directly involved in bill payments at the household (household in the context of this study refers to a group of people who share the same cooking arrangements and have one recognisable head) level. In cases of non-response and unwillingness to take part in the study, the field team moved to the next household, after which the systematic sampling began. This district has the smallest GWCL boundary extent and well-laid roads in the region, and these aspects made the sampling process quite simple and easy to be carried out. The randomness of the sampling technique and the homogeneity of the study participants helped to ensure the generalisability of the study findings across the target population. Questionnaires were mainly used to elicit participants’ view on the study topic. Information collated included customers’ demographic characteristics, mobile phone use, payment methods and preferences, and the use of electronic-enabled payment systems (see Appendix A). Water use and payment data spanning July 2017 to June 2018 of the Tema Central District were also sourced from the Ghana Water Company to form an integral part of the study. Requisite permission from GWCL was obtained prior to the commencement of data collection. Participation in this research was voluntary, and respondents were assured of the strict confidentiality and anonymity of the responses provided. Additionally, GWCL customer account numbers were anonymised.
2.3. Data Analysis
Quantitative data were descriptively and inferentially analysed with the Predictive Analytics SoftWare (PASW) version 16 before being reported in tables and charts. Prior to the quantitative analysis, data were subjected to validity checks and carefully verified for inconsistencies. In all, 250 completed questionnaires were descriptively and statistically analysed with the Pearson chi-squared test (χ2) model. Analyses were performed with a p-value of < 0.05 as the statistical significance threshold.
Secondary data (water use and payment data) were also analysed with Microsoft Excel. Data from GWCL billing and payment records were matched with sampled households to help establish the water use patterns between the adopters of EWP and traditional payment users. Matching was based on respondents’ account numbers given during the data collection. This was mainly based on the willingness to give their account numbers and the accuracy of the respective numbers. Out of 250 participants, 181 of them (customers) had their account numbers matching GWCL’s “Statement of billing” records. Additionally, the per capita water use of the respondents was computed using daily average use divided by the household size (the average household size is shown in Table 2). Water use data for July and August were unavailable from GWCL.
3. Results
3.1. Sample Characteristics and Determinants of Differences in EWP Awareness
Table 2 shows the distribution of selected dependent and independent variables that were stratified based on EWP awareness. Overall, we observed differences in EWP awareness across variables. The majority of the respondents (61%) reported being aware of EWP existence. The average household size of participants was 4.98 people. There were more females (51%) than males (49%). The majority of respondents were aged 41–50 years (29%), with secondary education (48%), self-employed (52%), and earning income (17%) above GH¢ 2000 (GH¢ is the national currency of Ghana). It can be inferred from Table 2 that EWP awareness was higher among older customers (within the age group 41–50 years) and those with higher income than the younger age group (18–30 years).
The majority of respondents (73%) received their bills on both their phone via Short Message Service (SMS) and on paper. Customers were more likely to be aware of the existence of EWP depending on how they received their monthly water bills. This was statistically significant (χ2 (3, N = 250) = 19.055, p = 0.000). Additionally, the results identified age, income and the employment status of customers to be statistically associated with EWP awareness (see Table 2). However, EWP awareness was not associated with the gender and educational level of respondents. The survey found that all 250 respondents surveyed owned mobile phones (Table 3), with 81% having mobile money accounts. Additionally, when considering the low patronage from this study, it could be deduced from the descriptive statistics that mobile phone ownership and mobile money usage may not be significant determinants of EWP uptake by customers.
3.2. Level of EWP Diffusion
Table 3 shows the proportion of customer payment preferences for a period of one year (July 2017 to June 2018). Two main payment options were computed from the GWCL billing and payment records for the Tema Central District. The data revealed the proportion of water utility customers using each payment method from July 2017 (when e-payments were formalised to most platforms in the country) to June 2018, as well as the proportion of monthly water transactions.
It was evident that as of June 2018 (the month this survey took place), 97.9% paid solely using the traditional payment methods. Few (2.1%) used EWP, and those who did used mobile money as the predominant mode of payment. Additionally, only 2.8% of the surveyed participants (respondents) used EWP, mainly mobile money options to pay their water bills. Though this value did not correspond to GWCL e-payments records, it established a relatively rapid increase in EWP uptake from 0.1% in July 2017 to 2.1% in June 2018.
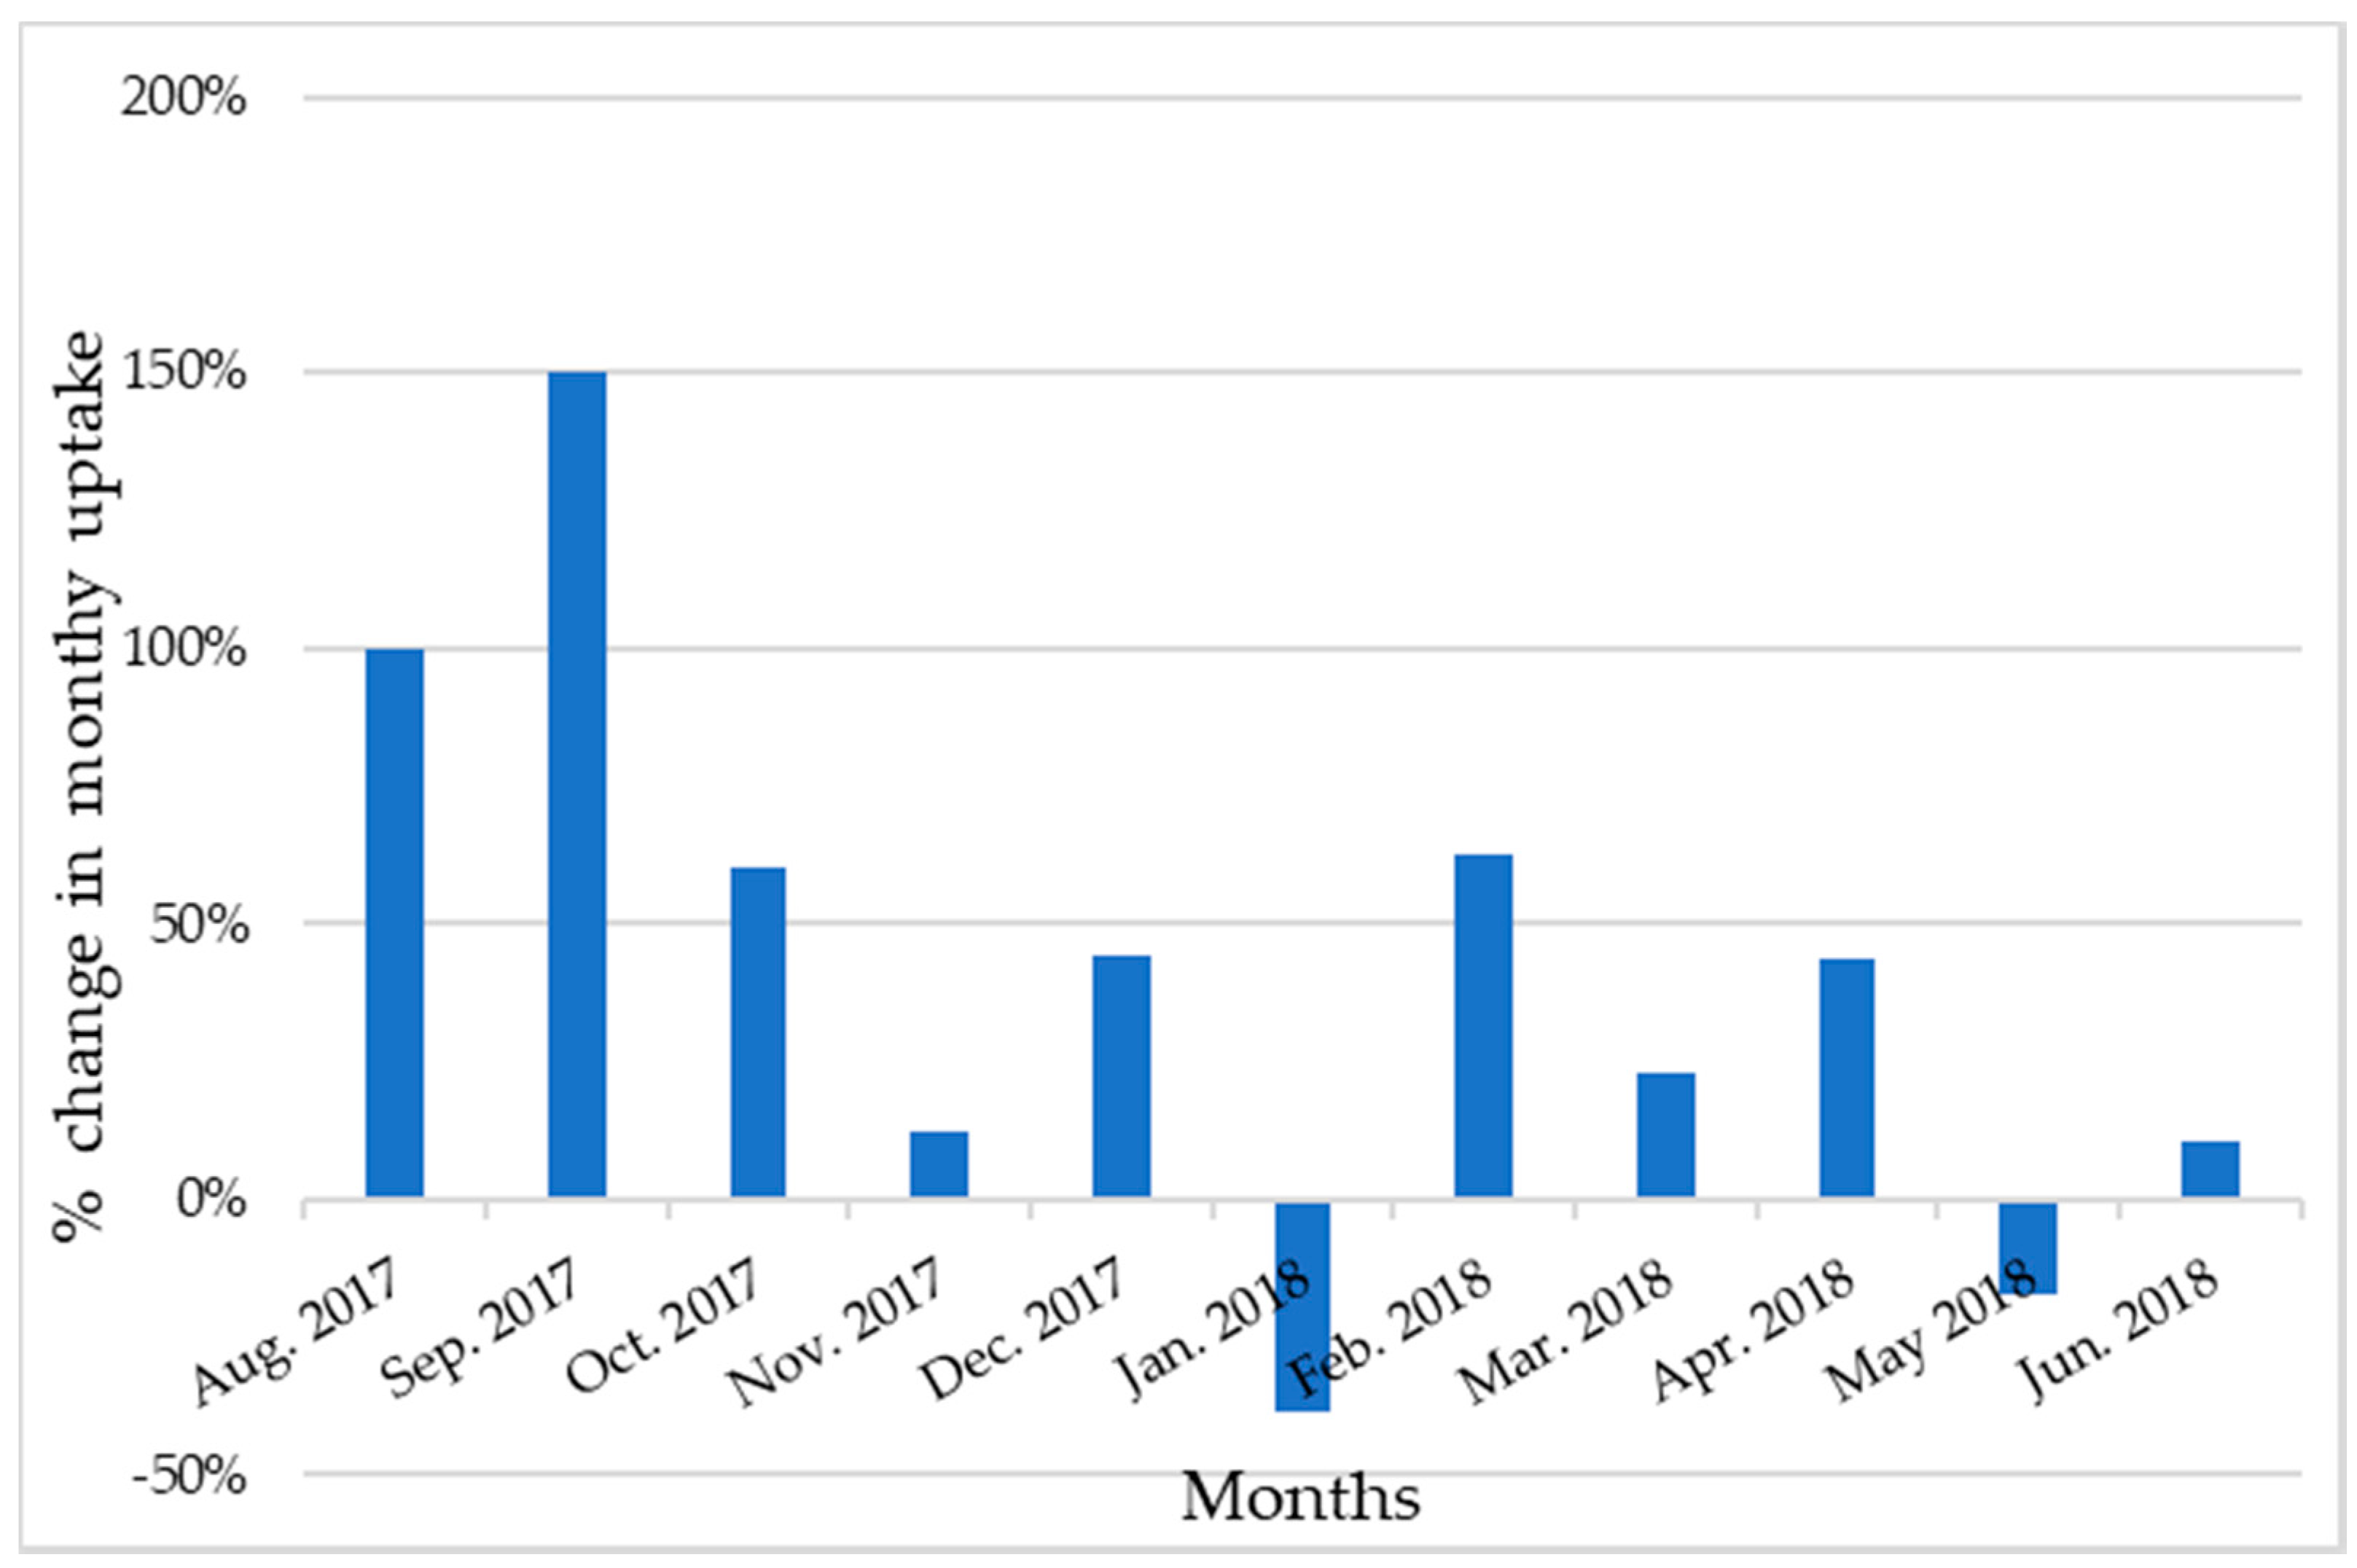
Computation of the month by month percentage change in GWCL records indicated that EWP uptake witnessed an annual growth of 41% in the reporting period but was uneven throughout the year (Figure 2). It must be emphasised that the unevenness in EWP uptake can be attributed to monthly variations in the total number of customers due to new service connections, disconnections or reconnections, and/or the possibility of multiple transactions by single customers. However, both survey data and GWCL records indicated that general EWP uptake in the district is increasing and might improve in the future.
3.3. Water Use Variation by Payment Type
Table 4 shows the variation of water use per payment type. The analysis showed that users of traditional payment methods, on average, used slightly higher (less than 1 m3 a month) volumes of water on a daily/monthly basis than EWP adopters (see Table 4). Additionally, customers paying with traditional methods had a slightly higher per capita water use (112 l/c/d) than those using EWP (110 l/c/d), which could be attributed to the similar household size that characterised the study sample.
4. Discussion
As a timely addition to the water policy and digital water transformation literature, this study provides insights into the diffusion and pattern of EWP adoption in urban environments and its implication for revenue collection and water service provisioning in Ghana and sub-Saharan Africa generally.
Similar to the low mobile water payment adoption among some urban water service providers in East Africa [9], the current study observed a low EWP uptake by customers. Amidst on-going campaigns by the water service provider in Ghana to promote EWP and mobile money usage among customers, the majority of customers reported to not using EWP despite a significant annual increase in uptake. This finding is suggestive of the fact that growth of EWP uptake is rapid but from a low base. The month by month variation in uptake presents an indication that EWP uptake is gradually gaining ground, although general uptake is still very low (based on the actual proportion of monthly water transactions). For instance, reports from GWCL indicated that bill collection through various digital platforms doubled between January and June 2018 [29]. The report further indicated that most electronic payments were through mobile money, with MTN being the most used network (69%). However, the annual growth of 41% is highly suggestive of the possibility of variations in the total monthly number of customers and multiple payment transactions by the same customers. This signals caution to improving avenues, not only to create EWP awareness but also to build institutional trust to facilitate uptake. Perhaps the foregoing findings are indicative of a potential uptick in mobile water payments when barriers are addressed overtime and groups with a lower awareness of EWP are educated about it. A similar gradual transition has been witnessed for mobile money in the Ghanaian banking sector, which experienced a growth rate of 737.4% between 2012 and 2016 [30].
Consistent with findings in Tanzania, Uganda, and Zambia [15,17], the adoption of mobile-enabled water payment options has been low despite an almost universal ownership of mobile phones among utility customers in the study community. Hence, findings in this research indicate that mobile phone ownership and mobile money usage may not be significant predictors or barriers to EWP uptake by customers. This finding is puzzling, given that mobile phones (smart or analogue) are designed and optimised for making electronic payments, and using these systems does not necessarily require sophisticated devices. By implication, people use mobile phones for many purposes but may not be cognizant of the use of mobile phone for making water payments. However, it was observed that customers were more likely to be aware of EWP existence based on the method through which they received their monthly water bills. This might provide avenue for potential EWP uptake in the future. Considering the potential of mobile receipt of bills, customers receiving their bills through digital platforms (SMS and emails) were more likely to adopt EWP. This relationship lends credence to efforts by GWCL to verify and validate all its customers on their new electronic billing system, which allows them to send bills via SMS and emails. Altogether, these findings demonstrate that EWP in Tema is used to complement rather than replace existing traditional payment methods, which is consistent with the authors of [31]’s study in Dar es Salaam, Tanzania. This means the expansion and widening of customer payment choices through EWP are likely to increase GWCL’s revenue and cost recovery due to potential better payment practices.
Additionally, the observation that EWP awareness was higher among elderly customers than younger ones was particularly surprising given that one might have expected younger people to have sufficient knowledge on ongoing technological trends due to their ready access to such information from diverse sources (both print and digital media). This finding is contrary to previous studies, which argued that younger cohorts with a higher income are more likely to be aware of the use of electronic payment instruments than the elderly [32]. This inconsistency hints that the finding must be interpreted with caution. Perhaps, this might be due to prior exposure of older customers to these technologies, since they constitute larger portion of people with GWCL pipeline connections. Indeed, information campaigns should be targeted across all sections of the population. Furthermore, the finding that poorer parts of the population are less aware of EWP systems may be confounded through other variables such as age or employment status, as retired or employment-seeking persons have generally less financial and timely means to engage with such novel technologies. Perhaps, low income populations are likely not to adopt these services due to the transactional costs that are often associated with EWP interventions [15]. Evidence of significant differences between employment status, EWP awareness, and potential uptake may relate to the fact that working on full time job provides greater convenience and time saving of bill payments outside of working hours.
Generally, the analysis showed that water consumption by customers did not vary significantly between the mode of bill payments. It is noteworthy that daily averages (0.56 and 0.55 m3) and per capita water variations (of 112 and 110 l/c/d per payment method) had little relevance in explaining the patterns of EWP adoption. This study deviates from previous studies [9], which have reported more water use among customers making bill payments at the bank than M-PESA users (0.96 and 0.5 m3, respectively) in peri-urban Kenya. This difference may be due to the characteristics of respondents, who were only domestic customers in the current study. However, water use levels in this study are in line with the author of [33]’s investigation of water consumption among GWCL customers in Koforidua, Ghana, wherein he argued that customers in the same category (domestic) consumed significantly similar amounts of water monthly. In addition, it is likely that one reason for the little variation in water use lie in the similar number of household members in the study area. The foregoing results are unsurprising to the extent that customers in the same category often share similar water use and water tariff characteristics as per the urban water tariff structure in the Ghanaian context, which was evident in the approach used in this study. For instance, domestic customers are charged a flat rate for a given volume of water use, as is evident in the Public Utilities Regulatory Commission (PURC) tariff structure. This implies that a flat rate charged on water among customers in that category is unlikely to change the outcome significantly unless there are vast differences in the number of people using that water source/meter in a household.
Our study had some limitations which are worth mentioning. The cross-sectional nature of our data implies that the interpretation of findings was potentially limited by self-reported recall bias. Hence, translating our findings to different localities with varying socioeconomic characteristics and service supply must be done with due caution. Additionally, further and more targeted investigations towards the determinants of actual EWP uptake are required. A larger sample and a more comprehensive econometric analysis that takes various covariates and omitted variables into account could help to unpick the causal mechanisms in future studies.
Notwithstanding these data limitations, our study is the first in Ghana and probably in urban West Africa to examine the prevalence, potential drivers, and patterns of the customer adoption of electronic water payments among utility customers, and it thus offers important insights into the state of digital financial instruments in public service delivery.
5. Conclusions
This study is the first to examine the prevalence and patterns of EWP adoption and its implication for water service delivery in Tema Metropolis, Ghana. The empirical findings indicate that although customers were aware of EWP existence, overall uptake was very low. They also show that EWP awareness and the potential uptake of EWP were significantly associated with customers’ age, employment status, income, and means of receiving monthly bills. Importantly, this paper underscores the need to capture customers’ baseline demographic and socioeconomic conditions in the introduction of water payment innovations as they serve as drivers for potential adoption and utilisation of such services. This finding has far-reaching implications for policy and practice within the water service delivery sector, particularly policy interventions to spur the integration of digitised payment innovations in the public sector in Ghana and other Global South countries towards achieving the Sustainable Development Goal 6 of ensuring the availability of water and sanitation for all. This is because digital payments present a promising tool that may help meet the water and sanitation needs of people in terms of cost and time saving. Going forward, it is important to develop specific guidelines that target unaware sections of the population, particularly poor or low-income customers and unconnected water users. This can be achieved by developing and advertising payment solutions that are well-suited to their individual behavioural patterns and prior needs. While this consumer characteristic may not be influenced by utility, our finding can help utility managers and service providers in the prioritization of potential customers, since a greater uptake of EWP can successfully complement existing payment infrastructure and processes that help utilities run profitably and more efficiently.
Author Contributions
G.A. conceptualised and designed the study, performed data analysis and drafted the initial version of the manuscript. F.A.A., C.F., and P.A. provided insights to the study design. G.A., F.A.A., C.F., and P.A. undertook a critical review of the manuscript. All authors have read and agreed to the published version of the manuscript.
Funding
This work is part of a larger study by the corresponding author who received funding from the Commonwealth Shared Scholarship (GHSS-2017-489) and the School of Geography and the Environment, Oxford University. The funders, however, played no role in designing the study, collecting and analysing data, manuscript preparation and the decision to publish the manuscript.
Acknowledgments
The authors would like to thank Professor Robert Hope for his insights and role towards the design and implementation of this study. Additionally, a big acknowledgment to all field assistants and GWCL customers who participated in this study.
Conflicts of Interest
The authors declare no conflict of interest.
Data Availability
Dataset used for this paper will be made available upon reasonable request, from corresponding author.
Abbreviations
BoG—Bank of Ghana; EWP—electronic water payment; GSMA—Groupe Speciale Mobile Association; GSS—Ghana Statistical Service; GWCL—Ghana Water Company Limited; NCA—National Communication Authority; l/c/d—litres per capita per day; MM—mobile money; MNO—Mobile Network Operator; PURC—Public Utilities Regulation Commission; TMA—Tema Metropolitan Assembly
Appendix A
Questionnaire

Table A1.
Household Characteristics. Please tick (√) the appropriate box.
| S/N | Items and Filters | Response Categories | |
|---|---|---|---|
| 001 | GWCL account Number | ||
| ( ) | |||
| Don’t know | ( ) | ||
| No answer | ( ) | ||
| 002 | Is it a single household? If No, go to 004 | No | ( ) |
| Yes | ( ) | ||
| 003 | If yes, what is the size of your household Actual number in box | 1–3 | ( ) |
| 4–6 | ( ) | ||
| 7–9 | ( ) | ||
| ≥10 | ( ) | ||
| Don’t want to answer | ( ) | ||
| 004 | If no, how many people regularly use the piped water |
Table A2.
Socio-demographic profile. Please tick (√) the appropriate box.
| S/N | Items and Filters | Response Categories | |
|---|---|---|---|
| 101 | Which age group are you? | 18–30 years | ( ) |
| 31–40 years | ( ) | ||
| 41–50 years | ( ) | ||
| 51–60 years | ( ) | ||
| ≥61 years | ( ) | ||
| Don’t want to answer | ( ) | ||
| 102 | Gender? | Male | ( ) |
| Female | ( ) | ||
| Don’t want to answer | ( ) | ||
| 103 | Highest Educational level | Basic | ( ) |
| Secondary | ( ) | ||
| Tertiary | ( ) | ||
| No formal education | ( ) | ||
| Other | ( ) | ||
| Don’t want to answer | ( ) | ||
| 104 | Employment status | Not employed | ( ) |
| Employed (public sector) | ( ) | ||
| Employed (Private sector) | ( ) | ||
| Self employed | ( ) | ||
| Retired | ( ) | ||
| Other | ( ) | ||
| Don’t want to answer | ( ) | ||
| 105 | Estimated average monthly income? | ≤¢300 | ( ) |
| ¢301–700 | ( ) | ||
| ¢701–1000 | ( ) | ||
| ¢1001–1500 | ( ) | ||
| ¢1501–2000 | ( ) | ||
| ≥¢2000 | ( ) | ||
| Don’t want to answer | ( ) |
Table A3.
EWP and GWCL services.
| S/N | Do You Have/Own Any of the Following | No | Yes | |
|---|---|---|---|---|
| 201 | Mobile phone | ( ) | ( ) | |
| 204 | Mobile money account | ( ) | ( ) | |
| 205 | Bank account | ( ) | ( ) | |
| S/N | In the Last Three Months Have You (Tick √ All That Apply): | No | Yes | |
| 206 | Used mobile device | ( ) | ( ) | |
| 207 | Phoned/ messaged a helpline (e.g., GWCL info Centre, etc) for water services | ( ) | ( ) | |
| 208 | Made any electronic transaction (utility) | ( ) | ( ) | |
| 209 | Do you use any mobile service | ( ) | ( ) | |
| 210 | If yes which services (network) do you use | Vodafone | ( ) | |
| MTN | ( ) | |||
| Airtel-Tigo | ( ) | |||
| Glo | ( ) | |||
| Others(Specify) | ( ) | |||
| 211 | How do you receive/ get your water bills? | SMS | ( ) | |
| ( ) | ||||
| Customer Portal (GWCL) | ( ) | |||
| Paper bills | ( ) | |||
| Other (Specify) | ( ) | |||
| S/N | Tick for All That Apply and Explain Where Appropriate | No | Yes | |
| 212 | Are you aware of Electronic Water Payment Systems (EWPs) If No, go to 301 | ( ) | ( ) | |
| 212a | If yes, what is it about (Explain) | |||
| 213 | Has GWCL ever given you information (e.g., a web address) on how to use EWPs? | ( ) | ( ) | |
| 214 | Do you use EWPs? | ( ) | ( ) | |
| 215 | Have you used GWCL EWPs for any water related transaction in the last three months? | ( ) | ( ) | |
References
- WWAP (UNESCO World Water Assessment Programme). The United Nations World Water Development Report 2019: Leaving No One Behind; UNESCO: Paris, France, 2019. [Google Scholar]
- Dos Santos, S.; Adams, E.A.; Neville, G.; Wada, Y.; de Sherbinin, A.; Bernhardt, E.M.; Adamo, S.B. Urban growth and water access in sub-Saharan Africa: Progress, challenges, and emerging research directions. Sci. Total Environ. 2017, 607, 497–508. [Google Scholar] [CrossRef] [PubMed]
- Adams, E.A.; Sambu, D.; Smiley, S.L. Urban water supply in Sub-Saharan Africa: Historical and emerging policies and institutional arrangements. Int. J. Water Resour. Dev. 2019, 35, 240–263. [Google Scholar] [CrossRef]
- World Health Organization; UNICEF. Progress on Drinking Water, Sanitation and Hygiene: 2017 Update and SDG Baselines; Licence: CC BY-NC-SA 3.0 IGO; World Health Organization (WHO) and the United Nations Children’s Fund (UNICEF): Geneva, Switzerland, 2017. [Google Scholar]
- Bakker, K. Privatizing Water: Governance Failure and the World’s Urban Water Crisis; Cornell University Press: London, UK, 2010. [Google Scholar]
- Gonzalez-Gomez, F.; Garcia-Rubio, M.; Guardiola, J. Why Is Non-Revenue Water So High in So Many Cities? Int. J. Water Resour. Dev. 2011, 27, 345–360. [Google Scholar] [CrossRef]
- Banerjee, S.G.; Morella, E. Africa’s Water and Sanitation Infrastructure: Access, Affordability, and Alternatives; The World Bank: Washington, DC, USA, 2011. [Google Scholar]
- Rouse, M. Institutional Governance and Regulation of Water Services: The Essential Elements, 2nd ed.; IWA Publishing: London, UK, 2013. [Google Scholar]
- Hope, R.; Foster, T.; Krolikowski, A.; Cohen, I. Mobile Water Payment Innovations in Urban Africa; School of Geography and the Environment and Skoll Centre for Social Entrepreneurship at Saïd Business School: Oxford, UK, December 2011; Available online: https://www.smithschool.ox.ac.uk/research/water/publications/Mobile-Water-Payment-Innovations.pdf (accessed on 5 January 2018).
- Hope, R.; Rouse, M. Risks and responses to universal drinking water security. Phil. Trans. R. Soc. A 2013, 371, 20120417. [Google Scholar] [CrossRef] [PubMed]
- Davis, J. Corruption in public service delivery: Experience from South Asia’s water and sanitation sector. World Dev. 2004, 32, 53–71. [Google Scholar] [CrossRef]
- Kayaga, S.; Franceys, R.; Sansom, K. Bill payment behaviour in urban water services: Empirical data from Uganda. J. Water Supply Res. Technol. Aqua 2004, 53, 339–349. [Google Scholar] [CrossRef] [Green Version]
- Owen, D.A.L. Smart Water Technologies and Techniques: Data Capture and Analysis for Sustainable Water Management; John Wiley & Sons: Oxford, UK, 2018. [Google Scholar]
- GSMA. Key Trends in Mobile-Enabled Water Services: What’s Working and What’s Next. 2018. Available online: https://www.gsma.com/mobilefordevelopment/wp-content/uploads/2018/08/Key-trends-in-mobile-enabled-water-services-What%E2%80%99s-working-and-what%E2%80%99s-next.pdf (accessed on 25 August 2018).
- Foster, T.; Hope, R.; Thomas, M.; Cohen, I.; Krolikowski, A.; Nyaga, C. Impacts and implications of mobile water payments in East Africa. Water Int. 2012, 37, 788–804. [Google Scholar] [CrossRef]
- Hope, R.; Foster, T.; Money, A.; Rouse, M.; Money, N.; Thomas, M. Smart Water Systems; Project Report to UK DFID; Oxford University: Oxford, UK, April 2011. [Google Scholar]
- Hope, R.; Foster, T.; Money, A.; Rouse, M. Harnessing mobile communications innovations for water security. Glob. Policy 2012, 3, 433–442. [Google Scholar] [CrossRef]
- Krolikowski, A. Can mobile-enabled payment methods reduce petty corruption in urban water provision? Water Altern. 2014, 7, 235–255. [Google Scholar]
- Sualihu, M.A.; Rahman, M.A.; Tofik-Abu, Z. The Payment Behaviour of Water Utility Customers in the Greater Accra Region of Ghana: An Empirical Analysis. SAGE Open 2017, 7, 2158244017731494. [Google Scholar] [CrossRef]
- Boakye, E.; Nyieku, I.E. Cost Recovery Analysis of Ghana Water Company Limited (Gwcl): A Case Study of Sekondi-Takoradi Metropolis. Eur. J. Sci. Res. 2010, 46, 119–125. [Google Scholar]
- Joyfm. Ghana Water Company Rolls Out New Technology to Check Billing Challenges. 2017. Available online: https://www.myjoyonline.com/news/2017/october-24th/ghana-water-company-rolls-out-new-technology-to-check-billing-challenges.php (accessed on 12 January 2018).
- Sualihu, M.A.; Rahman, M.A. Defaulting on water utility bills: Evidence from the Greater Accra Region of Ghana. Indian J. Financ. 2014, 8, 22–34. [Google Scholar] [CrossRef]
- GWCL. Ghana Water Company Limited Portal. 2017. Available online: www.gwcl.com.gh/e-billing_press_release (accessed on 27 November 2017).
- NCA. Quarterly Statistical Bulletin on Communications in Ghana. July–September 2017. Available online: https://nca.org.gh/assets/Uploads/stats-bulletin-Q3-2018.pdf (accessed on 28 January 2018).
- GSMA. Country Overview, Ghana: Driving Mobile-Enabled Digital Transformation; GSMA: London, UK, 2017; Available online: https://www.gsmaintelligence.com/research/?file=986feba592e4e9c07ff793916212eb66&download (accessed on 12 January 2018).
- Boyle, T.; Giurco, D.; Mukheibir, P.; Liu, A.; Moy, C.; White, S.; Stewart, R. Intelligent metering for urban water: A review. Water 2013, 5, 1052–1081. [Google Scholar] [CrossRef] [Green Version]
- Amankwaa, G. Moving paperless? The Adoption of Electronic Water Payment Systems in Metropolitan Tema, Ghana. Master’s Thesis, University of Oxford, Oxford, UK, 2018. [Google Scholar]
- Ghana Statistical Service (GSS). 2010 Population and Housing Census; District Analytical Report, Tema Metropolitan, TMA; GSS: Accra, Ghana, 2014. [Google Scholar]
- GWCL. GWCL e-Billing Project: Progress Report; Number 21.12.07.18; Ghana Water Company Limited: Accra, Ghana, 2018. [Google Scholar]
- Bank of Ghana. Payment System Oversight: Annual Report. 2017. Available online: https://www.bog.gov.gh/privatecontent/Payment%20Systems/Payment%20Systems%20Annual%20Report%202017.pdf (accessed on 6 June 2018).
- Krolikowski, A.; Hope, R. Determinants of Customer Payment Behaviours in the Urban Water Sector; Evidence from Dar es Salaam, Tanzania; Smith School of Enterprise and the Environment; Water Programme, Working Paper 4; Oxford University: Oxford, UK, 2016; Available online: http://www.smithschool.ox.ac.uk/research/water/WaterProgramme_Working%20Paper04_20Mar16.pdf (accessed on 10 February 2018).
- Polasik, M.; Gorka, J.; Wilczewski, G.; Kunkowski, J.; Przenajkowska, K.; Tetkowska, N. Time Efficiency of Point-of-Sale Payment Methods: Empirical Results for Cash, Cards and Mobile Payments; Cordeiro, J., Maciaszek, L.A., Filipe, J., Eds.; Enterprise I: Wroclaw, Poland, 2013. [Google Scholar]
- Banafo, K.S. Water Consumption and Its Variations in Koforidua. Master’s Thesis, Unpublished. 2013. [Google Scholar]
Figure 1.
GWCL operational boundaries in Tema showing study communities.

Figure 2.
Percentage change in month by month variation in EWP uptake from the GWCL database.

Table 1.
Traditional and new electronic water payment methods in Ghana.
| Traditional Cash Pay Methods | New Electronic Payment Methods | |
|---|---|---|
| Type | 1 Options/Provider | |
| GWCL collection and pay points | Mobile money | MTN, Vodafone, Airtel-Tigo |
| Cash/cheque at Accredited banks | E-services | Mobile banking, Slydpay, ExpressPay, eTransact |
| Third party cash collectors and vendors | GWCL Customer Portal and App | |
1 These are telecommunications companies (MTN (the Mobile Telephone Network), Airtel-Tigo and Vodafone) and other payment service providers who have partnered with GWCL to offer new electronic payment options.
Table 2.
Percentage/count distribution for selected dependent and independent variables by electronic water payment (EWP) awareness.
Table 2.
Percentage/count distribution for selected dependent and independent variables by electronic water payment (EWP) awareness.
| Variable | Category | Aware n = 152 | Unaware n = 98 | Total N (%) 250(/100%/) | p-Value |
|---|---|---|---|---|---|
| Age | 18–30yrs | 45.2 | 54.8 | 31 (12.4%) | 0.000 * |
| 31–40yrs | 63 | 37 | 46 (18.4%) | ||
| 41–50yrs | 74 | 26 | 73 (29.2%) | ||
| 51–60yrs | 72.3 | 27.7 | 47 (18.8%) | ||
| above 60yrs | 41.2 | 58.8 | 51 (20.4%) | ||
| No answer | 0 | 100 | 2 (0.8%) | ||
| Gender | Male | 61.5 | 38.5 | 122 (48.8%) | 0.831 |
| Female | 60.2 | 39.8 | 128 (51.2%) | ||
| Highest educational level | Basic | 50 | 50 | 22 (8.8%) | 0.527 |
| Secondary | 58.5 | 41.5 | 118 (47.2%) | ||
| Tertiary | 66 | 34 | 103 (41.2%) | ||
| No formal education | 66.7 | 33.3 | 3 (1.2%) | ||
| Other | 50 | 50 | 4 (1.6%) | ||
| Employment status | Not yet employed | 50 | 50 | 18 (7.2%) | 0.003 * |
| Employed (Public sector) | 62.5 | 37.5 | 48 (19.2%) | ||
| Employed (private sector) | 60 | 40 | 5 (2%) | ||
| Self employed | 69.2 | 30.8 | 130 (52%) | ||
| Retired | 35.6 | 64.4 | 45 (18%) | ||
| Other | 100 | 0 | 2 (1.6%) | ||
| Income level | <300 | 28.6 | 71.4 | 14 (5.6%) | 0.001 * |
| 300–700 | 53.8 | 46.2 | 26 (10.4%) | ||
| 701–1000 | 42.9 | 57.1 | 42 (16.8%) | ||
| 1001–1500 | 76.2 | 23.8 | 21 (8.4%) | ||
| 1501–2000 | 60.9 | 39.1 | 23 (9.2%) | ||
| Above 2000 | 83.7 | 16.3 | 43 (17.2%) | ||
| No answer | 61.7 | 39.2 | 81 (32.4%) | ||
| MM account | No | 52.1 | 47.9 | 48 (19.3%) | 0.177 |
| Yes | 62.9 | 37.2 | 201 (80.7%) | ||
| How do you receive your water bill | SMS | 50 | 50 | 4 (1.6%) | 0.000 * |
| Both Email and Paper bills | 50 | 50 | 4 (1.6%) | ||
| Paper bills | 37.3 | 62.7 | 59 (23.6%) | ||
| Both SMS and Paper bills | 68.9 | 31.1 | 183 (73.2%) | ||
| Average household size | 4.98 | ||||
| Sub-total level of awareness | 60.8 | 39.2 | 100 | ||
* Test were based on the chi-squared test; chi statistic is significant at 0.05. MM, mobile money; SMS, Short Message Service; n = total number of responses.
Table 3.
Proportion of customer payment preferences from July 2017 to June 2018 in Tema Central District from GWCL payment database.
Table 3.
Proportion of customer payment preferences from July 2017 to June 2018 in Tema Central District from GWCL payment database.
| Months 1 n = 10826 | Percent of Payments with Traditional Cash Methods (Collection/Pay Points and Banks/Vendors) | Percent of Total Payments with EWP |
|---|---|---|
| July 17 | 99.9 | 0.1 |
| August 17 | 99.8 | 0.2 |
| September 17 | 99.5 | 0.5 |
| October 17 | 99.2 | 0.8 |
| November 17 | 99.1 | 0.9 |
| December 17 | 98.7 | 1.3 |
| January 18 | 99.2 | 0.8 |
| February 18 | 98.7 | 1.3 |
| March18 | 98.4 | 1.6 |
| April 18 | 97.7 | 2.3 |
| May 18 | 98.1 | 1.9 |
| June 18 | 97.9 | 2.1 |
| Other indicators | ||
| Collection efficiency ratio | 99.1% | |
| Domestic Water tariff | USD 1.06 | |
| EWP uptake from 250 survey sample ** | 2.8% | |
| Phone ownership ** | 100% |
** From surveyed analysis of 250 respondents. 1 Figures were based on total monthly transactions in GWCL customer database.
Table 4.
Average monthly and daily water use per payment method of sampled households in m3.
| n = 181 | Payment Method | |||
|---|---|---|---|---|
| Traditional | EWP | |||
| Monthly Average | Daily Average | Monthly Average | Daily Average | |
| Sep-17 | 18.69 | 0.62 | 18.86 | 0.63 |
| Oct-17 | 17.4 | 0.56 | 17.88 | 0.58 |
| Nov-17 | 18.22 | 0.61 | 20.65 | 0.69 |
| Dec-17 | 14.56 | 0.45 | 14.92 | 0.48 |
| Jan-18 | 18.01 | 0.58 | 16.57 | 0.53 |
| Feb-18 | 16.82 | 0.6 | 16.14 | 0.58 |
| Mar-18 | 15.81 | 0.51 | 14.6 | 0.47 |
| Apr-18 | 16.38 | 0.55 | 15.25 | 0.51 |
| May-18 | 18.18 | 0.59 | 18.43 | 0.6 |
| Jun-18 | 15.11 | 0.5 | 14.18 | 0.47 |
| Average | 16.92 | 0.56 | 16.75 | 0.55 |
| Per capita water use (l/c/d) | 112 | 110 | ||
© 2020 by the authors. Licensee MDPI, Basel, Switzerland. This article is an open access article distributed under the terms and conditions of the Creative Commons Attribution (CC BY) license (http://creativecommons.org/licenses/by/4.0/).
Share and Cite
MDPI and ACS Style
Amankwaa, G.; Asaaga, F.A.; Fischer, C.; Awotwe, P. Diffusion of Electronic Water Payment Innovations in Urban Ghana. Evidence from Tema Metropolis. Water 2020, 12, 1011. https://doi.org/10.3390/w12041011
AMA Style
Amankwaa G, Asaaga FA, Fischer C, Awotwe P. Diffusion of Electronic Water Payment Innovations in Urban Ghana. Evidence from Tema Metropolis. Water. 2020; 12(4):1011. https://doi.org/10.3390/w12041011
Chicago/Turabian StyleAmankwaa, Godfred, Festus A. Asaaga, Christian Fischer, and Patrick Awotwe. 2020. "Diffusion of Electronic Water Payment Innovations in Urban Ghana. Evidence from Tema Metropolis" Water 12, no. 4: 1011. https://doi.org/10.3390/w12041011
Note that from the first issue of 2016, this journal uses article numbers instead of page numbers. See further details here.