Temporal Variations of Spring Water in Karst Areas: A Case Study of Jinan Spring Area, Northern China
by
Zongjun Gao
1, 
Jiutan Liu
1,
Xingyong Xu
2,3,
Qingbing Wang
4,
Min Wang
1,*,
Jianguo Feng
1 and
Tengfei Fu
2,3 1
College of Earth Science and Engineering, Shandong University of Science and Technology, Qingdao 266590, China
2
Key Laboratory of Marine Sedimentology and Environmental Geology, First Institute of Oceanography, Ministry of Natural Resources, Qingdao, Shandong 266061, China
3
Laboratory for Marine Geology, Qingdao National Laboratory for Marine Science and Technology, Qingdao, Shandong 266061, China
4
Shandong Geological Environmental Monitoring Station, Jinan 250014, China
*
Author to whom correspondence should be addressed.
Water 2020, 12(4), 1009; https://doi.org/10.3390/w12041009
Submission received: 3 March 2020
/
Revised: 24 March 2020
/
Accepted: 30 March 2020
/
Published: 1 April 2020
(This article belongs to the Section Hydrology)
Abstract
:Jinan is known as “Spring City,” because of its famous 72 artesian springs. Spring water plays an important role in the social and economic development of Jinan. However, the accelerating process of urbanization and more intensive human activities have significantly affected the Jinan springs. Based on the data from four spring groups (2015–2018), the hydrochemical characteristics of spring water were analyzed and 14 parameters were selected to evaluate the quality of spring water. In addition, the main ions variation characteristics of spring water in Jinan from 1958 to 2018 were analyzed, based on the previous studies. Subsequently, the spring flow dynamics of the Jinan spring area from 1958 to 2012 were also discussed. Overall, the water quality of the four spring groups is good. The chemical composition of the spring water is mainly controlled by the dissolution of calcite, followed by dolomite, and de-dolomitization. However, spring water is affected by human activities, and the hydrochemical type tends to evolve from HCO3-Ca to HCO3·SO4-Ca or HCO3-Ca·Mg. From 1958 to 2013, the main ions in spring water increased, while a relatively steady and certain fluctuation trend was observed from 2015 to 2018. Since 1958, the spring water flow in Jinan has experienced four stages, from decline to recovery. The exploitation of karst groundwater, change of land use type, and decrease of atmospheric precipitation are the three most important factors, affecting spring discharge dynamics. The slowdown of the increase of the main ion concentration in Jinan spring water and the resumption of spring water flowing indicate that remarkable achievements have been made to protect spring water, but there is still a long way to go to fully protect Jinan spring water.
1. Introduction
Hosting large reservoirs of groundwater, karst aquifers are of great significance in coordinating the balance of water environment and human needs [1,2]. Jinan is famous for numerous karst springs. Spring water is a good “city card” for the city and served as a history and culture carrier [3,4]. The four most famous spring groups are including Five Dragon Pool (FDP), Pearl Spring (PS), Spouting Spring (SS), and Black Tiger Spring (BTS). The development of karst in the Jinan spring area is a typical representative of the karst spring system in northern China. Karst groundwater resources are abundant, due to their unique geological-hydrogeological conditions and monoclinic geological structure characteristics [5] and have always been the main source of water supply for industry, agriculture, and domestic use in Jinan area. Therefore, these groundwater resources are considered as an important resource for social and economic development. However, with the construction of urban modernization, spring water resources have been seriously damaged and polluted [6,7,8,9,10,11]. With the acceleration of industrialization and urbanization, the exploitation of karst water has been increasing, since the 1980s. Furthermore, human activities have polluted groundwater to a certain extent, resulting in the detection of industrial and living pollutants in groundwater, with a gradual increase in the degree of pollution. Current literature research suggests the chemical composition of spring water has a continuous upward trend and the quality of spring water becomes worse year by year [6,10,11,12]. During recent years, extensive work has been done to protect Jinan spring water, including studies on hydrochemistry, water quality, and dynamics of spring water, which shows the importance of Jinan spring water as well as the attention required for its protection [13]. However, relatively few comprehensive studies exist on the hydrochemistry and flow dynamics of Jinan spring water. Lu et al. [10] determined the evolution of karst water quality in the Jinan spring area and its response to human activities. Yang et al. [8] discussed the impact of major engineering constructions on Jinan spring water and surrounded areas. Based on the groundwater table dynamics and precipitation data of the Jinan spring area, Qi et al. [14] analyzed the multi-time scale characteristics, correlation, and response of groundwater table dynamics of Jinan spring area to precipitation, using wavelet transform method. Zhou et al. [15] analyzed the chemical characteristics of karst water in the Jinan area and evaluated the water quality. Yin et al. [5] investigated the hydrochemistry and environmental isotopes of spring water in the Jinan spring area, through combining the actual hydrogeological conditions of the karst spring area. Xing et al. [3] studied the mixing ratios of spring water recharge sources in the Jinan, through the analysis of spring water level, tracer test, hydrochemical data, and karst development degree and suggested the presence of seasonal differences in spring water recharge sources.
Spring water is the soul of Jinan and its protection has attracted great attention from all walks of life [3]. To protect springs, a lot of work and efforts have been done in the city, which included putting forward the spring protection plans and promulgating the spring protection regulations [16,17]. Despite achieving remarkable results in the regard, due to the expansion of the city and the rapid increase of the urban population, more concerns have been raised, hence the protection of spring water in Jinan has a long way to go. Compared to the 1950s, the urban area has increased from dozens of square kilometers to more than 500 square kilometers. At present, reasonable exploitation of groundwater is required to reduce the impact of spring water on spring flow and control the pollution sources, to protect Jinan spring water. Therefore, based on the previous studies, this study comprehensively analyzed the temporal variation characteristics of spring water, using the long-term data of water quality (four spring groups), spring discharge, precipitation, groundwater exploitation, and urban land area in Jinan spring area. This study aims to (1) determine the temporal variations of spring water quality in the Jinan spring area; (2) characterize the temporal variations of spring water flow; (3) identify the major influence factors, causing spring water changes. This study contributes to further understanding of the temporal variation characteristics of Jinan spring water and can provide useful information for policymakers to protect the Jinan spring water.
2. Study Area
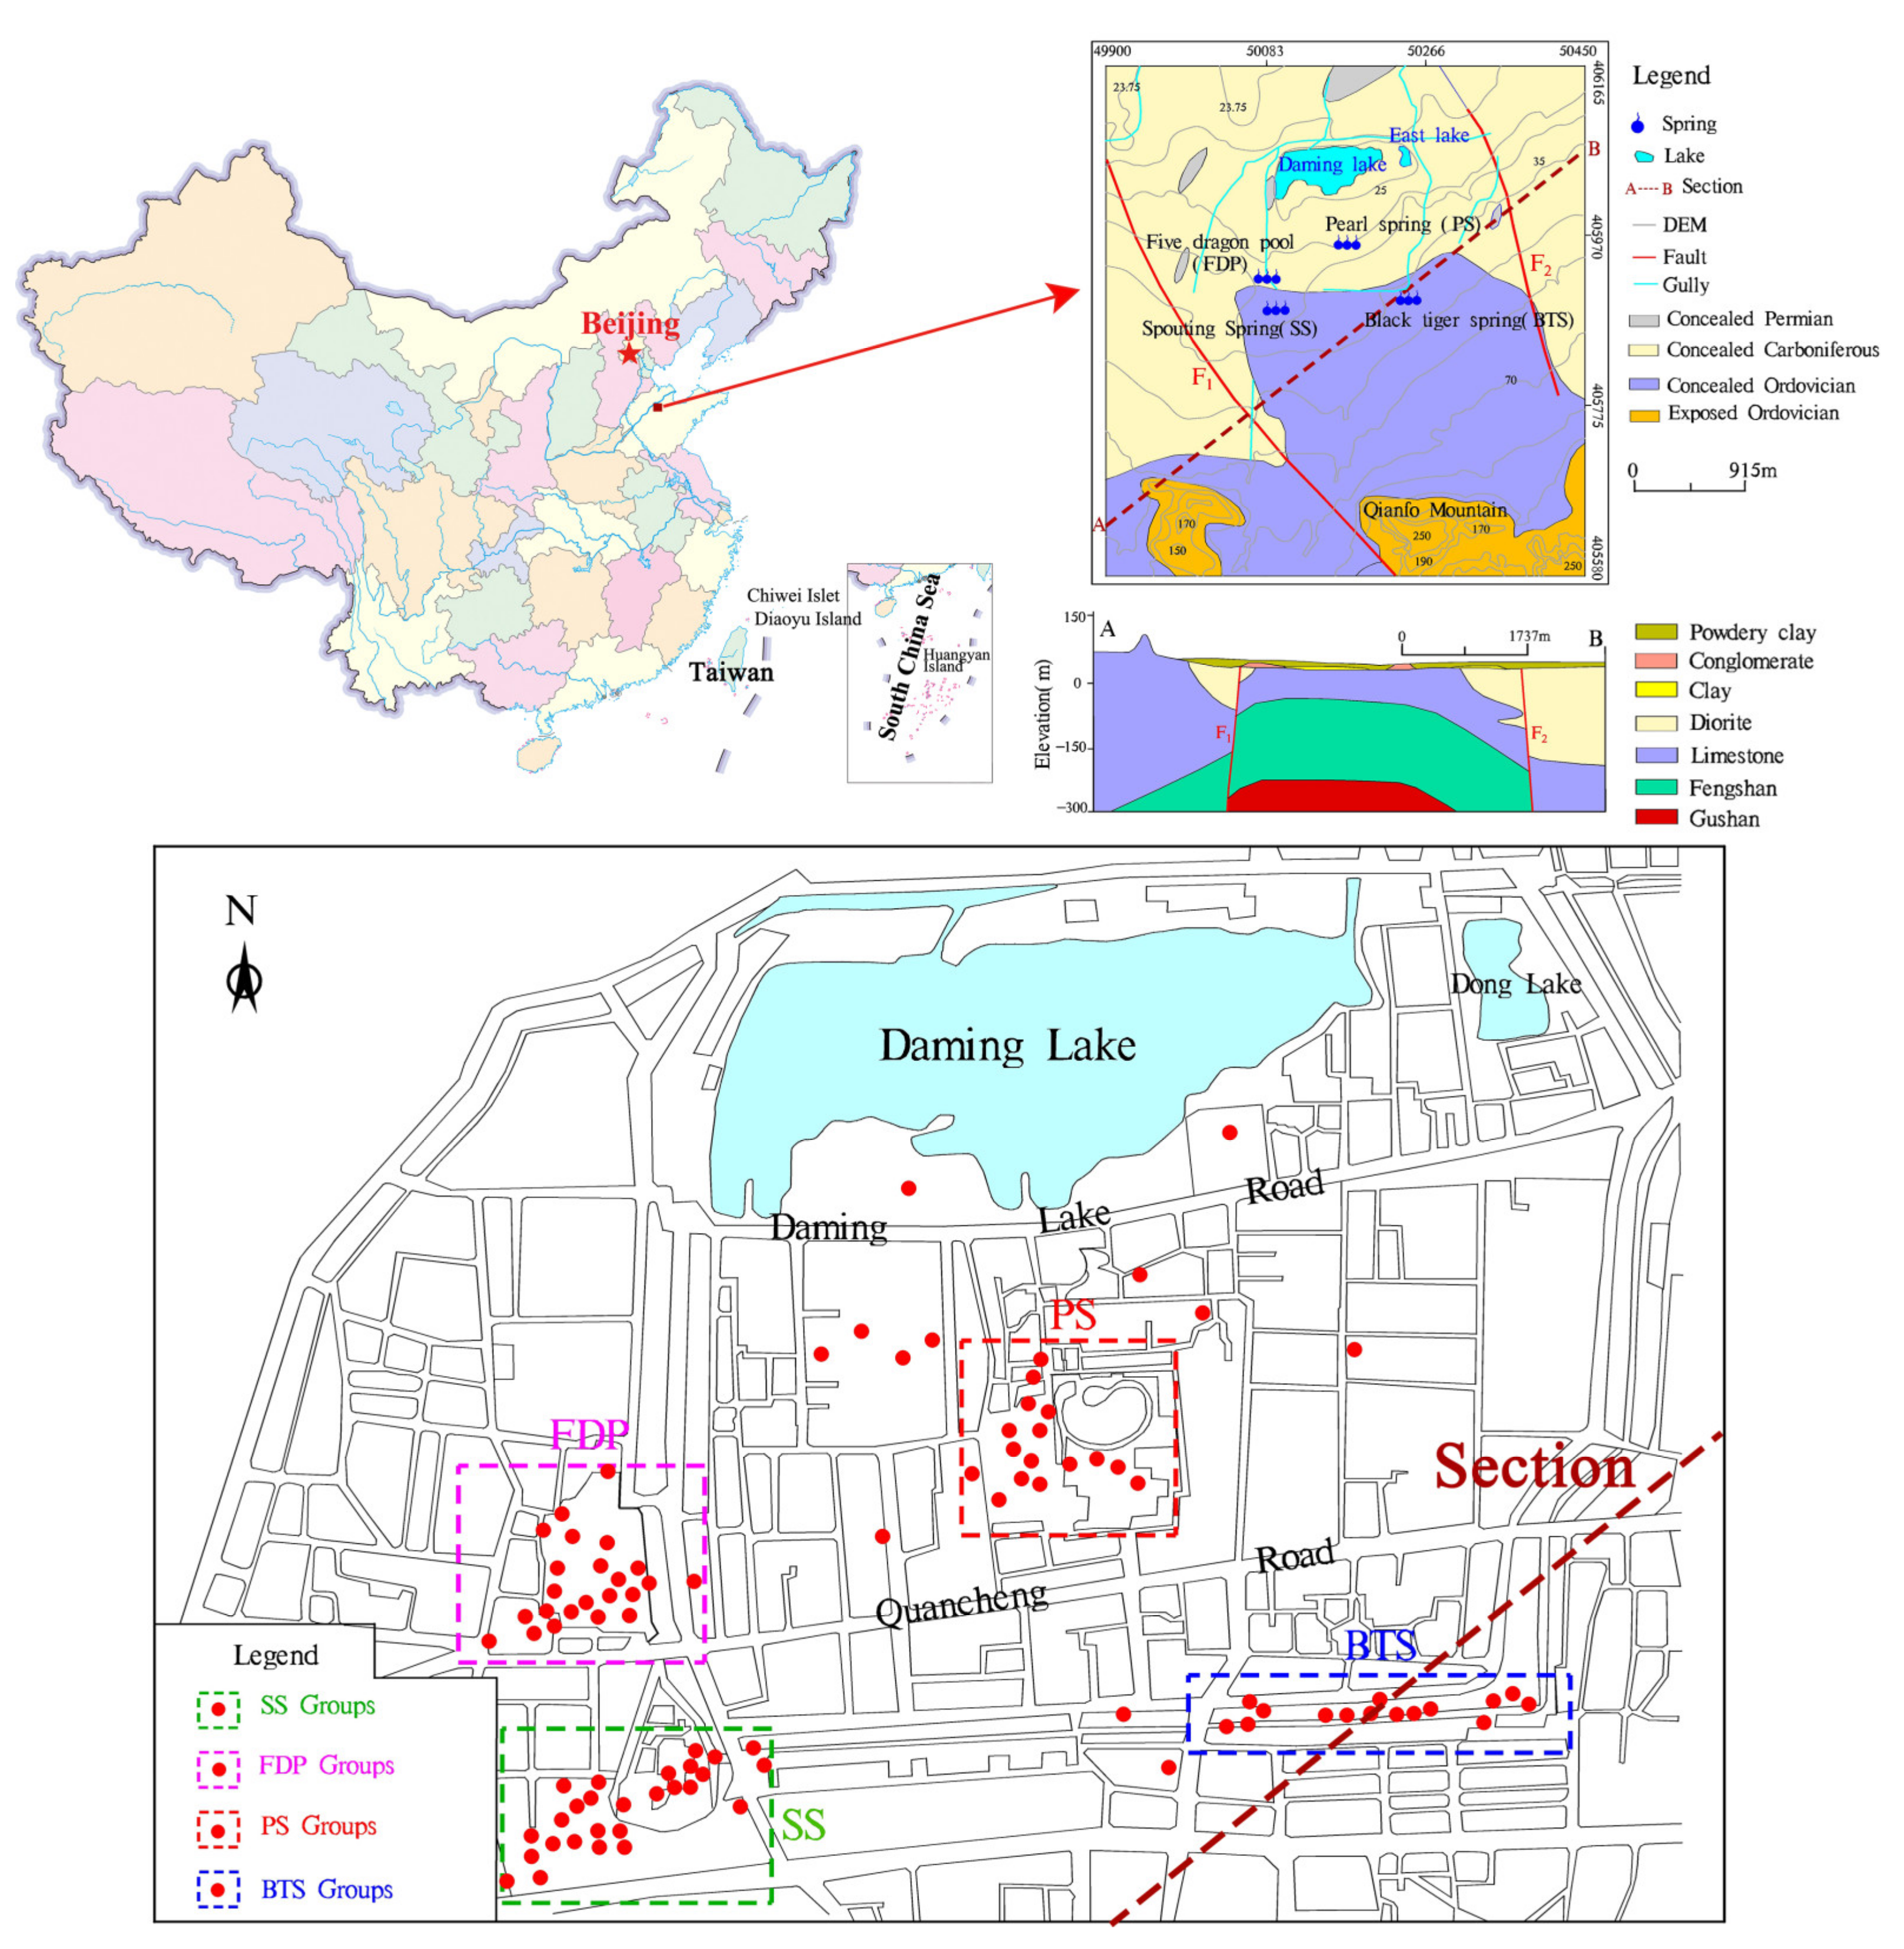
The Jinan spring area is located at the junction of the northern margin of the mountain area of Shandong province and the piedmont inclined plain, with the south high and the low north and the east high and the low west (Figure 1). The area is surrounded by the Taishan Mountains from the south and the Piedmont inclined plain and the Yellow River alluvial plain from the north. The central part of the area is dominated by low hills. Jinan is located in the mid-latitude inland zone, with a warm temperate continental climate. The annual average temperature is 14.30 °C, precipitation is 641.68 mm, evaporation (measured on the free water surface) is 1500–1900 mm (1956–2012), with uneven distribution of precipitation during the year. June–September is the flood season, accounting for about 73% of the annual precipitation. The great disparity in annual precipitation and periodic changes are the main characteristics of the weather in the area, which keeps the dry and wet change every 10 years.
From the oldest to the newest in Jinan, the exposed sediments in the area are including the Archean Taishan rock group, the Paleozoic Cambrian, Ordovician, Carboniferous, and Permian, and Cenozoic Tertiary and Quaternary. Jinan spring water mainly occurs in the limestone aquifer of Cambrian Zhangxia Formation and Jiulong Group Jiaomidian Formation, Jiulong Group Sanshanzi Formation, and Ordovician Majiagou Group. The former is mainly distributed in the southern mountainous areas, mostly depression springs, while the latter is mostly distributed in the urban area of Jinan City, which is an ascending spring. Among them, the most famous are the four spring groups, whose spring waters flow into the Daming Lake along the moat and then into the Xiaoqing River.
Jinan spring area is located in the Jinan monoclinic tectonic area, on the north wing of Taishan anticline and the strata incline northward as a whole. The north-inclined monoclinic structure is consistent with the south-high-north-low terrain, providing a geological and geomorphological foundation for the formation of spring water. The huge limestone layer with karst fissures provides a good place and channel for the recharge, storage, and migration of karst groundwater, as the source of spring water in Jinan. Jinan magmatic rock mass extends in the East-West direction, constituting a natural barrier for karst groundwater of monoclinic structure in Jinan. Indeed, the barrier of the magmatic rock mass is the key to the formation of spring water in the area. The aquifers of the four spring groups in Jinan mainly consist of dolomite and dolomitic limestone of Ordovician Cambrian Sanshanzi formation, which are cut by Qianfoshan fault and Wenhuaqiao fault, and the karst fissures are relatively developed. The shallow karst development form is mainly honeycomb-shaped, and a few large karst caves are developed, with a diameter of less than 2.0 m for a single karst cave. Karsts are very well developed in the area of BTS-SS-FDP. From 2010 to 2016, the SS group (37.9%) and BTS group (32.5%) accounted for 70.4% of the four spring groups, accounting for a large proportion, while, FDP group and PS group accounted for 20.4% and 9.2%, respectively.
According to the characteristics of aquifer medium and the movement and storage of groundwater in the aquifer, Jinan area can be divided into four major water-bearing formations, including loose rock pore water-bearing formation, carbonate rock fissure karst water-bearing formation, clastic rock with carbonate rock-fissure karst water-bearing formation, and massive rock fracture water-bearing formation. Meanwhile, the infiltration of atmospheric precipitation surface water and leakage of irrigation water are identified as sources of karst groundwater recharge in the study area. Among them, atmospheric precipitation infiltration recharge is the main source of karst groundwater in the Jinan spring area, with a recharge area in the southern mountainous area (Figure 1). The runoff direction and runoff path of karst groundwater are controlled by topography, landform, lithology, and structure [18]. The movement direction of karst groundwater is consistent with the inclination direction of topography and rock strata. The runoff is generally from the south to the north, with a larger hydraulic gradient in the southern mountainous area. Groundwater drainage in the spring area mainly includes spring water drainage, artificial mining drainage, subsurface drainage, surface drainage, and evaporation drainage. Groundwater exploitation and spring drainage are the main ways of groundwater drainage in the Jinan spring area [3].
3. Materials and Methods
3.1. Sampling and Analyses
A total of 80 groundwater samples were collected from the four spring groups from March 2015 to July 2018. The sampling was performed every two months. A dry and clean polyethylene plastic bottle was used to hold spring water. Before sampling, the sampling bottle was cleaned and rinsed 2–3 times with the spring water to be taken. All spring water samples were refrigerated and sent to the laboratory of Shandong Geological Environmental Monitoring Station, as soon as possible for water quality analysis. The pH value of spring water was determined in the laboratory, using pH acidity meter (PHS-3C, Lei magnetic, Shanghai, China). Total dissolved solids (TDS), K+, Na+, Ca2+, Mg2+, H2SiO3, and total hardness (TH) were analyzed, using inductively coupled plasma-optical emission spectrometer (optima7000DV, Perkinelmer, Waltham, MA, U.S.). SO42−, Cl−, NO3−, and F− were measured using ion chromatography (ICS-600 model, Thermo, Waltham, MA, U.S.). HCO3− and chemical oxygen demand (COD) were determined by titration, while, NO2− was measured by colorimetry. In addition, the normalized inorganic charge balance (NICB) was calculated, as follows:
where, TZ+ is the cationic charge (TZ+ = [Na+] + [K+] + [Ca2+] + [Mg2+], meq/L) and TZ− is theanionic charge (TZ− = [Cl−] + [HCO3−] + [SO42−] + [NO3−] + [F−], meq/L). In this study, the absolute values of the NICB ranged from 0.001 to 8.64, with an average of 2.22, suggesting the accuracy of the hydrochemical data.
In addition, some hydrochemical data were collected from previous studies [3,4,5,10]. Furthermore, information about spring flow (1958–2012), urban area (2000–2015), precipitation (1958–2012), groundwater exploitation (1958–2012), and maximum flood peak discharge (1956–2006) were provided by Shandong Geological Environmental Monitoring Station and Shandong Institute of Geological Survey.
3.2. Methods
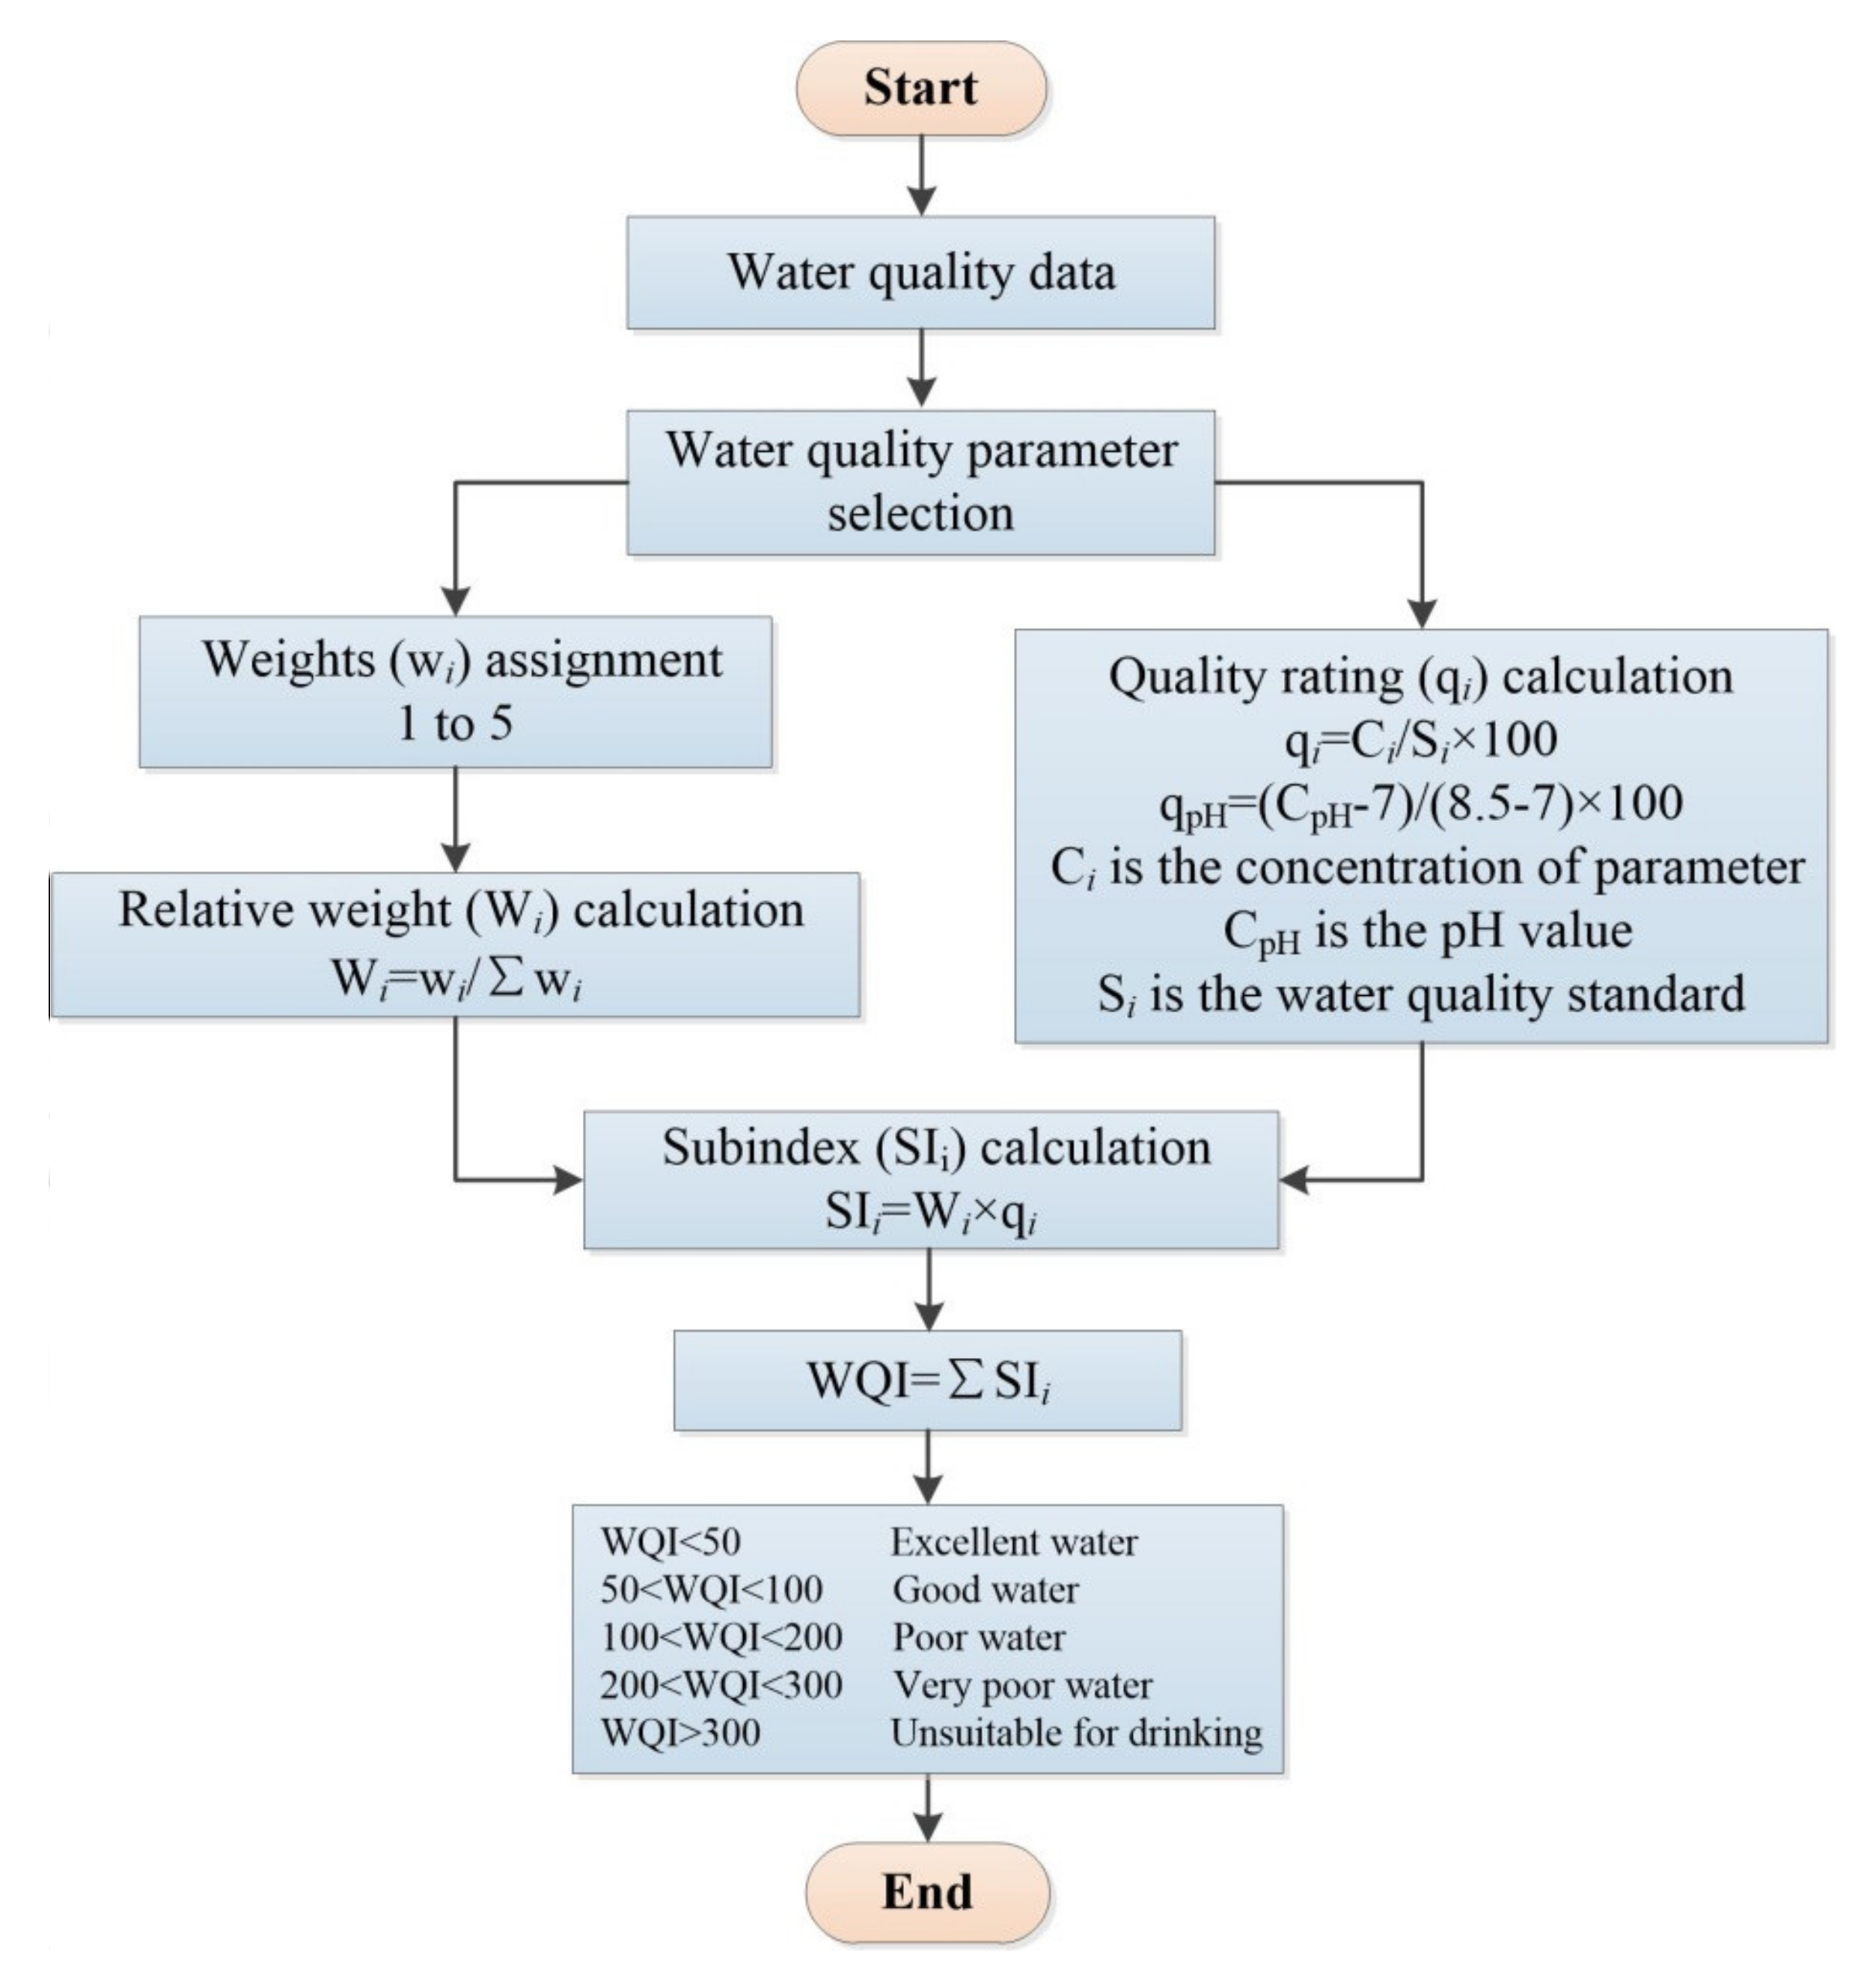
In this study, hydrochemical types were presented by the Piper diagram and Durov diagram, as effective tools for determining water types. Descriptive statistics, correlation analysis, and principal component analysis (PCA) were performed using SPSS 22.0 software. The main controlling factors of the spring water chemistry of four spring groups were analyzed using the ratio of major ions. The equilibrium state of the minerals in spring water was described by the saturation index (SI), which was calculated using Phreeqc interactive software (version: 3.4.0-12927, USGS). In addition, the spring water quality of four spring groups for drinking was characterized by a water quality index (WQI), as a widely-used tool to determine water quality [19,20,21]. The procedures of calculating WQI are illustrated in Figure 2.
In this study, a concept of discharge precipitation ratio (DPR) is introduced to determine the recharge conditions of precipitation to groundwater in the spring area. Consequently, the annual groundwater withdrawal (Qk) in the spring area is added to the total annual spring water flow (Qq) to form the annual total discharge (Qz) of the groundwater in the spring area. We refer to the ratio of the total discharge of groundwater to the annual precipitation (P) in the spring area as DPR, as follows:
4. Results and Discussion
4.1. Spring Water Chemistry
Statistical results of the main chemical components (March 2015 to July 2018) in the spring water of the four groups in Jinan are presented in Table 1. Overall, the spring water of the four springs in Jinan consists of weak alkalinity water, with the TDS lower than 1000 mg/L and the TH lower than 500 mg/L. The dominant cations are including Ca2+ and Mg2+, while, HCO3− and SO42− are the main anions in the spring water of the four groups. Except for NO2−, Na+, and COD, the coefficient of variation (Cv) of other chemical components are small, indicating their relatively stable conditions in the spring water. As NO2− and COD are one of the signs of pollution, the large coefficient of variation for these two components indicates the spring water is affected by human activities, although their content in spring water is very low.
TH and TDS are considered as significant parameters for evaluating water quality suitability [22]. The four spring groups of FDP, PS, SS, and BTS has an average TDS concentration of 566.60 mg/L, 561.14 mg/L, 622.11 mg/L, and 701.01 mg/L, respectively, and the average TH concentrations of 331.47 mg/L, 320.47 mg/L, 361.51 mg/L, and 404.55 mg/L, respectively (Table 1). Based on the TH and TDS, the water quality of the four spring groups for the duration of March 2015 to July 2018 is excellent. NO3− can usually reflect the impact of human activities, such as industrial and agricultural production, on groundwater [23]. The mean NO3−concentrations of FDP, PS, SS, and BTS are 37.47 mg/L, 33.80 mg/L, 43.44 mg/L, and 52.60 mg/L, respectively (Table 1). Among them, only the mean NO3− concentration of the BTS exceeds the WHO drinking water standards (i.e., 50 mg/L), however, the value does not exceed China’s national standards for drinking water (i.e., 88.57 mg/L) [24]. Other major ions, such as Cl−, SO42−, Na+, and F− are lower than the WHO standards [25].
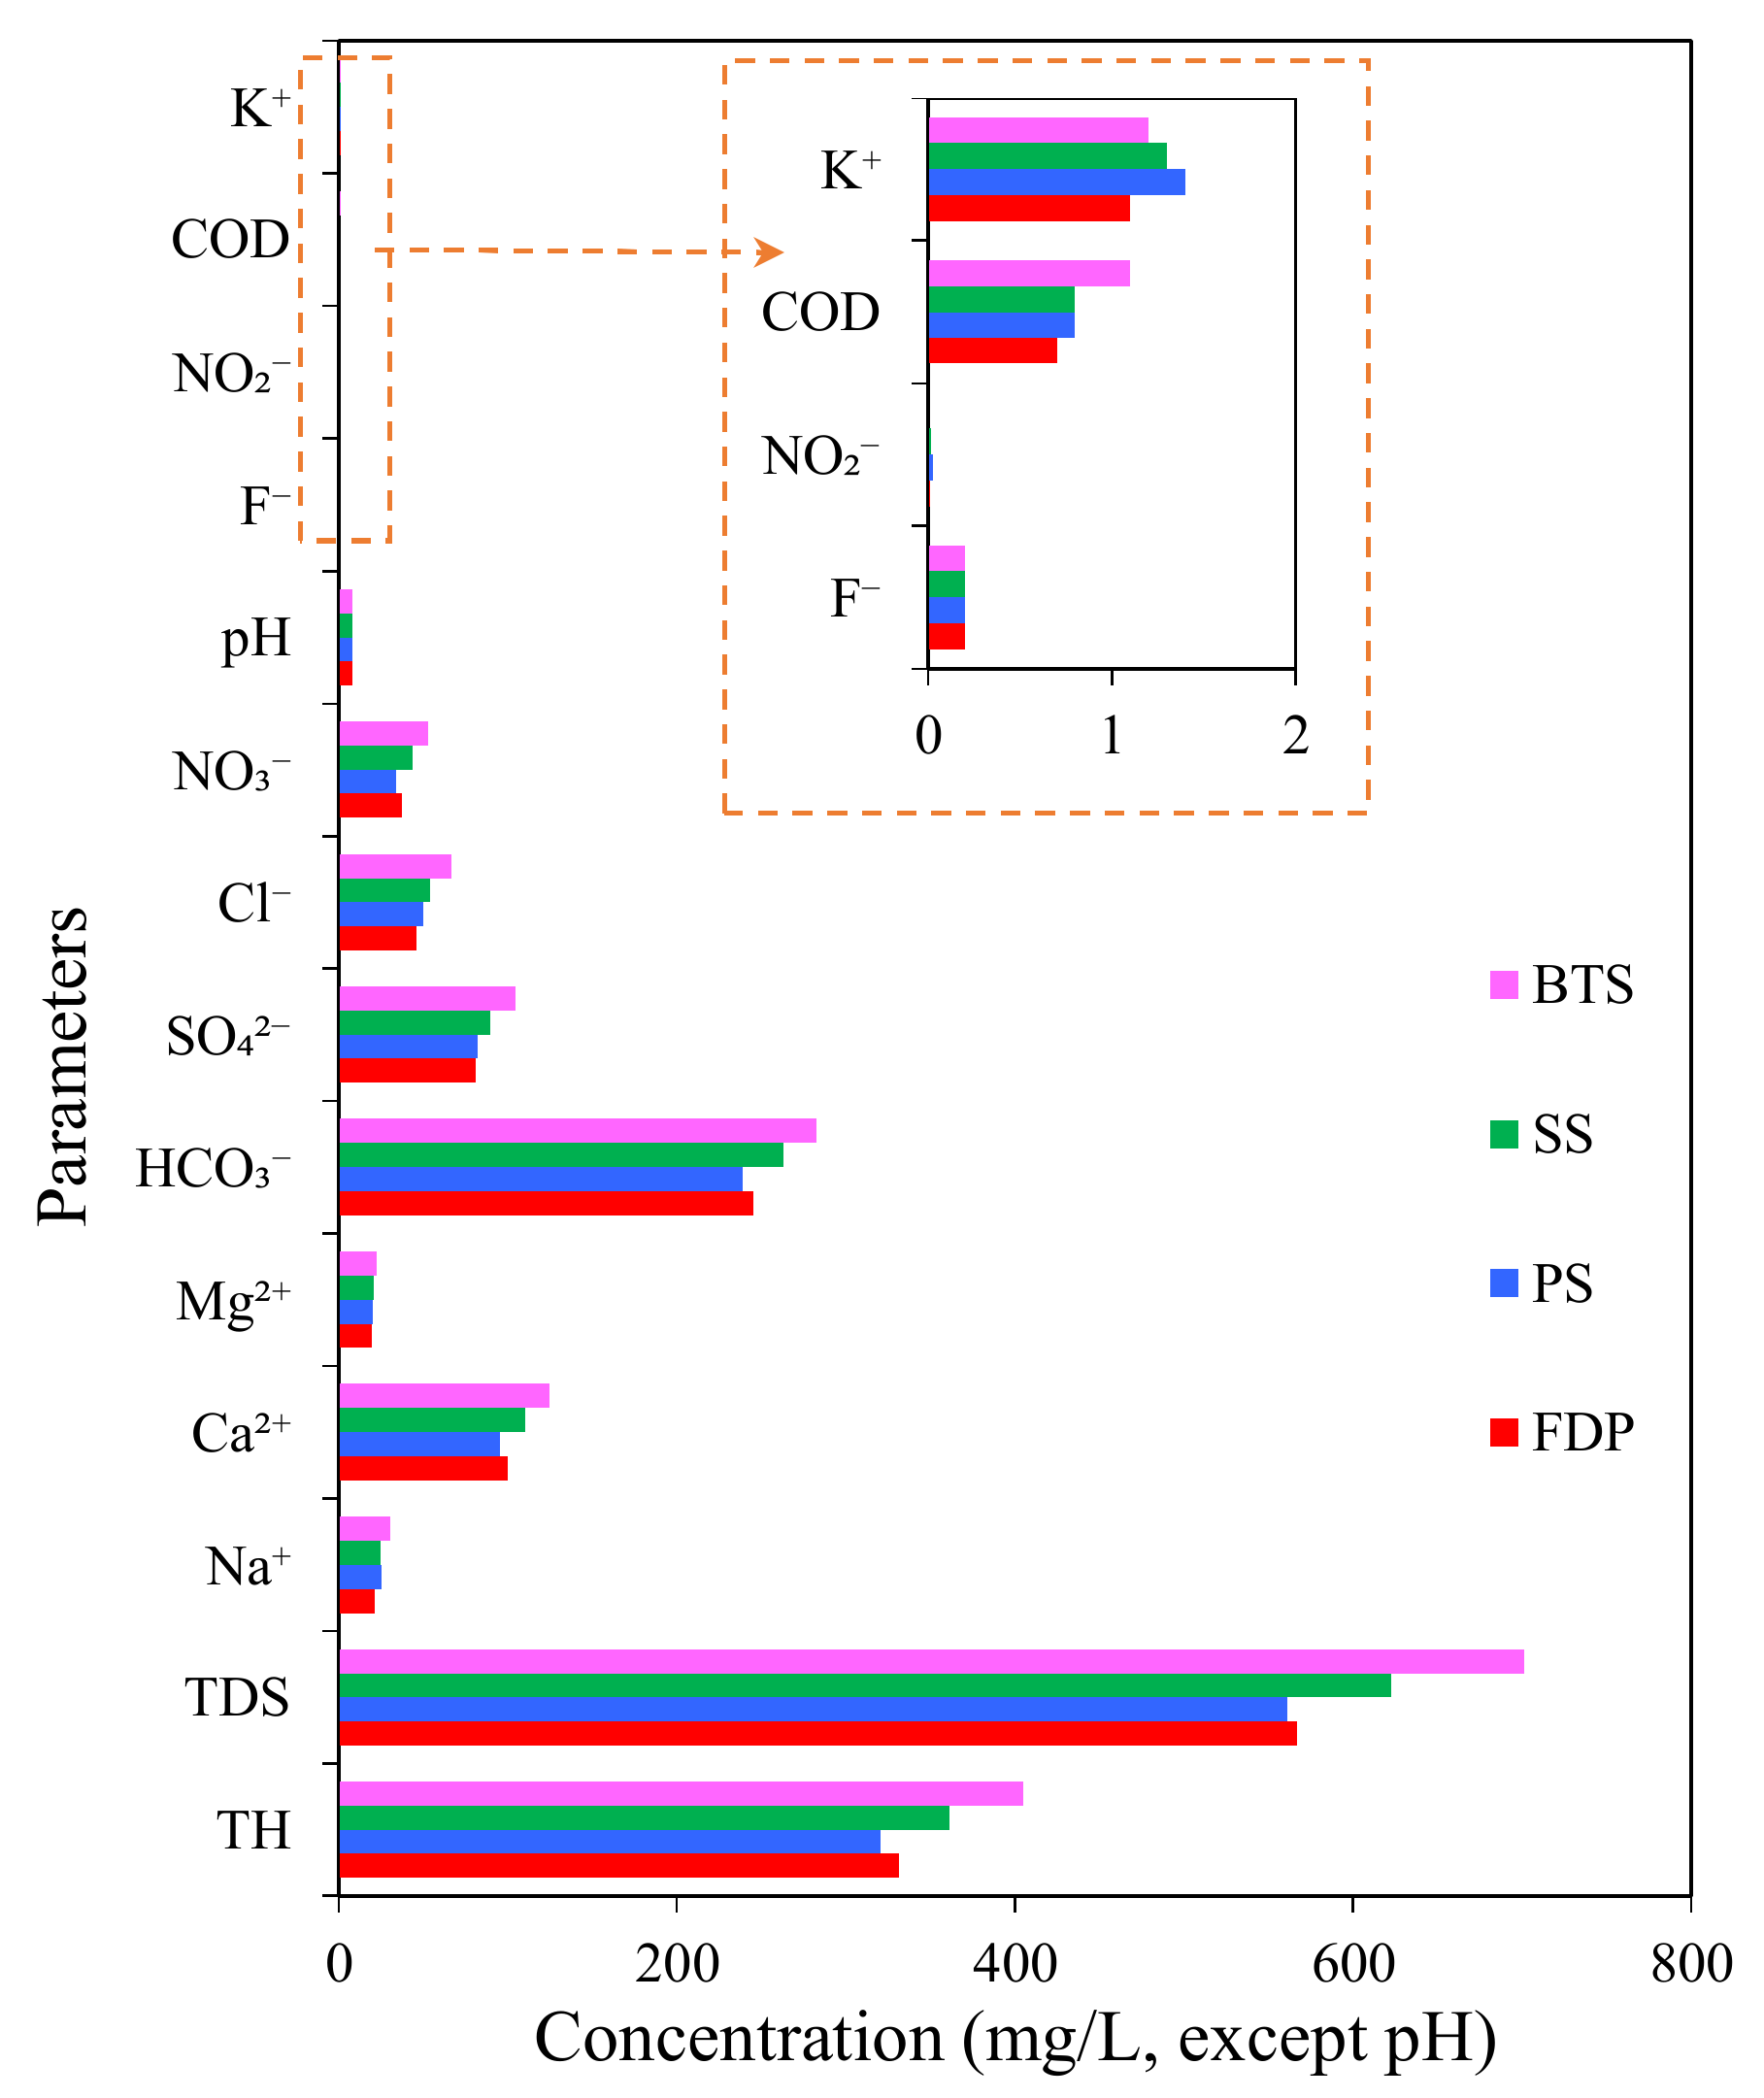
Based on the comparison between the four spring groups, except for the similar value of F− and pH, the chemical components of the four spring groups are different. Among them, the average concentrations of TDS, TH, Ca2+, HCO3−, and NO3− present an order of BTS > SS > FDP > PS, while Mg2+, Cl−, SO42−, and COD demonstrate an order of BTS > SS > PS > FDP, while K+ follows the order of PS > SS > BTS > FDP (Figure 3 and Figure 4).
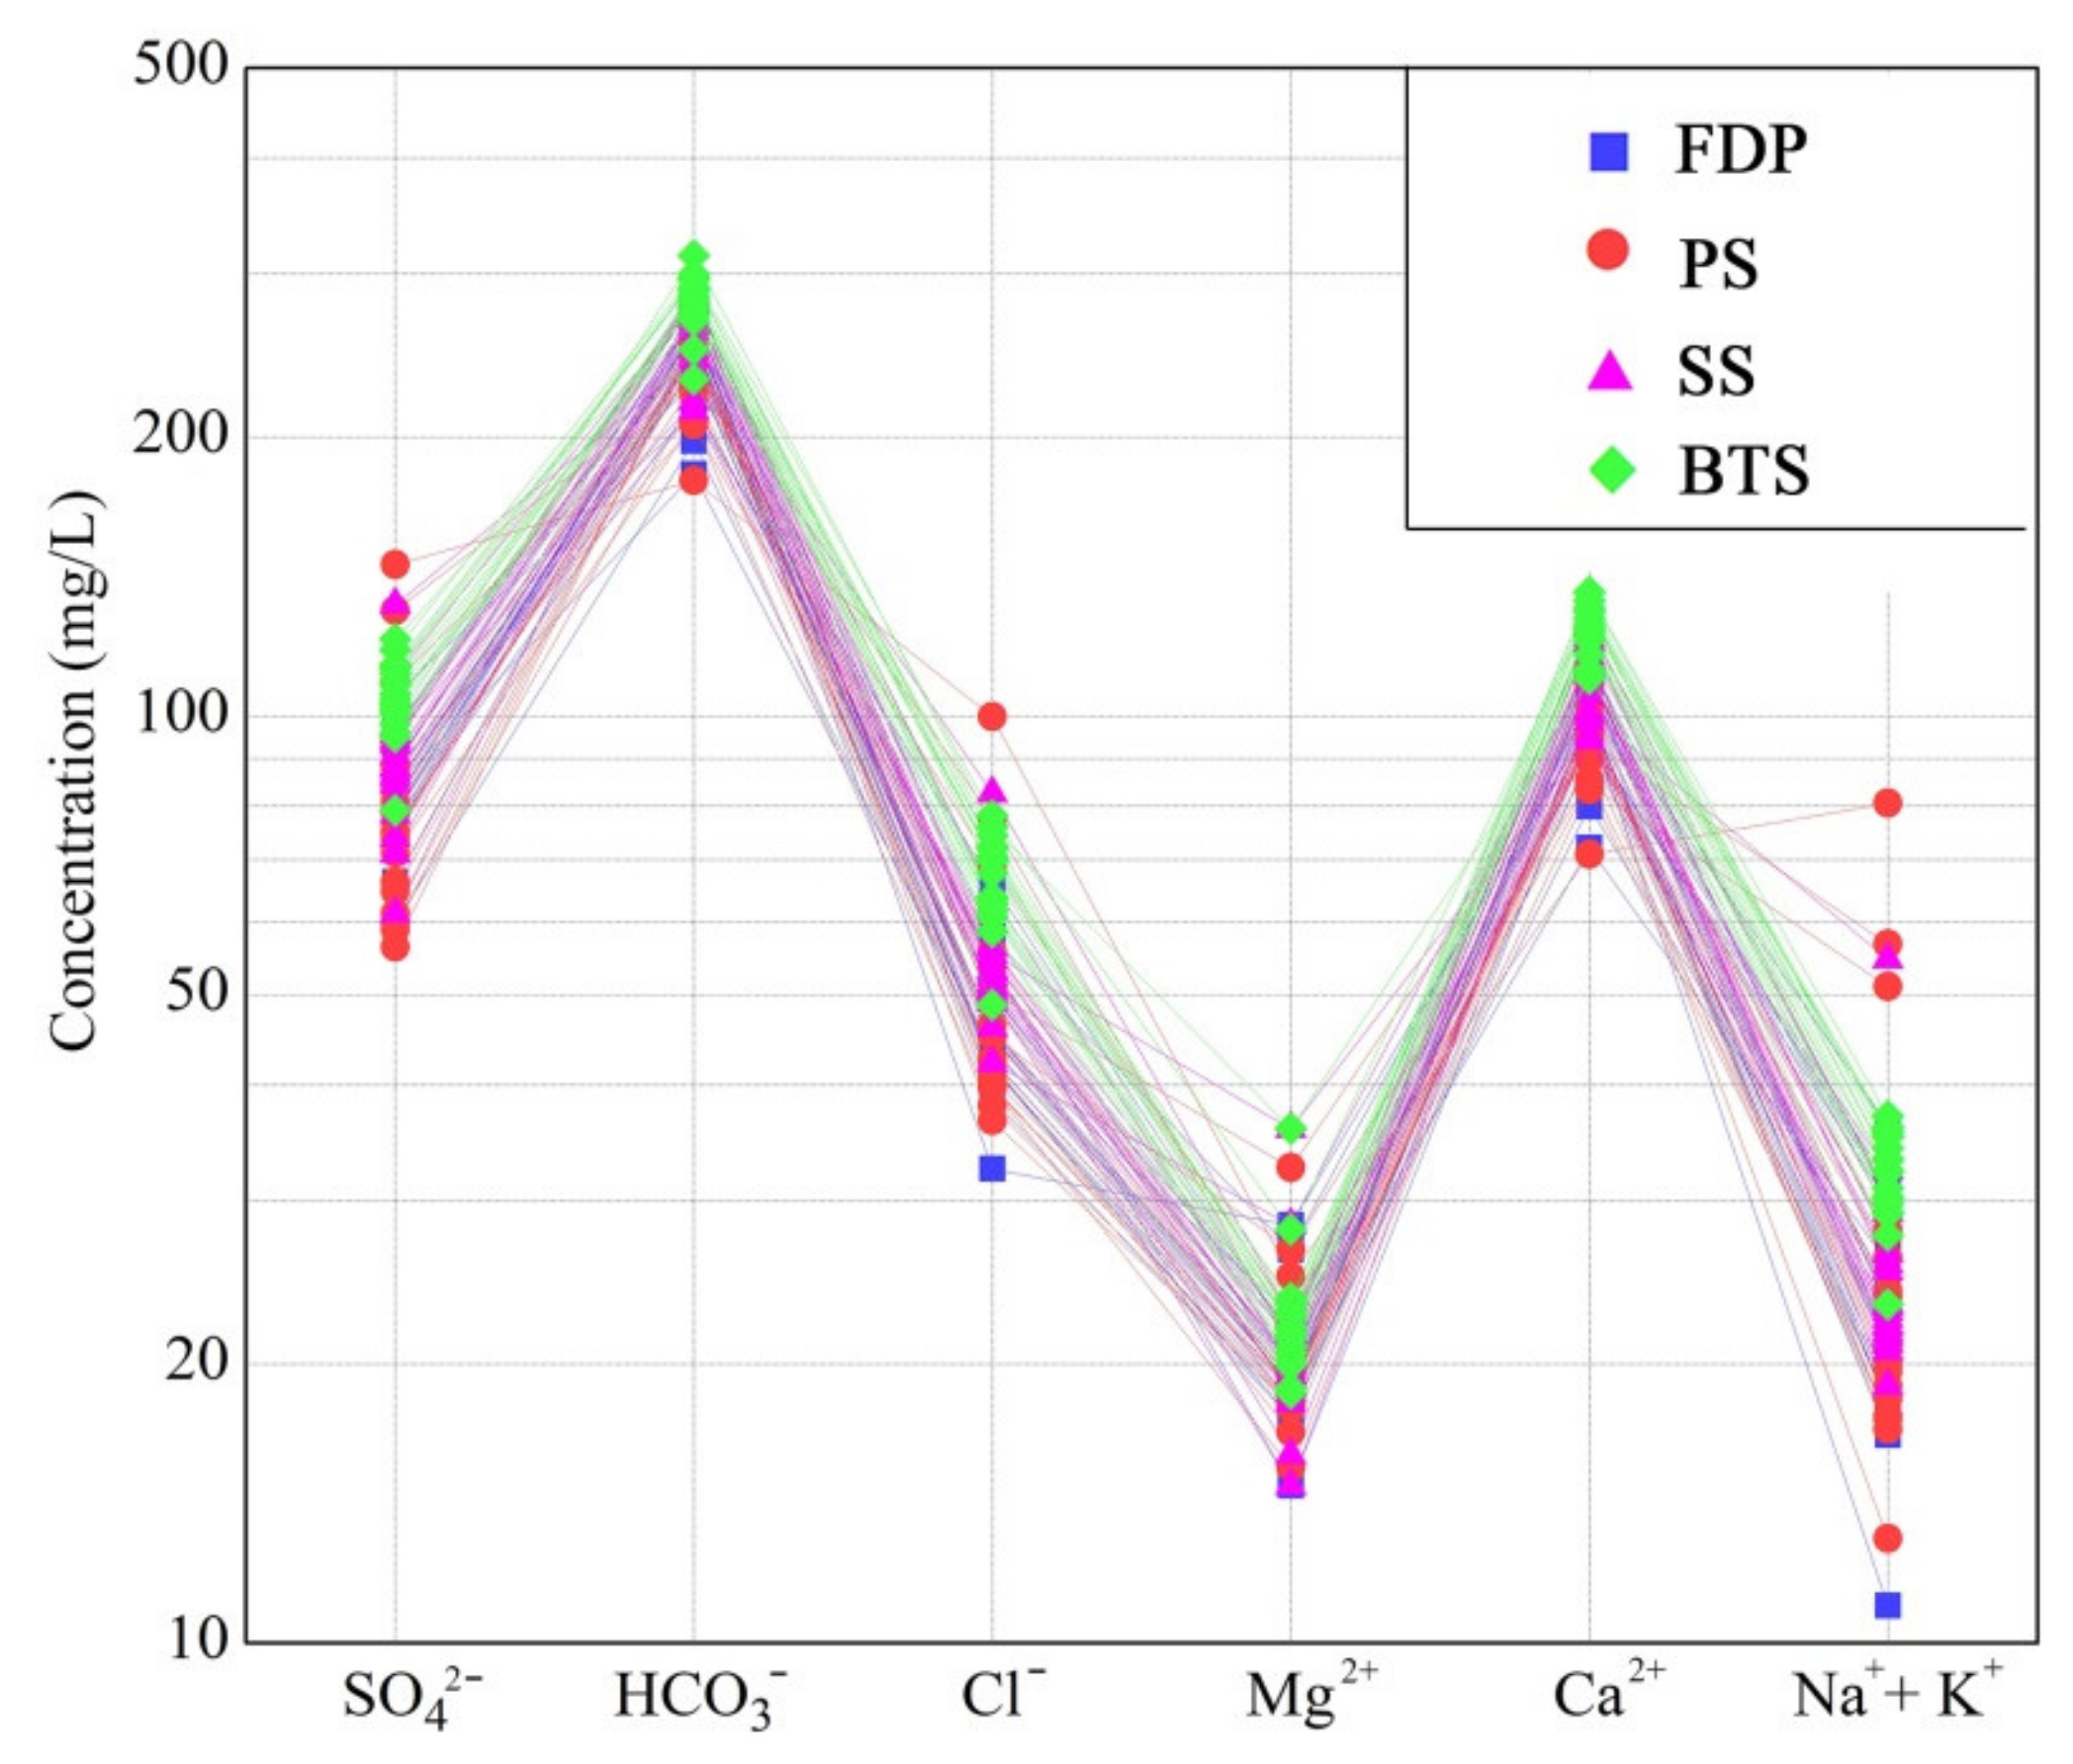
Schoeller diagram is a commonly used method for hydrochemical characterization, which can clearly show the changes in the concentration of major ions, in water samples [26]. According to the Schoeller diagram, obvious differences are observed in the main ion concentration of each spring group. Meanwhile, the same trend is observed for the water sample curves of the four groups, with a slight difference at individual water sample points, indicating the same source of recharge for these four groups.
4.2. Water Types
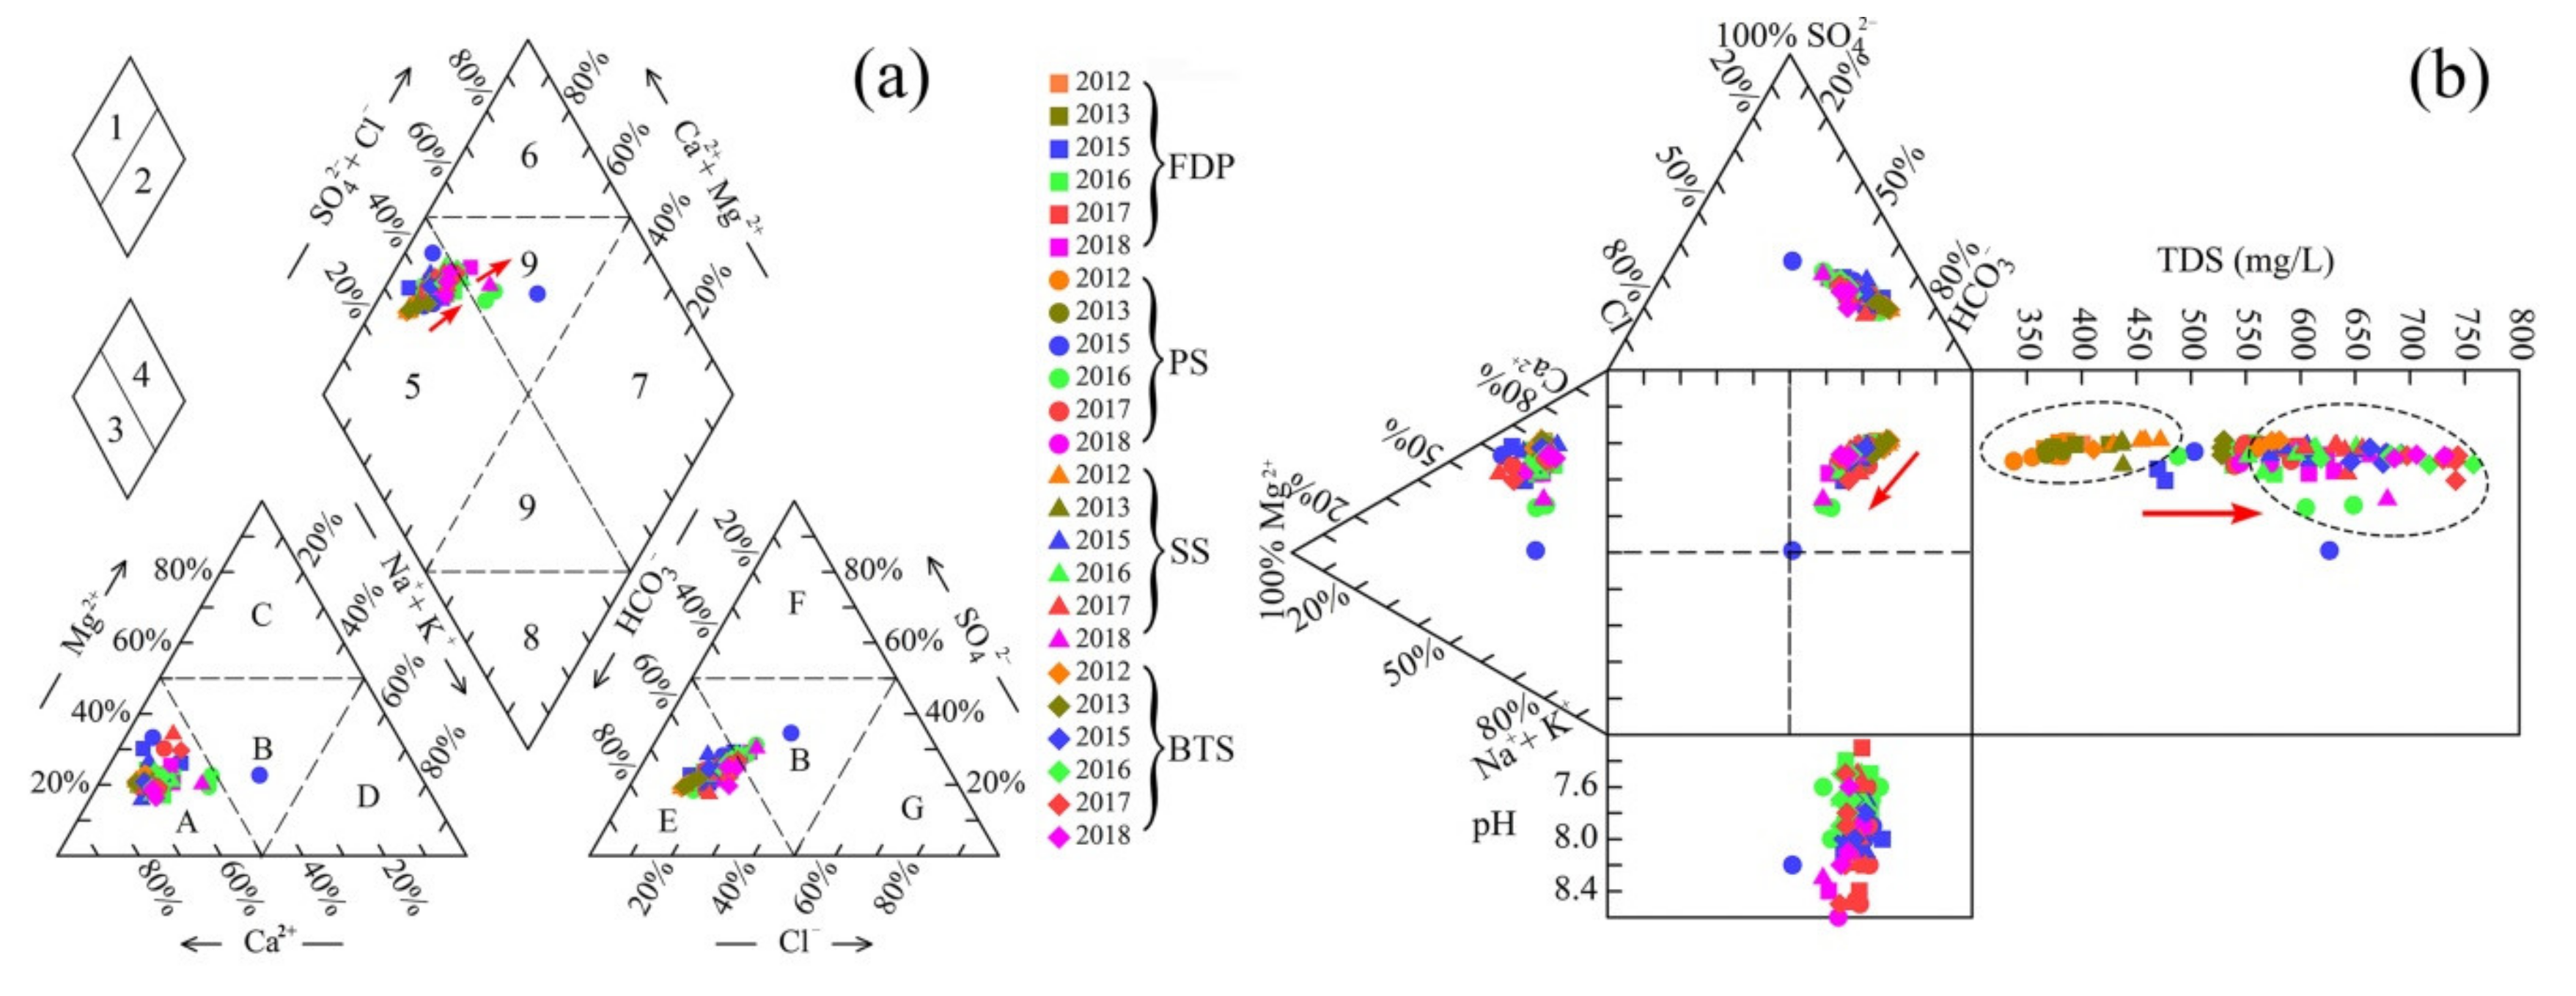
Piper diagram [27] and Durov diagram [28] are identified as effective tools for understanding the hydrochemical facies and hydrogeochemical regimes [29,30]. It can be seen from both diagrams in Figure 5 that the cations are mainly concentrated at the Ca2+ end (i.e., region A in the figure), while, the anions are mainly distributed at the HCO3− end (i.e., region E in Figure 5). In the diamond part of the Piper diagram, the spring water sample points are mainly located in the region 5, while in the Durov diagram, the water sample points are mainly distributed in the small square on the upper right-hand side, which indicates the water chemistry of the spring water is mainly HCO3-Ca type. This can be explained by a large number of carbonate rocks, distributed in the area, therefore, the weathering of carbonates is the main source of Ca2+ and HCO3− in the spring water.
In addition, the evolution trend of hydrochemical types of spring water can be observed in the Piper diagram and Durov diagram (Figure 5). In the Piper diagram, the water samples gradually change from zone 5 to zone 9 over time, that is, over time, the spring hydrochemical type gradually evolves from the HCO3-Ca type to the mixed type, due to the increase of SO42−. In the Durov diagram, in addition to the change in the water type, the TDS values gradually increase over time, and the pH values of many water samples in 2015, 2017, and 2018 are higher than those in other years.
4.3. Spring Water Chemistry Formation Mechanisms
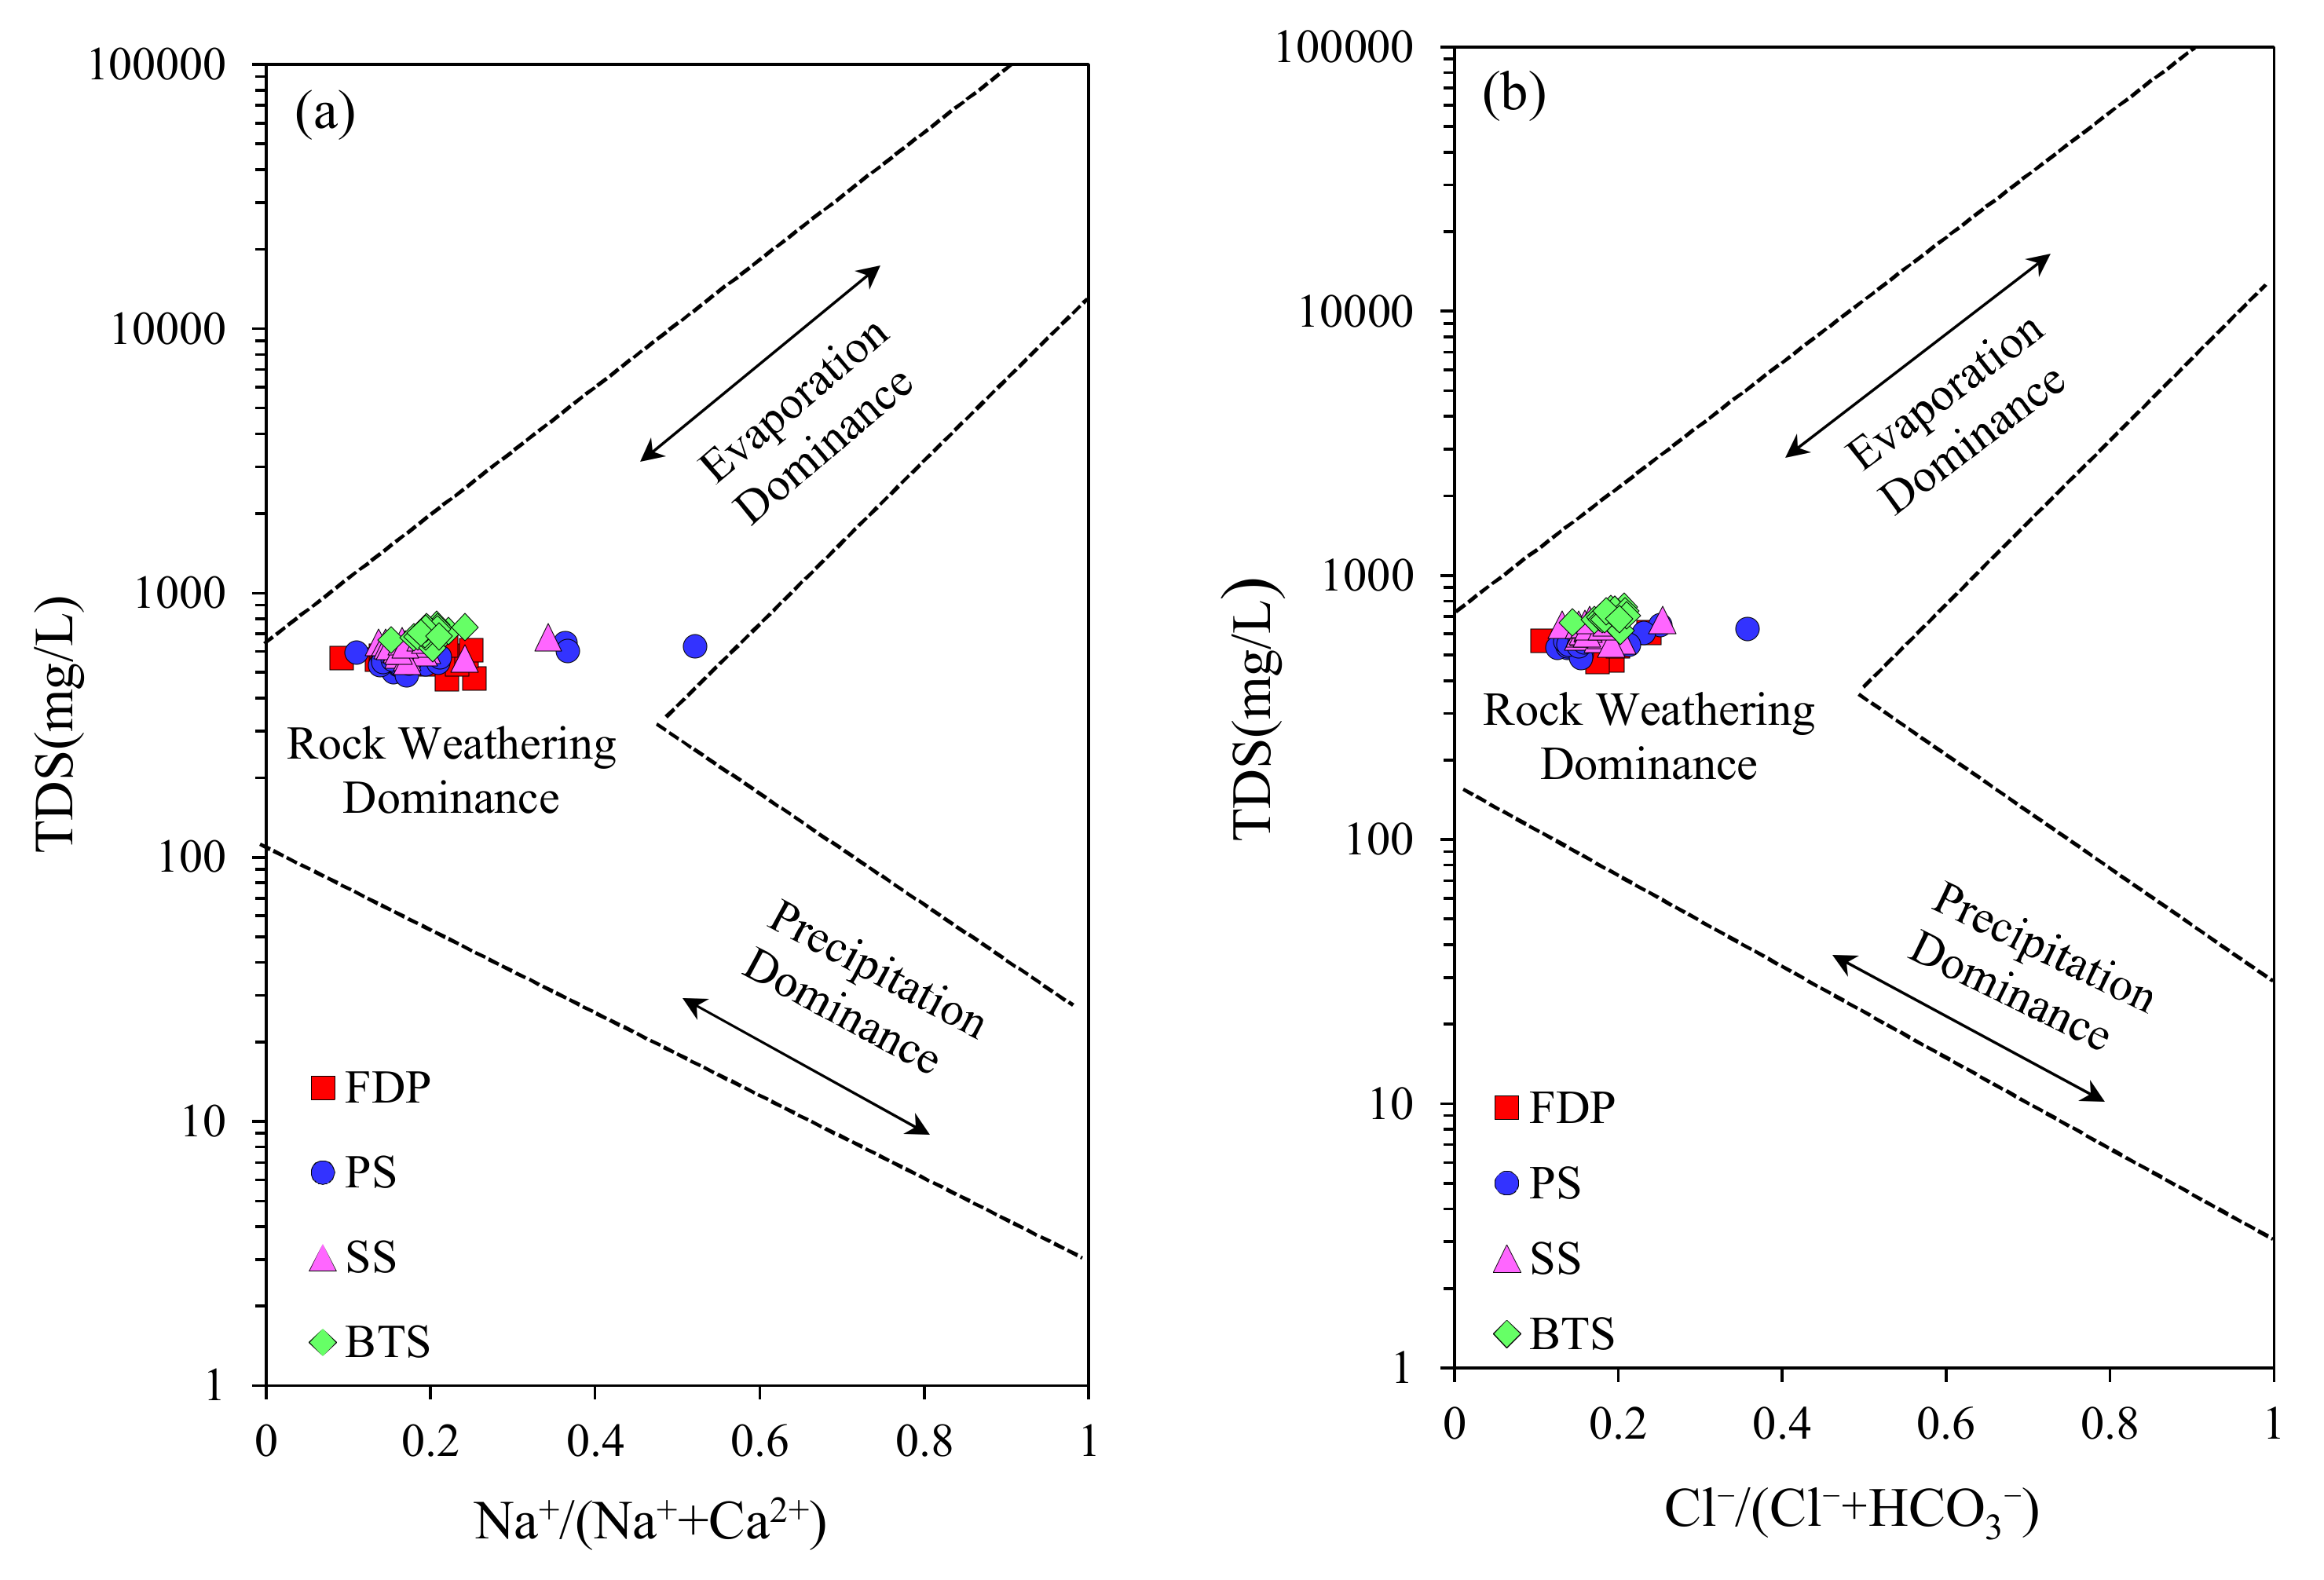
Generally speaking, rock weathering, atmospheric precipitation, and evaporation are three important factors, affecting the groundwater hydrochemistry in non-coastal areas. The Gibbs’s model diagram [31] can identify the dominant controlling factors of hydrochemistry. In this study, all the spring water samples, collected from the four spring groups, fall into the rock weathering dominance zone (Figure 6), indicating that water–rock interaction plays a significant role in the spring water chemistry.
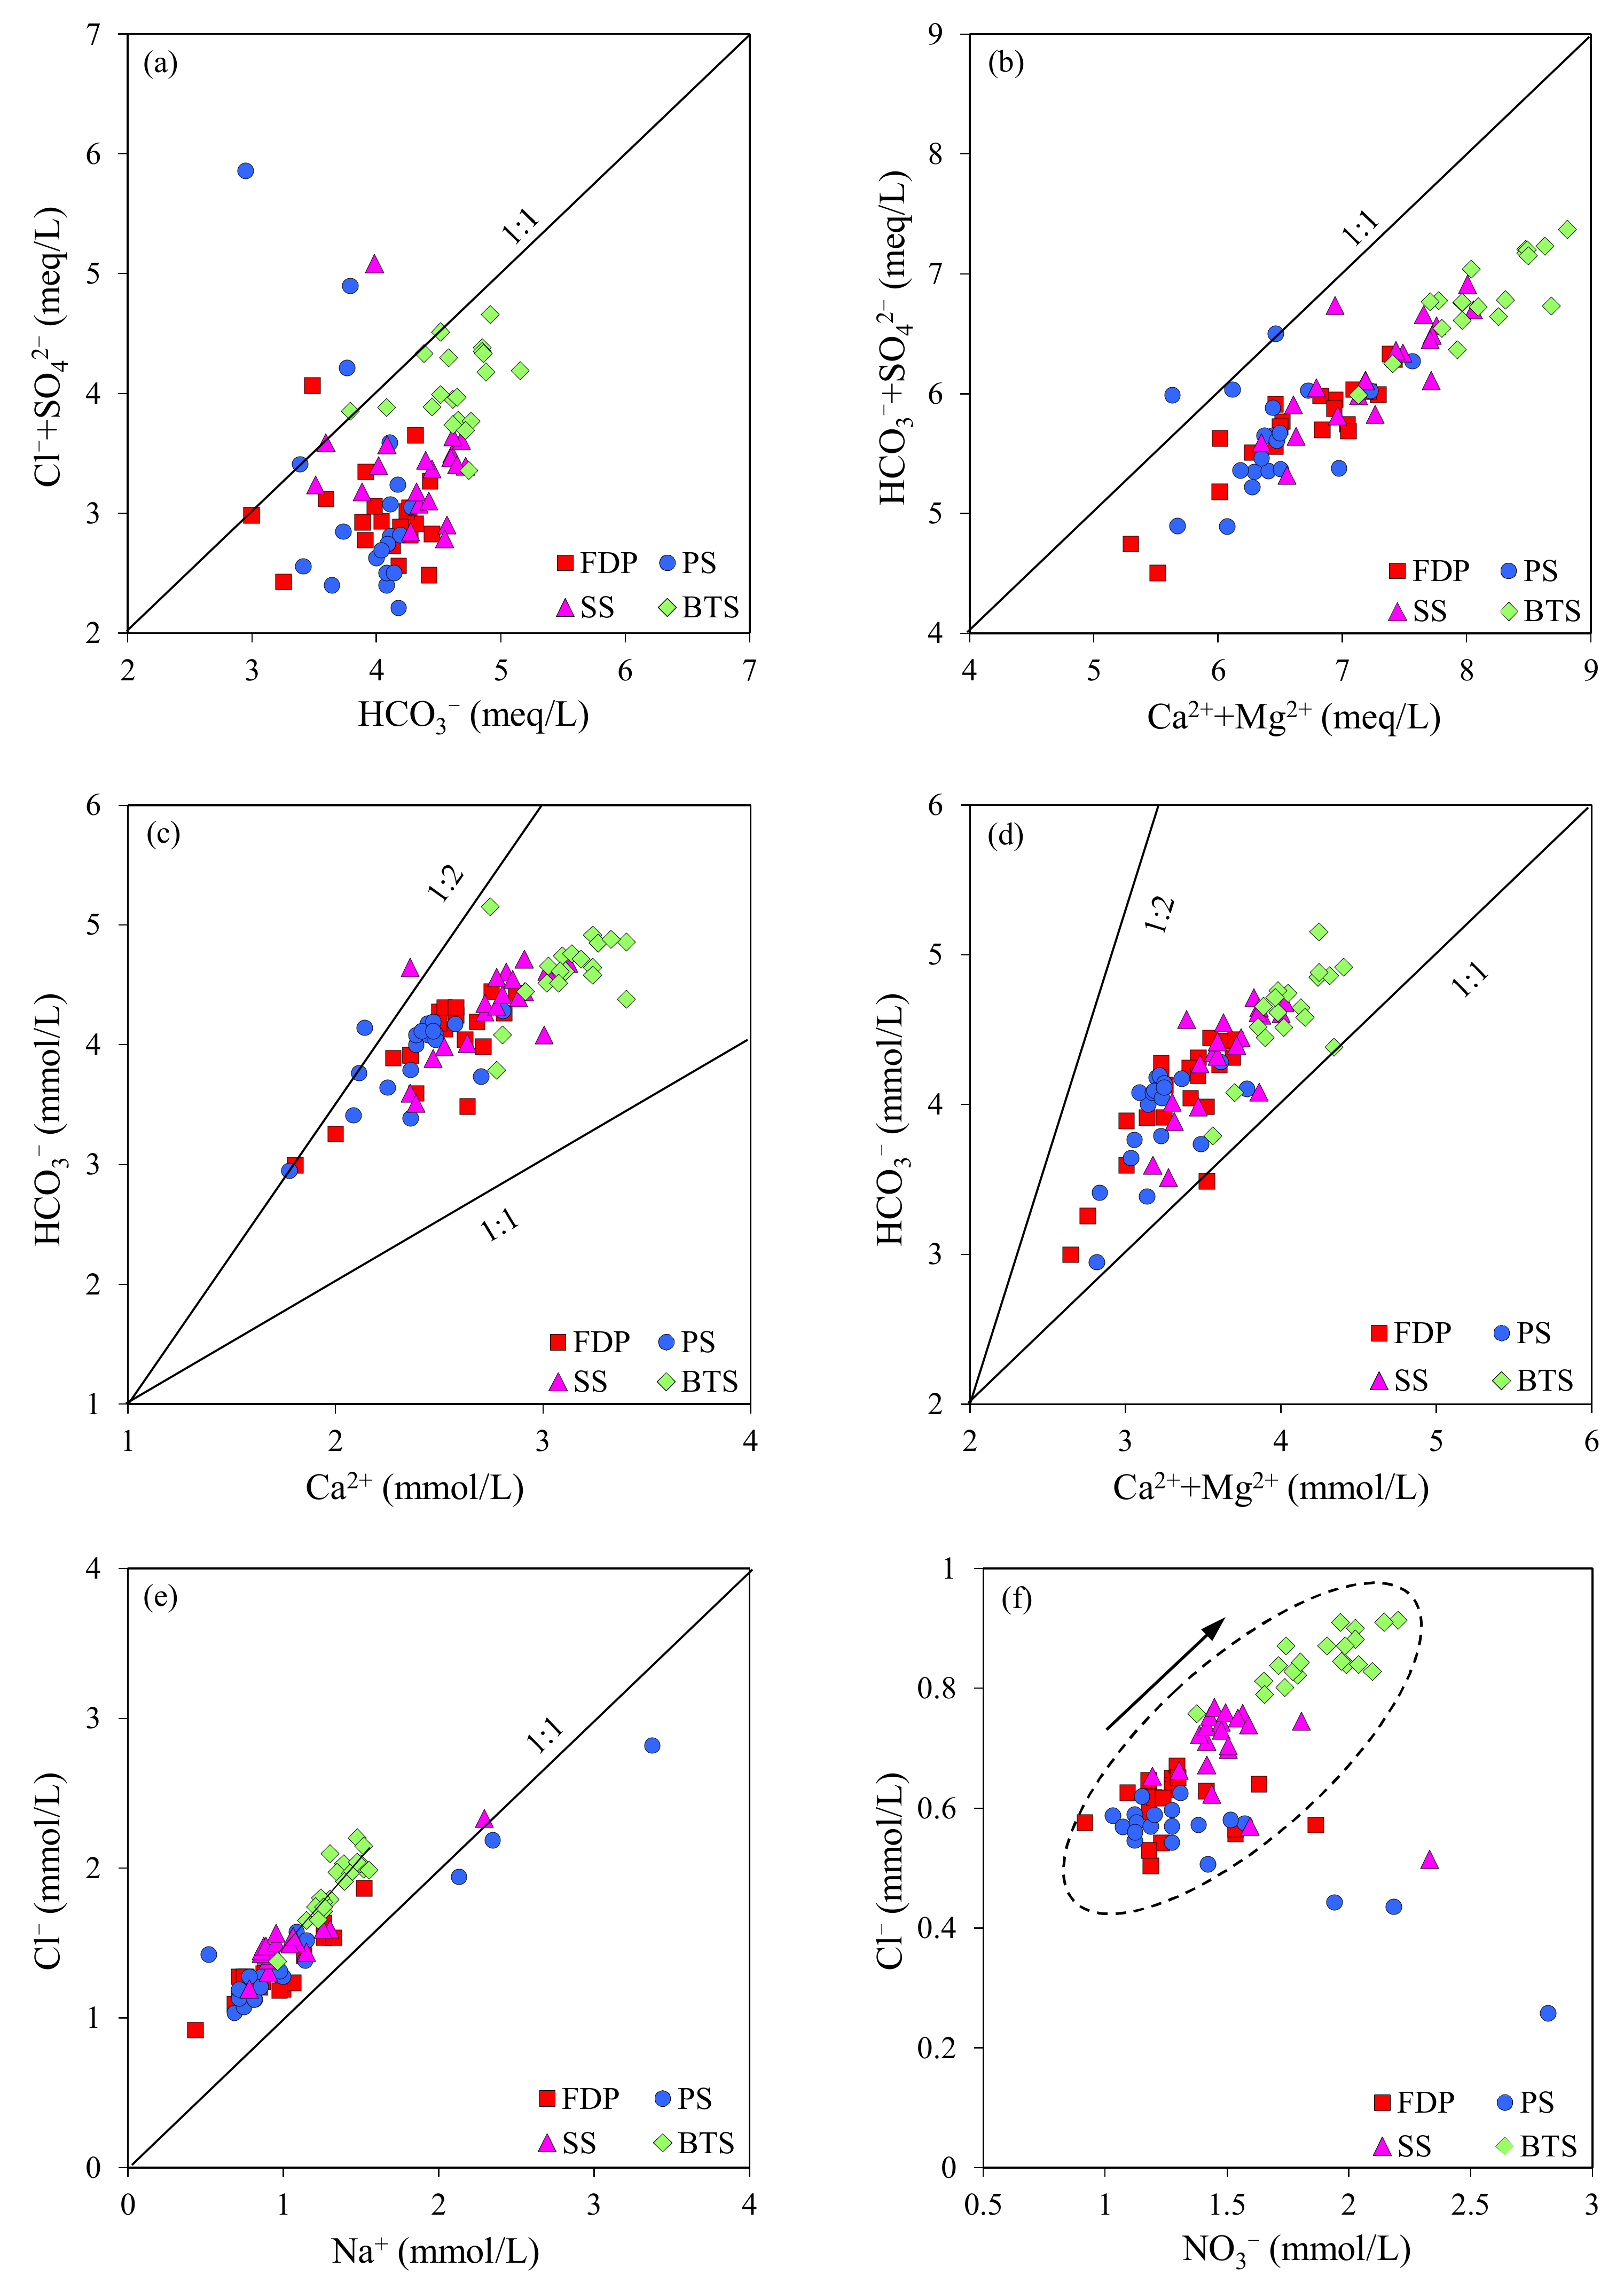
The ratios of major ion can help to further understand the types of rock weathering sources related to the hydrochemical characteristics of groundwater [32,33,34]. As presented in Figure 7a,b, most water samples are concentrated in the zones below the y = x line, which indicates that the water chemistry of the samples is affected by the dissolution of carbonate minerals, which provides the main source forCa2+, Mg2+, and HCO3− in the spring water. In addition, most of spring water samples are plotted in the zones between the y = x line and y = 2x line, but in Figure 7c the water samples are close to y = 2x line, while in Figure 7d, samples are inclined to y = x line, indicating that the spring water chemistry is mainly affected by the dissolution of calcite, followed by the dissolution of dolomite. Most spring water samples fall above the dissolution line (y = x line) of the halite (Figure 7e), indicating the dissolution of halite is not the source of Na+ and Cl−. Except for a few water samples, Cl− contents in most water samples of the four spring groups increase with the increase of NO3− (Figure 7f), which suggests a certain impact of human activities on spring water, in the study area.
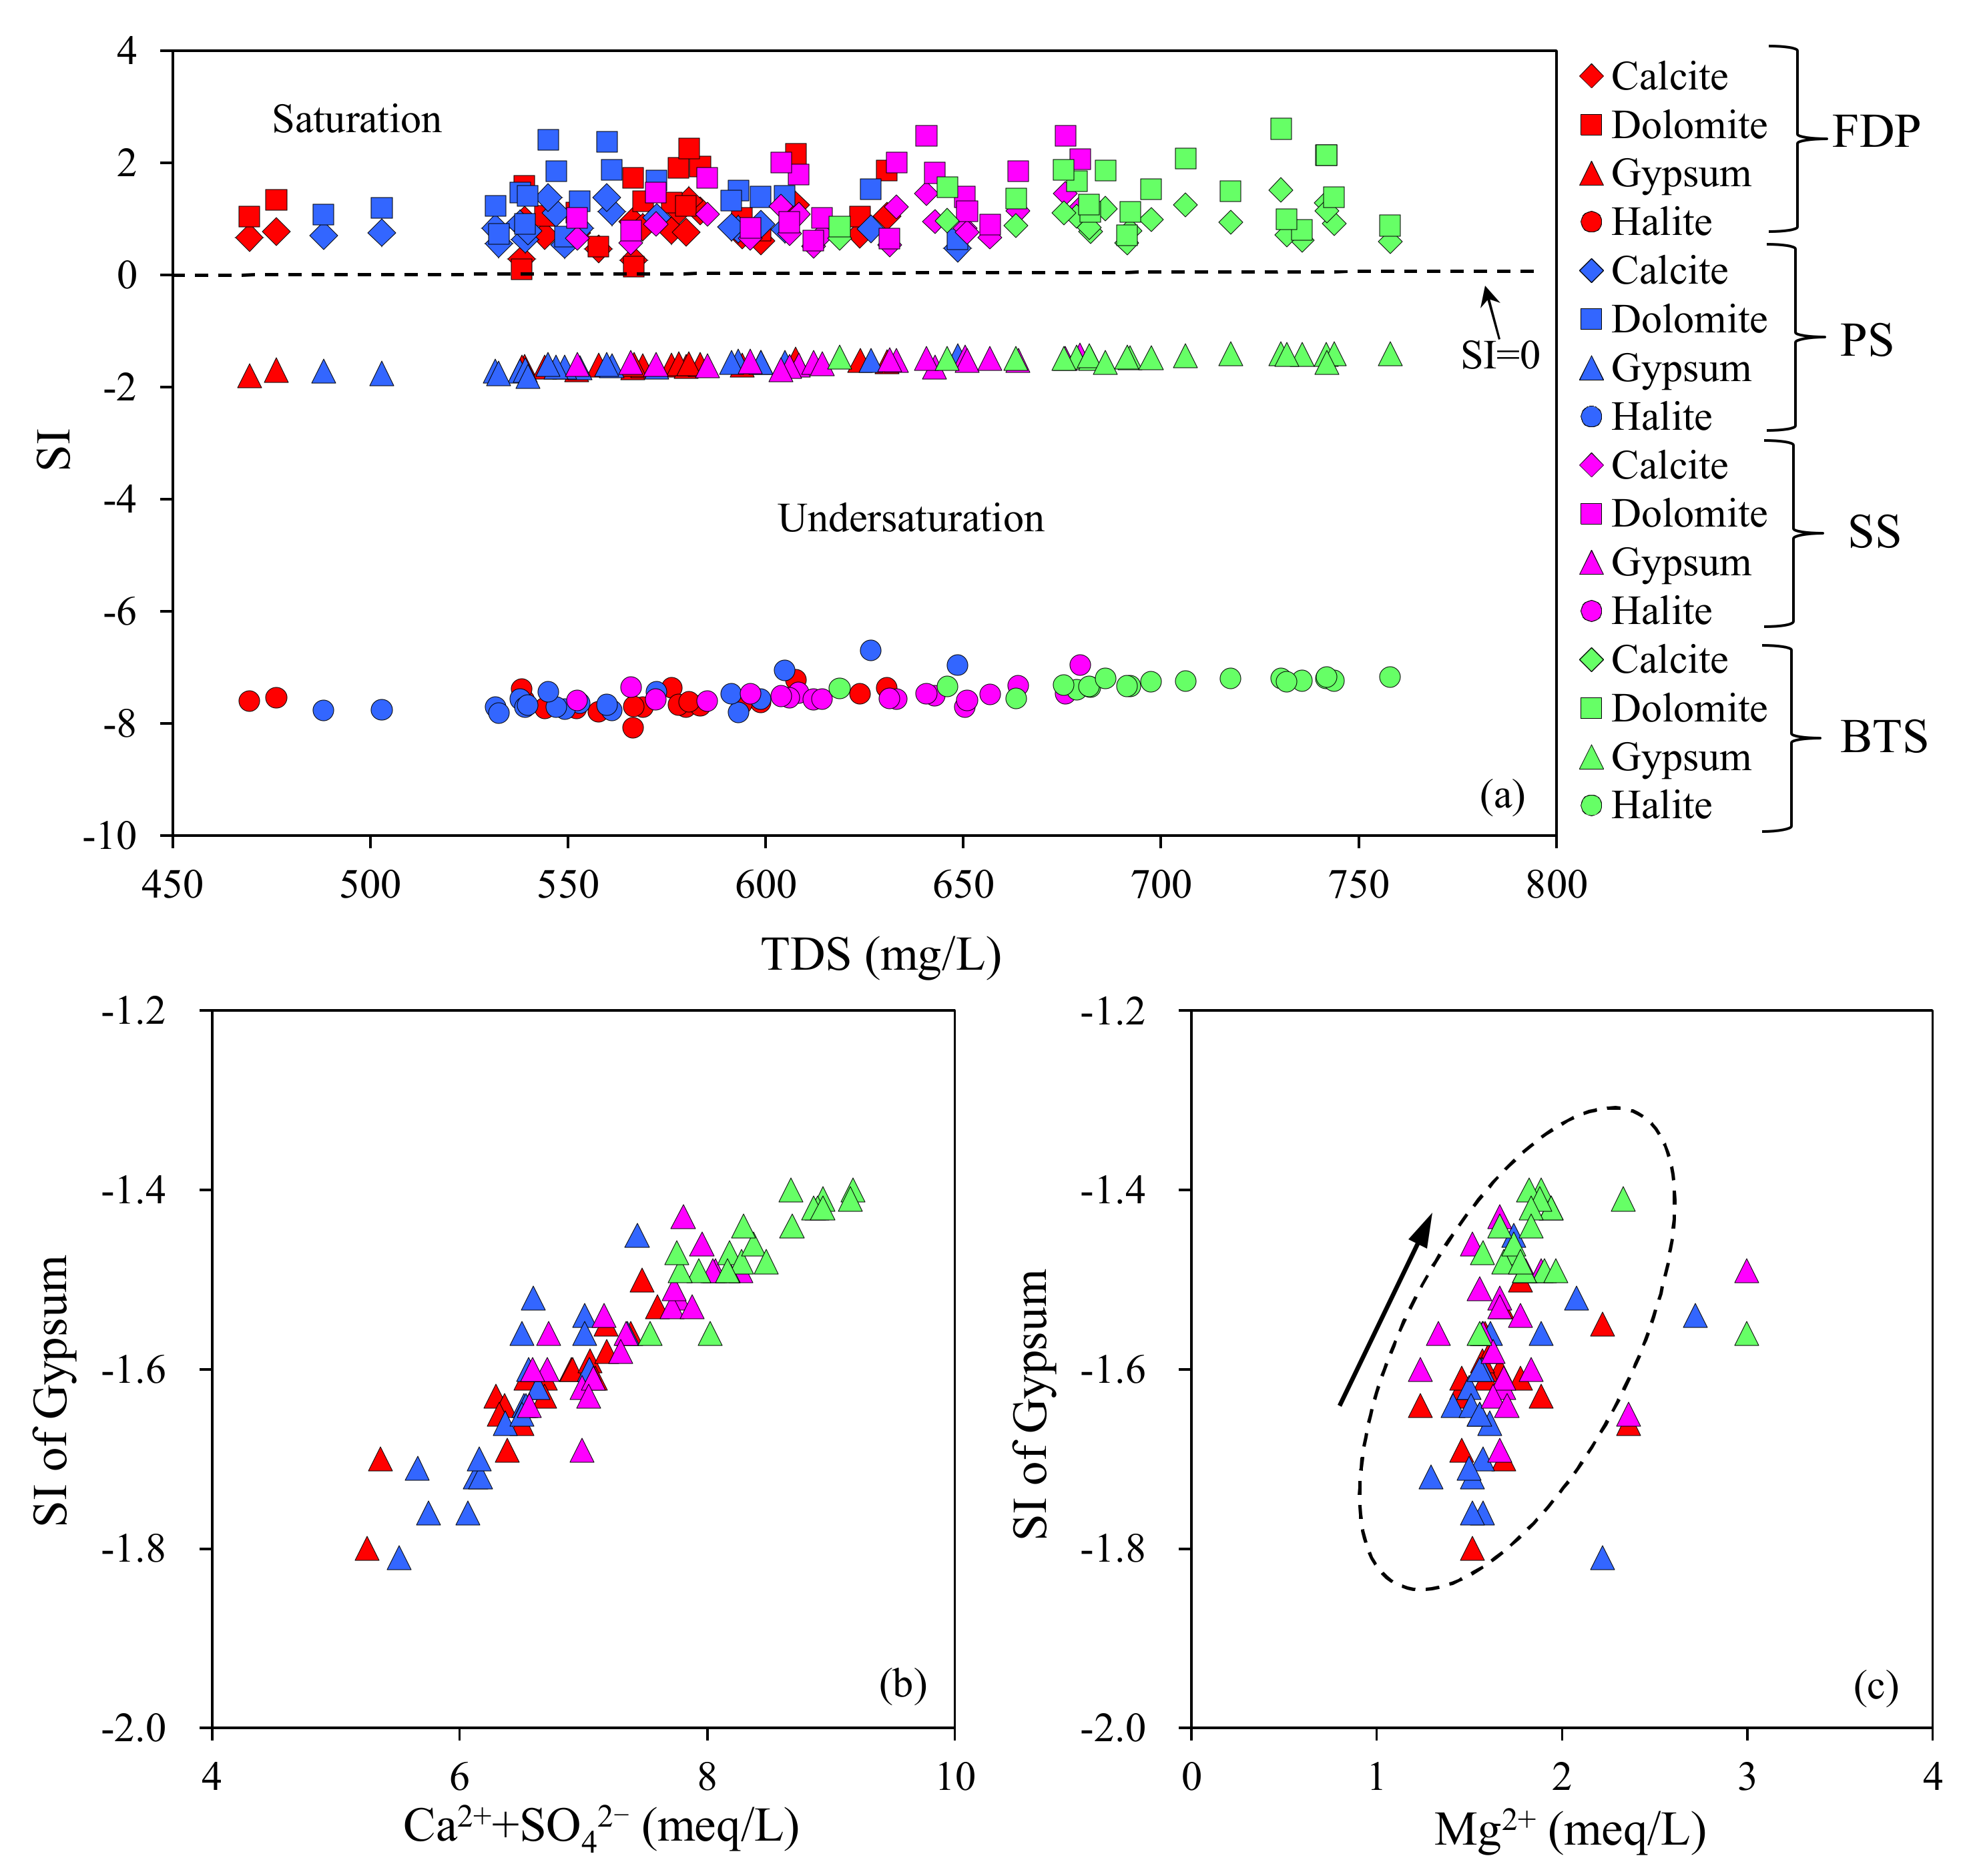
The saturation index (SI) is an indicator that is often used in hydrogeochemistry to determine the saturation state of mineral phases in groundwater [35,36,37]. In this regard, the states of the mineral, in the supersaturated state, the equilibrium state, and the unsaturated state are indicated by SI > 0, SI = 0, and SI < 0, respectively. Table 1 and Figure 8 show the SI values for calcite, dolomite, halite, and gypsum in the spring water samples of each spring group. Overall, all spring water samples indicate positive SI values for calcite and dolomite, as well as negative SI values for halite and gypsum. The values of calcite, dolomite, halite, and gypsum of the four spring groups ranged from 0.27 to 1.52 (mean value of 0.89), 0.11 to 2.61(mean value of 1.41), −1.84 to −1.40 (mean value of −1.57), and −8.07 to −6.69 (mean value of −7.48), respectively, suggesting saturation in carbonate minerals and undersaturation in halite and gypsum.
In addition, the amount of Ca2+ and SO42− increases with the increase of the SI of gypsum, which indicates that the dissolution of gypsum has a certain influence on the hydrochemistry of spring water. Simultaneously, the content of Mg2+ in most spring water samples increases as the SI of gypsum increases, which may indicate the presence of dedolomitization. As gypsum is not saturated and continues to dissolve, the concentrations of Ca2+ and SO42− in water increase, and Mg2+ in dolomite is replaced by Ca2+ to produce calcite precipitation, which leads to dedolomitization [38,39].
4.4. Principal Component Analysis
In this study, the PCA method is used to extract the principal components, affecting the hydrochemical components through dimensionality reduction of hydrochemical data (from March 2015 to July 2018) of the four spring groups to determine the impact of different factors on the spring water. The results show that KMO (Kaiser–Meyer–Olkin value) = 0.647 > 0.6 and p = 0.000 < 0.05, suggesting the factor model has good adaptability and can be used for PCA. As presented in Table 2, four principal components with an eigenvalue >1 are calculated, accounting for 79.7% of the total variance.
PC1 accounted for 33.8% of the total variance of spring water data, which is significantly correlated with TH, TDS, Ca2+, HCO3−, and NO3−. The Ca2+ and HCO3− of spring water are mainly governed by weathering of carbonate rocks. NO3− represents the impact of anthropogenic inputs (such as fertilization) on spring water. Therefore, PC1 mainly reflects the water-rock interaction of carbonate and the influence of human activities on the chemical composition of spring water. In addition, NO3− has a good correlation with Ca2+ and HCO3−, which indicates that the increase of NO3− concentration, caused by human activities, affects the dissolution of carbonate minerals [40].
PC2, accounted for 26% of the total variance, shows positive correlations with Na+, K+, Cl−, and SO42−, Na+ and Cl− may originate from the dissolution of halite, however, previous analysis on the ratios of major ion (see the previous section) shows that the dissolution of halite is very weak, therefore, PC2 does not represent the dissolution of halite. Weathering of silicate rocks can provide Na+ and K+, however, PC2 is negatively correlated with H2SiO3, hence, PC2 is not the product of silicates weathering. Yin et al. [5] suggested that sulfur in the spring water of the four spring groups mainly derives from fire coal, showing a growing trend. Therefore, PC2 may indicate that spring water is affected by precipitation inputs, influenced by fire coal.
PC3 accounted for 11.7% of the total variance and has significant correlations with Mg2+ and COD. Mg2+ may be represented as a product of the dedolomitization. COD is a pollution index, indicating the content of organic matter in water. The main sources of organic pollution in groundwater are including industrial, agricultural, and domestic pollutions. Thus, PC3 may reflect the effects of dedolomitization and human activities.
PC4 accounted for 8.2% of the total variance and is positively correlated with pH and NO2−. PC4 likely represents the anthropogenic inputs. However, the pH values and concentrations of NO2− in the spring water remains below the WHO standards [25], with relatively small variance, which indicated that the human activities, represented by PC4 have less influence on the quality of spring water, in the study area.
4.5. Temporal Variations of Spring Water Quality
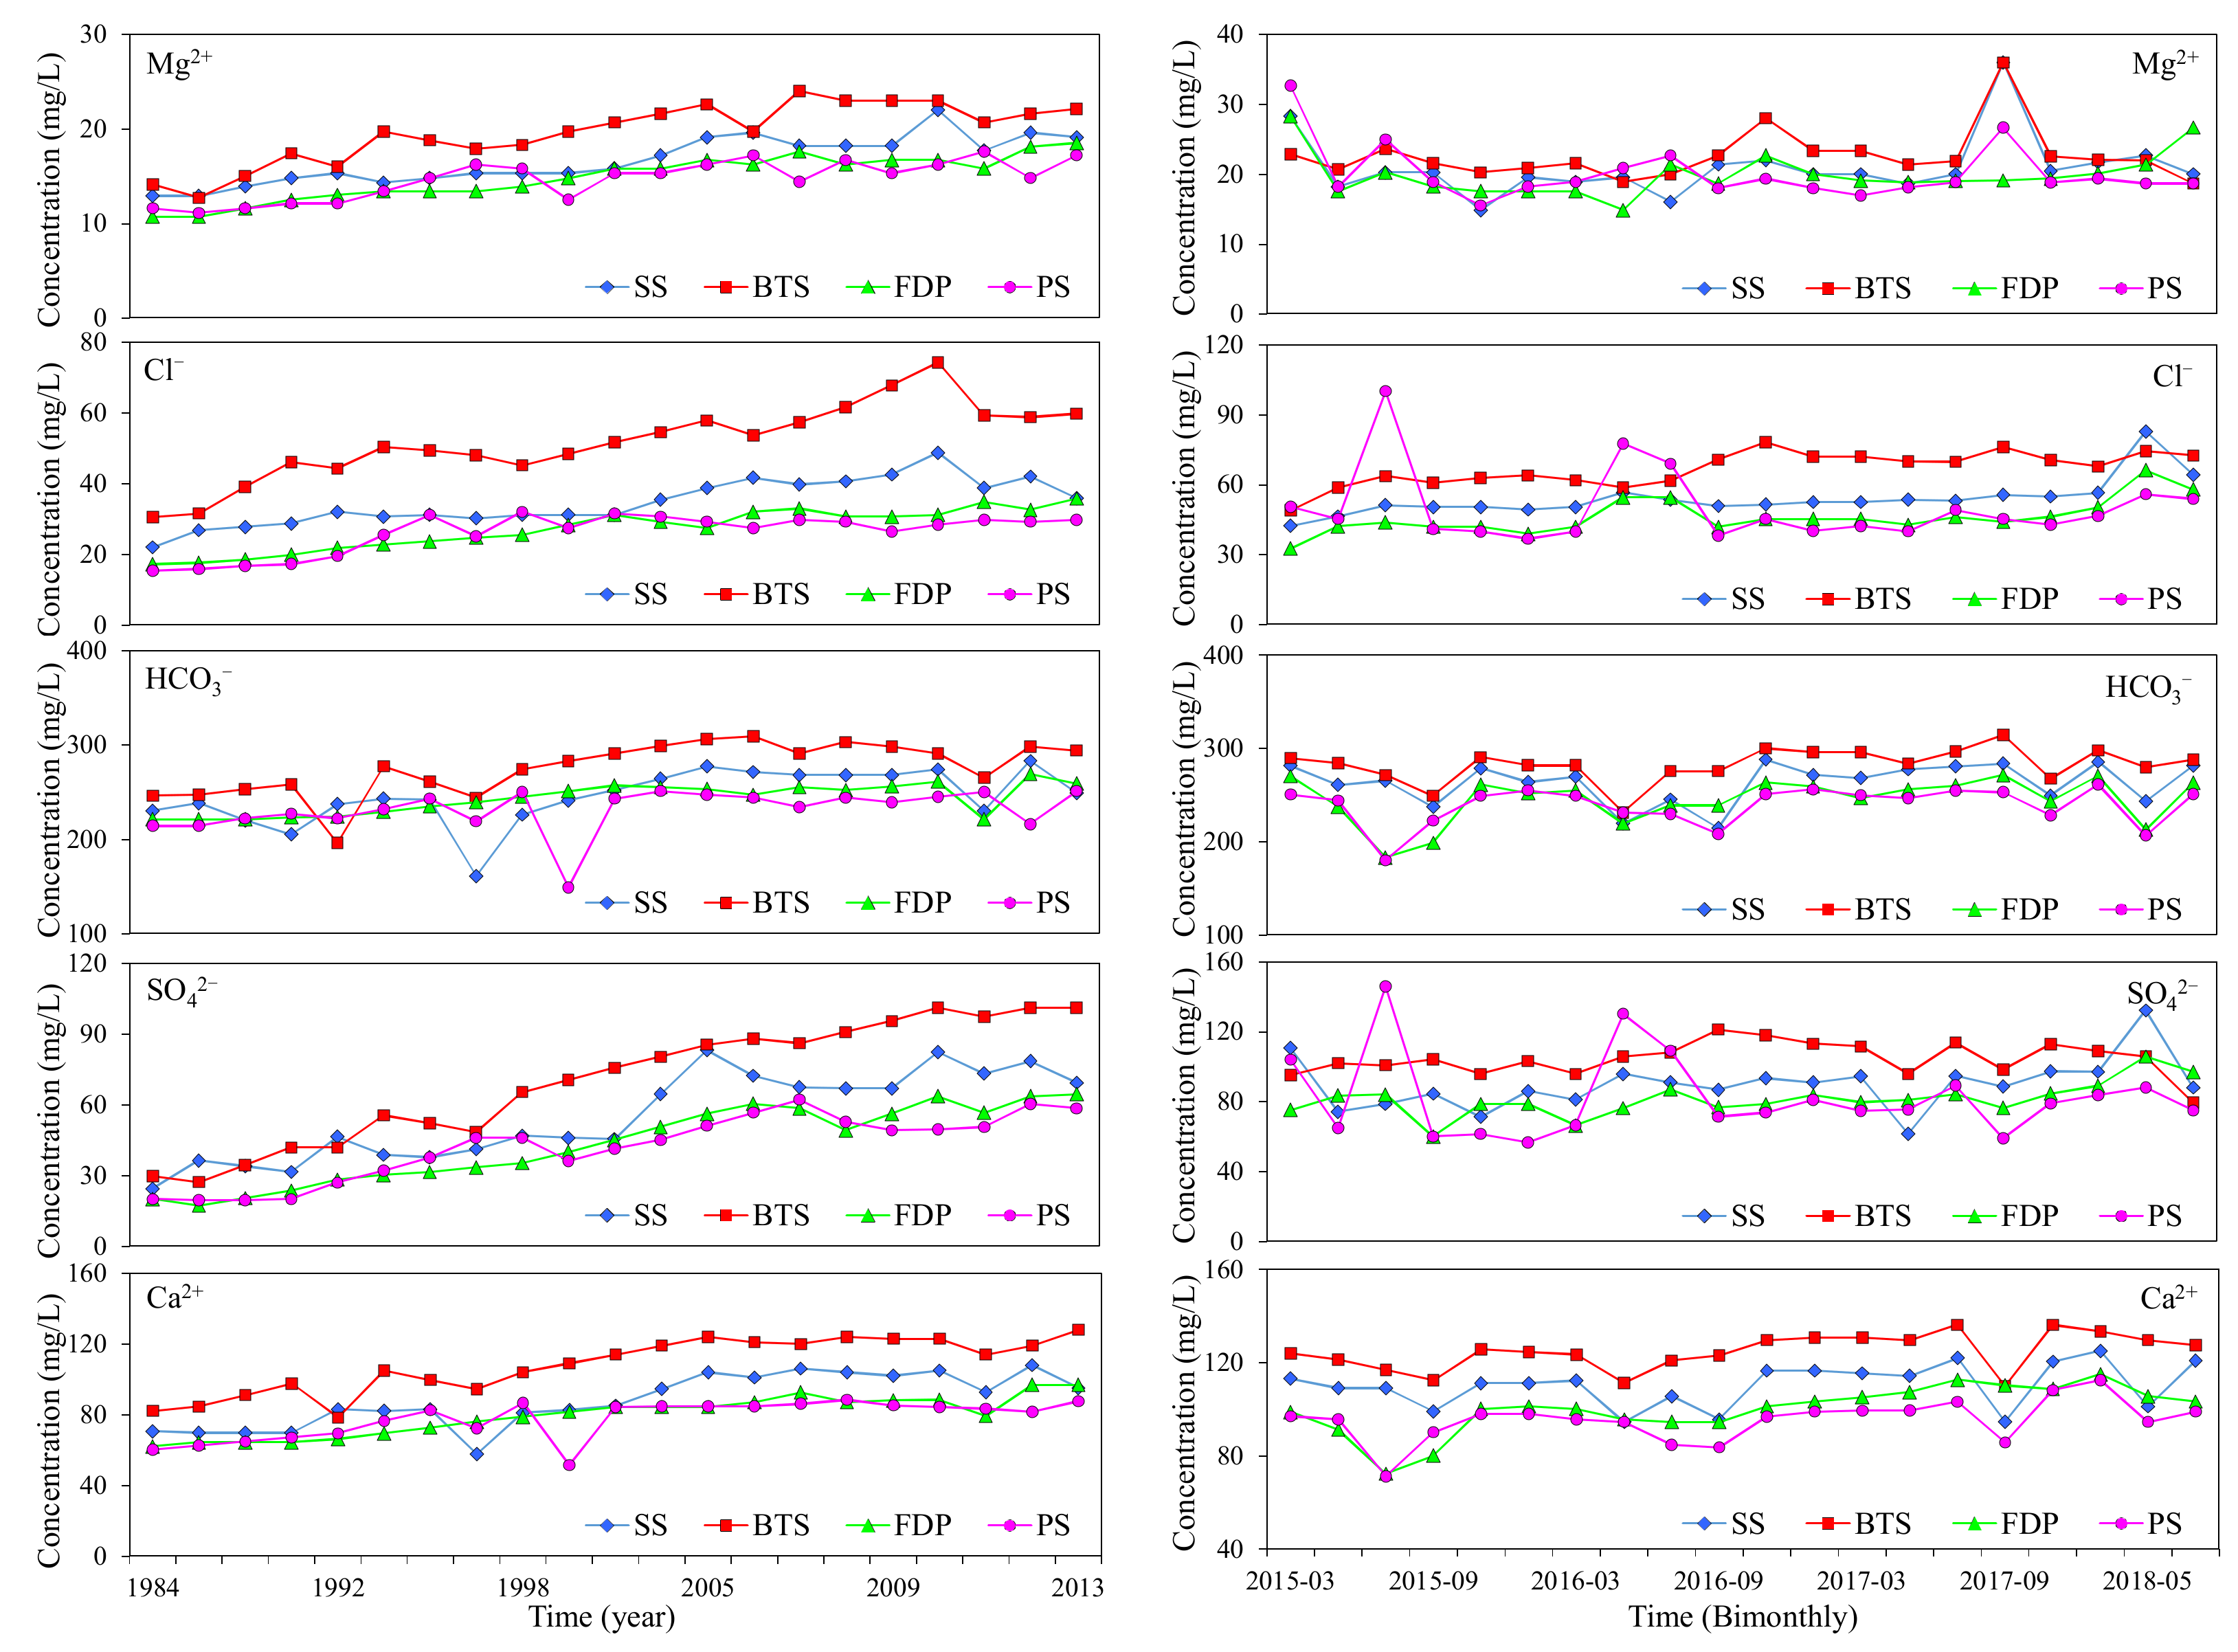
Based on the hydrochemical data of previous studies on the four spring groups and the data from this study, the temporal variations of spring water quality are discussed. Overall, significant changes are observed in the main ions in the spring water of the four spring groups from 1984 to 2013, with a continuously increasing trend. However, from 2015 to 2018, a relatively stable trend, with obvious fluctuations is observed in the main ions (Figure 9).
Regarding Mg2+, the concentration of Mg2+ in spring water of the four spring groups gradually increases, before 2006, while the growth rate slows down significantly, between 2006 and 2013. As for Cl−, overall, the Cl− content shows a gradual increase before 2010 and increase slowly after 2010 (Figure 9). The concentration of SO42− in spring water shows the characteristics of continuous increase. In addition, the concentration of SO42− in PS spring water has obvious fluctuations. Ca2+ content presents a gradual increase before 2005, followed by a slow increase. The contents of Na+ and Cl− in the four spring groups also show a slow upward trend, between 2015 and 2018.
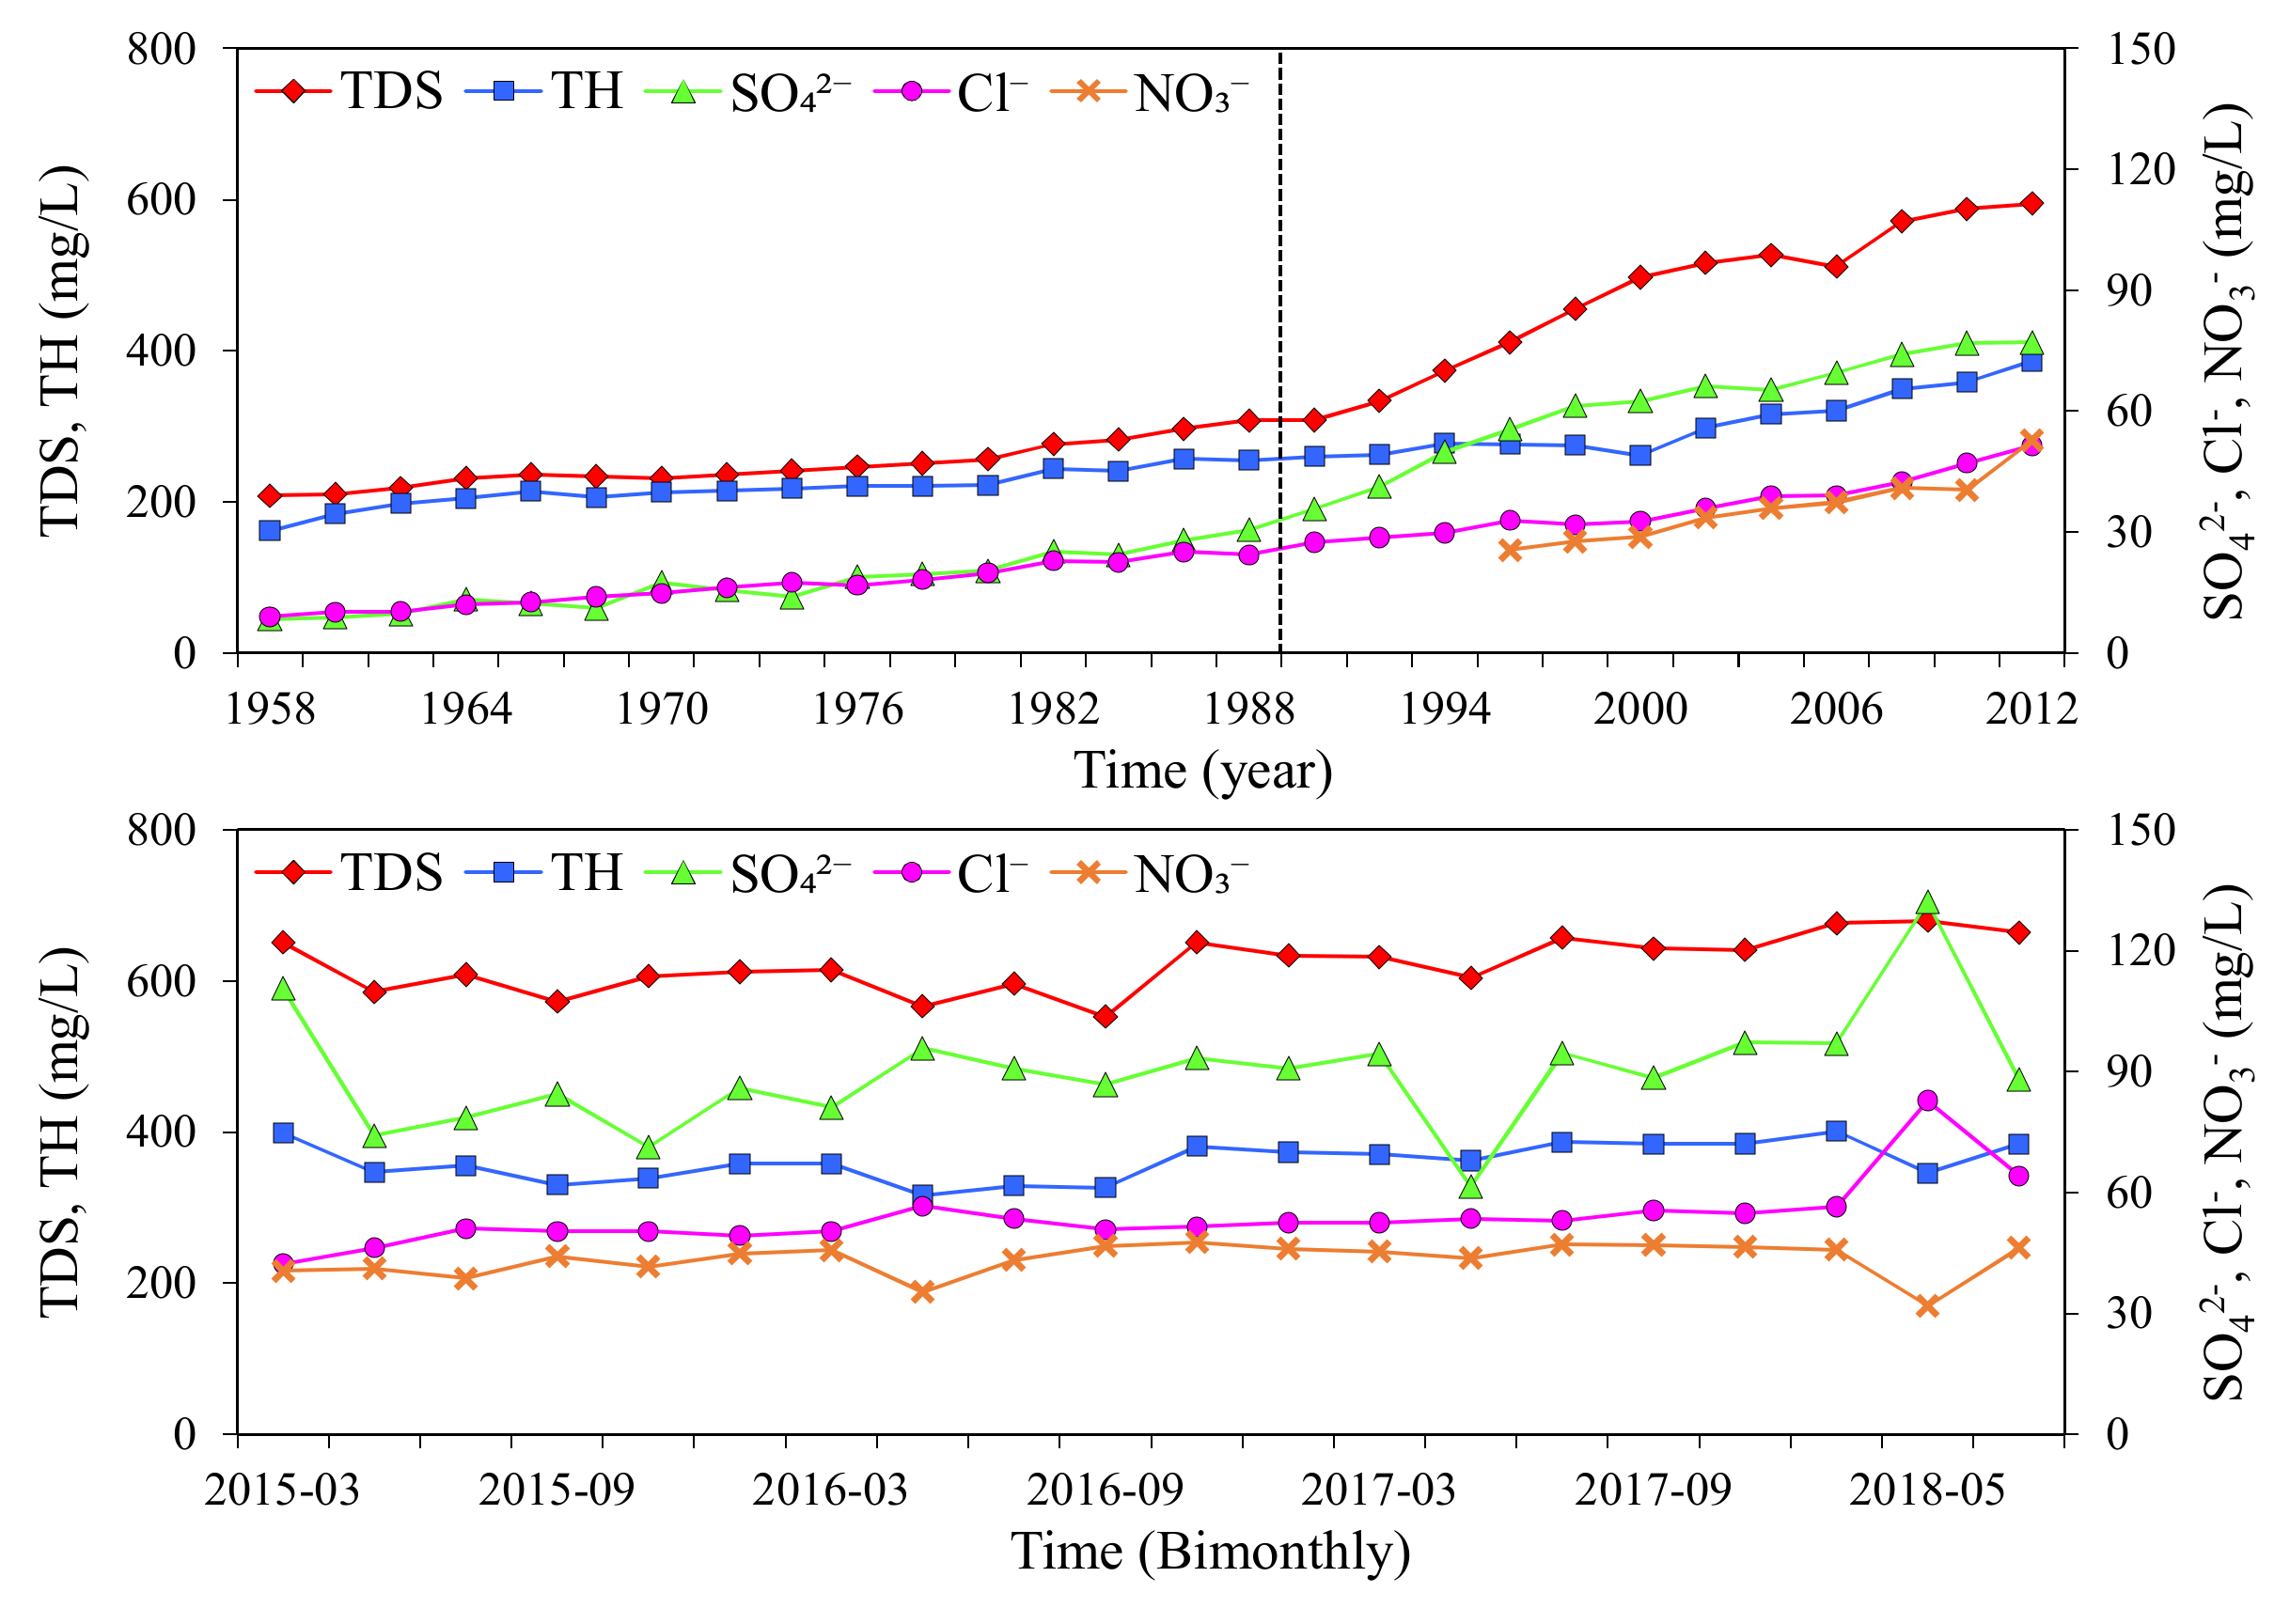
In addition, we gathered data on TDS, TH, SO42−, and Cl− in SS from 1958 to 2012, through previous studies [4]. Combined with the sampling data, collected in this study, we suggest the changes in the content of these chemical components in spring water from 1958 to 2012 can be divided into two stages (Figure 10). Before 1990, the content of each component is low, with a slow upward trend. From 1990 to 2012, the contents of each component in spring water increase, rapidly. However, the chemical composition of SS spring water is stable, from 2015 to 2018. The four spring groups are located in the urban area of Jinan, with a relatively close distance between the spring groups, suggesting the same source of recharge. Therefore, considering the chemical composition analysis of the SS, the chemical composition of the spring water of four spring groups from the 1960s to the present has experienced three phases of slow increase, increase, and stability.
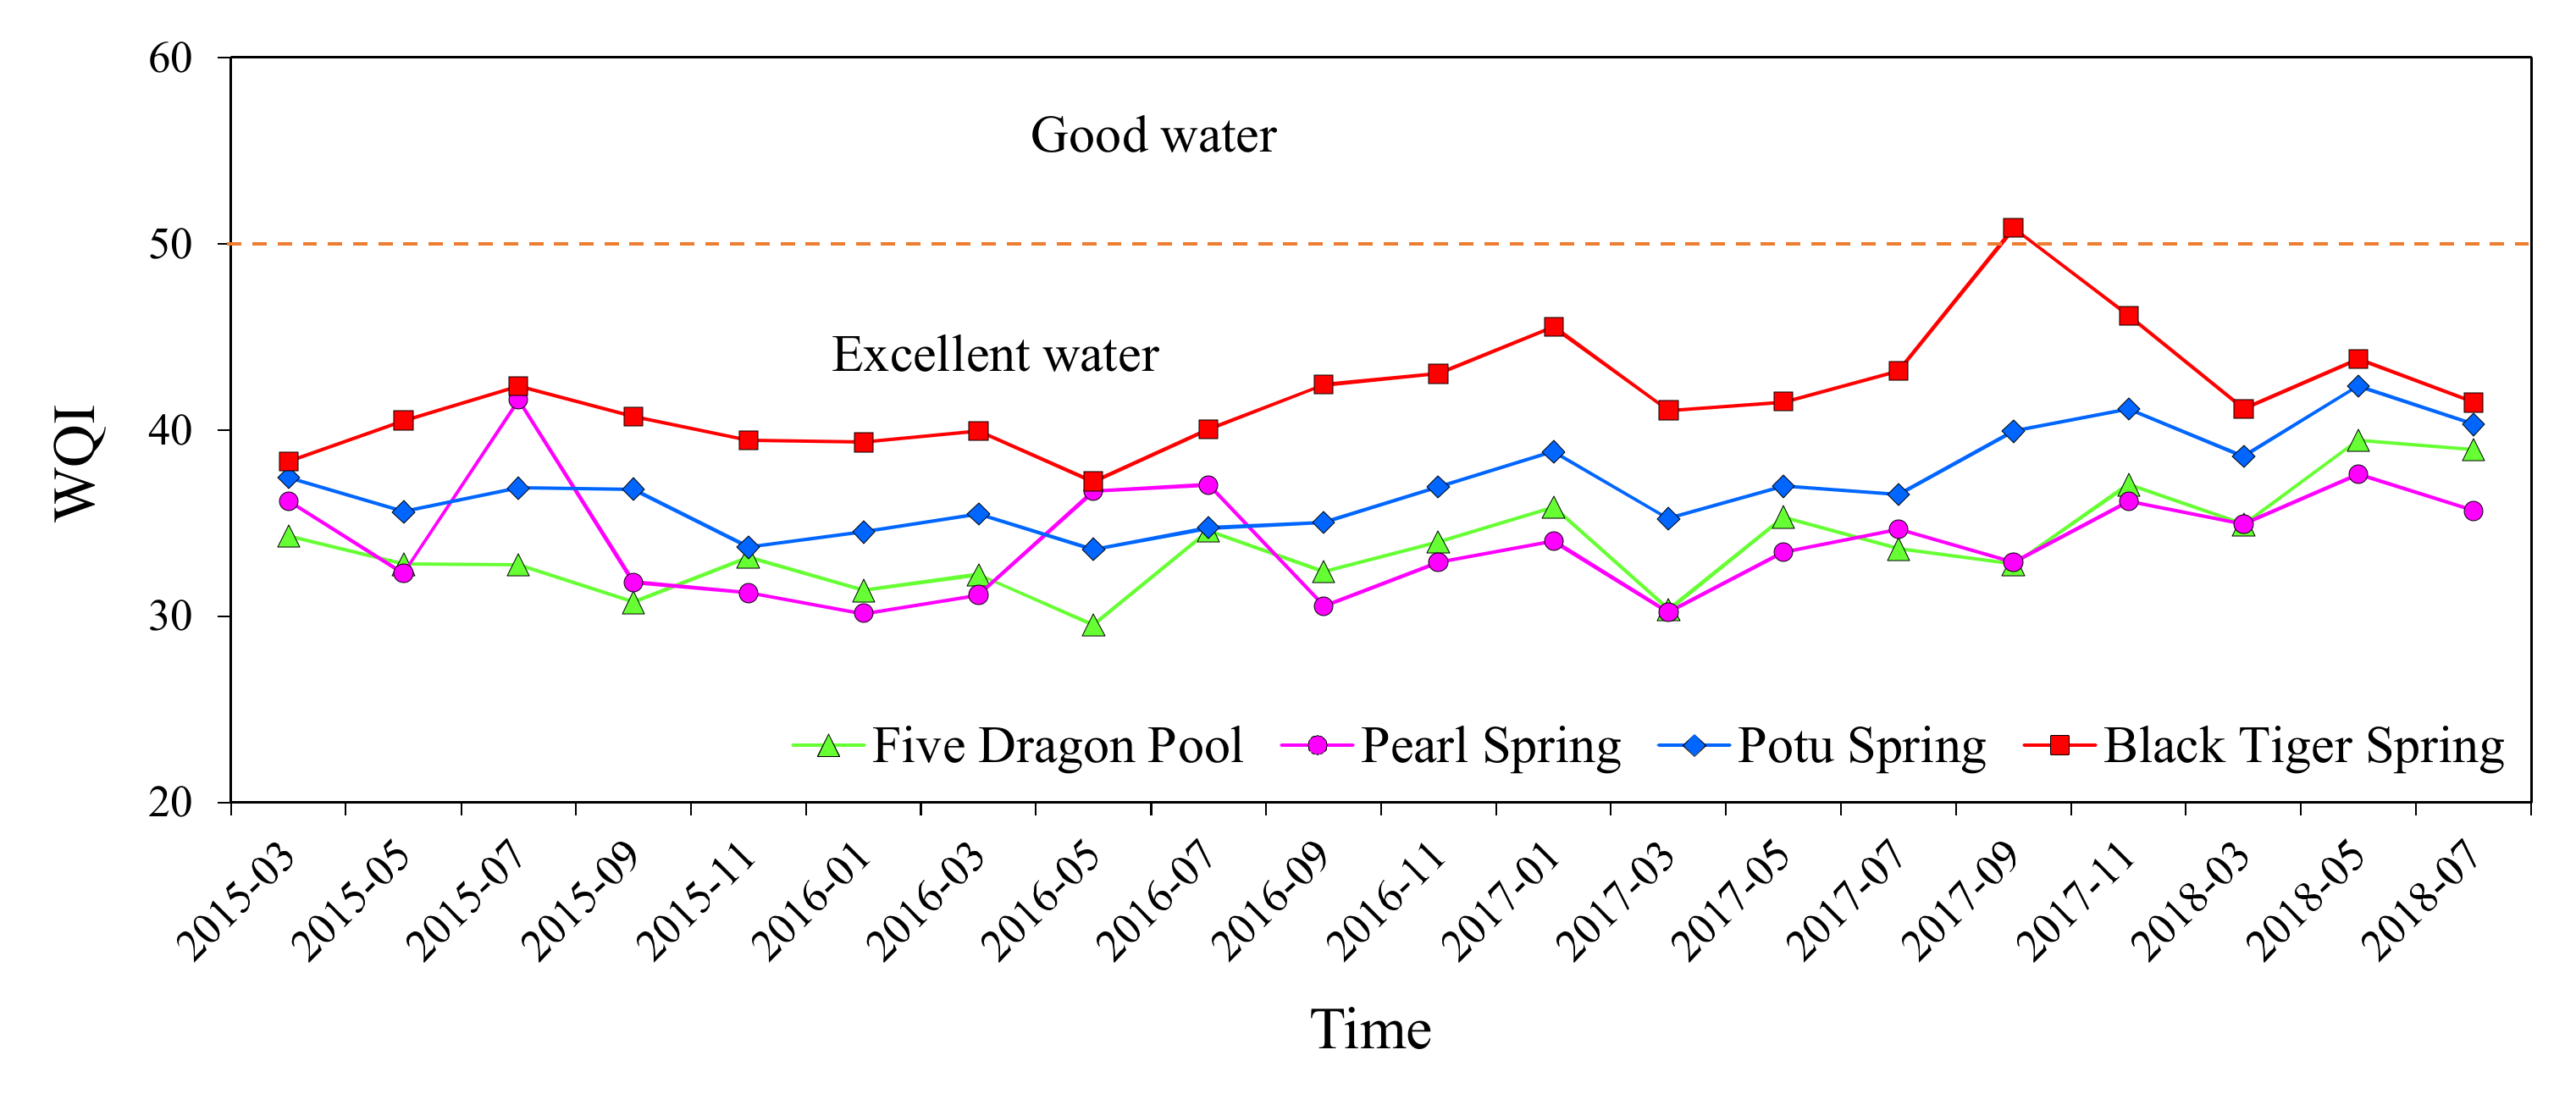
To better understand the water quality of the four spring groups in Jinan, considering the hydrochemical data from March 2015 to July 2018, 14 parameters (including K+, Na+, Ca2+, HCO3−, Mg2+, Cl−, SO42−, F−, NO2−, NO3−, TH, COD, TDS, and pH) are selected to evaluate the water quality of spring water, using WQI method [19,20,21]. The WQI values of spring water are calculated according to the flow chart, shown in Figure 2. The weight of each water quality parameter is determined, according to its relative importance (Table 3), before the evaluation.
Only one sample from the BTS site, collected in July 2017, shows a WQI value of more than 50 (Figure 11). The WQI values of FDP, PS, SS, and BTS are calculated, ranging from 29.54 to 39.46, 30.15 to 41.62, 33.60 to 2.38, and 37.23 to 50.84, respectively, with average values of 33.82, 34.07, 37.04, and 41.91, respectively, indicating excellent spring water quality in all four sites.
4.6. Temporal Variations of Spring Water Discharge
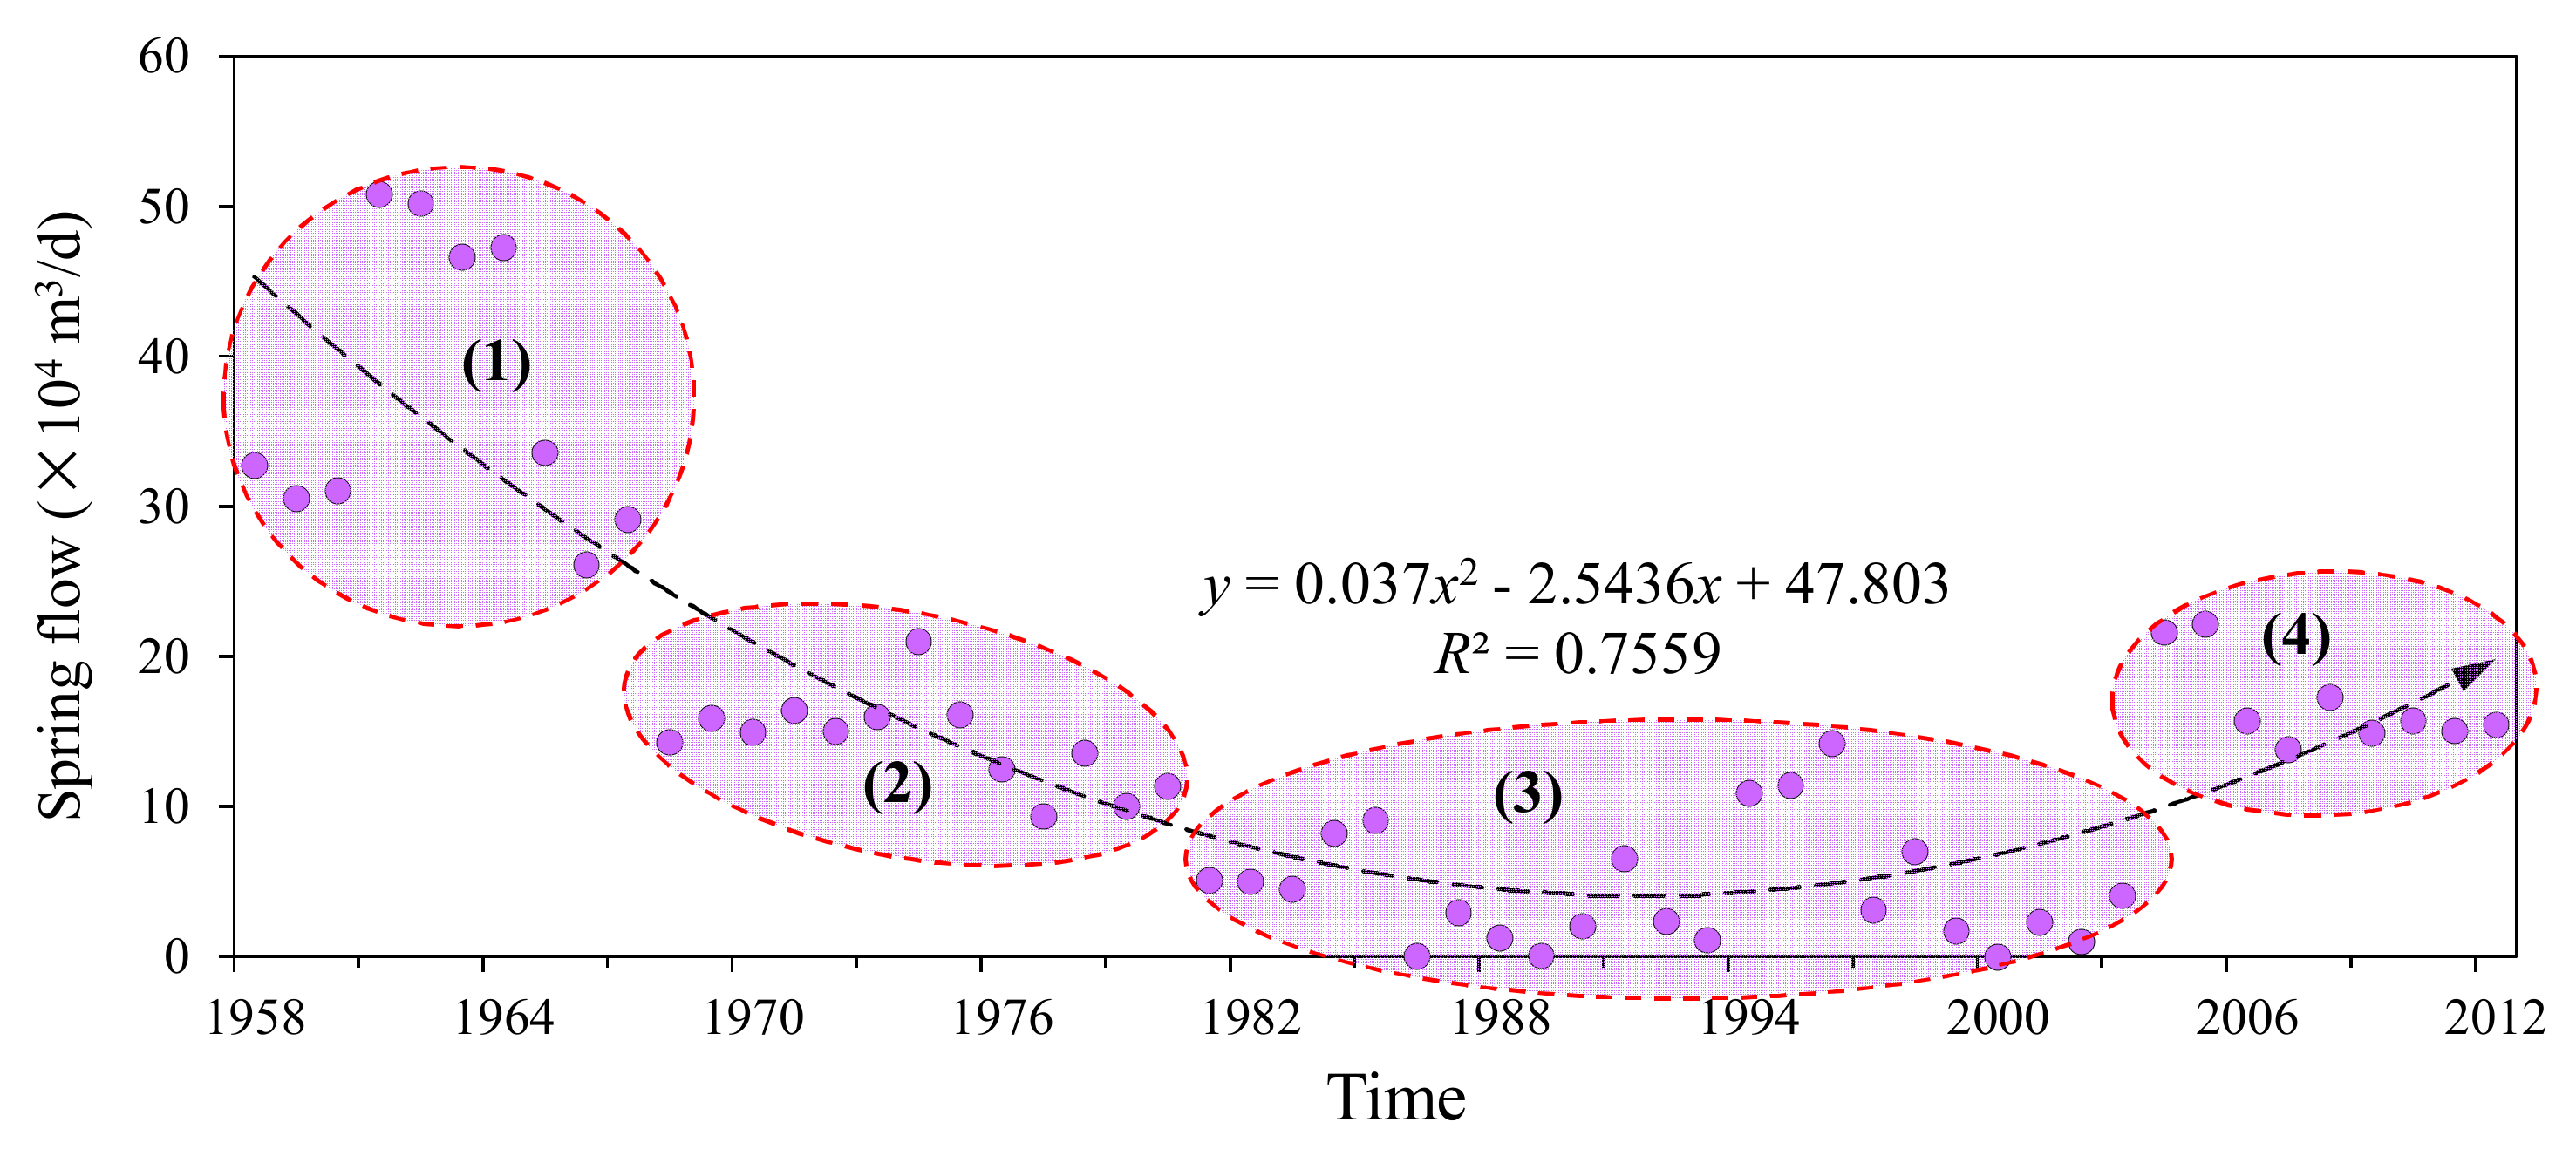
From 1958 to 2012, the spring water flow in Jinan has changed continuously, showing four different stages (Figure 12), as follows:
- 1.
- Natural flowing stage (1958–1967)
The ratio of karst water exploitation to spring water self-discharge is less than 1:2. In this period, the average discharge of spring is 3.67 × 10⁵ m3/d, and the karst water level is between 28.75 m and 31.86 m. From 1962 to 1964, with high precipitation, the exploitation of karst water is less than 1.65 × 10⁵ m3/d, the water level is stable at 31.54–31.86 m, and the total discharge of spring group is maintained at 4.66–5.02 × 10⁵ m3/d.
- 2.
- Flowing transitional stage (1968–1980)
The exploitation of karst water in spring area has increased from 2.99 × 10⁵ to 6.49 × 10⁵ m3/d, with a decrease in the flow of spring water from 1.43 × 10⁵ to 9.39 × 10⁴ m3/d. In this period, some springs are temporarily cut off.
- 3.
- Flowing decline stage (1981–2002)
After 1980, the exploitation of karst groundwater in Jinan continues to increase, with a gradual decrease in the spring water flow. The annual average spring water flow is less than 1.30 × 10⁵ m3/d. The spring water shows an intermittent stop in flow, for 3 to 8 months.
- 4.
- Flowing recovery stage (2003–2012)
Since 2003, the exploitation of groundwater has been completely banned in the urban area of Jinan and spring water has begun to flow. Based on metrological data, high precipitation is observed from 2004 to 2012. The average spring water flow is about 1.60 × 10⁵ m3/d with a maximum of 2.22 × 10⁵ m3/d in 2005.
4.7. Influencing Factors of Spring Water DynamicsF
4.7.1. Influencing Factors of Spring Water Quality
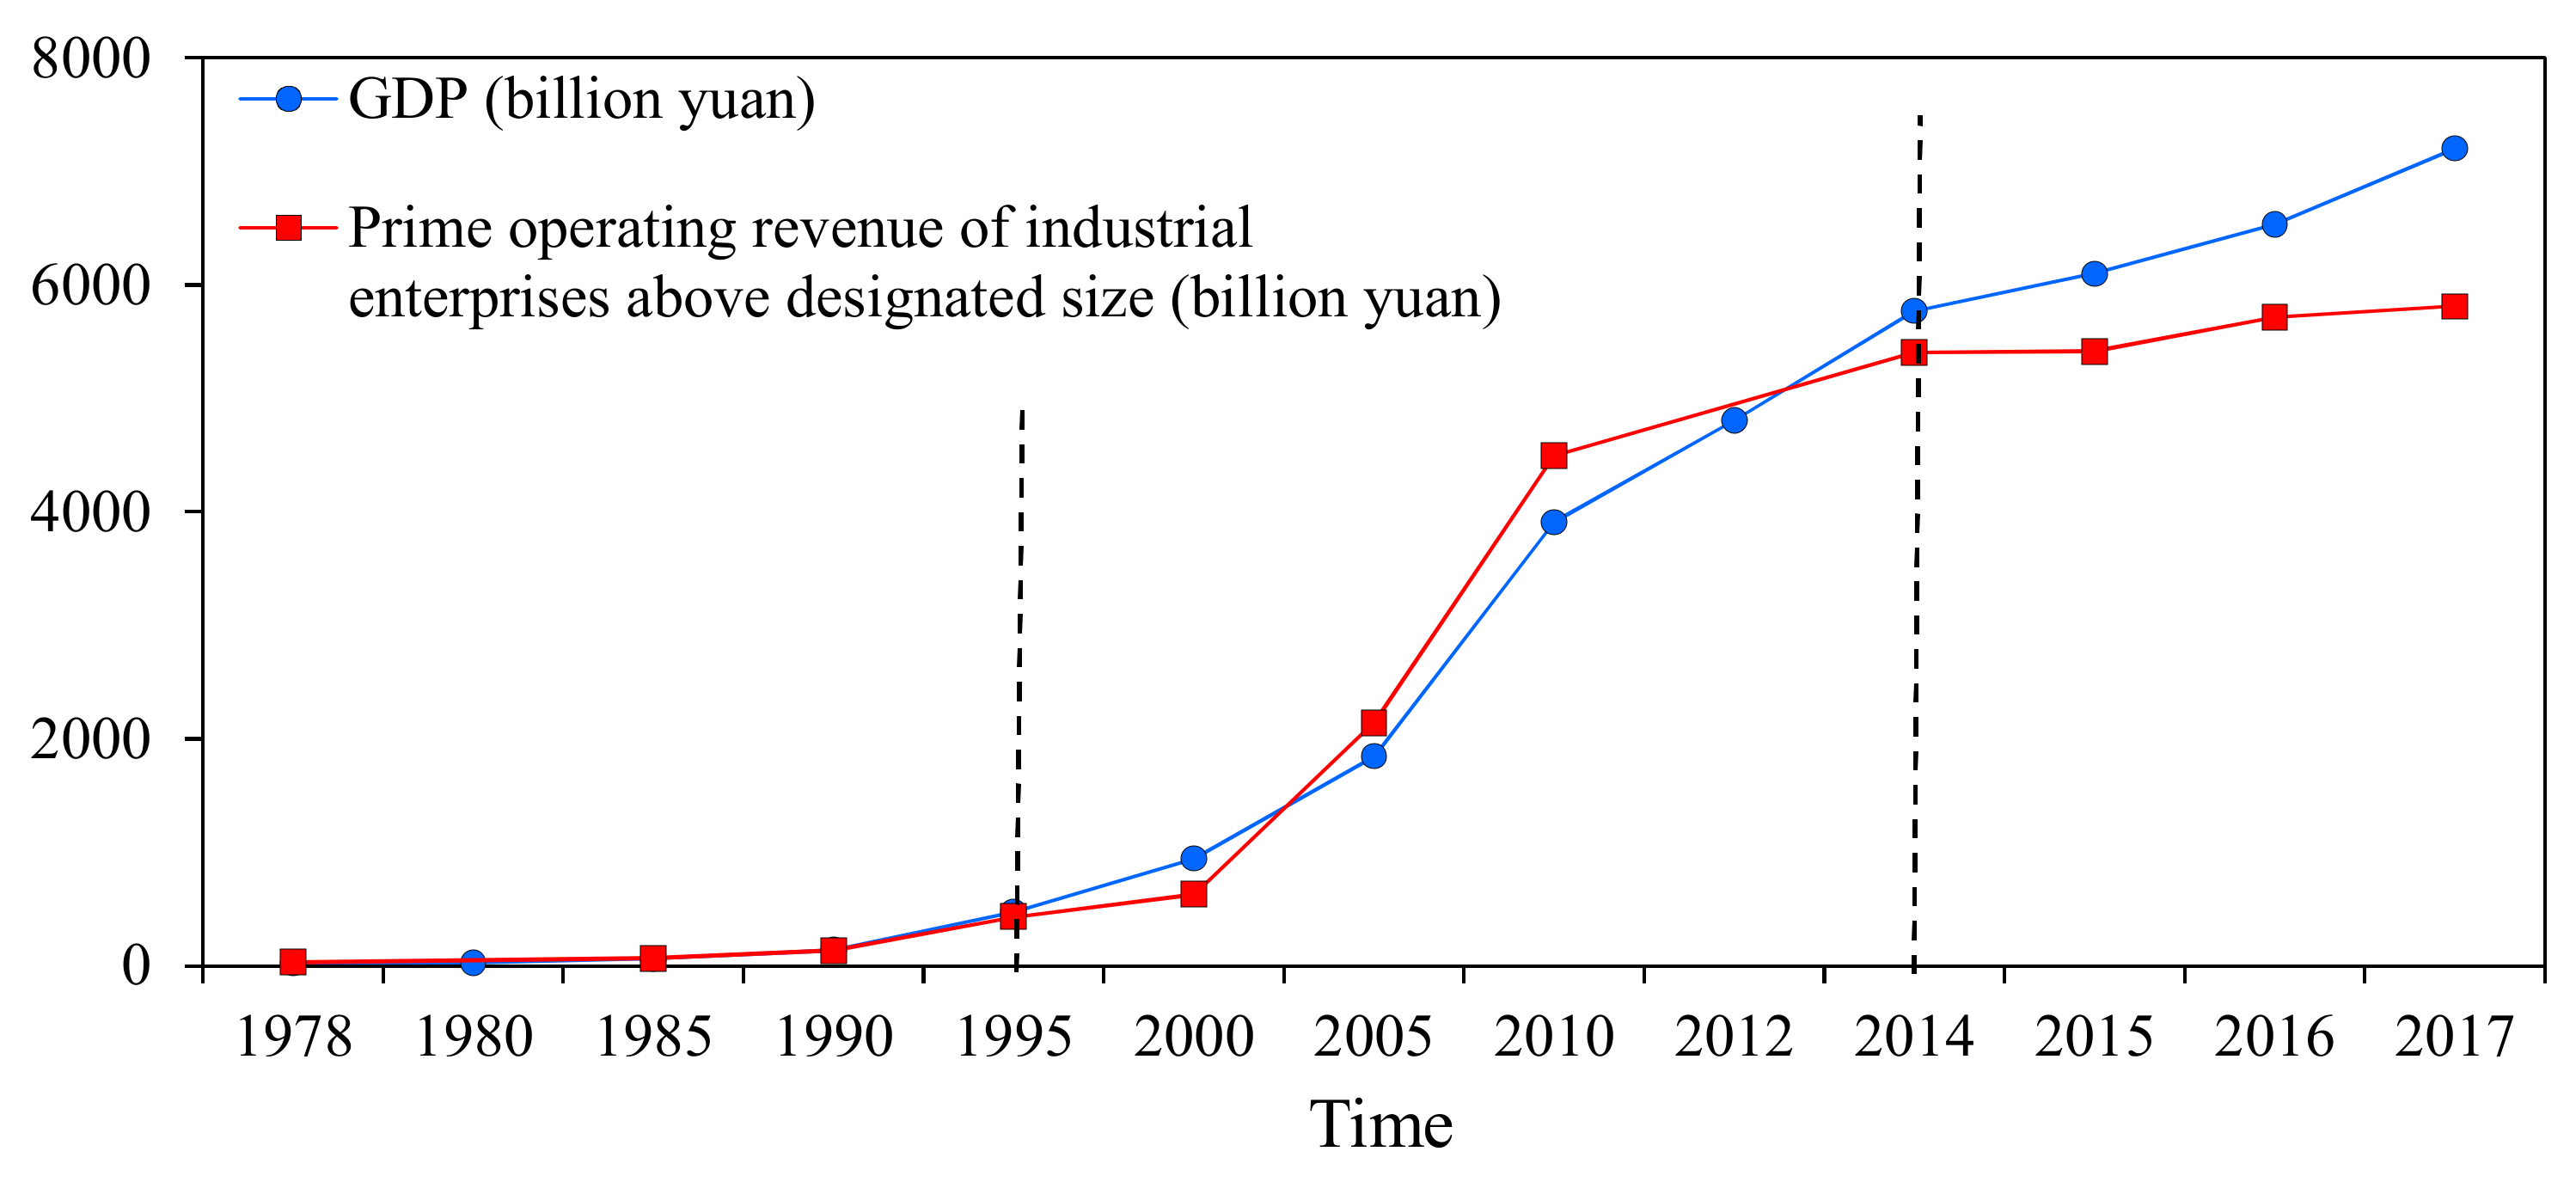
As the Jinan spring groups are located in the urban area of Jinan, their runoff area and direct supply area are mostly urban built-up areas [8]. The rapid development of the economy has resulted in stronger and more intensive human activities, which has put tremendous pressure on the groundwater environment. Therefore, the variation of chemical characteristics of spring water in Jinan is closely related to the intensity of human activities [6]. As shown in Figure 13, since the 1980s, the gross domestic product (GDP) and the prime operating revenue of industrial enterprises, above designated size in Jinan, have been divided into three stages including slow growth, rapid growth, and growth. This corresponds to the temporal variation of chemical components in spring water, indicating that human activities are the main factor, affecting the chemical variation characteristics of spring water in Jinan. In addition, excessive exploitation of groundwater and changes in land-use patterns have changed the dynamic conditions of groundwater, accelerating the transportation of pollutions from contaminated rivers and sewage to groundwater, hence affecting the quality of spring water.
4.7.2. Influencing Factors of Spring Water Flow
The influencing factors of spring water flow in Jinan are including the recharge conditions, precipitation, and groundwater exploitation.
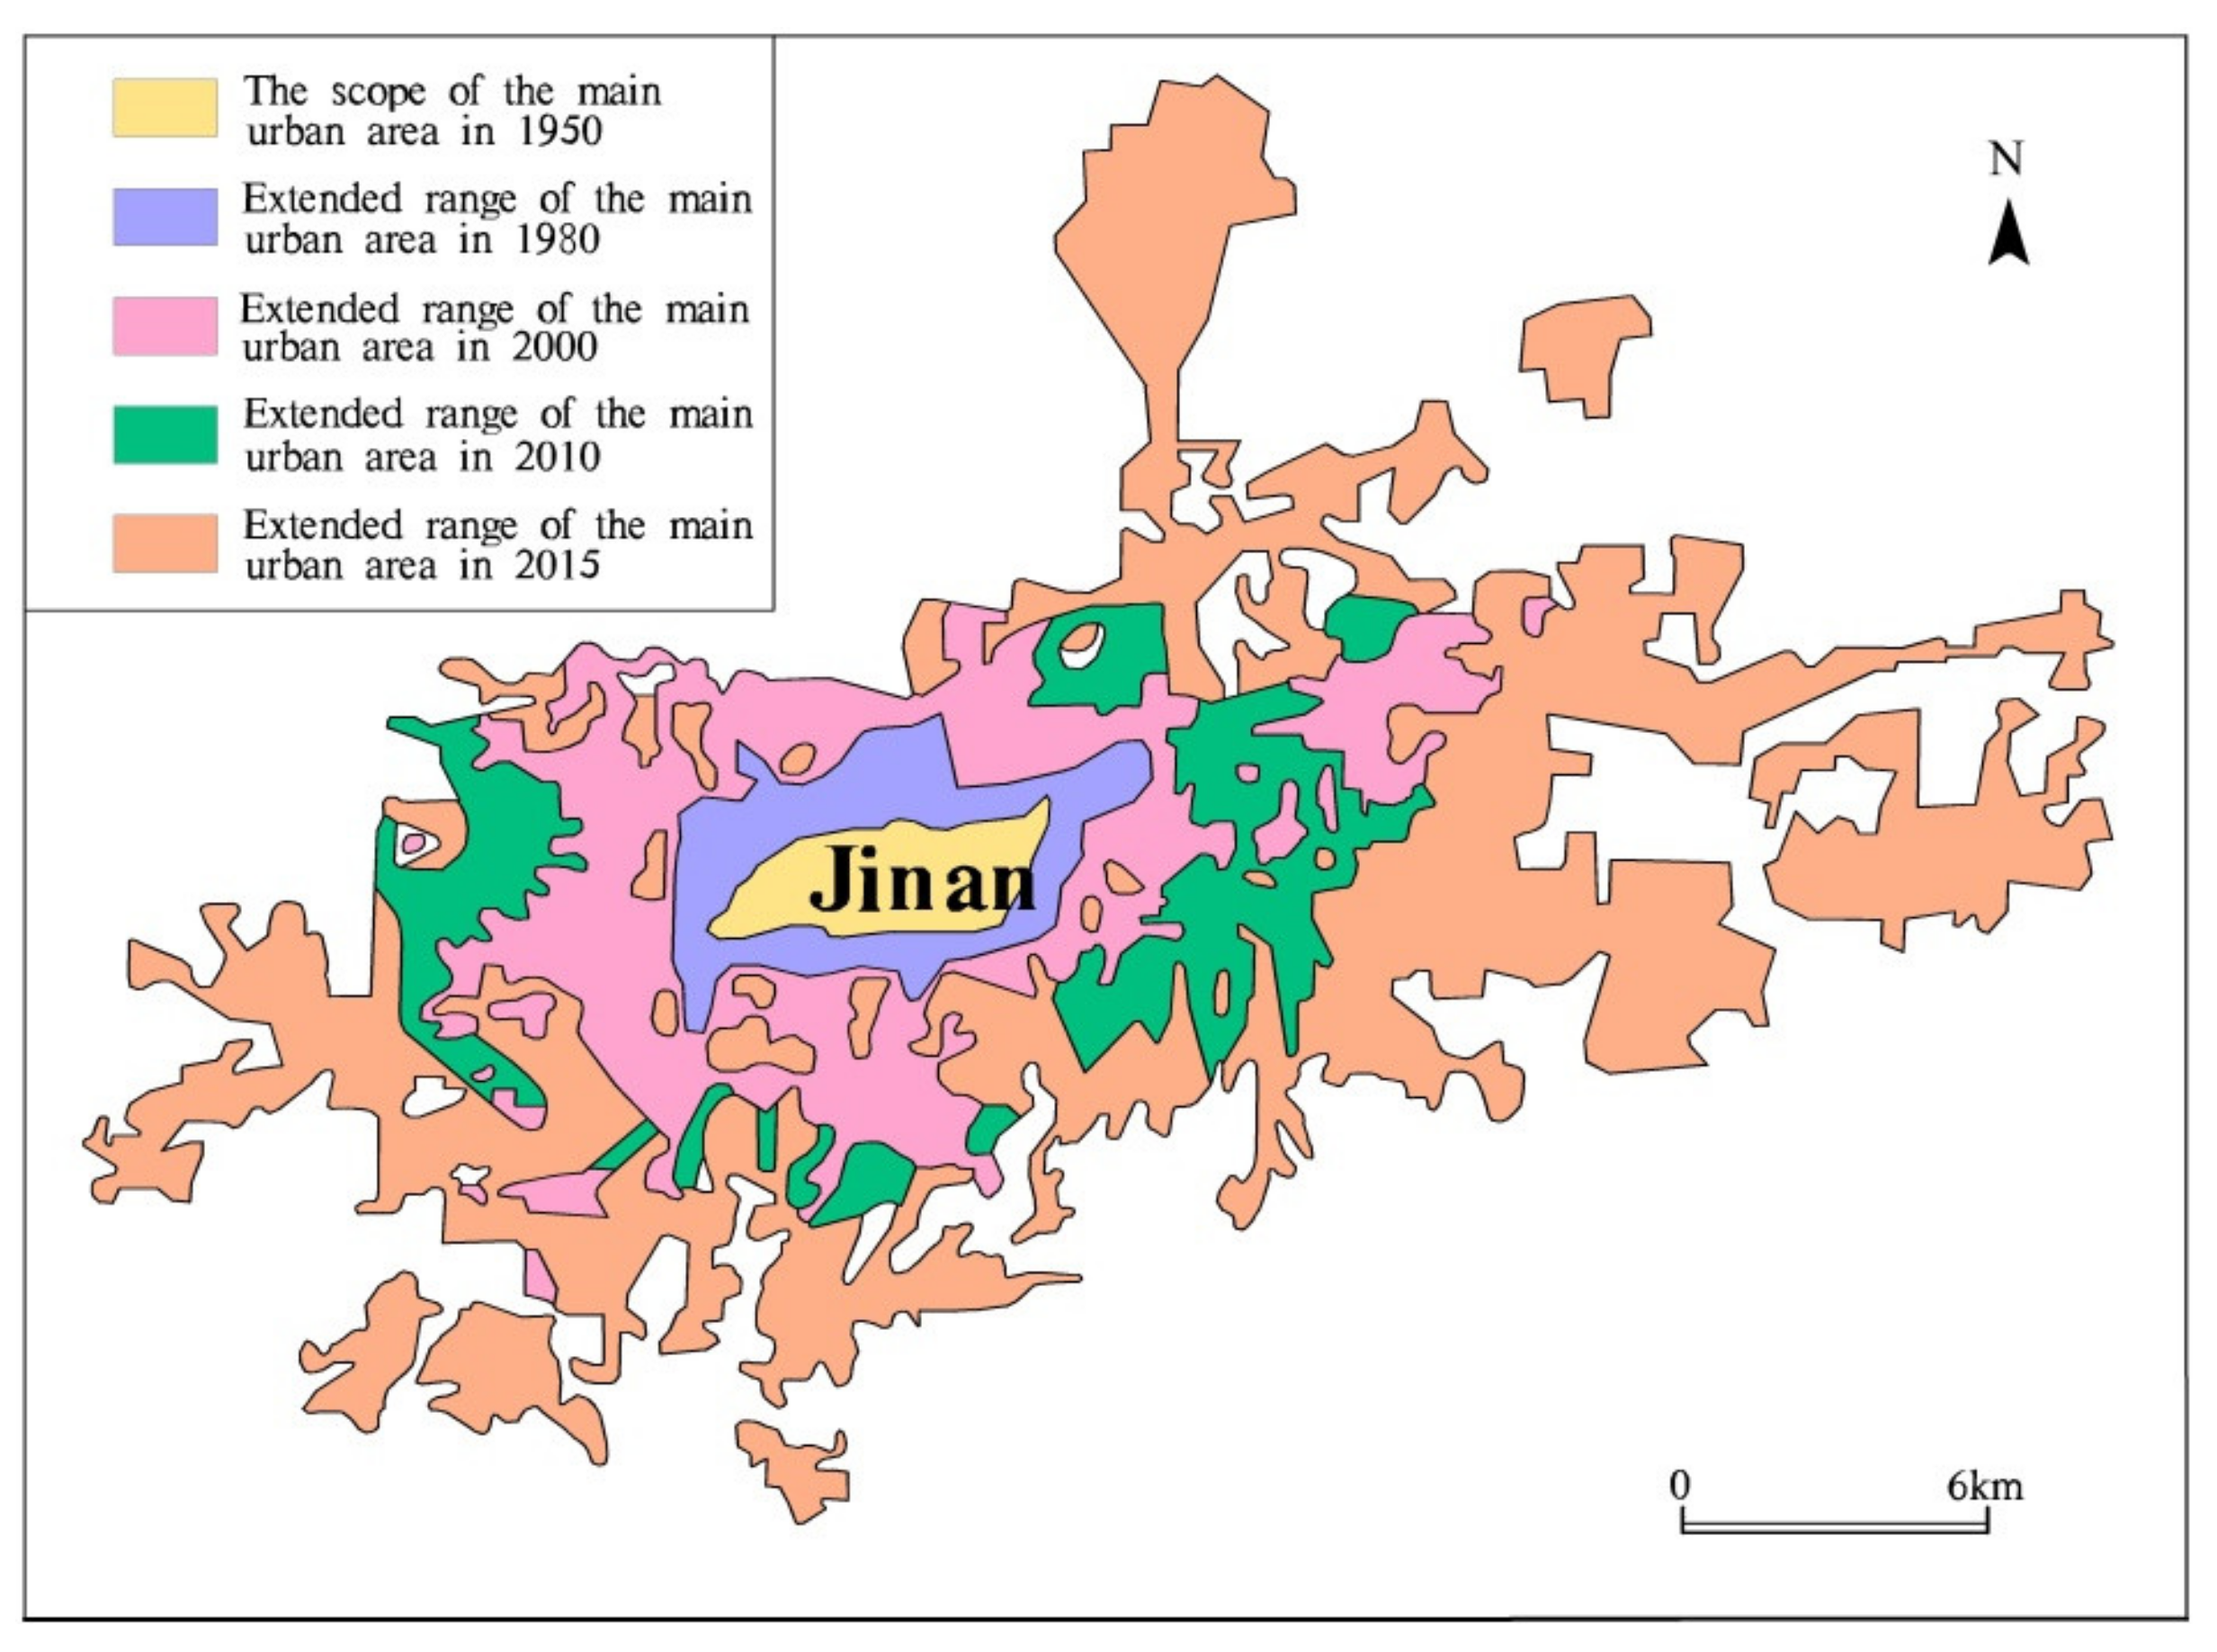
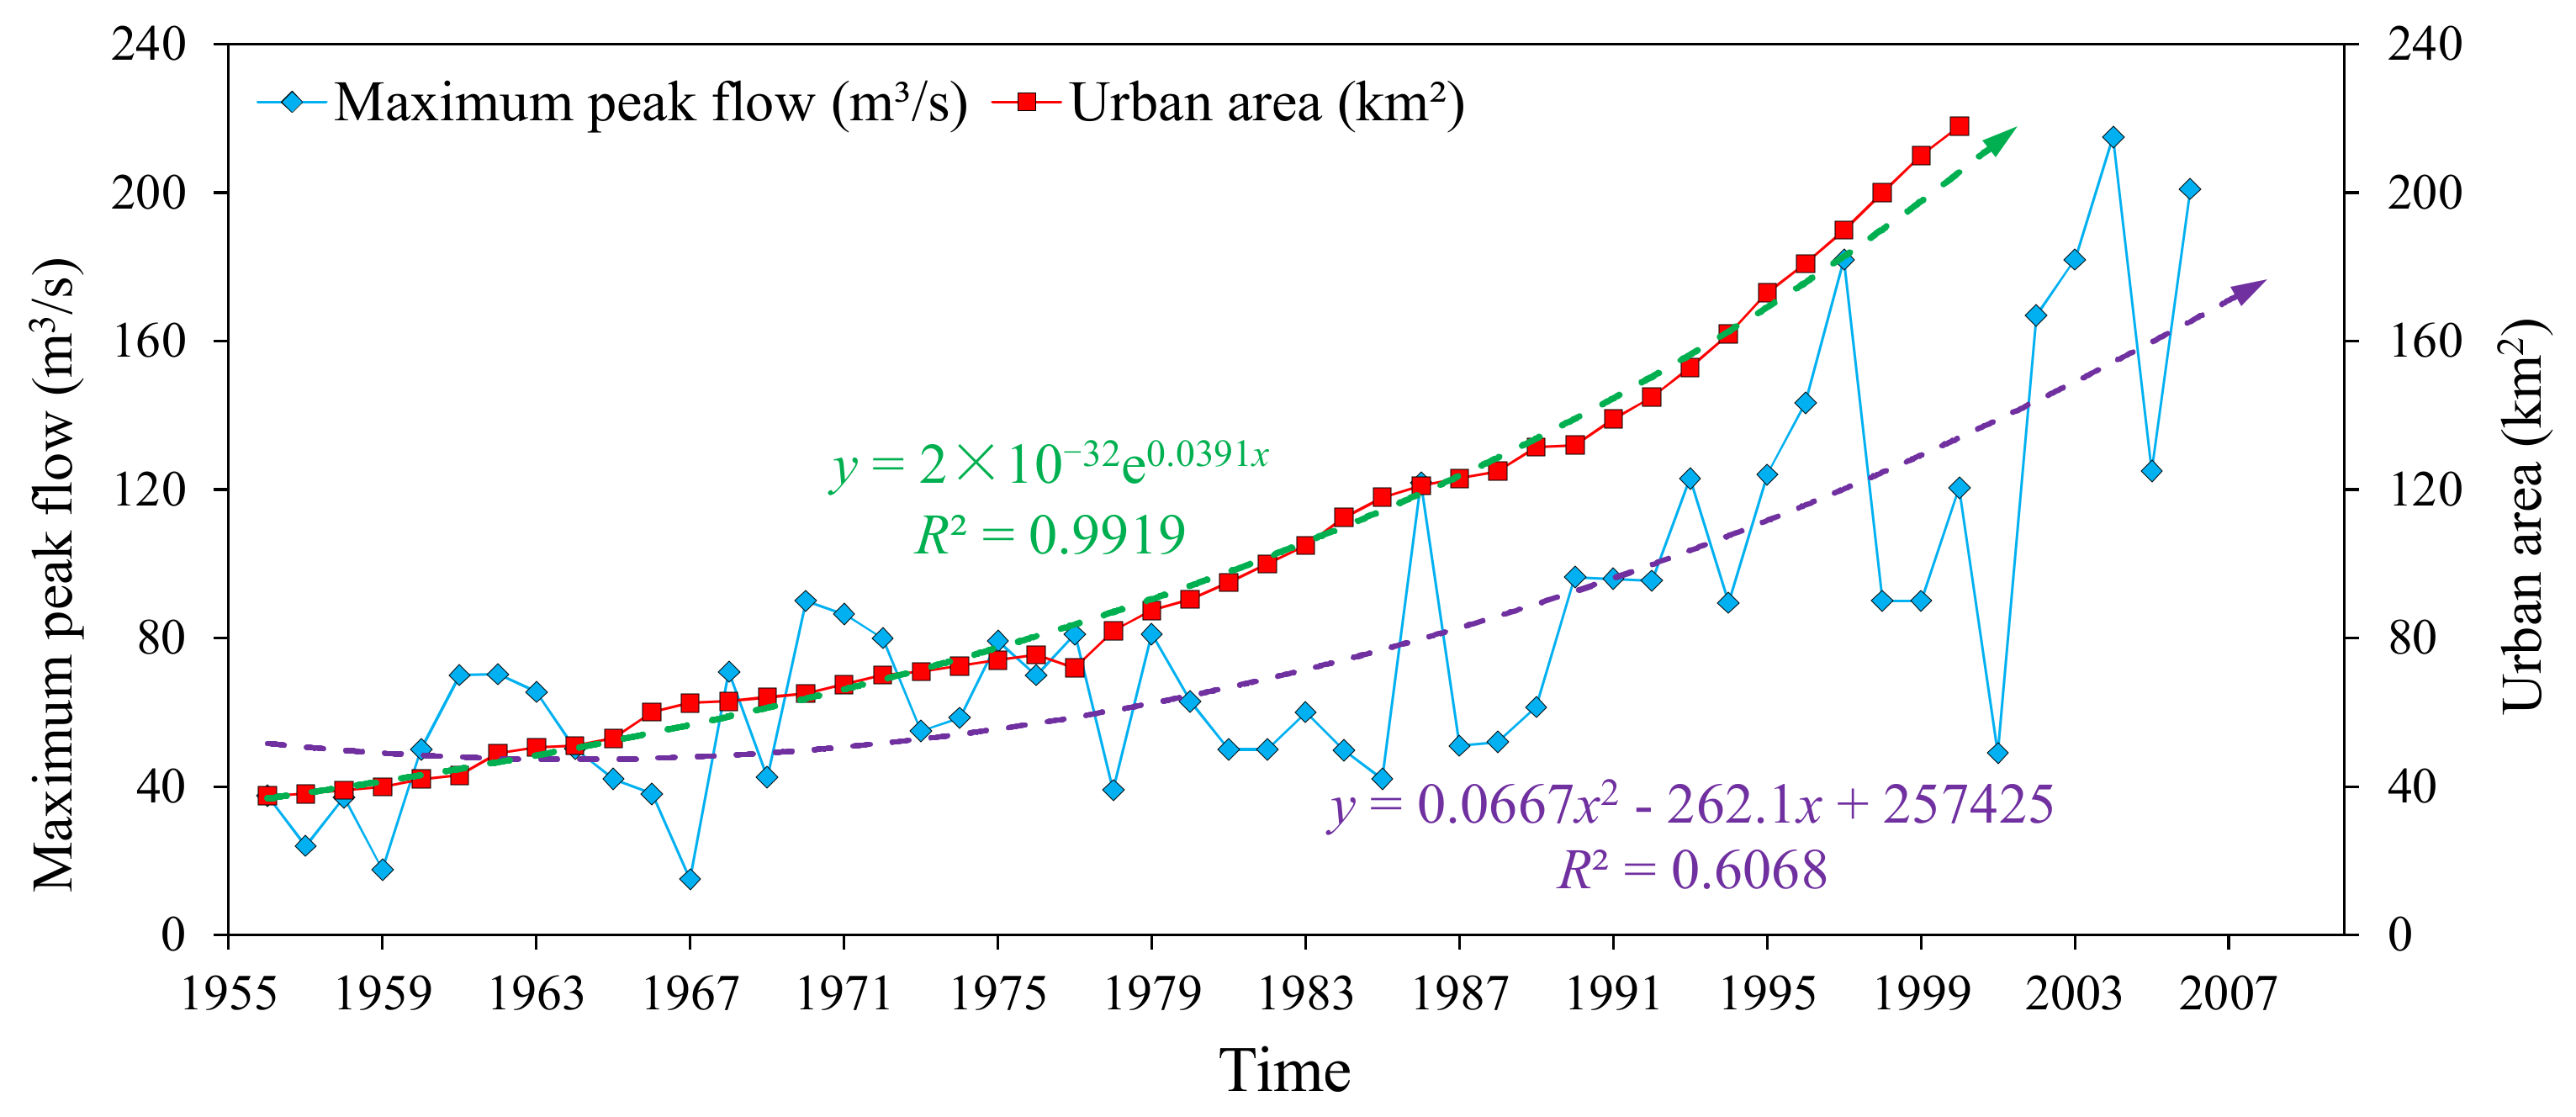
Restricting by the Yellow River, from the north, hinders the urban development in Jinan City in the northern area. Since the founding of New China, urban construction has rapidly developed and the urban area has grown from 23 km2 in the 1950s to more than 500 km2 in 2015 (Figure 14). The development direction of Jinan is to the east and south. Considering that the eastern and southern mountainous areas are the recharge areas of Jinan karst water and Jinan spring groups [8], urban development has resulted in a serious reduction of the effective recharge area of the spring water, which on the one hand reduces the amount of precipitation infiltration recharge spring water, and on the other hand increases the peak flow in the flood season (take the Xiaoqing River Basin as an example, Figure 15).
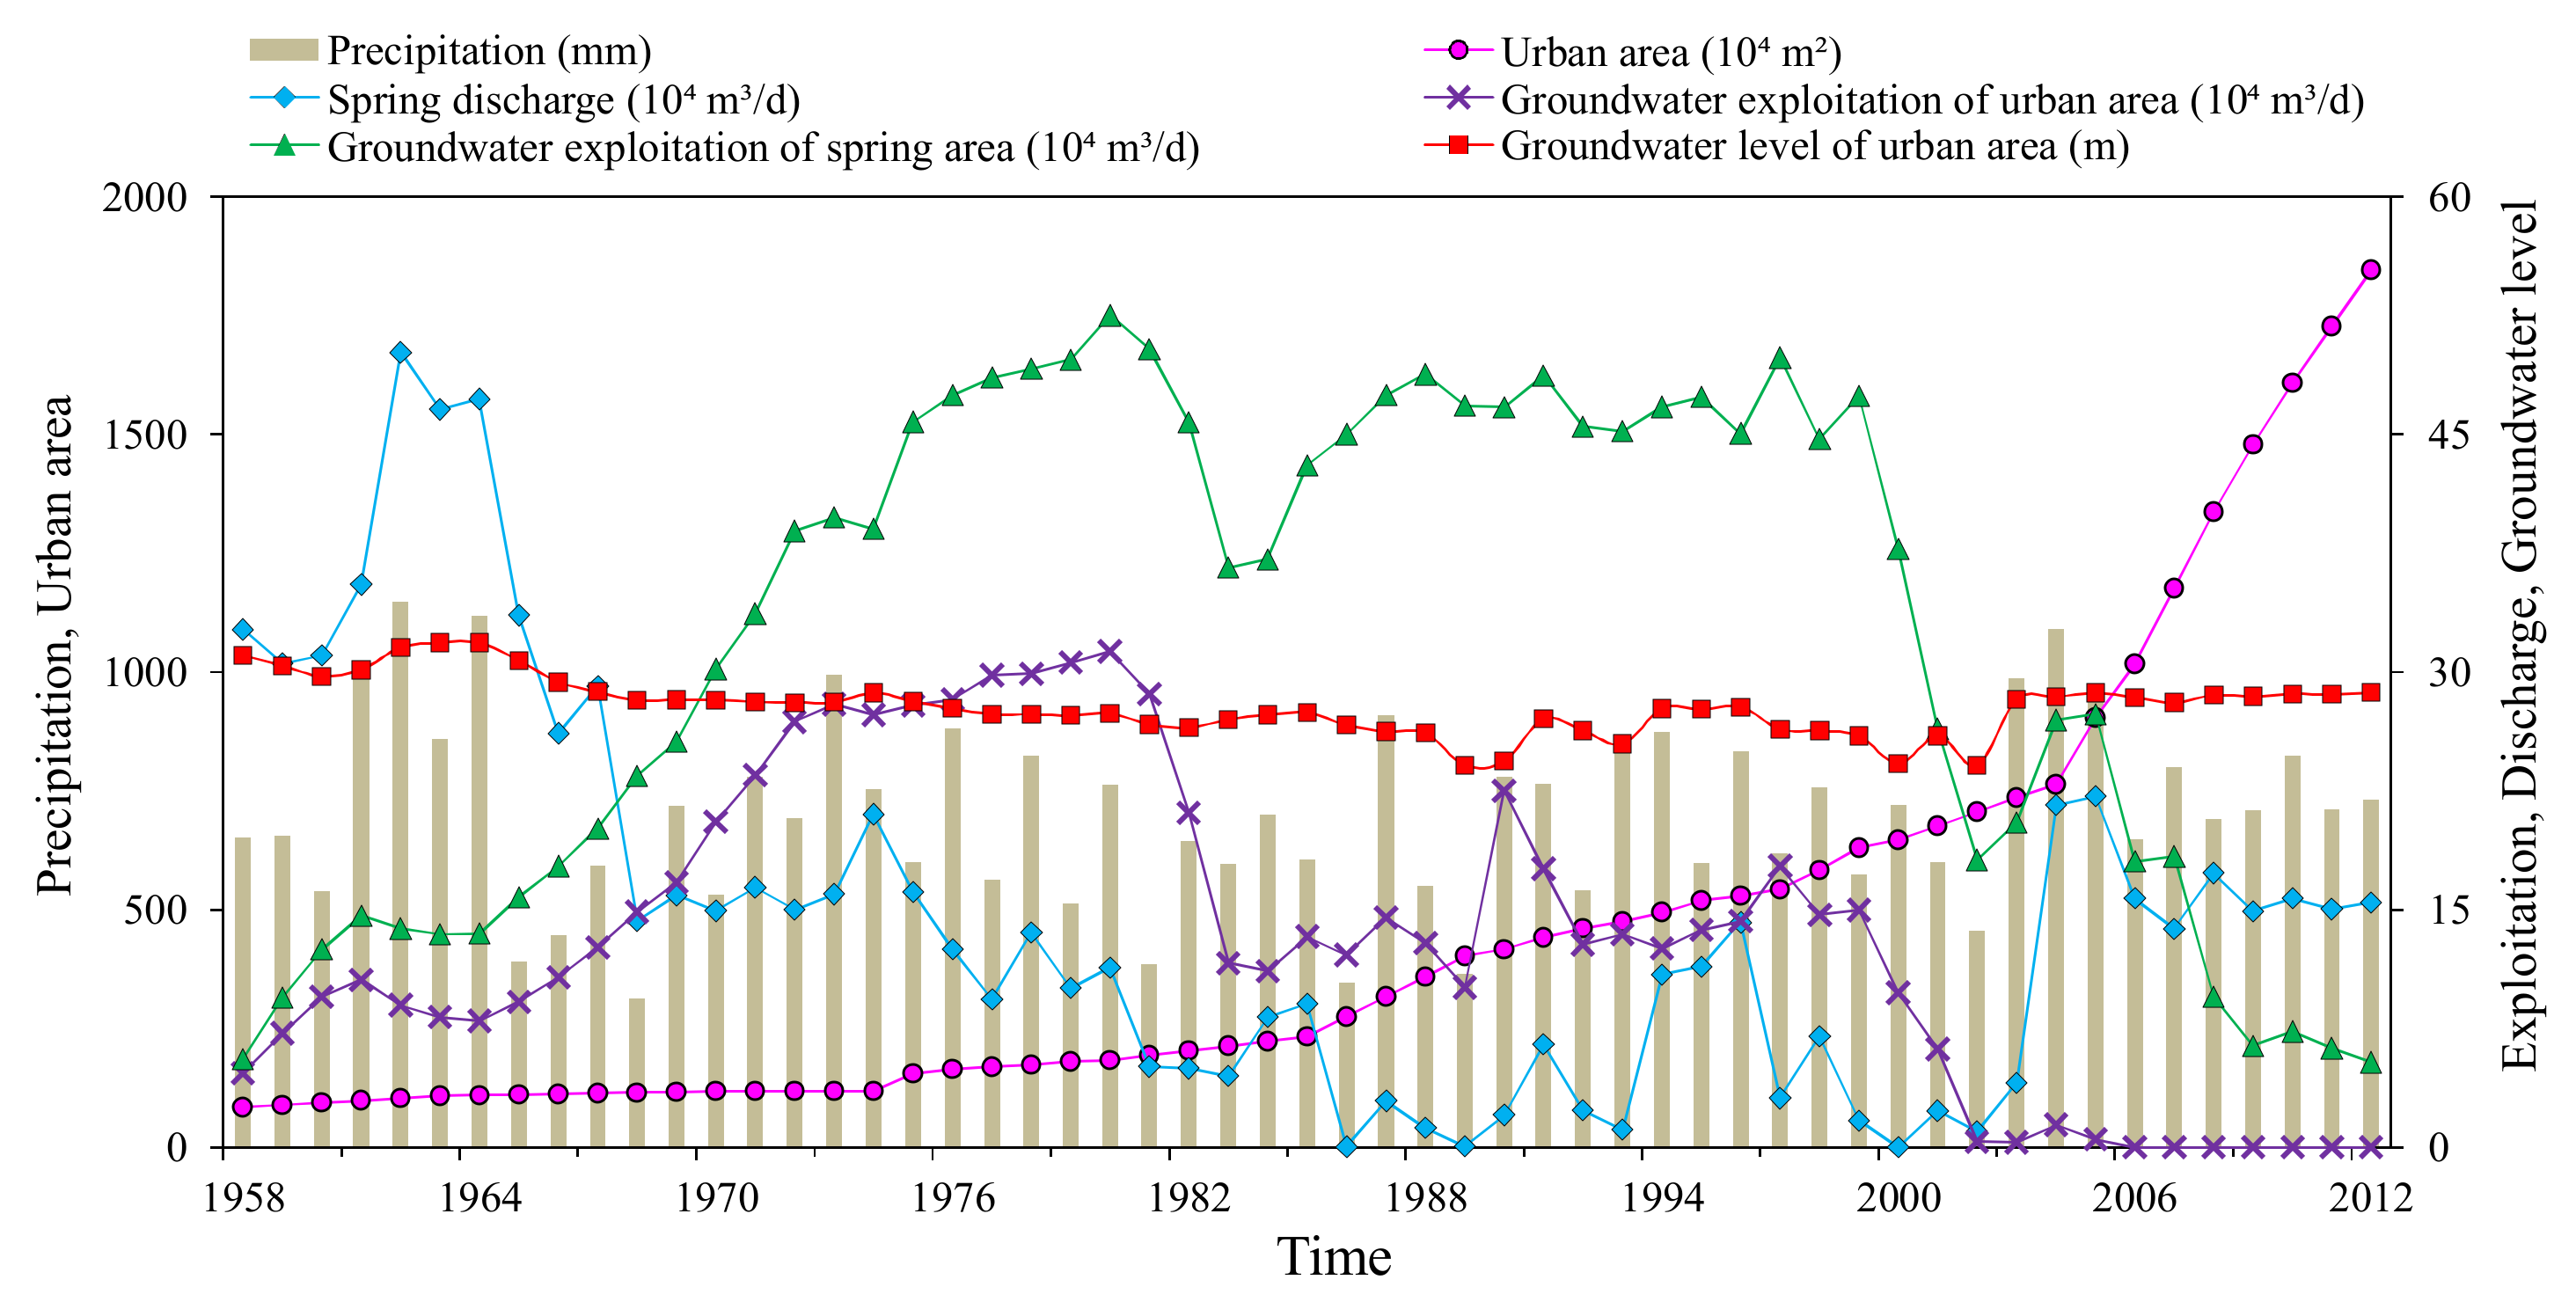
With the continuous development of the social economy and the increase of population, the karst water production increases year by year and the groundwater level decreases year by year, followed by a decrease in the spring water flow. Since 2003, the groundwater exploitation in the urban area has been close to zero (Figure 16). Since then, the springs have been continuously flowing up to now, which suggests karst water exploitation is the main cause of spring water cut-off in Jinan.
The decrease of precipitation in the Jinan area is also considered an important factor, affecting spring discharge. The low average precipitation in the 1980s (i.e., less than 600 mm) and droughts, occurred in 1988–1989 and 1999–2002 [8], result in the reduction of the spring water recharge (Figure 16). In addition, the decrease of river seepage, caused by reservoir construction and soil erosion, caused by overexploitation in southern mountainous areas, are also identified as deriving factors for the decrease of spring water flow, in Jinan.
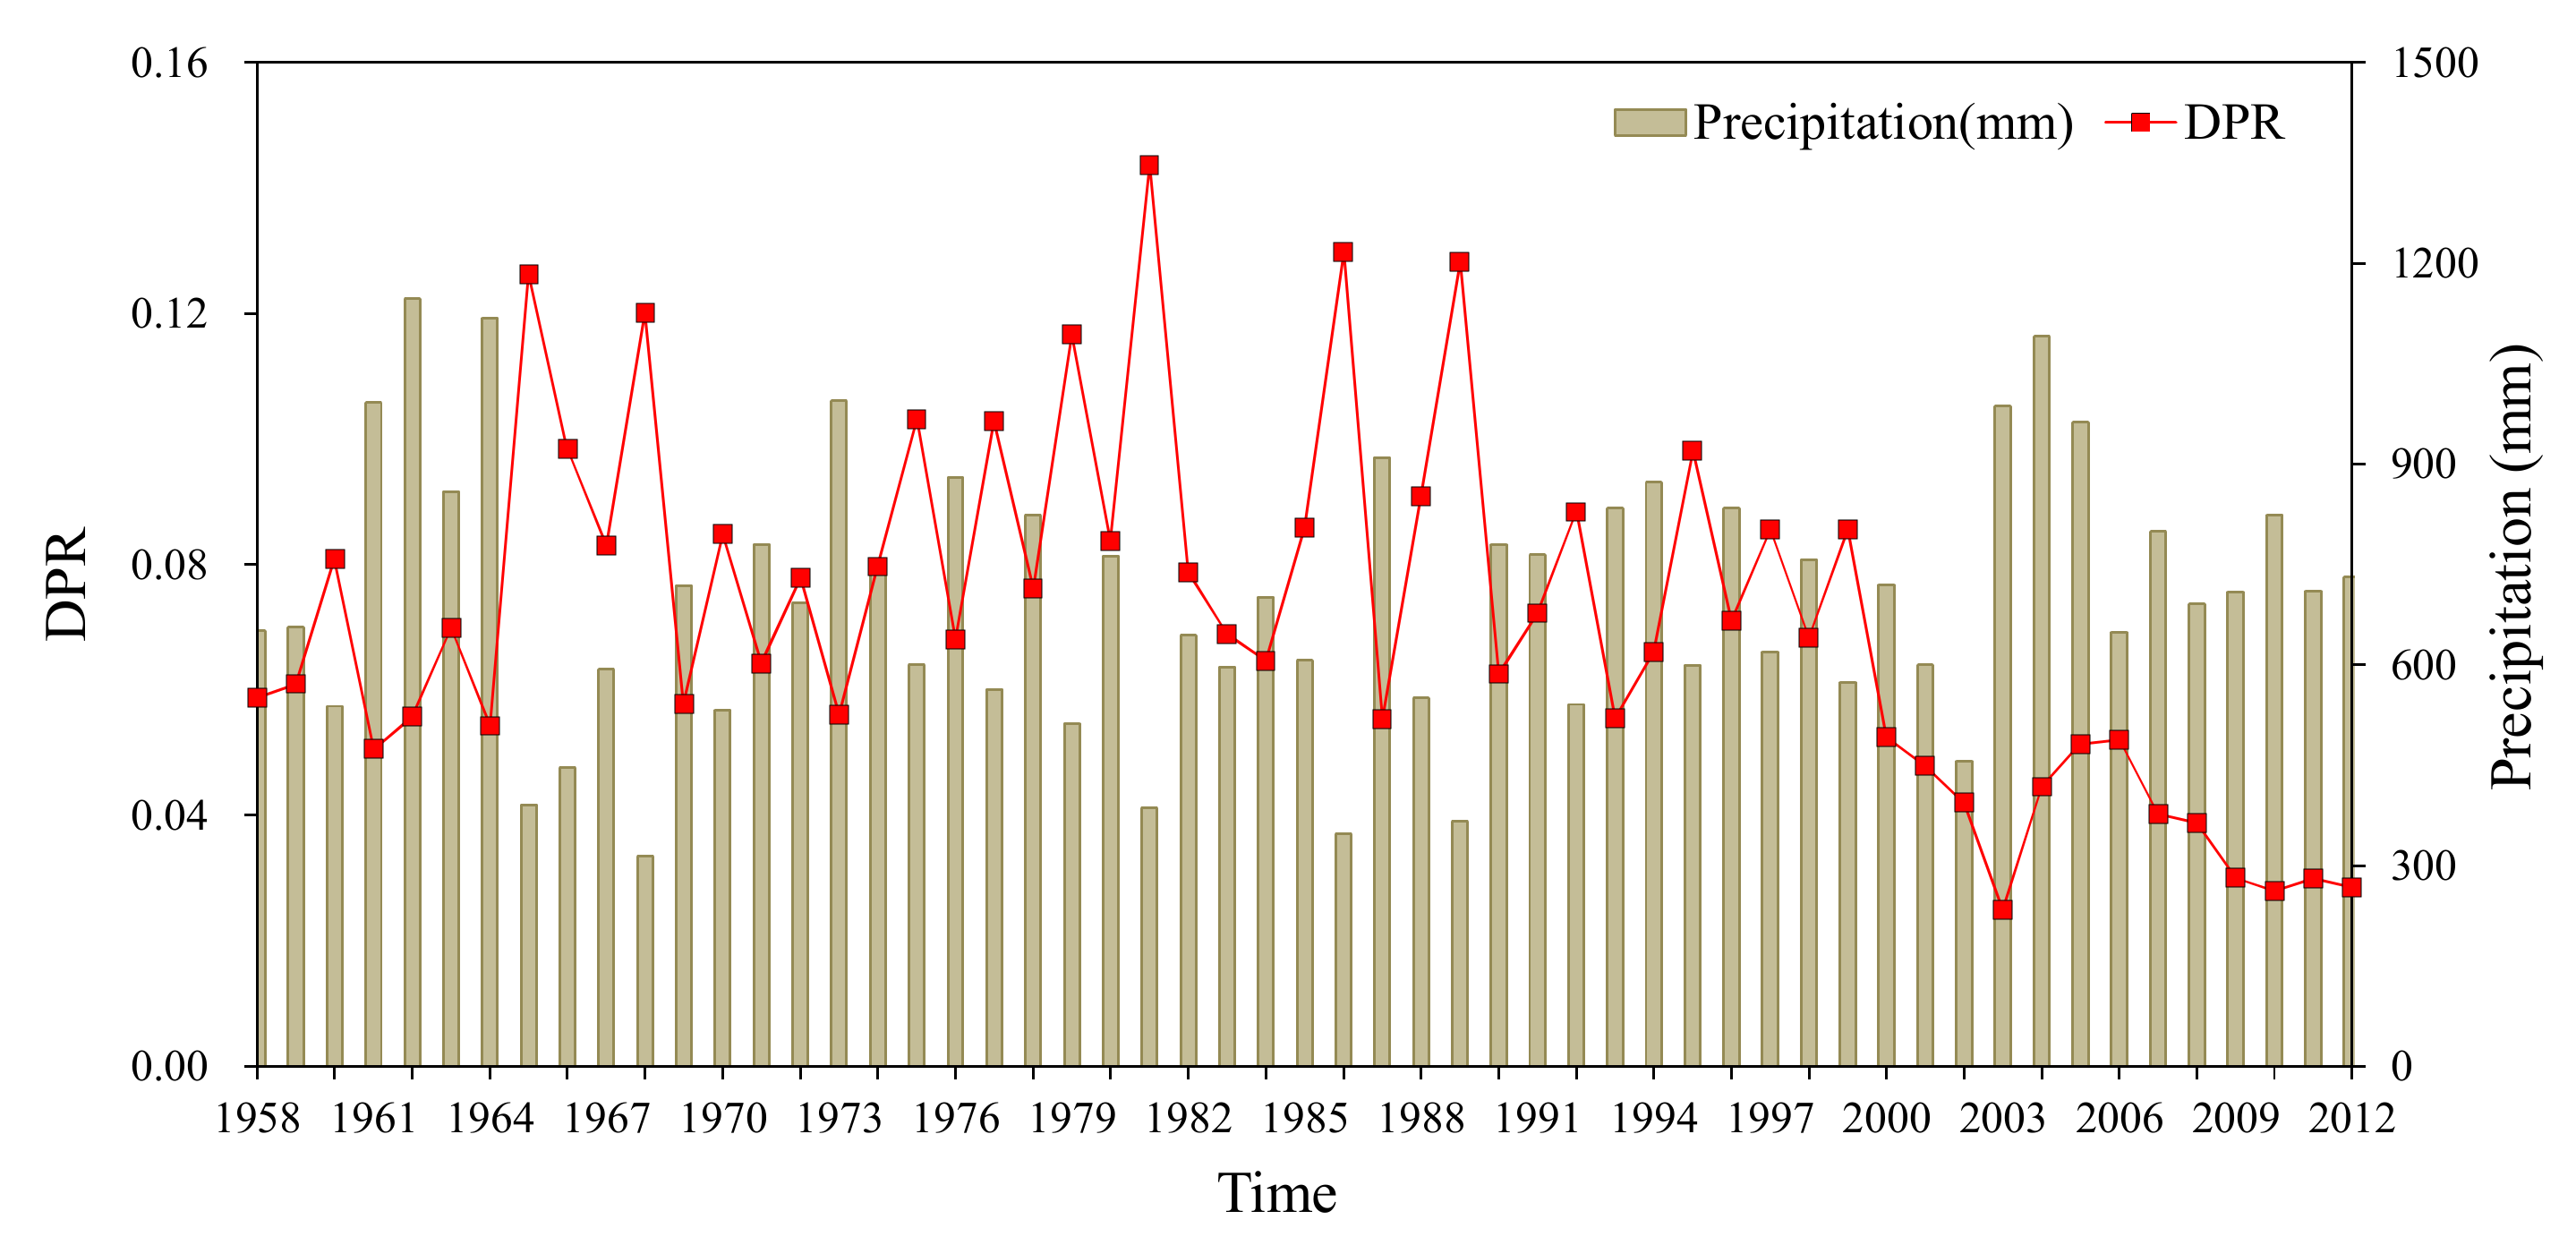
The conditions of spring area are complex, as the total discharge of karst water of spring area can only be calculated by considering the karst water exploitation and spring water flow, without considering evaporation. However, the recharge of the whole spring area cannot be accurately calculated for various reasons. Therefore, the concept of DPR is introduced in this study.
Under natural conditions, the DPR value is the ratio of spring water flow to precipitation. The multi-year dynamics should be relatively stable. Under exploitation conditions, the total groundwater discharge includes the groundwater withdrawal and spring water flow. If the recharge conditions remain the same, the DPR value should also be stable, however, it is not the case (Figure 17). As shown in Figure 17, the DPR value fluctuates between 0.05 and 0.10 before 2000, with a maximum of 0.14, and maintains a relatively stable trend. When the annual precipitation is high, the DPR value is small, and vice versa. This coincides with the fact that the surface runoff of the spring area is high when the precipitation is high, with a non-linear relationship, which is due to the limited storage space of the groundwater. However, after 2000, smaller values of DPR observed, i.e., less than 0.05, with a gradually decreasing trend. It indicates that the recharge conditions of precipitation to groundwater have deteriorated, indeed, the ground hardening in the recharge area has reduced the recharge of groundwater in the spring area, under the same precipitation conditions.
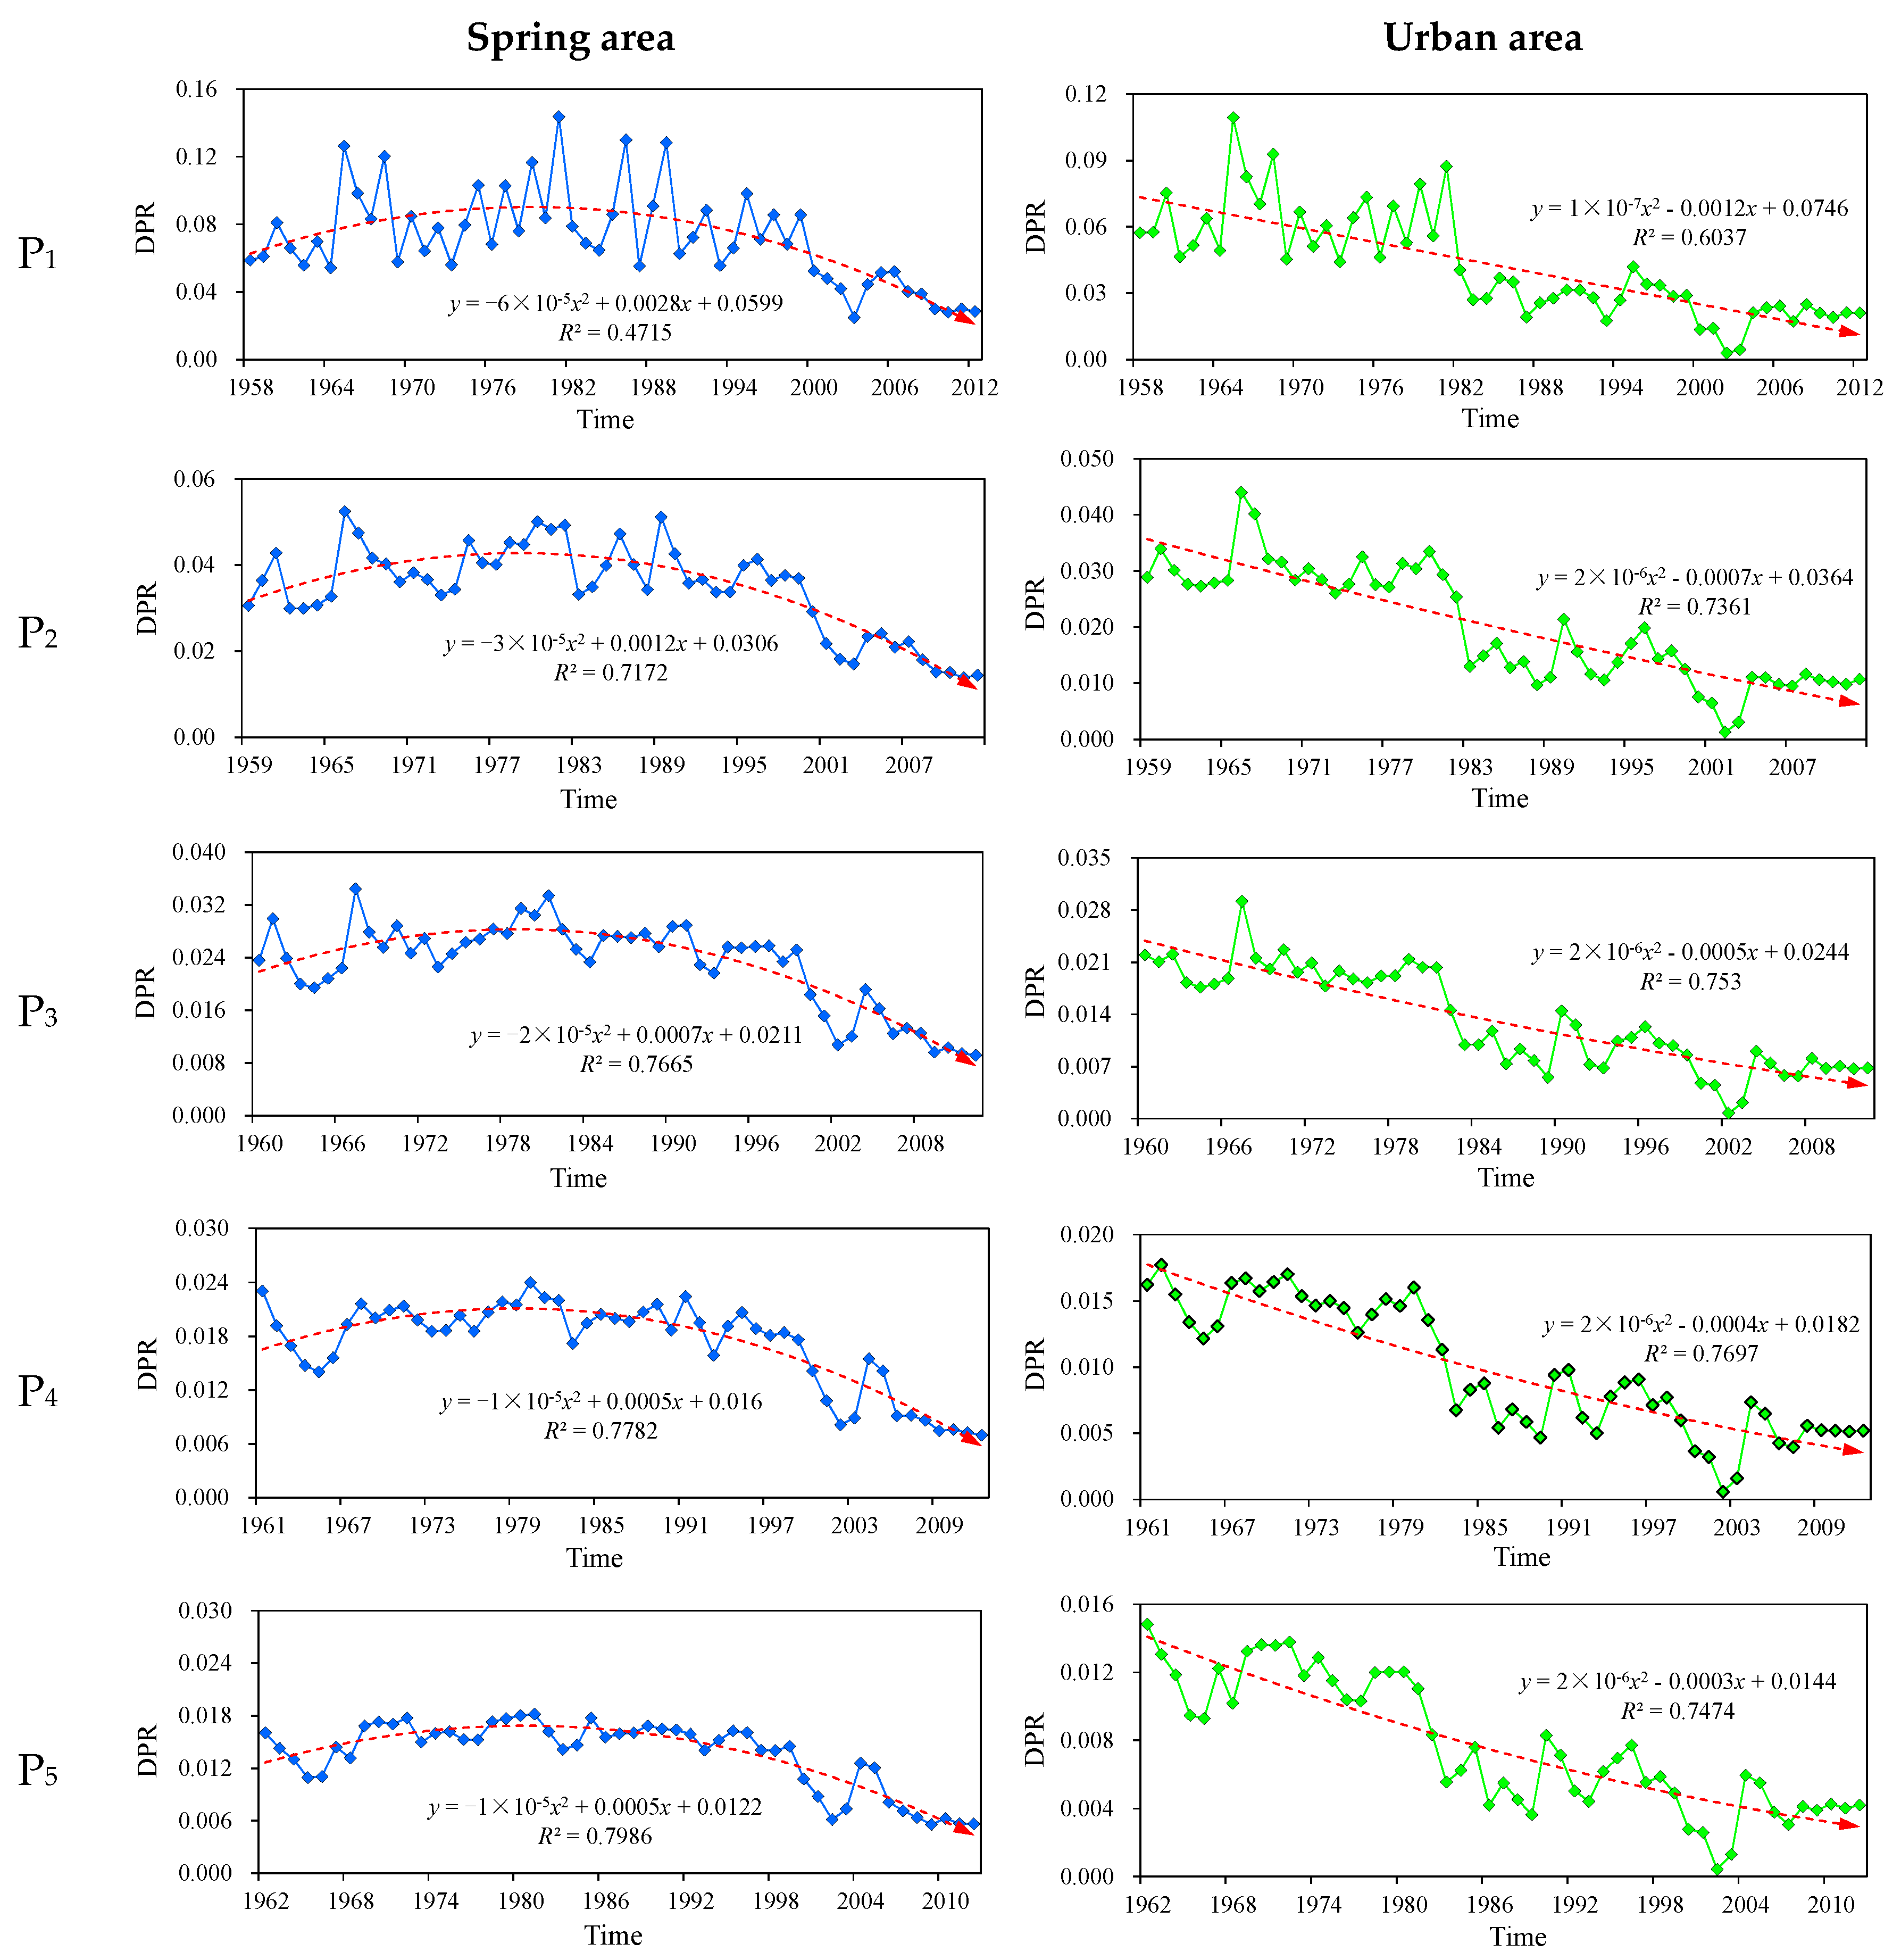
In addition, in this study, we also add the karst water exploitation in the urban and spring areas to the spring water flow, as the total discharge of groundwater in urban and spring areas, respectively, and compare them with the precipitation of the current year (P1), the last two years (P2), the last three years (P3), the last four years (P4), and the past five years (P5). As shown in Figure 18, a trend graph is made and its polynomial trend equation and corresponding correlation coefficients are calculated. Based on the results:
(1) The correlation between discharge and precipitation becomes better with the increase of precipitation years, which indicates that the precipitation in the last year, the last two years, and even the last four years affect the total discharge of karst water in that year. Thus, it can be concluded that annual precipitation can affect spring water flow in the next five years at least.
(2) According to the dynamic changes of DPR in the spring area, before 2000, the DPR value shows an initial increase, followed by a decrease, which indicates that the exploitation of groundwater can increase the recharge of precipitation to groundwater, i.e., “recharge increment” [41]. However, after 2000, a sudden decrease trend is observed, causing the ground hardening in the recharge area, which results in the decrease of groundwater recharge by precipitation.
5. Conclusions
Spring water has an irreplaceable effect on the city of Jinan. To better protect the spring water in the city, the data on the water quality and spring discharge of the four major spring groups are used to discuss the dynamic change of spring water time and its influencing factors. The main findings of our study are as follows:
(1) From 2015 to 2018, the TDS and TH of the four spring groups in Jinan are less than 1000 mg/L and 500 mg/L, respectively, and WQI indicates good water quality in the area. Compared to the other three spring groups, the contents of chemical components in the water samples collected from the BTS site, are higher. The hydrochemistry of spring water is mainly controlled by the dissolution of calcite, dolomite, and gypsum, as well as the occurrence of dedolomitization in the study area. However, the quality of spring water is affected by anthropogenic inputs. Since 1958, the main ions in spring water have experienced three stages of slow increase, increase, and slow increase, in response to intensive urban development in the area.
(2) From 1958 to 2012, Jinan spring flow has experienced four stages, including the natural outflow stage, flowing transitional stage, flowing decline stage, flowing recovery stage. Groundwater exploitation, urban construction land area, and precipitation are the three most important factors, affecting the spring flow dynamics in Jinan. The changes inland use not only affects the spring water flowing in Jinan, but also increases the risk of flooding of the urban area. Based on the results from DPR, annual precipitation can affect spring flow in the next five years, at least.
Finally, Jinan has achieved remarkable results in spring water protection, however, there is still a long way to go. In the future, the protection of spring water should be carried out simultaneously from two aspects: spring water quality and spring water flow. To restore and protect spring water in Jinan, the dynamic monitoring of spring water, the control of pollution sources, and the prohibition of groundwater overexploitation should be strengthened. In addition, the ecological environment of spring water recharge areas should be strongly protected.
Author Contributions
Methodology, J.L., X.X., Q.W., M.W., J.F. and T.F.; Project administration, Z.G.; Resources, Q.W.; Software, J.L., X.X., M.W., J.F. and T.F.; Writing—original draft, J.L., Z.G., and M.W.; Writing—review & editing, Z.G., J.L. and M.W. All authors have read and agreed to the published version of the manuscript.
Funding
This research was financially supported by the Visiting Scholar Project of Shandong University of Science and Technology, Shandong Geological Environmental Monitoring Station and the First Institute of Oceanography, MNR. National Natural Science Foundation of China (U1806212; 41706068).
Acknowledgments
The authors sincerely thank researchers and staff members for their supports. We would also like to acknowledge editors and reviewers for suggesting constructive feedback.
Conflicts of Interest
The authors declare no conflict of interest.
References
- Calligaris, C.; Mezga, K.; Slejko, F.F.; Urbanc, J.; Zini, L. Groundwater Characterization by Means of Conservative (δ18O and δ2H) and Non-Conservative (87Sr/86Sr) Isotopic Values: The Classical Karst Region Aquifer Case (Italy–Slovenia). Geosciences 2018, 8, 321. [Google Scholar] [CrossRef] [Green Version]
- Doctor, D. Hydrologic connections and dynamics of water movement in the classical karst (kras) aquifer: Evidence from frequent chemical and stable isotope sampling. Acta Carsologica 2008, 3, 101–123. [Google Scholar] [CrossRef] [Green Version]
- Xing, L.; Zhou, J.; Song, G.; Xing, X. Mixing ratio of recharging water sources for the four largest spring groups. Earth Sci. Front. 2018, 25, 260–272. [Google Scholar]
- Gao, Z.; Xu, J.; Wang, S.; Li, C.; Han, K.; Li, J.; Luo, F.; Ma, H. The distribution characteristics and hydrogeological significance of trace elements in karst water, Jinan, China. Earth Sci. Front. 2014, 21, 135–146. [Google Scholar]
- Yin, X.; Wang, Q.; Feng, W. Hydro-Chemical and isotopic study of the karst spring catchment in Jinan. Acta Geol. Sin. 2017, 91, 1651–1660. [Google Scholar]
- Yang, L.; Liu, C.; Qi, X. Study on characteristic variation of hydro-chemistry of Jinan spring. J. Water Resour. Water Eng. 2016, 27, 59–64. [Google Scholar]
- Liu, S.; Sun, Z.; Liu, S. Survey on the spring water quality, Jinan City, 2012. Prev. Med. Trib. 2013, 19, 926–927. [Google Scholar]
- Yang, L.; Ye, H.; Tong, Z.; Liu, C.; Shang, H. Research of the impact of major construction projects to Jinan spring. Geotech. Investig. Surv. 2012, 40, 42–48. [Google Scholar]
- Wang, J.; Jin, M.; Wang, J.; Jin, M. Hydrochemical Characteristics and Formation Causes of Karst Water in Jinan Spring Catchment. Earth Sci. 2017, 42, 821–831. [Google Scholar]
- Lu, H.; Zhang, C. The variations of goundwater quality and its relationship with human activity. Res. Soil Water Conserv. 2007, 6, 238–240. [Google Scholar]
- Bo, K.; Cai, Y. Evaluation on groundwater pollution degree in Jinan karst area. Shandong Land Resour. 2016, 32, 51–55. [Google Scholar]
- Meng, X.; Wang, Q.; Lian, Y. Hydro-chemical dynamic characteristic analysis on springs in Jinan City. Shandong Land Resour. 2017, 33, 47–53. [Google Scholar]
- Zhang, Z.; Wang, W.; Qu, S.; Huang, Q.; Liu, S.; Xu, Q.; Ni, L. A new perspective to explore the hydraulic connectivity of karst aquifer system in Jinan spring catchment, China. Water 2018, 10, 1368. [Google Scholar] [CrossRef] [Green Version]
- Qi, X.; Yang, L.; Han, Y.; Shang, H.; Liting, X. Cross wavelet analysis of groundwater level regimes and precipitation groundwater level regime in Jinan spring region. Adv. Earth Sci. 2012, 27, 969–978. [Google Scholar]
- Zhou, J.; Xing, L.T.; Zhang, F.J.; Han, Z.; Peng, T.Q.; Xu, M.T.; Yang, Y. Chemical characteristics research on karst water in Jinan spring area. Adv. Mater. Res. 2015, 1092–1093, 593–596. [Google Scholar] [CrossRef]
- Wu, Q.; Xu, H. A three-dimensional model and its potential application to spring protection. Environ. Geol. 2005, 48, 551–558. [Google Scholar] [CrossRef]
- Wang, X.; Wang, C.; Wang, B.; Liu, S.; Song, J. Protection of urban features during urbanization based on the roles of springs in Jinan. Chin. J. Popul. Resour. Environ. 2017, 15, 93–102. [Google Scholar] [CrossRef]
- Qian, J.; Zhan, H.; Wu, Y.; Li, F.; Wang, J. Fractured-karst spring-flow protections: A case study in Jinan, China. Hydrogeol. J. 2006, 14, 1192. [Google Scholar] [CrossRef]
- Şener, Ş.; Şener, E.; Davraz, A. Evaluation of water quality using water quality index (WQI) method and GIS in Aksu River (SW-Turkey). Sci. Total Environ. 2017, 584–585, 131–144. [Google Scholar]
- Varol, S.; Davraz, A. Evaluation of the groundwater quality with WQI (Water Quality Index) and multivariate analysis: A case study of the Tefenni plain (Burdur/Turkey). Environ. Earth Sci. 2015, 73, 1725–1744. [Google Scholar] [CrossRef]
- Wu, Z.; Wang, X.; Chen, Y.; Cai, Y.; Deng, J. Assessing river water quality using water quality index in Lake Taihu Basin, China. Sci. Total Environ. 2018, 612, 914–922. [Google Scholar] [CrossRef] [PubMed]
- Liu, J.; Gao, Z.; Wang, M.; Li, Y.; Yu, C.; Shi, M.; Zhang, H.; Ma, Y. Hydrochemical and isotopic characteristics of surface water in the Lhasa River basin. Arab. J. Geosci. 2019, 12, 520. [Google Scholar] [CrossRef]
- Liu, J.; Gao, Z.; Wang, M.; Li, Y.; Ma, Y.; Shi, M.; Zhang, H. Study on the dynamic characteristics of groundwater in the valley plain of Lhasa City. Environ. Earth Sci. 2018, 77, 646. [Google Scholar] [CrossRef]
- Ministry of Natural Resources of the People’s Republic of China. Standard for Groundwater Quality of China; Ministry of Natural Resources of the People’s Republic of China: Beijing, China, 2017.
- WHO. Guidelines for Drinking Water Quality; World Health Organization: Geneva, Switzerland, 2008. [Google Scholar]
- Sarikhani, R.; Dehnavi, A.G.; Ahmadnejad, Z.; Kalantari, N. Hydrochemical characteristics and groundwater quality assessment in Bushehr Province, SW Iran. Environ. Earth Sci. 2015, 74, 6265–6281. [Google Scholar] [CrossRef]
- Piper, A. A graphic procedure in the geochemical interpretation of water-analyses. Eos. Trans. Am. Geophys. Union 1944, 25, 914–928. [Google Scholar] [CrossRef]
- Durov, S. Classification of natural waters and graphic presentation of their composition. Dokl Akad Nauk SSSR 1948, 1, 87–89. [Google Scholar]
- Liu, J.; Gao, Z.; Wang, M.; Li, Y.; Shi, M.; Zhang, H.; Ma, Y. Hydrochemical characteristics and possible controls in the groundwater of the Yarlung Zangbo River Valley, China. Environ. Earth Sci. 2019, 78, 76. [Google Scholar] [CrossRef]
- Qu, B.; Zhang, Y.; Kang, S.; Sillanpää, M. Water quality in the Tibetan Plateau: Major ions and trace elements in rivers of the “Water Tower of Asia”. Sci. Total Environ. 2019, 649, 571–581. [Google Scholar] [CrossRef]
- Gibbs, R.J. Mechanisms controlling world water chemistry. Science 1970, 170, 1088–1090. [Google Scholar] [CrossRef]
- Liu, J.; Hao, Y.; Gao, Z.; Wang, M.; Liu, M.; Wang, Z.; Wang, S. Determining the factors controlling the chemical composition of groundwater using multivariate statistics and geochemical methods in the Xiqu coal mine, North China. Environ. Earth Sci. 2019, 78, 364. [Google Scholar] [CrossRef]
- Yang, Q.; Li, Z.; Ma, H.; Wang, L.; Martín, J.D. Identification of the hydrogeochemical processes and assessment of groundwater quality using classic integrated geochemical methods in the Southeastern part of Ordos basin, China. Environ. Pollut. 2016, 218, 879–888. [Google Scholar] [CrossRef] [PubMed]
- Mostaza Colado, D.; Carreño Conde, F.; Rasines Ladero, R.; Iepure, S. Hydrogeochemical characterization of a shallow alluvial aquifer: 1 baseline for groundwater quality assessment and resource management. Sci. Total Environ. 2018, 639, 1110–1125. [Google Scholar] [CrossRef] [PubMed]
- Xiao, J.; Jin, Z.; Zhang, F.; Wang, J. Solute geochemistry and its sources of the groundwaters in the Qinghai Lake catchment, NW China. J. Asian Earth Sci. 2012, 52, 21–30. [Google Scholar] [CrossRef]
- Liu, P.; Hoth, N.; Drebenstedt, C.; Sun, Y.; Xu, Z. Hydro-geochemical paths of multi-layer groundwater system in coal mining regions—Using multivariate statistics and geochemical modeling approaches. Sci. Total Environ. 2017, 601, 1–14. [Google Scholar] [CrossRef]
- Karroum, M.; Elgettafi, M.; Elmandour, A.; Wilske, C.; Himi, M.; Casas, A. Geochemical processes controlling groundwater quality under semi arid environment: A case study in central Morocco. Sci. Total Environ. 2017, 609, 1140–1151. [Google Scholar] [CrossRef] [PubMed]
- Huang, Q.; Qin, Q.; Liu, Y.; Cheng, R.; Li, F. Regional evolution and control factors of karst groundwater in Liulin spring catchment. China Environ. Sci. 2019, 40, 2132–2142. [Google Scholar]
- Qian, J.; Peng, Y.; Zhao, W.; Ma, L.; He, X.; Lu, Y. Hydrochemical processes and evolution of karst groundwater in the northeastern Huaibei Plain, China. Hydrogeol. J. 2018, 26, 1721–1729. [Google Scholar] [CrossRef]
- Duan, S.; Jiang, Y.; Zhang, Y.; Zeng, Z.; Wang, Z.; Wu, W.; Peng, X.; Liu, J. Sources of nitrate in groundwater and its environmental effects in karst trough valleys: A case study of an underground river system in the Longfeng trough valley, Chongqing. Environ. Sci. 2019, 40, 1715–1725. [Google Scholar]
- Zhang, G.; Fei, Y.; Yang, L.; Hao, M.; Shen, J. Responses of groundwater recharge and pumpage to change in precipitation in Hebei plain. Earth Sci. J. China U Geosci. 2006, 6, 879–884. [Google Scholar]

Figure 2.
Procedures for calculating water quality index (WQI).

Figure 3.
Bar chart of mean content of chemical components in spring water.

Figure 4.
Schoeller diagram of spring water for PS, SS, BTS, and FDP spring groups.

Figure 5.
(a) Piper diagram for the spring water samples, (b) Durov diagram of the spring water samples.
Figure 5.
(a) Piper diagram for the spring water samples, (b) Durov diagram of the spring water samples.

Figure 6.
Gibbs diagram for spring water, collected from the four spring groups.

Figure 7.
Ratio graphs of major ions in spring water samples, collected from the four spring groups.
Figure 7.
Ratio graphs of major ions in spring water samples, collected from the four spring groups.

Figure 8.
(a) SI for calcite, dolomite, gypsum, and halite, (b) plot of SI of gypsum versus (Ca2+ + SO42−), (c) plot of SI of gypsum versus Mg2+.
Figure 8.
(a) SI for calcite, dolomite, gypsum, and halite, (b) plot of SI of gypsum versus (Ca2+ + SO42−), (c) plot of SI of gypsum versus Mg2+.

Figure 9.
Temporal variations of major ions of spring water from 1984 to 2013 (left-hand side graph) and March 2015 to July 2018 (right-hand side graph).
Figure 9.
Temporal variations of major ions of spring water from 1984 to 2013 (left-hand side graph) and March 2015 to July 2018 (right-hand side graph).

Figure 10.
Temporal variations of TDS, TH, SO42−, Cl−, and NO3− of the Spouting Spring (SS).

Figure 11.
WQI of spring water from March 2015–July 2018.

Figure 12.
Scatter plot of Jinan spring natural discharge from 1958 to 2012.

Figure 13.
The GDP and prime operating revenue of industrial enterprises, above designated size in Jinan, from 1978 to 2017.
Figure 13.
The GDP and prime operating revenue of industrial enterprises, above designated size in Jinan, from 1978 to 2017.

Figure 14.
Changes in main urban areas in Jinan City.

Figure 15.
Relationship between urban land area and annual maximum flood peak flow in Xiaoqing River Basin of Jinan.
Figure 15.
Relationship between urban land area and annual maximum flood peak flow in Xiaoqing River Basin of Jinan.

Figure 16.
The relationship between spring flow, precipitation, urban area, and groundwater exploitation of Jinan.
Figure 16.
The relationship between spring flow, precipitation, urban area, and groundwater exploitation of Jinan.

Figure 17.
Relationship between DPR and precipitation of the Jinan spring area.

Figure 18.
DPR of the current year (P1), the last two years (P2), the last three years (P3), the last four years (P4), and the past five years (P5).
Figure 18.
DPR of the current year (P1), the last two years (P2), the last three years (P3), the last four years (P4), and the past five years (P5).


Table 1.
Statistical results of hydrochemical components and SI of four spring groups.
| Header | pH | TH | TDS | K+ | Na+ | Ca2+ | Mg2+ | HCO3− | SO42− | Cl− | NO3− | F− | NO2− | COD | H2SiO3 | SI (Calcite) | SI (Dolomite) | SI (Gypsum) | SI (Halite) | |
|---|---|---|---|---|---|---|---|---|---|---|---|---|---|---|---|---|---|---|---|---|
| FDP | Max | 8.4 | 369.66 | 630.66 | 1.50 | 35.00 | 114.90 | 28.29 | 271.17 | 105.66 | 66.21 | 41.57 | 0.25 | 0.05 | 1.15 | 20.10 | 1.33 | 2.26 | −1.50 | −7.22 |
| Min | 7.3 | 263.64 | 469.44 | 0.90 | 10.00 | 72.23 | 14.83 | 182.80 | 59.92 | 32.57 | 31.23 | 0.17 | 0.00 | 0.36 | 14.66 | 0.27 | 0.11 | −1.80 | −8.07 | |
| Mean | 7.89 | 331.47 | 566.60 | 1.11 | 21.45 | 99.95 | 19.88 | 244.86 | 81.23 | 46.14 | 37.47 | 0.21 | 0.01 | 0.71 | 17.50 | 0.82 | 1.28 | −1.62 | −7.61 | |
| SD | 0.31 | 29.74 | 40.85 | 0.15 | 6.03 | 10.31 | 3.11 | 24.51 | 9.67 | 7.43 | 2.89 | 0.02 | 0.01 | 0.24 | 1.24 | 0.29 | 0.60 | 0.07 | 0.19 | |
| Cv (%) | 3.88 | 8.97 | 7.21 | 13.89 | 28.12 | 10.31 | 15.65 | 10.01 | 11.91 | 16.11 | 7.70 | 11.31 | 121.16 | 33.24 | 7.09 | |||||
| PS | Max | 8.6 | 376.28 | 648.57 | 3.10 | 77.60 | 112.30 | 32.64 | 261.23 | 145.87 | 100.03 | 38.74 | 0.51 | 0.13 | 1.80 | 20.01 | 1.39 | 2.41 | −1.45 | −6.69 |
| Min | 7.6 | 280.25 | 488.22 | 1.00 | 12.00 | 71.12 | 15.50 | 179.76 | 56.48 | 36.68 | 15.96 | 0.18 | 0.00 | 0.36 | 10.06 | 0.48 | 0.64 | −1.81 | −7.81 | |
| Mean | 7.98 | 320.47 | 561.14 | 1.42 | 25.59 | 95.19 | 20.10 | 238.71 | 82.36 | 49.91 | 33.80 | 0.24 | 0.02 | 0.78 | 16.73 | 0.87 | 1.41 | −1.64 | −7.54 | |
| SD | 0.27 | 22.45 | 39.65 | 0.60 | 16.14 | 9.03 | 3.93 | 20.94 | 23.71 | 15.68 | 5.18 | 0.08 | 0.03 | 0.32 | 2.47 | 0.25 | 0.48 | 0.09 | 0.31 | |
| Cv (%) | 3.38 | 7.01 | 7.07 | 42.38 | 63.06 | 9.49 | 19.56 | 8.77 | 28.78 | 31.42 | 15.32 | 32.34 | 130.94 | 40.80 | 14.73 | |||||
| SS | Max | 8.5 | 401.23 | 679.53 | 2.70 | 52.80 | 125.00 | 35.97 | 287.60 | 132.08 | 82.76 | 47.61 | 0.27 | 0.13 | 1.41 | 21.42 | 1.45 | 2.49 | −1.43 | −6.95 |
| Min | 7.5 | 316.33 | 552.32 | 0.80 | 18.00 | 94.45 | 14.83 | 214.17 | 61.40 | 42.35 | 31.90 | 0.18 | 0.00 | 0.46 | 14.30 | 0.51 | 0.62 | −1.69 | −7.70 | |
| Mean | 7.90 | 361.51 | 622.11 | 1.33 | 24.43 | 110.28 | 20.91 | 263.06 | 89.83 | 53.86 | 43.44 | 0.20 | 0.01 | 0.79 | 18.38 | 0.92 | 1.46 | −1.55 | −7.49 | |
| SD | 0.28 | 25.23 | 36.44 | 0.50 | 7.50 | 9.32 | 4.43 | 21.75 | 14.65 | 8.07 | 4.20 | 0.02 | 0.03 | 0.25 | 2.00 | 0.30 | 0.60 | 0.07 | 0.15 | |
| Cv (%) | 3.53 | 6.98 | 5.86 | 37.29 | 30.71 | 8.45 | 21.17 | 8.27 | 16.31 | 14.98 | 9.66 | 9.67 | 230.89 | 31.44 | 10.89 | |||||
| BTS | Max | 8.5 | 438.89 | 757.95 | 2.40 | 35.75 | 136.13 | 35.97 | 314.31 | 121.13 | 78.17 | 56.63 | 0.23 | 0.05 | 6.49 | 21.54 | 1.52 | 2.61 | −1.40 | −7.17 |
| Min | 7.5 | 355.22 | 618.78 | 1.00 | 22.22 | 109.84 | 18.65 | 231.12 | 79.25 | 48.86 | 46.97 | 0.18 | 0.00 | 0.49 | 16.13 | 0.57 | 0.72 | −1.56 | −7.55 | |
| Mean | 7.88 | 404.55 | 701.01 | 1.23 | 30.83 | 124.75 | 22.59 | 282.33 | 104.40 | 66.73 | 52.60 | 0.20 | 0.00 | 1.11 | 19.05 | 0.94 | 1.48 | −1.46 | −7.28 | |
| SD | 0.27 | 21.79 | 36.43 | 0.30 | 3.44 | 7.76 | 3.73 | 18.45 | 9.68 | 7.19 | 2.63 | 0.01 | 0.01 | 1.29 | 1.58 | 0.26 | 0.52 | 0.05 | 0.10 | |
| Cv (%) | 3.43 | 5.39 | 5.20 | 24.15 | 11.16 | 6.22 | 16.49 | 6.54 | 9.27 | 10.78 | 5.01 | 6.49 | 223.42 | 116.24 | 8.27 |
Unit: mg/L except for pH and SI, Max: maximum value, Min: minimum value, Mean: mean value, SD: standard deviation, Cv: coefficient of variation.
Table 2.
Matrix of rotated principal component loading.
| Variables | Principal Components | |||
|---|---|---|---|---|
| PC1 | PC2 | PC3 | PC4 | |
| Ca2+ | 0.966 | −0.001 | −0.106 | −0.064 |
| TH | 0.945 | 0.056 | 0.23 | −0.088 |
| NO3− | 0.919 | −0.189 | 0.089 | −0.060 |
| TDS | 0.880 | 0.407 | 0.222 | −0.073 |
| HCO3− | 0.816 | −0.149 | 0.184 | −0.252 |
| Na+ | 0.094 | 0.948 | 0.129 | 0.109 |
| Cl− | 0.450 | 0.808 | 0.237 | 0.096 |
| K+ | −0.224 | 0.787 | −0.105 | 0.084 |
| SO42− | 0.437 | 0.755 | 0.196 | 0.004 |
| H2SiO3 | 0.420 | −0.537 | −0.001 | −0.075 |
| F− | −0.482 | 0.175 | 0.197 | −0.120 |
| Mg2+ | 0.228 | 0.145 | 0.826 | −0.079 |
| COD | 0.028 | 0.101 | 0.809 | 0.090 |
| pH | −0.042 | 0.034 | 0.234 | 0.820 |
| NO2− | −0.219 | 0.104 | −0.224 | 0.635 |
| Eigenvalue | 5.074 | 3.900 | 1.757 | 1.223 |
| Variance (%) | 33.83 | 25.999 | 11.71 | 8.152 |
| Cumulative of variance (%) | 33.83 | 59.829 | 71.539 | 79.691 |
Table 3.
The relative weight of chemical parameters.
| Parameters | WHO Standards (2008) [23] | Weight (wi) | Relative Weight (Wi) |
|---|---|---|---|
| K+ | 12 | 2 | 0.0408 |
| Na+ | 200 | 3 | 0.0612 |
| Ca2+ | 300 | 2 | 0.0408 |
| HCO3− | — | 2 | 0.0408 |
| Mg2+ | 30 | 2 | 0.0408 |
| Cl− | 250 | 4 | 0.0816 |
| SO42− | 250 | 4 | 0.0816 |
| F− | 1.5 | 5 | 0.1020 |
| NO2− | 3 | 5 | 0.1020 |
| NO3− | 50 | 5 | 0.1020 |
| TH | 500 | 3 | 0.0612 |
| COD | 10 | 4 | 0.0816 |
| TDS | 1500 | 4 | 0.0816 |
| pH | 6.5–8.5 | 4 | 0.0816 |
| ∑wi = 49 | ∑Wi = 1 |
© 2020 by the authors. Licensee MDPI, Basel, Switzerland. This article is an open access article distributed under the terms and conditions of the Creative Commons Attribution (CC BY) license (http://creativecommons.org/licenses/by/4.0/).
Share and Cite
MDPI and ACS Style
Gao, Z.; Liu, J.; Xu, X.; Wang, Q.; Wang, M.; Feng, J.; Fu, T. Temporal Variations of Spring Water in Karst Areas: A Case Study of Jinan Spring Area, Northern China. Water 2020, 12, 1009. https://doi.org/10.3390/w12041009
AMA Style
Gao Z, Liu J, Xu X, Wang Q, Wang M, Feng J, Fu T. Temporal Variations of Spring Water in Karst Areas: A Case Study of Jinan Spring Area, Northern China. Water. 2020; 12(4):1009. https://doi.org/10.3390/w12041009
Chicago/Turabian StyleGao, Zongjun, Jiutan Liu, Xingyong Xu, Qingbing Wang, Min Wang, Jianguo Feng, and Tengfei Fu. 2020. "Temporal Variations of Spring Water in Karst Areas: A Case Study of Jinan Spring Area, Northern China" Water 12, no. 4: 1009. https://doi.org/10.3390/w12041009
Note that from the first issue of 2016, this journal uses article numbers instead of page numbers. See further details here.