Article

Statistical Evaluation of the Latest GPM-Era IMERG and GSMaP Satellite Precipitation Products in the Yellow River Source Region

1
State Key Laboratory of Hydrology-Water Resources and Hydraulic Engineering, College of Hydrology and Water Resources, Hohai University, 1 Xikang Road, Nanjing 210098, China
2
National Meteorological Information Center, China Meteorological Administration, Beijing 100081, China
*
Author to whom correspondence should be addressed.
Water 2020, 12(4), 1006; https://doi.org/10.3390/w12041006
Submission received: 24 January 2020 / Revised: 19 March 2020 / Accepted: 26 March 2020 / Published: 1 April 2020
(This article belongs to the Special Issue Applications of Remote Sensing and GIS in Hydrology II)

Abstract

:
As the successor of Tropical Rainfall Measuring Mission, Global Precipitation Measurement (GPM) has released a range of satellite-based precipitation products (SPPs). This study conducts a comparative analysis on the quality of the integrated multisatellite retrievals for GPM (IMERG) and global satellite mapping of precipitation (GSMaP) SPPs in the Yellow River source region (YRSR). This research includes the eight latest GPM-era SPPs, namely, IMERG “Early,” “Late,” and “Final” run SPPs (IMERG-E, IMERG-L, and IMERG-F) and GSMaP gauge-adjusted product (GSMaP-Gauge), microwave-infrared reanalyzed product (GSMaP-MVK), near-real-time product (GSMaP-NRT), near-real-time product with gauge-based adjustment (GSMaP-Gauge-NRT), and real-time product (GSMaP-NOW). In addition, the IMERG SPPs were compared with GSMaP SPPs at multiple spatiotemporal scales. Results indicate that among the three IMERG SPPs, IMERG-F exhibited the lowest systematic errors and the best quality, followed by IMERG-E and IMERG-L. IMERG-E and IMERG-L underestimated the occurrences of light-rain events but overestimated the moderate and heavy rain events. For GSMaP SPPs, GSMaP-Gauge presented the best performance in terms of various statistical metrics, followed by GSMaP-Gauge-NRT. GSMaP-MVK and GSMaP-NRT remarkably overestimated total precipitation, and GSMaP-NOW showed an evident underestimation. By comparing the performances of IMERG and GSMaP SPPs, GSMaP-Gauge-NRT provided the best precipitation estimates among all real-time and near-real-time SPPs. For post-real-time SPPs, GSMaP-Gauge presented the highest capability at the daily scale, and IMERG-F slightly outperformed the other SPPs at the monthly scale. This study is one of the earliest studies focusing on the quality of the latest IMERG and GSMaP SPPs. The findings of this study provide SPP developers with valuable information on the quality of the latest GPM-era SPPs in YRSR and help SPP researchers to refine the precipitation retrieving algorithms to improve the applicability of SPPs.

1. Introduction

Precipitation is one of the most important components of atmospheric, hydrological, and energy cycles [1,2]. The accurate measurement or estimation of precipitation plays a critical role in extreme weather event monitoring, natural hazard forecasting, and water resource management. However, obtaining accurate precipitation is a challenging task in many remote regions with complex terrains and harsh natural conditions, where rain gauge networks are uneven and sparsely distributed [3]. In recent years, quasiglobal satellite-based precipitation products (SPPs) with high spatiotemporal resolutions have been available to the public; these SPPs include Tropical Rainfall Measuring Mission (TRMM) multisatellite precipitation analysis (TMPA) [4], precipitation estimation from remotely sensed information using artificial neural networks (PERSIANN) [5], Climate Prediction Center (CPC) morphing method (CMORPH) [6], global satellite mapping of precipitation (GSMaP) [7], and integrated multisatellite retrievals for Global Precipitation Measurement (GPM) (IMERG) [4]. These SPPs have been widely evaluated and utilized for hydrometeorological applications in many parts of the world [8,9,10,11,12,13,14].
GPM is an international satellite mission that was launched by the US National Aeronautics and Space Administration (NASA) and Japan Aerospace Exploration Agency (JAXA) in February 2014. As the successor of TRMM, GPM includes a core observatory satellite and approximately 10 partner satellites and extends the scope of observations to higher latitudes. The GPM core observatory carries a dual-frequency precipitation radar (DPR; the Ku-band at 13.6 GHz and Ka-band at 35.5 GHz) and a multichannel GPM microwave imager (frequencies of 10–183 GHz) [15]. With these advanced sensors, GPM extends the capabilities of the TRMM sensors to detect light and solid precipitation [16]. Currently, two parallel SPPs are used for GPM, namely, IMERG and GSMaP. IMERG is the level 3 precipitation estimation algorithm of GPM; it relies on the strength of multiple available satellite microwave precipitation estimates, infrared (IR) satellite estimates, precipitation gauge analyses, and monthly gauge precipitation data [17]. In terms of latencies, IMERG includes three types of products, namely, the near-real-time “early” and “late” run products (IMERG-E and IMERG-L, respectively) and the post-real-time “final” run product (IMERG-F) [18]. The GSMaP algorithm developed by JAXA combines the information of available passive microwave (PMW) and IR sensors [7]. GSMaP distributes global precipitation maps with several products, such as the real-time product (GSMaP-NOW), near-real-time product (GSMaP-NRT), near-real-time product with gauge-adjustment (GSMaP-Gauge-NRT), post-real-time microwave–IR-reanalyzed product (GSMaP-MVK), and post-real-time gauge-adjusted product (GSMaP-Gauge). Considering that a limited number of GPM-based SPPs are available, the performance of the latest GPM-era SPPs should be comprehensively evaluated.
Previous studies have evaluated the performance of GPM-era SPPs in different regions, such as the Tibetan Plateau [19,20], Mainland China [21,22,23], India [24], Brazil [25], and Africa [26,27]. Tang et al. [21] compared the performance of the Version 7 post-real-time 3B42 (3B42V7) product of TMPA with IMERG-F Version 04 (V04) over Mainland China at 3 h and daily temporal resolutions and discovered that IMERG-F showed appreciably better performance than 3B42V7, especially at the mid- and high-latitudes and in relatively dry climate regions. Xu et al. [28] concluded that IMERG-F V04 outperformed TMPA 3B42V7 in detecting daily precipitation at various spatial scales over southern Tibetan Plateau, and the performance of IMERG and 3B42V7 is strongly influenced by topography and precipitation intensity. Dezfuli et al. [27] found that in West and East Africa IMERG-F V04 showed significant improvement over its predecessor, the TMPA 3B42V7, particularly in capturing the mesoscale convective systems, due to its improved temporal resolution. Beria et al. [24] evaluated over 86 basins in India and concluded that IMERG outperformed TRMM for all rainfall intensity levels across a majority of Indian basins, and the systematic dependence of error components on basin climatology and topography was reduced in IMERG. Wang et al. [29] evaluated the performance of IMERG-E, IMERG-L, IMERG-F, and 3B42V7 in streamflow simulations and demonstrated that IMERG SPPs presented better hydrological performance than the 3B42V7 during the flood season. Duan et al. [30] highlighted that 3B42 showed higher error in the winter months when precipitation was low and outperformed GSMaP-MVK in terms of overall statistical metrics. In the Mundeni Aru River basin of Sri Lanka, GSMaP demonstrated better hydrological performance in flood inundation modeling than IMERG [10]. Rozante et al. [25] compared the performance of TRMM, IMERG-F, and GSMaP-Gauge in five Brazilian regions with different precipitation regimes and demonstrated that IMERG-F and GSMaP-Gauge presented better performance in comparison with TMPA products. Tian et al. [31] explored the error characteristics of GSMaP-MVK, TMAP 3B42, CMORPH, PERSIANN, and Naval Research Laboratory-blended product over the contiguous United States and observed that the performance of GSMaP-MVK was comparable to that of other SPPs and significantly overestimated the heavy precipitation events in summer. Guo et al. [32] examined the spatial error structures of GSMaP-MVK and GSMaP-Gauge over Central Asia and concluded that GSMaP-gauge showed consistently high correlation coefficient and outperformed GSMaP-MVK at the monthly scale. Ning et al. [33] indicated that GSMaP-Gauge V06 provides better daily and monthly precipitation estimates and features more stable quality than IMERG-F V04 over Mainland China in terms of mean error, correlation coefficient, and probability of detection. In the Huaihe River basin of China, the variable infiltration capacity model-based daily streamflow simulations showed that IMERG-F showed acceptable hydrological utility during the flood season, whereas both IMERG-E and IMERG-L demonstrated poor performances [34]. Tan et al. [35] concluded that GSMaP-Gauge displayed the best error stability among all GSMaP SPPs (GSMaP-NRT, GSMaP-MVK, and GSMaP-Gauge) at the hourly scale over nine major basins of China, and GSMaP-MVK can effectively capture most rainfall events. However, only a limited number of studies have systematically evaluated IMERG and GSMaP SPPs, including all real-time, near-real-time and, post-real-time versions. Yuan et al. [36] proposed an assessment framework to statistically and hydrologically evaluate the GPM-era IMERG and GSMaP SPPs in the near-real-time, real-time, and post-real-time versions at subdaily time scales and demonstrated that IMERG SPPs (IMERG-E, IMERG-L, and IMERG-F) generally present higher quality than GSMaP SPPs (GSMaP-NRT, GSMaP-MVK, and GSMaP-Gauge) in the Chindwin River basin of Myanmar. Furthermore, in 2017, JAXA released the gauge-adjusted near-real-time product (GSMaP-Gauge-NRT) Version 7 and a real-time product (GSMaP-NOW). To the best of our knowledge, both SPPs have not been reported. GSMaP-NOW is among the several real-time SPPs released to the public and is expected to be an alternative precipitation data source for flash flood monitoring and forecasting in data-sparse regions. In addition, most relevant studies [31,33,37,38,39,40,41] mainly evaluated IMERG and GSMaP SPPs at daily or monthly scales, whereas investigations at subdaily scales are rare [21,35,42]. Therefore, the two parallel SPPs should be quantitatively evaluated and comprehensively compared in all real-time, near-real-time, and post-real-time versions at multiple time scales.
This study statistically evaluated the two latest parallel GPM-era IMERG and GSMaP SPPs against the ground precipitation data in the Yellow River source region (YRSR) of China. Considering that the statistical evaluations of GPM-era IMERG and GSMaP SPPs in real-time, near-real-time, and post-real-time versions at multiple time scales have not been reported, the main goals of this study are as follows: to statistically evaluate the quality of three IMERG (IMERG-E, IMERG-L, and IMERG-F) and five GSMaP (GSMaP-Gauge, GSMaP-MVK, GSMaP-NRT, GSMaP-Gauge-NRT, and GSMaP-NOW) SPPs against ground precipitation observations; to compare the full sets of IMERG and GSMaP SPPs, including the near-real, real-, and post-real-time versions, at multiple temporal and spatial scales.
The findings of this study are expected to provide SPP users with useful guidelines on the choices of the latest GPM-era SPPs for hydrometeorological applications in YRSR and promote the SPP studies to refine the IMERG and GSMaP algorithms in future versions.

2. Study Area and Data
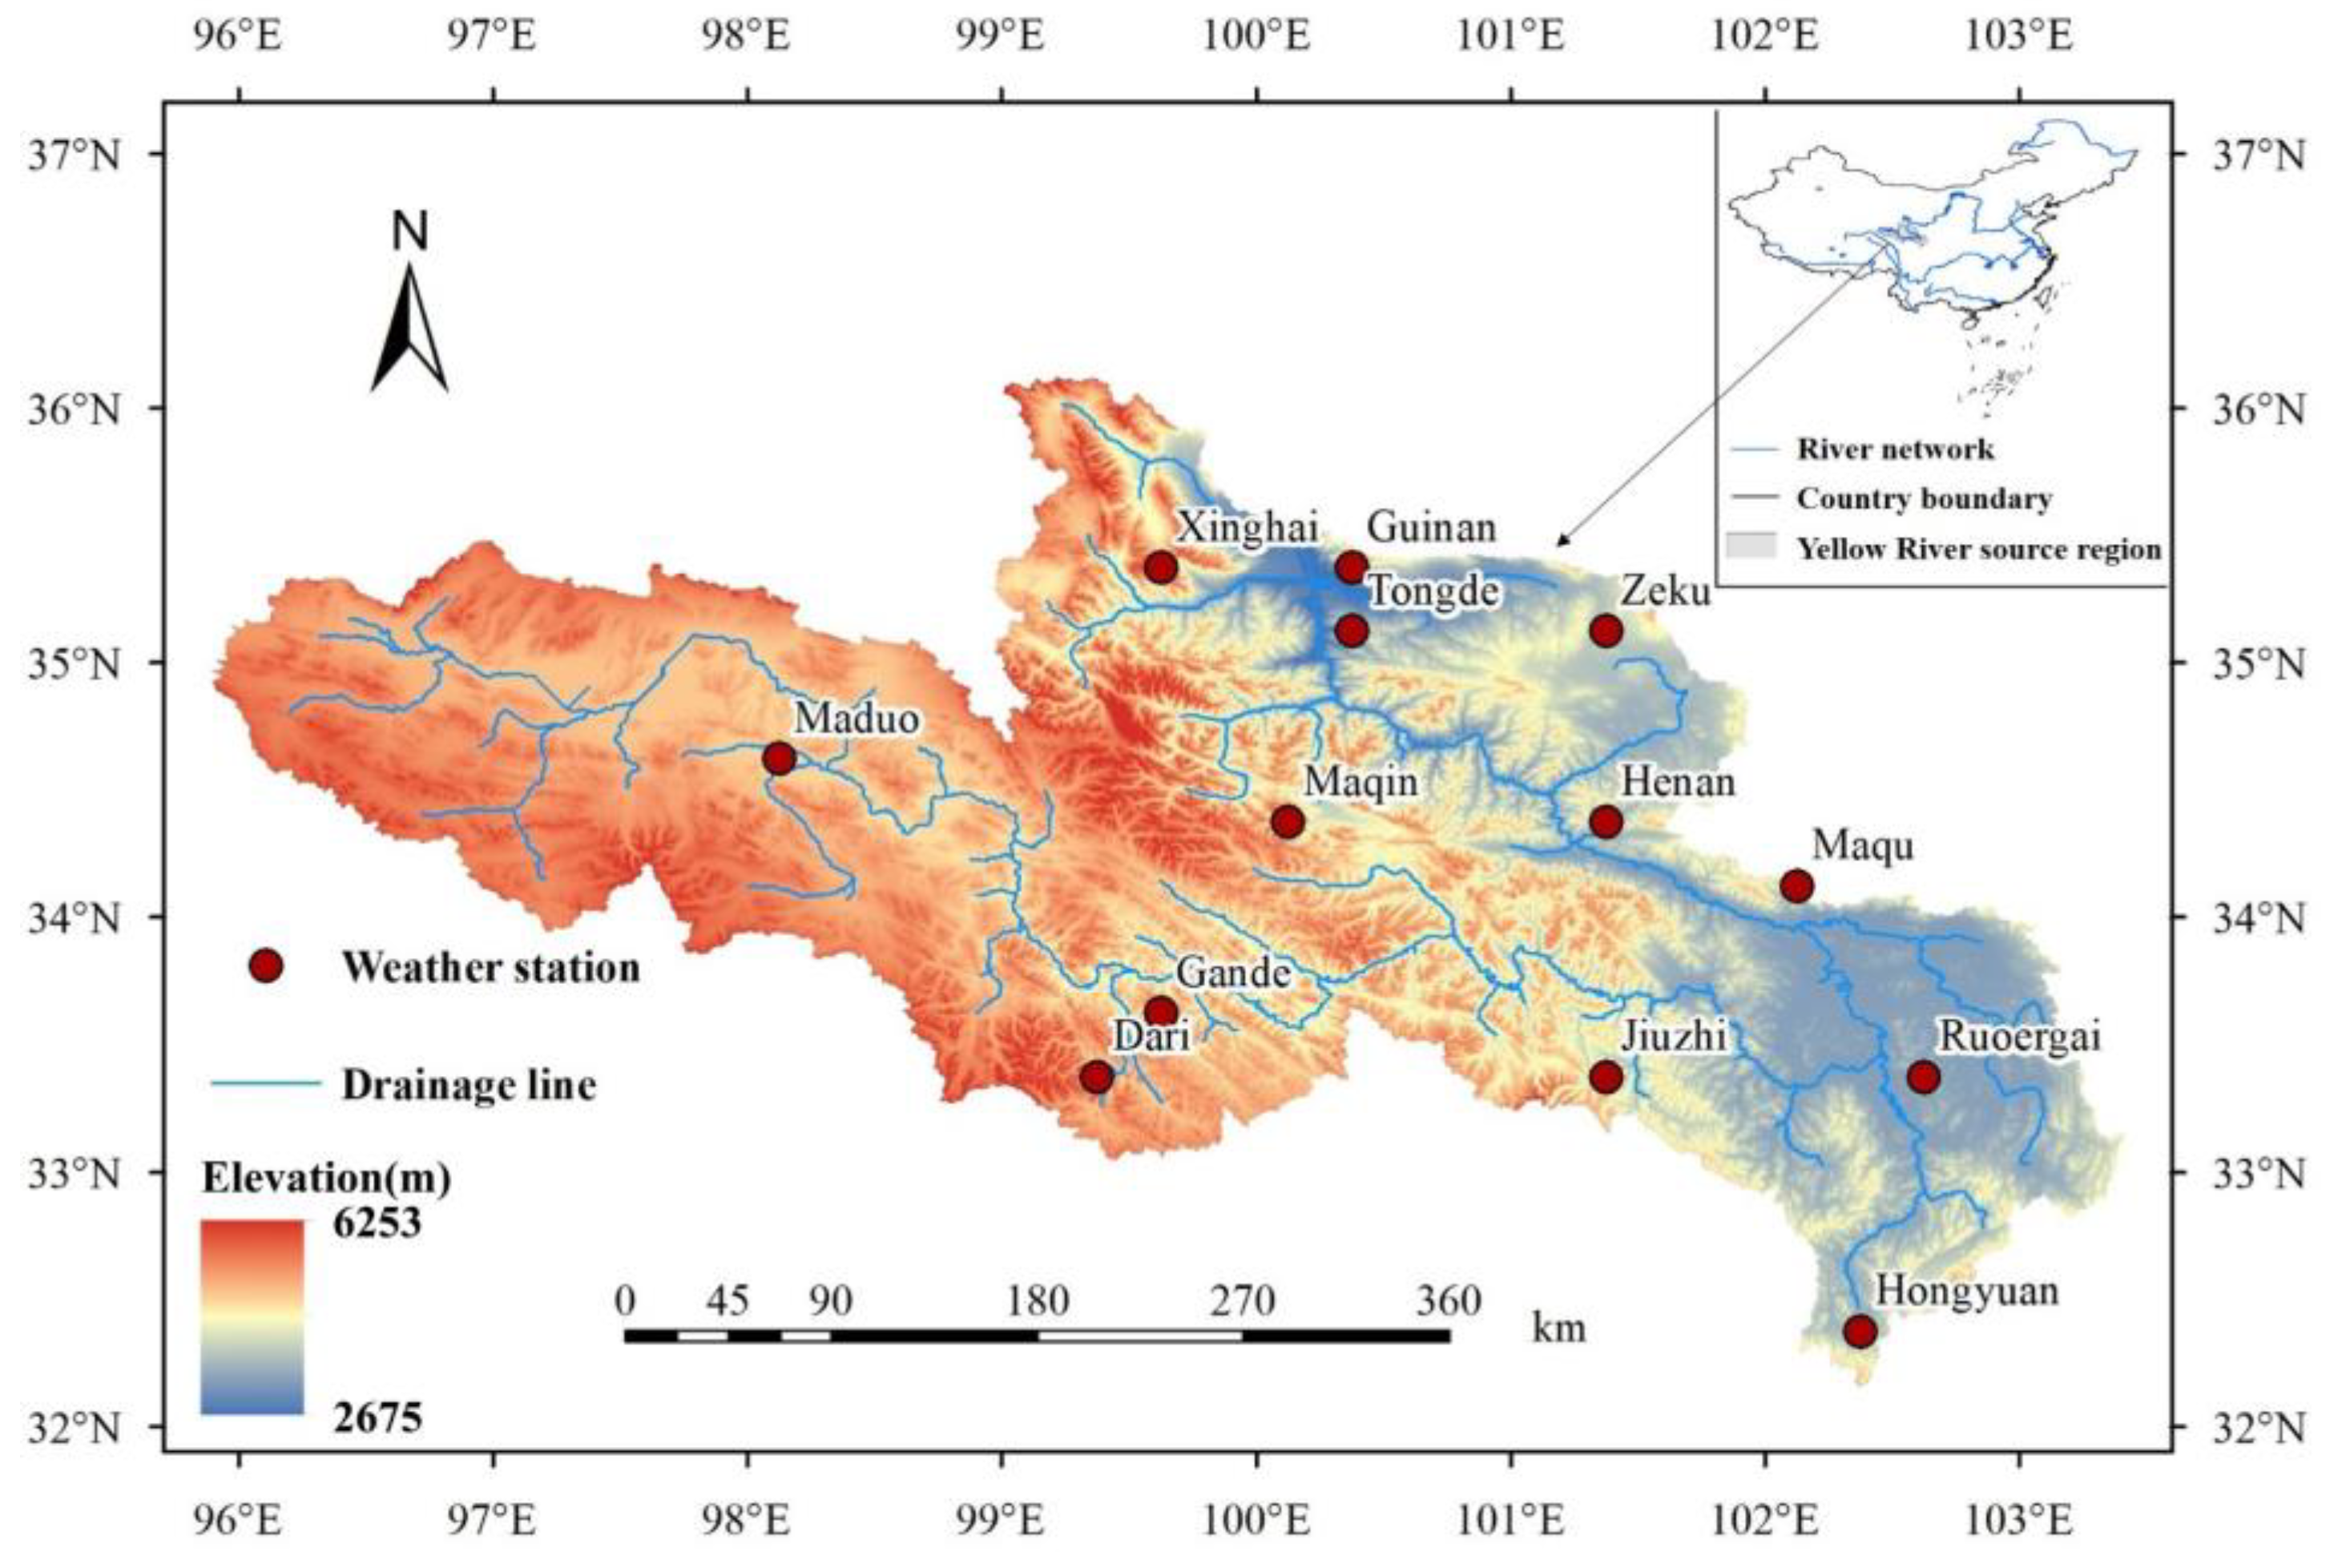
2.1. Study Area

This study selected the YRSR as the research area. YRSR is located in the northeast of the Qinghai–Tibet Plateau, China within the latitude belt of 32.1°–36.8° N and longitude belt of 95.8°–103.5° E (Figure 1). YRSR covers a drainage area of 121,972 km2, accounting for 15% of the total area of the Yellow River basin and contributes approximately 35% of the total water yield of the basin [43]. Consequently, YRSR plays an important role in water supply for the entire Yellow River basin. The altitude of the region ranges from 2677 to 6253 m above sea level, with a distinctively decreasing trend from west to east (Figure 1). Grassland, lake, river, and glacier are the main land cover types in YRSR, among which grassland accounts for 80%. This region is dominated by typical Qinghai–Tibet Plateau climate system with wet and cool summer and dry and cold winter. The annual mean precipitation is 530 mm, and precipitation is mainly concentrated from June to September, accounting for 75–90% of the total precipitation [44]. Snowfall mainly occurs from November to March. YRSR is the most important water source area and ecological conservation area in the Yellow River basin. Thus, it is necessary to acquire accurate precipitation datasets for hydrological and ecological studies and for sustainable water resource management in this area. However, due to the harsh environment, the existing rain-gauge network managed by the Chinese Meteorological Administration (CMA) is very sparse with a density of one station per 1° × 1° grid (Figure 1), which hinders the accurate hydrological prediction and rational water resource management and operation [36]. Therefore, the quality of SPPs in YRSR should be evaluated to provide an alternative data source for hydrometeorological and ecological applications.

2.2. Ground Precipitation Data

In this study, the hourly precipitation records at 13 weather stations from 1 January 2014 to 31 December 2018 were obtained from CMA, and a strict data check was carried out by CMA in terms of internal and spatial consistency and extreme values [45]. Among the 13 weather stations, the Dari and Maduo stations were included in the Global Precipitation Climatology Center (GPCC) gridded gauge-analysis precipitation dataset [46].

2.3. Satellite Precipitation Products

This study evaluated eight GPM-era SPPs (Table 1), which are described briefly below.

2.3.1. IMERG Products

IMERG was first released in March 2014, and the latest IMERG V06A products have been provided by NASA in March 2019. The current IMERG SPPs are available in 0.1° × 0.1° spatial resolution and half-hourly temporal resolution between the 60° N–S latitude band. Considering the level 3 precipitation estimation algorithm of GPM, IMERG is intended to intercalibrate, merge, and interpolate multiple satellite microwave precipitation estimates over the entire globe. The IMERG system provides three products with different latencies. The IMERG system is ran twice in near-real-time to provide IMERG-E and IMERG-L calibrated with climatological coefficients varying by month and location with 4 and 14 h latencies, respectively. IMERG combines the GPCC monthly gauge-analysis precipitation dataset, providing IMERG-F with a latency of 3.5 months [47]. Considering that the ground precipitation data are in hourly time intervals, these IMERG products were aggregated to hourly intervals in this study. The IMERG-E and IMERG-L data from 1 June 2014 to 31 December 2018 and IMERG-F data from 1 January 2014 to 31 December 2018 were downloaded from the Precipitation Measurement Missions website (http://pmm.nasa.gov/data-access/downloads/gpm).

2.3.2. GSMaP Products

GSMaP is a blended microware-IR precipitation product of the GPM mission, and the latest GSMaP version 7 (V7) products were released in January 2017. In this study, four GSMaP V7 products were evaluated: GSMaP-Gauge, GSMaP-MVK, GSMaP-NRT, and GSMaP-Gauge-NRT. The GSMaP-NOW SPP was also evaluated in this study, and it was produced using the GSMaP V06 algorithm. Similar to IMERG products, these GSMaP SPPs are available in near-real-time versions (GSMaP-NRT and GSMaP-Gauge-NRT) and post-real-time versions (GSMaP-Gauge and GSMaP-MVK). GSMaP-NRT uses the JAXA Global Rainfall Watch system, which combines available microwave imagers and sounders to retrieve rain rate with a 4 h latency. GSMaP-MVK is a reanalysis version of global rainfall map in GSMaP-NRT, which refines precipitation propagation forward and backward and employs PMW and sounders with a latency of 3 days. On the basis of PMW and IR, GSMaP-Gauge reduces the total retrieval errors by using the CPC unified gauge-based analysis of global daily precipitation dataset and features a latency of 3 days. GSMaP-gauge-NRT requires no direct gauge measurement but uses the error parameters derived from GSMaP-Gauge to adjust the GSMaP-NRT precipitation estimates with a 4 h latency. Moreover, GSMaP-NOW is the real-time version of GSMaP project. This version uses PMW observations and applies a 0.5 h forward extrapolation via cloud motion vector from the geostationary satellite. All these GSMaP SPPs are in 1 h interval, except for GSMaP-NOW with a temporal resolution of 30 min. To unify the temporal scale for SPP evaluation, we converted GSMaP-NOW into 1 h intervals. In this study, GSMaP-Gauge and GSMaP-MVK were evaluated from 1 March 2014 to 31 December 2018. Meanwhile, GSMaP-NRT and GSMaP-Gauge-NRT were assessed from 17 January 2017 to 31 December 2018. The evaluation period of GSMaP-NOW was from 29 March 2017 to 31 December 2018. All these data were obtained from JAXA Global Watch website (https://sharaku.eorc.jaxa.jp/GSMaP/).

3. Methodology

In this study, the IMERG and GSMaP precipitation estimates at the grid boxes, where the rain gauges are located, were statistically compared with the corresponding ground precipitation observations. Considering that the local ground rain gauges could only measure precipitation above 0.1 mm/h, this study defined 0.1 mm/h as the threshold to distinguish the precipitation and no-rain events. Thus, satellite-derived precipitation below 0.1 mm/h was set to zero to eliminate the effect of drizzles. We describe the statistical method used in this study below.

3.1. Statistical Metrics

Nine statistical metrics were selected to evaluate the quality of the eight SPPs versus gauge-based precipitation at different temporal scales (hourly, daily, monthly, and seasonal scales) (Table 2). These metrics could be generally divided into four categories. The first statistical metric category, that is, the Pearson correlation coefficient (CC), describes the correlation between SPP estimates and observed ground precipitation data. The second category, including mean error (ME), mean absolute error (MAE), root-mean-squared error (RMSE), and relative bias (BIAS), describes the deviation of SPPs from ground precipitation data. ME estimates the average precipitation error, but the positive and negative errors could partially offset. Accordingly, MAE was selected as a supplementary index. RMSE measures the average absolute deviation between SPP estimates and observed values. BIAS represents the systematic BIAS of the SPP estimates. The third category measures the precipitation detection capability of SPPs; it includes probability of detection (POD), false alarm ratio (FAR), and critical success index (CSI). POD describes the fraction of precipitation events that are correctly detected by satellites among all the real precipitation events. FAR denotes the proportion of the unreal precipitation events among all the precipitation events identified by the satellites. CSI combines the attributes of POD and FAR and measures the overall proportion of all precipitation events that are correctly detected by the satellites.
To analyze the error distribution characteristics of SPPs, we used the coefficient of skewness (SK) to measure the asymmetry of precipitation error distribution. If the SPP-based precipitation errors are symmetrically distributed, then SK is equal to zero. When the value of SK is positive (or negative), the SPP-based precipitation errors are positively (or negatively) skewed. The larger the value of SK, the greater the degree of deviation.

3.2. Confusion Matrix for Daily Precipitation Evaluation

A confusion matrix was adopted as a supplementary evaluation method to further investigate the error characteristics and detection capability of SPPs. Confusion matrix, also known as matching matrix, has been widely applied in machine learning, particularly in statistical classifications [48]. Confusion matrix is a specific table used to describe the performance of test data to match true values [49]. In this study, the confusion matrix was built to evaluate how the satellites capture precipitation occurrence for each daily precipitation amount class. The confusion matrix summarizes the capability of SPPs to reproduce a given observed precipitation [50]. The values in each column in the confusion matrix present the frequency distribution of SPP-based precipitation amount within each gauge-based daily precipitation amount class. Subsequently, the values of each column add up to 1. Ideally, the matrix should be antidiagonal with a value of 1 for the matrix elements along the antidiagonal line and the value of 0 for the remaining elements.

4. Results

4.1. Statistical Evaluation of IMERG SPPs

Considering that the available IMERG-E, IMERG-L, and IMERG-F SPPs have different time periods, this study selected overlapping time periods (1 June 2014 to 31 December 2018) as the evaluation period for IMERG SPPs, and the evaluation was conducted in terms of statistical indices at multiple temporal scales, precipitation error distribution, and precipitation frequency distribution.

4.1.1. Statistical Indices at Multiple Temporal Scales

The IMERG-E, IMERG-L, and IMERG-F precipitation estimates at the grid cells, where the 13 rain gauges are located, were statistically evaluated against the ground precipitation observations from 1 June 2014 to 31 December 2018. Table 3 summarizes the statistical metrics at hourly, daily, monthly, and seasonal scales. As for correlation between ground precipitation measurements and SPPs, CCs are statistically significant for all SPPs at all temporal scales (p-value < 0.0001) (Table 3). At all temporal scales, the near-real-time products (IMERG-E and IMERG-L) obtained similar CC values, which were slightly lower than those of IMERG-F. In addition, as the temporal scale decreases from seasonal intervals to hourly time steps, the CC values drop sharply, indicating that IMERG SPPs are poor at capturing precipitation dynamics at a fine temporal scale in YRSR. This finding is consistent with the results of Yuan et al. [46]. The main reason is that, owing to the SPP algorithm itself, the SPP estimates at short time intervals usually contain considerable errors, and the aggregation of SPP-based precipitation estimates from finer to coarser temporal resolutions might partially offset the precipitation errors in shorter time intervals, leading to the increased CCs in longer time steps. For ME, IMERG-E and IMERG-L evidently underestimated precipitation, and IMERG-F showed a slight overestimation. Notably, IMERG-F featured a higher MAE (0.111 and 1.606 mm) than IMERG-E (0.094 and 1.487 mm) and IMERG-L (0.093 and 1.499 mm) at both hourly and daily scales. These phenomena indicate that the positive errors could partially offset the negative errors. At monthly and seasonal scales, the MAEs of IMERG-E and IMERG-L were almost twice as much as those of IMERG-F, suggesting that the aforementioned phenomena also occur at monthly and seasonal scales. Moreover, although IMERG-F generally outperformed IMERG-E and IMERG-L, a considerable margin of error was still observed. Mathematically, MAE is equivalent to the L1 norm, RMSE is equivalent to the L2 norm, and RMSE is more sensitive to outliers than MAE. Table 3 demonstrates that IMERG-F achieved slightly higher RMSE values than IMERG-E and IMERG-L at both hourly and daily time scales and presented considerably lower RMSE values than IMERG-E and IMERG-L at both monthly and seasonal scales, similar to the situation of MAE. This finding indicates that IMERG SPPs contain several outliers. Regarding BIAS, IMERG-E and IMERG-L substantially underestimated precipitation by 33.17% and 34.45%, respectively, whereas IMERG-F achieved a substantially lower systematic BIAS (2.04%) owing to the gauge-based adjustment by using the GPCC monthly gridded gauge-analysis precipitation dataset. In terms of the capability of SPPs in detecting precipitation events, the three IMERG SPPs performed similarly, with PODs and CSIs higher than 0.69 and 0.53, respectively, and FARs lower than 0.32. Overall, the post-real-time IMERG-F outperformed the near-real-time IMERG-E and IMERG-F at all time scales.

4.1.2. Precipitation Error Distribution

The histograms of satellite precipitation errors were plotted to further investigate the characteristics of IMERG error distribution at different temporal scales (Figure 2). An error interval of 5 mm was defined to plot the hourly and daily precipitation error histograms, and an interval of 10 mm was set for monthly and seasonal histograms. Figure 2a demonstrates that the errors of IMERG SPPs are mainly concentrated between −5 and 5 mm at the hourly scale. The analysis of statistical metrics (Table 3) indicates that the positive errors of IMERG-F could partially offset its negative errors. Figure 2a illustrates that the errors of IMERG-F are symmetrically distributed with SK of 0.02 (Table 4). However, the errors of IMERG-E and IMERG-L showed a negative deviation with negative SK values (−0.26 and −0.27, respectively; Table 4). The daily histograms of IMERG-E and IMERG-L errors mainly showed an evident negative skew (Figure 2b), indicating a significant precipitation underestimation. Notably, IMERG-E and IMERG-L featured larger outliers that are above 50 mm or below −50 mm (Figure 2a,b) than those of IMERG-F. This finding implies that the near-real-time versions of IMERG SPPs still presented substantial uncertainties. For monthly error distribution, IMERG-E and IMERG-L exhibited visibly higher magnitudes of precipitation underestimation than IMERG-F (Figure 2c). The IMERG-F errors were mainly concentrated in the error range of −50 to 70 mm with a relatively low SK value (0.28). By contrast, IMERG-E and IMERG-L had SK values of −1.62 and −1.78, respectively (Table 4). In addition, the monthly IMERG-E and IMERG-L errors were mostly concentrated between −90 and −20 mm, demonstrating a considerable systematic underestimation. A similar finding was obtained in the seasonal error histogram (Figure 2d). In general, IMERG-E and IMERG-L underestimated precipitation at all evaluated scales, whereas the errors of IMERG-F were symmetrically distributed. At monthly and seasonal scales, IMERG-F outperformed IMERG-E and IMERG-L in terms of the magnitude and distribution of errors.

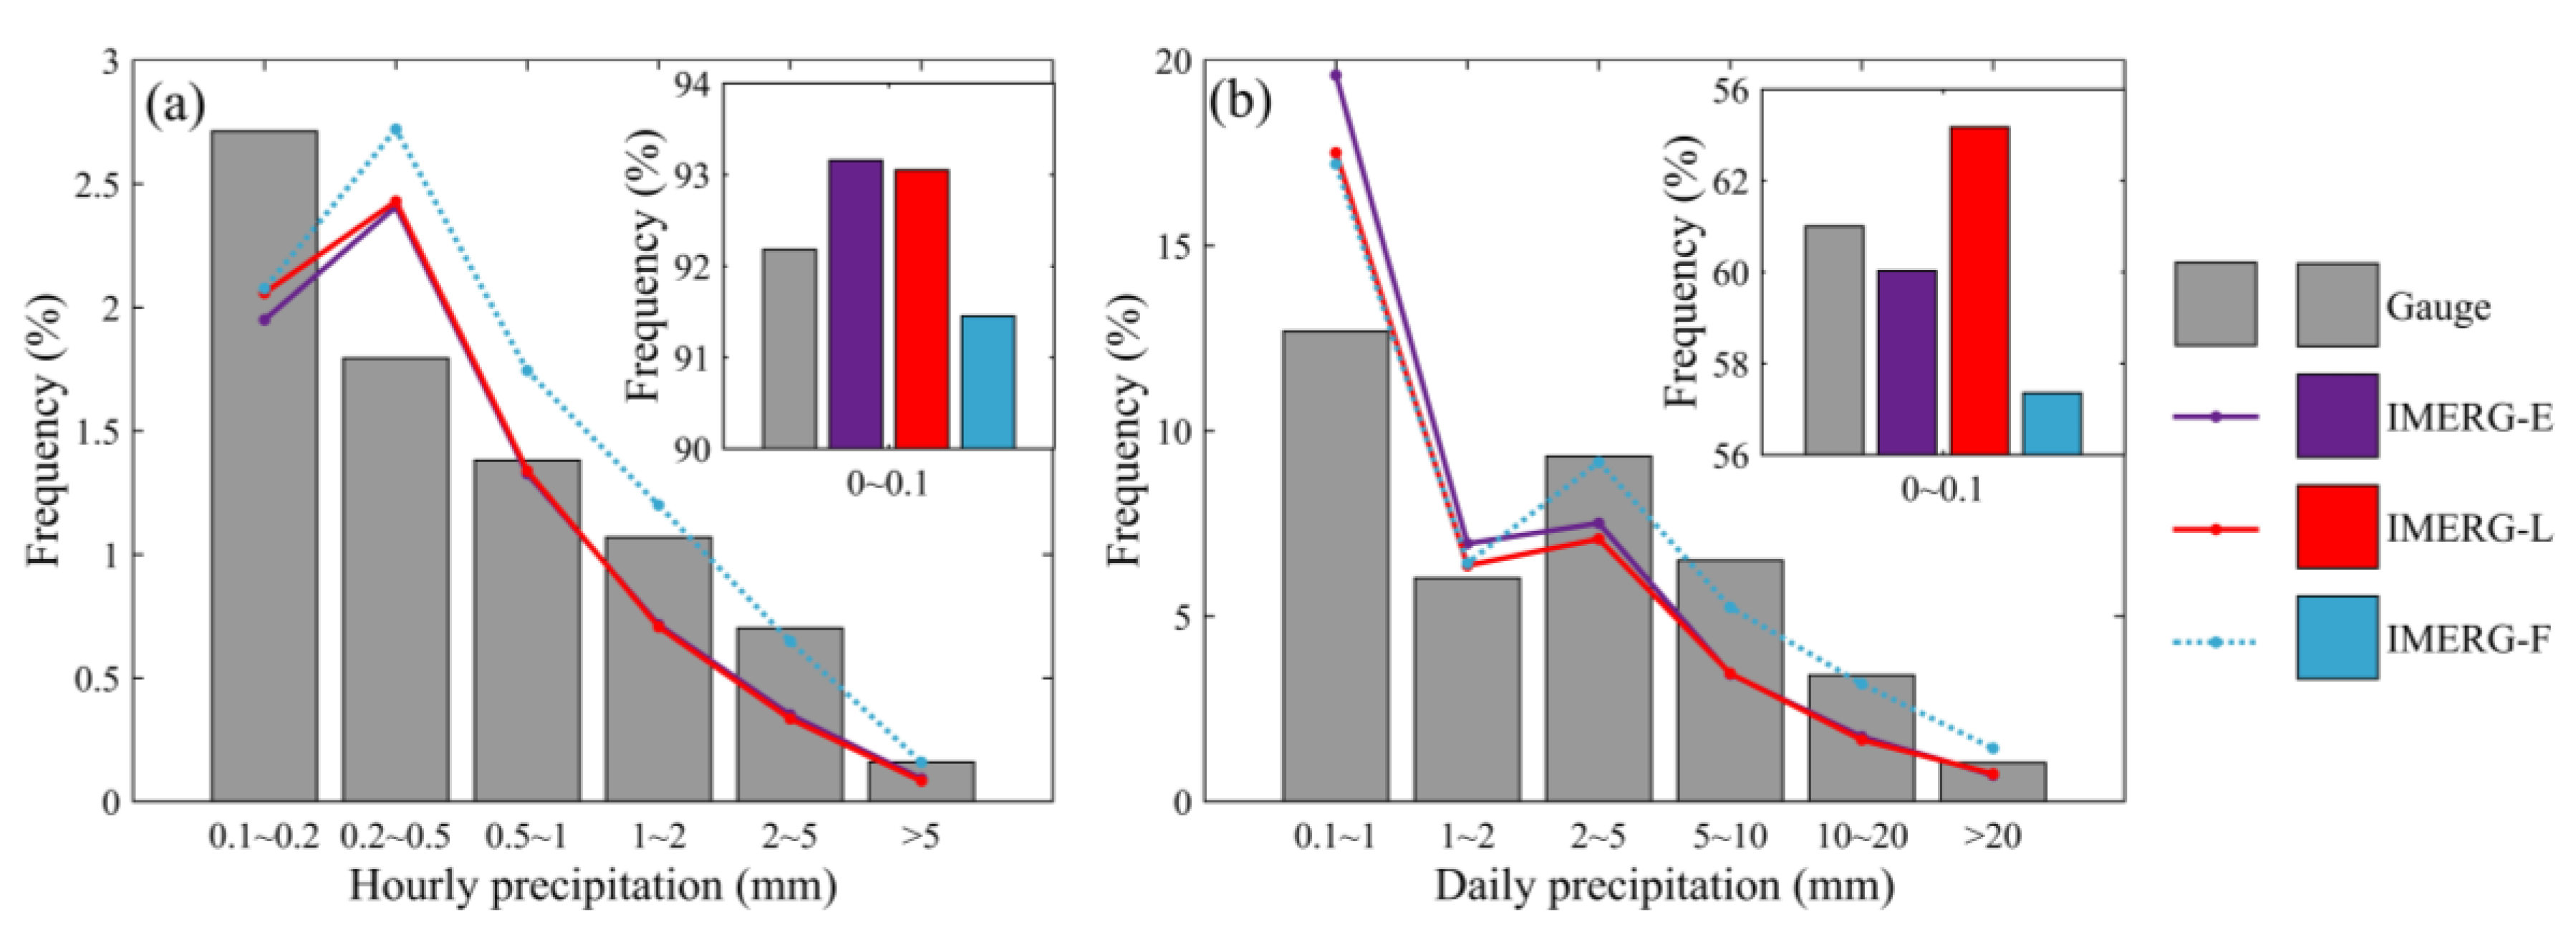
4.1.3. Precipitation Frequency Distribution

This study compared the hourly and daily IMERG-SPP precipitation frequency distribution with the ground precipitation observations. Figure 3a shows that over 92% of hourly gauge-based precipitation records were under 0.1 mm. IMERG-E and IMERG-L resulted in slight overestimations of 0.9% and 0.8%, respectively, and IMERG-F resulted in a mild underestimation of 0.7%. For hourly precipitation ranging from 0.1 to 0.2 mm, all IMERG SPPs resulted in an evident underestimation. In addition, all IMERG SPPs overestimated the occurrence frequency of hourly precipitation between 0.2 and 0.5 mm, and IMERG-F presented the highest overestimation. In general, the three IMERG SPPs captured the frequency distribution pattern of the gauge-based precipitation for hourly precipitation higher than 0.5 mm despite certain deviations at different precipitation intensity levels. IMERG-E and IMERG-L presented a remarkable underestimation for hourly precipitation over 0.5 mm, and IMERG-F approximated the frequency distribution of the gauge observations. This finding indicates that IMERG-F possesses a better capability over IMERG-E and IMERG-F in detecting moderate and heavy precipitation events.
For the frequency of daily precipitation under 0.1 mm, IMERG-E and IMERG-F presented underestimations of 1.0% and 3.7%, respectively, whereas IMERG-L overestimated this frequency by 2.2% (Figure 3b). All IMERG SPPs overestimated the frequency of daily precipitation between 0.1 and 1 mm, and IMERG-E presented the highest overestimation. For the total frequency of daily precipitation under 1 mm, IMERG-F approximated that of the gauge value, whereas IMERG-E and IMERG-L resulted in overestimations of 6.1% and 7.2%, respectively. This finding indicates that IMERG-F featured the best detection capability for the total frequency for precipitation under 1 mm, but a certain deviation remained in the specific distribution. Further improvements are needed to distinguish between no-rain and light-rain events for IMERG SPPs. For the frequency of daily precipitation over 1 mm, IMERG-F performs more closely to the gauge observations, whereas IMERG-E and IMERG-L showed a slight overestimation for daily precipitation between 1 and 2 mm and an underestimation for daily precipitation over 2 mm.

4.2. Statistical Evaluation of GSMaP SPPs

Considering the different time periods of the released GSMaP-Gauge, GSMaP-MVK, GSMaP-NRT, GSMaP-Gauge-NRT, and GSMaP-NOW SPP datasets, an overlapped time period (29 March 2017 to 31 December 2018) was selected as the evaluation period for GSMaP SPPs.

4.2.1. Statistical Indices at Different Temporal Scales

Table 5 shows that CCs are statistically significant for all SPPs at all temporal scales (p-value < 0.0001). GSMaP-Gauge achieved the highest CC at all temporal scales (0.31−0.96), whereas GSMaP-NRT demonstrated the lowest correlation with the gauge-based precipitation at hourly and daily scales (CC = 0.16, 0.46, respectively). GSMaP-NOW presented a higher correlation with the ground observations (CC = 0.26, 0.53, respectively) than GSMaP-NRT at hourly and daily scales. The lowest CCs at monthly and seasonal scales reached 0.75 and 0.78, respectively. Similar to IMERG SPPs, all GSMaP SPPs demonstrated higher CC values as temporal scale increases. For ME, all GSMaP SPPs exhibited a precipitation overestimation with various magnitudes, except for GSMaP-NOW with an evident underestimation. GSMaP-Gauge presented the lowest ME, followed by GSMaP-Gauge-NRT, whereas GSMaP-MVK obtained the highest value. Notably, the positive errors still partially offset the negative ones. For instance, at the daily scale, GSMaP-MVK featured a larger ME (1.178 mm) than GSMaP-NRT (0.968 mm), whereas GSMaP-NRT exhibited a larger MAE (2.702 mm) than GSMaP-MVK (2.642 mm). In terms of RMSE, GSMaP-gauge showed the lowest precipitation errors at all time scales, and GSMaP-NRT featured the highest. For BIAS, GSMaP-gauge manifested the lowest systematic errors (BIAS = 2.88%) due to the precipitation adjustment by using the CPC precipitation dataset. GSMaP-Gauge-NRT mildly overestimated precipitation by 11.24%. GSMaP-MVK and GSMaP-NRT resulted in significant overestimations of 58.77% and 48.29%, respectively. By contrast, GSMaP-NOW considerably underestimated precipitation by 23.14%. In terms of the contingency of SPPs, GSMaP SPPs demonstrated poor performance at the hourly scale but showed significant improvement at the daily scale. GSMaP-Gauge obtained the highest POD but with the highest FAR at the hourly scale, indicating that GSMaP-Gauge over-detected the occurrence of precipitation events. Furthermore, GSMaP-Gauge obtained the highest CSI at the daily scale (0.68) among all GSMaP SPPs, whereas GSMaP-NOW provided the lowest value for the daytime precipitation estimates (0.50). In general, for the post-real-time SPPs, GSMaP-Gauge performed better than other GSMaP SPPs in terms of various statistical metrics, except for FAR at the hourly scale. The near-real time SPP, GSMaP-Gauge-NRT, demonstrated better performance than GSMaP-NRT.

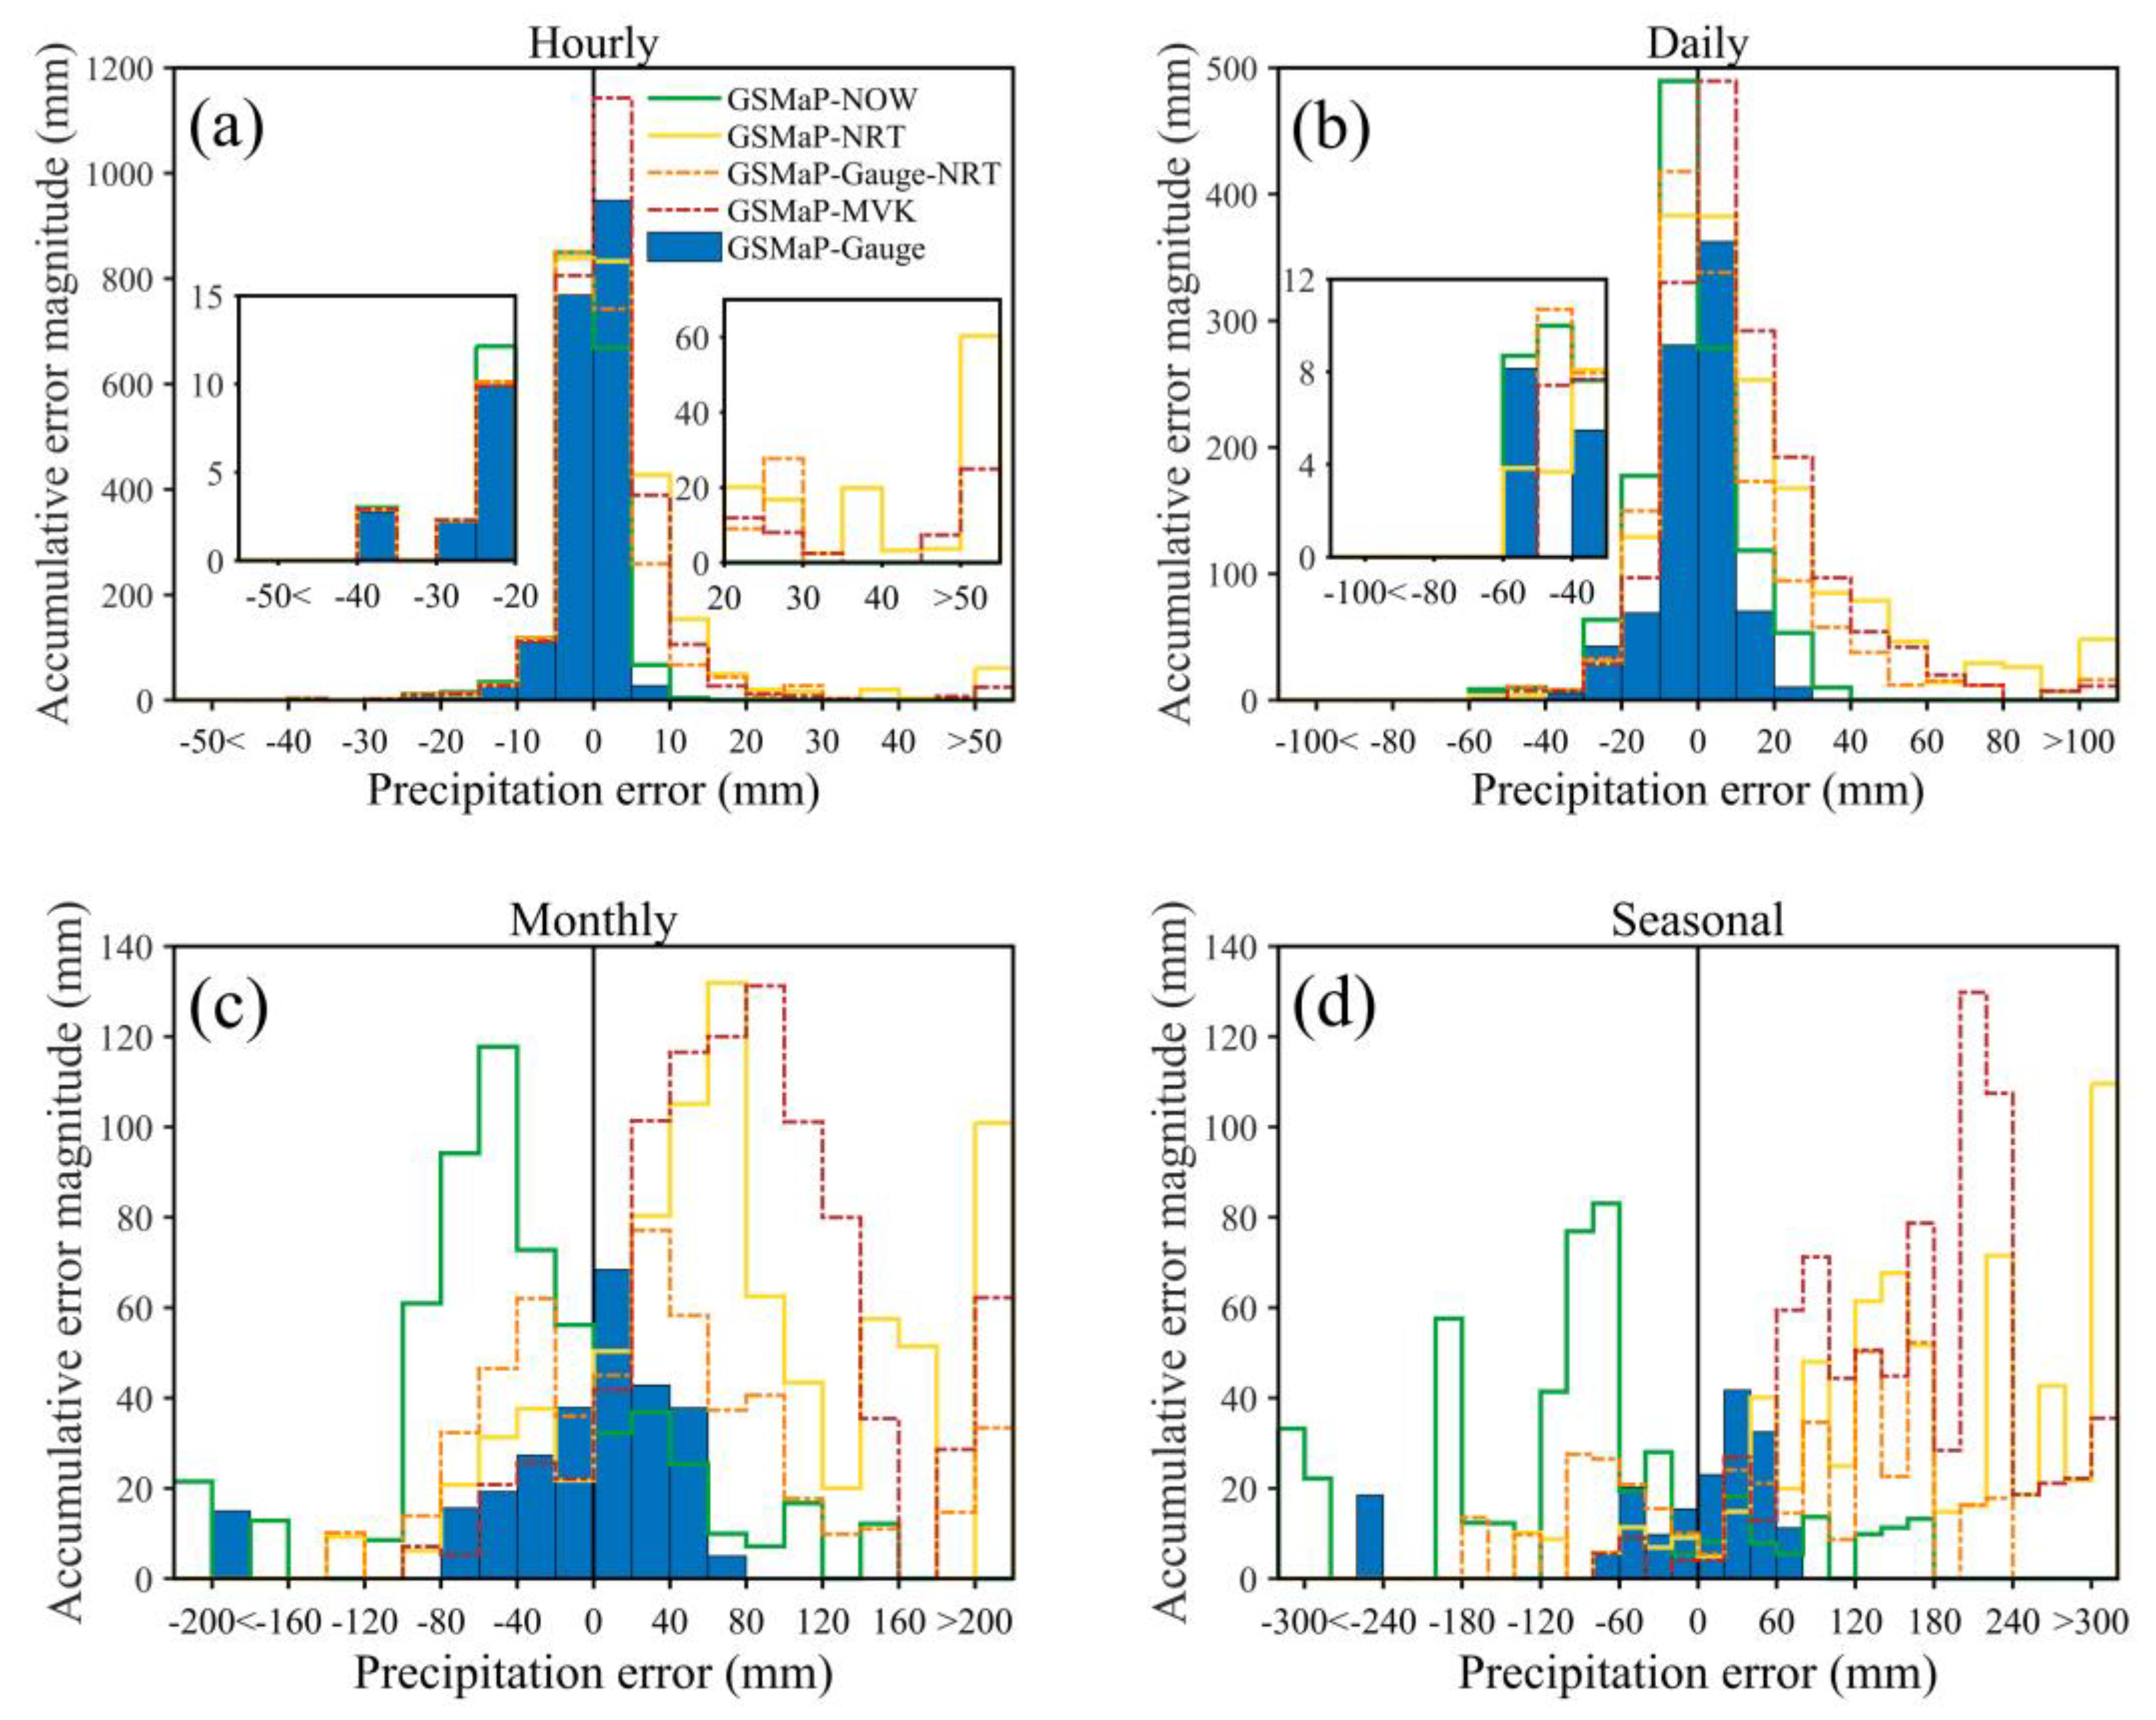
4.2.2. Precipitation Error Distribution

Figure 4 demonstrates the histograms of GSMaP precipitation errors at different temporal scales. The precipitation error intervals were defined as 5 mm for the hourly scale, 10 mm for the daily scale, and 20 mm for the monthly and seasonal scales. Figure 4a shows that the precipitation errors of GSMaP-Gauge and GSMaP-NOW contained several outliers that are mainly concentrated in the error range of −5 to 5 mm at the hourly scale. The other GSMaP SPPs demonstrated many positive errors with limited error outliers. In general, GSMaP-Gauge-NRT demonstrated better performance in almost each error class and possessed fewer error outliers than GSMaP-NRT (Figure 4a,b), mainly resulting from the precipitation adjustment procedure by using the error adjustment parameters of GSMaP-Gauge. As for monthly and seasonal precipitation error distributions, GSMaP-Gauge and GSMaP-Gauge-NRT exhibited relatively smaller error magnitudes than the other GSMaP SPPs (Figure 4c,d). Notably, GSMaP-NOW showed several error outliers at monthly and seasonal scales but almost no outliers at hourly and daily scales. This finding indicates that GSMaP-NOW possesses poor applicability at monthly and seasonal scales. GSMaP-MVK and GSMaP-NRT showed a significant precipitation overestimation with positively skewed histograms and larger SK values at monthly and seasonal scales (Table 6). By contrast, GSMaP-Gauge and GSMaP-Gauge-NRT presented a symmetric error distribution with smaller SK values (Figure 4c,d, respectively; Table 6).

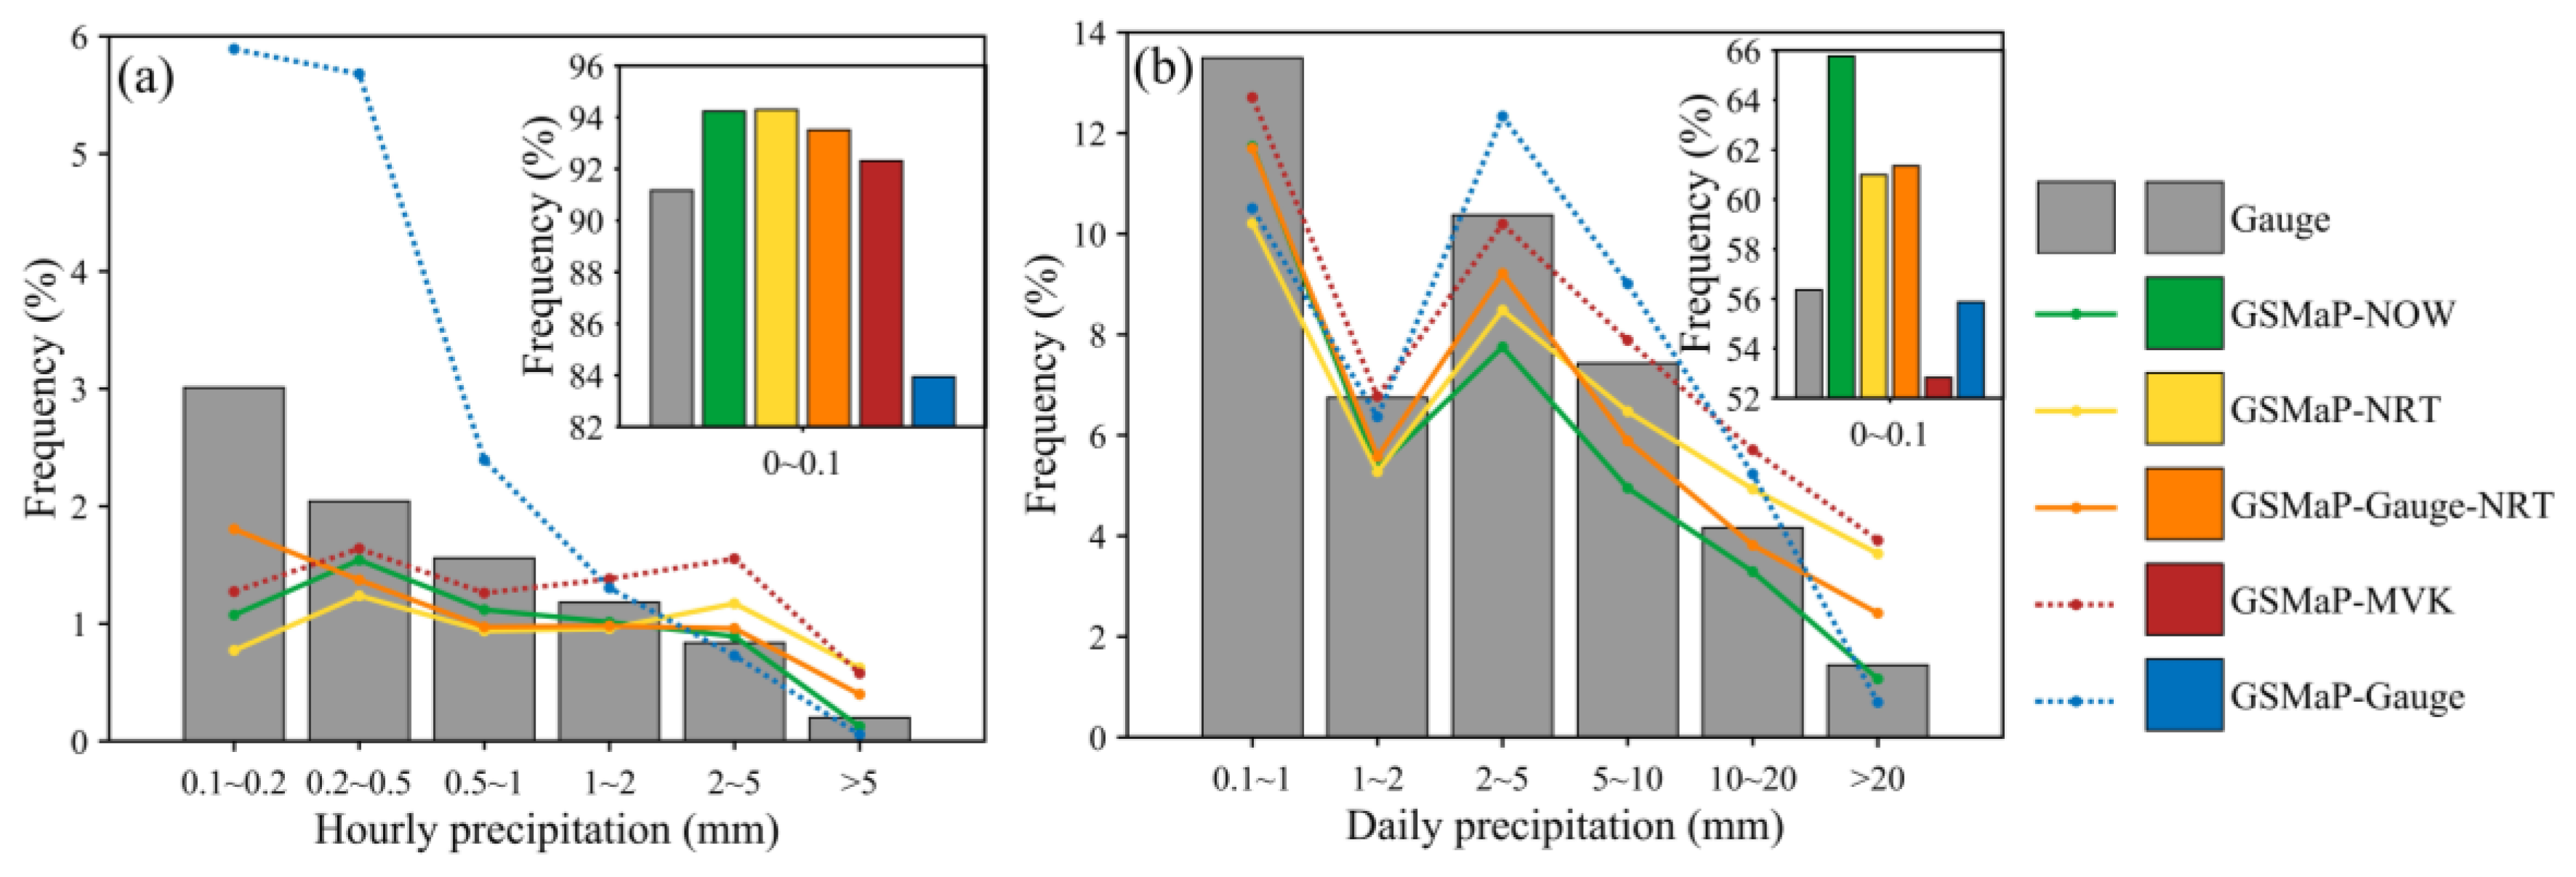
4.2.3. Precipitation Frequency Distribution

Figure 5a illustrates that at the hourly scale, GSMaP-Gauge underestimated the frequency of hourly precipitation under 0.1 mm by 7.2%, whereas other GSMaP SPPs overestimated this frequency by 1.1–3.1%. Furthermore, GSMaP-Gauge significantly overestimated hourly precipitation ranging from 0.1 to 1 mm, and the other GSMaP SPPs resulted in underestimation. Notably, the total frequency of all GSMaP SPPs for the precipitation under 0.5 mm was relatively close. This finding indicates that GSMaP SPPs, especially GSMaP-Gauge, still need considerable improvement in distinguishing between no-rain and light-rain events. GSMaP-MVK showed a distinct underestimation for precipitation under 1 mm and significantly overestimated the occurrence frequency of precipitation over 1 mm. In comparison with GSMaP-NRT, GSMaP-Gauge-NRT is notably closer to the observed frequency distribution. GSMaP-NOW underestimated the occurrence frequency of each precipitation class, except for daily precipitation between 2 and 5 mm.
For the frequency distribution of daily precipitation, all GSMaP SPPs generally captured the pattern of the observed frequency distribution (Figure 5b). GSMaP-MVK and GSMaP-Gauge resulted in slight underestimations of 0.5% and 3.5%, respectively. GSMaP-NOW, GSMaP-NRT, and GSMaP-Gauge-NRT resulted in overestimations of 9.4%, 4.6%, and 5.0%, respectively. GSMaP-NOW presented excessive overestimation of precipitation under 0.1 mm and consequently underestimated the frequency on each precipitation class at daily scale, indicating that its detection capability needs to be further improved. GSMaP-Gauge underestimated the frequency of precipitation under 2 mm and presented overestimation for precipitation between 2 and 20 mm. GSMaP-MVK performed close to the frequency distribution of gauge for precipitation between 0.1 and 10 mm but grossly overestimated the occurrence frequency of heavy rain (≥ 10 mm). GSMaP-Gauge-NRT performed better than GSMaP-NRT at the daily scale but not as evidently at the hourly scale.

4.3. IMERG SPPs Versus GSMaP SPPs

To evaluate and compare the quality of IMERG and GSMaP SPPs, we further analyzed the temporal variation of the SPP-based precipitation estimates and the spatial pattern of the statistical metrics. In addition, the confusion matrix method was used to investigate how well the IMERG and GSMaP SPPs captured precipitation events at different levels. The common time slot of all SPPs (29 March 2017 to 31 December 2018) was selected as the evaluation time period. To facilitate rational assessment, we divided eight GSMaP and IMERG SPPs into two groups, namely, the real-time and near-real-time group, which included IMERG-E, IMERG-L, GSMaP-NOW, GSMaP-NRT, and GSMaP-Gauge-NRT, and the post-real-time group, which consisted of IMERG-F, GSMaP-Gauge, and GSMaP-MVK.

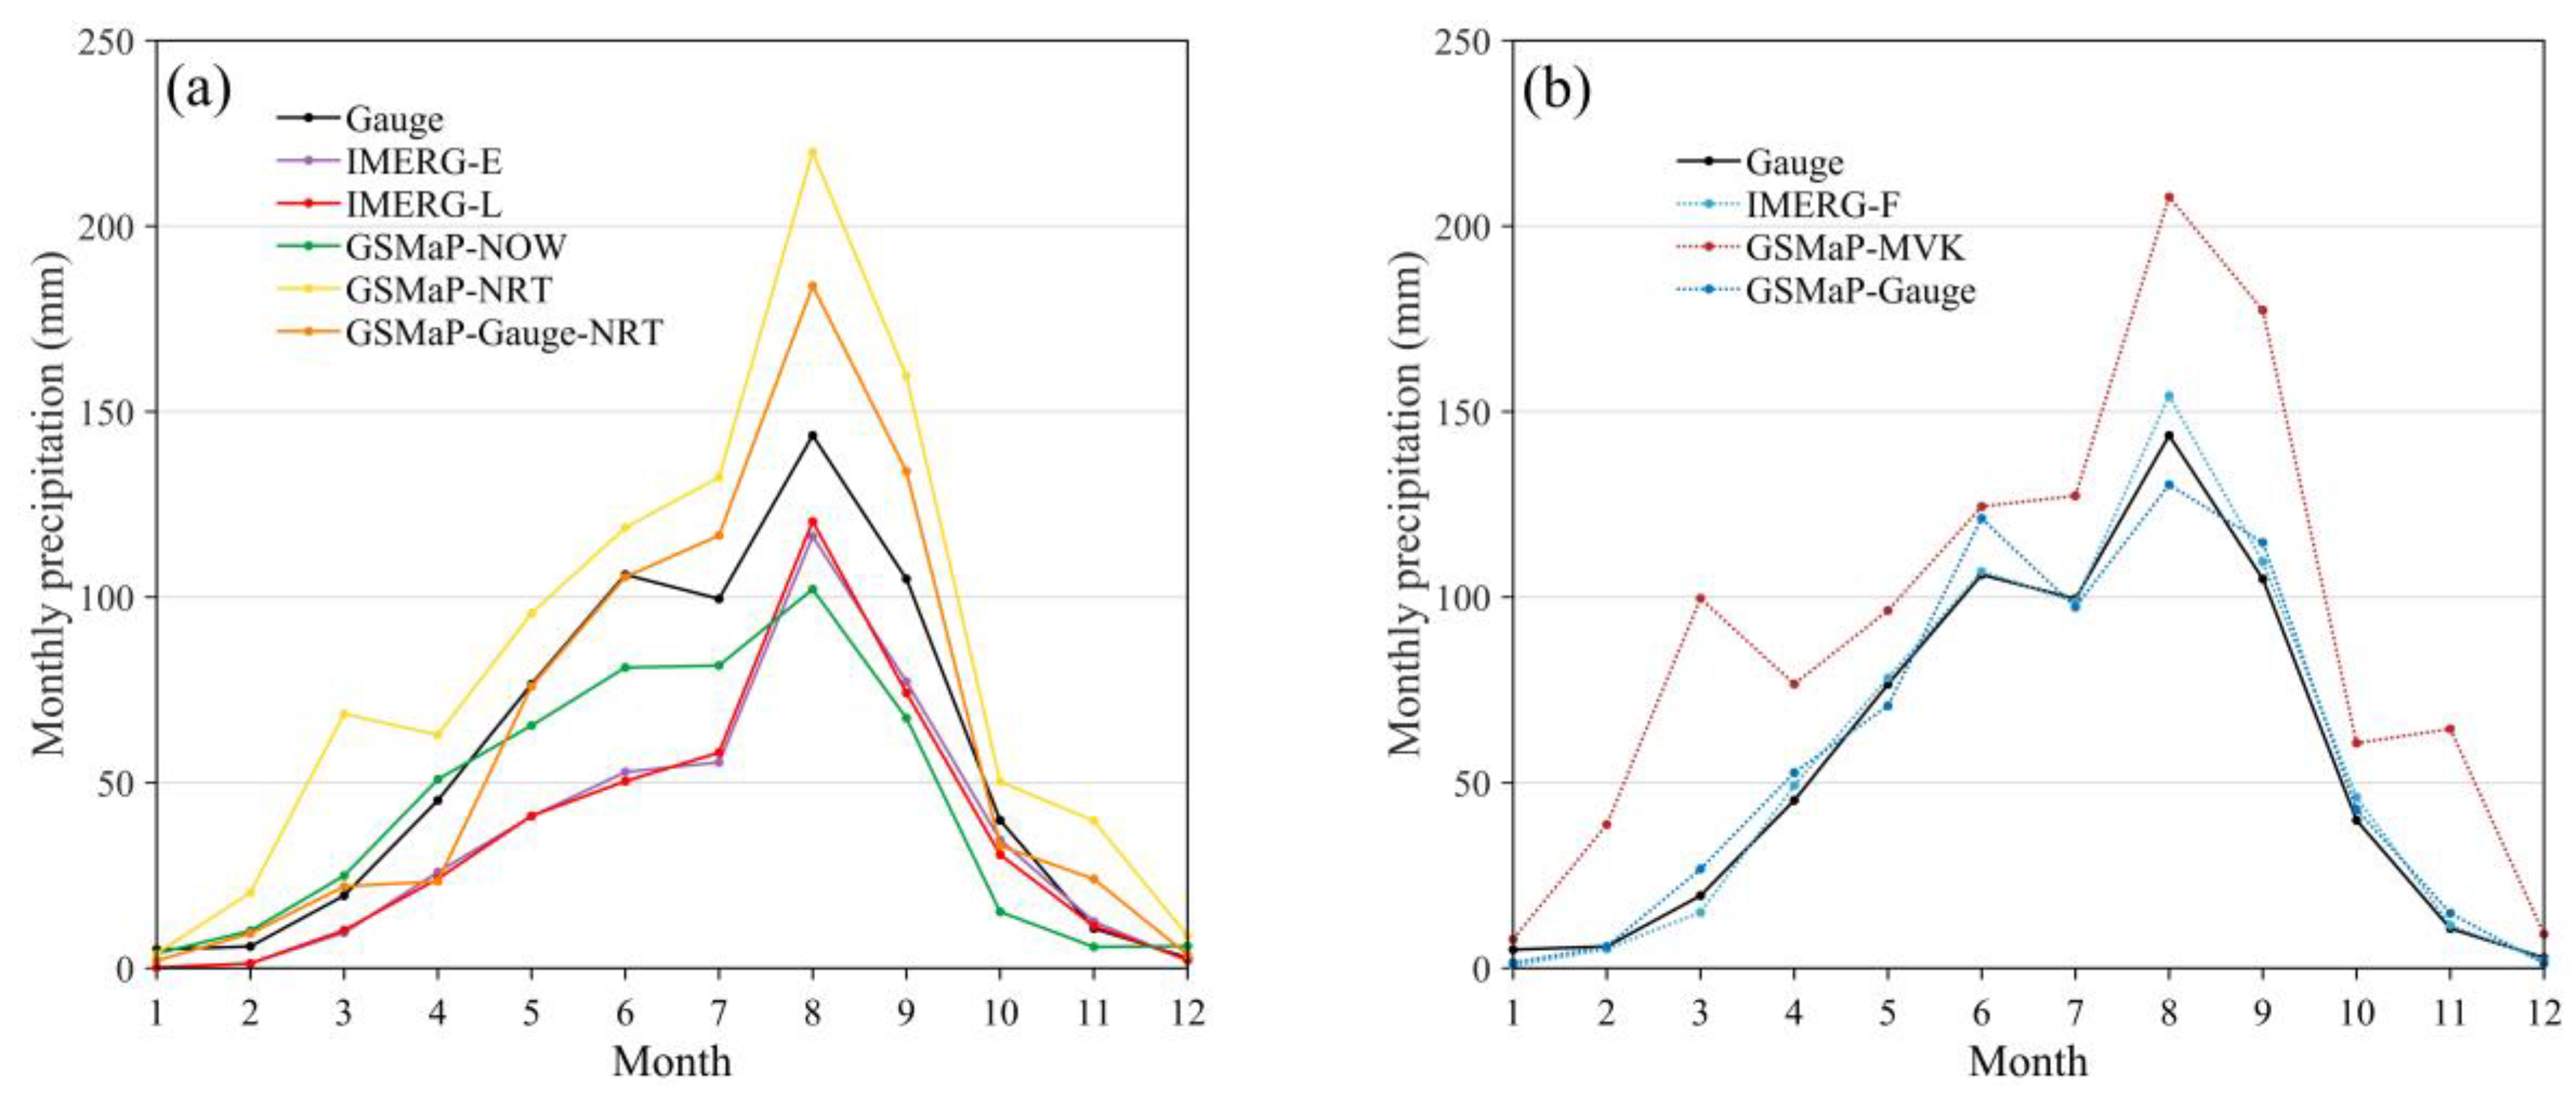
4.3.1. Temporal Variation of SPP-based Precipitation Estimates

The diurnal cycles of the SPP-based precipitation estimates averaged at the locations of 13 rain gauges were analyzed in this study. Figure 6a shows that all real-time and near-real-time SPPs generally captured the diurnal cycle of precipitation similar to that in ground rain gauges, with low precipitation intensities in late morning and early afternoon and high precipitation rates for the rest of the day. Both IMERG-E and IMERG-L demonstrated similar patterns, with a remarkable precipitation underestimation in the entire diurnal cycle (Figure 6a). GSMaP-NOW presented a slight overestimation from 23:00 to 03:00 and resulted in a considerable underestimation for the remaining time of the day. The diurnal cycles of GSMaP-Gauge-NRT- and GSMaP-NRT-based precipitation exhibited a similar pattern with a significant precipitation overestimation from 14:00 to 02:00, and GSMaP-NRT provided higher precipitation estimates than GSMaP-Gauge-NRT. For post-real-time SPPs, GSMaP-MVK overestimated precipitation in most of the diurnal cycle with the magnitude of over 60% from 11:00 to 23:00 (Figure 6b). By contrast, GSMaP-Gauge and IMERG-F reproduced the diurnal cycle of precipitation, although both products slightly overestimated precipitation from noon to midnight and resulted in a mild underestimation for the rest of the day. In general, the precipitation diurnal cycle derived from GSMaP-Gauge was closer to the observations compared with that of IMERG-F.
Figure 7 provides comparison of the SPP-based mean monthly precipitation with the ground observations. The monthly precipitation patterns from all SPPs were similar to the observations, with abundant precipitation in May to September and low precipitation in October to April. In terms of the real-time and near-real-time SPPs, IMERG-E and IMERG-L demonstrated similar precipitation features throughout the year and presented a remarkable precipitation underestimation, particularly in the rainy season (Figure 7a). GSMaP-NOW performed well in the dry season but demonstrated a considerable underestimation in rainy season (Figure 7a). GSMaP-NRT overestimated monthly precipitation throughout the year, and GSMaP-Gauge-NRT demonstrated good performance, although a slight precipitation overestimation was observed in July to September (Figure 7a). For post-real-time SPPs, GSMaP-MVK largely overestimated precipitation throughout the year (Figure 7b). GSMaP-Gauge fitted well with the gauge-based precipitation but exhibited slight deviation in rainy season, showing a certain uncertainty. By contrast, IMERG-F presented excellent capability in reproducing the annual cycle compared with other SPPs.

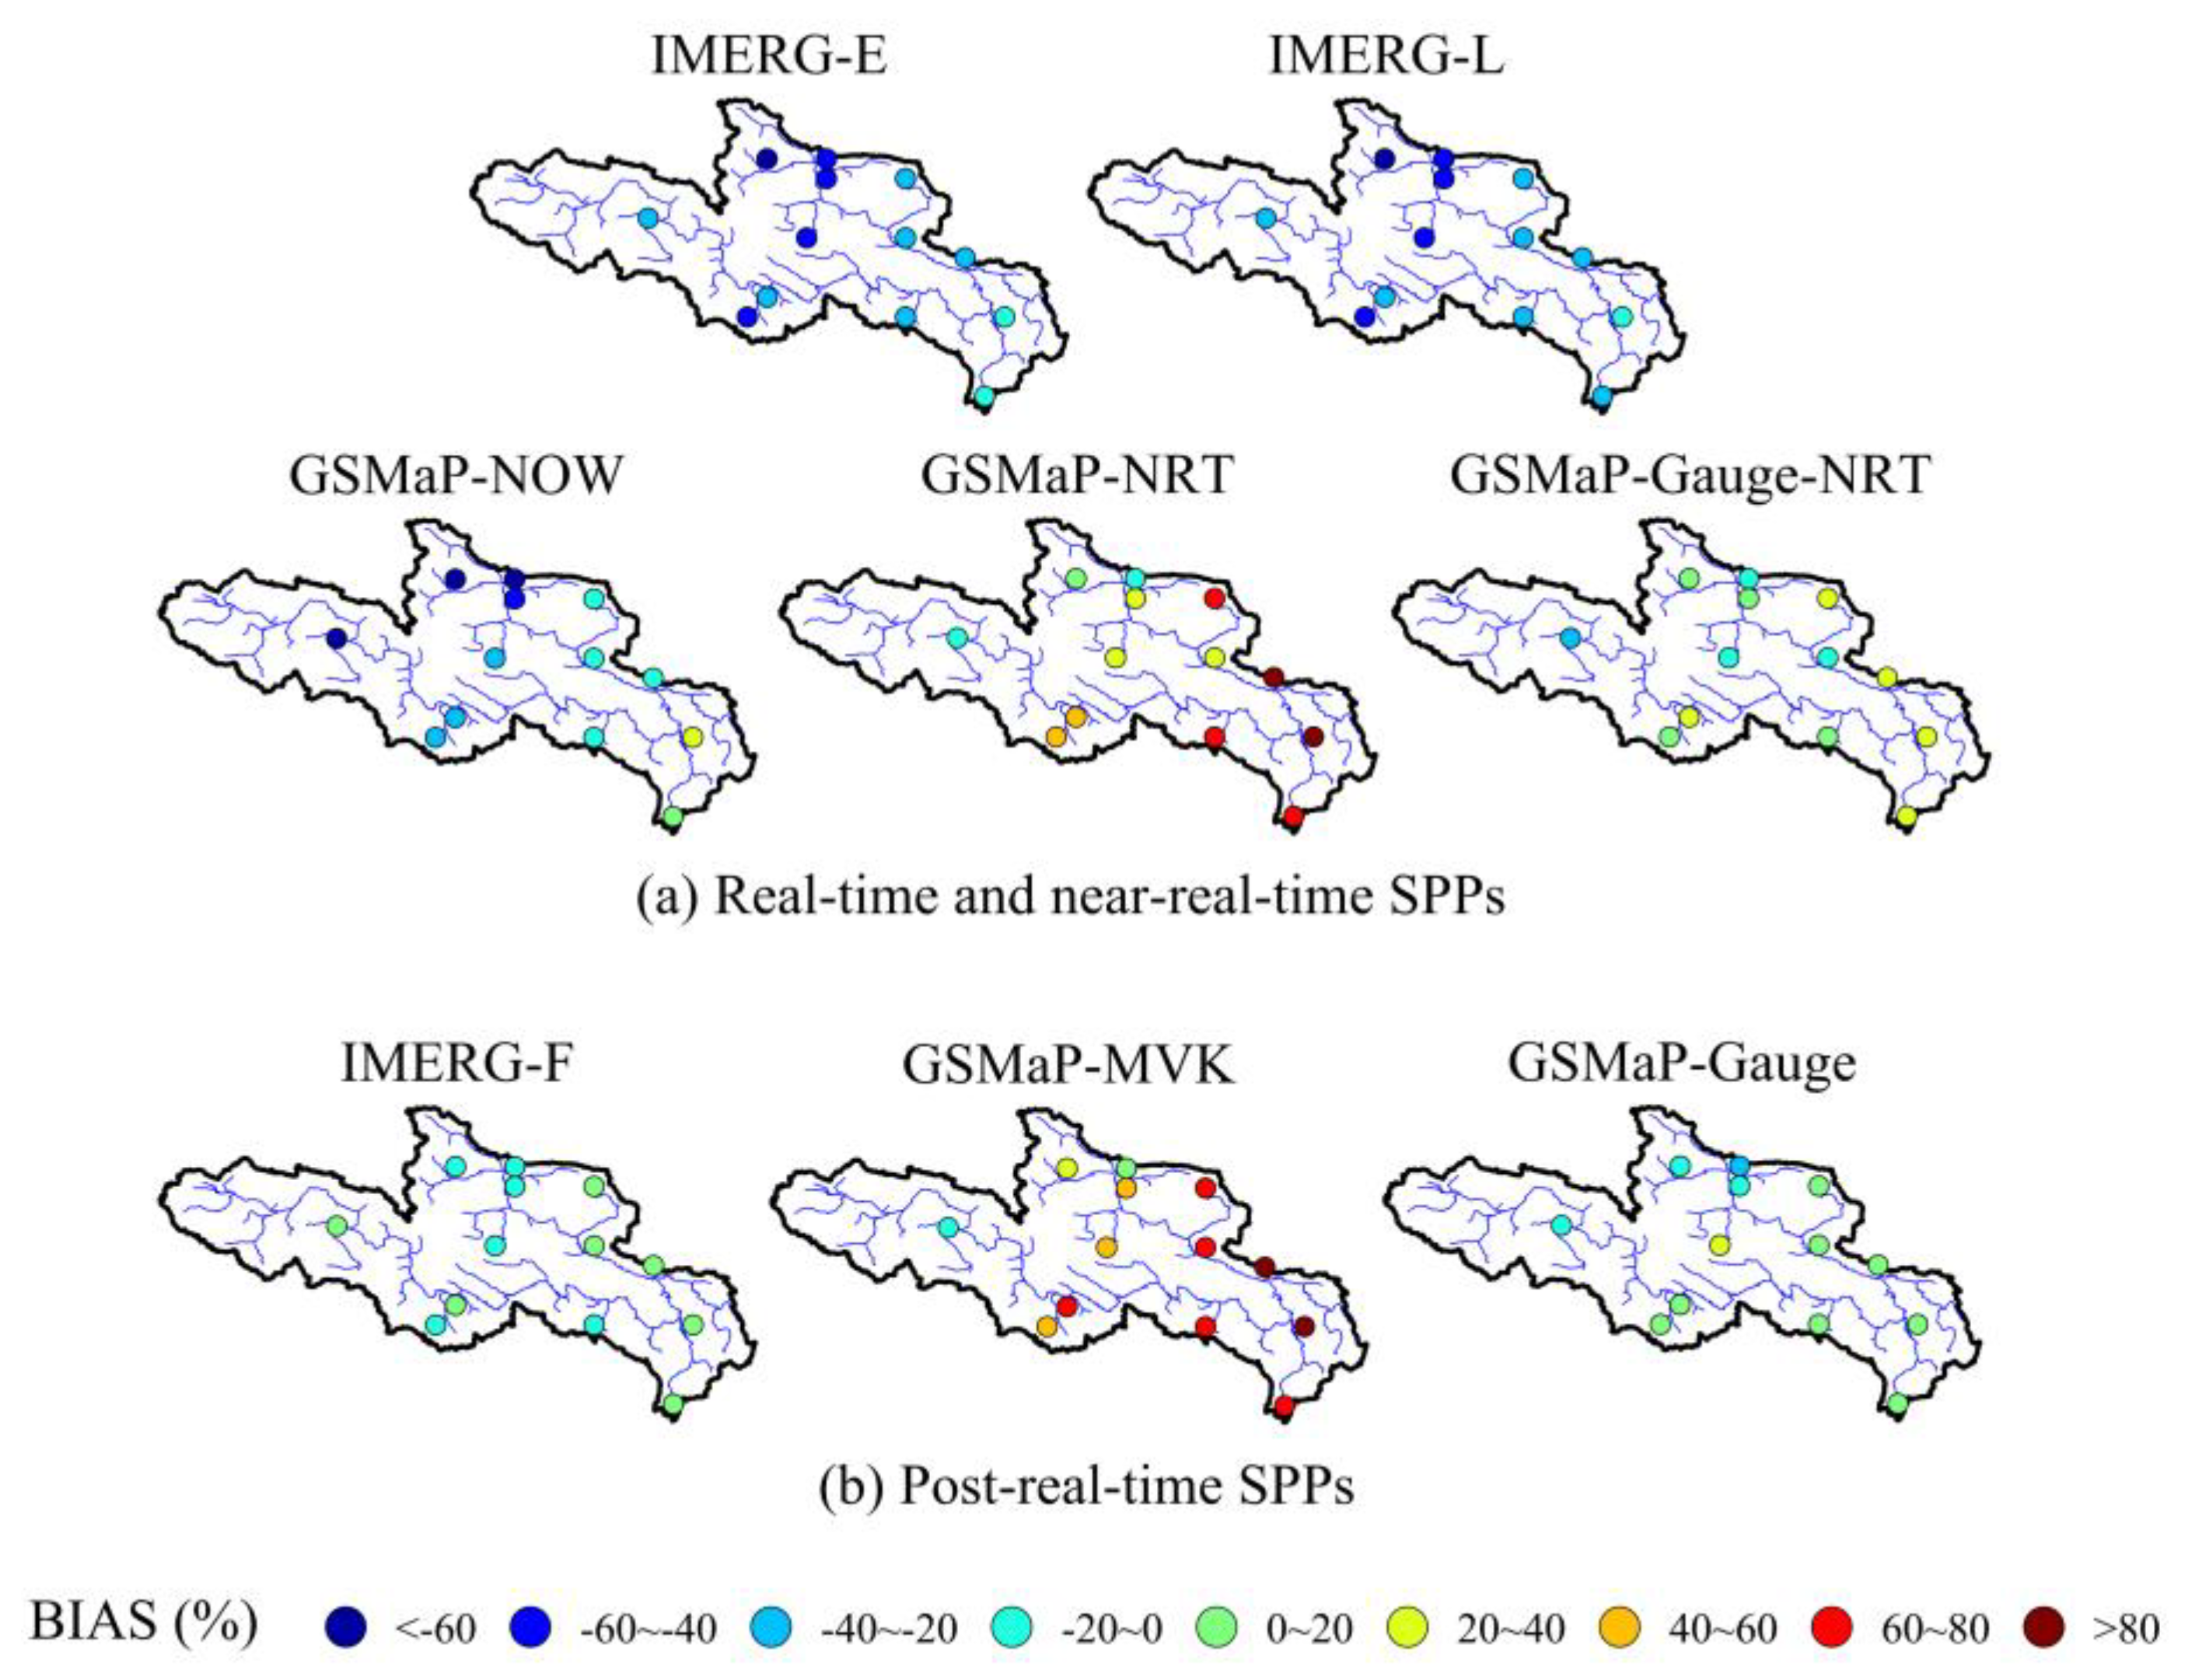
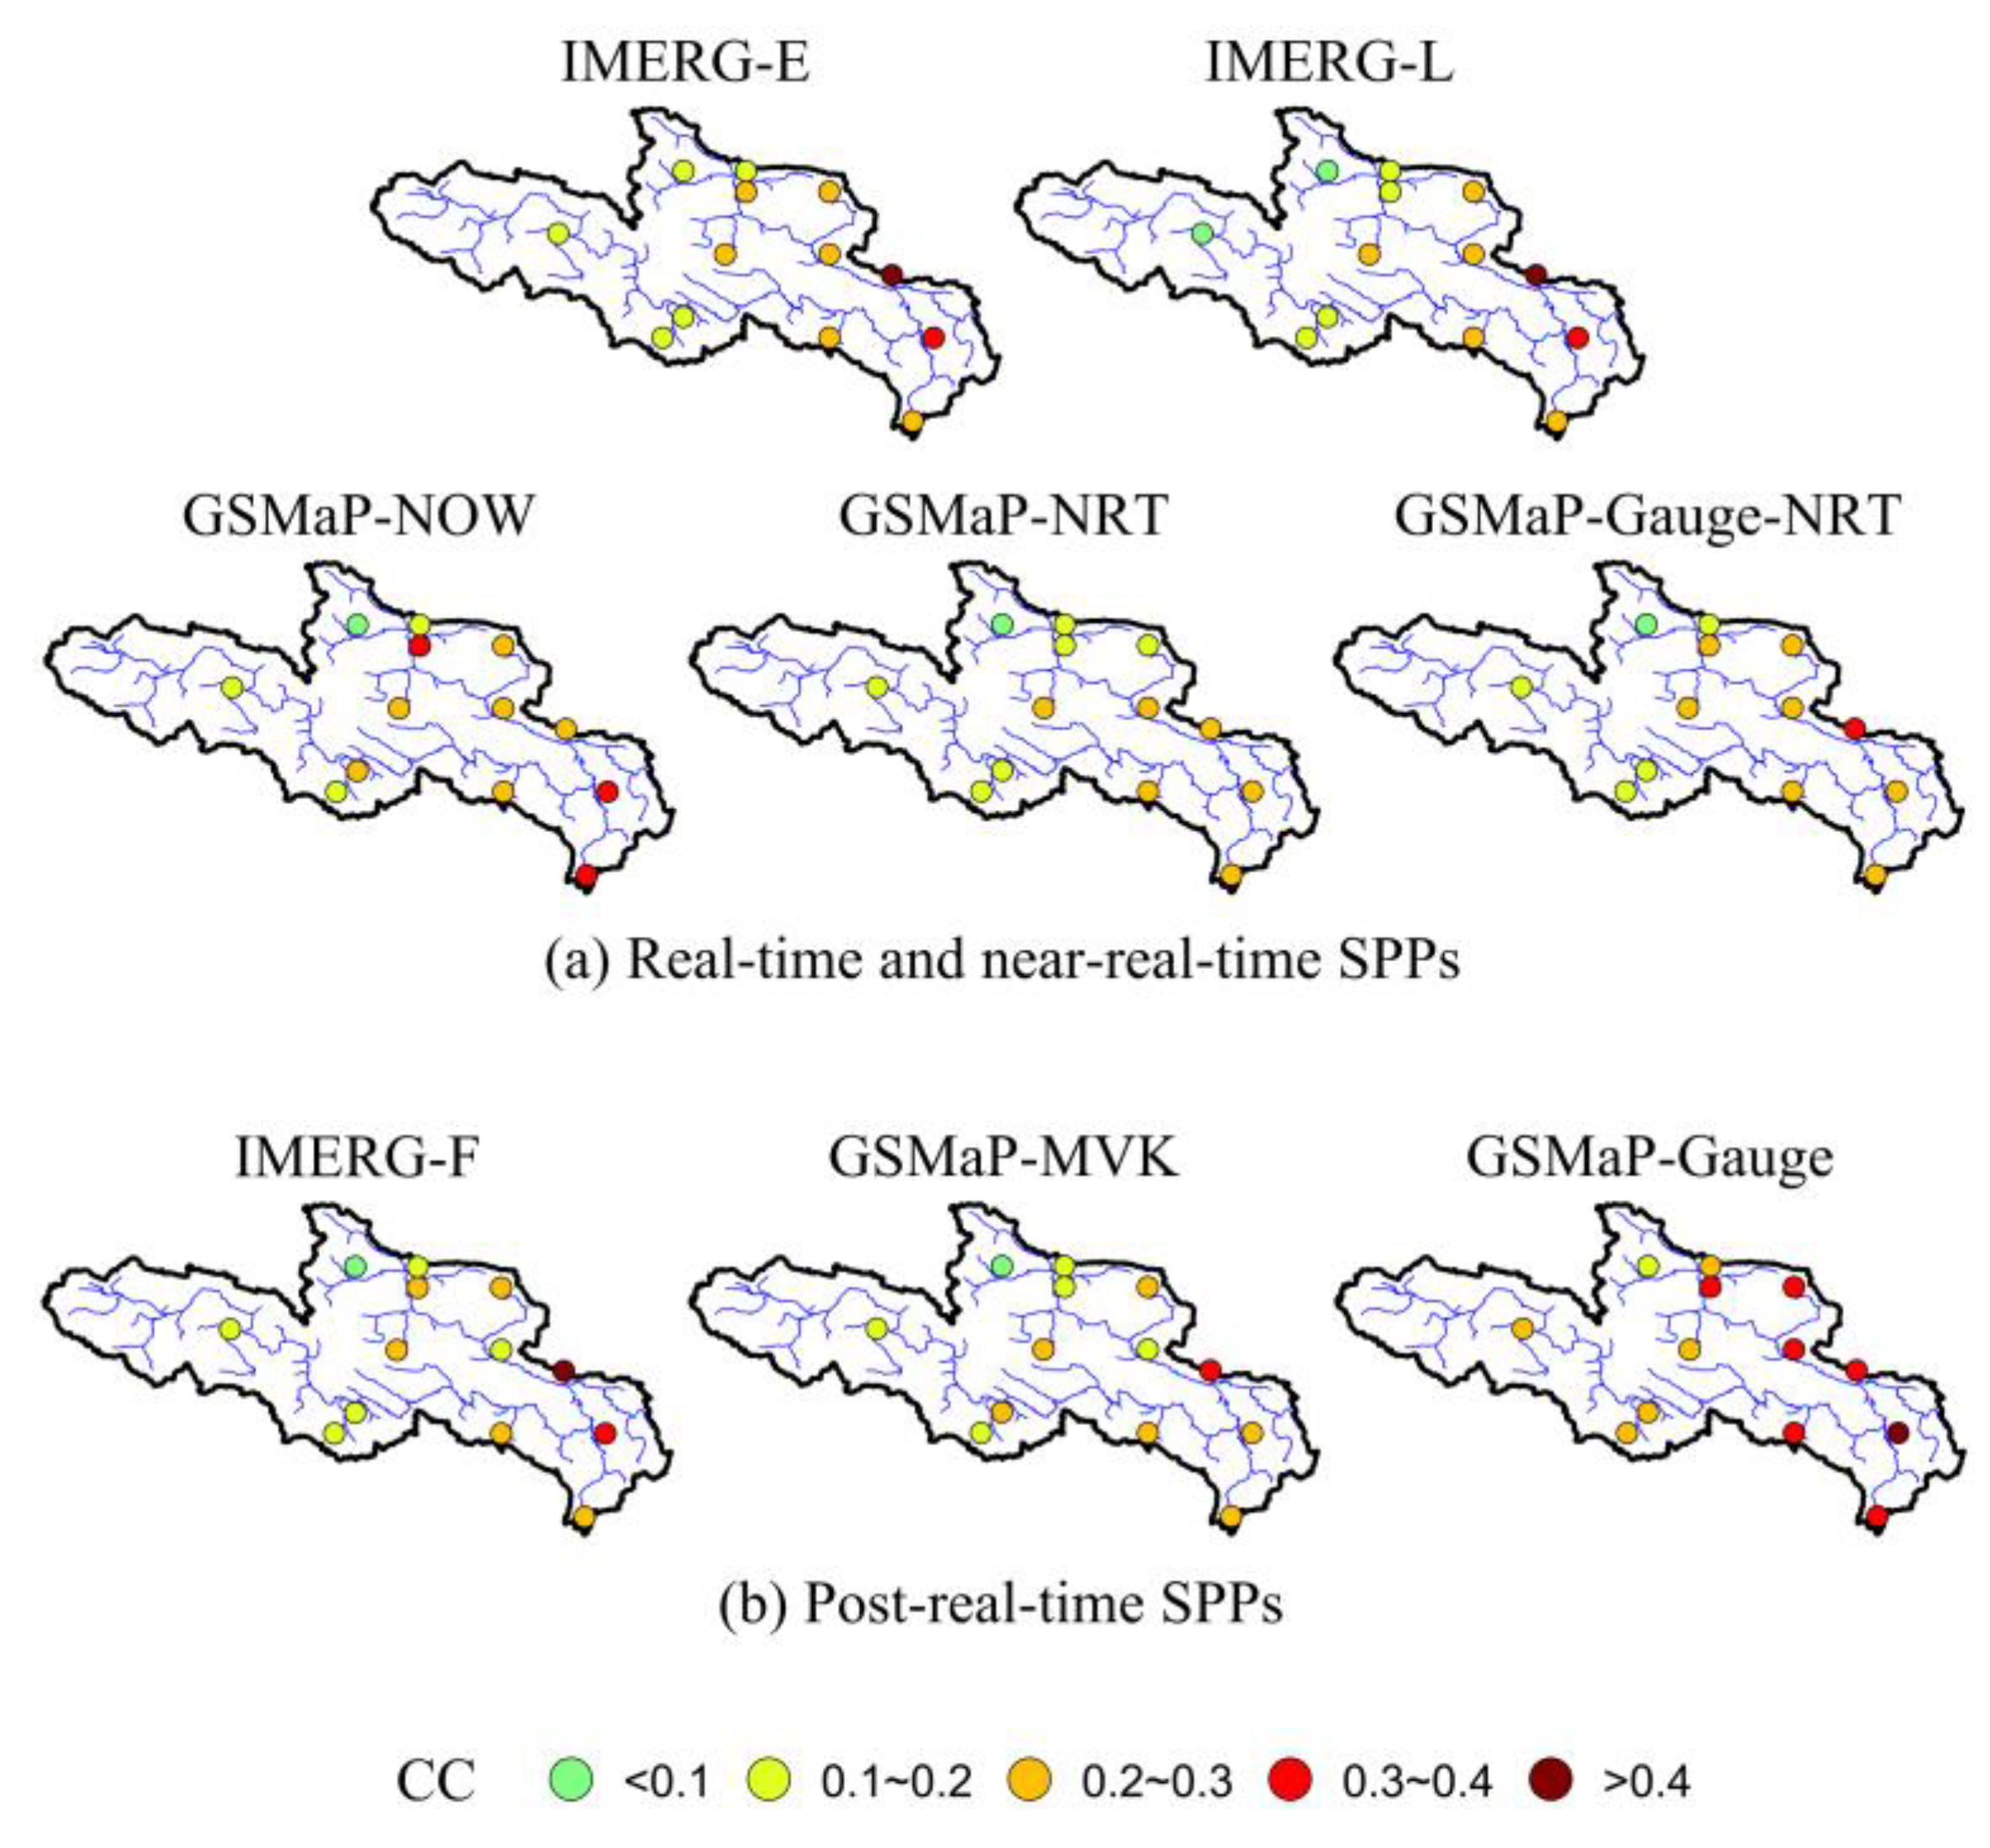
4.3.2. Spatial Pattern of Statistical Metrics

To investigate the accuracy of all the SPPs in regions with different topography, we computed the BIAS and CC at the locations of the 13 weather stations at the hourly scale. As shown in Figure 8 and Figure 9, both statistical metrics demonstrated a distinct spatial pattern. BIAS in the southeastern part of the basin (the lowlands) was higher than that in northwestern part (the highlands). A similar conclusion can be drawn from the CC values, in which higher values were observed in the southeastern of the basin than in the northwestern part.
IMERG-E and IMERG-L presented the same distribution pattern, which showed high underestimation at all stations (Figure 8a). GSMaP-NOW, as a real-time SPP, demonstrated better performance than IMERG-E and IMERG-L but still underestimated precipitation at most stations, except for Ruoergai and Hongyuan stations. GSMaP-NRT notably overestimated the southwestern part of the basin; the overestimations at Maqu and Ruoergai stations were over 80%, whereas GSMaP-Gauge-NRT performed well among real- and near-real-time SPPs and maintained the BIAS within 40%. For post-real-time SPPs, GSMaP-MVK prominently overestimated precipitation in most stations, whereas IMERG-F and GSMaP-Gauge maintained the margin of BIAS between −20% and 20%, showing low uncertainty. Notably, IMERG-F overestimated precipitation at half of the stations and underestimated the other half, thus explaining the partial offset in positive and negative errors.
IMERG-E showed better correspondence with gauge-based precipitation in the northwestern part than IMERG-L (Figure 9a). As a real-time product, GSMaP-NOW presented good performance in the southeastern part with CC values ranging from 0.27 to 0.37. By contrast, GSMaP-Gauge-NRT exhibited better correlation of gauge-based precipitation than GSMaP-NRT, which is consistent with the above statistical results. In addition, among all post-real-time SPPs, GSMaP-MVK showed the poorest correspondence with gauge measurements (Figure 9b). Although IMERG-F and GSMaP-Gauge behaved similarly in terms of BIAS, GSMaP-Gauge demonstrated good agreement with the gauge-based precipitation with higher CC on the east side of the basin.
As mentioned in Section 2.2, among the 13 weather stations, only the Maduo and Dari stations are included in GPCC. Figure 8 shows that at these two stations, IMERG-F demonstrated a relatively lower systematic deviation from the gauge observations (BIAS = 8.0% and −2.4%, respectively) than IMERG-E (BIAS = −31.0% and −41.0%, respectively) and IMERG-L (BIAS = −46.0% and −32.0%, respectively). However, IMERG-F at these two stations presented similar magnitudes of CC (0.13 and 0.14, respectively) to IMERG-E (0.13 and 0.18, respectively) and IMERG-L (0.10 and 0.17, respectively), and the CC values of IMERG-F at these GPCC stations are even much lower than those at a few non-GPCC stations in the central and eastern regions. The reason is that IMERG-F are bias-corrected using the GPCC precipitation dataset on a monthly basis. This bias-correction procedure is able to effectively alleviate the systematic errors of IMERG-E and IMERG-F precipitation estimates at the grid cells where GPCC stations are located but may not improve CC on time steps shorter than 1 month.

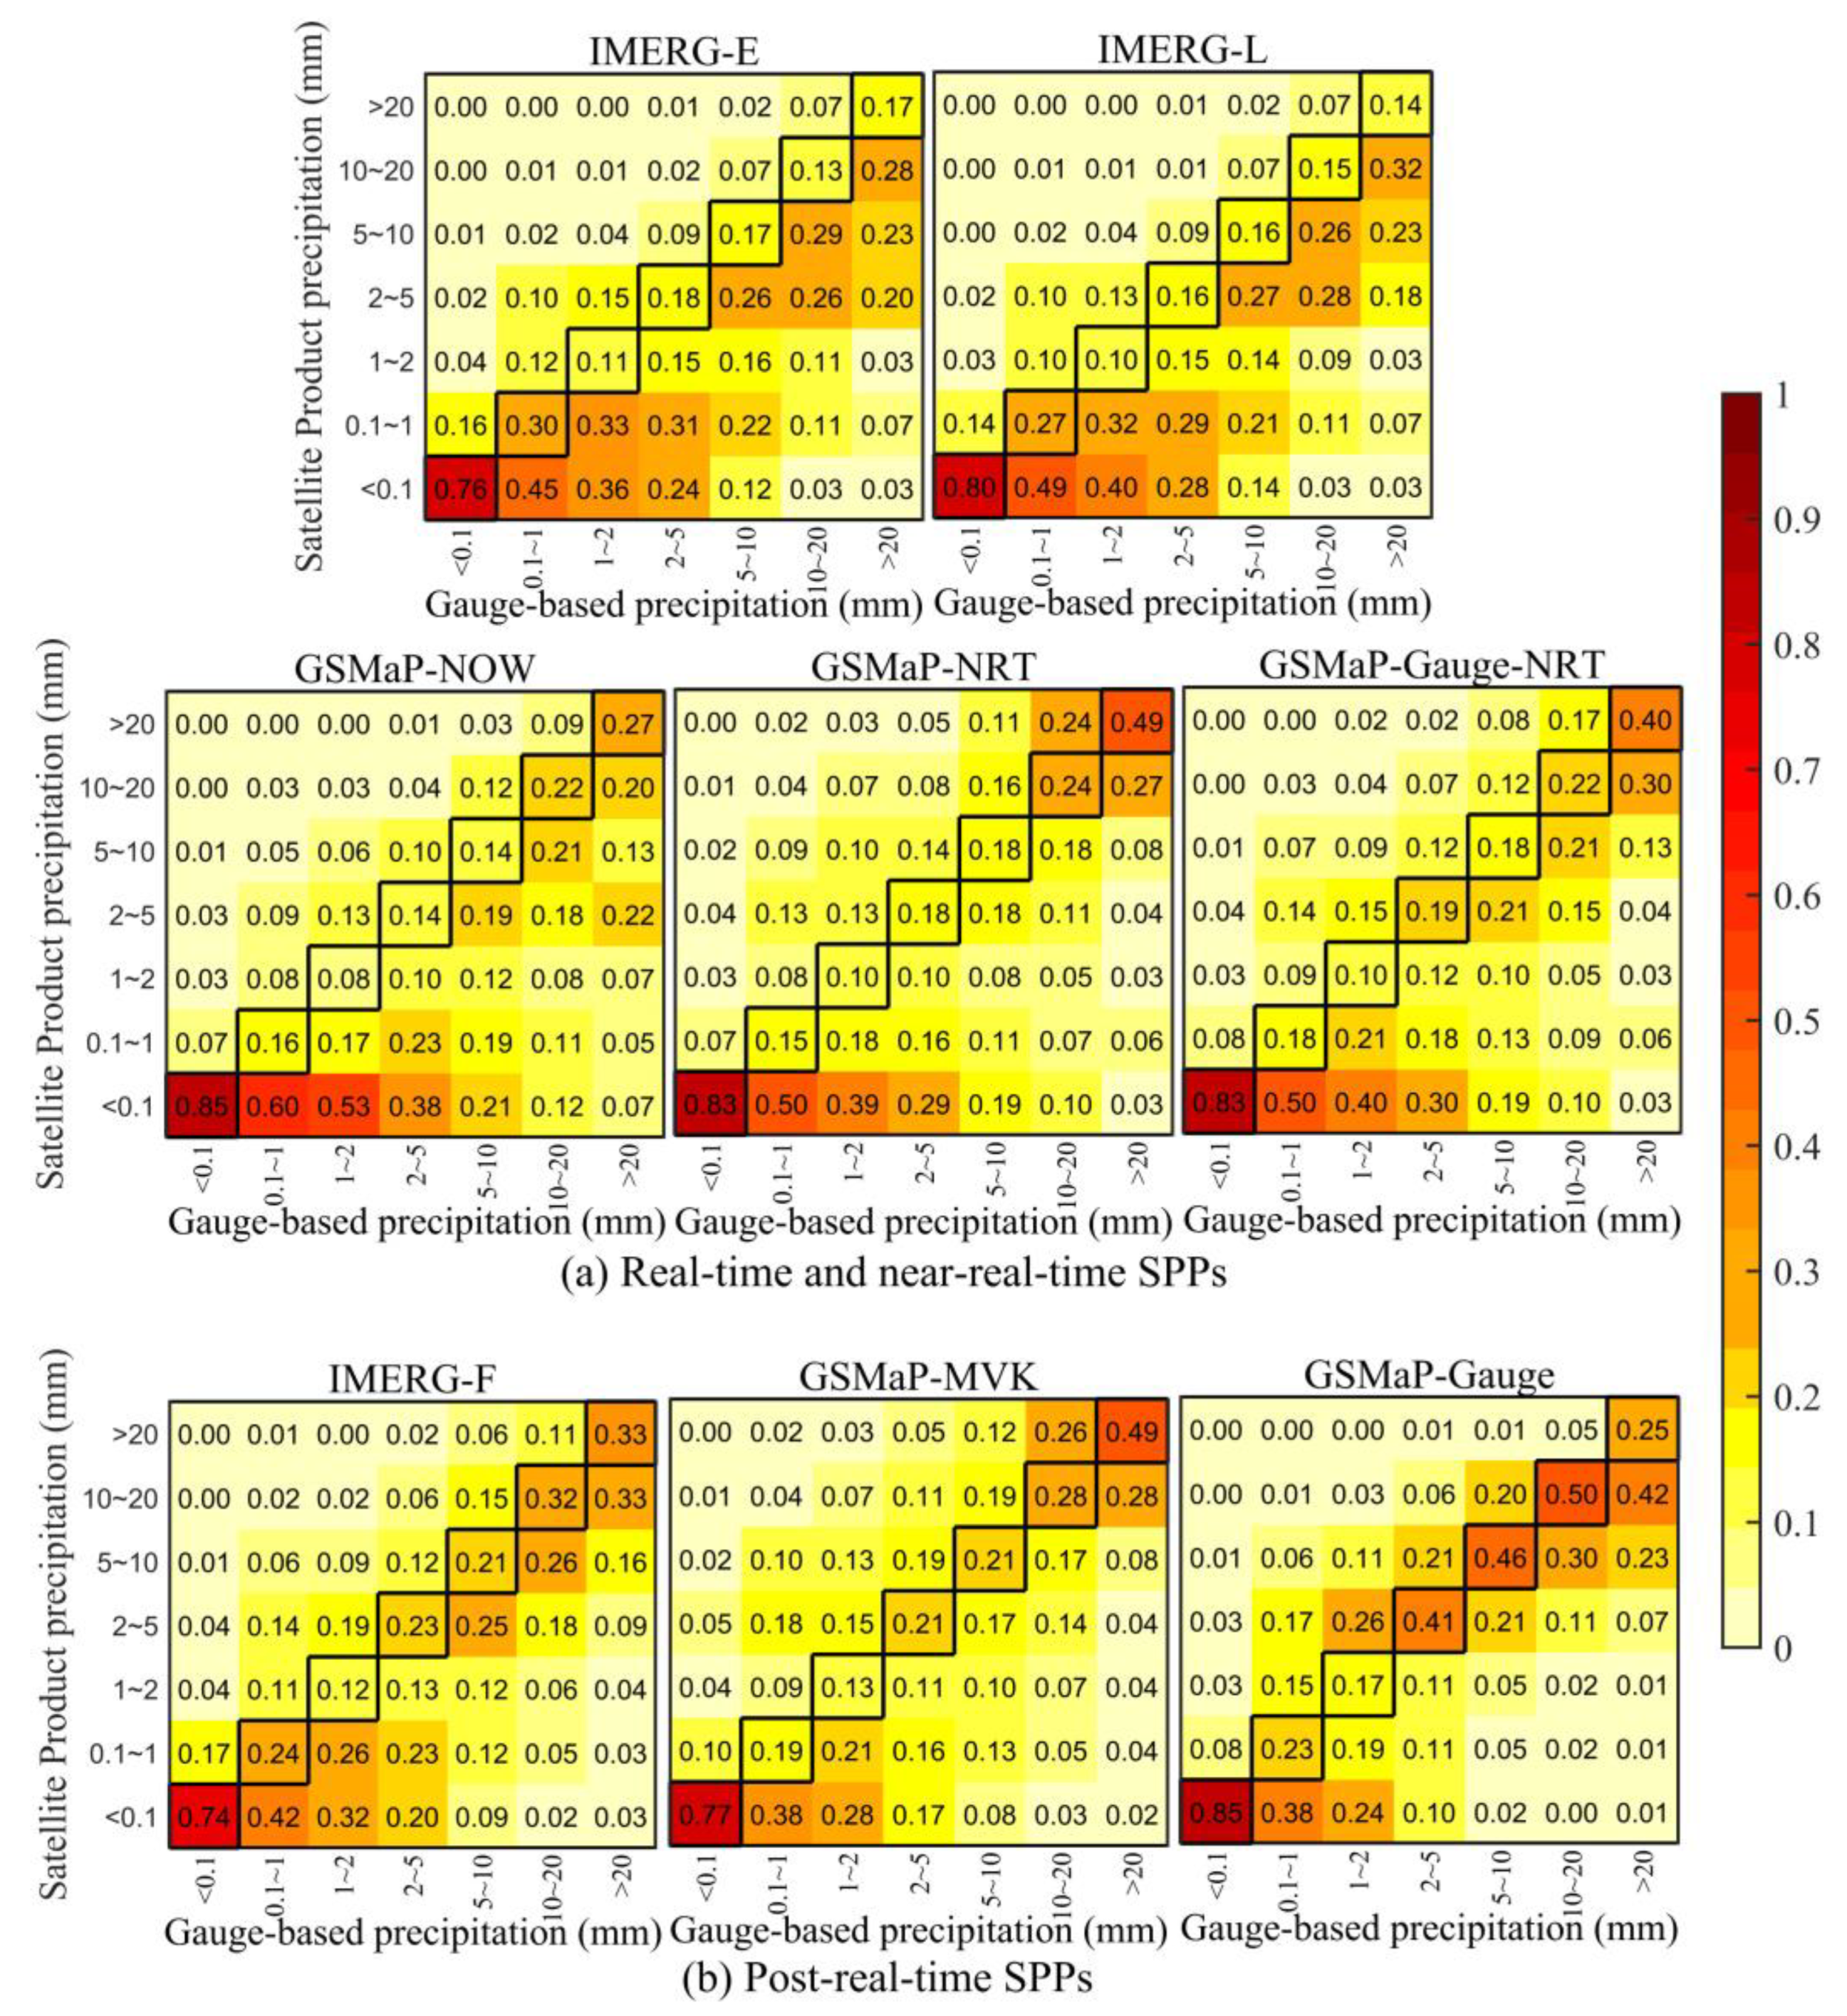
4.3.3. Confusion Matrix

In this study, confusion matrix was selected to measure the capability of SPPs in reproducing daily gauge-based precipitation at certain levels (Figure 10). The first column of confusion matrix can represent the distribution of false precipitation, the bottom row demonstrates the distribution of missed precipitation, and the rest of the matrix represents hit precipitation. Therefore, a confusion matrix can be used for SPP error component analysis [31]. In comparison with IMERG-L, IMERG-E presented a poorer detection capacity for the first class (< 0.1 mm), with better performances for the other rainfall classes. By contrast, real-time and near-real-time GSMaP SPPs (GSMaP-NOW, GSMaP-NRT, and GSMaP-Gauge-NRT) showed a relatively higher detection capacity for precipitation under 0.1 mm and over 10 mm. GSMaP-NOW missed several precipitation events for precipitation between 0.1 and 5 mm (38%−60%). GSMaP-NRT and GSMaP-Gauge-NRT demonstrated relatively better detection capability for precipitation between 0.1 and 5 mm than GSMaP-NOW. For post-real-time SPPs, IMERG-F, GSMaP-MVK, and GSMaP-Gauge presented improved detection capability with low values in the bottom rows (Figure 10b). IMERG-F featured an inferior performance in detecting daily precipitation under 0.1 mm with false precipitation mainly between 0.1 and 1 mm at the first column. By contrast, GSMaP-MVK featured a slightly lower detection rate than GSMaP-Gauge precipitation under 0.1 mm and overestimated precipitation between 10 and 20 mm. Meanwhile, GSMaP-Gauge obtained the lowest values at the bottom row, indicating that GSMaP-Gauge achieved a satisfactory detection capability of precipitation events exactly as the statistical indices (Table 5). Considering the antidiagonal values of the matrixes, GSMaP-Gauge presented good performance in identifying daily precipitation events over 2 mm. In general, in terms of the bottom-row values of the matrixes, all eight SPPs significantly missed the daily precipitation between 0.1 and 5 mm (20%−60%).

5. Discussion

This study evaluated the performance of the two parallel latest GPM-era SPPs (IMERG and GSMaP) in comparison with the ground precipitation observations at different temporal scales over YRSR. In terms of statistical metrics for SPPs (Table 2), the post-real-time IMERG-F and GSMaP-Gauge generally provided the best performance at different temporal scales among all the evaluated IMERG and GSMaP SPPs, respectively (Table 3 and Table 5). Post-real-time SPPs showed better performance than their near-time-time versions in several regions [36,50,51,52,53,54,55]. However, the offset effect of positive and negative precipitation errors might lead to distorted statistical metrics. Tian et al. [37] decomposed the total errors into hit bias, missed precipitation, and false precipitation and found many cases in which the offset effect might result in a small total bias. In this study, the error distribution of all SPPs (Figure 2 and Figure 4) demonstrated that the gauge-adjusted SPPs (IMERG-F and GSMaP-Gauge) contained small errors that were concentrated in a relatively unbiased range, which could offset total bias. Although GPM improved the capability of DPR in detecting light rain (less than 0.5 mm/h), this study demonstrated that considerable errors in identifying light-rail events remained in all GPM-era SPPs (Figure 3 and Figure 5). Hence, further work is needed to improve the accuracy of GPM-era SPPs for light-precipitation-event identification. Notably, the frequency distribution of GSMaP-Gauge (Figure 5) was notably lower than that of gauge-based precipitation in the first bin (0−0.1 mm), whereas the frequency distribution was significantly high for the precipitation between 0.1 and 0.5 mm, which is consistent with the result of Xinjiang [56]. Additionally, Ning et al. [33] observed that IMERG performed better than GSMaP in light-precipitation detection. These results indicate that the calibration procedure in GSMaP-Gauge mainly decreased the no-precipitation events and increased light-precipitation events to a certain degree, thus requiring the attention from algorithm developers.
Precipitation patterns and topography strongly affect the precipitation estimates [57,58,59]. In this study, GSMaP-Gauge-NRT demonstrated a relatively better performance than other real- and near-real-time SPPs in reproducing the diurnal and monthly cycles of precipitation. Considering that only a limited number of studies have focused on GSMaP-Gauge-NRT, more efforts should be exerted to study GSMaP-Gauge-NRT in different parts of the world. For post-real-time SPPs, GSMaP-MVK significantly overestimated precipitation in the monthly cycle, supporting the results reported by [20] and [60]. Interestingly, this study revealed that GSMaP-Gauge outperformed IMERG-F at the daily scale (Figure 6), whereas IMERG-F performed relatively better than GSMaP-Gauge at the monthly scale (Figure 7). The main cause may be the correction of IMERG-F by GPCC via gauge calibration algorithm at the monthly scale, whereas GSMaP-Gauge was calibrated using the CPC global daily gauge data via the GSMaP-Gauge algorithm. In this context, the temporal scale at which the gauge adjustment is employed considerably affected the performance of SPPs. Ma et al. [45] noted that local strong convectional weather and complex terrain seriously affect the satellite precipitation retrieval and lead to unexpected errors over the Brahmaputra basin. Similarly, this study demonstrated that the quality of all eight SPPs featured distinctive spatial variabilities. Among all the SPPs, GSMaP-Gauge showed the highest correlation with the gauge measurements and the lowest BIAS (Figure 8 and Figure 9). Notably, this study carried out the SPP evaluation by comparing the pixel precipitation values of SPPs with the point values of rain gauges. Considering the limited number of rain gauges in YRSR, this study did not analyze in detail the effect of topography on the accuracy of SPPs. Therefore, future work will focus on collecting precipitation data at more rain gauges and investigating the topographical effect. Notably, this study adopted confusion matrix as a supplementary evaluation method. The information found in the confusion matrix could present the distribution of hit, missed, and false precipitation events. Remarkably, the confusion matrix in this study demonstrated that GSMaP-Gauge performed relatively better than other SPPs at the daily scale (Figure 10).
In 2017, the GSMaP research group released the real-time GSMaP-Now SPP. To the best of our knowledge, this study is the earliest attempt to systematically evaluate the performance of GSMaP-Now. The results show that in YRSR GSMaP-Now demonstrated comparable precipitation monitoring capabilities to the evaluated near-real-time SPPs and even presented higher accuracy in detecting moderate and heavy rain events than IMERG-E and IMERG-L (Figure 10a). This finding indicates that GSMaP-Now has the potential to be employed for flash flood monitoring and real-time flood forecasting in YRSR. Future work will entail assessing the feasibility of GSMaP-Now in real-time flood forecasting. Given that GSMaP-Now provides quasiglobal precipitation estimates with no latency, we encourage the GSMaP developers and SPP users to carry out the GSMaP-Now evaluation in more regions and river basins.
Furthermore, SPP merging should be considered to utilize the advantages from available SPPs as mentioned in [36,39,42,61]. Zhu et al. [62] used two satellite-based precipitation products (3B42V7 and PERSIANN-CDR) and National Centers for Environment Prediction-Climate Forecast System Reanalysis to merge multisource precipitation estimates and streamflow simulations by using Bayesian model averaging. They observed that although merging multi–source precipitation products slightly improved the effect of runoff simulation, merging multisource streamflow simulations generally improved the performance of streamflow simulation. Chao et al. [63] proposed a satellite and gauge precipitation merging framework by using geographically weighted regression methods to merge CMORPH precipitation with station observation information (elevation, slope, aspect, surface roughness, distance to the coastline, and wind speed) in the Ziwuhe Basin of China. In comparison with the original CMORPH product, these geographically weighted regression methods significantly improved the quality of merged data with higher CC and lower RMSE. These merging techniques could be adopted in YRSR in the future.

6. Conclusions

This study provides a comprehensive evaluation of the latest eight GPM-era GSMaP and IMERG SPPs in real-time, near-real-time, and post-real-time versions at multiple temporal scales over the YRSR. First, GSMaP and IMERG SPPs were evaluated using specific statistical metrics. Subsequently, the real-time and near-real-time SPPs (IMERG-E, IMERG-L, GSMaP-NRT, GSMaP-Gauge-NRT, and GSMaP-NOW) and post-real-time SPPs (IMERG-F, GSMaP-Gauge, and GSMaP-MVK) were cross-evaluated. The main conclusions are summarized as follows:
(1)
Owing to the gauge-based calibration with the GPCC dataset, IMERG-F generally performed better than IMERG-E and IMERG-L, presenting considerably lower systematic biases. IMERG-E and IMERG-L underestimated the occurrences of the no-rain and light-rain events but overestimated moderate and heavy rain.
(2)
Regarding the performance of the three GSMaP SPPs, GSMaP-Gauge outperformed the other four GSMaP SPPs in all statistical metrics, although numerous false precipitation detections were incurred at the hourly scale. However, GSMaP-Gauge excessively underestimated the precipitation under 0.1 mm and overestimated the precipitation ranging from 0.1 to 1 mm. GSMaP-Gauge-NRT was ranked as the second after GSMaP-Gauge with evident improvement over GSMaP-NRT. GSMaP-MVK and GSMaP-NRT showed significant overestimations, and GSMaP-NOW notably underestimated total precipitation.
(3)
By comparing the performance of IMERG and GSMaP SPPs, GSMaP-Gauge-NRT presented better characteristics of the diurnal and monthly cycles most of the time among all real- and near-real-time SPPs. For post-real-time SPPs, GSMaP-Gauge presented the highest capability for the quantification of daily precipitation events, whereas IMERG-F resulted in the best precipitation estimates at the monthly scale. Considering the estimation accuracy of SPPs in complex elevation and topography, the evaluation metrics (BIAS and CC) at the hourly scale presented distinct spatial pattern. The BIAS and CC were higher in the southeastern part (the lowlands) of the basin than in the northwestern part (the highlands). In the application of confusion matrix, GSMaP-Gauge performed the best and showed the most stable quality results among all post-real-time SPPs, followed by IMERG-F.
Considering that IMERG-E and IMERG-L demonstrated similar performances in this study, we recommend IMERG-E for flood forecasting owing to its short latency. In addition, GSMaP-Gauge is recommended for daily streamflow simulation and IMERG-F for monthly streamflow simulation. Considering that GSMaP-Gauge-NRT generally presents the best performance among all near-real-time SPPs and features a short latency, it can be used for short-term flood forecasting. GSMaP-NOW, which is among the limited real-time SPPs released to the public, presented better performance than the other near-real-time and post-real-time SPPs in specific cases. Therefore, GSMaP-NOW shows a great potential for applications in real-time flood forecasting. Moreover, merging techniques could be used to improve the performance of GSMaP-NOW combined with the information of station observations and other SPPs.
Overall, this study potentially provides SPP users with valuable guidelines for the choices of multiple satellite precipitation products in the YRSR and offers users and researchers a better understanding of two parallel GPM-era SPPs. In addition, this study proposed an assessment framework that comprehensively investigates the SPP-based precipitation characteristics in many aspects, such as distribution of precipitation errors, precipitation frequency distribution, and spatiotemporal features of SPP estimates. This framework also includes the confusion matrix method that aims to evaluate how the satellites capture precipitation occurrence for rainfall events at different levels. We anticipate that this assessment framework will be employed in other basins.

Author Contributions

Conceptualization, F.Y.; methodology, F.Y.; writing—original draft preparation, J.S.; funding acquisition, F.Y.; investigation, F.Y., J.S., and C.Z.; data curation, C.S. and J.S.; visualization, J.S. and L.Z.; writing—review and editing, L.R., Y.Z., S.J., and Y.L. All authors have read and agreed to the published version of the manuscript.

Funding

This research was funded by the National Natural Science Foundation of China (Grant Nos. 41730750, 51779070, and 91437220) and the Fundamental Research Funds for the Central Universities (Grant No. 2019B10314).

Acknowledgments

We extend our sincere gratitude to the GPM research communities for making the satellite rainfall data available for this work. The authors extend their appreciation to the reviewers for their thoughtful comments and valuable advice.

Conflicts of Interest

The authors declare no conflict of interest.

References

  1. Kidd, C.; Huffman, G. Global precipitation measurement. Meteorol. Appl. 2011, 18, 334–353. [Google Scholar] [CrossRef]
  2. Allen, M.R.; Ingram, W.J. Constraints on future changes in climate and the hydrologic cycle. Nature 2002, 419, 228. [Google Scholar] [CrossRef]
  3. Xue, X.; Hong, Y.; Limaye, A.S.; Gourley, J.J.; Huffman, G.J.; Khan, S.I.; Dorji, C.; Chen, S. Statistical and hydrological evaluation of TRMM-based Multi-satellite Precipitation Analysis over the Wangchu Basin of Bhutan: Are the latest satellite precipitation products 3B42V7 ready for use in ungauged basins? J. Hydrol. 2013, 499, 91–99. [Google Scholar] [CrossRef]
  4. Huffman, G.J.; Bolvin, D.T.; Nelkin, E.J.; Wolff, D.B.; Adler, R.F.; Gu, G.; Hong, Y.; Bowman, K.P.; Stocker, E.F. The TRMM multisatellite precipitation analysis (TMPA): Quasi-global, multiyear, combined-sensor precipitation estimates at fine scales. J. Hydrometeorol. 2007, 8, 38–55. [Google Scholar] [CrossRef]
  5. Hsu, K.; Gao, X.; Sorooshian, S.; Gupta, H.V. Precipitation estimation from remotely sensed information using artificial neural networks. J. Appl. Meteorol. 1997, 36, 1176–1190. [Google Scholar] [CrossRef]
  6. Joyce, R.J.; Janowiak, J.E.; Arkin, P.A.; Xie, P. CMORPH: A method that produces global precipitation estimates from passive microwave and infrared data at high spatial and temporal resolution. J. Hydrometeorol. 2004, 5, 487–503. [Google Scholar] [CrossRef]
  7. Kubota, T.; Shige, S.; Hashizume, H.; Aonashi, K.; Takahashi, N.; Seto, S.; Hirose, M.; Takayabu, Y.N.; Ushio, T.; Nakagawa, K. Global precipitation map using satellite-borne microwave radiometers by the GSMaP project: Production and validation. IEEE T. Geosci. Remote. 2007, 45, 2259–2275. [Google Scholar] [CrossRef]
  8. Qi, W.; Zhang, C.; Fu, G.; Sweetapple, C.; Zhou, H. Evaluation of global fine-resolution precipitation products and their uncertainty quantification in ensemble discharge simulations. Hydrol. Earth Syst. Sc. 2016, 20, 903–920. [Google Scholar] [CrossRef] [Green Version]
  9. Falck, A.S.; Maggioni, V.; Tomasella, J.; Vila, D.A.; Diniz, F.L. Propagation of satellite precipitation uncertainties through a distributed hydrologic model: A case study in the Tocantins–Araguaia basin in Brazil. J. Hydrol. 2015, 527, 943–957. [Google Scholar] [CrossRef]
  10. Yoshimoto, S.; Amarnath, G. Applications of satellite-based rainfall estimates in flood inundation modeling—A case study in Mundeni Aru River Basin, Sri Lanka. Remote Sens.-Basel. 2017, 9, 998. [Google Scholar] [CrossRef] [Green Version]
  11. Yong, B.; Ren, L.L.; Hong, Y.; Wang, J.H.; Gourley, J.J.; Jiang, S.H.; Chen, X.; Wang, W. Hydrologic evaluation of Multisatellite Precipitation Analysis standard precipitation products in basins beyond its inclined latitude band: A case study in Laohahe basin, China. Water Resour. Res. 2010, 46. [Google Scholar] [CrossRef] [Green Version]
  12. Jiang, S.; Ren, L.; Hong, Y.; Yong, B.; Yang, X.; Yuan, F.; Ma, M. Comprehensive evaluation of multi-satellite precipitation products with a dense rain gauge network and optimally merging their simulated hydrological flows using the Bayesian model averaging method. J. Hydrol. 2012, 452, 213–225. [Google Scholar] [CrossRef]
  13. Tuo, Y.; Duan, Z.; Disse, M.; Chiogna, G. Evaluation of precipitation input for SWAT modeling in Alpine catchment: A case study in the Adige river basin (Italy). Sci. Total Environ. 2016, 573, 66–82. [Google Scholar] [CrossRef] [Green Version]
  14. Hong, Y.; Adler, R.F.; Huffman, G.J.; Pierce, H. Applications of TRMM-based multi-satellite precipitation estimation for global runoff prediction: Prototyping a global flood modeling system. In Satellite Rainfall Applications for Surface Hydrology; Springer Publishing: New York, NY, USA, 2010; pp. 245–265. [Google Scholar]
  15. Huffman, G.J.; Bolvin, D.T.; Braithwaite, D.; Hsu, K.; Joyce, R.; Kidd, C.; Nelkin, E.J.; Sorooshian, S.; Tan, J.; Xie, P. Algorithm Theoretical Basis Document (ATBD) Version 4.5: NASA Global Precipitation Measurement (GPM) Integrated Multi-Satellite Retrievals for GPM (IMERG); NASA: Greenbelt, MD, USA, 2015. [Google Scholar]
  16. Huffman, G.J.; Bolvin, D.T.; Braithwaite, D.; Hsu, K.; Joyce, R.; Xie, P. GPM Integrated Multi-Satellite Retrievals for GPM (IMERG) Algorithm Theoretical Basis Document (ATBD) Version 4.4; PPS, NASA/GSFC: Greenbelt, MD, USA, 2014; p. 30. [Google Scholar]
  17. Hou, A.Y.; Kakar, R.K.; Neeck, S.; Azarbarzin, A.A.; Kummerow, C.D.; Kojima, M.; Oki, R.; Nakamura, K.; Iguchi, T. The global precipitation measurement mission. B. Am. Meteorol. Soc. 2014, 95, 701–722. [Google Scholar] [CrossRef]
  18. Huffman, G.J.; Bolvin, D.T.; Braithwaite, D.; Hsu, K.; Joyce, R.; Kidd, C.; Nelkin, E.J.; Sorooshian, S.; Tan, T.; Xie, P. Algorithm Theoretical Basis Document (ATBD) Version 5.2 NASA—NASA Global Precipitation Measurement (GPM) Integrated Multi-satellite Retrievals for GPM (IMERG); NASA: Greenbelt, MD, USA, 2018. [Google Scholar]
  19. Ouyang, L.; Lu, H.; Yang, K.; Chen, Y. Evaluation of GPM IMERG Precipitation Products in the South Tibetan Plateau and Central Himalaya; AGU Fall Meeting Abstracts: Washington, DC, USA, 2018. [Google Scholar]
  20. Lu, D.; Yong, B. Evaluation and hydrological utility of the latest GPM IMERG V5 and GSMaP V7 precipitation products over the Tibetan Plateau. Remote Sens.-Basel. 2018, 10, 2022. [Google Scholar] [CrossRef] [Green Version]
  21. Tang, G.; Ma, Y.; Long, D.; Zhong, L.; Hong, Y. Evaluation of GPM Day-1 IMERG and TMPA Version-7 legacy products over Mainland China at multiple spatiotemporal scales. J. Hydrol. 2016, 533, 152–167. [Google Scholar] [CrossRef]
  22. Wei, G.; Lü, H.; Crow, W.T.; Zhu, Y.; Wang, J.; Su, J. Comprehensive Evaluation of GPM-IMERG, CMORPH, and TMPA Precipitation Products with Gauged Rainfall over Mainland China. Adv. Meteorol. 2018, 2018, 18. [Google Scholar] [CrossRef] [Green Version]
  23. Jiang, L.; Bauer-Gottwein, P. How do GPM IMERG precipitation estimates perform as hydrological model forcing? Evaluation for 300 catchments across Mainland China. J. Hydrol. 2019, 572, 486–500. [Google Scholar] [CrossRef]
  24. Beria, H.; Nanda, T.; Bisht, D.S.; Chatterjee, C. Does the GPM mission improve the systematic error component in satellite rainfall estimates over TRMM? An evaluation at a pan-India scale. Hydrol. Earth Syst. Sci. 2017, 21, 6117. [Google Scholar] [CrossRef] [Green Version]
  25. Rozante, J.; Vila, D.; Barboza Chiquetto, J.; Fernandes, A.; Souza Alvim, D. Evaluation of TRMM/GPM blended daily products over Brazil. Remote Sens.-Basel. 2018, 10, 882. [Google Scholar] [CrossRef] [Green Version]
  26. Gosset, M.; Alcoba, M.; Roca, R.; Cloché, S.; Urbani, G. Evaluation of TAPEER daily estimates and other GPM-era products against dense gauge networks in West Africa, analysing ground reference uncertainty. Q. J. Roy. Meteor. Soc. 2018, 144, 255–269. [Google Scholar] [CrossRef] [Green Version]
  27. Dezfuli, A.K.; Ichoku, C.M.; Mohr, K.I.; Huffman, G.J. Precipitation characteristics in West and East Africa from satellite and in situ observations. J. Hydrometeorol. 2017, 18, 1799–1805. [Google Scholar] [CrossRef]
  28. Xu, R.; Tian, F.; Yang, L.; Hu, H.; Lu, H.; Hou, A. Ground validation of GPM IMERG and TRMM 3B42V7 rainfall products over southern Tibetan Plateau based on a high-density rain gauge network. J. Geophys. Res.: Atmospheres. 2017, 122, 910–924. [Google Scholar] [CrossRef]
  29. Wang, Z.; Zhong, R.; Lai, C.; Chen, J. Evaluation of the GPM IMERG satellite-based precipitation products and the hydrological utility. Atmos. Res. 2017, 196, 151–163. [Google Scholar] [CrossRef]
  30. Duan, Z.; Liu, J.; Tuo, Y.; Chiogna, G.; Disse, M. Evaluation of eight high spatial resolution gridded precipitation products in Adige Basin (Italy) at multiple temporal and spatial scales. Sci. Total Environ. 2016, 573, 1536–1553. [Google Scholar] [CrossRef] [PubMed] [Green Version]
  31. Tian, Y.; Peters-Lidard, C.D.; Adler, R.F.; Kubota, T.; Ushio, T. Evaluation of GSMaP Precipitation Estimates over the Contiguous United States. J. Hydrometeorol. 2010, 11, 566–574. [Google Scholar] [CrossRef]
  32. Guo, H.; Chen, S.; Bao, A.; Hu, J.; Gebregiorgis, A.; Xue, X.; Zhang, X. Inter-Comparison of High-Resolution Satellite Precipitation Products over Central Asia. Remote Sens.-Basel. 2015, 7, 7181–7211. [Google Scholar] [CrossRef] [Green Version]
  33. Ning, S.; Wang, J.; Jin, J.; Ishidaira, H. Assessment of the Latest GPM-Era High-Resolution Satellite Precipitation Products by Comparison with Observation Gauge Data over the Chinese Mainland. Water 2016, 8, 481. [Google Scholar] [CrossRef]
  34. Su, J.; Lü, H.; Zhu, Y.; Cui, Y.; Wang, X. Evaluating the hydrological utility of latest IMERG products over the Upper Huaihe River Basin, China. Atmos. Res. 2019, 225, 17–29. [Google Scholar] [CrossRef]
  35. Tan, X.; Yong, B.; Ren, L. Error features of the hourly GSMaP multi-satellite precipitation estimates over nine major basins of China. Hydrol. Res. 2018, 49, 761–779. [Google Scholar] [CrossRef]
  36. Yuan, F.; Zhang, L.; Soe, K.; Ren, L.; Zhao, C.; Zhu, Y.; Jiang, S.; Liu, Y. Applications of TRMM- and GPM-Era Multiple-Satellite Precipitation Products for Flood Simulations at Sub-Daily Scales in a Sparsely Gauged Watershed in Myanmar. Remote Sens.-Basel. 2019, 11, 140. [Google Scholar] [CrossRef] [Green Version]
  37. Tian, Y.; Peters-Lidard, C.D.; Eylander, J.B.; Joyce, R.J.; Huffman, G.J.; Adler, R.F.; Hsu, K.; Turk, F.J.; Garcia, M.; Zeng, J. Component analysis of errors in satellite-based precipitation estimates. J. Geophys. Res. 2009, 114. [Google Scholar] [CrossRef] [Green Version]
  38. Yang, B.; Zhao, Y.; Zhao, H.; Li, B.; Huang, Y. Assessment of the Two Successive GPM-Based V3 and V4 GSMaP Precipitation Products at Multiple Temporal and Spatial Scales Over China. IEE J.-Stars. 2019, 12, 577–588. [Google Scholar] [CrossRef]
  39. Ning, S.; Song, F.; Udmale, P.; Jin, J.; Thapa, B.R.; Ishidaira, H. Error Analysis and Evaluation of the Latest GSMap and IMERG Precipitation Products over Eastern China. Adv. Meteorol. 2017, 2017, 1–16. [Google Scholar] [CrossRef] [Green Version]
  40. Reddy, M.V.; Mitra, A.K.; Momin, I.M.; Mitra, A.K.; Pai, D.S. Evaluation and inter-comparison of high-resolution multi-satellite rainfall products over India for the southwest monsoon period. Int. J. Remote Sens. 2019, 40, 4577–4603. [Google Scholar] [CrossRef]
  41. Chen, C.; Chen, Q.; Duan, Z.; Zhang, J.; Mo, K.; Li, Z.; Tang, G. Multiscale Comparative Evaluation of the GPM IMERG v5 and TRMM 3B42 v7 Precipitation Products from 2015 to 2017 over a Climate Transition Area of China. Remote Sens.-Basel. 2018, 10, 944. [Google Scholar] [CrossRef] [Green Version]
  42. Ma, Y.; Tang, G.; Long, D.; Yong, B.; Zhong, L.; Wan, W.; Hong, Y. Similarity and Error Intercomparison of the GPM and Its Predecessor-TRMM Multisatellite Precipitation Analysis Using the Best Available Hourly Gauge Network over the Tibetan Plateau. Remote Sens.-Basel. 2016, 8, 569. [Google Scholar] [CrossRef] [Green Version]
  43. Zheng, H.; Zhang, L.; Zhu, R.; Liu, C.; Sato, Y.; Fukushima, Y. Responses of streamflow to climate and land surface change in the headwaters of the Yellow River Basin. Water Resour. Res. 2009, 45. [Google Scholar] [CrossRef]
  44. Hu, Y.; Maskey, S.; Uhlenbrook, S.; Zhao, H. Streamflow trends and climate linkages in the source region of the Yellow River, China. Hydrol. Process. 2011, 25, 3399–3411. [Google Scholar] [CrossRef]
  45. Ren, Z.H.; Zhao, P.; Zhang, Q.; Zhang, Z.F.; Cao, L.J.; Yang, Y.R.; Zou, F.L.; Zhao, Y.F.; Zhao, H.M.; Chen, Z. Quality control procedures for hourly precipitation data from automatic weather stations in China. Meteorol. Mon. 2010, 36, 123–132. [Google Scholar]
  46. Yuan, F.; Wang, B.; Shi, C.; Cui, W.; Zhao, C.; Liu, Y.; Ren, L.; Zhang, L.; Zhu, Y.; Chen, T.; et al. Evaluation of hydrological utility of IMERG Final run V05 and TMPA 3B42V7 satellite precipitation products in the Yellow River source region, China. J. Hydrol. 2018, 567, 696–711. [Google Scholar] [CrossRef]
  47. Stanley, T.; Kirschbaum, D.B.; Huffman, G.J.; Adler, R.F. Approximating long-term statistics early in the global precipitation measurement era. Earth Interact. 2017, 21, 1–10. [Google Scholar] [CrossRef] [Green Version]
  48. Sokolova, M.; Lapalme, G. A systematic analysis of performance measures for classification tasks. Inform. Process. Manag. 2009, 45, 427–437. [Google Scholar] [CrossRef]
  49. Visa, S.; Ramsay, B.; Ralescu, A.L.; Van Der Knaap, E. Confusion Matrix-based Feature Selection. MAICS 2011, 710, 120–127. [Google Scholar]
  50. Abera, W.; Brocca, L.; Rigon, R. Comparative evaluation of different satellite rainfall estimation products and bias correction in the Upper Blue Nile (UBN) basin. Atmos. Res. 2016, 178–179, 471–483. [Google Scholar] [CrossRef]
  51. Jiang, S.; Ren, L.; Xu, C.; Yong, B.; Yuan, F.; Liu, Y.; Yang, X.; Zeng, X. Statistical and hydrological evaluation of the latest Integrated Multi-satellitE Retrievals for GPM (IMERG) over a midlatitude humid basin in South China. Atmos. Res. 2018, 214, 418–429. [Google Scholar] [CrossRef]
  52. Islam, M.A. Statistical comparison of satellite-retrieved precipitation products with rain gauge observations over Bangladesh. Int. J. Remote Sens. 2018, 39, 2906–2936. [Google Scholar] [CrossRef] [Green Version]
  53. Huang, W.; Chang, Y.; Liu, P. Assessment of IMERG precipitation over Taiwan at multiple timescales. Atmos. Res. 2018, 214, 239–249. [Google Scholar] [CrossRef]
  54. Guo, H.; Bao, A.; Ndayisaba, F.; Liu, T.; Kurban, A.; De Maeyer, P. Systematical Evaluation of Satellite Precipitation Estimates Over Central Asia Using an Improved Error-Component Procedure. J. Geophys. Res. Atmos. 2017, 122, 10906–10927. [Google Scholar] [CrossRef]
  55. Foelsche, U.; Kirchengast, G.; Fuchsberger, J.; Tan, J.; Petersen, W.A. Evaluation of GPM IMERG Early, Late, and Final rainfall estimates using WegenerNet gauge data in southeastern Austria. Hydrol. Earth Syst. Sc. 2017, 21, 6559–6572. [Google Scholar]
  56. Lu, X.; Tang, G.; Wei, M.; Yang, L.; Zhang, Y. Evaluation of multi-satellite precipitation products in Xinjiang, China. Int. J. Remote Sens. 2018, 39, 7437–7462. [Google Scholar] [CrossRef]
  57. Dinku, T.; Chidzambwa, S.; Ceccato, P.; Connor, S.J.; Ropelewski, C.F. Validation of high-resolution satellite rainfall products over complex terrain. Int. J. Remote Sens. 2008, 29, 4097–4110. [Google Scholar] [CrossRef]
  58. Bonacina, L.; Poulter, R.M.; Ashmore, S.E.; Manley, G.; BONACINA, L. Orographic rainfall and its place in the hydrology of the globe. Q. J. Roy. Meteor. Soc. 1945, 71, 41–55. [Google Scholar]
  59. Hughes, M.; Hall, A.; Fovell, R.G. Blocking in areas of complex topography, and its influence on rainfall distribution. J. Atmos. Sci. 2009, 66, 508–518. [Google Scholar] [CrossRef] [Green Version]
  60. Mega, T.; Ushio, T.; Takahiro, M.; Kubota, T.; Kachi, M.; Oki, R. Gauge-Adjusted Global Satellite Mapping of Precipitation. Ieee, T. Geosci. Remote. 2019, 57, 1928–1935. [Google Scholar] [CrossRef]
  61. Yong, B.; Chen, B.; Tian, Y.; Yu, Z.; Hong, Y. Error-Component Analysis of TRMM-Based Multi-Satellite Precipitation Estimates over Mainland China. Remote Sens.-Basel. 2016, 8, 440. [Google Scholar] [CrossRef] [Green Version]
  62. Zhu, Q.; Gao, X.; Xu, Y.; Tian, Y. Merging multi-source precipitation products or merging their simulated hydrological flows to improve streamflow simulation. Hydrolog. Sci. J. 2019, 64, 910–920. [Google Scholar] [CrossRef]
  63. Chao, L.; Zhang, K.; Li, Z.; Zhu, Y.; Wang, J.; Yu, Z. Geographically weighted regression based methods for merging satellite and gauge precipitation. J. Hydrol. 2018, 558, 275–289. [Google Scholar] [CrossRef]
Figure 1. Location of the study area.
Water 12 01006 g001
Figure 2. Distribution of precipitation errors from IMERG SPPs at (a) hourly, (b) daily, (c) monthly, and (d) seasonal scales from 1 June 2014 to 31 December 2018.
Water 12 01006 g002
Figure 3. Comparison of the frequency distribution of the IMERG precipitation estimates with those of the ground observations from 1 June 2014 to 31 December 2018: (a) hourly and (b) daily time scales.
Water 12 01006 g003
Figure 4. Distribution of precipitation errors from GSMaP SPPs at (a) hourly, (b) daily, (c) monthly, and (d) seasonal scales from 29 March 2017 to 31 December 2018.
Water 12 01006 g004
Figure 5. Comparison of the frequency distribution of the GSMaP precipitation estimates with those of the ground observations from 29 March 2017 to 31 December 2018: (a) hourly and (b) daily time scales.
Water 12 01006 g005
Figure 6. Comparison of diurnal cycles of the SPP-based precipitation estimates averaged at the locations of 13 rain gauges with the ground precipitation observations: (a) real-time and near-real-time SPPs and (b) post-real-time SPPs.
Water 12 01006 g006
Figure 7. Comparison of SPP-based mean monthly precipitation with the ground observations: (a) real-time and near-real-time SPPs and (b) post-real-time SPPs
Water 12 01006 g007
Figure 8. Spatial distribution of BIAS values at the hourly scale for all eight SPPs: (a) Real-time and near-real-time SPPs and (b) Post-real-time SPPs.
Water 12 01006 g008
Figure 9. Spatial distribution of CC values at the hourly scale for all eight SPPs: (a) Real-time and near-real-time SPPs and (b) Post-real-time SPPs.
Water 12 01006 g009
Figure 10. Confusion matrix of daily precipitation from the gauge-based precipitation and eight SPPs: (a) Real-time and near-real-time SPPs and (b) Post-real-time SPPs.
Water 12 01006 g010
Table 1. Brief information of the eight satellite-based precipitation products (SPPs) in this study.
ProductsResolutionLatencyTime Period
IMERG-E0.1°, 0.5 h4 h1 June 2014 to 31 December, 2018
IMERG-L0.1°, 0.5 h14 h1 June 2014 to 31 December, 2018
IMERG-F0.1°, 0.5 h3.5 months1 January 2014 to 31 December, 2018
GSMaP-NOW0.1°, 0.5 hReal time29 March 2017 to 31 December, 2018
GSMaP-NRT0.1°, 1 h4 h17 January 2017 to 31 December, 2018
GSMaP-Gauge-NRT0.1°, 1 h4 h17 January 2017 to 31 December, 2018
GSMaP-MVK0.1°, 1 h3 days1 March 2014 to 31 December, 2018
GSMaP-Gauge0.1°, 1 h3 days1 March 2014 to 31 December, 2018
Table 2. List of the statistical metrics used in this study.
CategoriesStatistic MetricsEquationsPerfect Value
1Pearson correlation coefficient (CC) CC = i = 1 n ( G i G ¯ ) ( S i S ¯ ) i = 1 n ( G i G ¯ ) 2 i = 1 n ( S i S ¯ ) 2 1
2Mean error (ME) ME = 1 n i = 1 n ( S i G i ) 0
Mean absolute error (MAE) MAE = 1 n i = 1 n | S i G i | 0
Root-mean-squared error (RMSE) RMSE = i = 1 n ( S i G i ) 2 n 0
Relative BIAS (BIAS) BIAS = i = 1 n ( S i G i ) i = 1 n G i × 100 % 0
3Probability of detection (POD) POD = H H + M 1
False alarm ratio (FAR) FAR = F H + F 0
Critical success index (CSI) CSI = H H + M + F 1
4Coefficient of skewness (SK) SK = 3 ( E ¯ M o ) σ 0
Notation: n , sample size; G i , gauge-based precipitation; G ¯ , mean value of the gauge-based precipitation; S i represents satellite precipitation; S ¯ , mean value of satellite precipitation; H , the number of precipitation events that are correctly detected by the satellites; M , the number of precipitation events that satellites failed to detect; F , the number of false detection; E ¯ , mean error of satellite precipitation estimates; M o , median error of satellite precipitation estimates; and σ, standard deviation of errors from SPPs.
Table 3. Summary of statistical metrics of precipitation estimates from integrated multisatellite retrievals for Global Precipitation Measurement (IMERG) SPPs at hourly, daily, monthly, and seasonal scales from 1 June 2014 to 31 December 2018.
Time ScaleSPPsCCME
(mm)
MAE
(mm)
RMSE (mm)BIAS
(%)
PODFARCSI
HourlyIMERG-E0.24−0.0240.0930.55−33.170.690.270.55
IMERG-L0.22−0.0250.0940.56−34.450.690.270.55
IMERG-F0.240.0010.1110.602.040.710.320.53
DailyIMERG-E0.53−0.5581.4993.93−33.170.770.250.61
IMERG-L0.52−0.5811.4874.09−34.450.740.220.61
IMERG-F0.600.0441.6064.122.040.800.260.63
MonthlyIMERG-E0.82−16.74423.30633.76−33.17---
IMERG-L0.82−17.41423.51234.39−34.45---
IMERG-F0.951.44910.28915.832.04---
SeasonalIMERG-E0.88−50.71655.52175.41−33.17---
IMERG-L0.88−52.74557.42277.03−34.45---
IMERG-F0.974.52921.06930.122.04---
Note: The sample sizes of each SPP dataset at hourly, daily, monthly, and seasonal scales are 522,600, 21,775, 702, and 234, respectively, and all the CCs in the table are statistically significant with p-values less than 0.0001.
Table 4. SK of precipitation errors from IMERG SPPs at hourly, daily, monthly, and seasonal scales from 1 June 2014 to 31 December 2018.
Time ScalesSPPsSK
HourlyIMERG-E−0.26
IMERG-L−0.27
IMERG-F0.02
DailyIMERG-E−0.68
IMERG-L−0.70
IMERG-F−0.10
MonthlyIMERG-E−1.62
IMERG-L−1.78
IMERG-F0.28
SeasonalIMERG-E−1.56
IMERG-L−1.50
IMERG-F0.46
Table 5. Summary of statistical metrics of precipitation estimates from global satellite mapping of precipitation (GSMaP) SPPs at hourly, daily, monthly, and seasonal scales from 29 March 2017 to 31 December 2018.
Time ScalesSPPsCCME
(mm)
MAE
(mm)
RMSE
(mm)
BIAS (%)PODFARCSI
HourlyGSMaP-NOW0.26−0.0190.1150.58−23.140.250.620.17
GSMaP-NRT0.160.0400.1711.2548.290.230.640.16
GSMaP-Gauge-NRT0.210.0090.1430.8111.240.240.670.16
GSMaP-MVK0.190.0490.1750.9858.770.290.670.18
GSMaP-Gauge0.310.0020.1250.542.880.530.710.23
DailyGSMaP-NOW0.53−0.4641.8954.37−23.140.590.240.50
GSMaP-NRT0.460.9682.7028.6348.290.670.250.55
GSMaP-Gauge-NRT0.540.2252.1515.6711.240.670.240.55
GSMaP-MVK0.541.1782.6426.8458.770.780.280.60
GSMaP-Gauge0.730.0581.3213.192.880.820.190.68
MonthlyGSMaP-NOW0.75−14.48027.86642.33−23.14---
GSMaP-NRT0.7829.42541.29467.9948.29---
GSMaP-Gauge-NRT0.846.85726.00341.5811.24---
GSMaP-MVK0.7935.63543.34364.0358.77---
GSMaP-Gauge0.921.86112.81622.172.88---
SeasonalGSMaP-NOW0.78−43.44027.86694.68−23.14---
GSMaP-NRT0.8588.27641.294142.3248.29---
GSMaP-Gauge-NRT0.8920.57126.00378.2011.24---
GSMaP-MVK0.87106.90643.343141.5058.77---
GSMaP-Gauge0.965.58425.41438.752.88---
Note: The sample sizes of each SPP dataset at hourly, daily, monthly, and seasonal scales are 200,616, 8359, 273, and 91, respectively, and all the CCs in the table are statistically significant with p-values less than 0.0001.
Table 6. SK of precipitation errors from GSMaP SPPs at hourly, daily, monthly, and seasonal scales from 29 March 2017 to 31 December 2018.
Time ScaleSPPsSK
HourlyGSMaP-NOW−0.17
GSMaP-NRT0.27
GSMaP-Gauge-NRT0.07
GSMaP-MVK0.32
GSMaP-Gauge0.02
DailyGSMaP-NOW−0.31
GSMaP-NRT0.49
GSMaP-Gauge-NRT0.15
GSMaP-MVK0.68
GSMaP-Gauge0.05
MonthlyGSMaP-NOW−1.02
GSMaP-NRT1.64
GSMaP-Gauge-NRT0.58
GSMaP-MVK1.93
GSMaP-Gauge0.23
SeasonalGSMaP-NOW−1.15
GSMaP-NRT1.60
GSMaP-Gauge-NRT0.72
GSMaP-MVK1.82
GSMaP-Gauge0.30

