Assessing Redundancy in Stormwater Structures Under Hydraulic Design
by
 , , ,
, , ,
Sina Hesarkazzazi
1,* ,
,
Mohsen Hajibabaei
1,
Julian David Reyes-Silva
2,
Peter Krebs
2 and
Robert Sitzenfrei
1,* 1
Unit of Environmental Engineering, University of Innsbruck, 6020 Innsbruck, Austria
2
Institute for Urban Water Management, Department of Hydrosciences, TU Dresden, 01069 Dresden, Germany
*
Authors to whom correspondence should be addressed.
Water 2020, 12(4), 1003; https://doi.org/10.3390/w12041003
Submission received: 4 March 2020
/
Revised: 25 March 2020
/
Accepted: 29 March 2020
/
Published: 1 April 2020
(This article belongs to the Section Urban Water Management)
Abstract
:As environmental change is happening at an unprecedented pace, a reliable and proper urban drainage design is required to alleviate the negative effects of unexpected extreme rainfall events occurring due to the natural and anthropogenic variations such as climate change and urbanization. Since structure/configuration of a stormwater network plays an imperative role in the design and hydraulic behavior of the system, the goal of this paper is to elaborate upon the significance of possessing redundancy (e.g., alternative flow paths as in loops) under simultaneous hydraulic design in stormwater pipe networks. In this work, an innovative approach based on complex network properties is introduced to systematically and successively reduce the number of loops and, therefore, the level of redundancy, from a given grid-like (street) network. A methodology based on hydrodynamic modelling is utilized to find the optimal design costs for all created structures while satisfying a number of hydraulic design constraints. As a general implication, when structures are subject to extreme precipitation events, the overall capability of looped configurations for discharging runoff more efficiently is higher compared to more branched ones. The reason is due to prevailing (additional) storage volume in the system and existing more alternative water flow paths in looped structures, as opposed to the branched ones in which only unique pathways for discharging peak runoff exist. However, the question arises where to best introduce extra paths in the network? By systematically addressing this question with complex network analysis, the influence of downstream loops was identified to be more significant than that of upstream loops. Findings, additionally, indicated that possessing loop and introducing extra capacity without determining appropriate additional pipes positions in the system (flow direction) can even exacerbate the efficiency of water discharge. Considering a reasonable and cost-effective budget, it would, therefore, be worthwhile to install loop-tree-integrated stormwater collection systems with additional pipes at specific locations, especially downstream, to boost the hydraulic reliability and minimize the damage imposed by the surface flooding upon the metropolitan area.
1. Introduction
Due to the unfavorable and deleterious impact of extreme urban inundations on the environment, society and economy, significant attention should be devoted to flood risk management in municipal areas. There is a perception that the frequency and magnitude of flooding events that are overwhelming drainage infrastructures are expected to increase because of climate change and urbanization [1]. The common design practice of the urban drainage systems is based on a specific design storm with a given return period, which is derived from historical rainfall observations, assuming stationary conditions. This results in a fixed urban drainage system capacity. However, due to the change in the characteristics of rainfall distributions over time in many parts of the world, the non-stationary behavior of rainfall time series might be dominant, which leads to unexpected high intensity precipitation events [2], as well as rapid exceedance of the drainage systems’ capacity. Thus, to tackle these anomalies, urban drainage infrastructures should be properly and reliably designed to enhance the reliability and hydraulic response, while confronting any potential unpredicted functional failures. Generally speaking, drainage network design is basically composed of two stages, determining suitable hydraulic design (pipe-sizing process) and generating an appropriate spatial layout/structure.
As far as hydraulic dimensioning is concerned, the storm sewer design of urban catchments is typically based on the steady-state methods, such as the classic Rational method due to its simplicity, quick implementation and few input parameters. However, these methods neglect complex flow conditions such as backwater effect and pressurized flow, and tend to imprecisely assess maximum design flows [3], especially when it comes to large networks as well as high intensity precipitation events. Furthermore, a looped structure cannot be assessed with such steady-state methods. To overcome these limitations, many researchers have extensively focused on optimal design processes using various optimization techniques [4,5,6,7,8,9,10,11,12]. Since these optimization algorithms try to find the optimal combination of pipe diameters as well as slopes among numerous candidates to achieve a minimum-cost solution for the whole network, they are computationally very expensive.
Within the realm of layout design, one of the strategies to increase reliability or resilience of the urban drainage systems is to implement redundancy-boosting solutions into the system. Redundancy implies having multiple components with similar functions or having alternative elements in order to minimize failure probability through the whole system [13]. Examples of adaption strategies to increase redundancy characteristics of drainage systems fall into three groups. 1) implementing a Best Management Practice (BMP) solution, e.g., centralized storage tanks, 2) identifying and replacing critical pipes and 3) introducing parallel pipes or loops [14]. Nonetheless, the contribution of the aforementioned adaptation strategies to the reliability and hydraulic improvement of the drainage infrastructures is still unclear [15]. Hereinafter, when mentioning “redundancy” throughout this paper, the third solution, which is having loops, is referred to.
Reliability, resilience and sustainability of grey, green and hybrid intervention strategies have been broadly described and well understood [16]. In their study, they demonstrated that the robustness measure of the grey infrastructures in terms of reliability, resilience and sustainability can be enhanced by incorporating green retrofits. One of the efforts with respect to these interventions is the sponge city initiative in China [17]. Similarly, there are numerous studies on the reduction impact of green infrastructures on the functional failures (e.g., rainfall induced) of the urban drainage networks [18,19,20,21]. However, these studies have not considered the influence of structure (configuration) on this type of failures, and thus flood reliability. As a result, the in-depth understanding of the network’s structure (e.g., redundancy) is of high importance in the first place. Furthermore, the identification of critical locations for having redundancy in the network is of high relevance even for hybrid solutions, giving guidance on how to implement an appropriate layout with different structural properties (with optimal location and optimal number of loops) in the grey part of the infrastructure. In this regard, though stormwater drainage systems are fundamentally constructed in a tree-like structure due to their gravity-driven nature (flowing along the gradients), adding (a few) additional pipes (building loops) might significantly improve the network’s response for handling higher runoff volumes due to more intense precipitations events. In this context, examples of studies are rare. Zhang et al. studied the impact of branched and looped systems on the vulnerability of urban drainage systems based on blockage scenarios (structural failures) [22]. Their results demonstrated that looped systems possessed a lesser proportion of critical elements compared to their branched counterparts. Likewise, the impact of structures of different stormwater networks on the relationship between peak rainfall and runoff (regression model) and their drainage density was studied [23]. Reyes-Silva et al. evaluated the functional failures of eight subnetworks of the city of Dresden that have different characteristics in terms of capacity as well as structure [24]. They inferred that networks with more meshed structural characteristics are associated with less flooding volumes and flooding nodes compared to branched ones. However, a generic and systematic technique, yielding numerous structures/configurations for a specific given system, is still required.
Based on this, two important questions arise: (1) to what extent might possessing loops affect the hydraulic design and performance of the stormwater collection systems? (2) Regarding construction costs and hydraulic performance of the piped network, what would be the optimal number of loops in the system? The main goal of this paper is, thus, to address these questions by developing an automated method to consecutively eliminate the additional pipes from a base looped sewer system, whose layout is mainly based on the street network system [25]. It is worth noting that unlike the common approach of changing redundancy by adding extra pipes to an already designed branched network (absolute increase in total system capacity), the additional pipes are removed one by one from a fully looped base system with a simultaneous hydraulic design until attaining the branched one. It can be said that the base system follows the more or less grid-wise structure of the street network. This approach is particularly relevant for the design and hydraulic assessment of different stormwater collection structures (with a different number of loops) to infer the optimal level of redundancy.
The objective of this paper is then as follows: (1) generate various stormwater structures/layouts by consecutively and systematically analyzing the complex nature of the drainage network, and reduce the number of loops from a given grid-like network using topological network properties; (2) design all generated stormwater collection structures with the help of the one-dimensional Saint-Venant shallow flow equation as well as the Manning equation with a two-stage sewer design described by Shao et al. [26], which is more efficient and computationally faster than optimization techniques; (3) evaluate the performance of all designed structures, which have a different number of loops, in terms of cost and flooding behavior by considering the urbanization impact in order to finally tackle the questions mentioned above.
2. Materials and Methods
2.1. Complex Network Analysis
An urban water network can be illustrated with a specific branch of mathematics called graph theory. Manholes, storage units and outfalls of the system are represented as vertices in the graph, and conduits, pumps and weirs are depicted as the edges. The incentive underlying such integration is that the graph interpretation of the sewer network is computationally very fast and effective [27]. In addition, for each edge of the graph, different edge weights can be allocated. For instance, weighting function of the edges can be parameters like Euclidean distances (pipe lengths), diameters or even hydraulic/functional properties such as velocity, maximum flow, etc. Since one of the first steps of network design is to determine flow direction, corresponding graphs need to be associated with direction, called directed graphs.
Applied in this study, the topological network attribute is edge betweenness centrality [28]. The betweenness of an edge corresponds to the number of the shortest paths between each pair of vertices in the graph that passes through it. It also characterises the importance of edges for a given network. In this work, nonetheless, for sewer systems, a customized modification is added: edge betweenness corresponds to how frequent an edge is part of the shortest path between source vertices (S), or inlet nodes, to only target vertices (T), or outlet (s). Such modified edge betweenness centrality is denoted here as , the equation of which is given by
where is the modified edge betweenness centrality of edge e, is the number of shortest paths between vertex S and T, which passes through edge e, and is the number of shortest paths between vertex S and T. Additionally, O and N denote the total number of outlet(s) and (inlet) nodes, respectively.
2.2. Design Cost Performance Indicator
2.2.1. Layout/Structure Design
Generation of sewer layout is about where to spatially allocate junctions/manholes and conduits in the system, and additionally, to determine the flow direction in the sewers towards the outlet(s). Given a base sewer layout consisting of all possible loops, the challenge here is to develop an automated procedure, able to successively reduce the number of loops from a given-grid-like network, and accordingly, to examine the usefulness and importance of having redundancy. This approach is expected to allow sewer engineers to scrutinize the trade-off between potentially increased construction costs, resulting from having loops, and potentially improved reliability and resilience behavior of the system. Hence, this can assist stakeholders and engineers to make more informed decisions about the final layout of the investigated urban drainage system when one tends to design looped structures. Furthermore, the number of elementary loops were evaluated by Equation (2) as follows [29]:
in which is the number of loops, is the number of edges and is the number of vertices for each network.
It is worth noting that due to the strong correlation found between street networks and urban water infrastructures (around 85% of total sewer networks corresponds to 50% of the street networks) [25], the base grid-like layout, can be also regarded as street networks of the region of interest as a base looped sewer system.
As an initial step, although spatio-temporal analysis can be applied on the Digital Elevation Model (DEM) of the area to determine flow direction towards the outlet, the directions are assumed to be known in advance in this study. Additionally, though the outlet position should be placed in the lowest elevation in the area next to a receiving water body, the location of the outlet and inlet nodes were kept unchanged according to the case study properties. In the next step, the base (looped) stormwater system is hydraulically designed according to the methodology explained in the section “Hydraulic Dimensioning and Costs” considering local design guidelines. Afterwards, modified edge betweenness centrality (), Equation (1), is applied to the network; edges with values equal to zero are then successively deleted. Though the edges of the graph can be removed based on any other preferences and weights, it was decided here to investigate the effect of pipes elimination resting in non-preferential flow pathways. According to Manning’s formula, volumetric flow rate [] can be expressed in terms of networks’ structural characteristics as given by Equation (3):
In addition, length of the pipes is integrated to gain a better understanding of the network’s hydraulic properties and to implicitly include the lengths-based pipe costs in the procedure. Hence, to determine preferential flow pathways through the pipes, in addition to the lengths, inverse values of Equation (3) are used as edge weights, shown in Equation (4). Correspondingly, this edge weight (Equation (4)) is considered and computed for all edges of the graph:
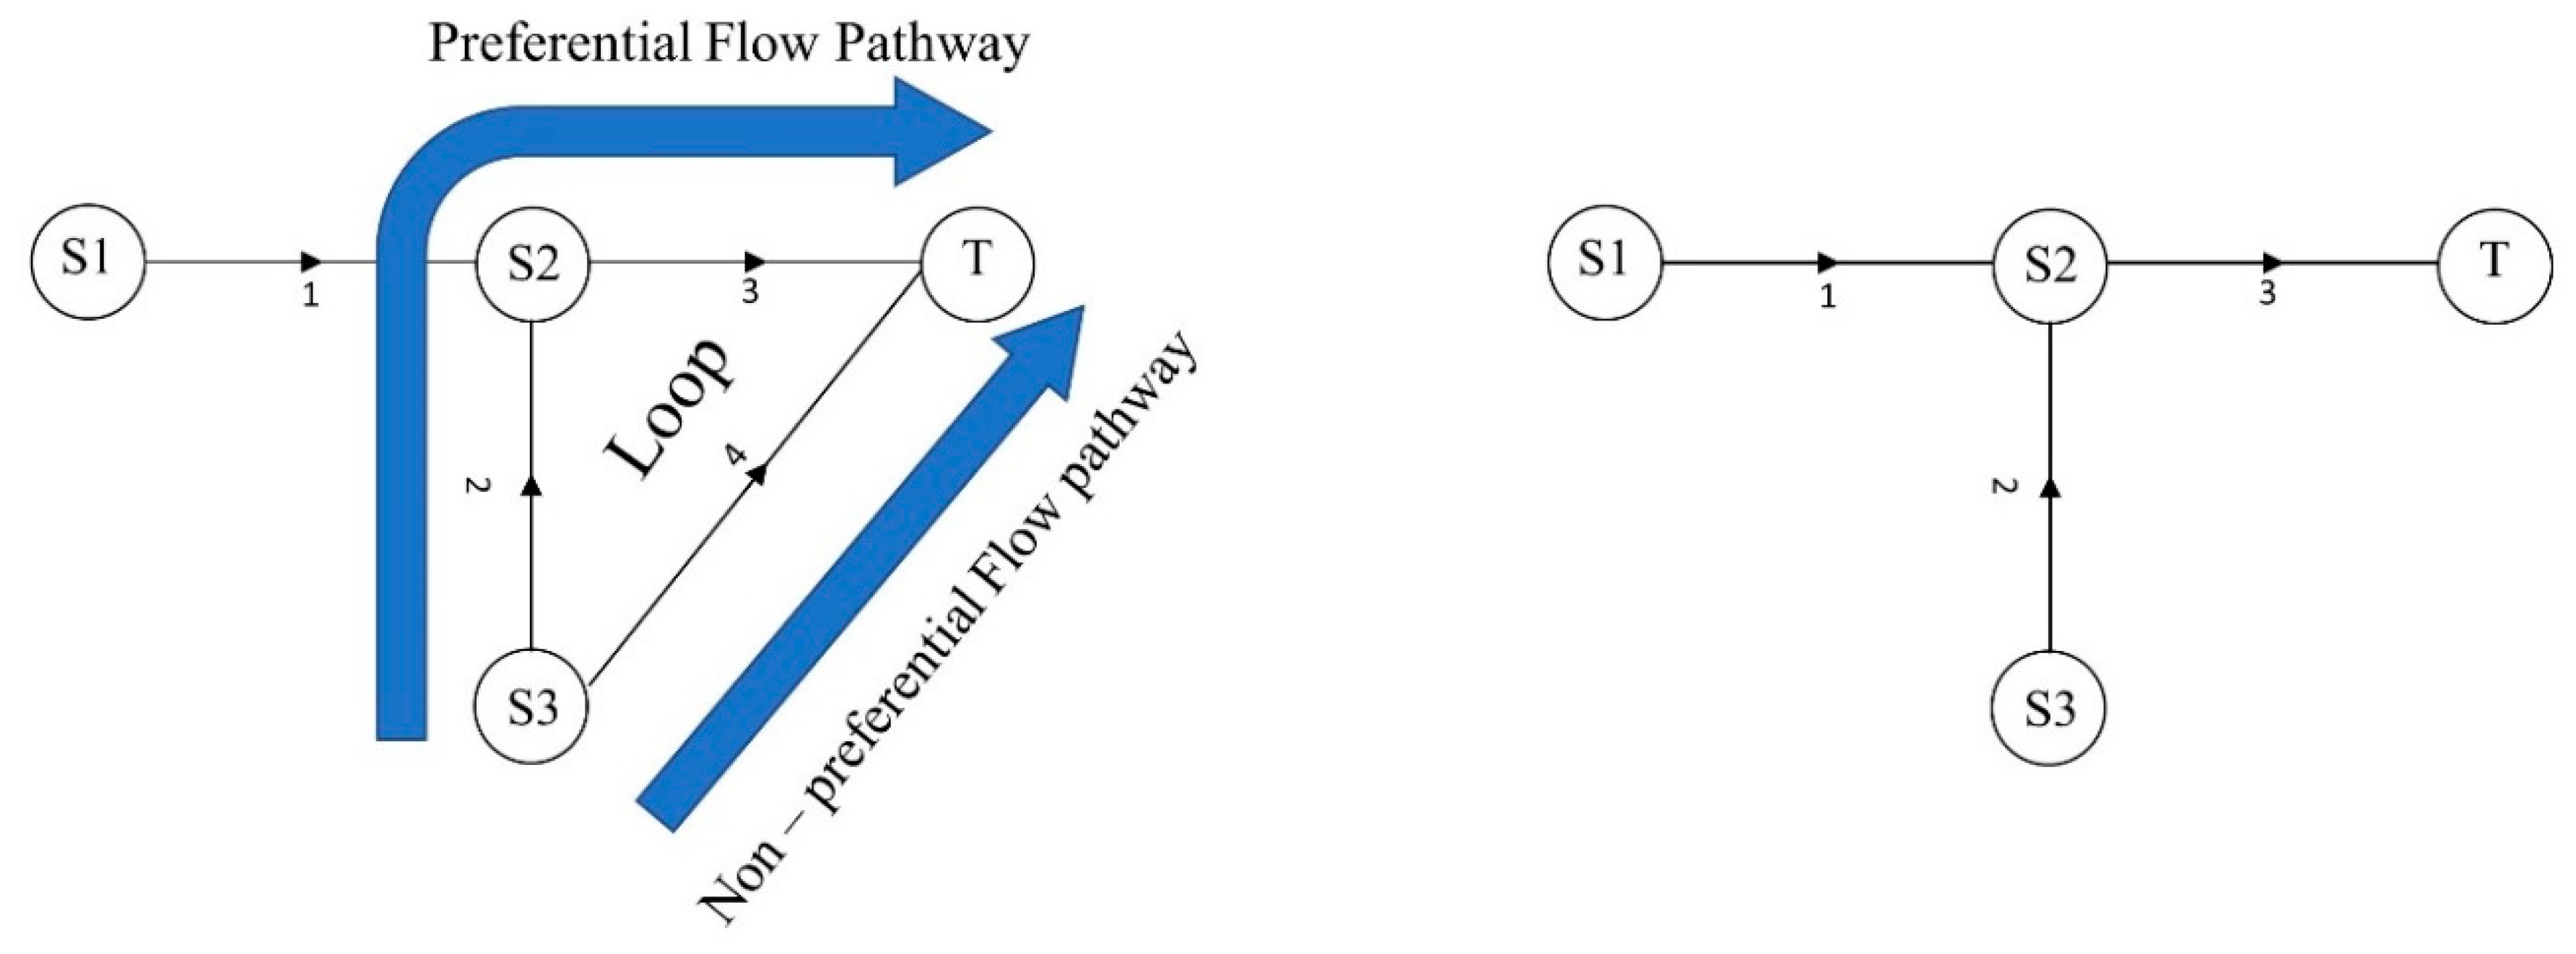
The proposed edge weight can be interpreted as that shorter connections with higher capacities attract more flow. Table 1 and Figure 1 demonstrate this procedure through an example. The structural properties of the example graph (Figure 1) are presented in Table 1 in terms of length, slope and diameter. As aforementioned, edge weights are computed within the network, and then (Equation (1)) is applied. To remove the additional pipe, as there are two paths from S3 (Source 3) to T (Target), the algorithm travels along the shortest paths (cheapest path) towards T. Since the path going through edge number 2 and 3 is the cheapest (with the value of 7330 as the sum of edge weight), chooses this path to get to T, ultimately leading to the elimination of edge number 4 ( equal to 0). In this study, this procedure is repeated for all extra paths through the base system, which culminates in creating numerous configurations from a fully looped (base) structured network to a branched one. In fact, applying , in this context, enables us to remove the additional pipes that are facing the multiple flow pathways. For the purpose of pipe elimination, three scenarios are defined in this study: (1) additional pipes are successively removed from upstream to downstream, (2) additional pipes are successively removed from downstream to upstream and (3) additional pipes are successively removed randomly.
2.2.2. Hydraulic Dimensioning and Costs
The storm sewer design applied in this study is described by Shao at al. [26]. It is based on dynamic hydrological and hydraulic flow routing in EPA Stormwater Management Model (SWMM) [30] for estimating maximum volumetric flow rates through all systems. Simultaneously, Manning’s equation is applied to correspond pipe flow rates with pipe slopes and diameters, assuming a steady-state condition. In order to achieve a proper stormwater collection design, there are a few constraints, which are elaborated as follows: (1) the computed diameters should be chosen from the discrete commercial lists and not less than a predefined minimum diameter, (2) minimum and maximum buried depth need to be additionally taken into account. The former is to prevent damages from the traffic load. The latter is assigned to avoid massive excavation volume, (3) minimum and maximum velocity through the pipes, the reasons of which are for self-cleaning capacity and pipe erosion, respectively, and (4) the ratio of flow depth to the diameter. The reason for fulfilling this constraint is to avoid any surcharge and flooding through the network caused by the design storm event. The hydraulic design constraints utilized in this paper are shown in Table 2. According to the sewer design methodology, as the first step, pipe slopes less than minimum allowable slope are updated to the minimum one to fulfil the minimum velocity requirements; additionally, all pipe diameters are set to the minimum diameter value. Next, simulation is run in the SWMM. The pipes, which are not able to satisfy the ratio of flow depth to the diameter constraint, are consecutively updated from downstream to upstream. This is conducted by recalculating the diameter using SWMM in parallel with Manning’s equation while keeping the slopes unchanged. This procedure is terminated once flow ratio to the depth of all pipes is equal or less than the maximum allowable threshold.
The next step is to eliminate any potential pipe velocities, greater or smaller than the maximum and minimum velocity, respectively. To do so, pipe diameters obtained in the last step are kept constant and pipe slopes that are not satisfying the velocity threshold are consecutively updated from downstream to upstream. Within this procedure, if the achieved velocity for the pipes is outside the acceptable range, its corresponding slope is adjusted using Manning’s equation; accordingly, the adjacent pipe slopes have to be updated. This iteration ends once all the pipes’ velocity is satisfied.
One of the performance assessment indicators used in this study is total design costs. For this purpose, the cost function explained by Maurer et al. [33] is utilized, which takes into account the average cover depth, diameter and lengths for each pipe section.
where C is the cost associated with a one meter pipe (US$/meter), D is diameter (meter) and is average depth of a pipe (meter), in which h is standard coverage depth of the sewer pipes (assumed equal to 2 meters). Conversion factor of 0.91 (1 US$ = €0.91) is used, in addition, to convert dollars to euros. Neglecting the operational costs of networks, the total construction costs for sewers and storage units are then assessed. The decisive duration for design is usually depending on the system size. In this work, a small case study is used (see Section 2.5). The storage units and its corresponding cost are calculated based on a single block rain event with a return period of 5 years and a duration of 60 min, and the pipe sizing procedure is calculated based on a block rain event with a return period of 2 years and a duration of 15 minutes according to Austrian standards [31]. As a result, total construction cost is computed as the sum of the construction costs of the conduits plus storage volume.
2.3. Urbanization
The hydrological response of an urban watershed to urbanization phenomena is of great importance, in that it plays a crucial role in deriving the design return period resulting from rainfall-runoff modeling [34,35]. In this study, the impact of urbanization is considered by incorporating city growth rate as well as the planning horizon associated with the infrastructure’s lifespan [36], which is based on the following equation:
where is the increased new return period (years), RP is original return period (years), g represents growth rate of the area (percentage) and t is the planning horizon (years).
2.4. Hydraulic Performance Indicator
The hydraulic performance indicator applied in this paper is expressed by flooding behavior [37]. Flooding performance is divided into the total (weighted) number of flooded nodes (Equation (8)), and total (weighted) ponded flooded volume (Equation (9)), based on a Euler II rain event [32] and 6 different return periods. The original return periods considered are 5, 10, 20, 50, 100 and 200 (years).
where denotes the total (weighted) number of flooded nodes, is number of flooded nodes, is the total (weighted) flooded volume, is flooded volume and i is the return period.
2.5. Case Study
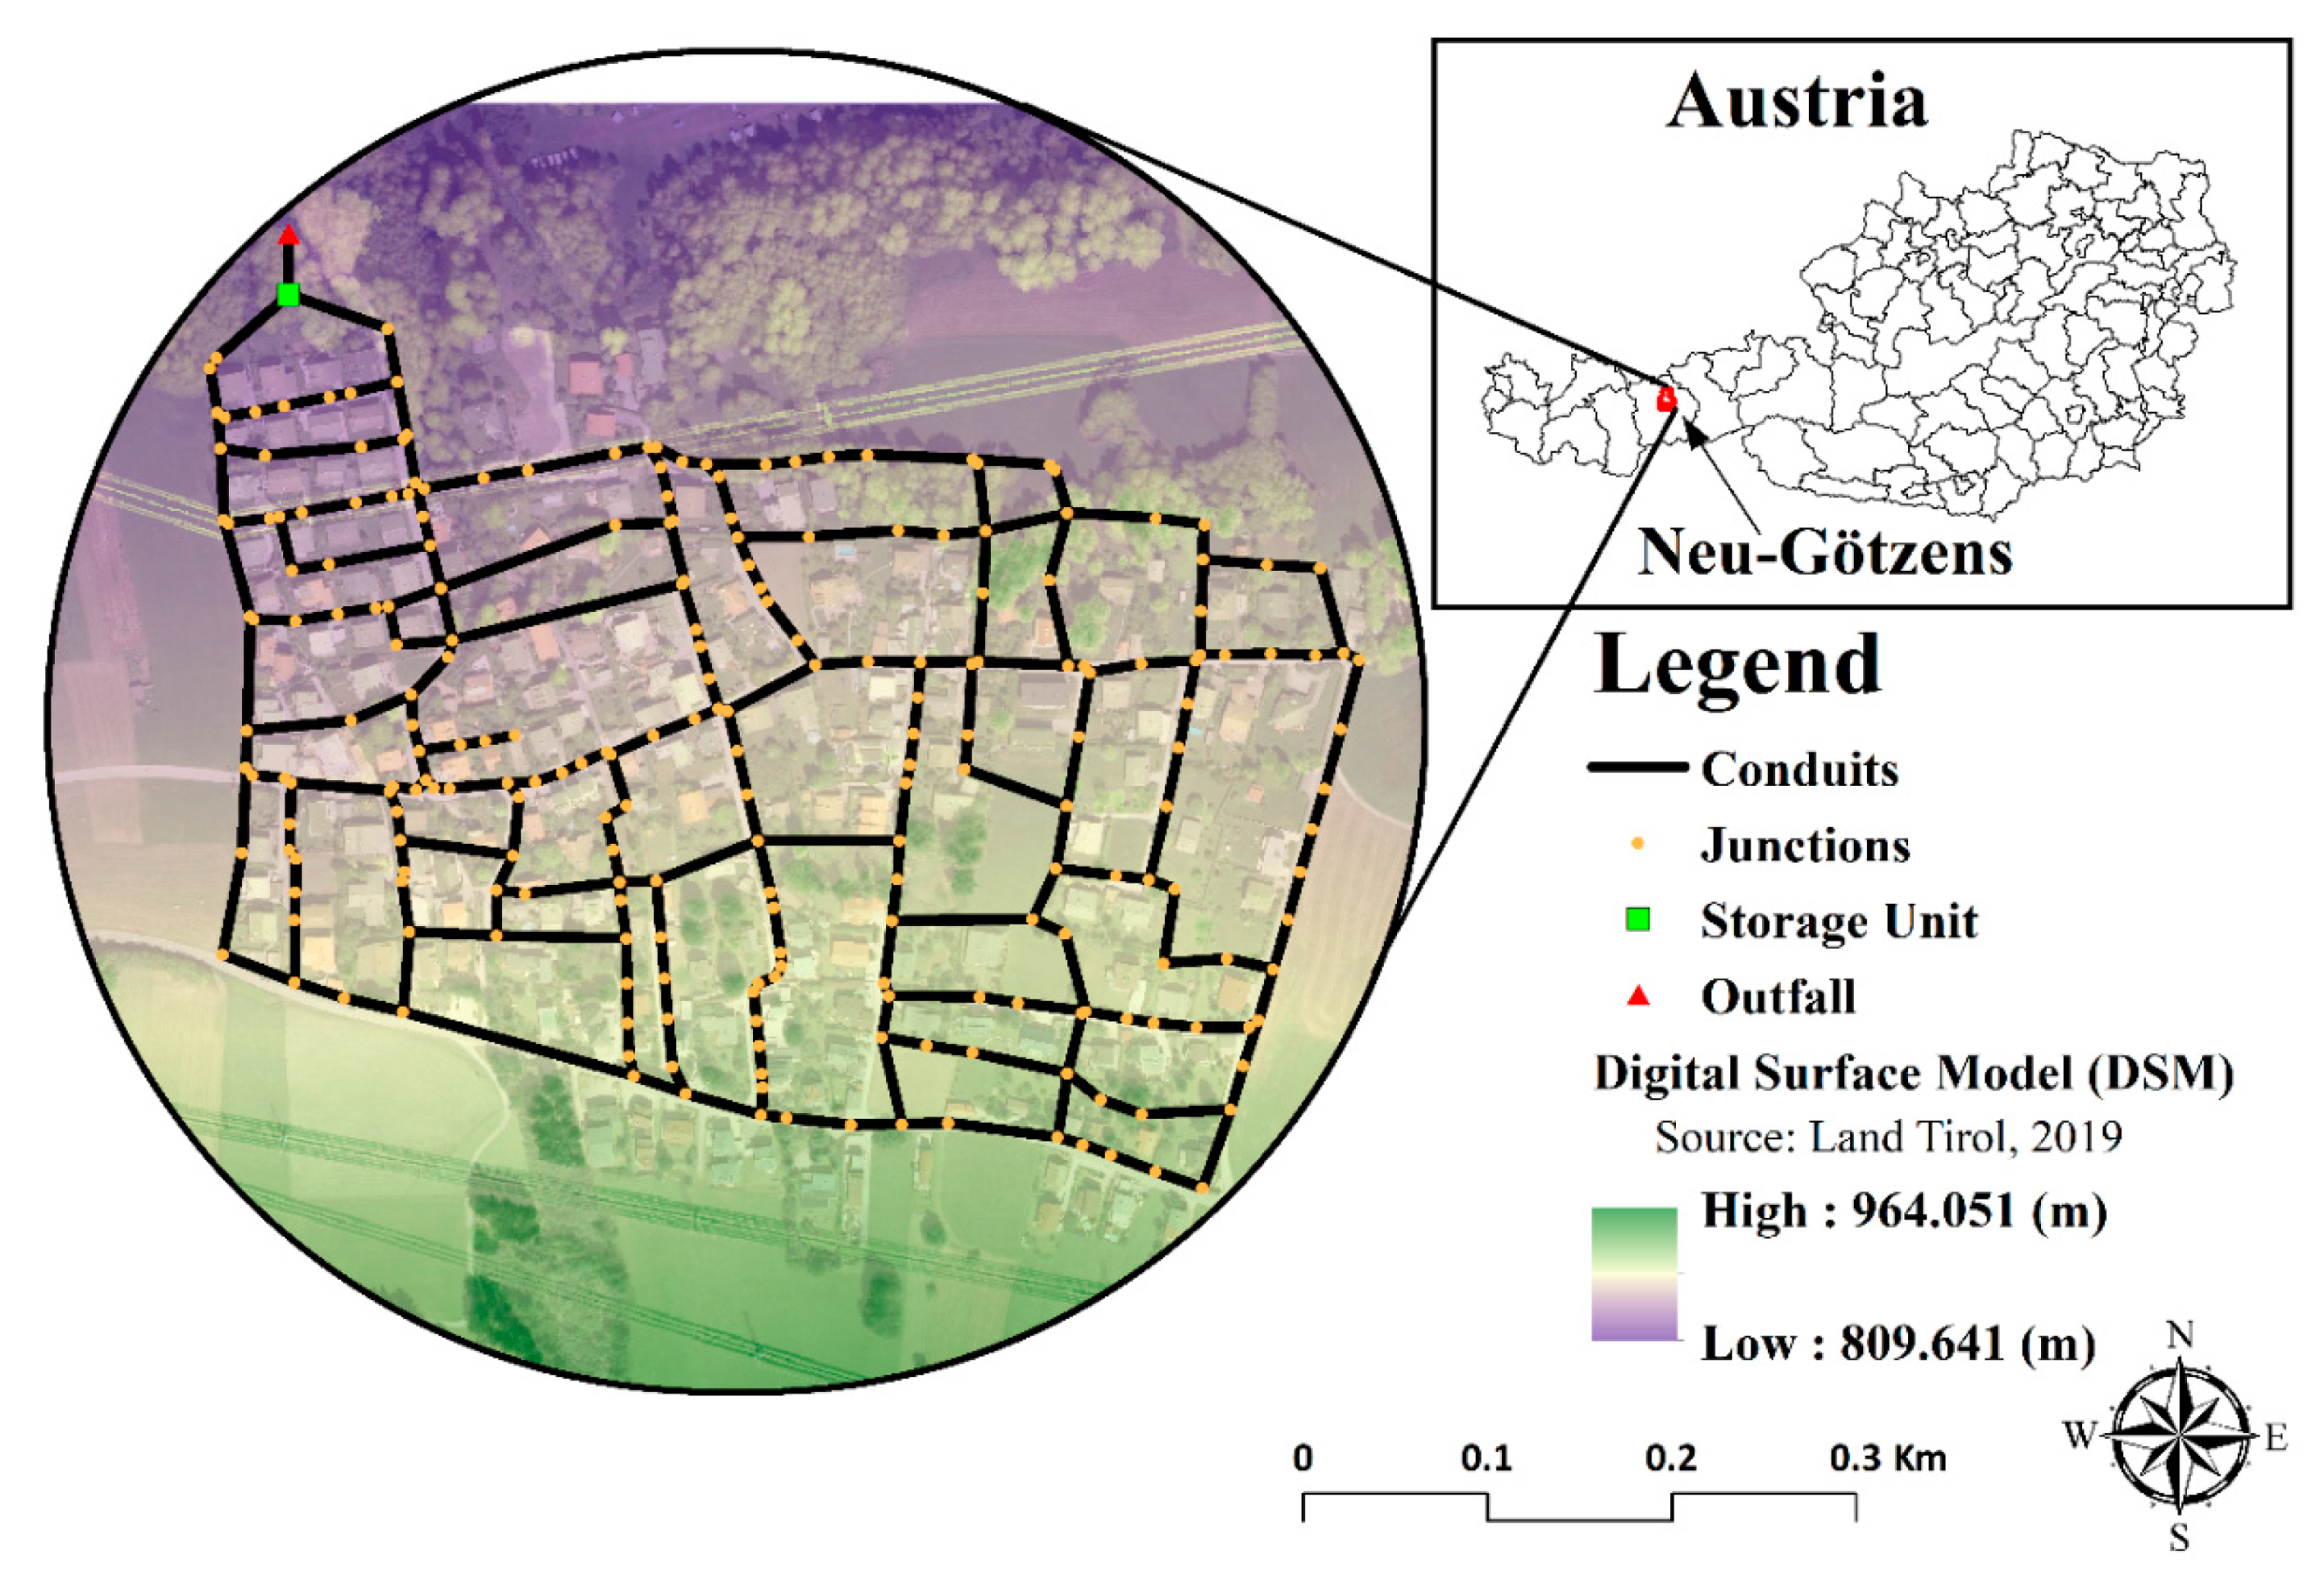
In this study, the stormwater drainage network of Neu-Götzens, an Alpine city in the proximity of Innsbruck/Austria, is selected as a case study. Though the original network is a dendritic one, all the possible conduits within the area were connected to resemble a grid-like network as the base sewer system (Figure 2). The placement of conduits was based on topographical features of the region. This network was chosen for one important reason. The Combined Sewer System (CSS) previously existed in this area, draining both sewage and storm. However, it was recently decided to renovate the system, converting it into separate drainage one. Therefore, it is of great importance to investigate different drainage structures, which might be beneficial for decision-makers before constructing the final version of the network. The network consists of one outfall and one storage unit to control peak runoff discharges to the receiving water system at downstream, and to prevent urban runoff peak colliding with the river peak. The network is comprised of 276 conduits and 237 junctions; the rest of its characteristics are shown in Table 3. As mentioned before, the Euler II rain event [32] is used for the hydraulic evaluation of all networks with a duration of 120 minutes (5 minutes interval) and 6 original return periods 5, 10, 20, 50, 100 and 200. These return periods are further recalculated using Equation (7), to account for urbanization impact with respect to the region’s growth rate equal to 1% and planning horizon equal to 25 years (see Section 2.3). Initial return periods, increased new (urbanized) return periods with their corresponding rainfall volumes (under new recurrence intervals), were shown in Table 4.
3. Results and Discussion
3.1. Hydraulic Performance Assessment
Based on the description given in the “Layout/Structure Design” section, applying Equation (1) to the fully looped base system of the case study (Figure 2), possessing 40 independent loops, leads to 41 individual network configurations. These networks varied from network number 40 (having 40 loops) to network number 0 (having zero loops/branched). Next, all 41 networks were hydraulically designed based on explained methodology and constraints in “Hydraulic Dimensioning and Costs.” The optimal design cost as well as total stormwater system capacity (the maximum capacity at which the system can accommodate volumetric flows) for all networks were computed. Afterwards, considering the Euler II storm event with the increased return periods introduced in Table 4, the hydraulic performance of all created structures was evaluated in terms of flood reliability, that is, surface flooded volume and flooded nodes (Equations (8) and (9)).
The above procedure is repeated for all three scenarios explained earlier: removing additional pipes from upstream, downstream and randomly. The results of hydraulic performance, as well as its relationship with system capacity, are presented in Figure 3 and all Tables in Appendix A. As seen in Figure 3, eliminating the additional pipes in all scenarios led to the overall decrease in the total weighted number of flooded nodes through the systems, although some fluctuations were observed in between. This is due to the fact that once the system capacity is fully utilized in a looped system, compared to a branched structure, multiple flow paths cause more nodes to flood. This means that removing extra paths under hydraulically designing the networks indeed improves the reliability and hydraulic behavior of the systems in terms of observed flooded nodes. The flooded volume indicator, however, manifested totally different behavior within the networks. For instance, Figure 3a,b show that removing the first 15 additional pipes from upstream (network 40 to 26), after hydraulic design is applied to all networks, did not remarkably influence the flooded volume generation. This implies that the 15 additional pipes, formed loops in upstream, are not placed at critical locations and, therefore, can be removed without considerably altering the achieved capacity as well as hydraulic performance. As seen in Figure 3a, there are two sharp decreases and increases in total weighted flooded volume for the networks 23 and 9, respectively. The reason is the sudden change in the total achieved capacity from 655 m3 (network 24) to 685 m3 (network 23) for the former, and from 642 m3 (network 10) to 610 m3 (network 9) for the latter. According to Figure 3a,b, network number 23 (with 23 loops in downstream) revealed the best hydraulic performance compared to other networks in terms of mitigating surface flooded volume (618 m3). In fact, viewed as a critical structural element, removing the 24th additional pipe altered the flow direction/distribution in a way that extreme rainfall amounts were discharged out in the most effective and quickest manner.
As far as looped structure is concerned, there are two crucial factors dominating the efficiency of peak rainfall delivery to the outlet, that is (additional) storage capacity and alternative water flow paths. The contribution of each of these factors can be favorable or unfavorable to each other. For example, although the capacities of networks 38, 37, 30 (with the largest capacity), 29 and 22 were equal or greater than the network 23 (see Figure 3b and Table A1 in Appendix A), this last one (network 23) was able to discharge the peak runoff better, and correspondingly, generated a lesser amount of flooded volume under same rainfall scenario. The reason is due to the location of the network 23’s pipes, through which the increased amount of precipitation is guided towards the outlet in the most efficient and quickest way. This implies that the contribution of flow routing (direction) to the peak runoff discharge in the network 23 outweighs the other networks’ capacities with greater values. This indeed conveys a pivotal message that introducing extra capacity single-handedly without determining proper additional pipes positions in the system might even aggravate the hydraulic performance. From Figure 3a, it can be seen that further removal of pipes only up to the 10th loop in downstream could maintain the flood generation below 630 m3. This means that the 10th additional pipe in downstream can be also considered as a critical element since further pipe eliminations tremendously increased the surface flooded amounts (Figure 3a). As a result, all networks from 23 to 10 can be regarded as optimal in terms of hydraulic response compared to the rest of the networks. These results also emphasize the significance of having at least 10 additional pipes in downstream up to 23 to achieve a better reliability for unforeseen rainfall events. In contrast, network number 0 with no loops appears as the worst-performing network with approximately 684 m3 total weighted flood volume, having the second smallest capacity (559 m3) (see Figure 3a,b). In other words, when a great deal of rainfall enters this dendritic network, the capacity of the stormwater system is rapidly exceeded. This, consequently, leads to a prolonged discharge of the increased water from the outlet since there is only one way out.
Eliminating extra pipes from downstream yielded larger flood volumes compared to the first scenario whose minimum value was equal to 643 m3 (Figure 3c,d). This finding again highlights how imperative the role of having redundancy is in downstream sections when sewer engineers intend to design looped stormwater configurations for the purpose of reliability improvement. Furthermore, the removal of additional pipes from downstream and the design of networks after the first 10 loops abruptly reduced the achieved total capacity and consequently generated quite a few surface flood volumes (Figure 3d). Similarly, this indicates the importance of the first 10 alternative water flow paths in downstream, whose presence led to bigger obtained capacity, and more importantly, contributed to a better distribution of maximum flow. This implication reveals that the first 10 loops in downstream (network number 40 to 31), appear to be more responsible for discharging the excessive rainfall amounts in an efficient way as opposed to the rest of the networks, in which the flooded volume showed a fluctuating pattern with very large flood volumes (Figure 3c). According to Figure 3c,d, proceeding from network 30 to the branched one yielded flood volume values almost greater than 680 m3 for these networks. This value is even greater than the flood volume achieved for all networks based on the first scenario, except for the network 0 (see Figure 3b). This implication can be utilized as a proxy to infer the less influential extra pipes, since all 30 loops upstream did not remarkably influence the total capacity as well as hydraulic performance. As seen in Figure 3d, moving within these networks (30 to 0), led to a slight reduction in the total capacity through the networks, whereas the flooded volume production showed a reducing trend. This means that more looped structures with bigger capacities within these networks performed even worse than more branched ones, as the alternative water pathways (updated flow direction) in those looped systems aggravated the discharge of runoff from the outlet and lingered the travel time of the catchment.
When it comes to randomly removing extra pipes from the base system (network 40), the overall variability of the observed flooded volume within all networks was higher than for the other two scenarios (see Figure 3a,c,e). Flooded volume demonstrated an overall increasing behavior once additional pipes were in succession removed randomly (under hydraulic design at the same time). Figure 3f shows that, notwithstanding the steady decrease in capacity when extra pipes were removed from network 37 to 31, the corresponding flood volume was not altered much. Furthermore, despite the fact that the most complex looped structures (networks 40 to 31) provided higher total storage capacity, the flooding behavior of the networks such as 28 and 26 was better than those looped ones (see Figure 3f and Table A3 in Appendix A). As aforementioned, the reason is related to the better configuration of the pipes in systems 28 and 26, through which the increased rainfall amount was able to be dismissed in a quicker amount of time out of the system. Interestingly enough, network number 26 with 26 loops (Figure 3e,f) is deemed as the most effective solution, since it reported the least amount of flood volume (600 m3) among all networks for all scenarios. This finding can be even more highlighted by comparing its total system capacity (605 m3) with the one of network 39 (with the largest capacity equal to 682 m3 and flood volume equal to 644 m3). This suggests that determining proper additional pipe locations in the system (flow distribution) is of great importance.
As mentioned before, the general implication with respect to the flooded volume generation indicates that the more branched the network is, the greater the flood volume is produced. This overall finding is in agreement with the relevant studies conducted in the literature [23,24]. However, the variation and fluctuation of the surface flood behavior within all the networks (Figure 3) is attributed to the interplay between total storage volume and flow distribution resulting from the (additional) pipe arrangements. Although this interaction has been indicated in [24] for eight subnetworks of the city of Dresden, systematically analyzing the contribution of system capacity as well as alternative flow path in a single specific network (under hydraulic design) was missing. Thus, the outcome of this section provided a more vivid insight towards the role of achieved capacity and flow direction in one single network, which ultimately extends the previous relevant researches.
3.2. Hydraulic and Design Costs Performance Assessment
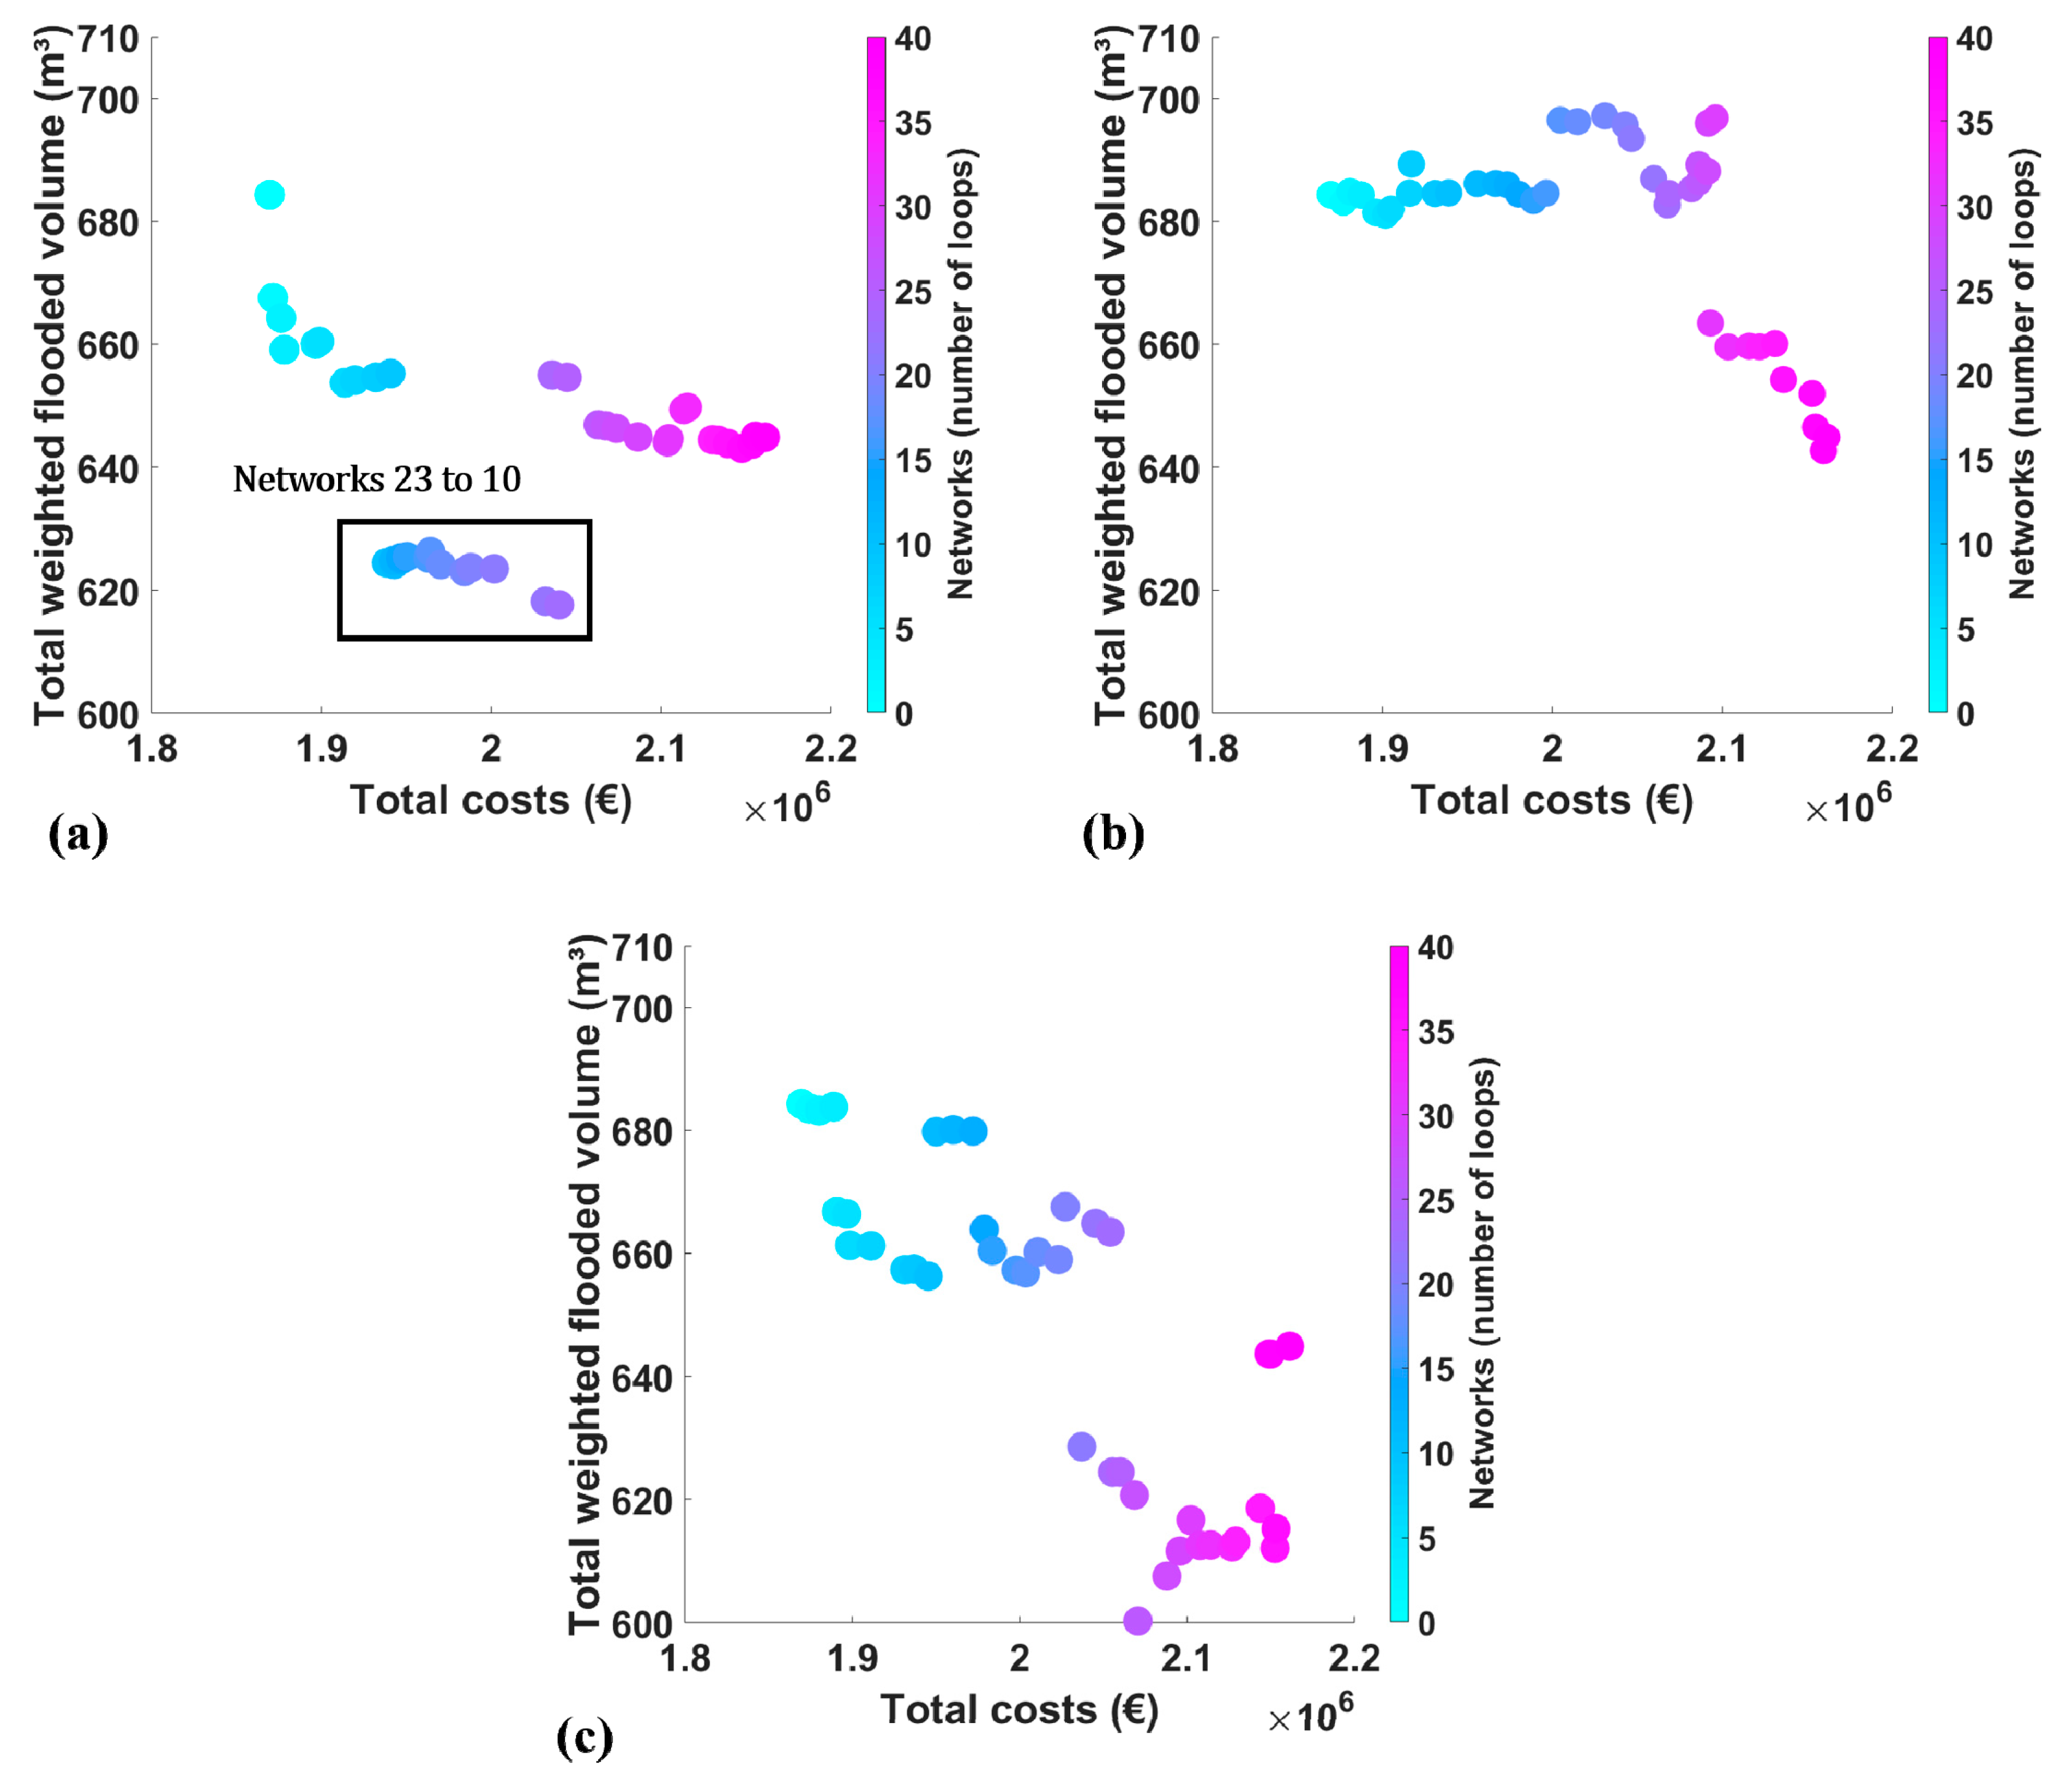
Figure 4 compares total construction costs with total weighted flooded volume for all 41 networks and for the three scenarios mentioned before: Figure 4a for the removal of additional pipes from upstream, Figure 4b for the removal of additional pipes from downstream and Figure 4c for the removal of additional pipes randomly. According to Figure 4a, removing extra pipes from upstream and designing the networks simultaneously led to the gradual decrease in overall construction costs from €2,161,330 for network 40 (base) to €1,869,698 for network 0. This means that removing all additional pipes from the base sewer system reduced the total construction costs by approximately 16%. Nonetheless, as mentioned before, the flood volume production was remarkably dropped after removing the first 17 extra pipes from upstream. Though a comprehensive trade-off analysis is still required when it comes to the selection of optimal network configuration, Figure 4, which integrates construction costs and hydraulic response, is expected to assist engineers to make a more informed decision about the final layout/structure of the stormwater network. As shown in Figure 4a, having at least 10 loops in downstream up to 23 loops (networks 23 to 10) can provide the most efficient network configuration in terms of dispersing high runoff amounts (generating flooded volumes with minimum 618 m3 to maximum 626 m3) and total construction costs between €2,040,203 and €1,938,491 (shown in black box in Figure 4a). With respect to both flood behavior as well as total costs, these configurations can be determined as the most reliable solutions once one is willing to design a loop-branch-combined stormwater system to more desirably cope with functional failures. According to Figure 4b, when additional pipes were removed from downstream, despite an overall reduction in cost pattern, some networks showed increasing design costs compared to their superior networks, such as networks number 30, 26 and 15 (see also Table A2 in Appendix A). The reason is related to the interaction of achieved cover depth, diameter and length costs, resulting from the hydraulic design procedure. The hydraulic design itself also depends on the (additional) pipes location in the system for flow routing purposes, which is different from one network to another. As a result, this is one of the most important reasons that lead to have different design costs from one system to another. As shown in Figure 4b, except for the first 10 looped structures, with the best hydraulic performance (but also the most expensive ones), the rest delivers a high amount of surface flood volumes. Thus, no clear compromise solution could be identified due to the big values recorded for both costs and flood indicators. Similarly, in terms of arbitrarily removing extra pipes (Scenario 3), the more expensive the network, the better the hydraulic performance (Figure 4c). Nevertheless, as aforementioned, the network number 26 with 26 additional alternative flow pathways, having a total cost equal to €2,070,702, might be even chosen as a good compromise candidate between costs and flood reliability compared with all other networks and regarding all scenarios thanks to more efficiently discharging the increased rainfall amounts out of the system.
4. Summary and Conclusions
In this study, redundancy in stormwater pipe networks were systematically evaluated in terms of two assessment indicators, namely total construction costs and flood reliability (flooded volume and flooded nodes). For this purpose, a novel methodology based on topological network characteristics was introduced to systematically and consecutively eliminate the number of loops from a base grid-like network, and to assess the importance of redundancy in stormwater systems under hydraulic design. This graph-based approach enables us to quickly create numerous configuration candidates with different structural characteristics to infer the optimal layout (in terms of number of desirable loops) so as to more efficiently tackle the intensifying extreme rain events. This method was applied to an Alpine city in the vicinity of Innsbruck, using all feasible pipes as a base storm sewer system. Within this procedure, 41 networks varying from network 40 with 40 loops to network 0 with zero loops (branched) were generated. For this purpose, three scenarios were defined: (1) removing extra pipes from upstream, (2) removing extra pipes from downstream and (3) removing extra pipes randomly. The design costs of all networks were then calculated, and correspondingly, the flooded volume and flooded nodes of all networks under extreme rain events were attained and systematically analyzed.
Depending on how and where extra pipes are eliminated, the flow distribution will be different from one network to another, which subsequently alters the corresponding designs and achieved capacity. Regarding looped structures, storm sewer capacity and alternative water flow paths can be deemed as two central pillars for discharging excess rainfall amounts. Nonetheless, owning redundancy (loops) where the position of additional pipes (resulted flow direction) is inappropriate, not only does not contribute to a faster discharging of runoff out of the system but can linger the whole process. The general implication indicated that removing extra pipes based on all scenarios and simultaneously designing the networks escalate the produced flooded volumes as proceeding towards more branched networks. This can be explained due to the fact that looped configurations, once subject to an extreme precipitation, can discharge the increased water in a more effective manner, as opposed to the branched ones in which one unique flow pathway exists. Identification of sensitive locations to construct loops, however, is of great importance, which might either improve the hydraulic performance or exacerbate it. Moreover, the role of downstream pipes for more efficiently discharging maximum flows out of the system is more prominent than that of upstream pipes. Overall, installing a branch-loop-integrated stormwater configuration based on an economical budget is beneficial if (additional) pipes placement (flow distribution) is properly determined at critical locations.
Further research is needed on the detection of the exact location of critical additional pipes in the system and the network characteristics of these locations, the removal of which alters the flow behavior in the network. In addition, this research can be extended to investigate the effect of loop reduction on the system resilience and reliability using different weights for the graphs analyzed and preferences. Moreover, incorporating green retrofits into the conventional grey infrastructures with different structural characteristics (different number of loops) should be pursued in future studies for a holistic and integrated urban water management. This approach can lead to the implementation of a hybrid solution where the optimal number and location of the loops and green solutions are determined.
Author Contributions
S.H. designed the framework, performed the analysis, and wrote the draft; M.H. helped in developing the model, and assisted in organizing and editing the manuscript, R.S. supervised the research, supported designing the framework, helped in improving the analysis and interpretation of the results, editing the writing of the manuscript, J.D.R.-S. and P.K. improved the interpretation of the results. All authors have read and agreed to the published version of the manuscript.
Funding
Open Access Funding by the Austrian Science Fund (FWF): P 31104-N29.
Conflicts of Interest
The authors declare no conflict of interest.
Appendix A

Table A1.
Total construction costs (€), total system capacity (m3), total weighted flooded volume (m3) and total weighted number of flooded nodes for all 41 networks in which extra pipes are removed from upstream (scenario 1).
Table A1.
Total construction costs (€), total system capacity (m3), total weighted flooded volume (m3) and total weighted number of flooded nodes for all 41 networks in which extra pipes are removed from upstream (scenario 1).
| Networks | Total Costs (€) | Total System Capacity (m3) | Flooded Volume (m3) | Flooded Nodes | Networks | Total Costs (€) | Total System Capacity (m3) | Flooded Volume (m3) | Flooded Nodes |
|---|---|---|---|---|---|---|---|---|---|
| 40 (base) | 2,161,330 | 680 | 645 | 41.4 | 19 | 1,984,308 | 653 | 623 | 38.3 |
| 39 | 2,155,603 | 679 | 645 | 41.4 | 18 | 1,970,456 | 647 | 624 | 38.4 |
| 38 | 2,153,795 | 686 | 644 | 41.3 | 17 | 1,964,329 | 646 | 626 | 37.9 |
| 37 | 2,147,579 | 685 | 643 | 41.2 | 16 | 1,963,083 | 645 | 625 | 37.6 |
| 36 | 2,139,390 | 683 | 644 | 41.4 | 15 | 1,950,568 | 643 | 625 | 37.2 |
| 35 | 2,133,817 | 682 | 644 | 41.7 | 14 | 1,946,925 | 642 | 625 | 37.7 |
| 34 | 2,130,374 | 681 | 644 | 41.5 | 13 | 1,947,084 | 643 | 625 | 37.0 |
| 33 | 2,115,637 | 671 | 650 | 40.7 | 12 | 1,942,697 | 641 | 625 | 36.9 |
| 32 | 2,113,453 | 671 | 649 | 40.6 | 11 | 1,942,997 | 645 | 624 | 36.4 |
| 31 | 2,104,637 | 676 | 645 | 40.8 | 10 | 1,938,491 | 642 | 624 | 36.8 |
| 30 | 2,103,883 | 689 | 644 | 41.0 | 9 | 1,940,864 | 610 | 655 | 35.5 |
| 29 | 2,086,489 | 685 | 645 | 40.9 | 8 | 1,932,195 | 608 | 655 | 35.4 |
| 28 | 2,073,721 | 679 | 646 | 41.0 | 7 | 1,919,880 | 605 | 654 | 35.6 |
| 27 | 2,067,563 | 680 | 647 | 40.2 | 6 | 1,913,960 | 604 | 654 | 35.3 |
| 26 | 2,063,138 | 679 | 647 | 40.2 | 5 | 1,898,866 | 580 | 660 | 35.7 |
| 25 | 2,044,826 | 657 | 655 | 37.8 | 4 | 1,896,678 | 578 | 660 | 36.0 |
| 24 | 2,035,973 | 655 | 655 | 38.1 | 3 | 1,878,386 | 560 | 659 | 36.8 |
| 23 | 2,040,203 | 685 | 618 | 37.5 | 2 | 1,876,470 | 559 | 664 | 37.1 |
| 22 | 2,032,046 | 688 | 619 | 37.0 | 1 | 1,871,648 | 558 | 668 | 37.3 |
| 21 | 2,001,924 | 657 | 624 | 38.3 | 0 | 1,869,698 | 559 | 684 | 37.4 |
| 20 | 1,988,070 | 654 | 624 | 38.7 | |||||
Table A2.
Total construction costs (€), total system capacity (m3), total weighted flooded volume (m3) and total weighted number of flooded nodes for all 41 networks in which extra pipes are removed from downstream (scenario 2).
Table A2.
Total construction costs (€), total system capacity (m3), total weighted flooded volume (m3) and total weighted number of flooded nodes for all 41 networks in which extra pipes are removed from downstream (scenario 2).
| Networks | Total Costs (€) | Total System Capacity (m3) | Flooded Volume (m3) | Flooded Nodes | Networks | Total Costs (€) | Total System Capacity (m3) | Flooded Volume (m3) | Flooded Nodes |
|---|---|---|---|---|---|---|---|---|---|
| 40 (base) | 2,161,330 | 680 | 645 | 41.4 | 19 | 2,030,928 | 594 | 697 | 41.3 |
| 39 | 2,159,587 | 682 | 643 | 41.1 | 18 | 2,014,936 | 592 | 696 | 41.4 |
| 38 | 2,154,764 | 681 | 647 | 41.0 | 17 | 2,004,697 | 589 | 696 | 41.4 |
| 37 | 2,152,848 | 680 | 652 | 41.5 | 16 | 1,996,492 | 586 | 685 | 40.8 |
| 36 | 2,135,994 | 666 | 654 | 42.7 | 15 | 1,988,899 | 587 | 683 | 40.8 |
| 35 | 2,130,969 | 657 | 660 | 42.7 | 14 | 1,980,184 | 584 | 684 | 39.8 |
| 34 | 2,121,862 | 649 | 660 | 42.8 | 13 | 1,973,479 | 578 | 686 | 40.5 |
| 33 | 2,115,790 | 647 | 660 | 43.2 | 12 | 1,966,705 | 577 | 686 | 40.5 |
| 32 | 2,103,474 | 644 | 660 | 42.5 | 11 | 1,955,941 | 576 | 686 | 40.5 |
| 31 | 2,093,036 | 636 | 663 | 42.6 | 10 | 1,939,136 | 573 | 685 | 41.0 |
| 30 | 2,095,986 | 606 | 697 | 42.2 | 9 | 1,931,201 | 571 | 685 | 40.8 |
| 29 | 2,091,710 | 605 | 696 | 42.0 | 8 | 1,917,250 | 561 | 689 | 40.1 |
| 28 | 2,091,278 | 606 | 688 | 42.1 | 7 | 1,916,134 | 565 | 685 | 38.9 |
| 27 | 2,086,162 | 602 | 689 | 42.5 | 6 | 1,905,165 | 567 | 682 | 38.4 |
| 26 | 2,086,278 | 605 | 686 | 42.5 | 5 | 1,901,968 | 567 | 681 | 38.1 |
| 25 | 2,081,858 | 603 | 685 | 42.4 | 4 | 1,896,395 | 566 | 681 | 38.4 |
| 24 | 2,068,662 | 600 | 685 | 42.3 | 3 | 1,887,506 | 563 | 684 | 38.2 |
| 23 | 2,067,676 | 603 | 683 | 42.2 | 2 | 1,881,011 | 561 | 685 | 38.3 |
| 22 | 2,059,741 | 595 | 687 | 41.8 | 1 | 1,877,138 | 564 | 683 | 38.0 |
| 21 | 2,046,580 | 591 | 693 | 42.1 | 0 | 1,869,698 | 559 | 684 | 37.4 |
| 20 | 2,042,804 | 588 | 696 | 41.5 | |||||
Table A3.
Total construction costs (€), total system capacity (m3), total weighted flooded volume (m3) and total weighted number of flooded nodes for all 41 networks in which extra pipes are removed randomly (scenario 3).
Table A3.
Total construction costs (€), total system capacity (m3), total weighted flooded volume (m3) and total weighted number of flooded nodes for all 41 networks in which extra pipes are removed randomly (scenario 3).
| Networks | Total Costs (€) | Total System Capacity (m3) | Flooded Volume (m3) | Flooded Nodes | Networks | Total Costs (€) | Total System Capacity (m3) | Flooded Volume (m3) | Flooded Nodes |
|---|---|---|---|---|---|---|---|---|---|
| 40 (base) | 2,161,330 | 680 | 645 | 41.4 | 19 | 2,023,225 | 594 | 659 | 39.3 |
| 39 | 2,149,865 | 682 | 644 | 42.1 | 18 | 2,010,975 | 592 | 660 | 39.0 |
| 38 | 2,149,004 | 681 | 644 | 42.1 | 17 | 2,003,661 | 589 | 657 | 39.4 |
| 37 | 2,153,055 | 680 | 615 | 41.4 | 16 | 1,997,935 | 586 | 657 | 39.3 |
| 36 | 2,152,498 | 666 | 612 | 41.0 | 15 | 1,983,732 | 587 | 660 | 39.0 |
| 35 | 2,143,796 | 657 | 619 | 39.6 | 14 | 1,978,909 | 584 | 664 | 39.0 |
| 34 | 2,129,086 | 649 | 613 | 41.4 | 13 | 1,972,227 | 578 | 680 | 39.8 |
| 33 | 2,126,811 | 647 | 612 | 40.8 | 12 | 1,960,383 | 577 | 680 | 39.4 |
| 32 | 2,114,063 | 644 | 613 | 40.6 | 11 | 1,950,277 | 576 | 680 | 38.7 |
| 31 | 2,107,760 | 636 | 613 | 40.1 | 10 | 1,945,455 | 573 | 656 | 38.7 |
| 30 | 2,102,239 | 606 | 617 | 39.7 | 9 | 1,936,903 | 571 | 657 | 38.3 |
| 29 | 2,095,733 | 605 | 612 | 40.7 | 8 | 1,931,461 | 561 | 657 | 37.9 |
| 28 | 2,087,909 | 606 | 608 | 41.7 | 7 | 1,911,252 | 565 | 661 | 37.8 |
| 27 | 2,068,655 | 602 | 621 | 42.5 | 6 | 1,898,737 | 567 | 661 | 37.3 |
| 26 | 2,070,702 | 605 | 600 | 42.0 | 5 | 1,896,821 | 567 | 666 | 37.6 |
| 25 | 2,060,105 | 603 | 624 | 40.5 | 4 | 1,890,901 | 566 | 667 | 37.4 |
| 24 | 2,055,568 | 600 | 624 | 40.6 | 3 | 1,888,952 | 563 | 684 | 37.4 |
| 23 | 2,054,192 | 603 | 663 | 39.7 | 2 | 1,880,283 | 561 | 683 | 37.6 |
| 22 | 2,045,340 | 595 | 665 | 39.3 | 1 | 1,874,358 | 564 | 684 | 37.8 |
| 21 | 2,037,088 | 591 | 629 | 39.5 | 0 | 1,869,698 | 559 | 684 | 37.4 |
| 20 | 2,027,299 | 588 | 668 | 39.2 | |||||
References
- Rosenzweig, B.R.; McPhillips, L.; Chang, H.; Cheng, C.; Welty, C.; Matsler, M.; Iwaniec, D.; Davidson, C.I. Pluvial flood risk and opportunities for resilience. Wiley Interdiscip Rev. Water 2018, 5, e1302. [Google Scholar] [CrossRef]
- Alexander, L.V.; Zhang, X.; Peterson, T.C.; Caesar, J.; Gleason, B.; Klein Tank, A.M.G.; Haylock, M.; Collins, D.; Trewin, B.; Rahimzadeh, F. Global observed changes in daily climate extremes of temperature and precipitation. J. Geophys. Res. Atmos. 2006, 111, 1–22. [Google Scholar] [CrossRef] [Green Version]
- Freire Diogo, A.; Antunes do Carmo, J. Peak Flows and Stormwater Networks Design—Current and Future Management of Urban Surface Watersheds. Water 2019, 11, 759. [Google Scholar] [CrossRef] [Green Version]
- Liang, L.Y. Optimising the design of sewer networks using genetic algorithms and tabu search. Eng. Constr. Archit. Manag. 2004, 11, 101–112. [Google Scholar] [CrossRef]
- Afshar, M.H. Improving the efficiency of ant algorithms using adaptive refinement: Application to storm water network design. Adv. Water Resour. 2006, 29, 1371–1382. [Google Scholar] [CrossRef]
- Afshar, M.H. Rebirthing particle swarm optimization algorithm: Application to storm water network design. Can. J. Civ. Eng. 2008, 35, 1120–1127. [Google Scholar] [CrossRef]
- Tze-Chin, P.; Jehng-Jung, K. GA-QP Model to Optimize Sewer System Design. J. Environ. Eng. 2009, 135, 17–24. [Google Scholar]
- Afshar, M.H.; Shahidi, M.; Rohani, M.; Sargolzaei, M. Application of cellular automata to sewer network optimization problems. Sci. Iran. 2011, 18, 304–312. [Google Scholar] [CrossRef] [Green Version]
- Haghighi, A.; Bakhshipour, A.E. Optimization of Sewer Networks Using an Adaptive Genetic Algorithm. Water Resour. Manag. 2012, 26, 3441–3456. [Google Scholar] [CrossRef]
- Bakhshipour, A.E.; Bakhshizadeh, M.; Dittmer, U.; Haghighi, A.; Nowak, W. Hanging Gardens Algorithm to Generate Decentralized Layouts for the Optimization of Urban Drainage Systems. J. Water Resour. Plan. Manag. 2019, 145, 04019034. [Google Scholar] [CrossRef]
- Afshar, M.H.; Rohani, M. Optimal design of sewer networks using cellular automata-based hybrid methods: Discrete and continuous approaches. Eng. Optim. 2012, 44, 1–22. [Google Scholar] [CrossRef]
- Steele, J.C.; Mahoney, K.; Karovic, O.; Mays, L.W. Heuristic optimization model for the optimal layout and pipe design of sewer systems. Water Resour. Manag. 2016, 30, 1605–1620. [Google Scholar] [CrossRef]
- Ahern, J. From fail-safe to safe-to-fail: Sustainability and resilience in the new urban world. Landsc. Urban Plan. 2011, 100, 341–343. [Google Scholar] [CrossRef] [Green Version]
- Mugume, S.N.; Diao, K.; Astaraie-Imani, M.; Fu, G.; Farmani, R.; Butler, D. Enhancing resilience in urban water systems for future cities. Water Supply 2015, 15, 1343–1352. [Google Scholar] [CrossRef] [Green Version]
- Butler, D.; Farmani, R.; Fu, G.; Ward, S.; Diao, K.; Astaraie-Imani, M. A new approach to urban water management: Safe and sure. Procedia Eng. 2014, 89, 347–354. [Google Scholar] [CrossRef] [Green Version]
- Casal-Campos, A.; Sadr, S.M.K.; Fu, G.; Butler, D. Reliable, resilient and sustainable urban drainage systems: An analysis of robustness under deep uncertainty. Environ. Sci. Technol. 2018, 52, 9008–9021. [Google Scholar] [CrossRef] [Green Version]
- Jia, H.; Wang, Z.; Zhen, X.; Clar, M.; Shaw, L.Y. China’s sponge city construction: A discussion on technical approaches. Front. Environ. Sci. Eng. 2017, 11, 18. [Google Scholar] [CrossRef]
- Pregnolato, M.; Ford, A.; Robson, C.; Glenis, V.; Barr, S.; Dawson, R. Assessing urban strategies for reducing the impacts of extreme weather on infrastructure networks. R. Soc. open Sci. 2016, 3, 160023. [Google Scholar] [CrossRef] [Green Version]
- Martínez, C.; Sanchez, A.; Galindo, R.; Mulugeta, A.; Vojinovic, Z.; Galvis, A. Configuring green infrastructure for urban runoff and pollutant reduction using an optimal number of units. Water 2018, 10, 1528. [Google Scholar] [CrossRef] [Green Version]
- Yang, B.; Li, S. Green infrastructure design for stormwater runoff and water quality: Empirical evidence from large watershed-scale community developments. Water 2013, 5, 2038–2057. [Google Scholar] [CrossRef]
- Stovin, V.; Dunnett, N.; Hallam, A. Green roofs-getting sustainable drainage off the ground. In Proceedings of the NOVATECH 2007, Lyon, France, 25–28 June 2007; pp. 11–18. [Google Scholar]
- Zhang, C.; Wang, Y.; Li, Y.; Ding, W. Vulnerability analysis of urban drainage systems: Tree vs. loop Networks. Sustainability 2017, 9, 397. [Google Scholar] [CrossRef] [Green Version]
- Lee, J.; Chung, G.; Park, H.; Park, I. Evaluation of the structure of urban stormwater pipe network using drainage density. Water (Switzerland) 2018, 10, 1444. [Google Scholar] [CrossRef] [Green Version]
- Reyes-Silva, J.D.; Helm, B.; Krebs, P. Meshness of sewer networks and its implications for flooding occurrence. Water Sci. Technol. 2019. [Google Scholar] [CrossRef]
- Mair, M.; Zischg, J.; Rauch, W.; Sitzenfrei, R. Where to find water pipes and sewers?—On the correlation of infrastructure networks in the urban environment. Water 2017, 9, 146. [Google Scholar] [CrossRef] [Green Version]
- Shao, Z.; Zhang, X.; Li, S.; Deng, S.; Chai, H. A novel SWMM based algorithm application to storm sewer network design. Water 2017, 9, 747. [Google Scholar] [CrossRef] [Green Version]
- Diogo, A.F.; Walters, G.A.; Ribeiro de Sousa, E.; Graveto, V.M. Three-dimensional optimization of urban drainage systems. Comput. Civ. Infrastruct. Eng. 2000, 15, 409–425. [Google Scholar] [CrossRef]
- Girvan, M.; Newman, M.E.J. Community structure in social and biological networks. Proc. Natl. Acad. Sci. USA 2002, 99, 7821–7826. [Google Scholar] [CrossRef] [Green Version]
- Barthelemy, M. Morphogenesis of Spatial Networks; Springer International Publishing: Cham, Switzerland, 2018; ISBN 978-3-319-20564-9. [Google Scholar]
- Rossman, L.A. Storm Water Management Model, User’s Manual, Version 5.1; EPA-600/R-14/413b; U.S. Office of Research and Development, US Environmental Protection Agency: Cincinnati, OH, USA, 2015.
- Abfallwirtschaftsverband. ÖWAV-Regelblatt 11: Richtlinien für die abwassertechnische Berechnung und Dimensionierung von Abwasserkanälen; Österreichisches Normungsinstitut: Wien, Austria, 2009. [Google Scholar]
- Arbeitsblatt. DWA-A 118: Hydraulische Bemessung und Nachweis von Entwässerungssystemen. DWA, Hennef 2006, 3, 1–32. [Google Scholar]
- Maurer, M.; Scheidegger, A.; Herlyn, A. Quantifying costs and lengths of urban drainage systems with a simple static sewer infrastructure model. Urban. Water J. 2013, 10, 268–280. [Google Scholar] [CrossRef]
- Yang, L.; Tian, F.; Niyogi, D. A need to revisit hydrologic responses to urbanization by incorporating the feedback on spatial rainfall patterns. Urban. Clim. 2015, 12, 128–140. [Google Scholar] [CrossRef]
- Villarini, G.; Smith, J.A.; Baeck, M.L.; Smith, B.K.; Sturdevant-Rees, P. Hydrologic analyses of the July 17–18, 1996, flood in Chicago and the role of urbanization. J. Hydrol. Eng. 2011, 18, 250–259. [Google Scholar] [CrossRef]
- Kleidorfer, M.; Sitzenfrei, R.; Rauch, W. Simplifying impact of urban development on sewer systems. Water Sci. Technol. 2014, 70, 1808–1816. [Google Scholar] [CrossRef] [PubMed]
- Jia, N.; Sitzenfrei, R.; Rauch, W.; Liang, S.; Liu, Y. Effects of Urban Forms on Separate Drainage Systems: A Virtual City Perspective. Water 2019, 11, 758. [Google Scholar] [CrossRef] [Green Version]
Figure 1.
Removing additional pipe in looped structure by removing the edge, resting in non-preferential flow pathway: looped structure (left); tree structure (right).
Figure 1.
Removing additional pipe in looped structure by removing the edge, resting in non-preferential flow pathway: looped structure (left); tree structure (right).

Figure 2.
Base (fully looped) stormwater pipe network and layout of the case study.

Figure 3.
Hydraulic performance of all networks (left sides) and the relationship between total weighted flooded volume and total system capacity for all networks (right sides). (a) and (b) are the cases where extra pipes are removed from upstream, (c) and (d) are the cases where extra pipes are removed from downstream, (e) and (f) are the cases where the extra pipes are removed randomly.

Figure 4.
Comparison between total costs (€) and total weighted flooded volume () for (a) removing additional pipes from upstream, (b) removing additional pipes from downstream and (c) removing additional pipes randomly.
Figure 4.
Comparison between total costs (€) and total weighted flooded volume () for (a) removing additional pipes from upstream, (b) removing additional pipes from downstream and (c) removing additional pipes randomly.

Table 1.
Structural characteristics of the graph shown as an example.
| Properties | Edge Number | ||
|---|---|---|---|
| 2 | 3 | 4 | |
| Length [] | 20 | 20 | 30 |
| Slope [] | 0.02 | 0.02 | 0.02 |
| Diameter [] | 0.25 | 0.4 | 0.25 |
| 5702 | 1628 | 7127 | |
| Sum of edge weights from S3 to T | 7330 | 8553 | |
| [] | 0.5 | 1 | 0 |
Table 2.
Hydraulic design constraints used in this study, modified from Austrian guideline [31].
Table 2.
Hydraulic design constraints used in this study, modified from Austrian guideline [31].
| Design Constraints | Threshold Values |
|---|---|
| Minimum Diameter | 0.25 (m) |
| Discrete Set of Diameters From Commercial List [32] | 0.25, 0.3, 0.35, 0.38, 0.4, 0.45,0.5, 0.53, 0.6, 0.7, 0.8, 0.9, 1, 1.05, 1.20, 1.35, 1.40, 1.5 (m) |
| Minimum Cover Depth | 1.5 (m) |
| Maximum Cover Depth | 8 (m) |
| Minimum Slope [32] | 0.3% |
| Minimum Velocity | 0.5 (m/s) |
| Maximum Velocity [32] | 5 (m/s) |
| Ratio of Design Flow Height to the Diameter | 0.9 |
Table 3.
Properties of the investigated case study.
| No. of Conduits | No. of Junctions | Total Area [ha] | Effective Impervious Area [ha] | Total Sewer Length [Km] | Maximum Throttle Flow from Storage Unit [L/s] | No. of Population |
|---|---|---|---|---|---|---|
| 276 | 237 | 21.94 | 11.82 | 7 | 250 | 600 |
Table 4.
Rainfall characteristics used for the hydraulic evaluation of networks.
| Euler II Rainfall Characteristics | ||||||
|---|---|---|---|---|---|---|
| Initial return periods (years) | 5 | 10 | 20 | 50 | 100 | 200 |
| Urbanized return periods (years) | 8.06 | 16.12 | 32.24 | 80.61 | 161.22 | 322.44 |
| Precipitation volume (mm) | 45.97 | 53.97 | 62.05 | 72.75 | 80.83 | 88.91 |
© 2020 by the authors. Licensee MDPI, Basel, Switzerland. This article is an open access article distributed under the terms and conditions of the Creative Commons Attribution (CC BY) license (http://creativecommons.org/licenses/by/4.0/).
Share and Cite
MDPI and ACS Style
Hesarkazzazi, S.; Hajibabaei, M.; Reyes-Silva, J.D.; Krebs, P.; Sitzenfrei, R. Assessing Redundancy in Stormwater Structures Under Hydraulic Design. Water 2020, 12, 1003. https://doi.org/10.3390/w12041003
AMA Style
Hesarkazzazi S, Hajibabaei M, Reyes-Silva JD, Krebs P, Sitzenfrei R. Assessing Redundancy in Stormwater Structures Under Hydraulic Design. Water. 2020; 12(4):1003. https://doi.org/10.3390/w12041003
Chicago/Turabian StyleHesarkazzazi, Sina, Mohsen Hajibabaei, Julian David Reyes-Silva, Peter Krebs, and Robert Sitzenfrei. 2020. "Assessing Redundancy in Stormwater Structures Under Hydraulic Design" Water 12, no. 4: 1003. https://doi.org/10.3390/w12041003
Note that from the first issue of 2016, this journal uses article numbers instead of page numbers. See further details here.